Article

Monitoring Plateau Pika and Revealing the Associated Influencing Mechanisms in the Alpine Grasslands Using Unmanned Aerial Vehicles

1
Key Laboratory of Cryospheric Science and Frozen Soil Engineering, Northwest Institute of Eco-Environment and Resources, Chinese Academy of Sciences, 320 Donggang West Road, Lanzhou 730000, China
2
Tanggula Mountain Cryosphere and Environment Observation and Research Station of Tibet Autonomous Region, Key Laboratory of Cryospheric Science and Frozen Soil Engineering, Northwest Institute of Eco-Environment and Resources, Chinese Academy of Sciences, Lanzhou 730000, China
3
University of Chinese Academy of Sciences, No. 1 Yanqihu East Road, Beijing 101408, China
4
State Key Laboratory of Herbage Improvement and Grassland Agro-Ecosystems, College of Pastoral Agriculture Science and Technology, Lanzhou University, 222 Tianshui South Road, Lanzhou 730000, China
*
Author to whom correspondence should be addressed.
Drones 2025, 9(4), 298; https://doi.org/10.3390/drones9040298
Submission received: 3 March 2025 / Revised: 8 April 2025 / Accepted: 9 April 2025 / Published: 11 April 2025

Abstract

:
Plateau pika (Ochotona curzoniae, hereafter pika) is a key species in the alpine grasslands on the Qinghai-Tibetan Plateau (QTP). They are susceptible to the influence of external disturbance and may present great variation, which is important to evaluate their ecological role in alpine grasslands. However, our knowledge regarding their interannual variation and the influencing mechanism is still limited due to the lack of long-term observation of pika density. This study aimed to investigate the spatiotemporal variations in pika and the associated key influencing factors by aerial photographing at 181 sites in Gannan Tibetan Autonomous Prefecture in 2016, 2019, and 2022. Our findings showed that: (1) pika primarily distributed in the central and northeastern Maqu County and the southwestern part of Luqu County, and their average density was in a range of 9.87 ha−1 to 14.43 ha−1 from 2016 to 2022; (2) high pika density were found in 1.22 to 3.61 °C for annual mean temperature, 12.86 to 15.06 °C for diurnal temperature range, 3400 to 3800 m for DEM and less than 3° for slope; and (3) pika density showed varied response to interannual changes in mean diurnal range, annual precipitation and precipitation of the driest month in different years. Our results concluded that pika density showed significant spatiotemporal variations, and climate and terrain variables dominantly affected pika density. Given the great interannual fluctuation of climate variables and different responses of pika density to these variables, our results suggested that long-term monitoring of pika is crucial to reveal their real distribution, response mechanism to habitat environment, and role in alpine grasslands. Moreover, unmanned aerial vehicles are cost-effective tools for the long-term monitoring of pika.

1. Introduction

Known as the Third Pole of Earth and Asian Water Tower [1], the Qinghai-Tibetan Plateau (QTP) hosts the world’s largest and most unique alpine ecosystems [2]. Among these alpine ecosystems, alpine grasslands cover more than 30% of the total area of grassland in China [3], which plays an important role in water conservation, carbon fixation, and biodiversity conservation [4]. However, approximately 1/3 of the alpine grasslands have degraded in the past few decades [5,6]. Other than climate change [7,8], permafrost degradation [6,9], livestock overgrazing, and human activities [10], small burrowing herbivores’ disturbance have also been considered as one of the causes for the degradation of alpine grasslands [11].
Plateau pika (Ochotona curzoniae, hereafter pika) is a small burrowing and herbivore widely distributed in the alpine grasslands on the QTP [12]. Living underground, they construct complex burrows and contribute to nutrient cycling [13]. The abandoned pika burrows provide shelter for small birds and lizards, and themselves serve as a food source for plateau carnivores as well [14]. Pika is, therefore, considered to be a keystone in alpine grasslands. However, the outbreaks of pika density are generally associated with grassland degradation [15,16,17]. Their excavation and burrowing activities are considered to accelerate soil erosion and create bare patches [18], which will lead to nutrient loss and a decline in vegetation productivity [19]. Therefore, they are chronically labeled as pests and subjected to control and eradication with poisoning campaigns over the past decades. The current confused role of pika hinders the implementation of management and the maintenance of sustainable development of alpine grasslands. It is urgently needed to reveal the real role of pika, and the spatial distribution and controlling factors are prerequisites to fulfill this goal. Unfortunately, our knowledge about this is still insufficient.
The traditional methods for investigating pika density include direct counting density, marker recapture, and burrow index [20]. Although these methods have high survey accuracy, they all fail to investigate the density and distribution of pika at a large scale because they are time-consuming and expensive. Consequently, most previous studies either investigated pika density at a small scale [21,22,23] or modeled and analyzed pika distribution based on the presence-absence data [24,25,26,27]. These results presented the possible suitable habitat for pikas; however, they could not reflect their true distribution in the real world. Recently, unmanned aerial vehicles (UAV) with high resolution have been used to extract pika holes [28], estimate pika density [29], explore their controlling factors [30,31], and simulate pika distribution [32,33,34]. However, these studies only focused on pika distribution at a single time, failing to capture the interannual variations in pika density. This limitation could result in overlooking abnormal fluctuations in pika density, such as outbreaks or near-extinction events [35,36]. Additionally, the lack of interannual pika density also prevented dynamic assessment of their role in alpine grasslands, including the effects on plant species diversity, biomass, and soil nutrients [29]. Therefore, it is necessary to conduct long-term spatiotemporal monitoring to better understand their ecological impact. In this study, we used aerial photography by the UAV and ground survey to obtain the spatiotemporal pika density in Gannan Tibetan Autonomous Prefecture during the year 2016~2022. Then, we analyzed the mechanism that influences environmental variables on pika density. The specific objectives were to (1) investigate the spatial distribution of pika; (2) explore the interannual variation in pika density; and (3) reveal the dominant controlling factors of pika density.

2. Materials and Methods

2.1. Study Area

The study area is located in the Gannan Tibetan Autonomous Prefecture (100°45′45′′~104°45′30′′ E, 33°06′30′′~35°34′00′′ W), northeastern QTP, China (Figure 1). The study area has a typical plateau continental climate. The average annual air temperature ranged from 1.22 to 2.08 °C, and the average annual precipitation was in a range of 587.42~837.26 mm during the year of 2016 to 2022 [37]. The average altitude of this region is 3368 m. Grasslands are the dominant vegetation type, which covers approximately 2.6 × 10⁶ ha and account for 67.56% of the total area of Gannan Tibetan Autonomous Prefecture. The area of available grasslands is about 2.5 × 10⁶ ha, accounting for 95.56% of the total grassland area [38]. Grassland types include alpine meadows, mountain meadows, and swamps, among which the largest area is occupied by alpine meadows [39]. The vegetation species are dominated by cold-resistant perennial herbaceous plants, including Potentilla fruticosa, Kobresia humilis, Kobresia willd, Leontopodium nanum, Elymusnutans Griseb, and so on [40].

2.2. Data Acquisition and Processing

2.2.1. Field Investigation and Pika Density Extracting

We have established 181 work points in Gannan Tibetan Autonomous Prefecture to investigate pika density since 2016. At each work point, 1-2 GRID flightways (200 m × 200 m) were added. Each GRID flightway contained 16 flight points (Figure 2a). A DJI drone with a weight of 905 g (Mavic 2 Zoom, DJI Innovation Company, Shenzhen City, China) was auto-piloted and took photos at a height of 20 m using Fragmentation Monitoring and Analysis with Aerial Photography Version 5.0 (FragMap v5.0) [41]. Altogether, ~7100 aerial photos were extracted, each covering the ground area of ~35 m × 26 m (Figure 3). The pixel is 12 million, and the resolution is ~1 cm [41]. We set three round plots with a radius of 14.6 m at 11 work points to determine the coefficient of the effective pika hole (Ceph, Figure 2a and Figure 3). The distance between each plot was more than 50 m. We covered total pika holes (TPH) with soil in each plot and counted opened hole exits after 72 h, which were recorded as the number of effective pika holes (EPH) [42]. We used Equation (1) to calculate the Ceph.
C e p h = E P H T P H
Based on the machine learning analysis software ML Classifier v5.3, the convolutional neural network (CNN) algorithm with manual correction was employed to identify and extract TPH from each aerial photo (Figure 2b and Figure 3). TPH were first identified by automatic identification and then manually verified and corrected (Figure 3). Based on TPH and the Ceph (Table 1), we calculated the effective pika holes (EPH). Then, pika density (PD) was estimated using the EPH and the coefficient of pika density (Cpd, Equation (2), Table 1). The flowchart of the study scheme is shown in Figure 3.
C p d = P D E P H

2.2.2. Pika Hazard Categories Base on EPH

We mainly followed the Technical Specification of Control of Rodents on Grassland Ground (Technical specification) to classify pika hazards into 5 categories (Table 2).

2.2.3. Environmental Variables

Terrain, climate, and vegetation variables were used to analyze the dominant controlling factors of pika density.
The digital elevation model (dem) was acquired based on ASTER GDEM elevation data from the Geospatial Data Cloud (https://www.gscloud.cn/ (accessed on 28 September 2023)). Data processing, such as disposition of dem, slope and aspect extraction, and resampling spatial resolution, were all carried out using ArcGIS 10.8.
Temperature and precipitation data were downloaded from the National Tibetan Plateau/Third Pole Environment Data Center (TPDC; https://data.tpdc.ac.cn/ (accessed on 17 November 2024)), including monthly average temperature, maximum temperature, minimum temperature, and monthly total precipitation in 2016, 2019 and 2022 [37]. Climate data were further processed, and 19 bioclimatic variables (Table 3) were calculated.
Normalized Difference Vegetation Index (NDVI) was obtained from MOD13Q1 vegetation index products with Google Earth Engine. To avoid the influence of cloud and snow, 24 images from each year of 2016, 2019, and 2022 were selected to synthesize the annual maximum NDVI. Grassland types were extracted according to the 1:100,000 Chinese digital grassland classification map provided by the China Resource and Environmental Science Data Center (https://www.resdc.cn/ (accessed on 26 September 2023)).
To eliminate the autocorrelation of 23 environmental variables, Pearson’s correlation analysis was used to determine the correlation of each variable. Specifically, the environmental variables were extracted based on the coordinates of observing pika density at each work point. If the correlation coefficient of multiple environment variables was larger than 0.8, the single environment variable was retained (Figure 4). In total, 8 environmental variables were finally retained, including bio1 (annual mean temperature), bio12 (annual precipitation), dem, NDVI, bio2 (mean diurnal range), bio14 (precipitation of driest month), slope, and aspect.

2.3. Data Analyses

2.3.1. Relationships Between Pika Density and Environmental Variables

Pika density exhibited zero-inflated data, while environmental variables showed polygonal point clouds and heteroscedastic error distribution. Both of them did not follow linear or curvilinear relationships [54]. Quantile regression, based on a constraint line, was effective in handling these data [55]. Constraint line regression was therefore used to explore the relationships between pika density and environmental variables. We first divided each environmental variable (x-value) into 15 groups and selected the 95th quantile points of pika density (x-values) from each group as boundary points. Then, we performed a non-linear regression using Equations (3) and (4) to extract the constraint lines and determine their equations.
y = a × e x p ( x b 2 2 × c 2 )
y = x a 2 × e x p ( x 2 b 2 )

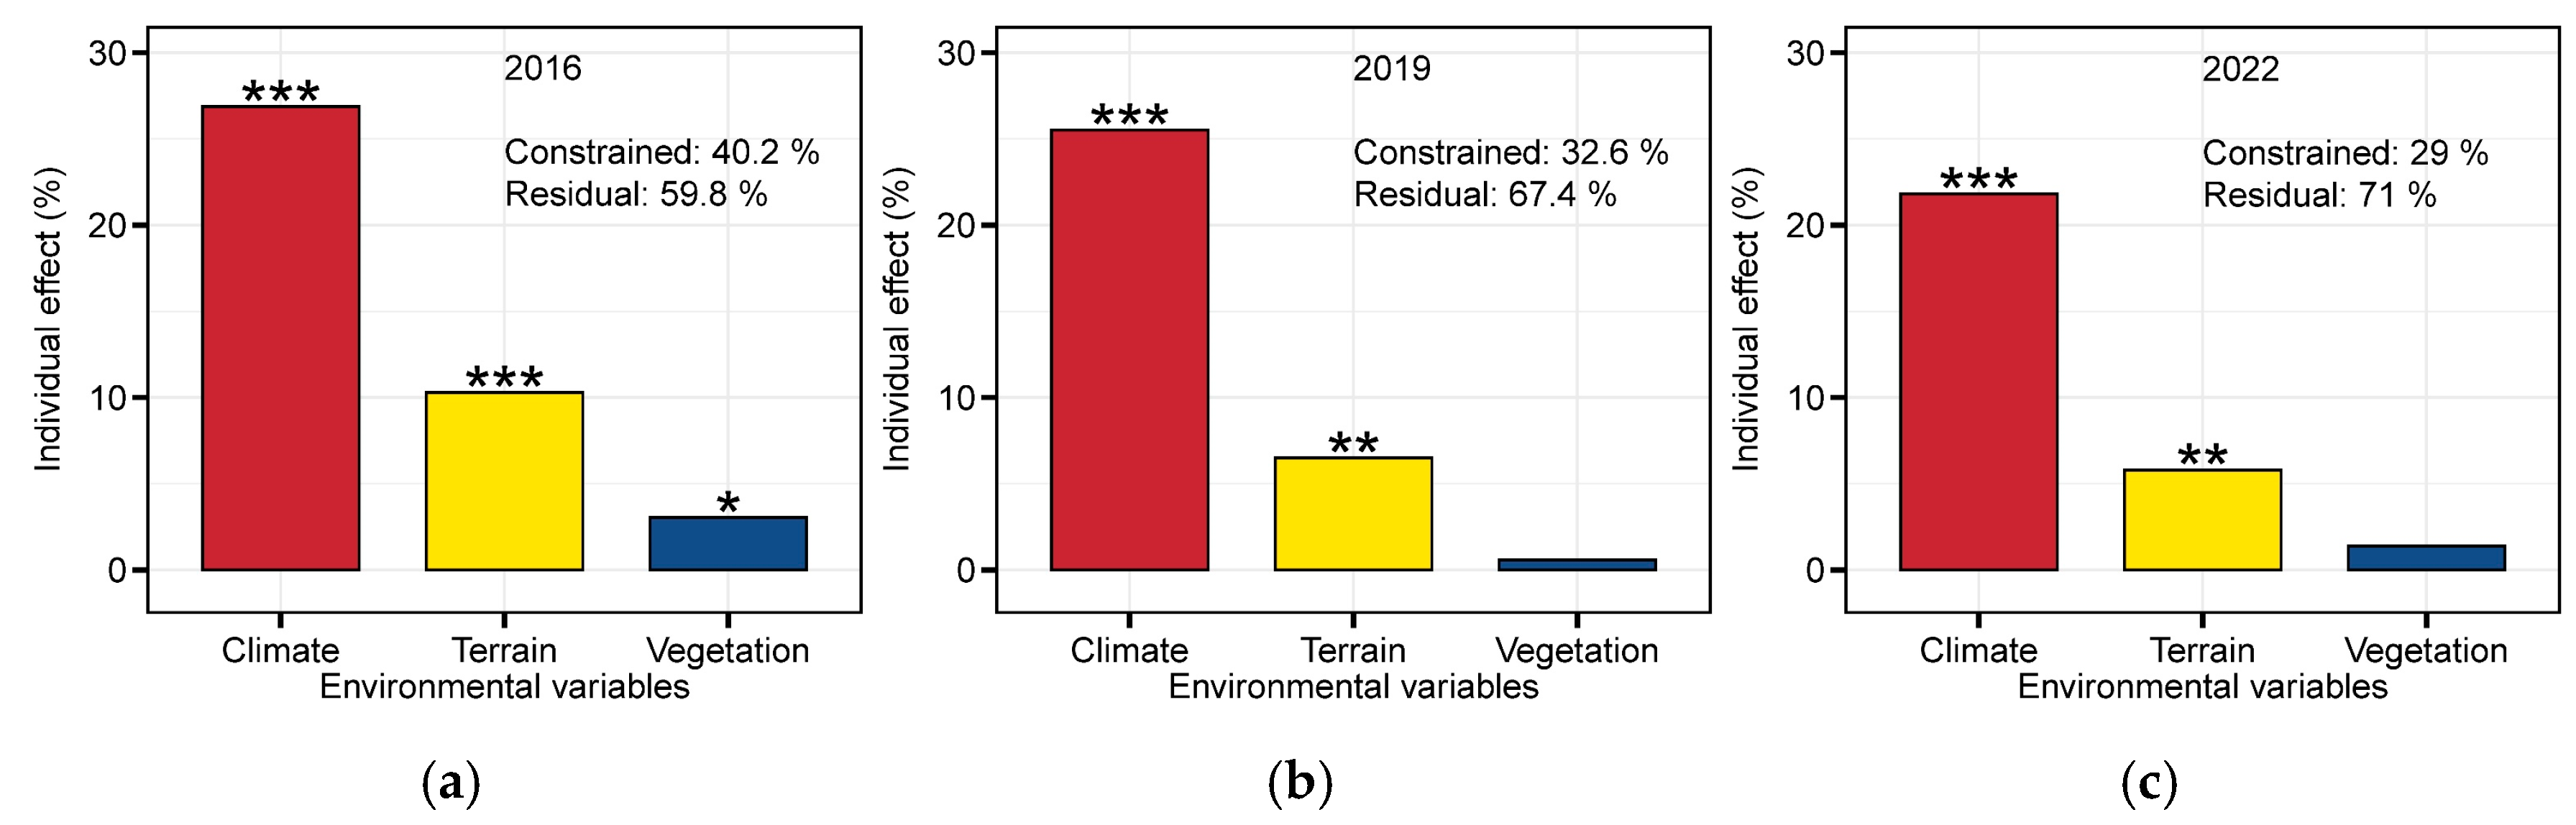
2.3.2. The Key Controlling Factors of Pika Density

To detect the dominant controlling factors for pika density, we first performed a Hellinger transformation on pika density to eliminate the influence of extreme values [56]. Then, redundancy analysis (RDA) was performed to determine the relationships of pika density with 8 environmental variables and 3 groups (terrain, climate, and vegetation variable groups). The individual contribution of each (group) environmental variable was assessed using hierarchical partitioning (HP). Finally, the permutation routine was conducted to determine the contribution of individual environmental variables to pika density.

2.3.3. Statistical Analyses

All statistical analyses were performed using R software (version 4.2.3; https://www.r-project.org/ (accessed on 20 June 2023)), with all statistical plots generated using the ggplot2 package [57]. Maps were created using ArcGIS 10.8. The 19 bioclimatic variables were calculated with the biovars function of the dismo R package [58]. Pearson’s correlation matrix of environmental variables was calculated with the quickcor function of the ggcor R package [59]. RDA and HP analyses were performed using the rdacca.hp R package [60]. Pika density across different years was subjected to a one-way analysis of variance (ANOVA) to test the significant difference in interannual variation.

3. Results

3.1. Spatiotemporal Variation in Environmental Variables

From 2016 to 2022, the annual mean temperature (bio1) and mean diurnal range (bio2) showed a trend of first decreasing and then increasing, with the lowest values observed in 2019 (Figure 5a,b). However, annual precipitation (bio12) and NDVI exhibited the opposite trend of first increasing and then decreasing, with the highest annual precipitation recorded in 2019 (Figure 5c,e). Precipitation of the driest month (bio14) had significant interannual fluctuation; however, it generally showed a reduction from 2016 to 2022 (Figure 5d).
At the spatial scale, annual mean temperature (bio1) and NDVI had no significant change across the Gannan Tibetan Autonomous Prefecture from 2016 to 2022 (Figure 6a,e). The mean diurnal range (bio2) exhibited firstly decreased and then increased, with greater variation observed in the western part of Gannan Tibetan Autonomous Prefecture (Figure 6b). Annual precipitation (bio12) followed the trend of first increasing and then decreasing, with higher precipitation found in Maqu County and Luqu County in 2019 (Figure 6c). Precipitation of the driest month (bio14) showed a gradual decrease across the Gannan Tibetan Autonomous Prefecture, with the most significant reduction observed in Maqu County (Figure 6d).

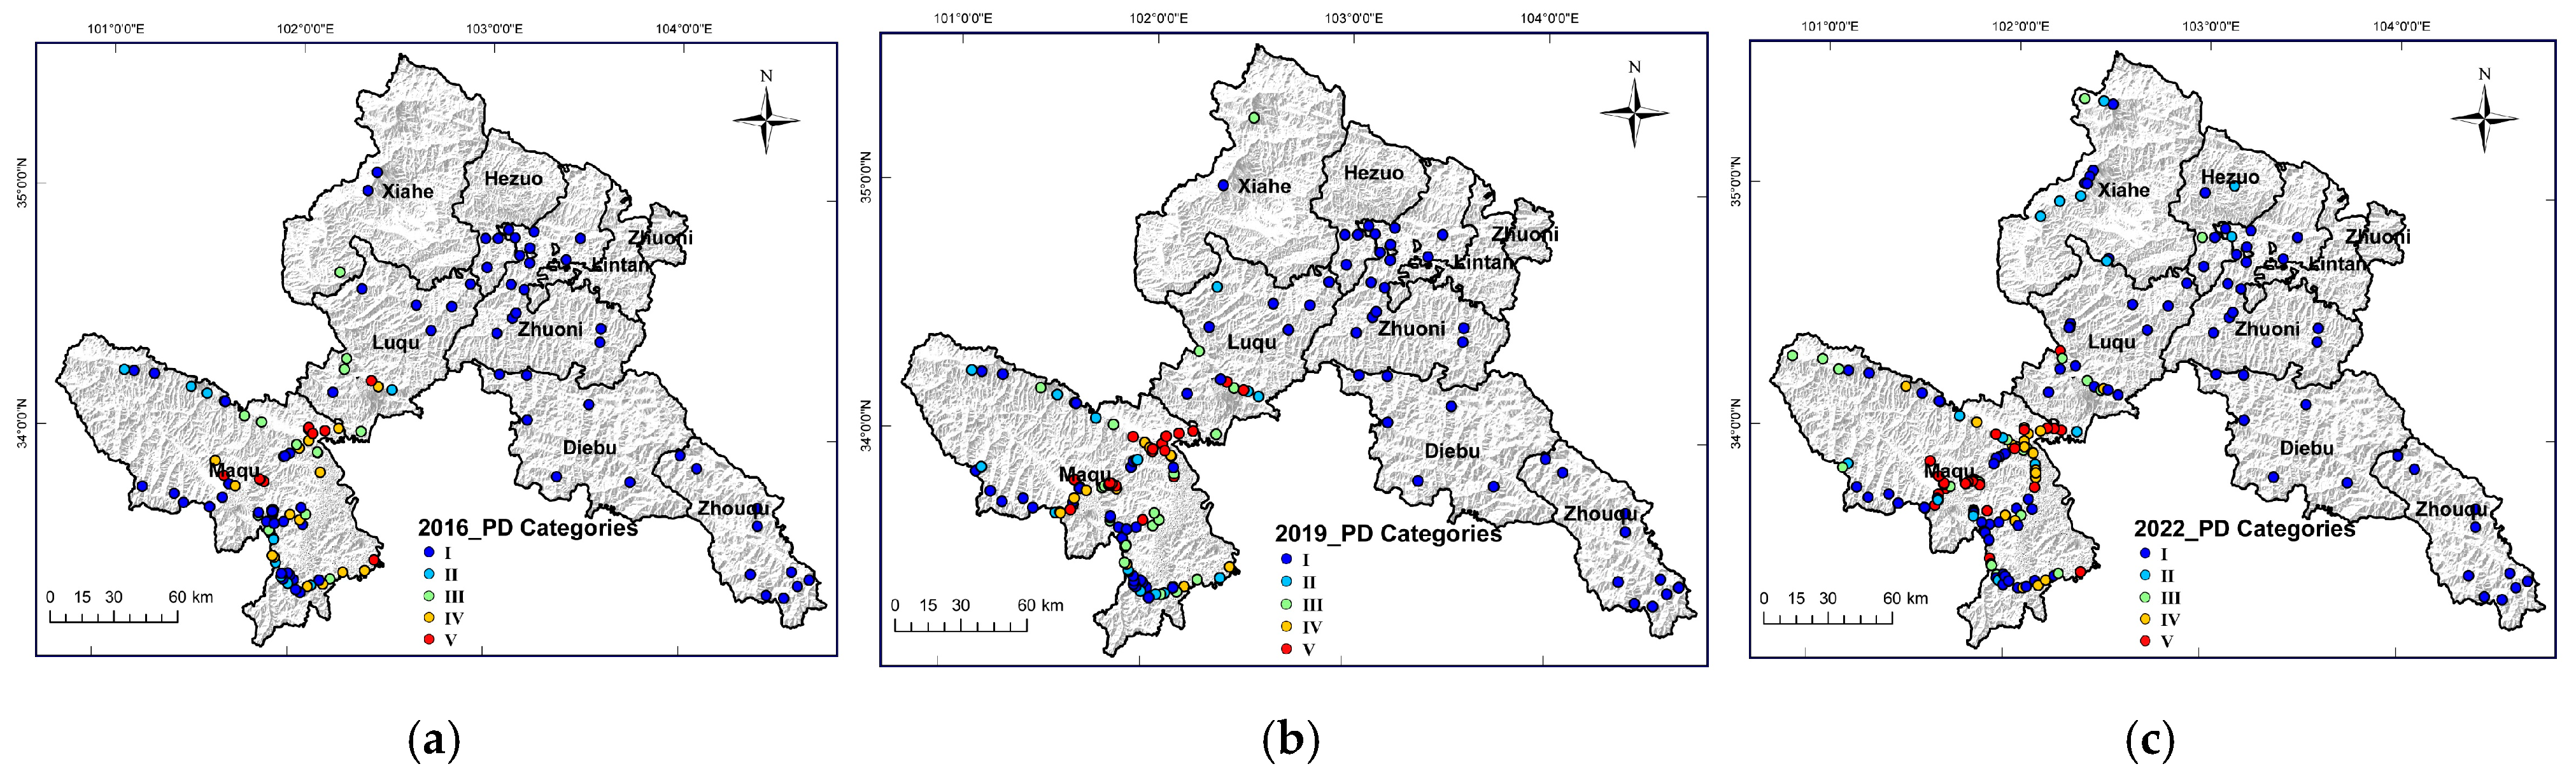
3.2. Spatiotemporal Distribution of Pika Density Spatiotemporal Differentiation Characteristics of the Distribution of Pika Density

Categories I and II dominated pika hazard in most areas of Gannan Tibetan Autonomous Prefecture, which accounted for 63% of total survey work points. Categories III and IV are mainly distributed in the central, northeastern, and southeastern of Maqu County and the southwestern of Luqu County. Category V was mainly found in the central, northeastern, and southwestern of Maqu County in 2016 and 2019 (Figure 7a,b), while it was mainly distributed in the central and northeastern Maqu County in 2022 (Figure 7c). Overall, the suitable habitats for pika in Gannan Tibetan Autonomous Prefecture were located in the central and northeastern of Maqu County and the southwestern and central of Luqu County.
All categories of pika density showed a trend of first increasing and then decreasing from 2016 to 2022 (Table 4). The average pika density for categories II, III, IV, and V ranged from 1.33 ± 0.45 ha−1 to 1.42 ± 0.48 ha−1, 5.08 ± 1.80 ha−1 to 5.33 ± 2.21 ha−1, 15.88 ± 5.22 ha−1 to 19.01 ± 6.24 ha−1 and 61.37 ± 47.89 ha−1 to 79.04 ± 67.11 ha−1 during the year of 2016~2022. Overall, the average pika density was 9.87 ± 21.03 ha−1 in 2016. It increased by 65.45% compared to 2016, with the average pika density of 14.43 ± 37.79 ha−1 in 2019. However, it decreased to 11.20 ± 26.72 ha−1 in 2022.

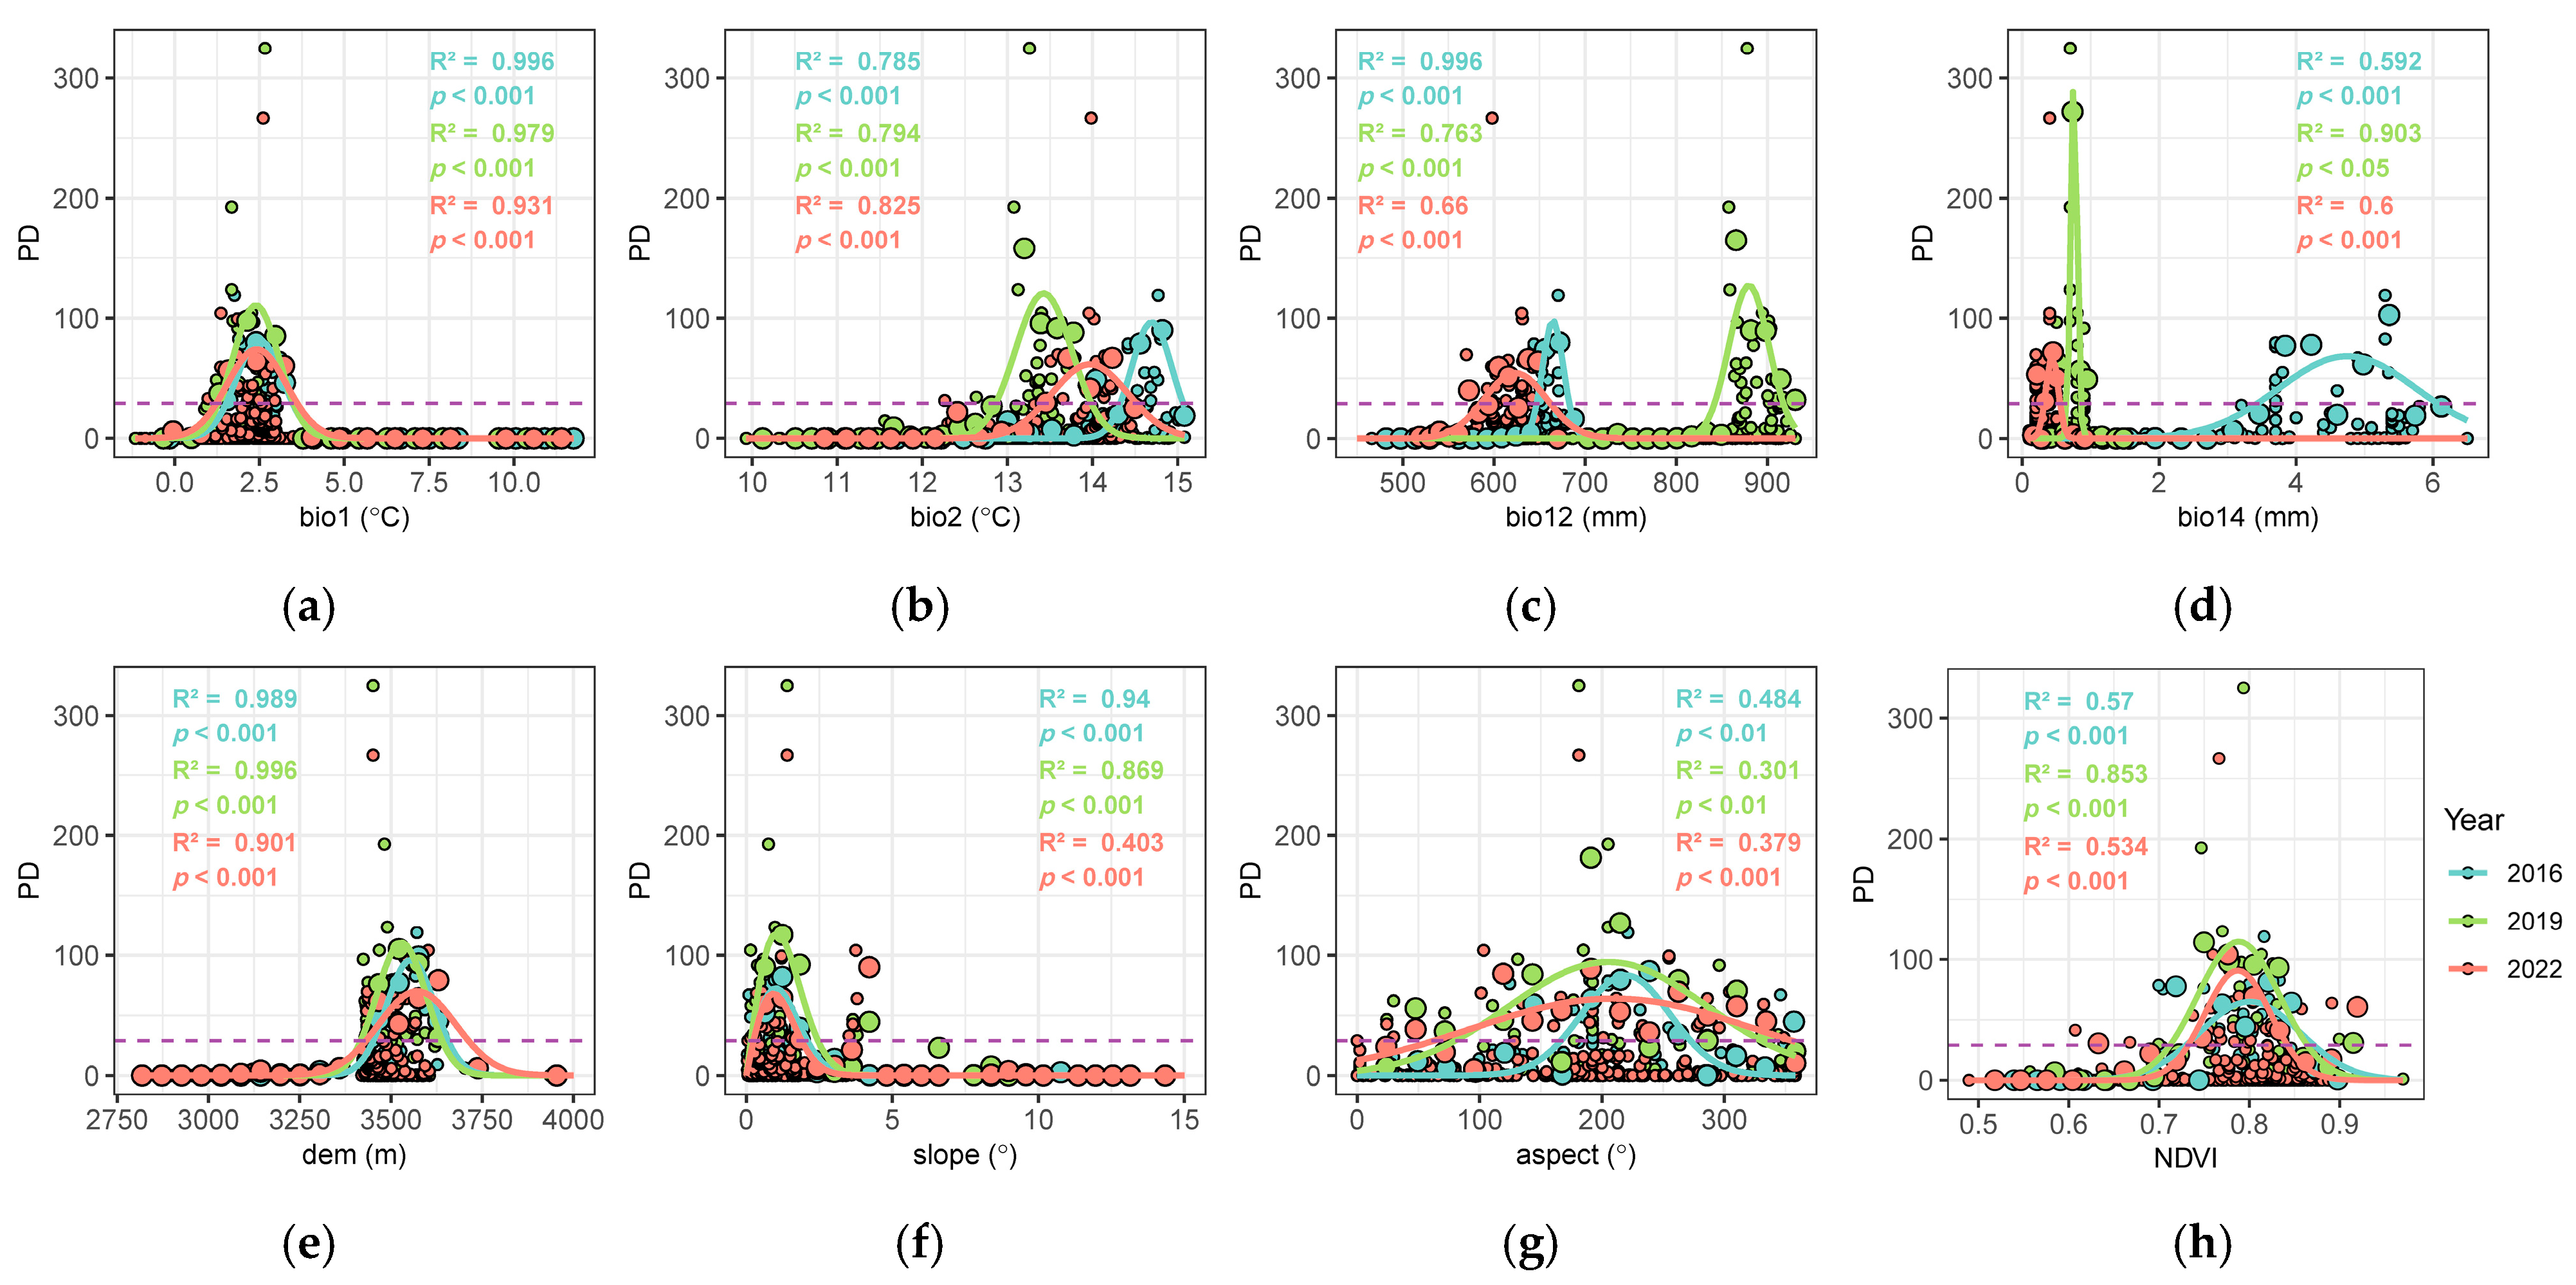
3.3. Response of Pika Density to Environmental Variables

Pika density exhibited unimodal relationships with climate, vegetation, and terrain variables (Figure 8). High pika density was found in 1.22~3.61 °C for annual mean temperature (bio1) (Figure 8a), 3417.17~3711.96 m for dem (Figure 8e), 0.16~2.45° for slope (Figure 8f), south-facing aspect (Figure 8g) and 0.71~0.87 for NDVI (Figure 8h) during the year of 2016~2022. In contrast, the mean diurnal range (bio2), annual precipitation (bio12), and precipitation of the driest month (bio14) showed a sharp variation in different years. High pika density was also found in different ranges for these variables in different years. For example, the highest pika densities were found in 14.33~15.06 °C, 12.86~13.99 °C and 13.42~14.25 °C for the mean diurnal range (bio2) (Figure 8b), 646.97~682.58 mm, 841.95~917.48 mm and 585.33~661.91 mm for annual precipitation (bio12) (Figure 8c), and 3.43~6.07 mm, 0.33~1.18 mm and 0.32~0.55 mm for precipitation of the driest month (bio14) (Figure 8d) in 2016, 2019 and 2022, respectively.
The redundancy analysis (RDA) showed that the eight environmental variables explained a total variation in pika density of 44%, 36.3%, and 32.2% in 2016, 2019, and 2022 (Figure 9), respectively. In 2016, the most important variables for pika density were mean diurnal range (bio2) (15.3%), dem (6.96%), annual mean temperature (bio1) (6.81%), slope (4.38%), NDVI (3.61%) and annual precipitation (bio12) (3.51%) (Figure 9a). Mean diurnal range (bio2) (18.62%), dem (5.11%), annual mean temperature (bio1) (5%), and slope (3.61%) had a significant effect on pika density in 2019 (Figure 9b). For 2022, pika density was dominantly affected by mean diurnal range (bio2) (14.34%), dem (5.3%), annual mean temperature (bio1) (4.05%), annual precipitation (bio12) (3.15%) and slope (2.72%) (Figure 9c). Totally, climate, terrain, and vegetation variables explained 40.2%, 32.6%, and 29% of pika density variation in 2016, 2019 and 2022 (Figure 10), respectively. However, climate and terrain variables had a significant effect on pika density in all years, which accounted for 26.87% and 10.3% variation in pika density in 2016 (Figure 10a), 25.51% and 6.49% in 2019 (Figure 10b), 21.82% and 5.8% in 2022 (Figure 10c), respectively.

4. Discussion

4.1. Spatiotemporal Distribution of Pika Density

Large-scale, long-term repeated monitoring of pika is crucial for understanding their role in alpine grasslands. However, there is limited research on long-term monitoring of pika due to the harsh environment on the QTP. The application of UAVs for investigating pika distribution and revealing the influencing mechanisms has provided unprecedented insights into their habitat and population dynamics [28,29,45]. Compared to traditional ground surveys, UAVs can perform the survey on a large scale. For example, each aerial photo covers an area of ~35 × 26 m, and each flightway covers an area of 200 × 200 m. Additionally, it will take only 8 min to fulfill a flight way, significantly improving survey efficiency. Furthermore, UAV photos have higher precision. The pixel resolution of each aerial photo is ~1 cm. The diameter of the pika hole is approximately 6 cm, and the diameter of the pika pile is about 60 cm [61]. Consequently, they can be clearly identified from aerial photos. Finally, UAV aerial photography is a non-intrusive technology and does not damage alpine grasslands.
Our results showed that pika distribution exhibited considerable spatial variation in the Gannan Tibetan Autonomous Prefecture. For example, pika is primarily distributed in the central and northeastern regions of Maqu County, as well as the southwest of Luqu County. Given the lack of pika density at a large scale, most previous studies had predicted the potential habitat relied on presence-absence data and species distribution models [24,25,26,27,62,63]. They reported that pikas are primarily distributed across the west of Gannan Tibetan Autonomous Prefecture. These discrepancies between this study and the previous works can be attributed to differences in the observation scale and the number of sampling points. Ideally, sufficient presence-absence data should have been available across the entire species’ distribution area to effectively calibrate the model [64]. However, most of these previous studies typically relied on presence-absence data sourced from literature or limited survey points. In contrast, we established a large number of survey points across all accessible areas in Gannan Tibetan Autonomous Prefecture, which reflect their true distribution in the real world. Additionally, the resolution of species sampling data should match with environmental predictor variables [65]. The previous studies mainly relied on ground surveys, which may cause the mismatch of environmental variables and pika density at a spatial scale. Our flightways covered an area of 200 × 200 m, which matched well with the pixel size of MODIS. Therefore, we believed that our results were more reliable in revealing the real pika distribution.
Our results also showed that pika density presented obvious temporal variation. Pika density exhibited a trend of initially increasing and then decreasing, with the average pika density ranging from 9.87 ha−1 to 14.43 ha−1 from 2016 to 2022. However, it reported that pika density could reach up to 22~84 ha−1 in our study region [66], which differs considerably from our finding. This is mainly attributed to the difference in investigation scale both at time and space. We performed multiple investigations of pika density at 181 work pints in Gannan Tibetan Autonomous Prefecture, while most previous studies carried out their investigation at a small scale from a single survey. We therefore concluded that the estimated pika density based on our survey was more reliable. Notably, accurate pika density was important to evaluate the effect of pika on alpine grasslands. It reported that moderate density can enhance plant diversity [61], and excessive activity can lead to grassland degradation [15,16,17]. Single-time analysis cannot comprehensively reflect the ecological impact of pika on alpine grassland, while the results based on a multi-year investigation of pika density provided a deeper understanding of their ecological effects [19,29,67]. We, therefore, recommended that multi-temporal scale monitoring be necessary to estimate pika density better and improve our understanding of their role.

4.2. Key Factors Influencing Pika Distribution

Climate, terrain, and vegetation are key factors influencing pika density. Pika is a cold-tolerant species [68]. Excessively high temperatures during the warm season and extremely low temperatures in the cold season can affect pika survival [69,70]. We therefore speculated that there was the optimal temperature for pika, and our results showed that current pika density was high in the areas with annual mean temperatures ranging from 1.22 to 3.61 °C. We also observed significant variations in the mean diurnal range across different years and the associated response of pika density. The optimal mean diurnal range for pika density was 12.86~15.06 °C. This result was consistent with the previous study, which reported that the optimal mean diurnal range for pika was 13.31~15.69 °C [24]. Pika needs to regulate their heat production and heat dissipation mechanisms to maintain a constant body temperature because temperature changes can affect their energy metabolism and thermal balance. The optimal mean diurnal range was conducive to regulating pika body temperature and reducing the consumption of brown adipose tissue [35,71,72].
Annual precipitation is a major factor affecting vegetation growth of alpine grasslands. Increased precipitation affected the survival and reproduction of pika by altering vegetation biomass and height [73]. Excessive summer rainfall can affect the survival rate of juvenile pika [42], while winter snowfall impacts pika foraging [74,75]. Our results also showed that annual precipitation and the precipitation of the driest month had a significant effect on pika density, and pika density responded diversely to them across different years. These results indicated that long-term monitoring is necessary to reveal these differences, owing to the important role of annual precipitation and the precipitation of the driest month in constructing a niche model to simulate pika distribution and evaluate pika density [25,26].
Our results indicated that the suitable elevation for pika in Gannan Tibetan Autonomous Prefecture ranged from 3400 to 3700 m, with almost no pika distribution below 3250 m or above 3750 m. This may be attributed to this elevation range being the suitable habitat environment and food resources for pika [76,77]. Our results also found that pika distributed in the areas with a slope in a range of 0.16~2.45°. A steep slope may lead to poor soil conditions for vegetation growth and low vegetation biomass [77,78]. Additionally, steep slopes can prevent pika from detecting predators, while flat ground may lead to water accumulation and flooding [79]. These factors are all unfavorable for pika survival. Notably, pika preferred to live on south-facing or southeast-facing aspects, as south-facing burrows were conducive to maintaining higher ambient temperatures in winter [80]. Previous studies have shown that vegetation is also an important factor influencing pika density [21,25,27]. However, our study indicated that NDVI did not have a significant impact on pika density. This could be attributed to the favorable water and heat conditions supporting the better vegetation in our study region [81].

4.3. Study Limitations and Future Research

To our knowledge, this work is one of few attempts to explore pika density and the associated influencing factors. We acknowledge that this study still has some shortcomings. A previous study indicated that vegetation height and biomass were significant factors affecting pika density [21]. Owing to the difficulty of obtaining vegetation height and biomass at a large scale, the effect of vegetation on pika density was analyzed by the agent of NDVI in the present study. However, NDVI cannot accurately reflect vegetation height and biomass, and it suffers from saturation when estimating biomass. For example, the predicted aboveground biomass is significantly underestimated in areas with high NDVI [82]. Recent studies have shown that UAV LiDAR and RGB imagery can be used to estimate grassland height and biomass [83,84], which supplied a new way to collect vegetation height and biomass at a large scale.
Grazing can regulate pika activity at the landscape scale by affecting their habitat environment [85]. However, there is still a lack of large-scale, dynamic monitoring systems for grazing intensity. Recent studies using UAV have investigated yak herd grazing density and grazing proximity at the household scale, offering new insights for large-scale grazing intensity surveys [86]. Substantial studies have reported that human activities were also key factors affecting pika distribution [25,26,27], and the results showed a high probability of pika presence with increasing human activity intensity. This may be because infrastructure development, such as roads and settlements, reduces vegetation cover and creates favorable living conditions for pika [87]. Additionally, areas near human activity often experience reduced predator activity, forming a protective mechanism by decreasing predation risk for pika. Therefore, more efforts were made to explore the effect of human activities on pika density in future studies, including the changes in pika density with grazing intensity, the distance between city and road, and the response of pika density to predator activity.
It reported that pika preferred areas with gentle slopes [80]. However, during our field surveys, we also observed intense pika activity on steep roadside slopes (Figure 11). Currently, most field observation is conducted in flat plots and road-accessible areas, ignoring areas such as ridges and valleys. Furthermore, our UAV flight height was set at 20 m, insufficient to survey steep slope areas. Therefore, it is necessary to conduct surveys in steeper regions using UAV terrain following mode or increasing the flight height to reveal the real effect of slope on pika. Although this study conducted extensive surveys in Gannan Tibetan Autonomous Prefecture, regions such as the mountainous northwest of Maqu County, the eastern edge, and the grasslands above the tree line in Lintan, Diebu, and Zhouqu County remain unexamined. Future surveys in these areas will be prioritized.

5. Conclusions

In this study, we investigated pika distribution in Gannan Tibetan Autonomous Prefecture by ground surveys and aerial photography in 2016, 2019, and 2022. Then, we analyzed their key influencing factors based on pika density and environmental variables. Our findings revealed that both pika distribution and density showed significant variation at spatial and temporal scales in the Gannan Tibetan Autonomous Prefecture. Mean diurnal range, dem, annual mean temperature, and slope were dominant factors influencing pika density. It is worth noting that pika density diversely responds to different climate variables across different years, indicating that long-term monitoring is essential to accurately evaluate pika density and improve our understanding of their role in alpine grasslands, and UAV is the efficient and cost-effective tool to fit this purpose. Our results suggested the distribution and density of pika at a large scale and clarified their dominant impact factors, which were crucial for formulating effective conservation and management strategies for pika.

Author Contributions

Conceptualization, X.L. and Y.Q.; Data curation, X.L., Y.Q., Y.S. and S.Y.; Funding acquisition, Y.Q.; Investigation, X.L., Y.Q. and Y.S.; Methodology, X.L. and Y.Q.; Project administration, Y.Q.; Resources, X.L.; Software, X.L., Y.Q., Y.S. and S.Y.; Supervision, Y.Q.; Validation, Y.Q.; Visualization, X.L.; Writing—original draft, X.L. and Y.Q.; Writing—review and editing, Y.Q. All authors have read and agreed to the published version of the manuscript.

Funding

This study was jointly supported by the Grants from Gansu province Science Fund for Distinguished Young Scholars (21JR7RA066), the CAS “Light of West China” Program (xbzglzb2022022), Gansu Province Science and Technology Innovation Talent Program-The Light of the West “Western Young Scholars” Project (23JR6KA009), the National Natural Science Foundation (42071139) and the independent grants from the Key Laboratory of Cryospheric Science and Frozen Soil Engineering (KLCSFSC-ZZ-2025).

Data Availability Statement

All data and materials in the article are available upon request. Further inquiries can be directed to the corresponding author.

Acknowledgments

We gratefully acknowledge Shouzhang Peng from Northwest A&F University for providing climate data and NASA for providing vegetation and topographic data.

Conflicts of Interest

The authors declare no conflicts of interest.

Correction Statement

This article has been republished with a minor correction to the existing affiliation information. This change does not affect the scientific content of the article.

References

  1. Yao, T.; Bolch, T.; Chen, D.; Gao, J.; Immerzeel, W.; Piao, S.; Su, F.; Thompson, L.; Wada, Y.; Wang, L. The imbalance of the Asian water tower. Nat. Rev. Earth Environ. 2022, 3, 618–632. [Google Scholar] [CrossRef]
  2. Miehe, G.; Schleuss, P.-M.; Seeber, E.; Babel, W.; Biermann, T.; Braendle, M.; Chen, F.; Coners, H.; Foken, T.; Gerken, T. The Kobresia pygmaea ecosystem of the Tibetan highlands–Origin, functioning and degradation of the world’s largest pastoral alpine ecosystem: Kobresia pastures of Tibet. Sci. Total Environ. 2019, 648, 754–771. [Google Scholar] [CrossRef] [PubMed]
  3. Pan, Q.; Sun, J.; Yang, Y.; Liu, W.; Li, A.; Peng, Y.; Xiu, J.; Xia, H.; Huang, J. Issues and Solutions on Grassland Restoration and Conservation in China. Bull. Chin. Acad. Sci. 2021, 36, 666–674. [Google Scholar]
  4. Fu, B.; Ouyang, Z.; Shi, P.; Fan, J.; Wang, X.; Zheng, H.; Zhao, W.; Wu, F. Current Condition and Protection Strategies of Qinghai-Tibet Plateau Ecological Security Barrier. Bull. Chin. Acad. Sci. 2021, 36, 1298–1306. [Google Scholar]
  5. Wang, Z.; Zhang, Y.; Yang, Y.; Zhou, W.; Gang, C.; Zhang, Y.; Li, J.; An, R.; Wang, K.; Odeh, I. Quantitative assess the driving forces on the grassland degradation in the Qinghai–Tibet Plateau, in China. Ecol. Inform. 2016, 33, 32–44. [Google Scholar] [CrossRef]
  6. Wang, G.; Li, Y.; Wang, Y.; Wu, Q. Effects of permafrost thawing on vegetation and soil carbon pool losses on the Qinghai–Tibet Plateau, China. Geoderma 2008, 143, 143–152. [Google Scholar]
  7. Chen, B.; Zhang, X.; Tao, J.; Wu, J.; Wang, J.; Shi, P.; Zhang, Y.; Yu, C. The impact of climate change and anthropogenic activities on alpine grassland over the Qinghai-Tibet Plateau. Agric. For. Meteorol. 2014, 189, 11–18. [Google Scholar] [CrossRef]
  8. Wang, G.; Wang, Y.; Li, Y.; Cheng, H. Influences of alpine ecosystem responses to climatic change on soil properties on the Qinghai–Tibet Plateau, China. Catena 2007, 70, 506–514. [Google Scholar] [CrossRef]
  9. Cheng, G.; Wu, T. Responses of permafrost to climate change and their environmental significance, Qinghai-Tibet Plateau. J. Geophys. Res. Earth Surf. 2007, 112. [Google Scholar] [CrossRef]
  10. Zhang, J.; Zhang, L.; Liu, W.; Qi, Y.; Wo, X. Livestock-carrying capacity and overgrazing status of alpine grassland in the Three-River Headwaters region, China. J. Geogr. Sci. 2014, 24, 303–312. [Google Scholar] [CrossRef]
  11. Arthur, A.D.; Pech, R.P.; Jiebu, Z.Y.; Lin, H. Grassland degradation on the Tibetan Plateau: The role of small mammals and methods of control. Aust. Cent. Int. Agric. Res. Tech. Rep. 2007, 67, 1–35. [Google Scholar]
  12. Shao, Z.; Qin, Y. Advance in Studying the Influence of Plateau Pikas Disturbance on Carbon Cycle of Alpine Grasslands. Acta Agrestia Sin. 2022, 30, 1086–1094. [Google Scholar]
  13. Li, W.; Zhang, Y. Impacts of plateau pikas on soil organic matter and moisture content in alpine meadow. Acta Theriol. Sin. 2006, 26, 331. [Google Scholar]
  14. Smith, A.T.; Foggin, J.M. The plateau pika (Ochotona curzoniae) is a keystone species for biodiversity on the Tibetan plateau. Anim. Conserv. Forum 1999, 2, 235–240. [Google Scholar] [CrossRef]
  15. Zhang, W.; Wang, Q.; Zhang, J.; Pang, X.; Xu, H.; Wang, J.; Guo, Z. Clipping by plateau pikas and impacts to plant community. Rangel. Ecol. Manag. 2020, 73, 368–374. [Google Scholar] [CrossRef]
  16. Pech, R.P.; Jiebu Arthur, A.D.; Yanming, Z.; Hui, L. Population dynamics and responses to management of plateau pikas Ochotona curzoniae. J. Appl. Ecol. 2007, 44, 615–624. [Google Scholar] [CrossRef]
  17. Song, Z.; Li, X.; Su, X.; Li, C. Analyzing the recovery mechanisms of patchy degradation and its response to mowing and plateau pika disturbances in alpine meadow. Ecol. Indic. 2023, 154, 110565. [Google Scholar] [CrossRef]
  18. Dong, Q.M.; Zhao, X.Q.; Wu, G.L.; Shi, J.J.; Ren, G.H. A review of formation mechanism and restoration measures of “black-soil-type” degraded grassland in the Qinghai-Tibetan Plateau. Environ. Earth Sci. 2013, 70, 2359–2370. [Google Scholar] [CrossRef]
  19. Sun, F.; Chen, W.; Liu, L.; Liu, W.; Cai, Y.; Smith, P. Effects of plateau pika activities on seasonal plant biomass and soil properties in the alpine meadow ecosystems of the Tibetan Plateau. Grassl. Sci. 2015, 61, 195–203. [Google Scholar] [CrossRef]
  20. Wei, W.; He, J.; Zheng, Q.; He, Y.; Oosthuizen, M.K. A comparison of density estimation methods in plateau pika populations in an alpine meadow ecosystem. J. Mammal. 2020, 101, 1091–1096. [Google Scholar] [CrossRef]
  21. Wei, W.; Yao, X.; Zhang, Y.; Zhen, Q.; Qin, M.; Tang, Z.; Oosthuizen, M.K.; Zhang, W. Vegetation restoration measures: Increasing plant height suppresses population densities of plateau pikas. Land Degrad. Dev. 2023, 34, 2201–2213. [Google Scholar] [CrossRef]
  22. Wang, X.; Li, J.; Li, J.; Guo, Z.; Pang, X. Plateau pika (Ochotona curzoniae) bioturbation triggers soil organic carbon loss by altering plant inputs and soil properties and their control on microbial composition. Catena 2025, 250, 108737. [Google Scholar] [CrossRef]
  23. Pang, X.P.; Wang, Q.; Guo, Z.G. The impact of the plateau pika on the relationship between plant aboveground biomass and plant species richness. Land Degrad. Dev. 2021, 32, 1205–1212. [Google Scholar] [CrossRef]
  24. Qi, Y.; Pu, X.; Li, Y.; Li, D.; Huang, M.; Zheng, X.; Guo, J.; Chen, Z. Prediction of Suitable Distribution Area of Plateau pika (Ochotona curzoniae) in the Qinghai–Tibet Plateau under Shared Socioeconomic Pathways (SSPs). Sustainability 2022, 14, 12114. [Google Scholar] [CrossRef]
  25. Hua, R.; Hua, L.; Tang, Z.; Dong, R.; Bao, D.; Ye, G.; La, M.; Sun, W.; Zhang, Z.; Wang, L. Maxent Modeling for Predicting Habitat Suitability and Potential Distribution of Plateau Pika (Ochotona curzoniae) on the Qinghai-Tibet Plateau, China. Rangel. Ecol. Manag. 2023, 87, 34–43. [Google Scholar] [CrossRef]
  26. Wang, Z.; Deng, Y.; Kang, Y.; Wang, Y.; Bao, D.; Tan, Y.; An, K.; Su, J. Impacts of climate change and human activities on three Glires pests of the Qinghai–Tibet Plateau. Pest Manag. Sci. 2024, 80, 5233–5545. [Google Scholar] [CrossRef]
  27. Wu, Y.; Ma, Y.; Liu, W.; Zhang, W. Modeling the spatial distribution of plateau pika (Ochotona curzoniae) in the Qinghai Lake Basin, China. Animals 2019, 9, 843. [Google Scholar] [CrossRef]
  28. Yi, S.; Chen, J.; Qin, Y. Preliminary application of aerial photos using UAV on the ecological studies of alpine grassland on Qinghai-Tibetan Plateau. J. Southwest Univ. Natl. 2016, 42, 1–7. [Google Scholar]
  29. Qin, Y.; Yi, S.; Ding, Y.; Qin, Y.; Zhang, W.; Sun, Y.; Hou, X.; Yu, H.; Meng, B.; Zhang, H. Effects of plateau pikas’ foraging and burrowing activities on vegetation biomass and soil organic carbon of alpine grasslands. Plant Soil 2021, 458, 201–216. [Google Scholar] [CrossRef]
  30. Du, J.; Yi, S.; Qin, Y.; Yu, H.; Ma, J.; Sun, Y.; Qin, Y. Distribution and cause of plateau pika (Ochotona curzoniae) burrows in Henan Mongolian Autonomous county, Qinghai Province. J. Anhui Agric. Univ. 2019, 46, 415–419. [Google Scholar]
  31. Guo, X.; Yi, S.; Qin, Y.; Chen, J. Habitat environment affects the distribution of plateau pikas: A study based on an unmanned aerial vehicle. Pratacultural Sci. 2017, 34, 1306–1313. [Google Scholar]
  32. Du, J.; Sun, Y.; Xiang, B.; Chen, J.; Qin, Y.; Hou, X.; Yu, H.; Yi, S. Potential distribution of plateau pika and its influence factors in the source region of the Yellow River Basin using BIOMOD. Pratacultural Sci. 2019, 36, 1074–1083+1917. [Google Scholar]
  33. Hua, R.; Zhou, R.; Baodaerhan Zhang, F.; Zhou, F.; Tang, Z.; Hua, L. Prediction of geographical distribution for plateau pikas and its potential response to climate change in Maqu. Grassl. Turf 2020, 40, 1–8. [Google Scholar]
  34. Zhao, J.; Jiang, C.; Ding, Y.; Li, G.; Li, Q. Potential distribution and disturbance intensity analysis of plateau pika in the source region of the Yellow River via BIOMOD2 integrated model. Chin. J. Ecol. 2024, 43, 1192–1201. [Google Scholar]
  35. Qu, J.; Russell, J.C.; Ji, W.; Yang, M.; Chen, Q.; Li, W.; Zhang, Y. Five-year population dynamics of plateau pikas (Ochotona curzoniae) on the east of Tibetan Plateau. Eur. J. Wildl. Res. 2017, 63, 51. [Google Scholar] [CrossRef]
  36. Smith, A.T. Conservation status of American pikas (Ochotona princeps). J. Mammal. 2020, 101, 1466–1488. [Google Scholar] [CrossRef]
  37. Peng, S.; Ding, Y.; Liu, W.; Li, Z. 1-km monthly precipitation dataset for China (1901–2023). Earth Syst. Sci. Data 2024, 11, 1931–1946. [Google Scholar] [CrossRef]
  38. Liu, X.; Chen, Q.; Wang, Y. The effect of grassland degeneration for ecological security and economie development in Gannan region of Gansu province. Pratacultural Sci. 2006, 23, 39–42. [Google Scholar]
  39. Yu, H.; Feng, Q.; Chen, S.; Han, L.; Huang, X.; Liang, T. Grassland biomass dynamic monitoring in Gannan prefecture based on the microwave vegetation indices. J. Lanzhou Univ. 2011, 47, 69–74. [Google Scholar]
  40. Liu, M.; Zhang, Y.; Li, Q.; Li, B.; Sun, R.; Song, J. Species abundance distribution characteristics of alpine meadow plant community in Gannan. China Environ. Sci. 2021, 41, 1405–1414. [Google Scholar] [CrossRef]
  41. Yi, S. FragMAP: A tool for long-term and cooperative monitoring and analysis of small-scale habitat fragmentation using an unmanned aerial vehicle. Int. J. Remote Sens. 2017, 38, 2686–2697. [Google Scholar] [CrossRef]
  42. Qu, J.; Li, W.; Yang, M.; Ji, W.; Zhang, Y. Life history of the plateau pika (Ochotona curzoniae) in alpine meadows of the Tibetan Plateau. Mamm. Biol. 2013, 78, 68–72. [Google Scholar] [CrossRef]
  43. Zhang, W.; Jin, S.; Yu, C.; Pang, X.; Wang, J.; Guo, Z. Influence of the density of burrow entrances of plateau pika on the concentration of soil nutrients in a Kobresia pygmaea meadow. Pratacultural Sci. 2018, 35, 1593–1601. [Google Scholar]
  44. Wei, W. The Relationship between Population Density, Vegetation Community Structure and Predation Risk of Plateau Pika. Acta Agrestia Sin. 2019, 27, 350–355. [Google Scholar]
  45. Hua, R.; Bao d Dong, R.; Tang, Z.; Chu, B.; Hao, Y.; Hua, L. Monitoring of rodent damage areas in grassland using unmanned aerial vehicle remote sensing technology. Acta Prataculturae Sin. 2023, 32, 71–82. [Google Scholar]
  46. Liu, J.; Si, W. Correlation between population density of plateau pika and community structure of grassland. J. South. Agric. 2012, 43, 2083–2086. [Google Scholar]
  47. Chen, J.; Wang, Z.; Wang, Y.; Li, B.; Zhaxi, X.Z.; Luosangdawa, Z.M. Methods for investigating the density of the plateau pika in Northern Tibetan Plateau. Plant Prot. 2008, 34, 114–117. [Google Scholar]
  48. Yu, H. Investigation on The Field Route of Rodent Damage in The Grassland of Huangnan State in Qinghai Provine. Qinghai Prataculture 2018, 27, 36–40. [Google Scholar]
  49. Sun, F.; Long, R.; Lu, C. Effects of plateau pikas (Ochotona curzoniae) burrow densities on plant community composition and population diversity in alpine meadow. J. Arid. Land Resour. Environ. 2010, 24, 181–186. [Google Scholar]
  50. Li, B.; Jiebu Li, S.; Tao, Y. The survey report of main meadow type mouse of north plateau in Tibet. Tibet. Sci. Technol. 2007, 3, 29–30. [Google Scholar]
  51. Gong, A.; Zhang, S.; Li, Q. Discussion on population types of redents and damage in alpine meadow grassland in QingHai. Qinghai Prataculture 2003, 12, 19–23. [Google Scholar]
  52. Liu, W.; Wang, X.; Zhou, L.; Zhou, H. Studies on Destruction, Prevention and Control of Plateau Pikas in Kobresia pygmaea Meadow. Acta Theriol. Sin. 2003, 23, 214–219. [Google Scholar]
  53. Yi, S.; Chen, J.; Qin, Y.; Xu, G. The burying and grazing effects of plateau pika on alpine grassland are small: A pilot study in a semiarid basin on the Qinghai-Tibet Plateau. Biogeosciences 2016, 13, 6273–6284. [Google Scholar] [CrossRef]
  54. Villén Peréz, S.; Heikkinen, J.; Salemaa, M.; Mäkipää, R. Global warming will affect the maximum potential abundance of boreal plant species. Ecography 2020, 43, 801–811. [Google Scholar] [CrossRef]
  55. Cade, B.S.; Noon, B.R.; Flather, C.H. Quantile regression reveals hidden bias and uncertainty in habitat models. Ecology 2005, 86, 786–800. [Google Scholar] [CrossRef]
  56. Legendre, P.; Gallagher, E.D. Ecologically meaningful transformations for ordination of species data. Oecologia 2001, 129, 271–280. [Google Scholar] [CrossRef]
  57. Wickham, H. ggplot2: Elegant Graphics for Data Analysis; Springer: New York, NY, USA, 2016. [Google Scholar]
  58. Hijmans, R.J.; Phillips, S.; Leathwick, J.; Elith, J. dismo: Species Distribution Modeling, R Package Version 1.3-14. 2023. Available online: https://CRAN.R-project.org/package=dismo (accessed on 26 September 2023).
  59. Huang, H.; Zhou, L.; Chen, J.; Wei, T. ggcor: Extended Tools for Correlation Analysis and Visualization, R Package Version 0.9.7. 2020.
  60. Lai, J.; Zou, Y.; Zhang, J.; Peres-Neto, P.R. Generalizing hierarchical and variation partitioning in multiple regression and canonical analyses using the rdacca. hp R package. Methods Ecol. Evol. 2022, 13, 782–788. [Google Scholar] [CrossRef]
  61. Qin, Y.; Huang, B.; Zhang, W.; Yu, Y.; Yi, S.; Sun, Y. Pikas burrowing activity promotes vegetation species diversity in alpine grasslands on the Qinghai-Tibetan Plateau. Glob. Ecol. Conserv. 2021, 31, e01806. [Google Scholar] [CrossRef]
  62. Sumbh, O.; Hof, A.R. Can pikas hold the umbrella? Understanding the current and future umbrella potential of keystone species Pika (Ochotona spp.). Glob. Ecol. Conserv. 2022, 38, e02247. [Google Scholar] [CrossRef]
  63. Song, Y.; Chong, H.; Wang, D.; Xiao, H. Simulation and response mechanism of potential geographical distribution of plateau pika Ochotona curzoniae under climate change. Glob. Ecol. Conserv. 2025, 57, e03409. [Google Scholar] [CrossRef]
  64. Tessarolo, G.; Lobo, J.M.; Rangel, T.F.; Hortal, J. High uncertainty in the effects of data characteristics on the performance of species distribution models. Ecol. Indic. 2021, 121, 107147. [Google Scholar] [CrossRef]
  65. Guisan, A.; Thuiller, W. Predicting species distribution: Offering more than simple habitat models. Ecol. Lett. 2005, 8, 993–1009. [Google Scholar] [CrossRef] [PubMed]
  66. Yan, C.; Li, C.; Lin, K.; Fu, H.; Zhang, Z. Current situation, research progress and management strategies of plant diseases, insect pests, and rodent pests in grasslands of China. Bull. Natl. Nat. Sci. Found. China 2023, 37, 580–586. [Google Scholar]
  67. Li, J.; Li, X.; Gao, J.; Ma, G.; Qi, X. Micro-scale fragmentation of the alpine meadow landscape on the Qinghai-Tibet Plateau under external disturbances. Catena 2021, 201, 105220. [Google Scholar] [CrossRef]
  68. Pan, X.; Migmar, W.-D. Plateau pika ecology: A review. Chin. J. Ecol. 2016, 35, 7. [Google Scholar]
  69. Wang, X.; Smith, A.T. On the natural winter mortality of the plateau pika (Ochotona curzoniae). Acta Theriol. Sin. 1988, 8, 152–156. [Google Scholar]
  70. Nie, H. Study on the Evolutionary Ecology of Small Herbivorous Ammals: Life History Strategy of Plateau Pika (Ochotona curzoniae). Ph.D. Thesis, Zhejiang University, Hangzhou, China, 2005. [Google Scholar]
  71. Wang, J.; Zhang, Y.; Wang, D. Seasonal thermogenesis and body mass regulation in plateau pikas (Ochotona curzoniae). Oecologia 2006, 149, 373–382. [Google Scholar] [CrossRef]
  72. Wang, D.; Sun, R.; Wang, Z.; Liu, J. Effects of temperature and photoperiod on thermogenesis in plateau pikas (Ochotona curzoniae) and root voles (Microtus oeconomus). J. Comp. Physiol. B 1999, 169, 77–83. [Google Scholar] [CrossRef]
  73. Yi, S.; Cao, W.; Zhang, J.; Qin, Y.; Sun, Y.; Qin, Y. Research Progress on Plateau Pika Dynamic Distribution in the Context of Climate Change and Human Activities. J. Nantong Univ. 2020, 19, 16–30. [Google Scholar]
  74. Zong, H.; Xia, W.; Sun, D. The influence of a heavy snow on the population density of small mammals. Acta Biol. Plateau Sin. 1986, 5, 85–90. [Google Scholar]
  75. Speakman, J.R.; Chi, Q.; Ołdakowski, Ł.; Fu, H.; Fletcher, Q.E.; Hambly, C.; Togo, J.; Liu, X.; Piertney, S.B.; Wang, X. Surviving winter on the Qinghai-Tibetan Plateau: Pikas suppress energy demands and exploit yak feces to survive winter. Proc. Natl. Acad. Sci. USA 2021, 118, e2100707118. [Google Scholar] [CrossRef] [PubMed]
  76. Li, J.; Yang, Q.; Bai, Z.; Zhou, W.; Semenza, G.L.; Ge, R. Chronic cold exposure results in subcutaneous adipose tissue browning and altered global metabolism in Qinghai-Tibetan plateau pika (Ochotona curzoniae). Biochem. Biophys. Res. Commun. 2018, 500, 117–123. [Google Scholar] [CrossRef] [PubMed]
  77. Bhandari, J.; Zhang, Y. Effect of altitude and soil properties on biomass and plant richness in the grasslands of Tibet, China, and Manang District, Nepal. Ecosphere 2019, 10, e02915. [Google Scholar] [CrossRef]
  78. Sun, J.; Zhang, Z.; Dong, S. Adaptive management of alpine grassland ecosystems over Tibetan Plateau. Pratacultural Sci. 2019, 36, 933–938. [Google Scholar]
  79. Smith, A.T.; Badingqiuying Wilson, M.C.; Hogan, B.W. Functional-trait ecology of the plateau pika Ochotona curzoniae in the Qinghai–Tibetan Plateau ecosystem. Integr. Zool. 2019, 14, 87–103. [Google Scholar] [CrossRef]
  80. Wei, W.; Zhang, L.; Yang, G.; Xu, J.; Fan, X.; Zhang, W. A study on the burrow features and functions of plateau pika. Acta Prataculturae Sin. 2013, 22, 198–204. [Google Scholar]
  81. Ren, Y.; Liu, J.; Liu, S.; Wang, Z.; Liu, T.; Shalamzari, M.J. Effects of Climate Change on Vegetation Growth in the Yellow River Basin from 2000 to2019. Remote Sens. 2022, 14, 687. [Google Scholar] [CrossRef]
  82. Hu, R.; Chen, X.; Chen, J.; Zhang, S.; Kuang, Y.; Yu, H.; Ji, H.; Zhao, X.; Yi, S.; Meng, B.; et al. MODIS NDVI saturation assessment of alpine meadow grassland biomass estimation using remote sensing: A case study in the eastern edge of the Qinghai-Tibet Plateau. Acta Ecol. Sin. 2024, 44, 6357–6372. [Google Scholar]
  83. Zhang, H.; Tang, Z.; Wang, B.; Meng, B.; Qin, Y.; Sun, Y.; Lv, Y.; Zhang, J.; Yi, S. A non-destructive method for rapid acquisition of grassland aboveground biomass for satellite ground verification using UAV RGB images. Glob. Ecol. Conserv. 2022, 33, e01999. [Google Scholar] [CrossRef]
  84. Kan, H.; Zhang, H.; Meng, B.; Shuhua, Y. LiDAR flight parameter influence on low vegetation height inversion: A case study of DJI Zenmuse L1. Pratacultural Sci. 2023, 40, 2513–2527. [Google Scholar]
  85. Tang, Z.; Zhang, Y.; Zheng, Z.; Cong, N.; Zhu, Y.; Chen, Y.; Gao, J.; Zhu, W. Grazing affects ecosystem traits by regulating plateau pika activities at the landscape scale. Sci. Total Environ. 2024, 946, 174356. [Google Scholar] [CrossRef] [PubMed]
  86. Sun, Y.; Yi, S.; Hou, F.; Luo, D.; Hu, J.; Zhou, Z. Quantifying the dynamics of livestock distribution by unmanned aerial vehicles (UAVs): A case study of yak grazing at the household scale. Rangel. Ecol. Manag. 2020, 73, 642–648. [Google Scholar] [CrossRef]
  87. Zhang, H.J.; Xie, J.X.; Li, X.L. The distribution of the plateau pika and correlation with soil properties of Henan County in Qinghai. Qinghai Univ. (Nat. Sci. Ed.) 2010, 34, 14–21. [Google Scholar]
Figure 1. Location of Gannan Tibetan Autonomous Prefecture, grassland types, and fixed aerial photography monitoring plots.
Drones 09 00298 g001
Figure 2. GRID flight way. Blue circular plots represent work points where the coefficient of effective pika hole was surveyed (a), FragMap v5.0 software working interface (b), 16 aerial photos collected by UAV (c), artificial intelligence classification, and manual correction of total pika holes (d).
Drones 09 00298 g002
Figure 3. The flowchart of monitoring total pika holes by UAV and ground survey, extracting total pika holes, and estimating effective pika holes and pika density.
Drones 09 00298 g003
Figure 4. The correlation heatmaps of environmental variables in 2016 (a), 2019 (b), and 2022 (c). *, p < 0.05; **, p < 0.01; ***, p < 0.001.
Drones 09 00298 g004
Figure 5. Temporal variation in bio1 (annual mean temperature) (a), bio2 (mean diurnal range) (b), bio12 (annual precipitation) (c), bio14 (precipitation of driest month) (d) and NDVI (e) during the year of 2016~2022.
Drones 09 00298 g005
Figure 6. Interannual variation in bio1 (a), bio2 (b), bio12 (c), bio14 (d), and NDVI (e) during the year of 2016~2022.
Drones 09 00298 g006aDrones 09 00298 g006b
Figure 7. Spatiotemporal distribution of different categories of pika density in 2016 (a), 2019 (b), and 2022 (c) in alpine grasslands of Gannan Tibetan Autonomous Prefecture.
Drones 09 00298 g007
Figure 8. Relationships of pika density with bio1 (a), bio2 (b), bio12 (c), bio14 (d), dem (e), slope (f), aspect (g), and NDVI (h). Blue, green, and red points are pika density in 2016, 2019 and 2022. Bolded points represent boundary points. Blue, green, and red lines are constraint lines for 2016, 2019, and 2022.
Drones 09 00298 g008
Figure 9. The relative importance of individual environment variables to pika density in 2016 (a), 2019 (b), and 2022 (c). *, p < 0.05; **, p < 0.01; ***, p < 0.001.
Drones 09 00298 g009
Figure 10. The relative importance of climate, terrain, and vegetation variables to pika density in 2016 (a), 2019 (b), and 2022 (c). *, p < 0.05 **, p < 0.01; ***, p < 0.001.
Drones 09 00298 g010
Figure 11. Pika holes on a steep slope. The red rectangles were the location of the identified total pika holes.
Drones 09 00298 g011
Table 1. The coefficient of effective pika hole (Ceph) and the coefficient of pika density (Cpd) of alpine grasslands.
Study AreaCephCpdReferences
Gannan Tibetan Autonomous Prefecture0.38 ± 0.14-This study
Maqu county0.440.46[43,44,45]
Yushu prefecture0.740.37[46]
Naqu county0.480.11[47]
Huangnan prefecture0.27-[48]
Maqin county-0.175[49]
Naqu county0.260.25[50]
Qinghai-0.27[51]
Dari county-0.22[52]
Tianjun county0.290.44[53]
Average0.410.29-
Table 2. Criteria for classifying pika hazards based on their density.
CategoriesHazardEPH (ha−1)Pika Density (ha−1)
IWithout pika0~30
IINo hazard4~81.16~2.32
IIISlight hazard9~302.61~8.7
IVModerate hazard31~1008.99~29
VSevere hazard≥101≥29.29
Table 3. The 19 bioclimate variables used in this study.
Symbol (Unit)Description
Bio1 (°C)Annual Mean Temperature
Bio2 (°C)Mean Diurnal Range (Mean of monthly (max temp − min temp))
Bio3 (-)Isothermality (BIO2/BIO7) (×100)
Bio4 (°C)Temperature Seasonality (standard deviation × 100)
Bio5 (°C)Max Temperature of Warmest Month
Bio6 (°C)Min Temperature of Coldest Month
Bio7 (°C)Temperature Annual Range (BIO5-BIO6)
Bio8 (°C)Mean Temperature of Wettest Quarter
Bio9 (°C)Mean Temperature of Driest Quarter
Bio10 (°C)Mean Temperature of Warmest Quarter
Bio11 (°C)Mean Temperature of Coldest Quarter
Bio12 (mm)Annual Precipitation
Bio13 (mm)Precipitation of Wettest Month
Bio14 (mm)Precipitation of Driest Month
Bio15 (-)Precipitation Seasonality (Coefficient of Variation)
Bio16 (mm)Precipitation of Wettest Quarter
Bio17 (mm)Precipitation of Driest Quarter
Bio18 (mm)Precipitation of Warmest Quarter
Bio19 (mm)Precipitation of Coldest Quarter
Table 4. Pika density of different categories in 2016, 2019 and 2022. Measure unit is ha−1. Different lowercase letters indicate significant differences among different years (p < 0.05).
Pika Density201620192022
I0 a0 a0 a
II1.42 ± 0.48 a1.33 ± 0.45 a1.36 ± 0.39 a
III5.12 ± 1.83 a5.33 ± 2.21 a5.08 ± 1.80 a
IV17.03 ± 5.68 a19.01 ± 6.24 a15.88 ± 5.22 a
V65.36 ± 23.45 a79.04 ± 67.11 a61.37 ± 47.89 a
Mean9.87 ± 21.03 a14.43 ± 37.79 a11.20 ± 26.72 a
Disclaimer/Publisher’s Note: The statements, opinions and data contained in all publications are solely those of the individual author(s) and contributor(s) and not of MDPI and/or the editor(s). MDPI and/or the editor(s) disclaim responsibility for any injury to people or property resulting from any ideas, methods, instructions or products referred to in the content.

