Article

Mutual Cooperation System for Task Execution Between Ground Robots and Drones Using Behavior Tree-Based Action Planning and Dynamic Occupancy Grid Mapping †

by
Hiroaki Kobori
and
Kosuke Sekiyama
*,‡
Department of Mechatronics Engineering, Graduate School of the Science and Technology, Meijo University, 501-1 Shiogamaguchi, Tempaku-ku, Nagoya 468-8502, Japan
*
Author to whom correspondence should be addressed.
This paper is an entended version of our paper published in Kobori, H.; Sekiyama, K. Cooperative System of Ground Robots based on dynamic exploration of Drone Occupancy Grid Maps. In Proceedings of the 2023 62nd Annual Conference of the Society of Instrument and Control Engineers (SICE), Tsu, Japan, 6–9 September 2023; pp. 1074–1079.
These authors contributed equally to this work.
Drones 2025, 9(2), 95; https://doi.org/10.3390/drones9020095
Submission received: 16 December 2024 / Revised: 14 January 2025 / Accepted: 23 January 2025 / Published: 26 January 2025

Abstract

:
This study presents a cooperative system where drones and ground robots share information to efficiently complete tasks in environments that challenge the capabilities of a single robot. Drones focus on exploring high-interest areas for ground robots, generating occupancy grid maps and identifying high-risk routes. Ground robots use this information to evaluate and adapt routes as needed. Flexible action planning through behavior trees enables the robots to respond dynamically to environmental changes, facilitating spontaneous and adaptable cooperation. Experiments with real robots confirmed the system’s performance and adaptability to various settings. Specifically, when high-risk areas were identified from drone provided information, ground robots generated alternative routes to bypass these zones, demonstrating the system’s capacity to navigate complex paths while minimizing risks. This establishes a basis for scaling to larger environments. The proposed system is expected to improve the safety and efficiency of robot operations by enabling multiple robots to accomplish complex tasks collaboratively-tasks that would be difficult or time consuming for an individual robot. The findings demonstrate the potential for multi-robot cooperation to enhance task execution in challenging environments and provide a framework for future research on effective role sharing and information exchange in autonomous systems.

1. Introduction

Cooperative systems involving drones and ground robots have attracted significant attention from researchers due to their diverse applications in efficient task execution and data collection. These systems must respond rapidly and effectively to environmental uncertainties by coordinating robots with different functionalities. The cooperative forms between drones and ground robots can be broadly categorized into two main types: perception cooperation and motion cooperation [1].
Perception cooperation involves multiple sensors collaborating to acquire and share information. This can be further divided into complementary collaborative collaboration and cooperation. Complementary cooperation involves each robot providing different information or capabilities, enabling a more comprehensive environmental perception [2]. On the other hand, collaborative cooperation involves multiple sensors working together to provide information that cannot be obtained by a single sensor [3,4].
In motion cooperation, there are centralized and decentralized approaches. Centralized cooperation involves a central control station that handles all computations and control, effective in static and controlled environments [5]. In contrast, decentralized cooperation involves each robot operating autonomously while cooperating with others to complete tasks. This approach demonstrates high flexibility and fault tolerance, especially in disaster response and unknown complex environments [6]. Furthermore, recent research has explored the use of multi-agent reinforcement learning (MARL) to enhance cooperation between ground robots and drones. This method allows individual agents to autonomously learn and dynamically adjust their behavior in cooperation with other agents, thereby improving decision-making capabilities in complex environments [7,8]. Moreover, systems that combine these cooperative forms have been proposed. For instance, using decentralized and complementary cooperation allows robots to operate autonomously while complementing each other, leading to effective task execution. This study addresses the critical challenges of integrating decentralized and complementary cooperation, such as interoperability, energy efficiency, and adaptability to unknown environments, through a novel system validated in real-world experiments. Therefore, this research focuses on decentralized and complementary cooperation, seeking to combine them in a way that maximizes the capabilities of each robot for efficient task completion.
Previous studies have proposed systems where drones and ground robots collaborate to explore unknown areas. In these systems, drones create occupancy grid maps and transfer them to ground robots to aid in optimal path planning [9]. Additionally, mechanisms for spontaneous cooperative work have been incorporated, with action planning implemented using behavior trees (BTs). However, the predefined fixed exploration points for drones make it challenging to respond to rapidly changing environments, and there needs to be more flexible exploration based on the ground robots’ areas of interest.
This research aims to enhance the interaction and task execution efficiency of robots in complex environments through cooperative mechanisms between drones and ground robots. By leveraging BTs for action planning, the proposed system facilitates real-time decision-making and establishes dynamic cooperation between heterogeneous robots.
A key innovation of this research is the implementation of mutual information sharing within the BT nodes of each robot. While BT has traditionally been used in single-robot systems for its modularity and adaptability, conventional BT implementations lack mechanisms for real-time collaboration between multiple robots. To overcome this limitation, the functionality of existing BT Action and Condition nodes has been extended to support real-time data exchange between drones and ground robots. For example, a drone’s Condition node evaluates data from a ground robot to identify high-risk areas, while the ground robot’s Action node uses updated maps from the drone to generate alternative routes.
From a decentralized cooperation perspective, this approach supports efficient task execution by allowing each robot to operate autonomously while maintaining robust communication. Furthermore, complementary cooperation is achieved by leveraging drones’ aerial exploration and risk identification capabilities and ground robots’ detailed path planning and navigation strengths. This integration enhances both adaptability and overall system performance.
Conventional cooperative approaches have primarily relied on centralized decision-making frameworks and unidirectional information sharing, making it challenging for robots to dynamically and collaboratively adapt in real-time within uncertain environments. The method proposed in this study overcomes these limitations by incorporating a mutual information-sharing mechanism based on BTs. This approach enables real-time bidirectional information exchange and collaborative task execution, which was previously unattainable. For example, the proposed system allows a drone to utilize information provided by a ground robot to promptly identify high-risk areas. Concurrently, the ground robot can dynamically update its path based on the latest environmental information generated by the drone. These capabilities, which were difficult to achieve using conventional methods, demonstrate the novelty and practical applicability of the proposed approach.
Experiments were conducted using actual robots in minimal environments to confirm the system’s fundamental performance, demonstrating its adaptability in complex environments and providing a foundation for evaluating its applicability in larger-scale environments. These experiments verified that the proposed system could efficiently identify and mitigate risks, ensuring seamless task execution even in highly uncertain scenarios. While we acknowledge the importance of quantitative evaluation methods, we emphasize that the core advantages of the proposed system, such as adaptability and flexibility in dynamic and uncertain environments, are challenging to capture solely through numerical comparisons. Therefore, we supplement the quantitative evaluation with detailed operational examples to illustrate the system’s practical applicability and unique capabilities.
As a result, the safety and efficiency of robot operations are expected to improve significantly. The mutual cooperation framework not only enhances the effective implementation of role division and information sharing in complementary cooperation but also increases the autonomy and flexibility of each robot in decentralized cooperation. By addressing challenges that are insurmountable for a single robot, this system represents a significant advancement in multi-robot interaction, paving the way for its deployment in real-world applications, such as search and rescue, surveillance, and complex environmental exploration.

2. Related Work

2.1. Cooperative Systems with Multiple Robots Such as Drones and Ground Robots

This study focuses on decentralized and complementary cooperation, providing an overview of key previous research from both perspectives and elucidating current technological trends and unresolved challenges.
Regarding decentralized cooperation, significant research has been conducted on cooperative systems among heterogeneous robots, including drones and ground robots. This form of collaboration aims to share real-time information and efficiently execute diverse tasks. Queralta et al. developed a system where heterogeneous robots (ground robots, drones, USVs, and UUVs) collaborate for disaster rescue, aiming for rapid situation assessment and response at disaster sites. This system shares information in real time via a communication network and uses multiple sensors to collect data. However, challenges remain, particularly in achieving fully autonomous robots, which often require human intervention. Moreover, many systems are tested in simulation environments, necessitating further research for real-world applications [10]. Chen et al. developed a multi-modal task-based graphical user interface to support the control of heterogeneous robot teams for the DARPA Subterranean Challenge (SubT). This interface is designed for operators to intuitively manipulate tasks on a 3D map, supporting autonomous task execution and situation awareness of robots. However, challenges such as unstable communication and GPS-denied environments limit the robots’ adaptation to complex environments [11].
On the other hand, complementary cooperation focuses on utilizing the unique characteristics of different robots to accomplish tasks. Dufek et al. studied optimal perspectives for external robots or sensors to support other robots, though further research is needed to adapt to complex environments. Their research models the optimal external perspective for task-executing robots to enhance work efficiency. However, in dynamically changing environments, the selection and adaptation of optimal perspectives are not fully realized, requiring further improvement [12]. Minaeian et al. developed a system where drones and ground robots collaborate to detect and locate targets. Drones monitor vast areas from the air, while ground robots conduct detailed detection on the ground, leveraging both strengths to achieve high-precision target detection and localization. However, real-time data communication and processing challenges remain [13]. Elmakis et al. proposed a system in which drones provide visual information from the air, and ground robots utilize this information for ground-level operations. This system enables efficient task execution in construction site preparation. However, the system’s evaluation has primarily been based on simulations and limited experiments, necessitating further real-world validation to confirm its applicability. Additionally, the limited flight time of drones poses a challenge for sustained operations over extended periods [14].
Integrating decentralized cooperation and complementary cooperation systems aims to leverage the strengths of each approach to enhance overall system performance. Miller et al. developed a system framework where heterogeneous robots (ground robots and drones) cooperate. This system uses advanced semantic maps for ground robots to perform self-localization, planning, and navigation, while aerial quadrotors create maps in real time. Ground robots independently select targets and navigate while avoiding collisions. Communication is opportunistic and decentralized, allowing the system to operate without external infrastructure. However, improvements are needed in local navigation and obstacle avoidance in complex environments. Further research is required for the deployment and management of large-scale robot teams [15]. Yang et al. proposed a need-driven cooperation mechanism in heterogeneous robot systems, optimizing robot cooperation using BTs. Their research demonstrated that heterogeneous robots could maximize their capabilities in rescue missions, enhancing overall group utility. However, improvements in real-time decision-making capabilities are necessary. Additionally, as the system’s evaluation relies on simulations, practical experiments are needed to confirm real-world applicability [16]. Moreira et al. developed a system for warehouse inventory management that integrates a drone and ground robot using the virtual structure control paradigm. In this system, the ground robot handles mobility and positioning, while the drone performs data acquisition from the air, reading QR (Quick Response code) codes or RFID (Radio Frequency Identification) tags. The two robots operate autonomously but cooperate through real-time information sharing, allowing for efficient task execution. The system also incorporates obstacle avoidance, with the ground robot avoiding ground-level obstacles and the drone avoiding aerial obstacles. This approach effectively combines the decentralized nature of independent robot control with the complementary strengths of each robot, exemplifying the integration of decentralized and complementary cooperation [17].
Recent studies have demonstrated that decentralized and complementary cooperation can enhance system performance. However, challenges remain, particularly in real-time adaptation to complex environments and the operation of large-scale robot teams. This study addresses these challenges by developing a novel cooperative system that integrates decentralized and complementary cooperation. The proposed system enhances flexibility and adaptability through real-time information collection, bidirectional information exchange, and validation via practical experiments. This approach provides a new framework for cooperation among heterogeneous robots, enabling efficient execution of complex tasks such as exploration, surveillance, and investigation. Table 1 compares the cooperation types and task request directions of some existing methods with the proposed method. Queralta et al. [10] and Elmakis et al. [14] employ planned cooperation with unidirectional task requests. Yang et al. [16] and our previous research [9] adopt needs-driven flexible cooperation with unidirectional task requests, relying on shared information. In contrast, the proposed method introduces bidirectional task requests, significantly enhancing adaptability and flexibility in uncertain environments.

2.2. Action Planner

Traditional methods for robot action planning, such as Planning Graphs and the Planning Domain Definition Language (PDDL), have been instrumental in defining and managing complex task execution. Planning Graphs, for instance, model the dependencies between actions and identify sets of actions that can be executed concurrently, with GraphPlan being one of the most representative algorithms [18]. While this approach enables efficient modeling of action dependencies, it often becomes computationally expensive when managing complex dependencies and constraints. Similarly, PDDL has become a widely adopted standard language for defining action planning problems and their corresponding solutions [19]. PDDL’s versatility and standardization provide significant benefits; however, its expressive power is limited in representing complex domains, and the computational time required for large-scale problems can be substantial. As robotic systems evolve to operate in dynamic and uncertain environments, traditional planning approaches struggle to adapt effectively. This challenge is particularly pronounced in multi-robot systems, where coordination and optimization become increasingly difficult. Consequently, new methodologies are needed to address these limitations.
BTs have emerged as a promising alternative, offering an intuitive way to represent complex dependencies among actions using a hierarchical tree structure. This approach provides improved modularity and flexibility, allowing for real-time adaptation to changing circumstances [20]. In contrast to Subsumption Architectures [21], where the interaction between behaviors can lead to unpredictable system behavior, BTs facilitate clear and predictable action selection by organizing tasks into separate, modular nodes. This modularity also addresses the limitations of Teleo-Reactive Programs (TRP) [22], which tend to obscure the overall control flow as complexity increases. BTs’ ability to separate conditions and actions enhances maintainability and debugging, making them particularly suitable for complex and dynamic environments.
Given these advantages, BTs have been applied extensively in various robotic domains, including manipulation and mobile robot control [23,24]. For example, Colledanchise et al. proposed the Planning and Acting BT (PA-BT), which integrates planning and execution, thereby improving the stability of task performance in complex environments [25]. However, while PA-BT successfully handles single-robot scenarios, it lacks a mechanism for effective information sharing and coordination in multi-robot systems, limiting its scalability and flexibility. Similarly, Macenski et al.’s Navigation2 framework utilizes BTs for path planning and obstacle avoidance in mobile robots, demonstrating high flexibility in complex environments [26]. Nonetheless, the framework focuses solely on single-robot navigation, and thus, it does not address challenges such as task coordination and real-time decision-making among multiple robots. Botto et al.’s knowledge transfer through behavior trees (KT-BT) represents one of the few attempts to apply BTs to multi-robot systems [27]. Although KT-BT enhances task execution efficiency through knowledge sharing between robots, it has primarily been validated through simulations, and the framework’s applicability in real-world environments remains unclear. Additionally, KT-BT faces challenges in handling uncertainty in dynamic environments and maintaining scalability when the number of robots increases.
Building on these previous works, this study explores a novel approach for cooperative behavior in multi-robot systems using the PA-BT framework. By leveraging the inherent modularity of BTs and enabling real-time information exchange between robots, this approach aims to achieve efficient and flexible cooperation in complex environments. Through experimental validation using actual robots, this study seeks to establish a robust cooperative framework that addresses the current limitations of decentralized cooperation, such as information sharing and complementary coordination, ultimately improving the overall performance of multi-robot systems in real-world applications.

3. Overview of BT-Based Multi-Robot Interaction System

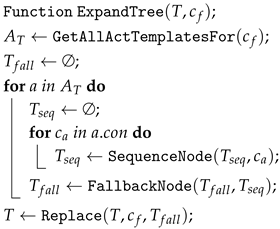
3.1. System Architecture for Coordinated Robot Task Execution

In this study, we propose a novel system architecture that enables drones and ground robots to collaborate efficiently in complex environments.
As illustrated in Figure 1, the proposed architecture integrates real-time data processing, navigation, and action planning to enable swift adaptation to environmental changes and efficient task execution. Drones excel at rapidly gathering wide-area information from an aerial perspective but are constrained by limited flight duration due to battery limitations. Ground robots, while capable of extended operations, face challenges in navigating obstacle-dense environments. This system leverages the strengths of both platforms to enable complementary collaboration, mitigating their respective limitations. The drone initiates actions as needed based on requests from the ground robot, prioritizing the exploration of critical areas essential for path planning. This targeted approach minimizes unnecessary energy consumption, ensuring efficient utilization of the drone’s limited battery capacity and enhancing the overall sustainability of the system. Equipped with cameras, drones collect environmental data, which are processed in real-time using Visual SLAM to identify obstacles and generate maps. Orientation and position controllers optimize drone behavior for precise data collection and task execution. Simultaneously, ground robots utilize LiDAR sensors to conduct detailed terrain mapping. LiDAR SLAM processes the collected data to identify obstacle locations and determine safe travel paths. The action planner schedules robot activities based on mission requirements, while position controllers ensure accurate navigation. The integration of drone and ground robot mapping data into an occupancy grid map facilitates seamless information sharing, enhancing task execution and coordination. This architecture enables real-time information updates and dynamic adjustments during task execution, allowing the system to respond flexibly to unknown obstacles and rapidly changing environmental conditions. By combining the aerial perspective of drones with the detailed terrain analysis capabilities of ground robots, the proposed system significantly enhances the applicability of autonomous robotic systems. It also improves the success rate of complex and demanding missions, such as search and rescue, environmental monitoring, and exploration.
Figure 2 depicts the system’s action planning architecture. The Action Template (AT) in Figure 2 represents the preconditions and goal constraints of actions. In symbolic task planning, a partially ordered plan called the Reachability Graph (RG) is generated through online planning, leaving choices between goal descriptions and AT. The RG represents potential sequences of actions that can be executed in parallel or varying orders, depending on the system’s current state. Subsequently, an action sequence is created using the generated RG, which expands the BT nodes. The robot’s state is continuously monitored throughout online action planning, and actions are directed to the robot controller. The state of the BT is also monitored while the robot controller executes the actions. The generation of action sequences contributes to scheduling, proposing alternatives, and determining the means of action realization.
The BT planning tool plays a central role in the proposed system, utilizing an RG to illustrate the potential actions and formulate efficient task execution strategies. This tool predicts potential action failures during the planning process and incorporates an automatic adjustment mechanism to address them. Using this system, robots can autonomously generate cooperative tasks and form optimal collaborative relationships based on the situation. While each robot can independently execute individual tasks, the system also enables them to interact and collectively solve complex problems or unexpected obstacles by working together. Such dynamic interactions maximize system efficiency and allow flexible and rapid emergency response. The experiments in this study focus particularly on path planning for ground robots. Although capable of conducting explorations independently, the system is designed to induce cooperation with other robots in high-risk situations naturally. This approach allows robots to balance the ability to complete tasks individually and the flexibility to collaborate with other robots when necessary.
Additionally, as the components used in this study operate on the Robot Operating System (ROS), robots utilizing this system must be compatible with ROS.

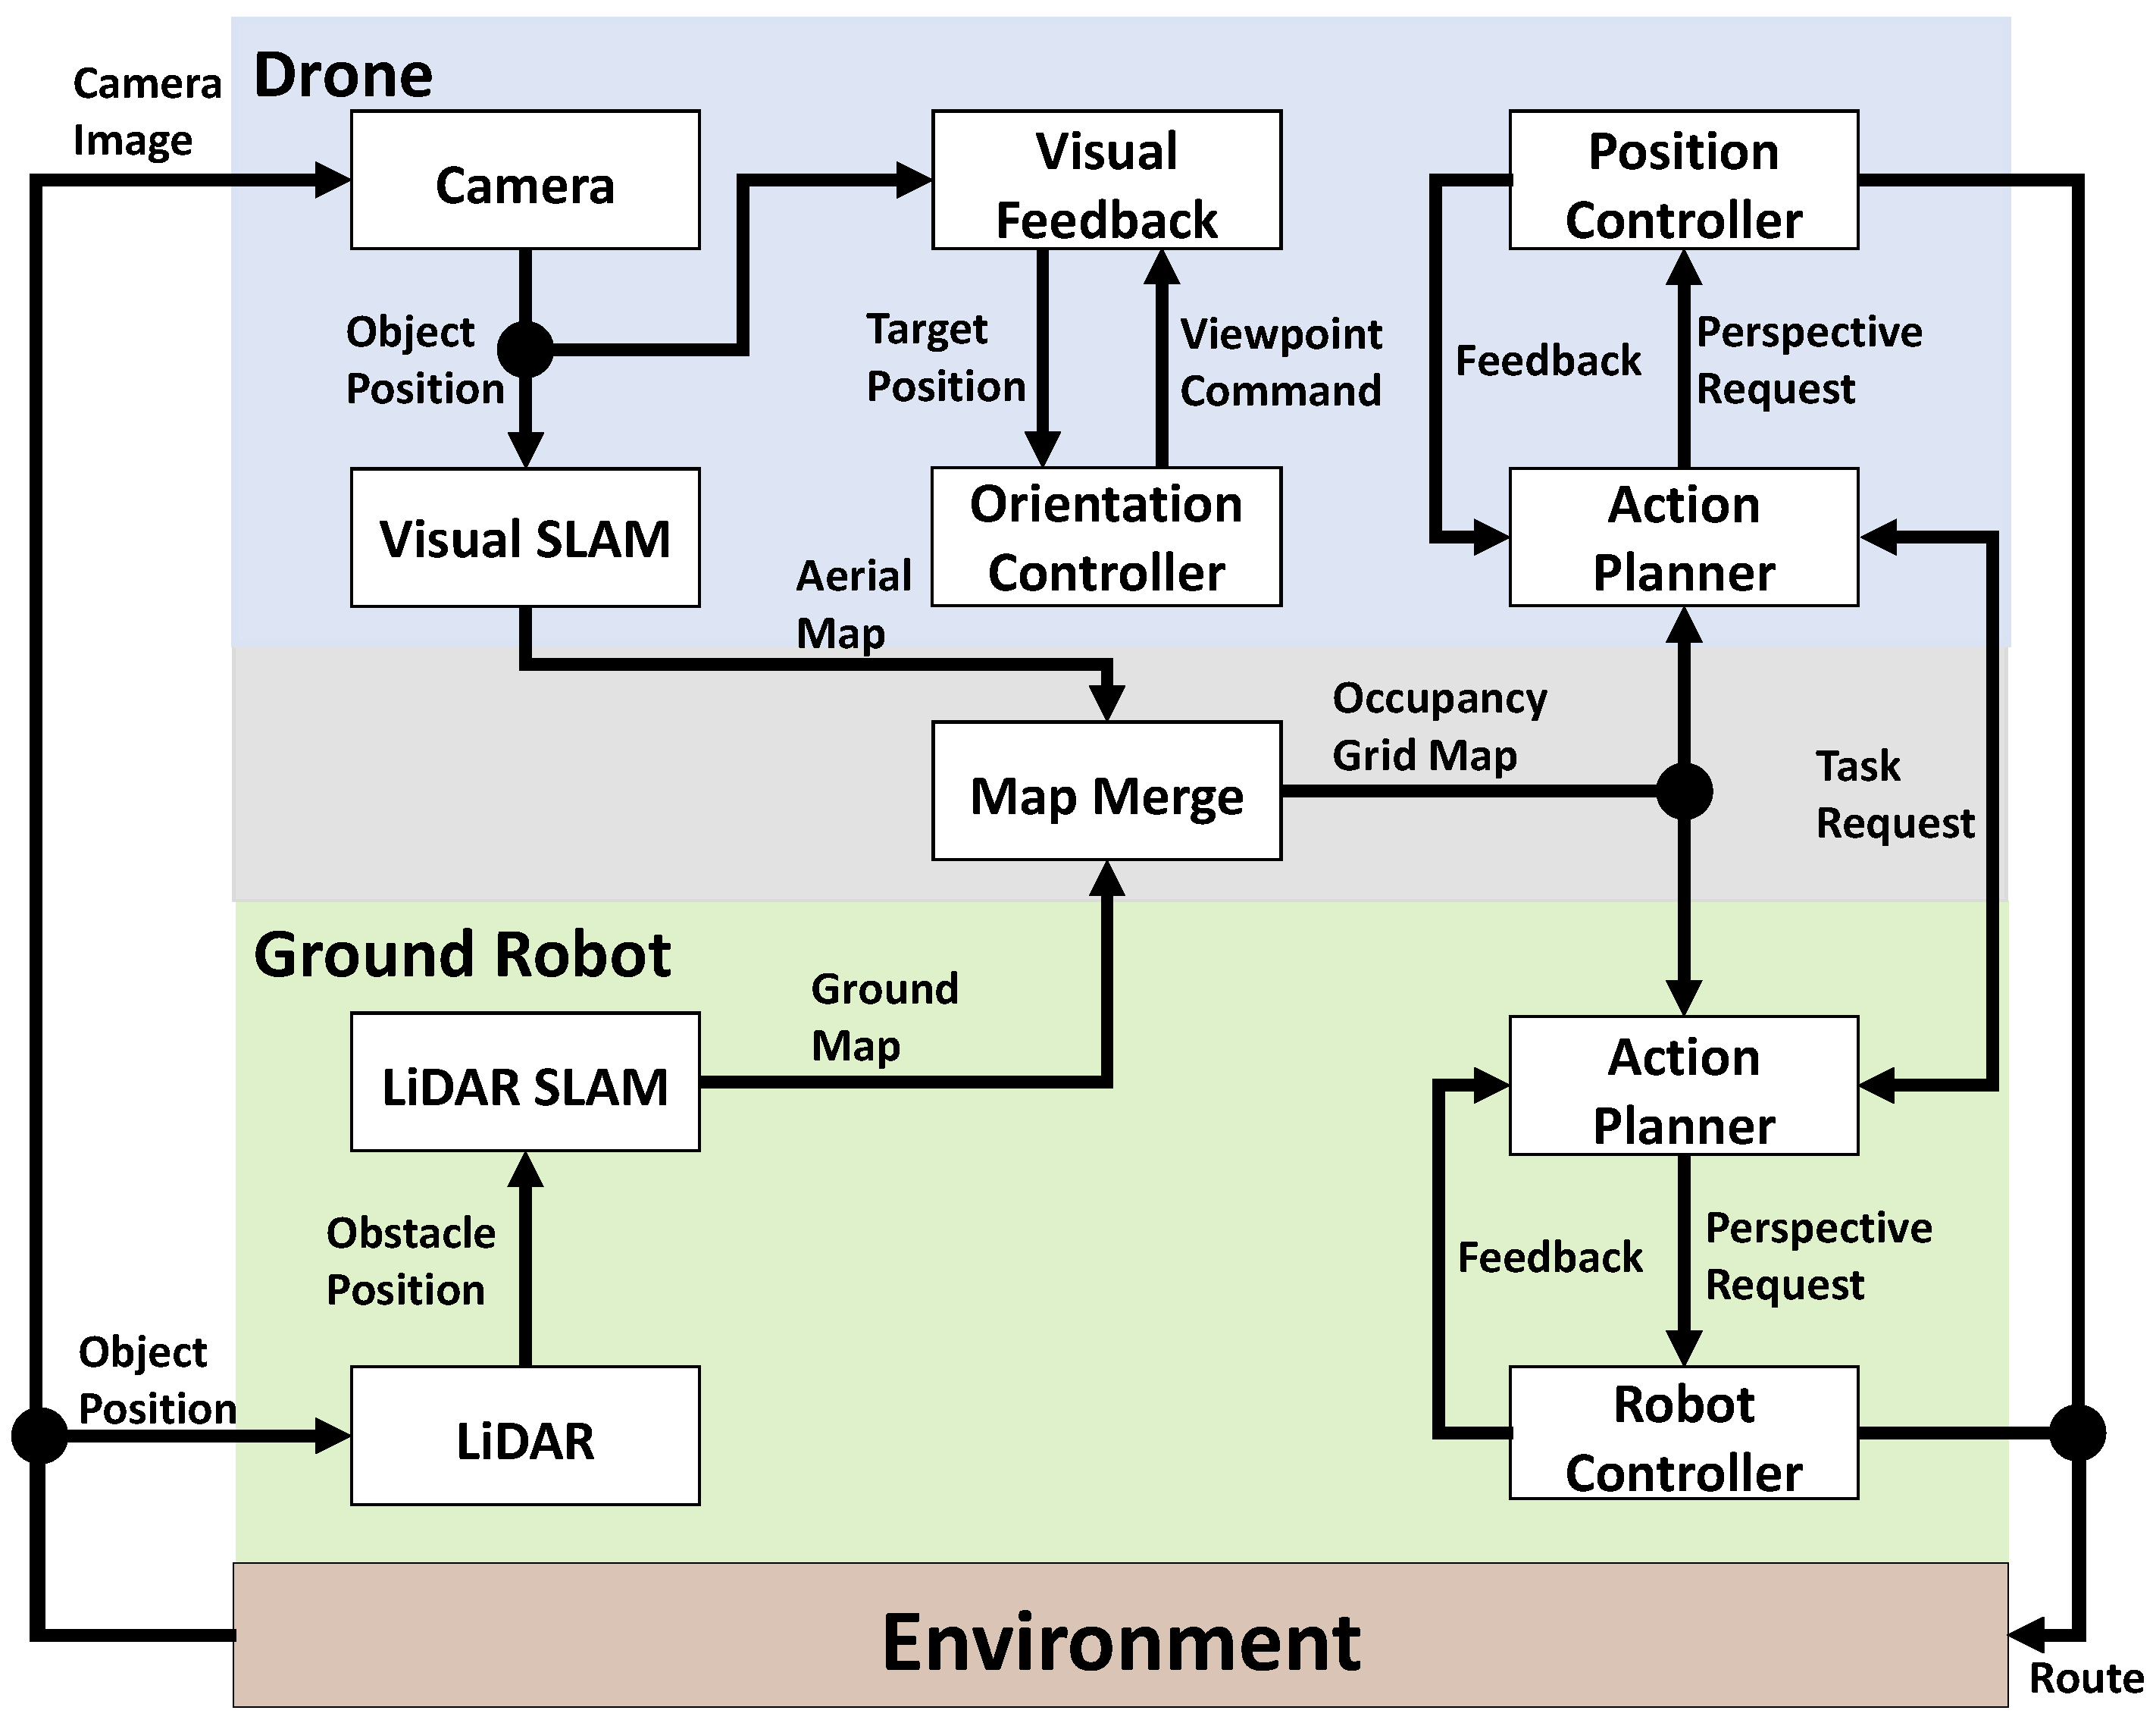
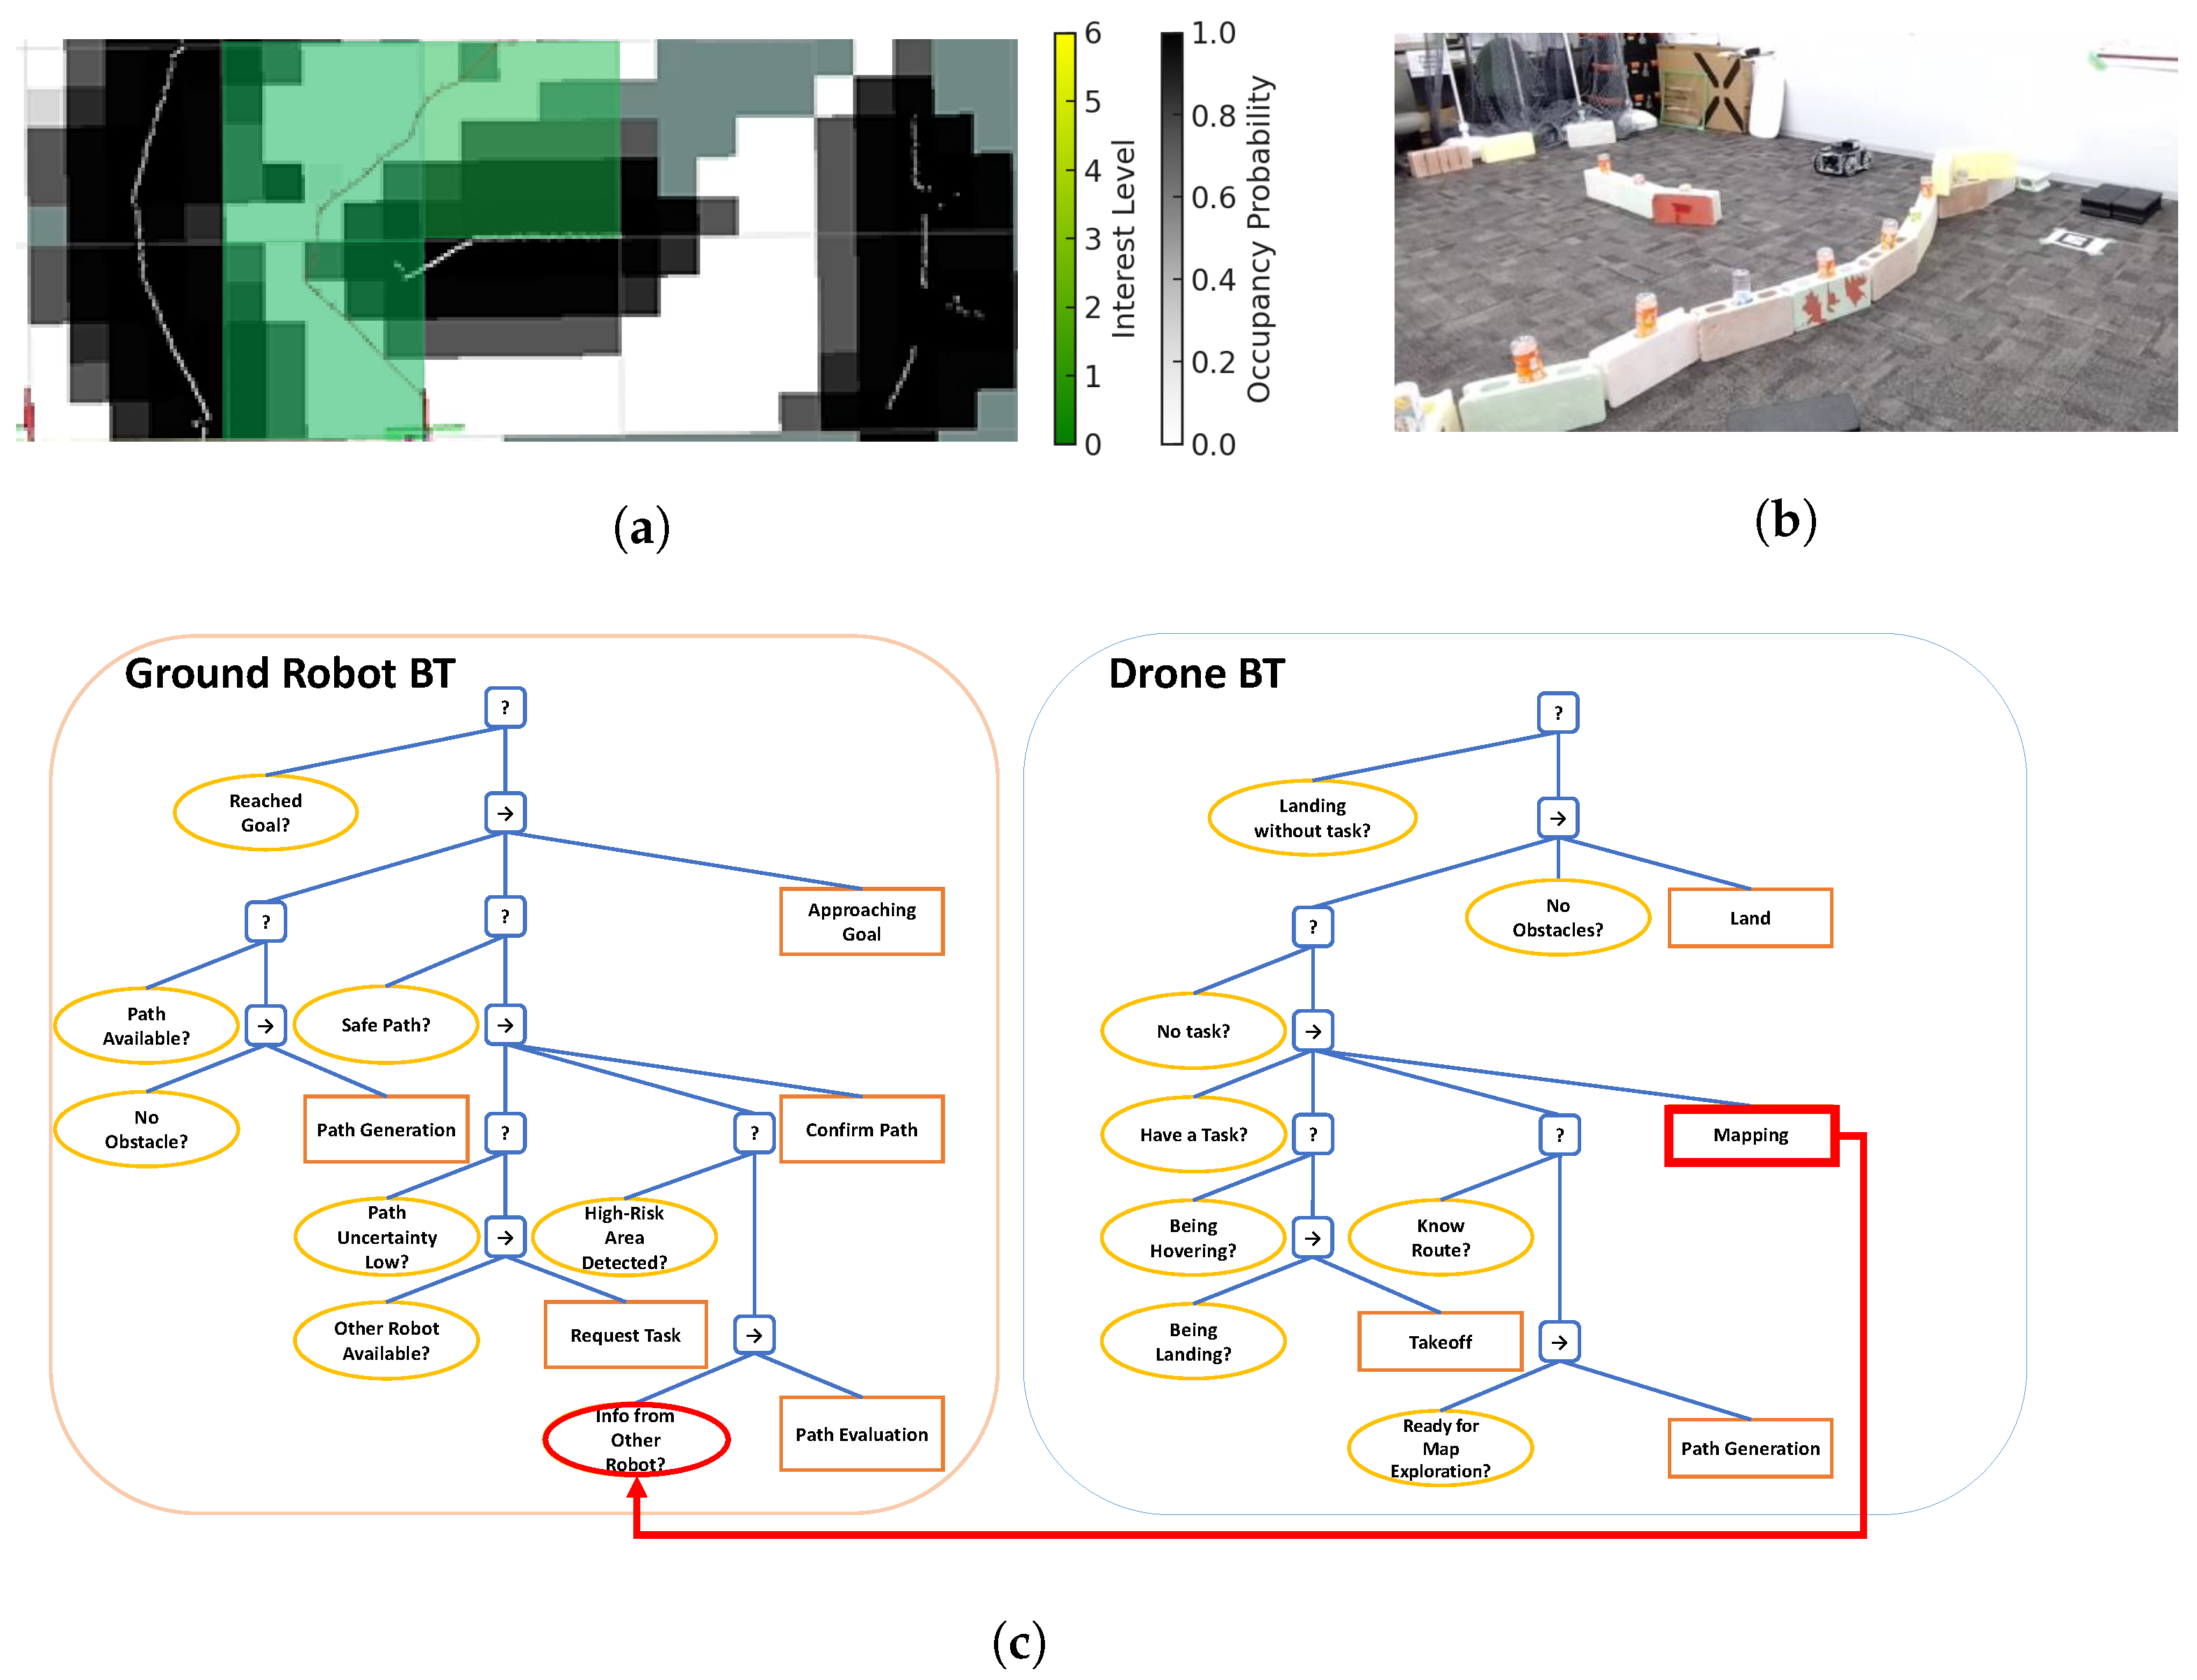
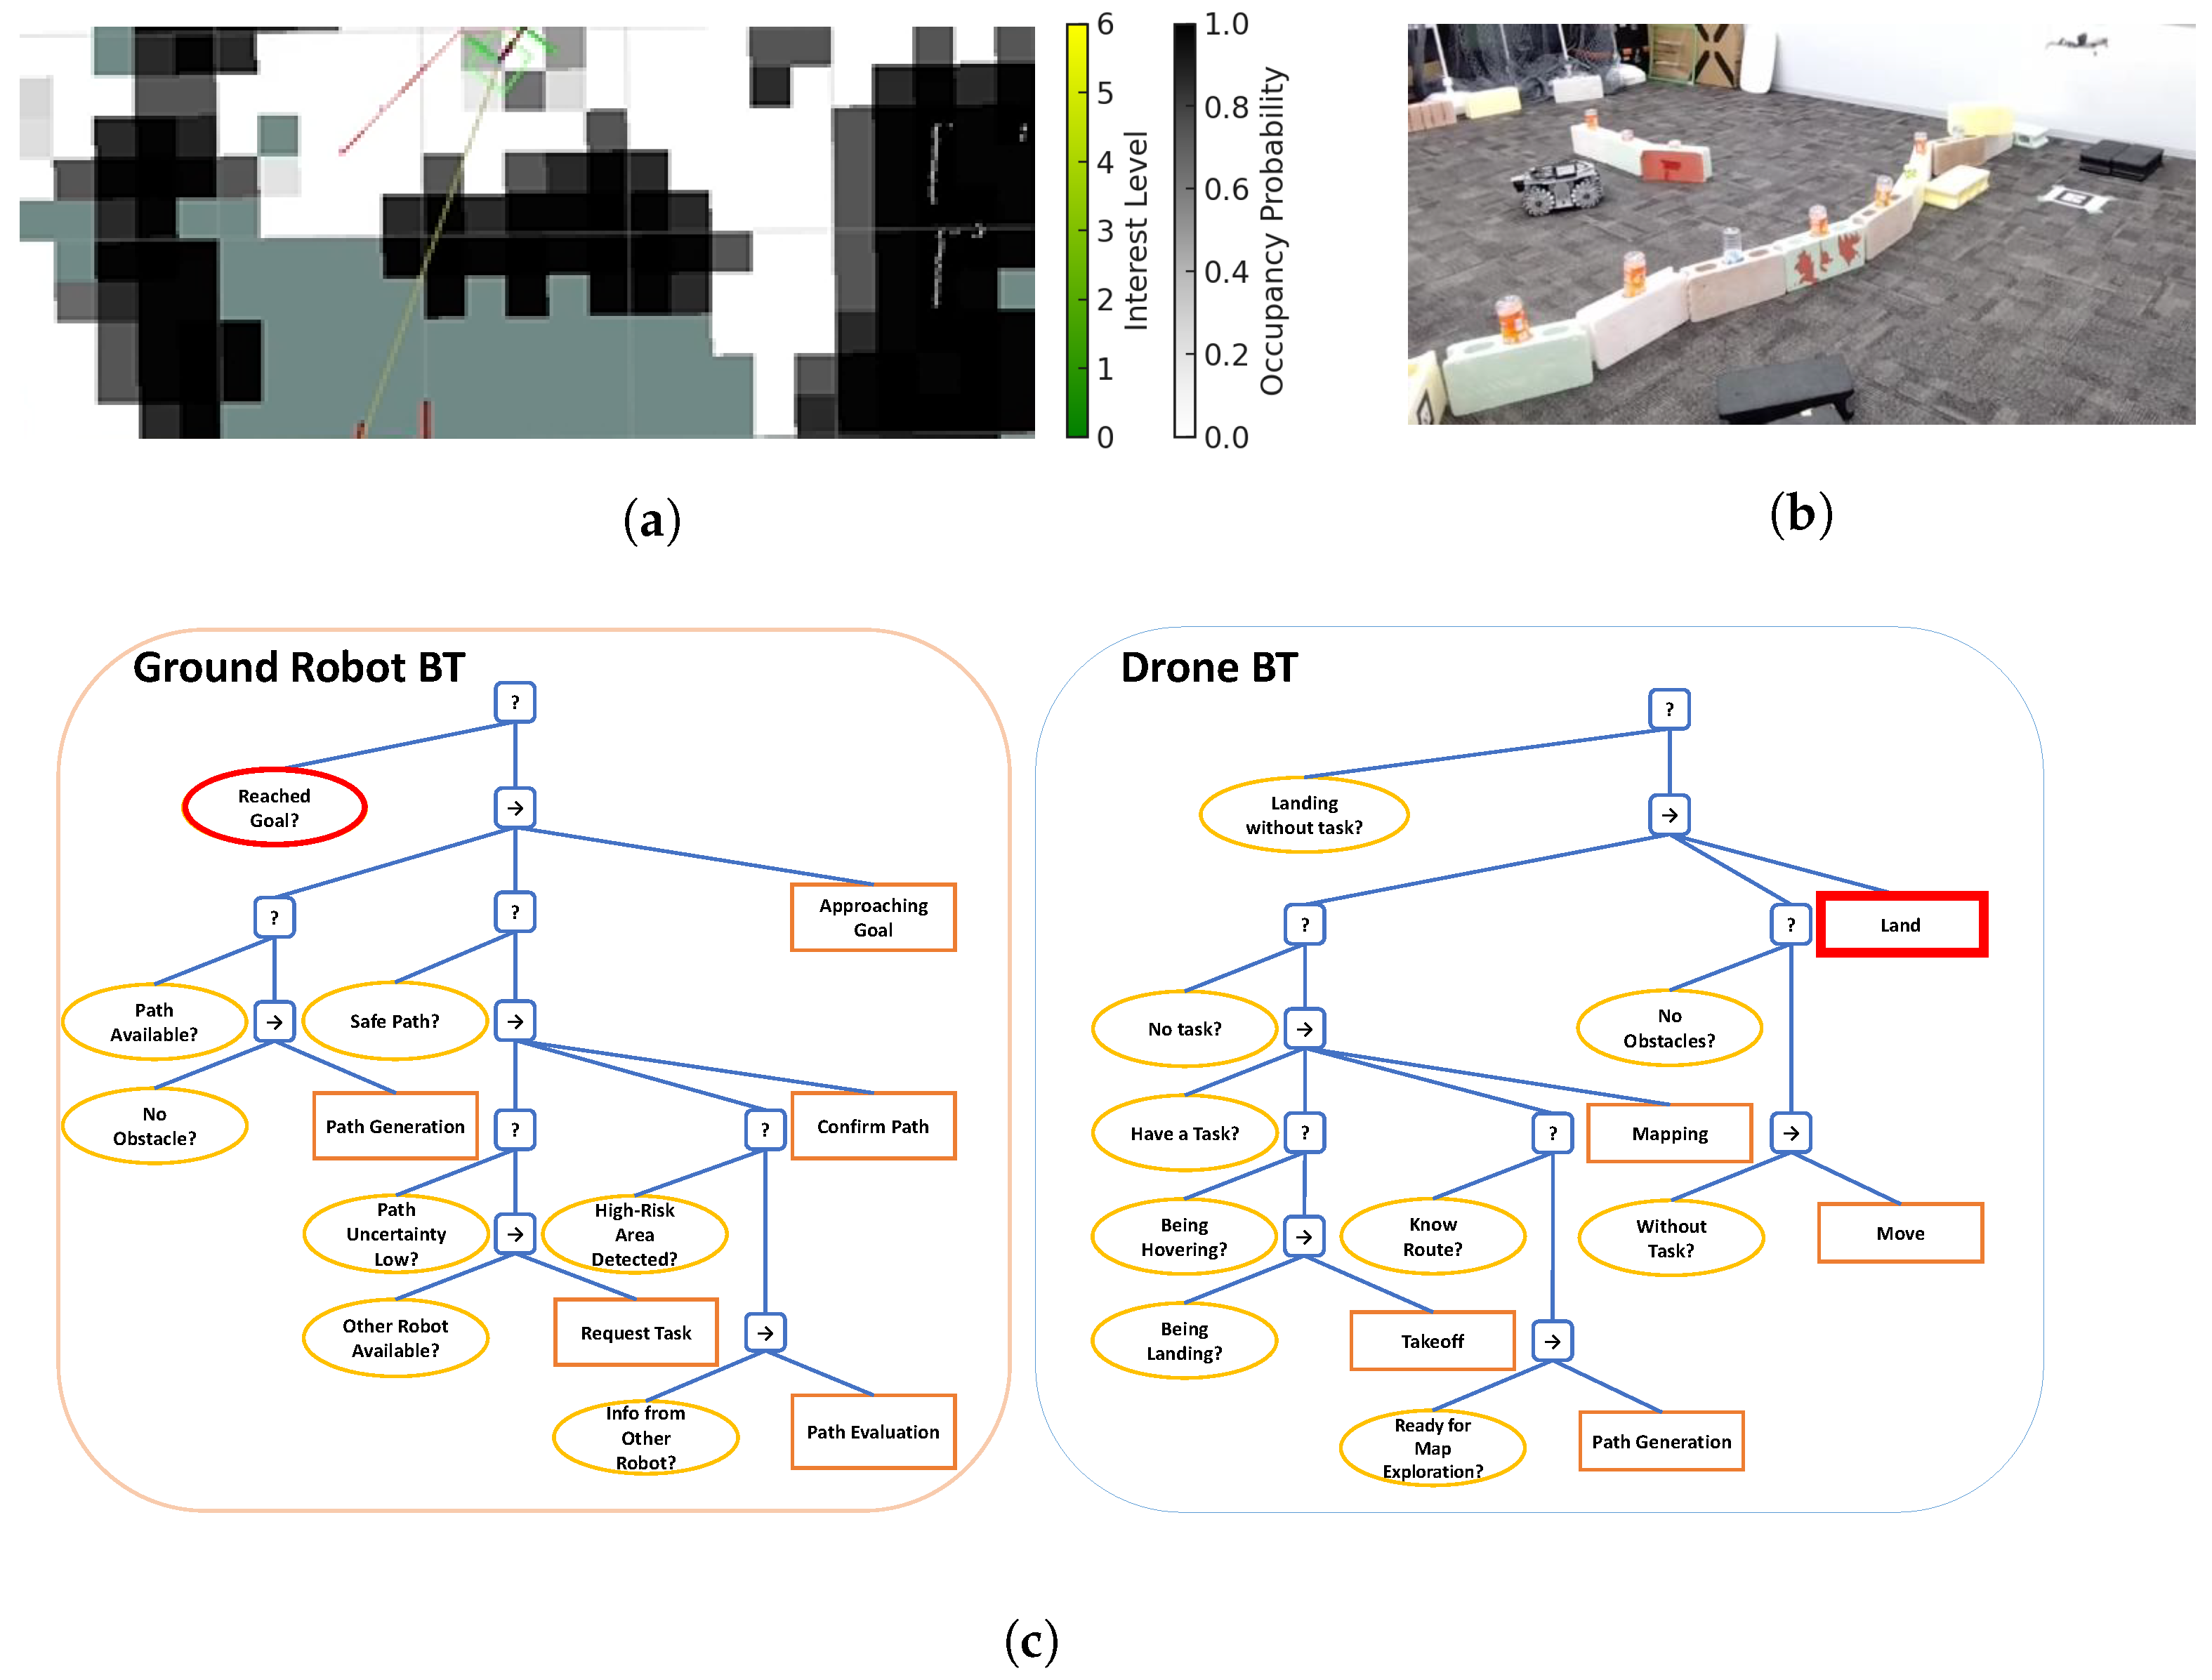
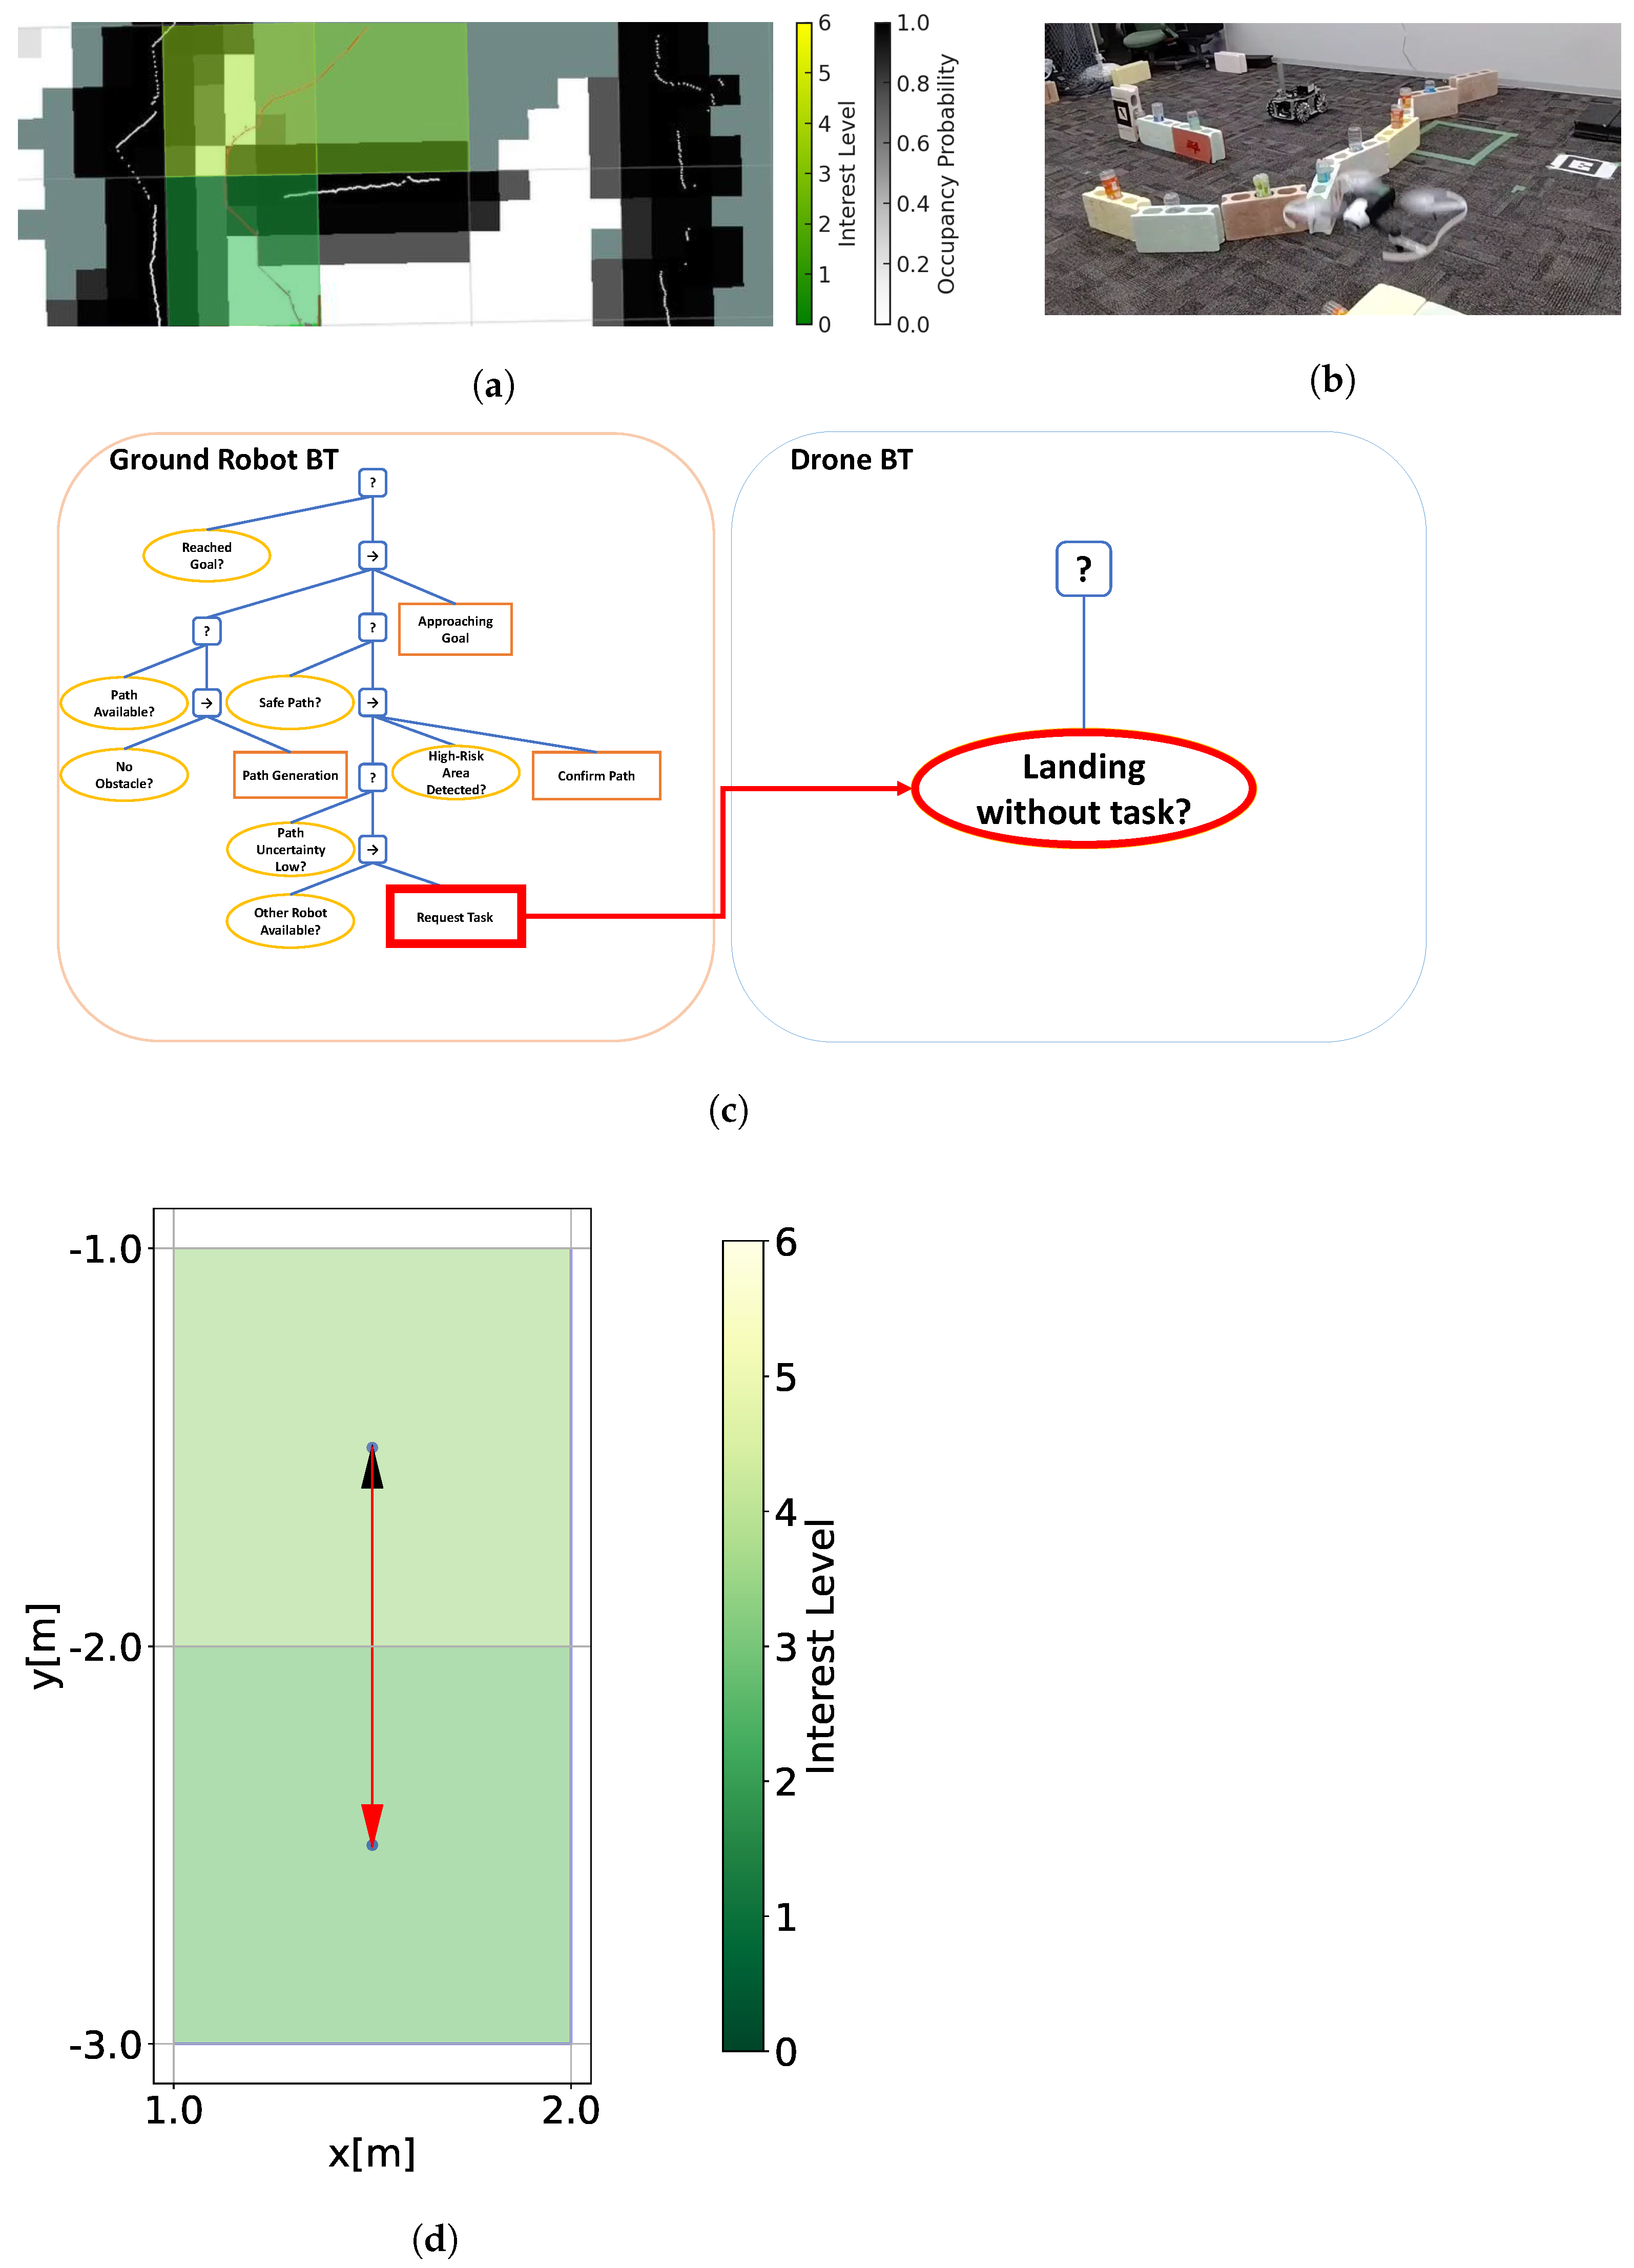
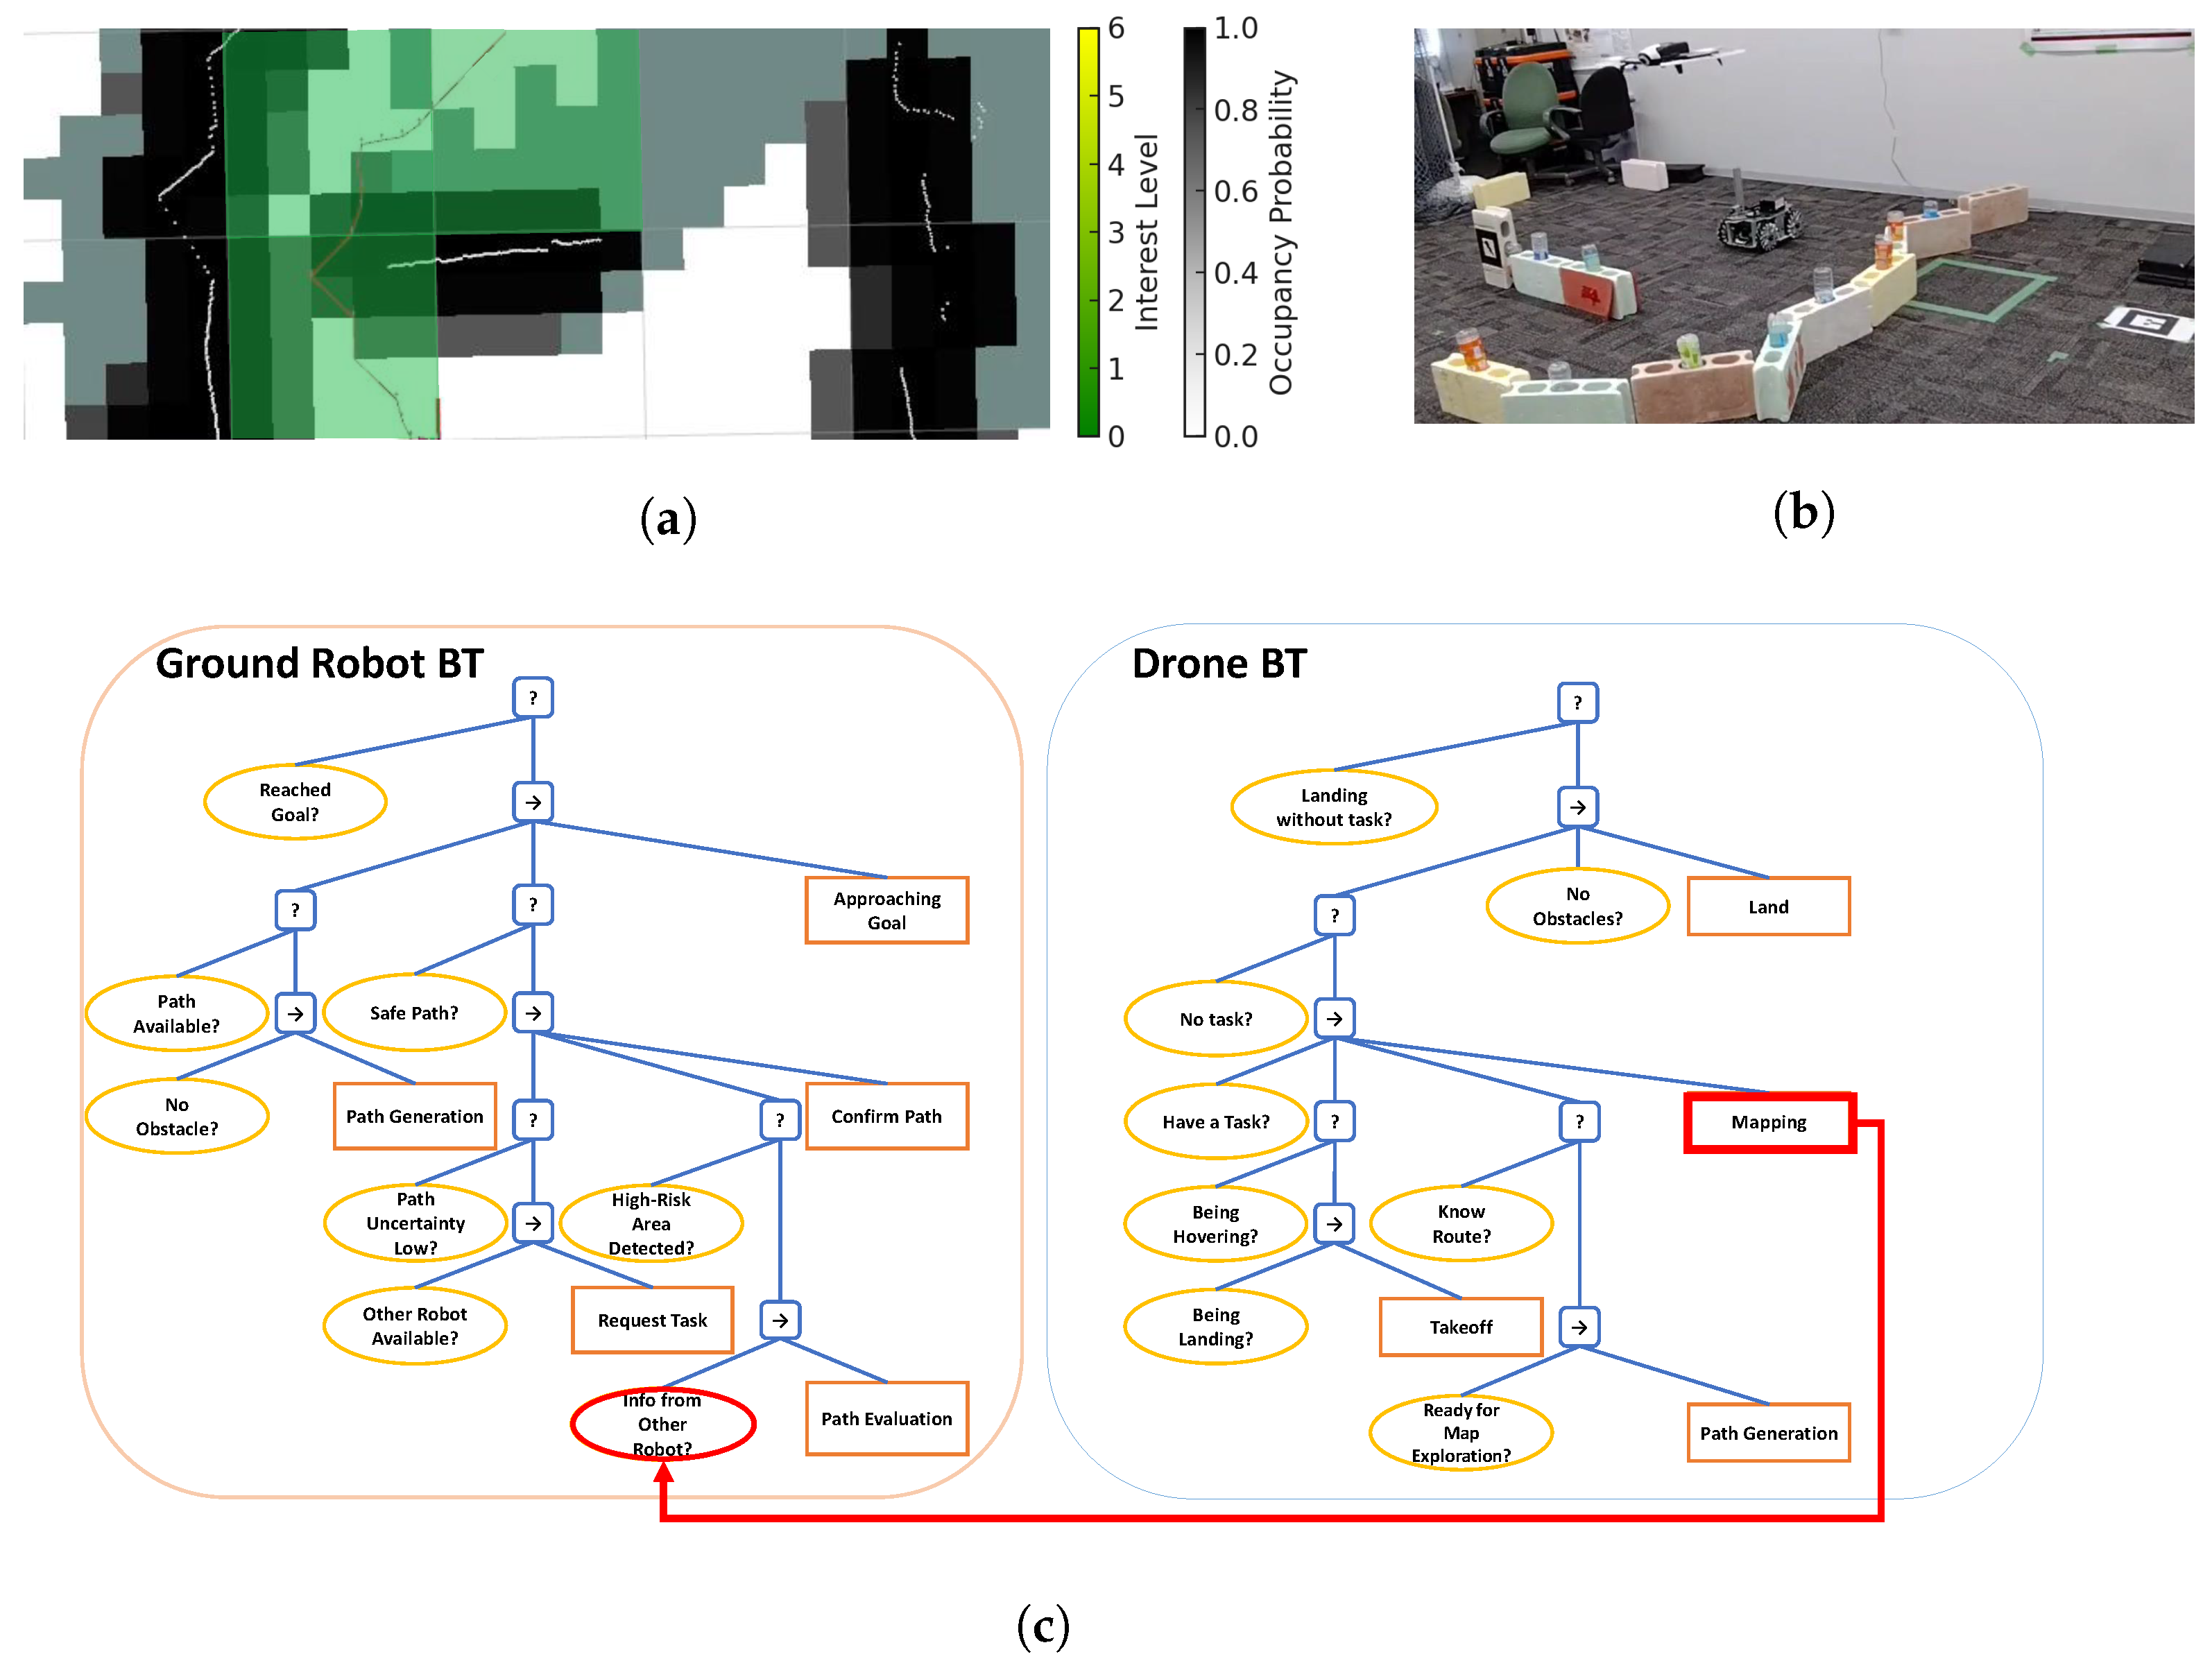
3.2. Flowchart of Coordinated Robot Tasks and Detailed Operation of Each Robot

3.2.1. Ground Robot Operations

The ground robot employs behavior tree-based action planning to dynamically adapt its exploration strategy. Upon initiating exploration, the ground robot generates an initial path through unknown territories, where it evaluates the uncertainty of the planned path. If the uncertainty is deemed low, the robot proceeds safely along the path. Conversely, when uncertainty is high, the ground robot requests additional data from the drone to reduce risks and enhance safety. The ground robot continuously evaluates the updated data provided by the drone to either proceed along the existing path or generate an alternative route. This iterative approach enables the ground robot to maintain safe and efficient navigation, particularly in environments with incomplete or uncertain information.

3.2.2. Drone Operations

In this system, drones utilize Visual SLAM technology to generate a detailed and up-to-date occupancy grid map of the environment. By leveraging aerial perspectives, drones effectively explore unknown areas, especially those deemed high-risk by the ground robot. During the exploration process, drones dynamically update the environment map and perform risk assessments of specific regions along the ground robot’s planned path. The drone’s capability to evaluate risks and provide critical environmental data ensures that the ground robot can make informed decisions about its traversal strategies. When high-risk areas are detected, the drone relays this information back to the ground robot for further analysis and planning.

3.2.3. Interaction Between Drone and Ground Robot

The interaction between the drone and the ground robot is a dynamic and complementary process. While the drone creates a detailed map from an aerial perspective and evaluates risks along the ground robot’s planned path, the ground robot uses this information to assess traversability. When high-risk areas are identified by the drone, the ground robot conducts a detailed passability assessment. If a high-risk area is deemed traversable, the ground robot moves forward along the existing path. Otherwise, it generates an alternative path and requests further drone assistance to evaluate the new area. This iterative exchange of information and tasks ensures effective coordination between the two robots, allowing them to adapt flexibly to dynamic environments. This interaction mechanism significantly enhances the overall safety and efficiency of the system.

3.2.4. Experimental Visualization and Flowchart

In this experiment, the focus is on the coordination mechanisms between ground robots and drones, rather than navigation itself. The experiment verifies that ground robots can request collaborative tasks from drones when necessary and that these tasks are executed through mutual information exchange. The experimental process is illustrated in Figure 3. At the beginning of the exploration, as shown in Figure 3a, the ground robot initiates path planning in an environment with numerous unknown areas. At this stage, it is unclear whether the yellow path generated by the ground robot is safe. Consequently, the ground robot requests assistance from the drone, as depicted in Figure 3b. Once the drone begins its task, it explores unknown areas where the ground robot requires information, updates the map, and evaluates the risk levels of specific areas. If high-risk areas are detected, this information is transmitted to the ground robot, which then decides whether to approach or detour around the high-risk areas.
The flowchart in Figure 4 illustrates the sequence in which the ground robot assesses the uncertainty of its path and, if necessary, requests a task from the drone. In Figure 4, black lines indicate the internal processing of the robot, while orange lines represent the sharing of information or task requests with other robots. The left and right trees correspond to the BTs of each robot, with states A to G mapped to each processing step in the flowchart to indicate the BT status for each process. The drone takes off, collects information, and transmits the updated map and high-risk area data to the ground robot. Ultimately, when the ground robot reaches its destination, the drone’s hovering status is checked, and it is instructed to land, thereby completing the mission for both the ground robot and the drone.
In summary, this system enables robots to autonomously determine the timing and nature of task requests, fostering natural cooperative behavior. This study particularly emphasizes the path exploration problem of ground robots. Ground robots typically explore independently, but in high-risk scenarios, they request assistance from other robots, naturally instigating cooperative behavior.
A detailed description of the action planning process for each robot can be found in Section 4.1. The map generation, self-localization, and path planning performed by the drone are discussed in Section 4.2 and Section 4.3. Finally, the information exchange and task execution mechanism involving both robots are elaborated in Section 4.4.

4. Action Planning and Mapping Framework for Multi-Robot Coordination System

4.1. Action Planning System

4.1.1. Overview of BTs

BT [20] controls robotic behaviors by continuously monitoring the robot’s state and selecting appropriate actions accordingly. BTs modularize complex decision-making processes by decomposing them into reusable sub-tasks, thus efficiently managing robotic behaviors. This approach offers significant flexibility and scalability, particularly under dynamic environmental conditions. An important advantage of BTs is that individual behaviors can be effortlessly reused within the context of higher-level behaviors without the need to specify their relationships to subsequent actions. A BT primarily consists of Sequence Nodes, Fallback Nodes, Action Nodes, and Condition Nodes, each playing a specific and crucial role in task execution.
  • Sequence Node: These nodes require all child nodes to succeed; if one fails, the entire sequence is considered a failure. This structure strictly manages the order of task execution.
  • Fallback Node: These nodes attempt to execute their child nodes one at a time until one succeeds. If all child nodes fail, the Fallback Node itself fails.
  • Action Node: These nodes execute specific commands directing the robot’s actions, such as “move forward” or “grasp an object”.
  • Condition Node: These nodes evaluate the system’s state to determine whether specific conditions are met. If the conditions are fulfilled, the node succeeds; otherwise, it fails.
The BT includes Condition and Action Nodes, with prerequisite conditions for appropriate action execution displayed on the left side of the tree. The notation ‘→’ represents Sequence Nodes, while ‘?’ denotes Fallback Nodes. Action Nodes are represented by rectangular shapes, and Condition Nodes are shown as elliptical shapes. This structure allows for flexible directives of complex behavior patterns for the robot. Furthermore, the high readability of BTs makes them an effective tool for understanding and designing robotic behaviors. In this study, we enhanced the BT nodes to enable information exchange between robots. Specifically, an Action Node in one robot’s BT is designed to share information with a Condition Node in another robot’s BT. The shared information allows the Condition Node to verify the prerequisites, facilitating the execution of appropriate actions. This enhancement enables dynamic cooperation and situationally adaptive behavior among robots, significantly improving the system’s overall flexibility and efficiency.

4.1.2. Planning and Acting Using Behavior Tree (PA-BT)

The PA-BT [25] approach automates the planning and execution of robotic behaviors using BTs. This method selects the optimal actions based on specific goals and generates efficient action sequences. PA-BT offers robots high adaptability and flexibility, particularly in dynamic and unpredictable environments. Continuous state monitoring and re-evaluation of conditions enable immediate adjustment of robotic behaviors in response to changing environmental conditions. This allows robots to avoid obstacles and swiftly respond to new objectives, demonstrating the suitability of PA-BT for complex tasks and environments. When an Action Node in the BT fails, the system checks if it can self-resolve the issue or needs assistance from other robots. In scenarios where a route is generated through unknown areas, ground robots do not know if the road is passable, necessitating task delegation to drones generated by the BT to verify the passability of unknown areas.

4.1.3. Generation and Elaboration of the BT

Algorithm 1 initiates by generating a Sequence Node corresponding to the target constraint C g o a l , progressively constructing the BT T. This tree includes Condition Nodes based on the actions selected from C g o a l for each constraint c. Each Condition Node is a prerequisite for action execution, strategically positioned on the left side of the tree structure, as shown in Figure 5. The system continually refines the current tree T through the RefineAction(T) function, which assesses and updates actions within the tree based on situational demands. Subsequently, the Tick(T) function triggers the tree, evaluating nodes from the root downward. This evaluation continues until the tree returns F a i l u r e , allowing adaptive action selection through iterative state updates. Upon failure, the GetFailedConditionNode(T) function identifies the failed Condition Node c f , and the ExpandTree T , c f function is employed to expand the tree. This expansion applies new action templates based on the failed condition, integrating new conditions and actions into the tree to enhance the probability of success in the following evaluation cycle.
Algorithm 1: Reactive Execution with BT and Task Requests to Other Robots
Drones 09 00095 i001
Furthermore, if the action associated with the expanded tree T cannot be executed independently, the RequestTaskFromOtherRobot( c f ) function is employed to send a task request to another robot’s Condition Node. Upon receiving a successful response, the system continues the evaluation process with the updated tree. This mechanism integrates cooperative task execution into the BT, enabling dynamic collaboration among robots to handle complex tasks. This aspect differs from traditional BTs, which focus solely on the actions of a single robot. Instead, it extends the framework to support task delegation and interaction between multiple robots, enhancing adaptability and scalability in multi-robot systems. Moreover, by applying this mechanism to multiple robots, mutual information exchange is facilitated, allowing robots to share task-related knowledge, such as environmental data or task progress, thereby improving the overall efficiency and coordination of the system. This approach ensures a dynamic and distributed problem-solving capability, critical for complex and evolving environments. The task request process described here is demonstrated in our experiments to validate its effectiveness in enabling cooperation among robots.
Algorithm 2 illustrates how subtrees are generated when a Condition Node fails within the BT, enabling dynamic expansion of the entire tree. This process facilitates continual adaptation of the system to its goals. Initially, the GetAllActTemplatesFor function retrieves a list of potential action templates A T corresponding to the failed Condition Node c f . These templates provide new behavioral options that contribute to goal attainment and failure avoidance. For each action template, a Sequence Node is generated to fulfill its prerequisite conditions, iteratively processing each condition c a represented by a . c o n . Each condition is added to the sequence using the SequenceNode function, culminating in adding the action itself. After all conditions and actions are incorporated into the Sequence Node T s e q , this sequence is integrated into the fallback tree T f a l l using the FallbackNode function. This integration enables multiple behavioral options to be evaluated sequentially, with the system selecting the first successful option. Finally, the Replace function replaces the failed Condition Node c f within the original BT T with the newly expanded fallback tree T f a l l , thereby updating the BT to adapt dynamically to failures. This ensures that BT can respond to new challenges by incorporating alternative strategies.
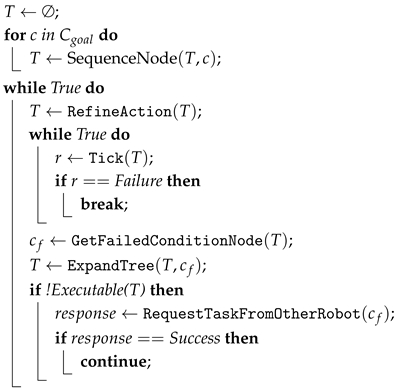
Algorithm 2: BTs, Expand Tree
Drones 09 00095 i002

4.2. Drone Self-Location Estimation and Occupancy Grid Map Creation

4.2.1. ORB-SLAM

In this study, ORB-SLAM (Oriented FAST and Rotated BRIEF-Simultaneous Localization and Mapping) [28] was utilized to enable real-time drone localization in GPS-denied environments. Using a monocular camera, ORB-SLAM tracks environmental feature points and dynamically constructs a 3D map to update the drone’s position. This capability ensures accurate positioning and mapping, which are essential for generating occupancy grid maps and supporting collaborative exploration tasks. The system’s robustness in resource-constrained settings makes it particularly suitable for our experiments.

4.2.2. Coordinate Transformation

When using ORB-SLAM, position and orientation data are represented in a local coordinate system relative to the initial detection point of feature points. To enable the drone to operate over a wider area, these local data are transformed into a global coordinate system P g R 3 referenced to the ground using AR markers. The transformation applies a rotation matrix R l g R 3 × 3 and a translation vector t l g to the local coordinates P l R 3 , as shown in Equation (1):
P g = R l g · P l + t l g
Here, R l g represents the drone’s orientation (roll ϕ , pitch θ , and yaw ψ ), and t l g is the translation vector. The rotation matrix R l g is defined as:
R l g = C θ C ψ S ϕ C ψ S θ C ϕ S ψ S ϕ S ψ + C ϕ S θ C ψ C θ S ψ C ϕ C ψ + S ϕ S θ S ψ C ϕ S θ S ψ S ϕ C ψ S θ S ϕ C θ C ϕ C θ
where C and S denote cos and sin, respectively (e.g., C θ = cos θ , S θ = sin θ ). This transformation ensures accurate real-time position tracking, enabling the drone to adapt to dynamic tasks and complex environments.

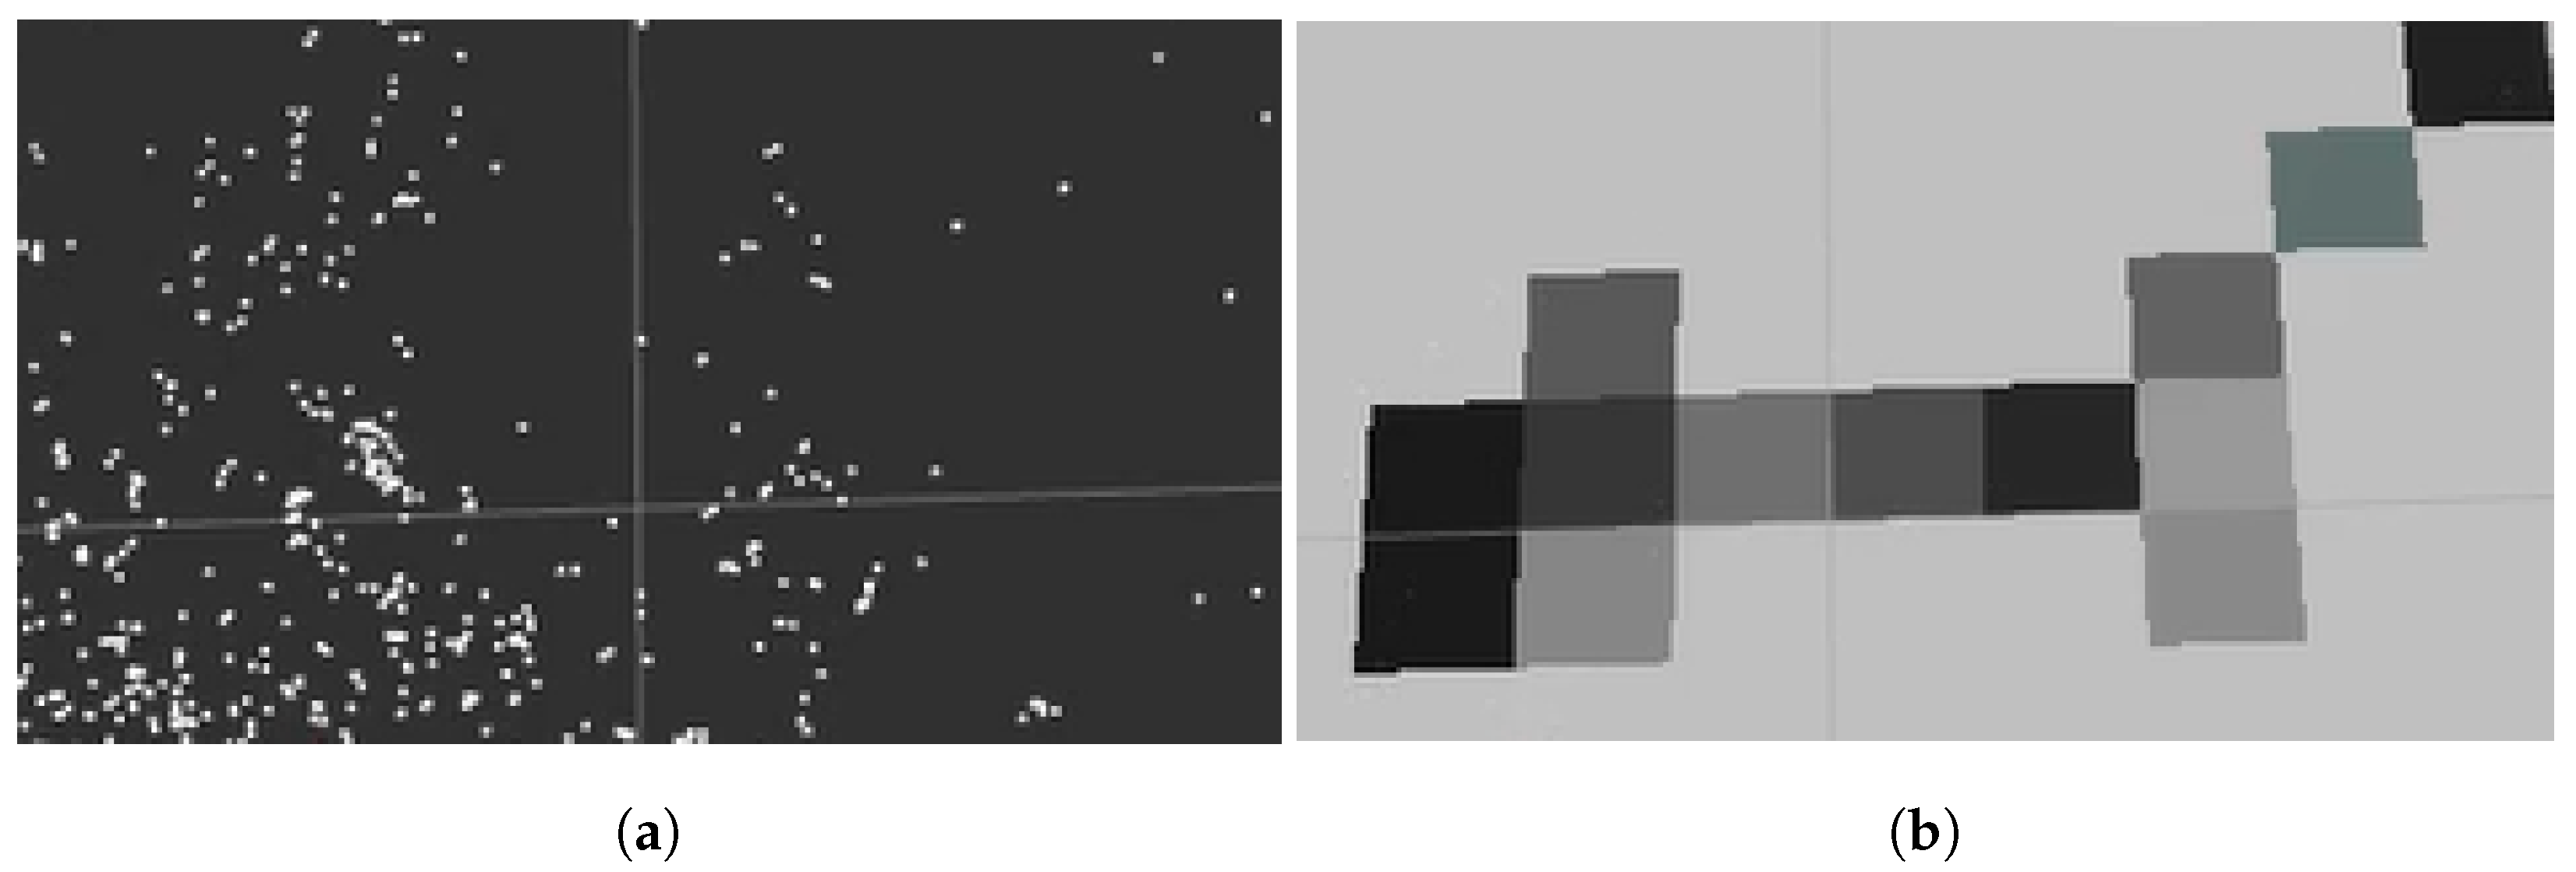
4.2.3. Occupancy Grid Map

When ground robots perform exploration tasks, areas outside their line of sight often remain unobserved, resulting in incomplete environmental awareness. To address this, drones assist by conducting further exploration based on requests from the ground robots. Using its monocular camera, the drone generates an occupancy grid map, which provides comprehensive environmental coverage and supports the ground robot’s navigation and decision-making processes. In this study, ORB-SLAM features were utilized to assign occupancy probabilities to each grid cell based on obstacle detection.
An occupancy grid map represents the environment as a grid of cells, where each cell holds a probability value indicating the likelihood of being occupied by an obstacle. The relationship between the continuous variables x and y, representing the robot’s position, and the discrete grid cell coordinates i and j is expressed as follows in Equation (4):
i = x r e s , j = y r e s
The resolution of the grid ( i , j ) is denoted by r e s , which in this case is set to 0.2 m. The function · represents the floor function, also known as the greatest integer function. This function truncates a given number to the largest integer less than or equal to the number. For instance, given a resolution of r e s = 0.2 and coordinates x = 1.5 m and y = 2.7 m, the grid coordinates ( i , j ) are calculated as ( i , j ) = ( 7 , 14 ) . This relationship enables the continuous mapping of position information onto the discrete cells of the grid map. Assuming an area of up to 10 m × 10 m, the occupancy probability ρ ( i , j ) of each grid cell in unobserved zones is initially set to 0.5, indicating equal uncertainty between occupied and unoccupied states, for grid division each containing an average of three to four feature points. The occupancy probability ρ ( i , j ) of each grid cell is estimated using a Poisson distribution P ( i , j ) ( k ) , which is based on the average height of the feature points. The value λ ( i , j ) is derived by calculating the average height of the feature points within the grid ( i , j ) , where these feature points are obtained by the drone using ORB-SLAM. The Poisson distribution is chosen in this context because it effectively models the frequency of discrete events (in this case, the presence of feature points) within a fixed area or volume. It is particularly useful when the average rate of occurrence (the mean height λ ( i , j ) ) is known, and the events (height measurements) occur independently. By using a Poisson distribution, we can probabilistically represent the number of feature points detected at different height levels within each grid cell, providing a reliable estimate of the occupancy probability based on the density and spatial distribution of the points. The average height of the point cloud within grid ( i , j ) , denoted as λ ( i , j ) , can be derived using the heights of the individual points ( z 1 , z 2 , , z N ) within grid ( i , j ) , as shown in the following Equation (4):
λ ( i , j ) = 1 N n = 1 N z n
where N is the total number of feature points within the grid ( i , j ) . Since the height distribution of feature points directly influences the occupancy probability, the Poisson distribution P ( i , j ) ( k ) is formulated as shown in Equation (5), using the mean height λ ( i , j ) of the feature points in each grid cell:
P ( i , j ) ( k ) = λ ( i , j ) k e λ ( i , j ) k ! ( k = 0 , 1 , 2 )
Here, k represents the discrete values used to model the observed point cloud distribution along the height axis. The height range is divided into intervals of 10 cm, where k = 0 corresponds to a height range of 0 to 9 cm, k = 1 corresponds to 10 to 19 cm, and so forth. This discretization allows us to map continuous height measurements into discrete bins, making it easier to categorize and analyze the height of detected feature points. Each value of k thus reflects a specific interval of the height, enabling the distribution of feature points to be represented as a function of these discrete height levels.
The occupancy probability ρ ( i , j ) is calculated by summing the probabilities from k = 0 up to a critical height h that represents the minimum height at which an obstacle becomes impassable for ground robots, as shown in Equation (6):
ρ ( i , j ) = 1 k = 0 h P ( i , j ) ( k )
The height parameter h is set to 0.05 m in this experiment. This parameter is adjustable depending on factors such as the robot’s height. The point cloud map generated by the drone is shown in Figure 6a, and the occupancy grid map created based on the point cloud map is presented in Figure 6b, respectively. In Figure 6b, the gradient from white to black visually represents the occupancy rate, with darker colors indicating higher occupancy rates.

4.3. Path Planning for Drones

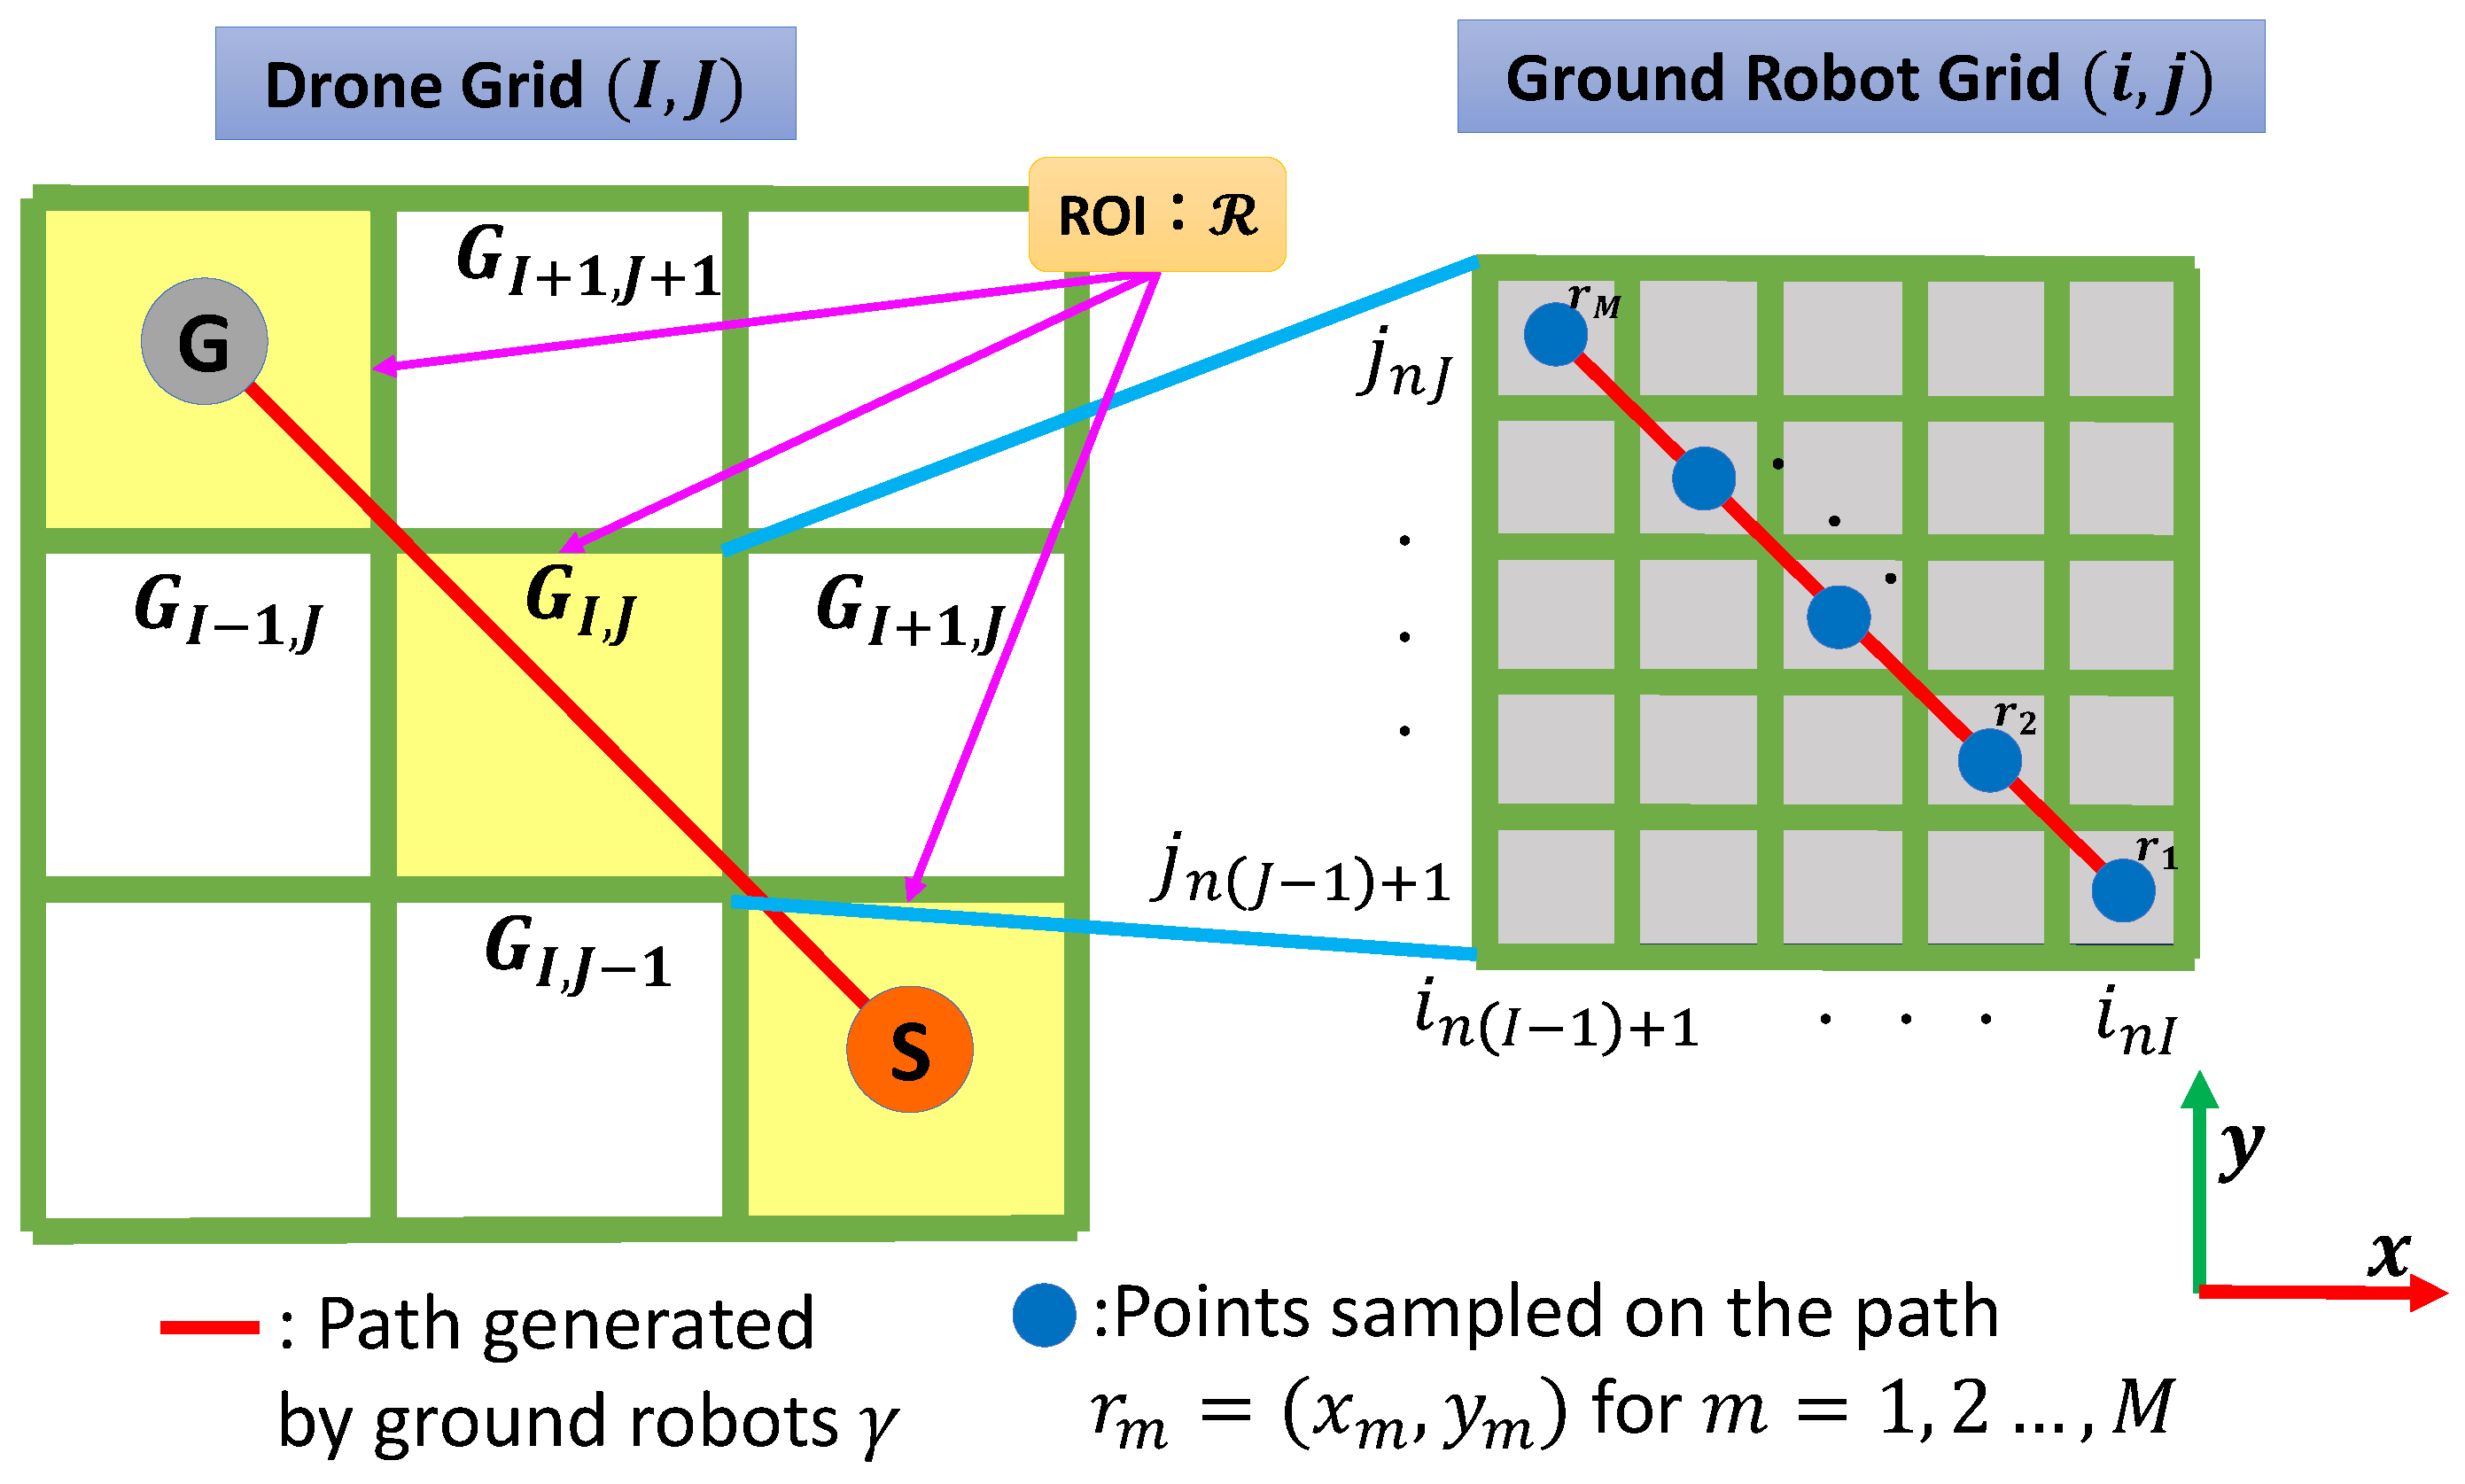
4.3.1. Drone-Assisted Path Planning for High-Uncertainty Areas Using Hierarchical Grids

The primary goal of drone path planning is to assist the ground robot by quickly collecting and accurately transmitting necessary map information. To achieve this, the drone autonomously plans its actions to explore areas of high uncertainty. These high-uncertainty areas, often characterized by sensor measurement errors and self-localization inaccuracies, are identified by the drone to reduce ambiguity regarding the presence or absence of obstacles. The detailed process of risk evaluation and passability assessment is discussed in Section 4.4. In this study, the drone generates a hierarchical grid for evaluating areas of high uncertainty along the path generated by the ground robot. This process involves creating a new grid specifically designed for drone exploration. A monocular camera is used to generate a grid with a resolution of 1 m × 1 m, optimized for the drone’s altitude of 1m or higher. Initially, a low-resolution grid is employed to observe a wide area and identify regions requiring further exploration. The drone then collects more detailed data in these regions to generate a map. The relationship between the ground robot’s grid coordinates ( i , j ) and the drone’s grid coordinates ( I , J ) is defined by Equation (7), with the number of grid subdivisions n set to n = 5 based on this relationship.
I = s g n ( i ) · | i | + ( n 1 ) n , J = s g n ( j ) · | j | + ( n 1 ) n
Both of these are discrete variables. The function s g n ( x ) refers to the sign function, which equals 1 when x > 0 , 0 when x = 0 , and 1 when x < 0 . For example, when i = 8 and j = 4 , the resulting grid coordinates are I = 2 and J = 1 . Figure 7 provides a visual representation of the relationship between the grids used by the ground robot and the drone. The yellow-highlighted area indicates the region of interest (ROI), where uncertainties are high. The left grid shows the drone’s coarser 1 m × 1 m grid ( I , J ) , while the right grid represents the finer 0.2 m × 0.2 m grid ( i , j ) used by the ground robot for path planning. In this study, the ROI refers to critical areas identified by the ground robot during its exploration, where environmental uncertainty is high. These areas are characterized by the fact that the presence or absence of obstacles cannot be directly captured by sensors, making them potentially hazardous for safe navigation. The drone complements this by providing additional information about these unknown areas, supporting the ground robot’s safe passage. The grid on the left represents the drone grid, while the grid on the right corresponds to the ground robot grid.

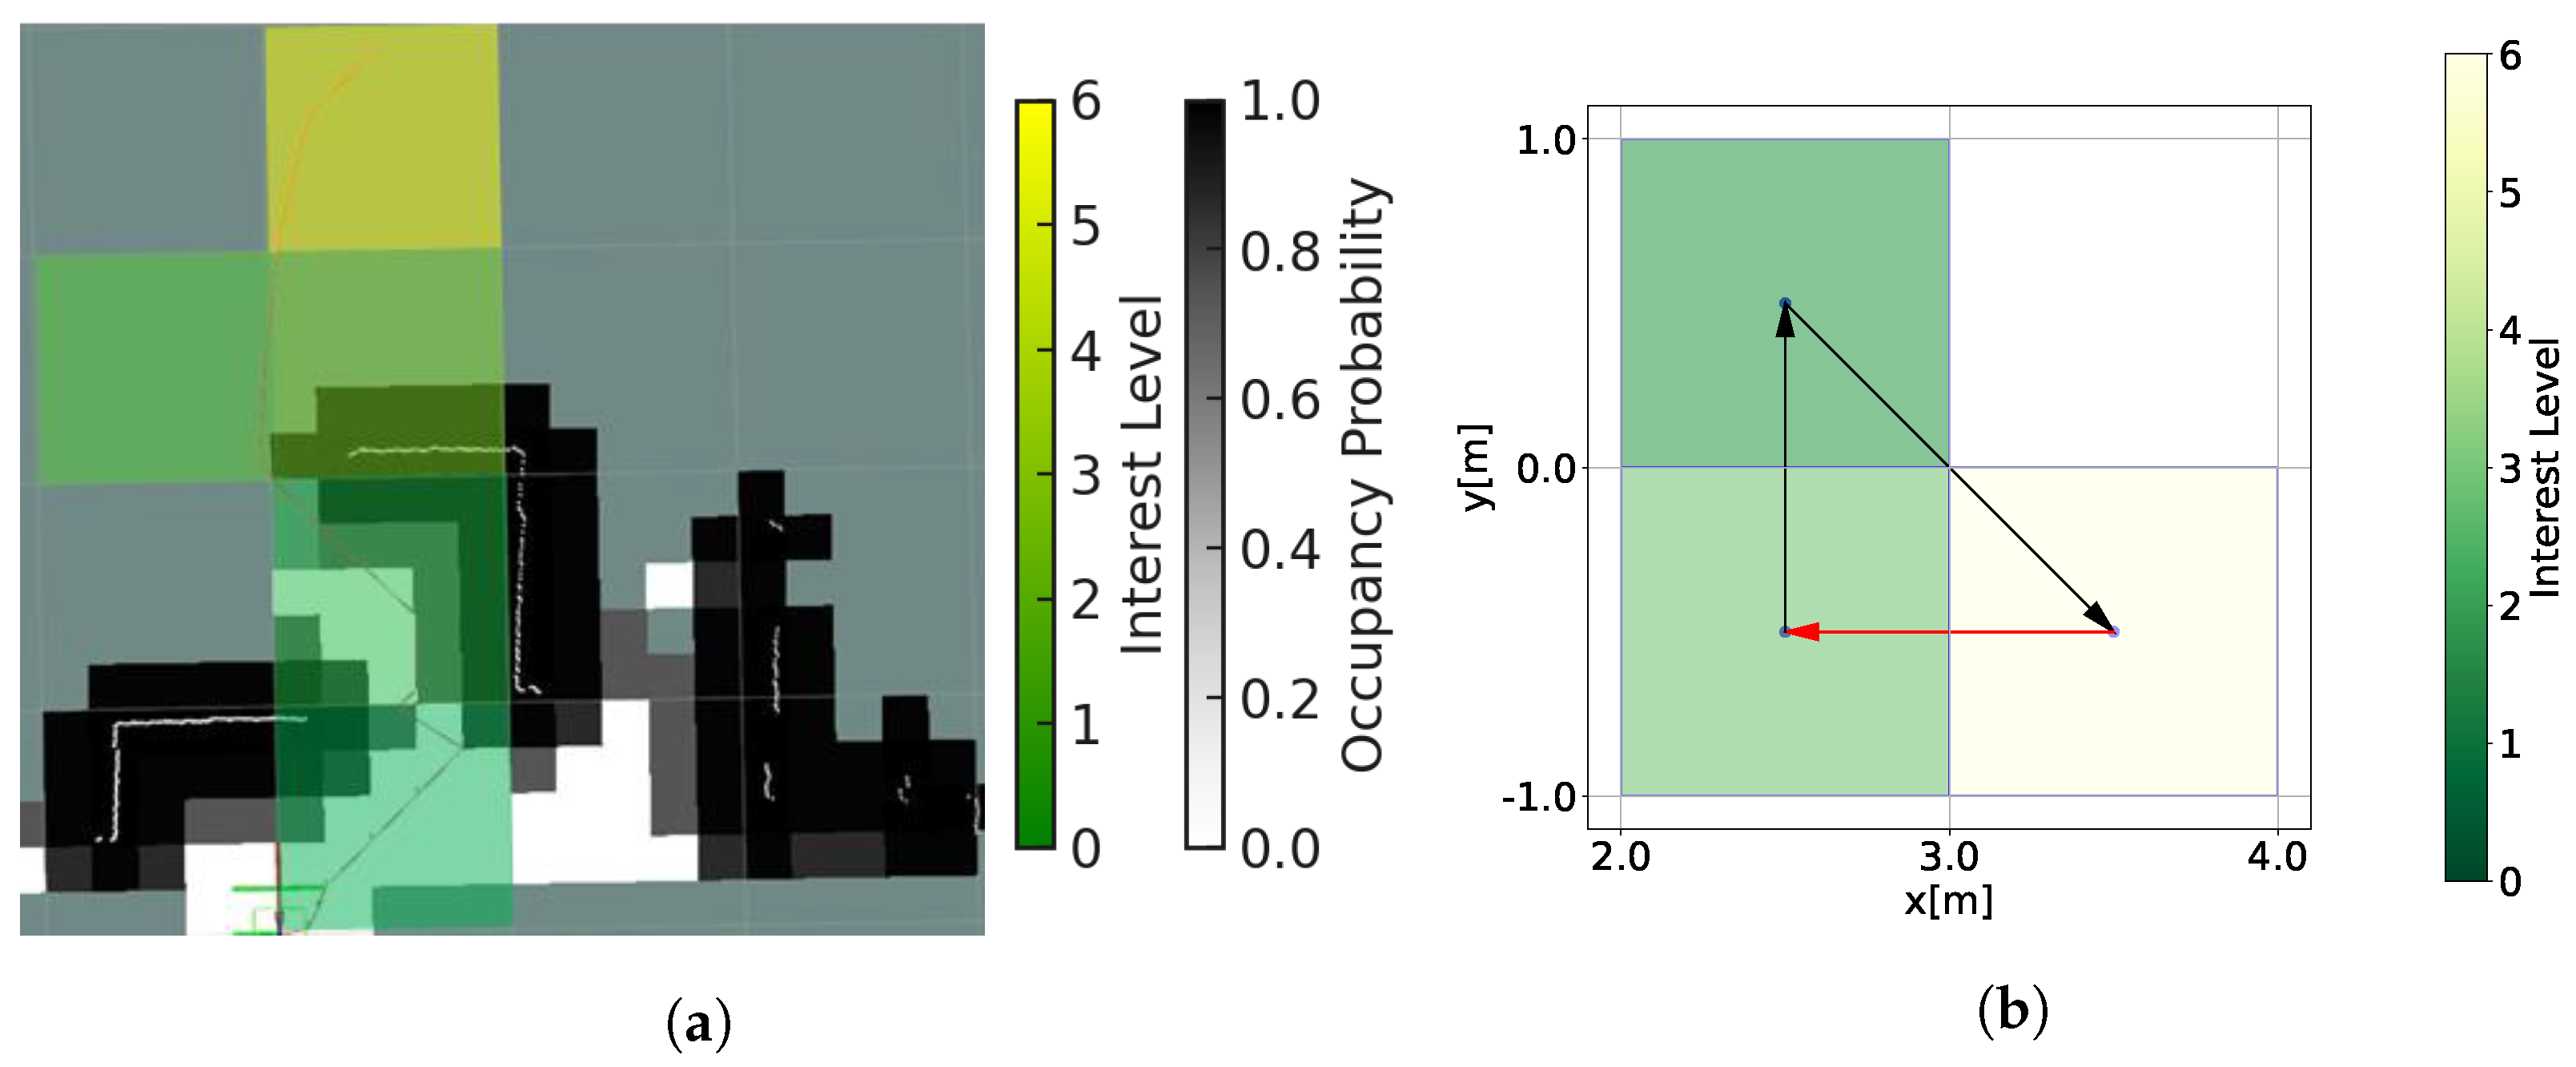
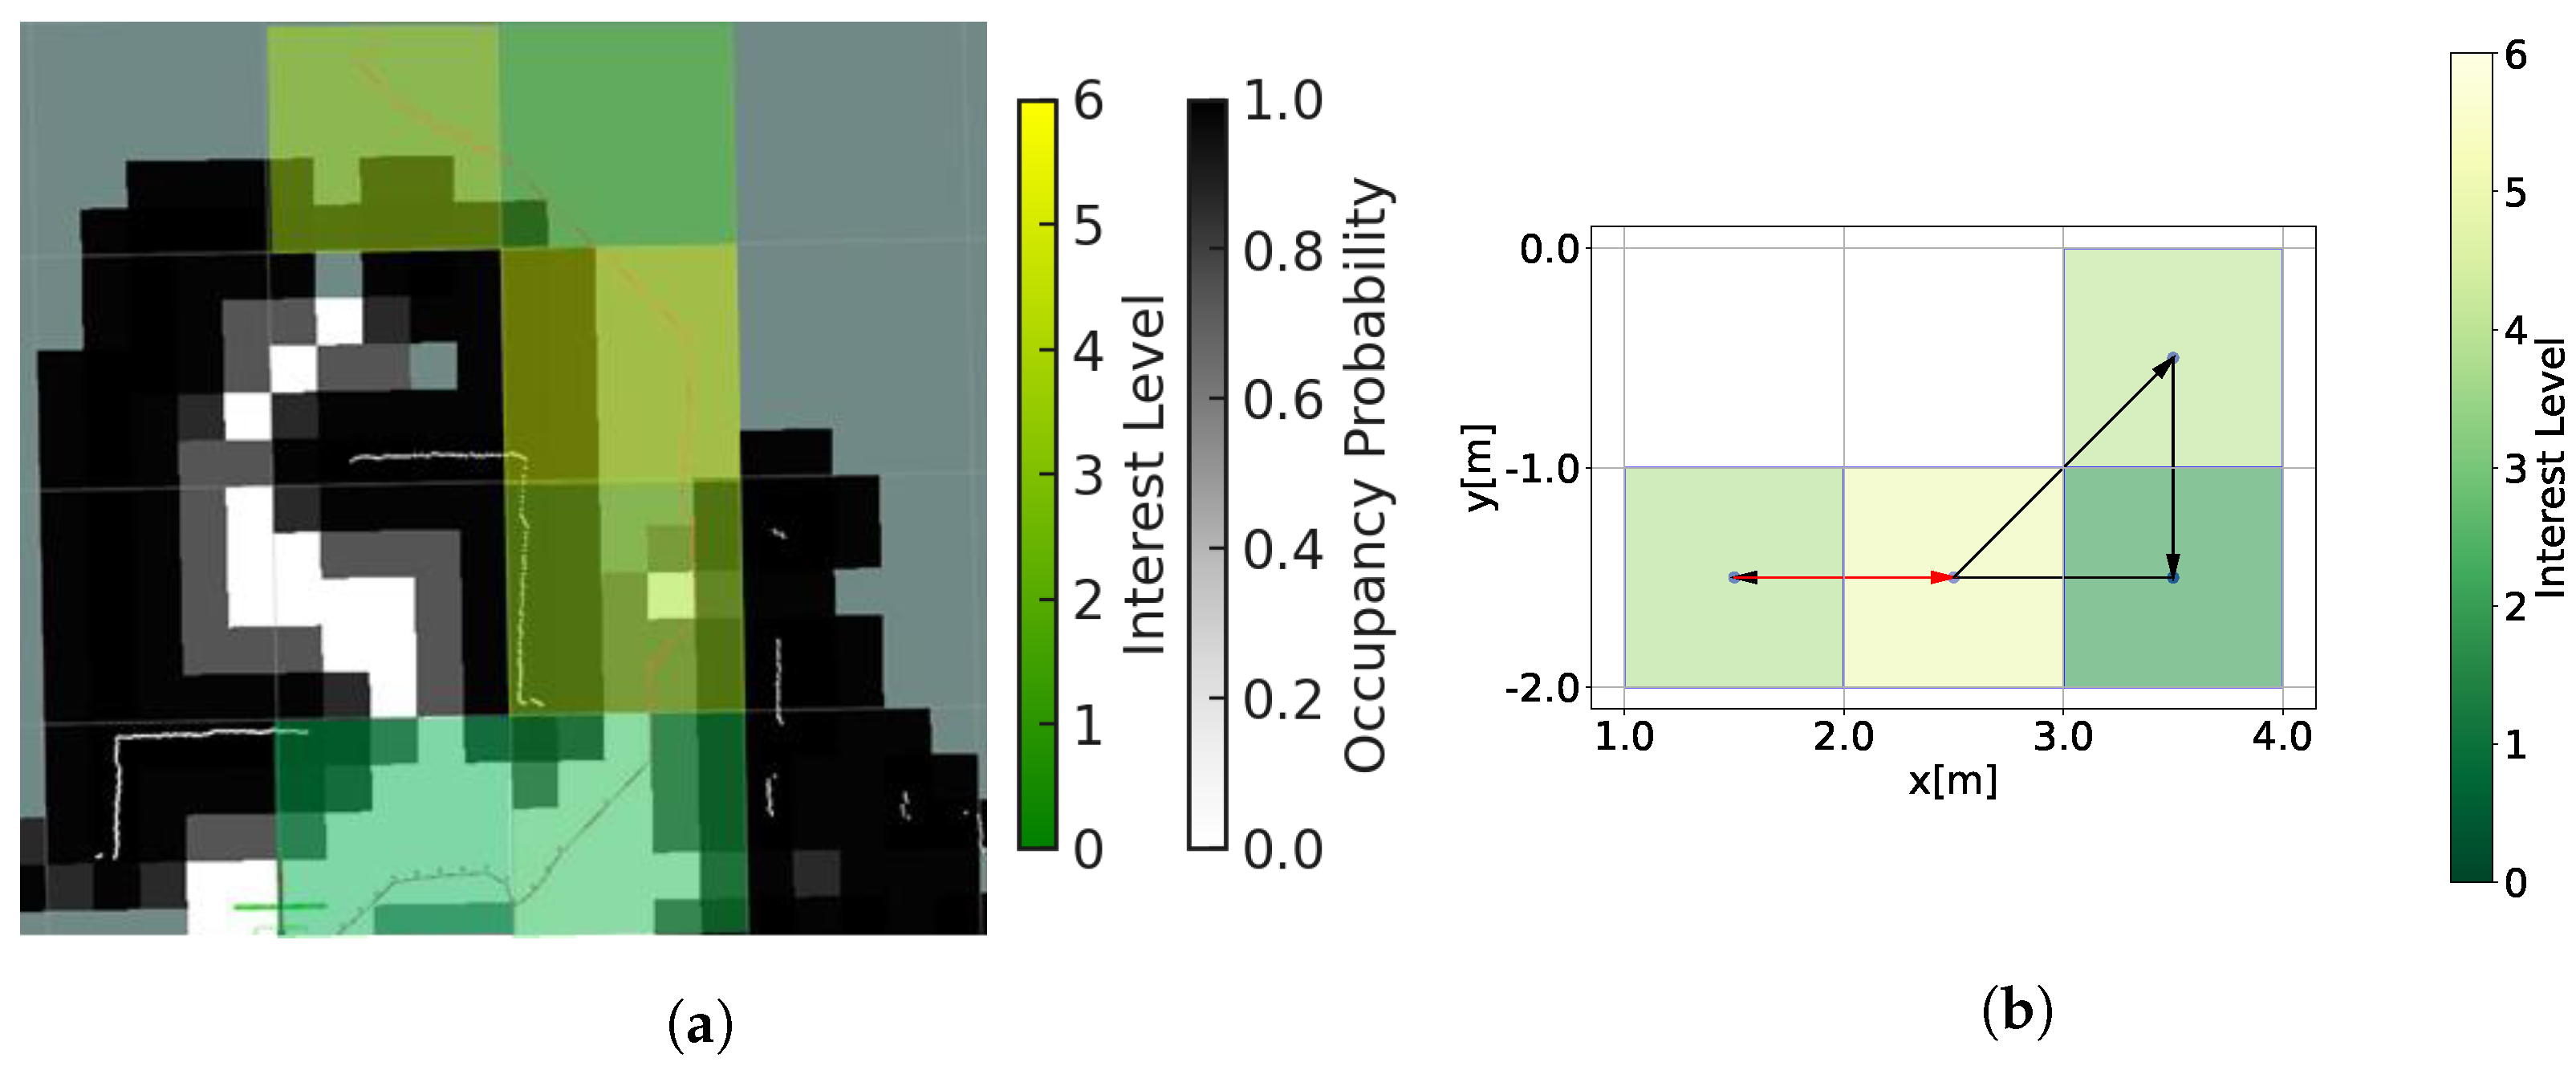
4.3.2. Extraction of the ROI and Calculation of Interest Levels

In drone routing, the ground robot’s challenges during exploration prompt the identification of Regions of Interest (ROI) based on the shared map and routing information. The drone prioritizes these regions, corresponding to high-uncertainty zones ( I , J ) within its search grid that overlap with the ground robot’s path γ . This focus allows the drone to generate detailed maps of critical areas requiring further exploration. As illustrated in Figure 7, the ground robot’s 1 m × 1 m grid highlights these ROIs within the drone’s search grid in yellow. The interest level C ( I , J ) quantifies the significance of each ROI for the ground robot’s path γ , with higher values indicating zones where detailed mapping is essential. These regions are typically characterized by significant uncertainties or potential obstacles that could hinder safe navigation. Uncertainty, a key factor in defining the ROI, reflects incomplete information about obstacles or the environment. The drone calculates entropy, a measure of uncertainty, to identify high-risk areas and prioritize them for detailed mapping. Entropy quantifies the unpredictability of occupancy probabilities within each grid cell. By reducing entropy in these critical zones, the drone supports safer and more efficient path planning for the ground robot. The set of ROI R is formally defined in Equation (8):
R = { ( I , J ) | γ G I , J }
Here, G I , J represents the region corresponding to the grid ( I , J ) , and γ G I , J indicates that a part of the path γ is contained within the range of grid ( I , J ) . Therefore, the ROI R is represented as the set of all grids ( I , J ) traversed by the path γ . Based on this definition, it becomes possible to efficiently identify the areas relevant to the path for exploration or analysis. This definition of the ROI is particularly useful for conducting focused exploration and data collection along the path. Moreover, it serves as a foundation for evaluating the risks and uncertainties in each grid ( I , J ) within the ROI, thereby determining the passability of the path.
Furthermore, the set of sampled points on the path within the grid ( I , J ) is represented by Equation (9):
A = { r m = ( x m , y m ) m = 1 , 2 , , M }
where A represents the set of coordinates of sampled points along the path within the grid ( I , J ) . Each r m = ( x m , y m ) corresponds to the position of the m-th sampled point, with M denoting the total number of sampled points. These sampled points are used to analyze the path’s features or evaluate interest levels within each grid cell. The grid on the right side of Figure 7 illustrates the concept. The interest level C ( I , J ) is given by Equation (10). The interest level represents the cumulative entropy of the path within the grid ( I , J ) , which has been identified as the ROI.
C ( I , J ) = r m A ρ r m log 2 ρ r m + ( 1 ρ r m ) log 2 ( 1 ρ r m )
where ρ r m represents the occupancy probability of point r m on the grid ( I , J ) . This time, those with an interest level of less than 1.0 are excluded from the ROI. Based on this interest level, an evaluation function for path planning is set.

4.3.3. Path Planning with Genetic Algorithm

This study employs a genetic algorithm (GA) to solve the Traveling Salesman Problem (TSP) for drone path planning. GA’s population-based approach enables it to explore diverse candidate solutions simultaneously, reducing the risk of local optima and improving search efficiency. This makes it well-suited for addressing the combinatorial challenges of path planning in complex environments. Unlike single-solution-focused techniques like Particle Swarm Optimization (PSO) [29] or Simulated Annealing (SA) [30], GA evolves an entire population of solutions through genetic operations such as crossover and mutation. These operations maintain solution diversity and enhance the exploration of the solution space, enabling GA to efficiently identify optimal or near-optimal paths for the drone.
In this study, GA enables the drone to efficiently identify the optimal route that visits all target grids while considering environmental constraints such as obstacles and uncertainties. This adaptability ensures effective path planning even in unknown, obstacle-rich environments. The evaluation function F used to optimize the path considers the balance between interest level and travel distance, as represented by Equation (11). The GA parameters employed in this study are summarized in Table 2, providing a basis for reproducibility and validation.
F = k = 1 K 1 d ( ( I k , J k ) , ( I k + 1 , J k + 1 ) ) C ( I k + 1 , J k + 1 )
C ( I k + 1 , J k + 1 ) indicates the ROI of the next coordinate ( I k + 1 , J k + 1 ) , and d ( ( I k , J k ) , ( I k + 1 , J k + 1 ) ) represents the Euclidean distance from coordinate ( I k , J k ) to ( I k + 1 , J k + 1 ) . Additionally, j is the number of zones the drone identifies as the ROI.
In this study, the genetic algorithm was configured with a population size of 100, a crossover rate of 0.8, and a mutation rate of 0.05. The population size was chosen to balance computational cost and solution diversity, ensuring sufficient candidate solutions for exploration. A crossover rate of 0.8 was selected to effectively facilitate information exchange between solutions, while a mutation rate of 0.05 was set to maintain diversity and prevent premature convergence. The parameter settings used in this study were arbitrarily determined during the initial experimental phase. These parameters were adjusted to function appropriately for tasks in a 10 m × 10 m area. However, for more complex paths or larger-scale environments, it may be necessary to modify or optimize these parameters. The aim of this study is to evaluate the impact of the proposed GA approach on drone behavior. Therefore, the rationality of the parameter settings will be explored in greater detail in future research. We evaluated these zones and the corresponding mapping trajectories. This evaluation function prioritizes paths with high interest levels and short distances, leading to the most efficient exploration path. While these parameter settings were confirmed to be suitable for the tasks within the scope of this study, further adjustments or optimizations may be required for more complex tasks or larger environments. Therefore, the detailed impact of parameter settings will be systematically examined in future research.
The results of the paths generated by the drone, based on the ROI of the ground robot’s path and the evaluation function (Equation (11)), are presented. The environment was set with the start point at (0.0, 0.0) and the goal point at (4.0, −0.5), as shown in Figure 8, where performance validation was conducted. In Figure 9, Figure 10 and Figure 11, (a) illustrates the path generated by the ground robot, indicated by the red line, where the occupancy probability increases as the color shifts from white to black. For the ROI, the interest level increases as the color changes from green to yellow. In (b), the drone’s exploration path is depicted, starting from the red arrow and proceeding to the black arrow in order. Similar to (a), the heat map in (b) reflects increasing interest levels with colors transitioning from green to yellow. Figure 9 illustrates the ROI, interest levels, and path generation results by the drone for the initial path created by the ground robot. Figure 10 shows the ROI, interest levels, and path generation results after the drone’s exploration. Furthermore, Figure 11 presents the ROI, interest levels, and path generation results when the drone identified obstacles during exploration and deemed the route impassable. This process demonstrates that the drone can promptly explore high-uncertainty areas in the path generated by the ground robot, while also conducting an efficient exploration that minimizes the flight path length. Additionally, it shows that when the ground robot identifies an impassable route, an alternate path can be generated, a new ROI can be specified, and the drone can conduct re-exploration. In this manner, the mapping path for the drone was generated using TSP-GA, based on the path information from the ground robot and the occupancy grid map. As a result, the exploration efficiency of the drone is improved, and it is expected to rapidly identify high-uncertainty areas.
To evaluate whether the drone performed meaningful actions for the ground robot, the cumulative entropy H ( I , J ) , hereafter referred to as the uncertainty levels, is derived as shown in Equation (12). The uncertainty levels H ( I , J ) of the grid ( I , J ) are analyzed, focusing on whether the uncertainty levels of grids recognized as ROI decrease preferentially.
H ( I , J ) = i I j J ρ ( i , j ) log 2 ρ ( i , j ) + ( 1 ρ ( i , j ) ) log 2 1 ρ ( i , j )
Here, ρ ( i , j ) is the occupancy probability of cell ( i , j ) .

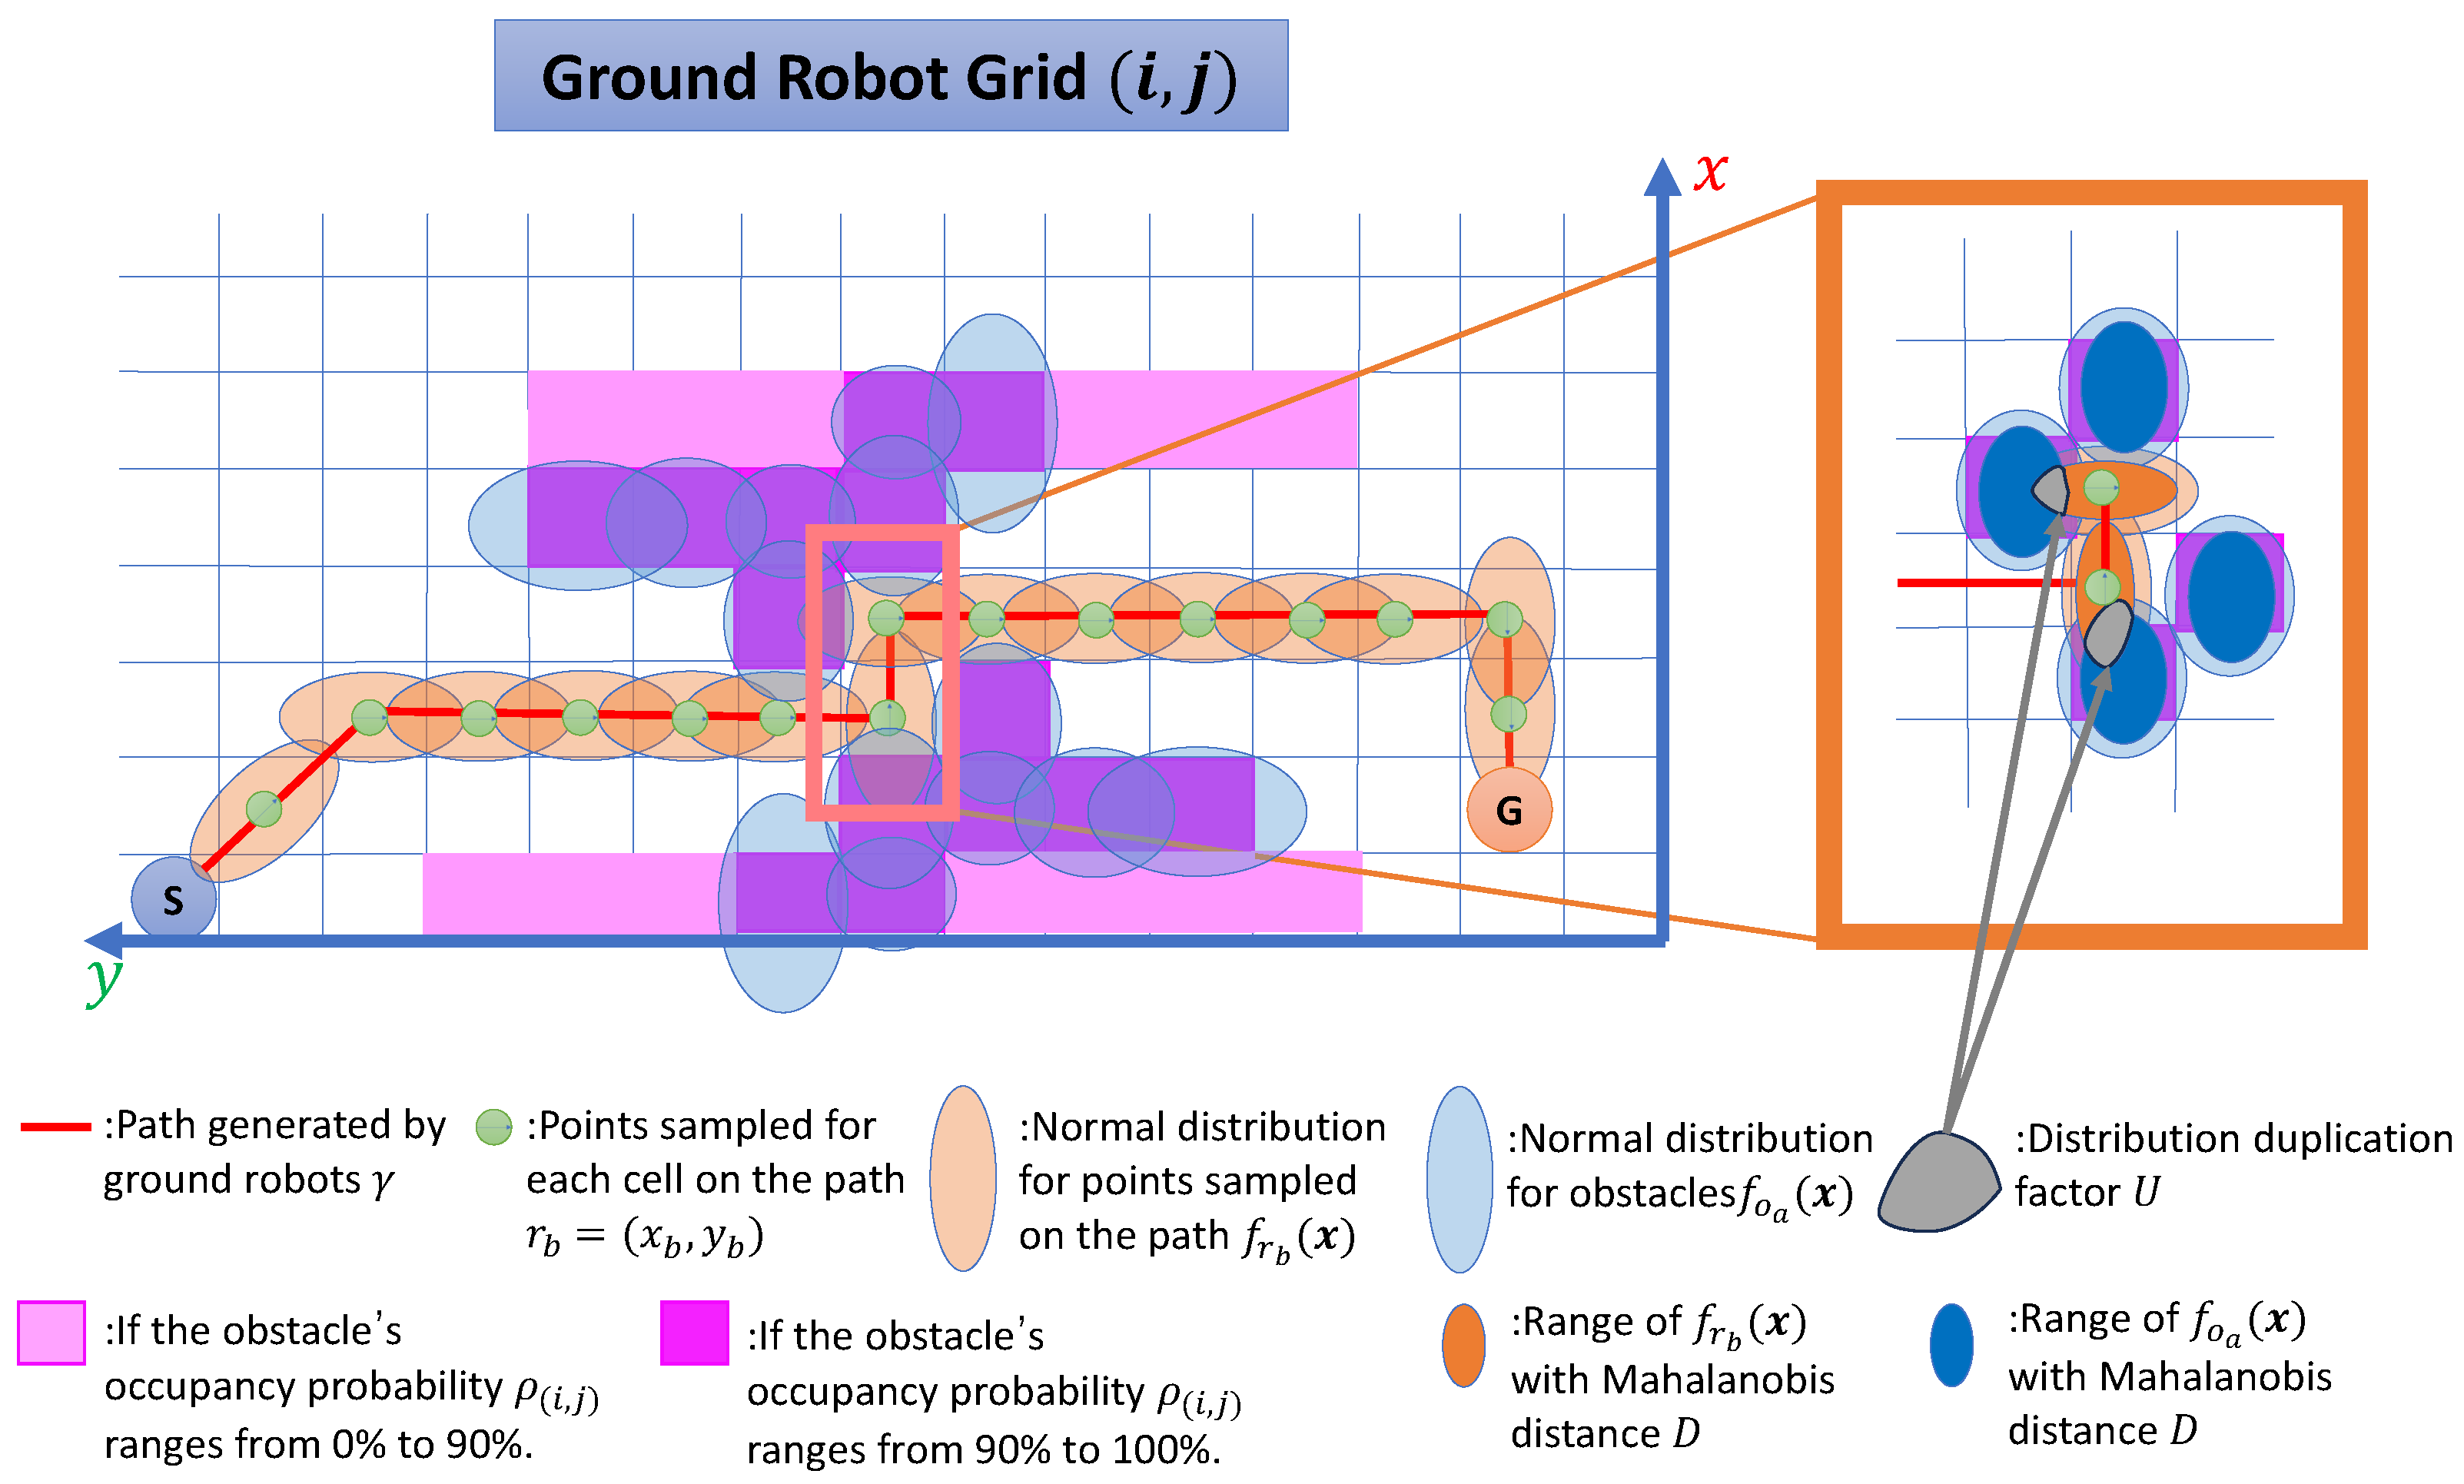
4.4. Risk Assessment and Passability Through Mutual Information Sharing Between Drones and Ground Robots

4.4.1. Risk Assessment of Ground Robot Paths Conducted by Drones

In this study, a two-step process is implemented for path exploration by the ground robot using information from the drone. First, the drone identifies high-risk areas along the ground robot’s path and shares this information. The ground robot then assesses the passability of these areas. If deemed passable, the robot proceeds; otherwise, it generates an alternative path and requests updated map data from the drone. This iterative process ensures safe path exploration.
To evaluate risks, the drone models uncertainties in the planned path and obstacle positions using normal distributions, enabling precise risk assessment and addressing resolution limitations of grid-based methods.
The degree of overlap between the normal distributions of the path and obstacles indicates the risk level, and this overlap is numerically calculated. The results are utilized by the drone to identify critical areas for the ground robot. As the ground robot progresses and new data become available, this information is iteratively updated. This process ensures that the ground robot can navigate safely, either by passing through high-risk areas or avoiding them. Figure 12 illustrates this risk assessment process, demonstrating how uncertainties are modeled and high-risk areas are identified.
The figure depicts the modeling of uncertainties in the positions of the ground robot’s path and obstacles using normal distributions. The path generated by the ground robot is represented, with sampled points along the path denoted by continuous coordinates r b = ( x b , y b ) . Obstacle and each sampled point is modeled as a normal distribution, f o a ( x ) = N ( μ o a , Σ o a ) and f r b ( x ) = N ( μ r b , Σ r b ) , respectively, as defined in Equations (13) and (14). These distributions are updated in real time, based on sensor data and a self-localization algorithm. Furthermore, only grid cells ( i , j ) with an occupancy probability of 90% or higher are modeled using normal distributions, focusing the evaluation on regions of greatest risk.
f o a ( x ) = 1 ( 2 π ) 2 | Σ o a | exp 1 2 ( x μ o a ) T Σ o a 1 ( x μ o a ) , a = 1 , 2 , , O
f r b ( x ) = 1 ( 2 π ) 2 | Σ r b | exp 1 2 ( x μ r b ) T Σ r b 1 ( x μ r b ) , b = 1 , 2 , , L
Here, x R 2 denotes the position vector being evaluated, distinguishing it from discrete grid cell coordinates. μ o a R 2 and Σ o a R 2 × 2 represent the estimated central position and covariance matrix of the obstacle o a , respectively. Similarly, μ r b R 2 and Σ r b R 2 × 2 represent the estimated central position and covariance matrix of the sampled point r b .
The uncertainty in self-localization based on a particle filter is quantitatively characterized by the mean vector μ r b and the covariance matrix Σ r b . The mean vector μ r b represents the estimated position’s central tendency and provides the most likely position along each axis. It is defined as follows in Equation (15):
μ r b = μ x ( r b ) μ y ( r b ) = k = 1 N w k p k k = 1 N w k ,
where p k = [ x k , y k ] T is the position of particle k, and w k is its associated weight determined by the sensor model. Here, μ x ( r b ) and μ y ( r b ) are the weighted averages of the particles’ positions along the x-axis and y-axis, respectively.
In addition to the mean vector, the uncertainty in the estimated position is expressed using the covariance matrix Σ r b , which captures the variances and covariances of the estimated position. The covariance matrix is formulated as follows in Equation (16):
Σ r b = σ x x ( r b ) σ x y ( r b ) σ x y ( r b ) σ y y ( r b ) = k = 1 N w k ( p k μ r b ) ( p k μ r b ) T k = 1 N w k .
Here, σ x x ( r b ) and σ y y ( r b ) represent the variances along the x-axis and y-axis, respectively, while σ x y ( r b ) represents the covariance between these two axes, reflecting their correlation. These values depend on factors such as sensor noise, map resolution, and the distribution of feature points on the map.
By combining the mean vector and the covariance matrix, the estimated position is comprehensively represented, encompassing both its central value and the associated uncertainty. This representation is critical for multi-robot systems, as it allows drones and ground robots to share localization uncertainties for collaborative evaluation of high-risk areas. This shared information enhances system robustness and enables adaptive path planning by dynamically incorporating localization uncertainty into decision-making processes, ensuring safer navigation in complex environments.
To quantify the uncertainty of obstacles, we formulate the distribution of feature points within each grid cell ( i , j ) using a covariance matrix Σ . Let { p 1 , p 2 , , p N } represent the set of feature points detected within the grid cell ( i , j ) , where each feature point p n is denoted as p n = ( x n , y n ) . The centroid μ o a = [ μ x ( o a ) , μ y ( o a ) ] T of the feature point set is computed as follows in Equation (17):
μ o a = μ x ( o a ) μ y ( o a ) = 1 N n = 1 N x n 1 N n = 1 N y n
The covariance matrix Σ o a is defined as follows, where its elements are calculated as follows in Equation (18)
Σ o a = σ x x ( o a ) σ x y ( o a ) σ x y ( o a ) σ y y ( o a ) = 1 N n = 1 N ( x n μ x ( o a ) ) 2 1 N n = 1 N ( x n μ x ( o a ) ) ( y n μ y ( o a ) ) 1 N n = 1 N ( x n μ x ( o a ) ) ( y n μ y ( o a ) ) 1 N n = 1 N ( y n μ y ( o a ) ) 2
This covariance matrix Σ o a quantitatively represents the uncertainty of the obstacle’s position and shape within the grid cell ( i , j ) . It serves as a critical metric for evaluating the ambiguity of the obstacle based on the spatial distribution of feature points within the cell.
The regions within a Mahalanobis distance D from the centers of these normal distributions are defined as S o a and S r b as follows in Equations (19) and (20). Mahalanobis distance is suitable for risk assessment as it accounts for correlations between dimensions, incorporating positional uncertainties in a robust manner. Unlike Euclidean distance, it reflects actual risk by incorporating positional uncertainties through the covariance matrix.
S o a = x ( x μ o a ) T Σ o a 1 ( x μ o a ) D
S r b = x ( x μ r b ) T Σ r b 1 ( x μ r b ) D
The overlap between the two normal distributions is evaluated by integrating the minimum value of the two distributions over the overlapping region U, as shown in Equation (21). This is represented by the shaded area in Figure 12, which visually illustrates the overlap between the path’s uncertainty and the obstacle’s uncertainty. The overlap ratio E quantifies the extent to which these uncertainties overlap, with higher values indicating a greater risk of collision. By evaluating E, high-risk areas can be systematically identified, guiding the ground robot’s path planning process.
U = a = 1 O x S o a S r b min ( f o a ( x ) , f r b ( x ) ) d x
We can accurately evaluate the overlap by considering only the primary regions of the two normal distributions defined by S o a and S r b . The degree of overlap between the two distributions is quantified as the ratio E of the overlapping area to the total area of the sampled point’s distribution:
E = U x S r b f r b ( x ) d x
In this context, E represents the distribution overlap ratio, which will henceforth be referred to as the risk assessment metric. This approach enables a quantitative assessment of the overlap between the path and obstacle distributions, allowing the identification of high-risk points. In this study, D = 2 was used, corresponding to a 95.4% confidence interval of the normal distribution, ensuring that most uncertainties are captured within this range. Areas where E exceeded 0.15 were considered high-risk. This high-risk information is communicated to the ground robot, which evaluates whether it is feasible to pass through these areas. After identifying high-risk regions through the risk assessment process, the ground robot proceeds to evaluate the passability of these regions. Thus, the passability evaluation is directly informed by the results of the risk assessment, ensuring that the robot’s path planning reflects both the risks and the feasibility of safe traversal.

4.4.2. Passability Evaluation of Ground Robot Based on Drone Risk Assessment

Next, we explain the ground robot’s passability evaluation. Unlike the drone, which uses normal distributions, the ground robot employs grid-based information for this process. This method divides the physical space into finer cells, enabling efficient and localized passability assessment with lower computational costs. Passability is evaluated based on traversal difficulty T, where a low T indicates a passable path, while a high T suggests the path is not passable. Using the information provided by the drone, the ground robot determines whether it can traverse the identified high-risk areas. The assessment involves examining the occupancy probability within a Mahalanobis distance D centered on the high-risk points and calculating the average value. The coordinates ( x , y ) within the Mahalanobis distance D are defined as follows in Equation (23):
x x b y y b T Σ r b 1 x x b y y b D 2
Here, D is the Mahalanobis distance, and ( x b , y b ) represents the coordinates of the sampled point on the path r b . Figure 13 shows an image of the Equation (23).
The traversal difficulty T within the Mahalanobis distance D is calculated as shown in Equation (24):
T = 1 C c = 1 C ρ g c
Here, g c denotes a cell in Mahalanobis distance D, and g c can be derived from which cell corresponds to ρ g c using the formula Equation (4). ρ g c represents the occupancy probability of each cell ( i c , j c ) within the distance D, and C is the number of cells within this Mahalanobis distance D. If T exceeds a certain threshold, the area is deemed impassable, and the ground robot generates an alternative path.

5. Experimental Equipment

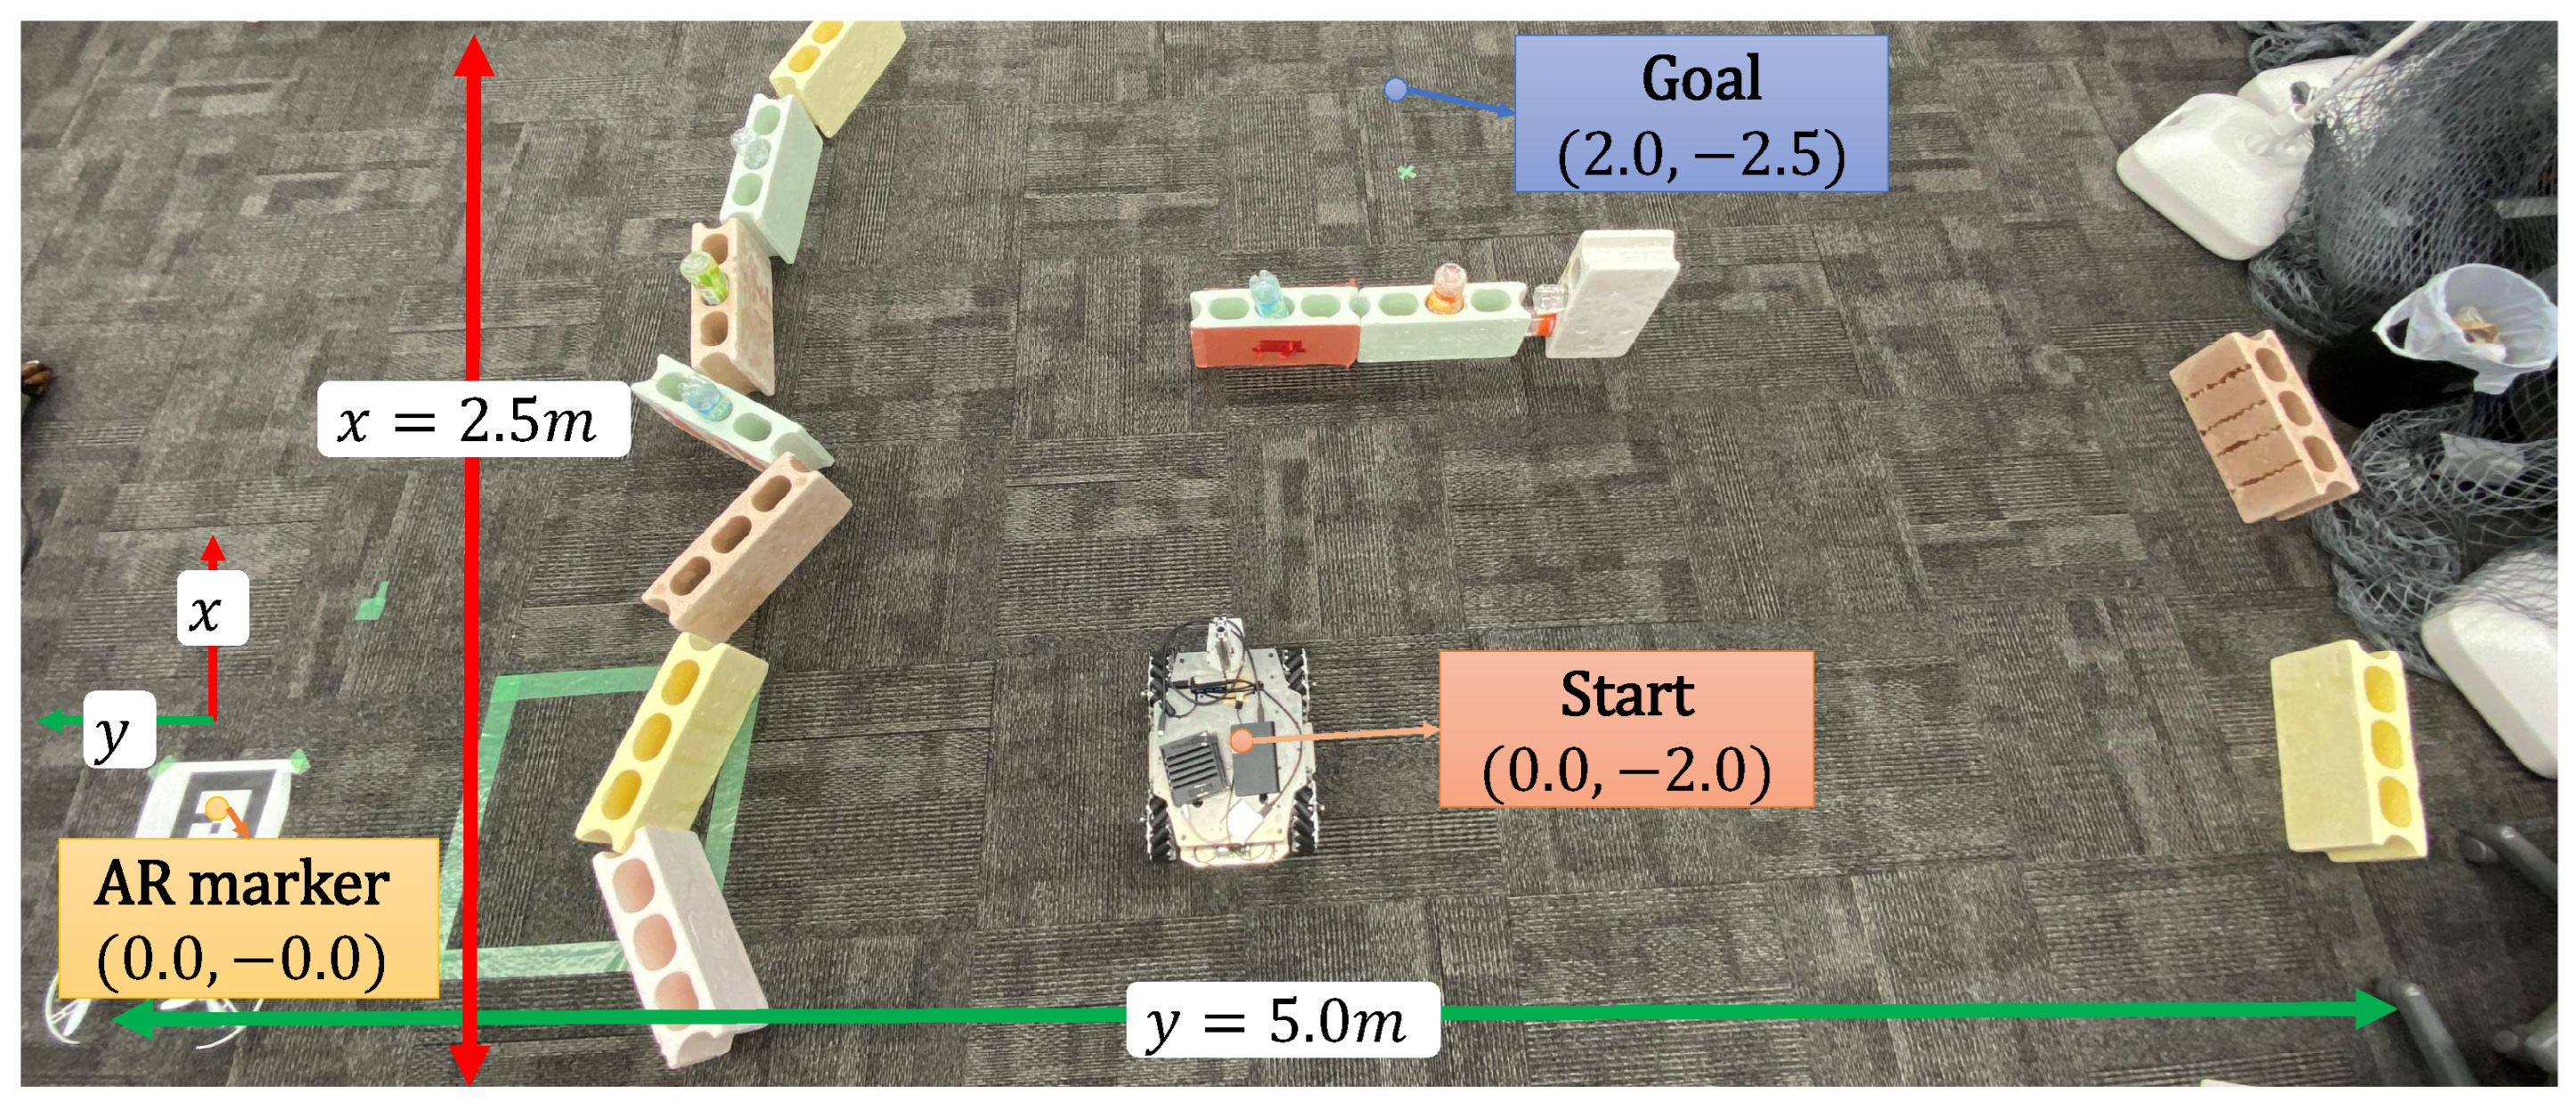
5.1. Experimental Setup

The real-world experiments are conducted in an environment measuring 2.5 m (x: −0.5 m to 2.0 m) × 5 m (y: −5.0 m to 0.0 m). The starting point for the ground robot is ( 0.0 , 2.0 ) and the goal point is ( 2.0 , 2.5 ) . The starting point of the drone is arbitrary. The experimental environment is illustrated in Figure 14. In this study, the Parrot Bebop2 drone was utilized, featuring a weight of 500 g, a flight time of 25 min, and a maximum speed of 16 m/s. Additionally, the ground robot used in this research was the Mecanum Rover ver2.1, developed by Vstone, equipped with omnidirectional movement enabled by Mecanum wheels. The integration of these devices allowed for the verification of cooperative operations between the robots. It is important to note that the effects of wind disturbances on the drone are disregarded in this study. During the experiments, the arrangement of blocks on the left side of Figure 14 is randomly altered, and the spacing between the blocks is adjusted. Additionally, the central block is moved forward or backward to create variations in the passage risk. When the passage risk is high, an alternative path is generated to ensure safe navigation. The cooperative behavior of the drone and ground robot is evaluated, focusing on the drone’s mapping trajectories and evaluating locations identified as high-risk by the drone. The ground robot assessed the passability of specific locations based on risk information provided by the drone, determining whether to proceed or to detour those zones. The map is color-coded to indicate occupancy probability, transitioning from white to black as the likelihood increases, while gray cells represent unknown zones. The drone’s landing point is predetermined to be around an AR marker, and the map’s origin is also set to this AR marker, with all positional data referenced from this origin. The drone flew at an altitude of 1.0 m, with its camera tilted 60 downward from the horizontal. To verify the ROI, the drone must be approximately 1.0 m away from the zone.
Consequently, when the drone moved to verify the ROI, it always mapped the zone from a distance of 1.0 m. Dijkstra’s algorithm is applied for the ground robot’s path planning [26], and PID control is utilized for the drone’s navigation. The condition for initiating path planning is set either when the ground robot determines that the cumulative entropy of the path, H, is at least 2.0 ( H 2.0 ), or when the ground robot determines that it could safely pass through a high-risk zone despite high cumulative entropy. The formula for deriving H is shown in Equation (25).
H = b = 1 L ρ r b log 2 ρ r b + ( 1 ρ r b ) log 2 1 ρ r b
where r b is the coordinate ( x b , y b ) of each sampled point on the ground robot’s path γ , ρ r b is the occupancy probability at r b , and L is the path generated from the start point to the goal point, represented as { r b = ( x 1 , y 1 ) , , r L = ( x L , y L ) }.

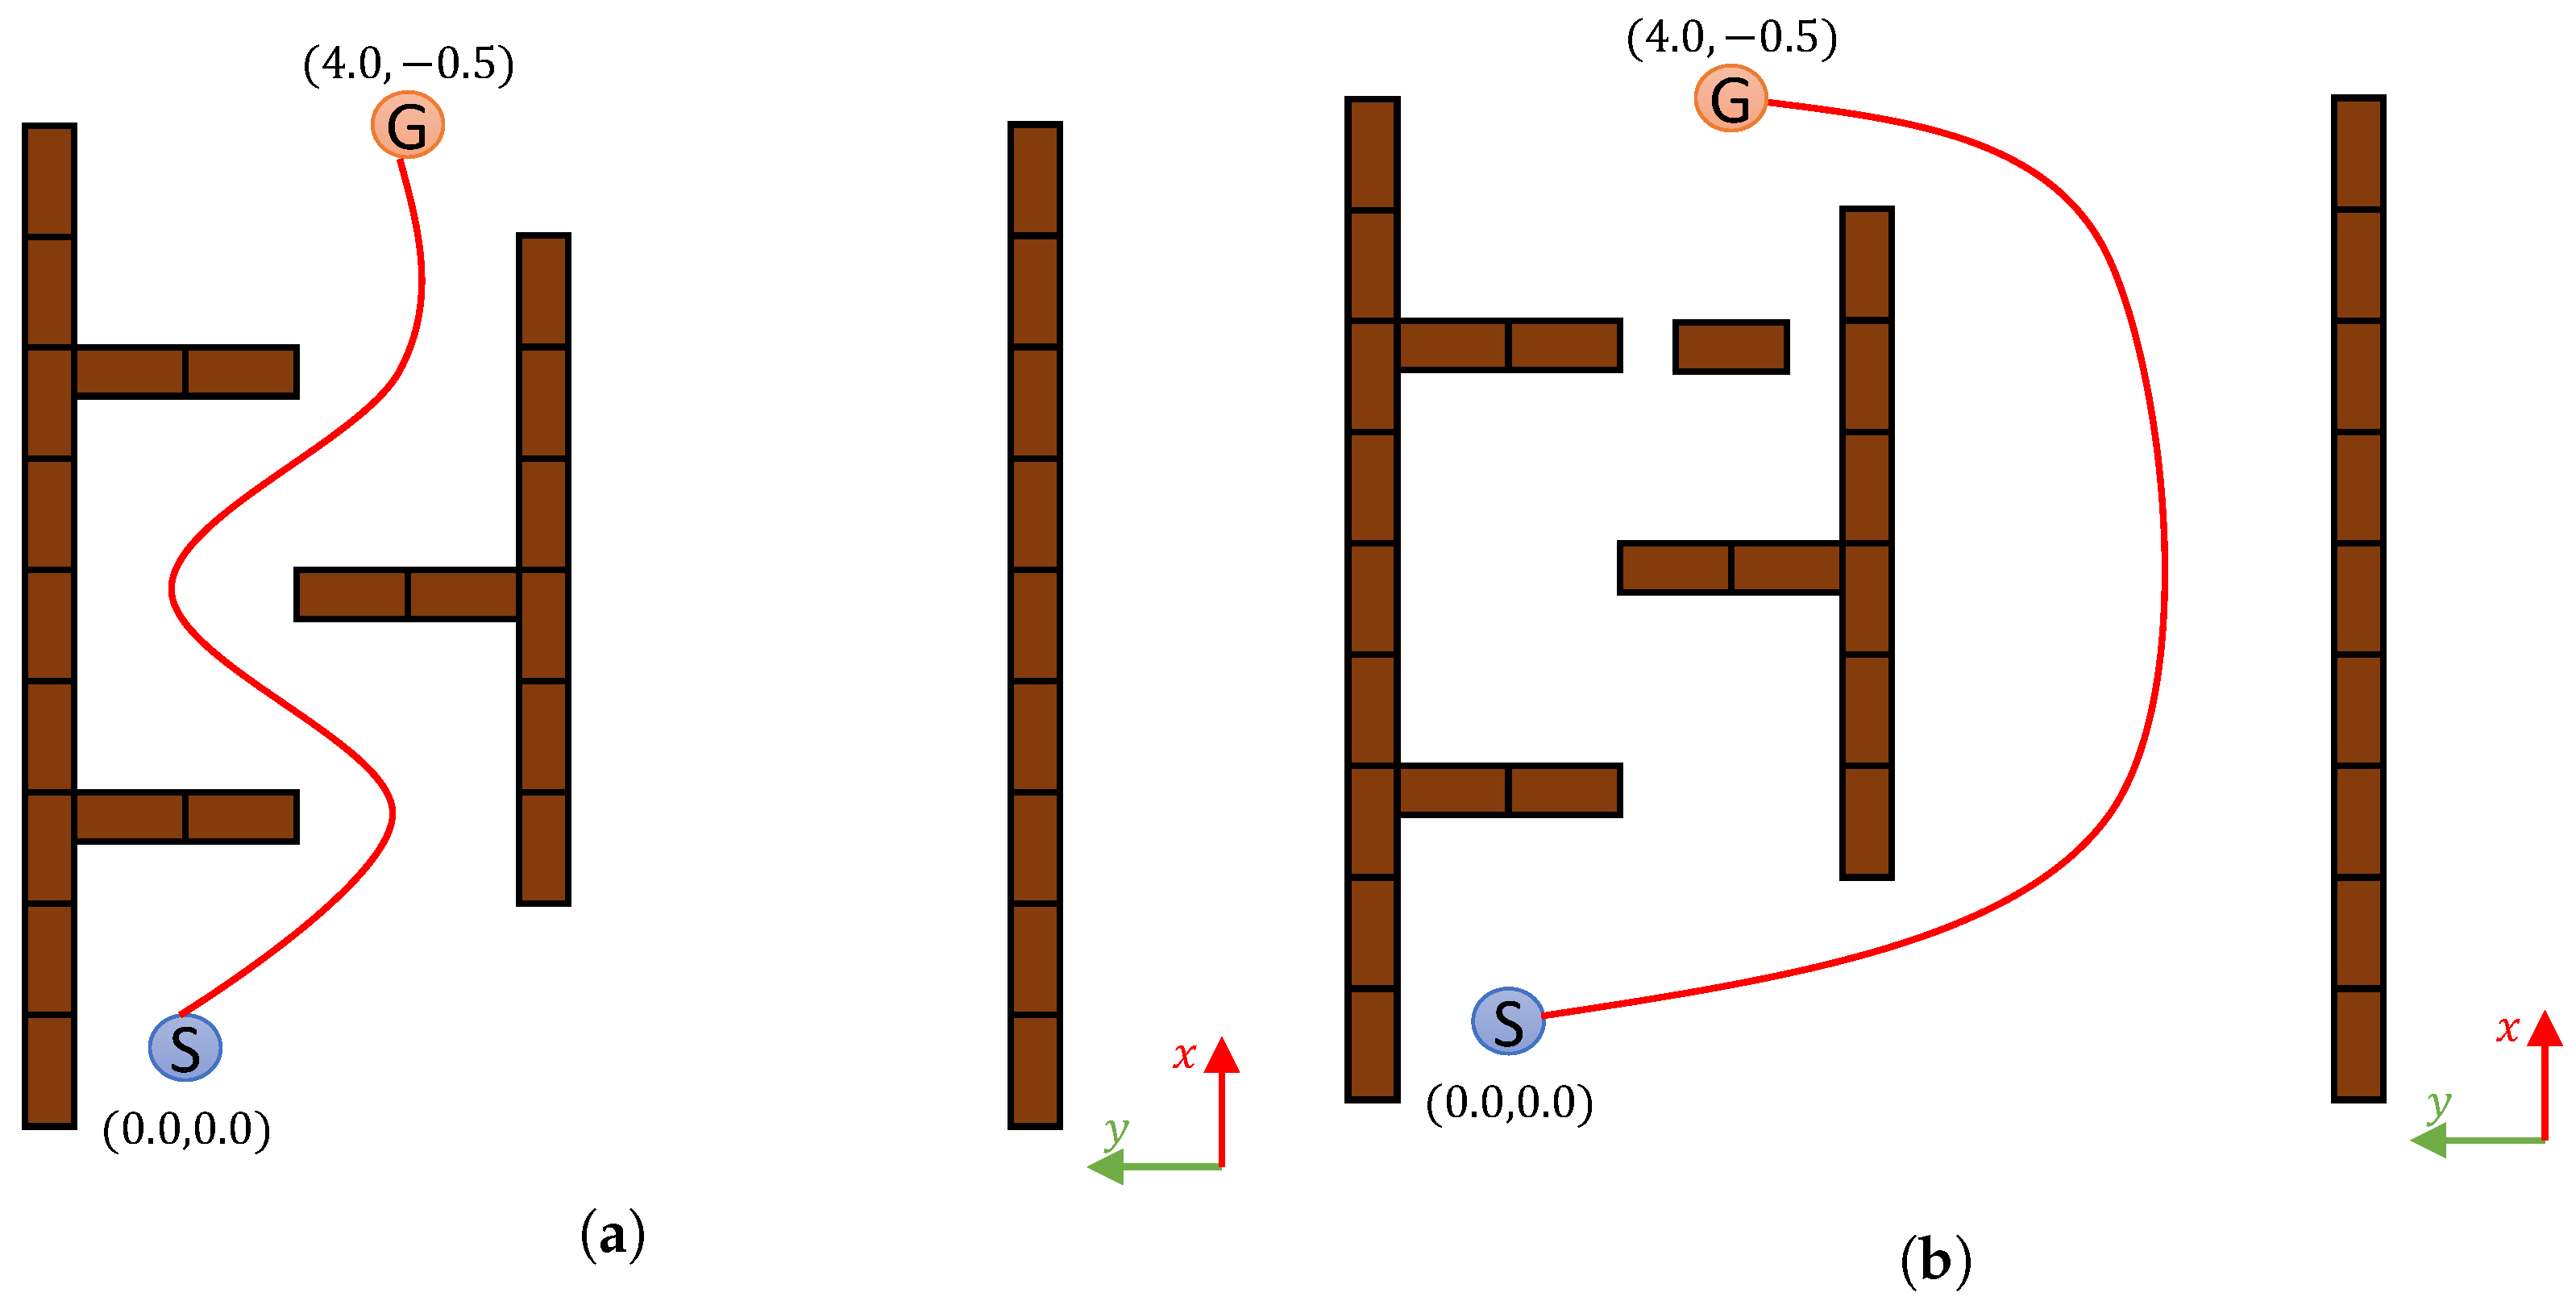
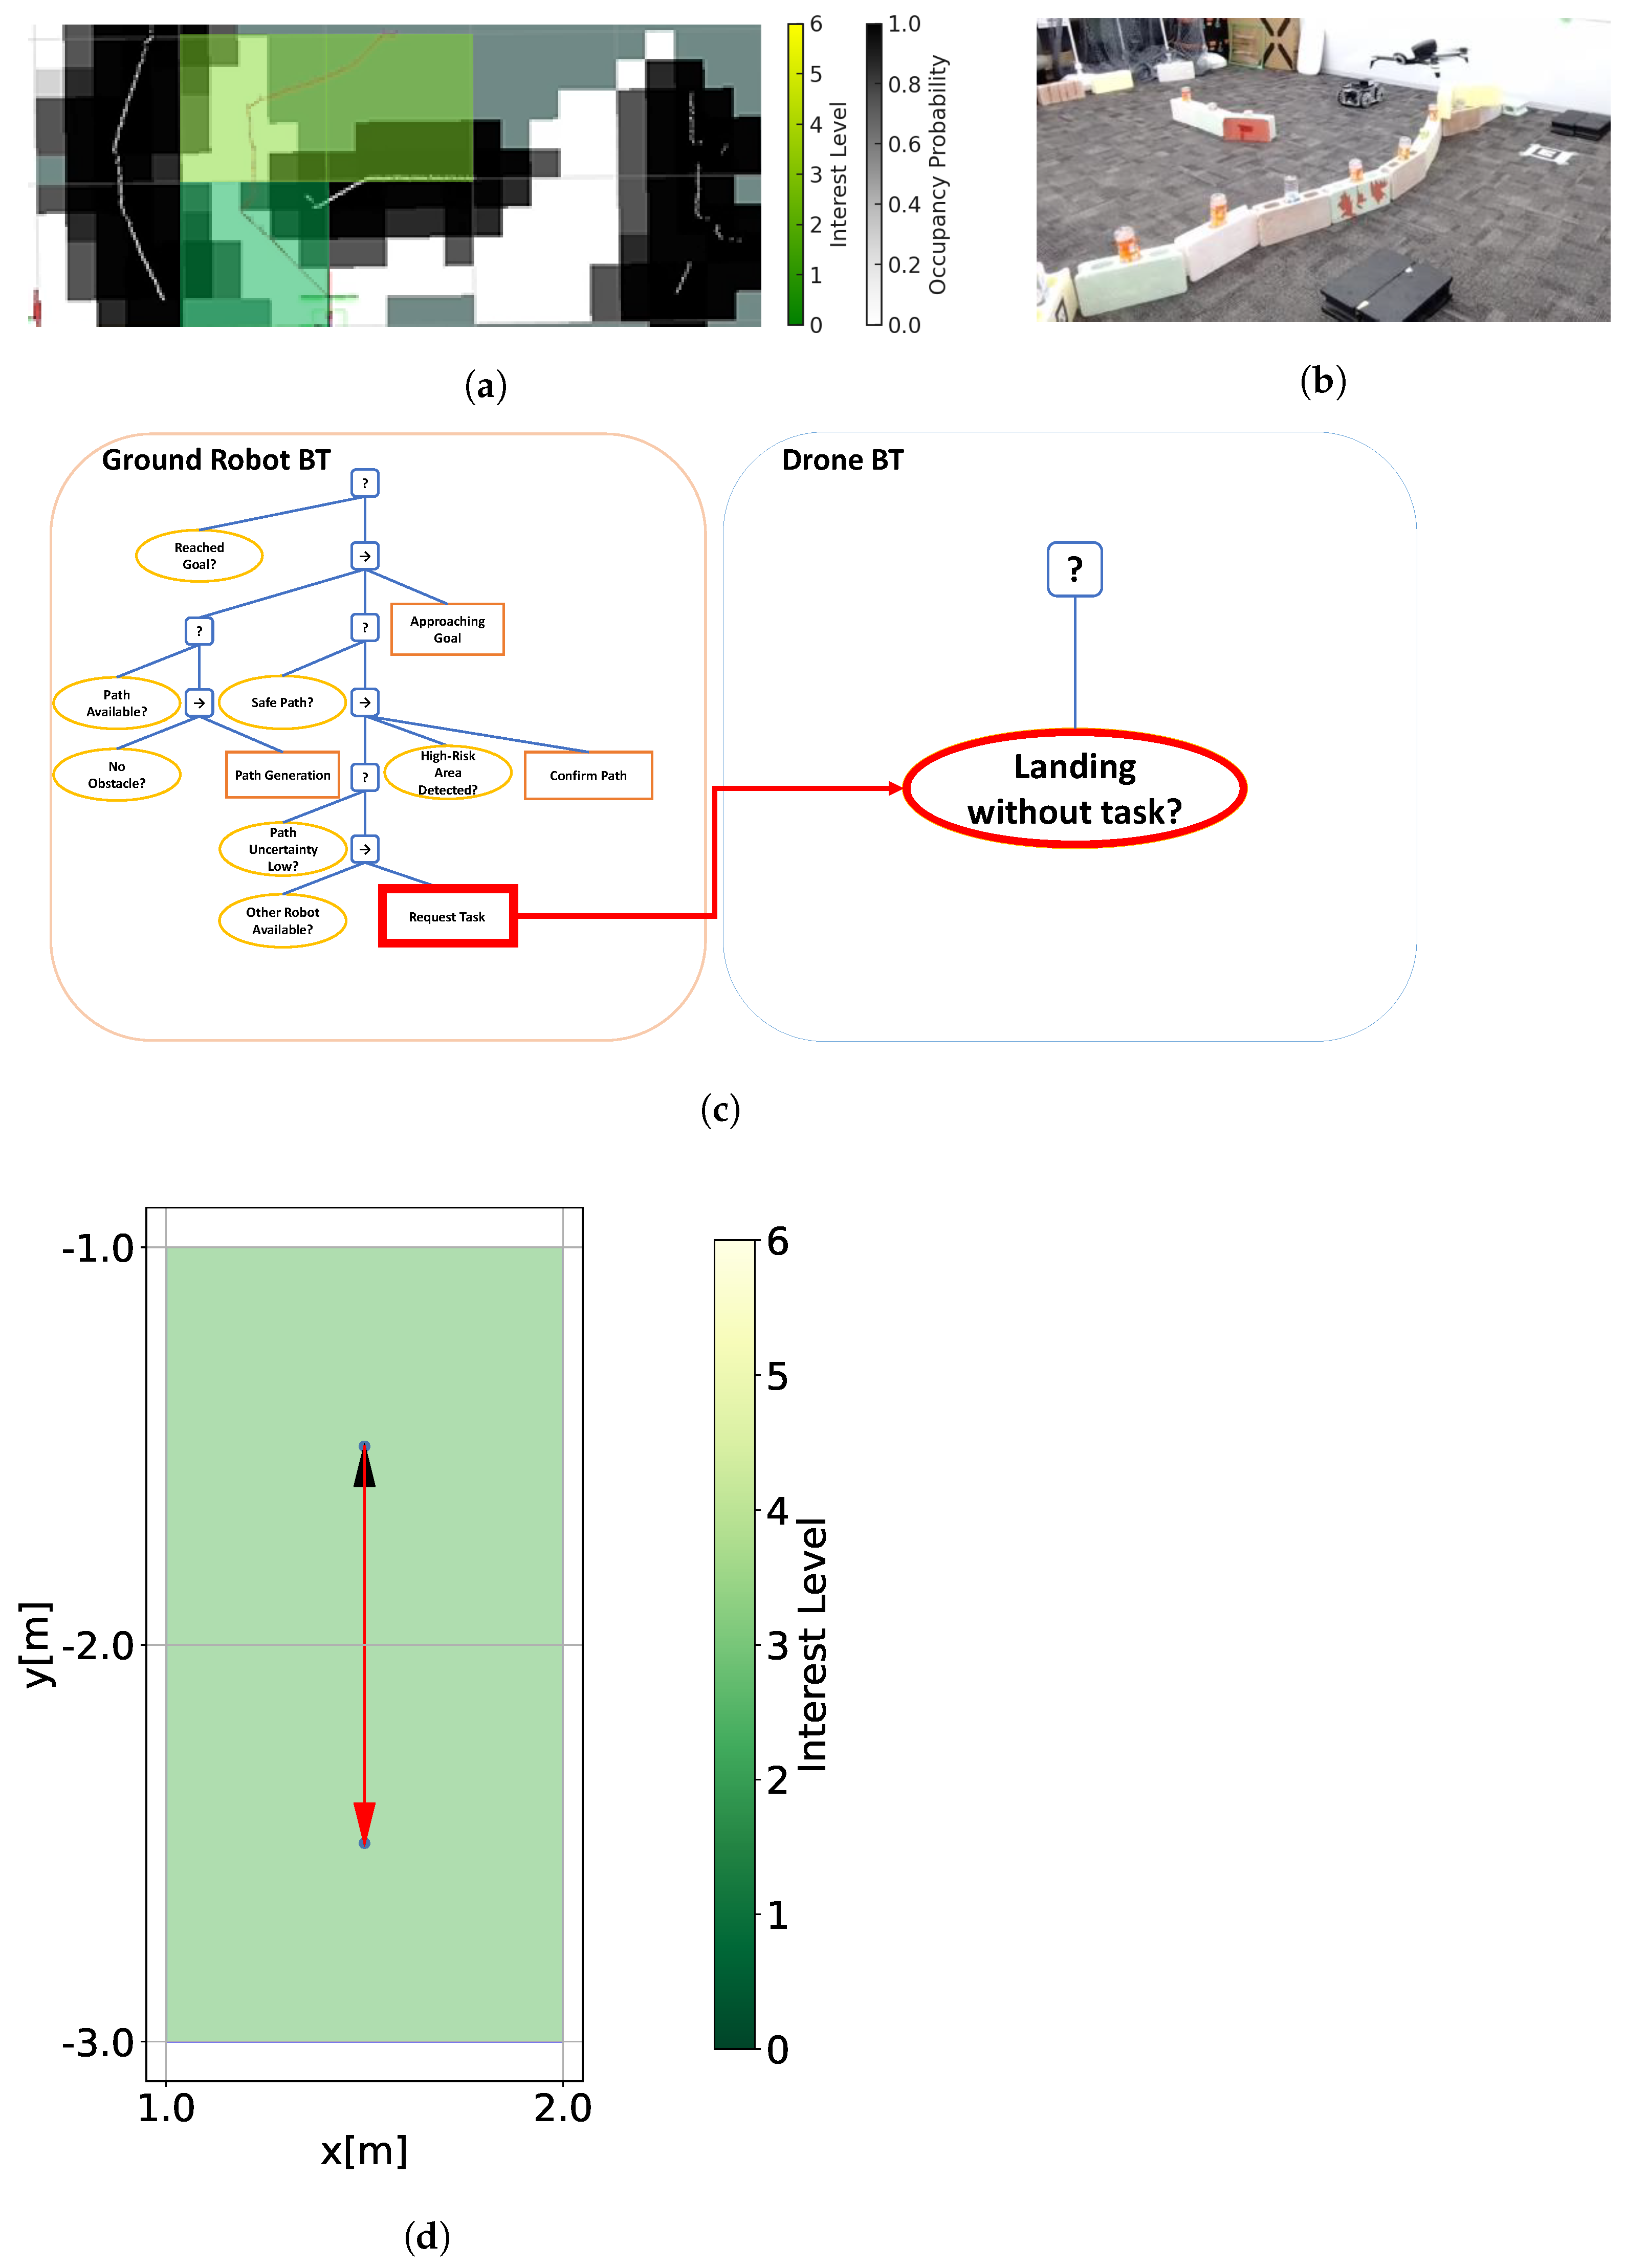
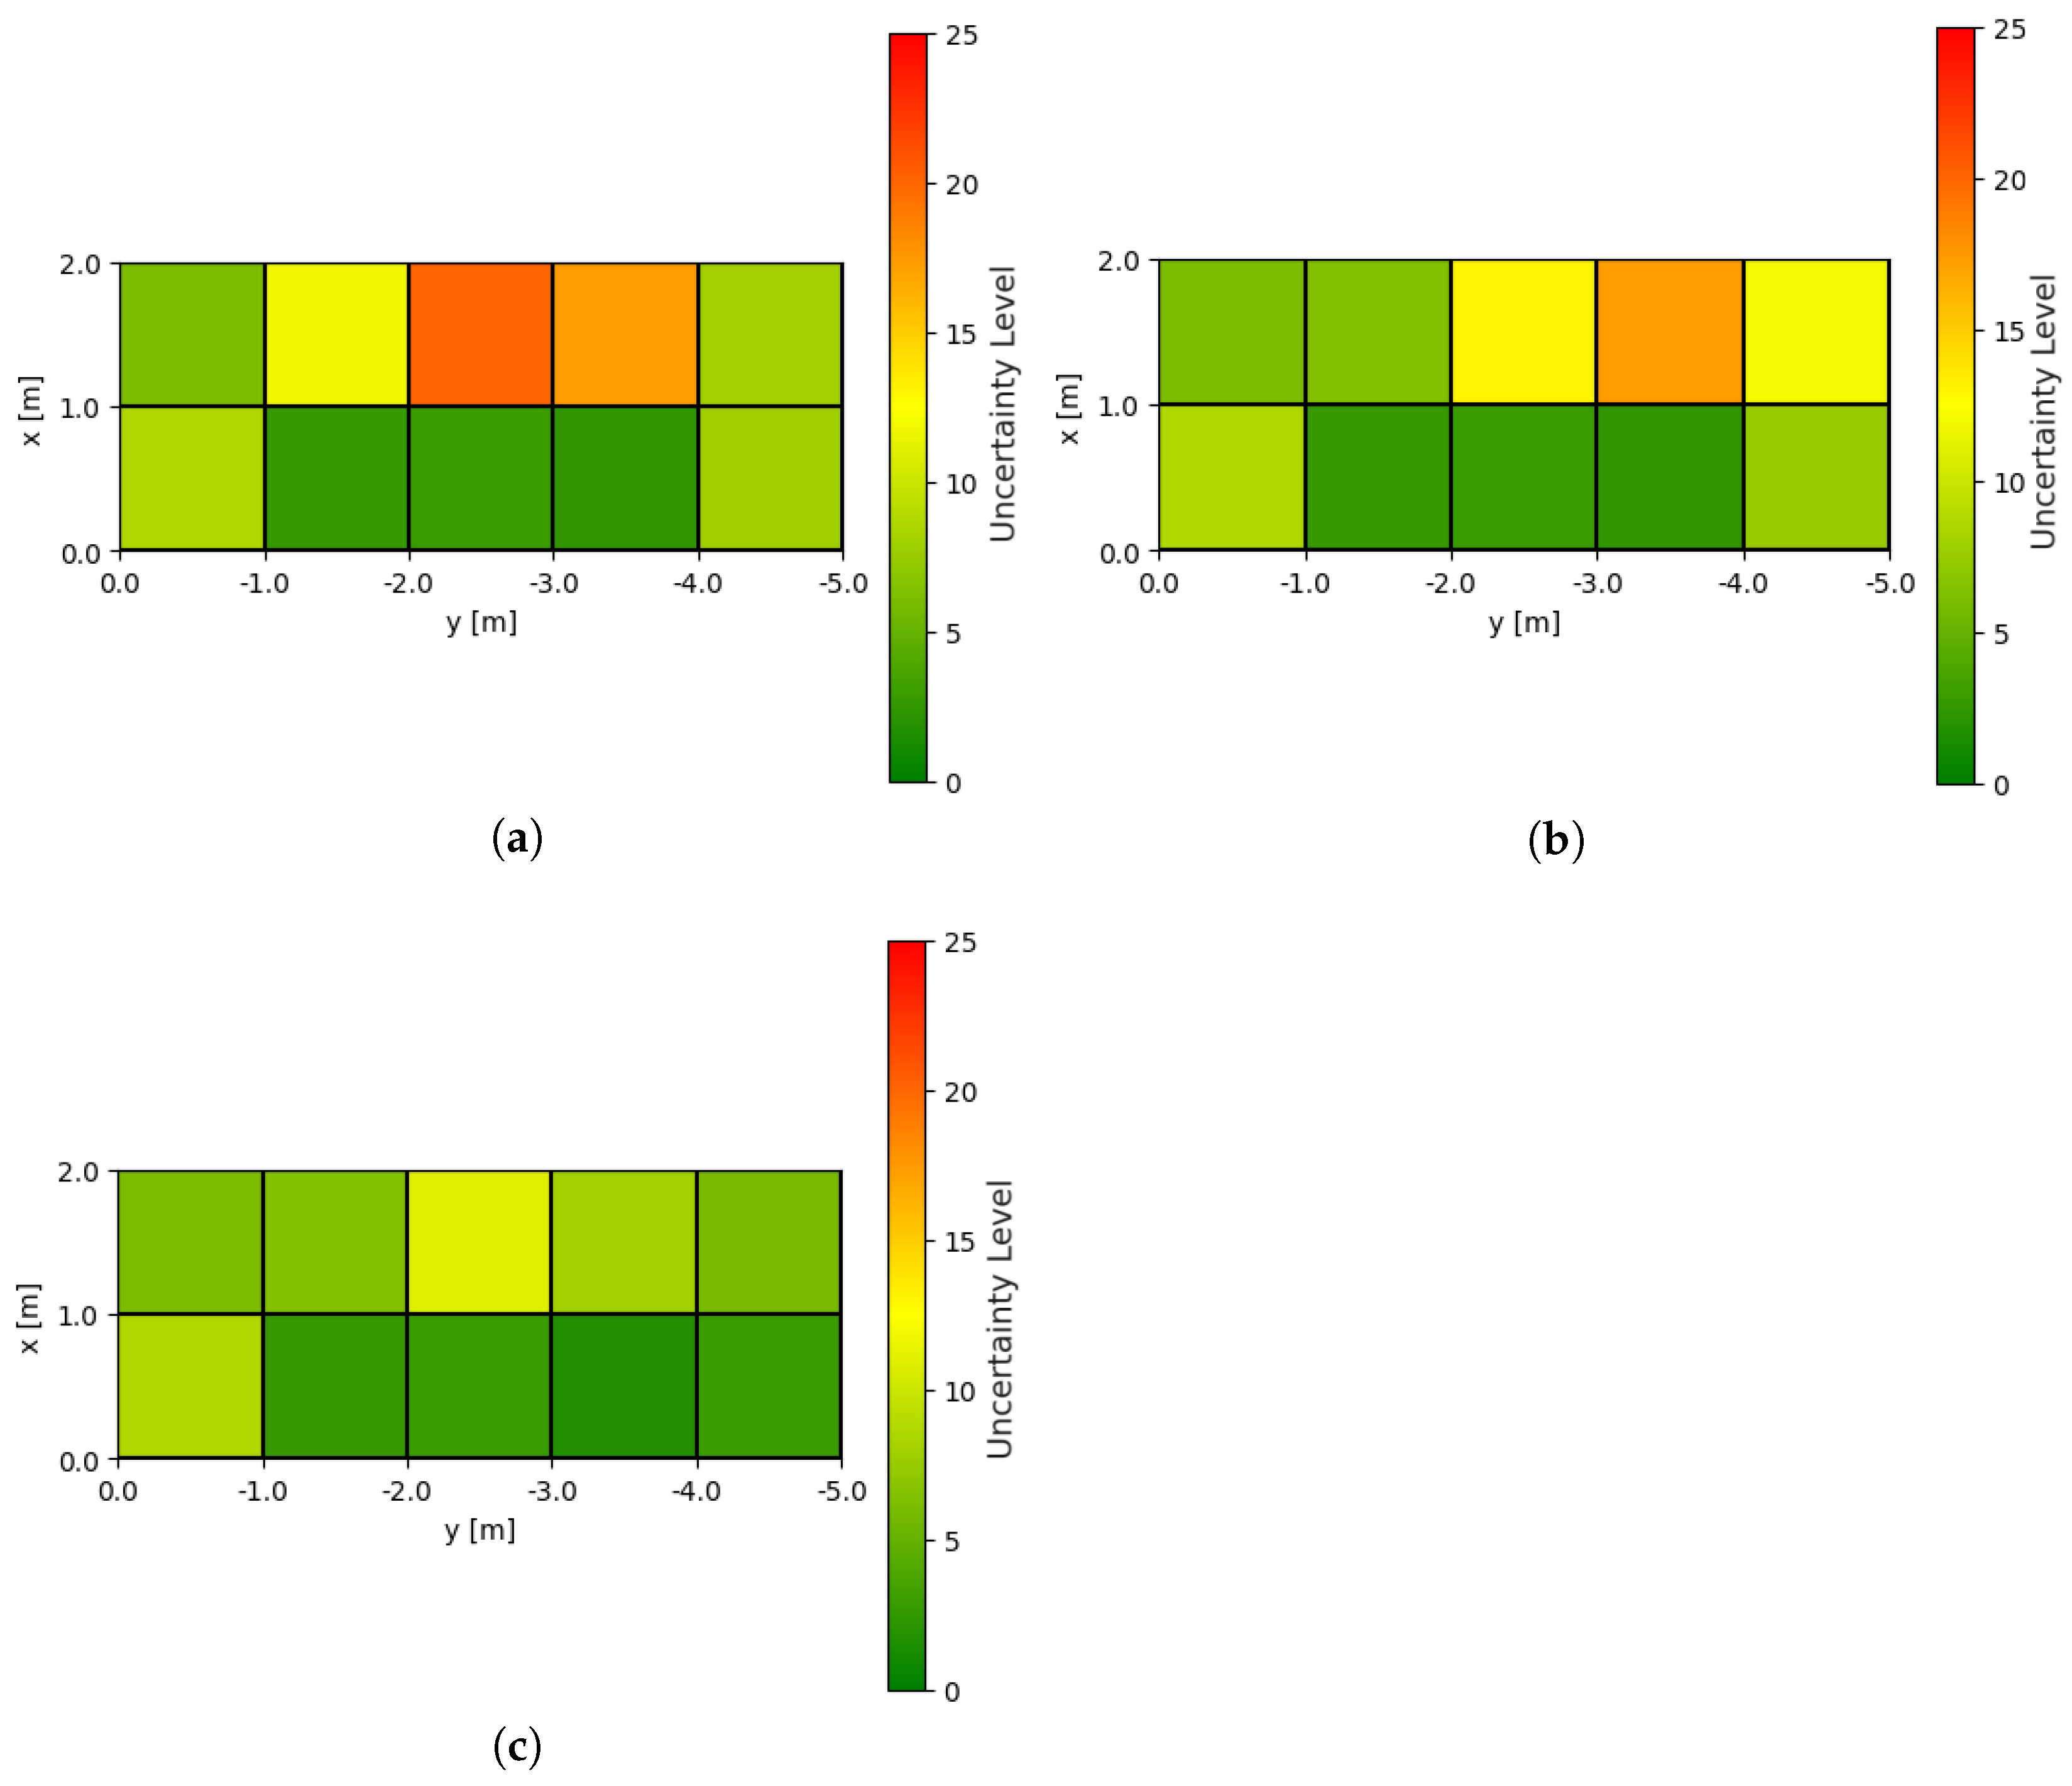
5.2. Experimental Results

This investigation seeks to enhance ground robot path planning accuracy and safety through drone collaborative operations. Specifically, it examines a method where drones detect high-risk zones when the uncertainty of the path generated by the ground robot is high and re-plans a safe path for the ground robot. Initially, the uncertainty H of the path generated by the ground robot is checked, and if H 2.0 , a task request is made to the drone. This method initiates spontaneous collaboration. Subsequently, the drone flies over specific zones to detect high-risk zones ( x , y ) . The ground robot then plans its path based on the occupancy probability data obtained from the drone, and any zone with a traversal difficulty T exceeding 70% is considered impassable, prompting the generation of an alternative path. The experimental results for two scenarios one where a straight path was feasible and another where an alternative path was generated are presented in Figure 15, Figure 16, Figure 17, Figure 18, Figure 19, Figure 20 and Figure 21. In each figure, (a) represents the ground robot’s map, generated path, and the location of its ROI, with the additional detail that areas on the map progress from white to black as occupancy probability increases, and from yellow to green as the level of interest in ROI rises. (b) provides a third-person perspective view. (c) illustrates the robot’s BT behavior as observed from a third-person perspective. (d) depicts the exploration path taken by the drone in cases where high interest levels in regions require map generation. Additionally, in (d), the heat map shows increasing levels of interest from green to yellow, with exploration progressing in the order of red arrows to black arrows. In this study, the scenario where the ground robot followed the initially generated path directly is referred to as Experiment 1, while the scenario where an alternative path was generated to avoid high-risk areas is referred to as Experiment 2.
The experimental results of a straight path traversal are shown in Figure 15, Figure 16 and Figure 17. When the ground robot generates its initial path, high uncertainty H = 6.0 regarding the path prevents a determination of passability. Consequently, as shown in Figure 15, the ground robot requests a task from the drone, which then initiates its task. The drone generates an exploration path based on the ground robot’s ROI and their respective levels of interest and begins mapping through exploration. After the drone’s exploration is completed, as illustrated in Figure 16, the uncertainty in the path is reduced to H = 1.0 , enabling an assessment of passability. Since the path was determined to be passable, the ground robot proceeded with its straight path exploration. Ultimately, as shown in Figure 17, the exploration is safely completed.
The experimental results for the case in which an alternative path was generated and explored are shown in Figure 18, Figure 19, Figure 20 and Figure 21. Similar to the straight path scenario, when the ground robot generates its initial path, the uncertainty H = 6.7 in the path is high, making it impossible to determine passability. Consequently, as shown in Figure 18, the ground robot requests a task from the drone, which then initiates its task. The drone generates an exploration path based on the ROI and their respective levels of interest identified by the ground robot and begins mapping through exploration. After the drone’s exploration is completed, as illustrated in Figure 19, the uncertainty in the path is reduced, enabling an assessment of passability. In this case, however, the path was determined to be impassable. Therefore, as shown in Figure 20, the ground robot generates an alternative path and requests further exploration from the drone. Once the safety of the detour is confirmed, and the uncertainty is reduced to H = 1.0 , the ground robot initiates its exploration along the alternative path, ultimately completing the path, as shown in Figure 21. The reduction of uncertainty is critical for enabling the ground robot to make more informed decisions about path traversability, especially in regions where risk levels are initially high. This ensures safer and more efficient navigation in complex or dynamic environments.
The following describes how the BT governs the interaction and task execution between the ground robot and the drone. The task request to the drone is triggered when the “Safe Path”? node in the ground robot’s BT fails, activating the “Task Request” node. The success of this node initiates the drone’s takeoff and exploration tasks. The ground robot retrieves information from the drone’s “Mapping” node and the evaluation of traversal difficulty is performed through the “Path Evaluation” node in the ground robot’s BT. This process allows the ground robot to choose between proceeding straight or selecting a detour. If a detour is selected, the information is updated in the “Have a Task”? node and a new path are provided. Consequently, the drone performs further mapping and risk assessment of the ground robot’s path through the “Mapping” node and shares the updated information with the ground robot. By utilizing BT, task requests and information sharing are streamlined, enabling flexible and efficient collaboration in regions with high uncertainty while ensuring actions are initiated as needed.

5.3. Analysis of Experimental Data

An analysis of the experimental data is conducted. Table 3 presents the results of each experiment, including the exploration stage of each drone, the coordinates of the ROI R, and the change in ROI before and after drone exploration. Table 4 presents the results of each experiment, including the exploration stage of each drone, sampled points ( x , y ) on the ground robot’s route, the drone’s risk assessment E for those points, the ground robot’s traversal difficulty T, and the final decision of the ground robot. Notably, the data shown here are selected excerpts, focusing on six representative samples for each drone exploration stage. For E, the blue color indicates the distribution overlap ratio where the drone determined the area to be safe during risk assessment, while the yellow color indicates the distribution overlap ratio where the drone assessed the area as hazardous. Regarding T, the blue color represents regions with low risk as judged during the E stage. Green indicates regions assessed as hazardous during the E stage but determined to have a low likelihood of being impassable by the ground robot. Red represents regions assessed as hazardous during the E stage and deemed impassable. For the Remake category, blue signifies areas deemed problem-free due to low risk at the E stage. Green denotes areas considered passable due to low traversal difficulty, and red indicates areas deemed impassable due to high traversal difficulty. Additionally, Figure 22 and Figure 23 illustrate the uncertainty associated with each grid ( I , J ) . In these figures, the heat map transitions from green to yellow and then to red as the level of uncertainty increases. The uncertainty levels H ( I , J ) for each grid ( I , J ) are derived using Equation (12) in Section 4.3.3. In Figure 22, the drone’s exploration transforms the map from (a) to (b), prioritizing the reduction of H ( I , J ) in the ROI as shown in Table 3. This demonstrates that the drone’s exploration effectively contributes to reducing H ( I , J ) . Similarly, in Figure 23, the drone’s initial exploration transforms the map from (a) to (b). Upon requesting additional exploration, the map further transitions from (b) to (c). This progression also highlights the prioritization of reducing H ( I , J ) within the ROI, as shown in Table 3. This iterative process reduces the uncertainty in the ROI, as highlighted in Table 3 while addressing newly identified high-uncertainty areas during re-exploration. Furthermore, in the results shown in Table 4, a point with T = 80 % and T = 85 % was identified in the experiment involving an alternative path, necessitating the generation of an alternative path. These experiments confirmed that the ground robot could appropriately select paths based on risk assessments provided by the drone. This finding is significant because it highlights the system’s ability to adapt to high-risk situations by leveraging drone-collected data, ensuring that the robot avoids potentially hazardous areas while maintaining operational efficiency.
The implementation of BTs facilitated efficient information exchange between the drone and the ground robot, ensuring successful cooperative behavior within the experimental environment. This demonstrates the practical utility of BTs in multi-robot systems, providing a scalable and robust framework for dynamic decision-making in collaborative tasks. Additionally, the effectiveness of detouring when T exceeds 70% was verified, demonstrating the system’s practicality. In terms of scalability, the proposed approach is inherently flexible and can be adapted to address varying levels of uncertainty and dynamic changes in the environment. This is particularly important in real-world scenarios where operational environments often scale in size and complexity, requiring adaptive and modular solutions to maintain system effectiveness. As the scale of the environment increases, hierarchical structures or decentralized frameworks could be introduced to manage a larger number of robots and more complex ROI. The integration of additional drones or ground robots would allow the system to distribute tasks efficiently, maintaining its effectiveness in reducing uncertainty and ensuring traversability even in large-scale and heterogeneous environments. Future work will focus on implementing and validating these extensions to ensure the robustness of the system in real-world applications.

6. Conclusions and Future Work

This study proposes a novel approach that enables robots to efficiently perform tasks and naturally cooperate with one another. Compared to previous studies [9], the proposed system allows robots to prioritize tasks, conduct exploration and mapping, and implement mutual interaction for effective communication and information sharing. This capability enables real-time monitoring and rapid response, even in unpredictable environments. Through decentralized cooperation, each robot autonomously performs tasks, while complementary cooperation enhances role-sharing and information exchange, improving the overall efficiency and flexibility of the system. By selectively exploring areas of interest based on ground robots’ requests and optimizing flight paths through dynamic planning algorithms, unnecessary energy consumption can be minimized. This approach focuses on reducing battery usage by improving system efficiency, enabling extended operational time and enhancing the sustainability of large-scale missions.
A critical challenge for future development is improving the system’s scalability. This involves optimizing algorithms to enable coordination among three or more robots and strengthening communication infrastructure. Enhancing interoperability between different types of robots is also essential, including standardizing communication protocols and improving data exchange efficiency across diverse platforms. These improvements will enhance the system’s flexibility and adaptability by facilitating efficient communication and information sharing.
The extension of the proposed system to incorporate multiple drones and ground unmanned vehicles (UGVs) presents an opportunity to demonstrate its practicality in more complex scenarios. By leveraging a dynamic information-sharing mechanism and distributed planning architecture, the system supports scalable coordination among heterogeneous robots. For instance, multiple drones can simultaneously explore different areas, updating the global map with high-resolution data, while UGVs focus on path planning and task execution. This framework is well-suited to large-scale missions, such as disaster response or industrial operations, where a single robot pair would be insufficient.
Enhancing the self-learning capabilities of robots is a critical aspect of improving their overall performance. By integrating reinforcement learning algorithms and automating data collection and analysis, robots can dynamically adapt to their environments, thereby increasing task efficiency. In addition to optimizing energy consumption and advancing resource management at the system level, innovative strategies leveraging ground robots can also be considered. For instance, ground robots can serve as temporary rest platforms, allowing drones to land and conserve battery power during operations. Such collaborative approaches not only extend operational time but also enhance the sustainability and efficiency of large-scale missions. These improvements are expected to significantly increase mission success rates and ensure reliability in diverse and challenging environments.
Future research should focus on validating the system’s scalability through simulations and real-world experiments involving multiple drones and UGVs. Key areas of investigation include assessing communication delays, optimizing task allocation strategies, and evaluating system performance under dynamic and uncertain conditions. These efforts will provide valuable insights into the feasibility and reliability of deploying such a system in large-scale, real-world applications.

Author Contributions

Conceptualization, H.K. and K.S.; methodology, H.K.; software, H.K.; validation, H.K. and K.S.; format analysis, H.K. and K.S.; investigation, H.K.; writing-original draft preparation H.K. and K.S.; write-review and editing, H.K. and K.S.; visualization, H.K.; supervision, K.S. All authors have read and agreed to the published version of the manuscript.

Funding

This research received no external funding.

Institutional Review Board Statement

Not applicable.

Informed Consent Statement

Not applicable.

Data Availability Statement

The data presented in this study are available on request from the corresponding author.

Conflicts of Interest

The authors declare no conflicts of interest.

References

  1. Ding, Y.; Xin, B.; Chen, J. A Review of Recent Advances in Coordination Between Unmanned Aerial and Ground Vehicles. Unmanned Syst. 2021, 9, 97–117. [Google Scholar] [CrossRef]
  2. Cheng, C.; Li, X.; Xie, L.; Li, L. A Unmanned Aerial Vehicle (UAV)/Unmanned Ground Vehicle (UGV) Dynamic Autonomous Docking Scheme in GPS-Denied Environments. Drones 2023, 7, 613. [Google Scholar] [CrossRef]
  3. Ivancevic, V.; Yue, Y. Hamiltonian dynamics and control of a joint autonomous land–air operation. Nonlinear Dyn. 2016, 84, 1853–1865. [Google Scholar] [CrossRef]
  4. Moon, J.; Lee, B.-H. PDDL Planning with Natural Language-Based Scene Understanding for UAV-UGV Cooperation. Appl. Sci. 2019, 9, 3789. [Google Scholar] [CrossRef]
  5. Gao, W.; Luo, J.; Zhang, W.; Yuan, W.; Liao, Z. Commanding Cooperative UGV-UAV with Nested Vehicle Routing for Emergency Resource Delivery. IEEE Access 2020, 8, 215691–215704. [Google Scholar] [CrossRef]
  6. He, J.; Zhou, Y.; Huang, L.; Kong, Y.; Cheng, H. Ground and Aerial Collaborative Mapping in Urban Environments. IEEE Robot. Autom. Lett. 2021, 6, 95–102. [Google Scholar] [CrossRef]
  7. Ramezani, M.; Amiri Atashgah, M.A.; Rezaee, A. A Fault-Tolerant Multi-Agent Reinforcement Learning Framework for Unmanned Aerial Vehicles–Unmanned Ground Vehicle Coverage Path Planning. Drones 2024, 8, 537. [Google Scholar] [CrossRef]
  8. Stolfi, D.H.; Brust, M.R.; Danoy, G.; Bouvry, P. UAV-UGV-UMV Multi-Swarms for Cooperative Surveillance. Front. Robot. AI 2021, 8, 616950. [Google Scholar] [CrossRef] [PubMed] [PubMed Central]
  9. Kobori, H.; Sekiyama, K. Cooperative System of Ground Robots based on dynamic exploration of Drone Occupancy Grid Maps. In Proceedings of the 2023 62nd Annual Conference of the Society of Instrument and Control Engineers (SICE), Tsu, Japan, 6–9 September 2023; pp. 1074–1079. [Google Scholar] [CrossRef]
  10. Queralta, J.P.; Taipalmaa, J.; Pullinen, B.C.; Sarker, V.K.; Gia, T.N.; Tenhunen, H.; Gabbouj, M.; Raitoharju, J.; Westerlund, T. Collaborative Multi-Robot Search and Rescue: Planning, Coordination, Perception, and Active Vision. IEEE Access 2020, 8, 191617–191643. [Google Scholar] [CrossRef]
  11. Chen, S.; O’Brien, M.J.; Talbot, F.; Williams, J.; Tidd, B.; Pitt, A.; Arkin, R.C. Multi-modal User Interface for Multi-robot Control in Underground Environments. In Proceedings of the 2022 IEEE/RSJ International Conference on Intelligent Robots and Systems (IROS), Kyoto, Japan, 23–27 October 2022; pp. 9995–10002. [Google Scholar] [CrossRef]
  12. Dufek, J.; Xiao, X.; Murphy, R.R. Best Viewpoints for External Robots or Sensors Assisting Other Robots. IEEE Trans. Hum. Mach. Syst. 2021, 51, 324–334. [Google Scholar] [CrossRef]
  13. Minaeian, S.; Liu, J.; Son, Y.-J. Vision-Based Target Detection and Localization via a Team of Cooperative UAV and UGVs. IEEE Trans. Syst. Man Cybern. Syst. 2016, 46, 100-5-1016. [Google Scholar] [CrossRef]
  14. Elmakis, O.; Shaked, T.; Degani, A. Vision-Based UAV-UGV Collaboration for Autonomous Construction Site Preparation. IEEE Access 2022, 10, 51209–51220. [Google Scholar] [CrossRef]
  15. Miller, I.D.; Cladera, F.; Smith, T.; Taylor, C.J.; Kumar, V. Stronger Together: Air-Ground Robotic Collaboration Using Semantics. IEEE Robot. Autom. Lett. 2022, 7, 9643–9650. [Google Scholar] [CrossRef]
  16. Yang, Q.; Parasuraman, R. Needs-driven Heterogeneous Multi-Robot Cooperation in Rescue Missions. In Proceedings of the 2020 IEEE International Symposium on Safety, Security, and Rescue Robotics (SSRR), Abu Dhabi, United Arab Emirates, 4–6 November 2020; pp. 252–259. [Google Scholar] [CrossRef]
  17. Moreira, M.S.M.; Villa, D.K.D.; Sarcinelli-Filho, M. Controlling a Virtual Structure Involving a UAV and a UGV for Warehouse Inventory. J. Intell. Robot. Syst. 2024, 110, 121. [Google Scholar] [CrossRef]
  18. Blum, A.L.; Furst, M.L. Fast planning through planning graph analysis. Artif. Intell. 1997, 90, 281–300. [Google Scholar] [CrossRef]
  19. Chu, F.-J.; Xu, R.; Seguin, L.; Vela, P.A. Toward Affordance Detection and Ranking on Novel Objects for Real-World Robotic Manipulation. IEEE Robot. Autom. Lett. 2019, 4, 4070–4077. [Google Scholar] [CrossRef]
  20. Colledanchise, M.; Ögren, P. Behavior Trees in Robotics and AI: An Introduction; CRC Press: Boca Raton, FL, USA, 2018; pp. 93–126. [Google Scholar]
  21. Brooks, R. A robust layered control system for a mobile robot. IEEE J. Robot. Autom. 1986, 2, 14–23. [Google Scholar] [CrossRef]
  22. Nils, J.N. Teleo-reactive programs for agent control. JAIR 1994, 1, 139–158. [Google Scholar]
  23. Iovino, M.; Scukins, E.; Styrud, J.; Ögren, P.; Smith, C. A survey of Behavior Trees in robotics and AI. Robot. Auton. Syst. 2022, 154, 104096. [Google Scholar] [CrossRef]
  24. Bernardo, R.; Sousa, J.M.C.; Botto, M.A.; Gonçalves, P.J.S. A Novel Control Architecture Based on Behavior Trees for an Omni-Directional Mobile Robot. Robotics 2023, 12, 170. [Google Scholar] [CrossRef]
  25. Colledanchise, M.; Almeida, D.; Ögren, P. Towards Blended Reactive Planning and Acting using Behavior Trees. In Proceedings of the 2019 International Conference on Robotics and Automation (ICRA), Montreal, QC, Canada, 20–24 May 2019; pp. 8839–8845. [Google Scholar] [CrossRef]
  26. Macenski, S.; Martín, F.; White, R.; Clavero, J.G. The Marathon 2: A Navigation System. In Proceedings of the 2020 IEEE/RSJ International Conference on Intelligent Robots and Systems (IROS), Las Vegas, NV, USA, 25–29 October 2020; pp. 2718–2725. [Google Scholar] [CrossRef]
  27. Venkata, S.S.O.; Parasuraman, R.; Pidaparti, R. KT-BT: A Framework for Knowledge Transfer Through Behavior Trees in Multirobot Systems. IEEE Trans. Robot. 2023, 39, 4114–4130. [Google Scholar] [CrossRef]
  28. Campos, C.; Elvira, R.; Rodríguez, J.J.G.; Montiel, J.M.M.; Tardós, J.D. ORB-SLAM3: An Accurate Open-Source Library for Visual, Visual–Inertial, and Multimap SLAM. IEEE Trans. Robot. 2021, 37, 1874–1890. [Google Scholar] [CrossRef]
  29. Emambocus, B.A.S.; Jasser, M.B.; Hamzah, M.; Mustapha, A.; Amphawan, A. An Enhanced Swap Sequence-Based Particle Swarm Optimization Algorithm to Solve TSP. IEEE Access 2021, 9, 164820–164836. [Google Scholar] [CrossRef]
  30. Zhou, A.-H.; Zhu, L.-P.; Hu, B.; Deng, S.; Song, Y.; Qiu, H.; Pan, S. Traveling-Salesman-Problem Algorithm Based on Simulated Annealing and Gene-Expression Programming. Information 2019, 10, 7. [Google Scholar] [CrossRef]
Figure 1. System architecture for drone and ground robot collaboration.
Drones 09 00095 g001
Figure 2. Action planner framework for symbolic task planning and BT execution.
Drones 09 00095 g002
Figure 3. The experimental process: (a) Initial state where the ground robot starts path planning through unknown territory. (b) Collaborative task between the ground robot and drone, where the drone explores unknown areas and reveals high-risk portions. (c) Ground robots decide between approaching a high-risk area or choosing a safer alternative path based on the information provided by the drone.
Drones 09 00095 g003
Figure 4. Flowchart for coordination process between ground robot and drone for collaborative task execution.
Drones 09 00095 g004
Figure 5. The growth of the BT: As shown in (ad), the BT continues to grow until a feasible task is found. This example illustrates a scenario where the task can be executed independently by a single robot without requiring task requests from other robots.
Drones 09 00095 g005
Figure 6. Feature point extraction and map generation by ORB-SLAM: (a) Feature point extraction and map generation by ORB-SLAM using a monocular camera on a drone. (b) The drone created an occupancy grid map based on feature point extraction using ORB-SLAM.
Drones 09 00095 g006
Figure 7. Relationship between ground robot and drone grids, illustrating the ROI in yellow. The ground robot grid is subdivided into 1 m × 1 m cells, highlighting the generated path areas.
Drones 09 00095 g007
Figure 8. The environments used for performance validation with the evaluation function (Equation (11)) are presented: (a) An environment without obstacles, where the initial validation was conducted. (b) An environment with obstacles, where the drone determined the path was impassable during exploration.
Drones 09 00095 g008
Figure 9. The ROI, interest levels, and the drone’s path corresponding to the initial path generated by the ground robot: (a) The initial path generated by the ground robot and its associated ROI. (b) The path generated by the drone is based on the ground robot’s ROI, along with the interest levels at those locations.
Drones 09 00095 g009
Figure 10. The ROI, interest levels, and the drone’s path following its exploration in the environment depicted in Figure 8a: (a) The path generated by the ground robot and the ROI after the drone’s exploration. (b) The path generated by the drone is based on the ground robot’s ROI, along with the interest levels at those locations.
Drones 09 00095 g010
Figure 11. The ROI, interest levels, and the drone’s path following its exploration in the environment depicted in Figure 8b: (a) The path generated by the ground robot and the ROI after the drone’s exploration. (b) The path generated by the drone is based on the ground robot’s ROI, along with the interest levels at those locations.
Drones 09 00095 g011
Figure 12. Representation of path generation for ground robots and risk assessment by drones, including the sampling points for each cell, the normal distribution for the path, obstacles, and the distribution duplication factor.
Drones 09 00095 g012
Figure 13. Image on passability evaluation of ground robot based on drone risk assessment.
Drones 09 00095 g013
Figure 14. The experimental environment.
Drones 09 00095 g014
Figure 15. The results of task requests in Experiment 1: (a) The initial path generated by the ground robot and its ROI. (b) A third-person perspective when the ground robot makes a task request. (c) The behavior of the BT when the ground robot issues a task request. (d) The exploration path generated by the drone is based on the region of interest from the ground robot and the interest levels of the exploration area.
Drones 09 00095 g015
Figure 16. The results of the drone exploration in Experiment 1: (a) The path and ROI during the drone’s exploration. (b) A third-person perspective during the drone’s exploration. (c) The behavior of the BT as the ground robot, in coordination with the drone’s shared information, assesses the passability of areas identified as high-risk by the drone.
Drones 09 00095 g016
Figure 17. The results of the ground robot’s task completion in Experiment 1: (a) The map at the time of the ground robot’s completed exploration. (b) A third-person perspective at the time of the ground robot’s completed exploration. (c) The behavior of the BT at the moment the ground robot completes its exploration and the drone completes its task, initiating the landing sequence.
Drones 09 00095 g017
Figure 18. The results of task requests in Experiment 2: (a) The initial path generated by the ground robot and its ROI. (b) A third-person perspective when the ground robot makes a task request. (c) The behavior of the BT when the ground robot issues a task request. (d) The exploration path generated by the drone is based on the region of interest from the ground robot and the interest levels of the exploration area.
Drones 09 00095 g018
Figure 19. The results of the drone exploration in Experiment 2: (a) The path and ROI during the drone’s exploration. (b) A third-person perspective during the drone’s exploration. (c) The behavior of the BT as the ground robot, in coordination with the drone’s shared information, assesses the passability of areas identified as high-risk by the drone.
Drones 09 00095 g019
Figure 20. The results of the ground robot’s generation of alternative paths for Experiment 2: (a) The path and ROI when the ground robot generated the alternative path. (b) A third-person perspective during the generation of the alternative path by the ground robot. (c) The behavior of the BT when the ground robot generated an alternative path and requested the drone to reassess its safety.
Drones 09 00095 g020
Figure 21. The results of the ground robot’s task completion in Experiment 2: (a) The map at the time of the ground robot’s completed exploration. (b) A third-person perspective at the time of the ground robot’s completed exploration. (c) The behavior of the BT at the moment the ground robot completes its exploration and the drone completes its task, initiating the landing sequence.
Drones 09 00095 g021
Figure 22. Distribution of H ( I , J ) when dividing the map in Experiment 1 into 1 m × 1 m grids: (a) Distribution of uncertainty in Figure 15. (b) Distribution of uncertainty after drone exploration in Figure 16.
Drones 09 00095 g022
Figure 23. Distribution of H ( I , J ) when dividing the map in Experiment 2 into 1 m × 1 m grids: (a) Distribution of uncertainty in Figure 18. (b) Distribution of uncertainty after drone exploration in Figure 19. (c) Distribution of uncertainty after drone re-exploration in Figure 20.
Drones 09 00095 g023
Table 1. Comparison of cooperation approaches.
ReferenceCooperation TypeTask Request Directionality
Queralta et al. [10]PlannedUnidirectional
Elmakis et al. [14]PlannedUnidirectional
Yang et al. [16]Needs-driven flexibleUnidirectional
Own Previous Research [9]Needs-driven flexibleUnidirectional
Proposed MethodNeeds-driven flexibleBidirectional
Table 2. Parameters for TSP-GA.
ParameterValue
Population Size100
Crossover Rate0.8
Mutation Rate0.05
Number of Generations50
Selection MethodTournament Selection
Crossover MethodPartially Mapped Crossover
Mutation MethodSwap Mutation
Table 3. Experimental data on the ROI of ground robots.
Path TypeDrone Exploration Stage R ( x , y ) Change in ROI
Straight Path1st 1.0 < x < 2.0 3.0 0.2
1.0 < y < 2.0
1.0 < x < 2.0 3.0 1.0
2.0 < y < 3.0
Alternative Path1st 1.0 < x < 2.0 3.7 0.7
1.0 < y < 2.0
1.0 < x < 2.0 3.0 0.0
2.0 < y < 3.0
2nd 1.0 < x < 2.0 3.0 0.0
2.0 < y < 3.0
Table 4. Experimental data on risk assessment by drones and passability challenges for ground robots.
Path TypeDrone Exploration StageHigh-Risk Position ( x , y ) ETRemark
Straight Path1st(1.4, −1.5)0.137NoneNo Issues
(1.2, −1.5)0.15745Passable
(1.0, −1.5)0.15552Passable
(0.8, −1.4)0.15248Passable
(0.6, −1.6)0.15448Passable
(0.4, −1.6)0.142NoneNo Issues
Alternative Path1st(1.4, −1.6)0.147NoneNo Issues
(1.2, −1.6)0.15545Passable
(1.0, −1.4)0.16185Impassable
(0.8, −1.4)0.15780Impassable
(0.6, −1.6)0.15665Passable
(0.4, −1.6)0.142NoneNo Issues
2nd(1.4, −3.8)0.129NoneNo Issues
(1.2, −3.8)0.132NoneNo Issues
(1.0, −3.8)0.136NoneNo Issues
(0.8, −3.8)0.134NoneNo Issues
(0.6, −3.6)0.131NoneNo Issues
(0.4, −3.4)0.124NoneNo Issues
Disclaimer/Publisher’s Note: The statements, opinions and data contained in all publications are solely those of the individual author(s) and contributor(s) and not of MDPI and/or the editor(s). MDPI and/or the editor(s) disclaim responsibility for any injury to people or property resulting from any ideas, methods, instructions or products referred to in the content.

