Article

AUP-DETR: A Foundational UAV Object Detection Framework for Enabling the Low-Altitude Economy

1
School of Computer Science and Technology, Hainan University, Haikou 570228, China
2
Hangda Hanlai (Tianjin) Aviation Technology Co., Ltd., Tianjin 300300, China
*
Author to whom correspondence should be addressed.
Drones 2025, 9(12), 822; https://doi.org/10.3390/drones9120822
Submission received: 27 September 2025 / Revised: 24 November 2025 / Accepted: 25 November 2025 / Published: 27 November 2025

Highlights

What are the main findings?
  • We propose AUP-DETR, a novel end-to-end detection framework for UAVs, whose specialized modules for multi-scale feature fusion and global context modeling achieve a 4.41% mAP50 improvement over the baseline on the UCA-Det dataset.
  • We constructed the UCA-Det dataset, a new large-scale dataset specifically for UAV perception in complex urban port environments, filling a gap left by existing datasets that lack land–sea mixed scenes, extreme scale variations, and dense object distributions.
What are the implications of the main findings?
  • This work provides a robust and efficient perception solution that is critical for enabling UAV autonomy in challenging real-world applications, such as automated logistics and intelligent infrastructure inspection within the low-altitude economy.
  • Our research, including both the high-performance AUP-DETR model and the UCA-Det dataset, establishes a new challenging dataset that can facilitate and empower future academic and applied research in perception for complex low-altitude environments.

Abstract

The ascent of the low-altitude economy underscores the critical need for autonomous perception in Unmanned Aerial Vehicles (UAVs), particularly within complex environments such as urban ports. However, existing object detection models often perform poorly when dealing with land–sea mixed scenes, extreme scale variations, and dense object distributions from a UAV’s aerial perspective. To address this challenge, we propose AUP-DETR, a novel end-to-end object detection framework for UAVs. This framework, built upon an efficient DETR architecture, features the innovative Fusion with Streamlined Hybrid Core (Fusion-SHC) module. This module effectively fuses low-level spatial details with high-level semantics to strengthen the representation of small aerial objects. Additionally, a Synergistic Spatial Context Fusion (SSCF) module adaptively integrates multi-scale features to generate rich and unified representations for the detection head. Moreover, the proposed Spatial Agent Transformer (SAT) efficiently models global context and long-range dependencies to distinguish heterogeneous objects in complex scenes. To advance related research, we have constructed the Urban Coastal Aerial Detection (UCA-Det) dataset, which is specifically designed for urban port environments. Extensive experiments on our UCA-Det dataset show that AUP-DETR outperforms the YOLO series and other advanced DETR-based models. Our model achieves an mAP50 of 69.68%, representing a 4.41% improvement over the baseline. Furthermore, experiments on the public VisDrone dataset validate its excellent generalization capability and efficiency. This research delivers a robust solution and establishes a new dataset for precise UAV perception in low-altitude economy scenarios.

1. Introduction

As a product of the deep integration between digital technologies and aviation advancements, the low-altitude economy is rapidly emerging worldwide [1]. This emerging economic model leverages low-altitude airspace to enable diverse applications through aircraft such as UAVs. It has already demonstrated significant social and commercial value. Its application landscape is extensive, spanning multiple frontier domains, including automated logistics to transform urban supply chains and Urban Air Mobility (UAM) to alleviate ground traffic congestion. Another key area is the intelligent inspection of critical infrastructure such as bridges and power lines [2,3]. In these transformative applications, UAVs are recognized as the primary carriers that activate the low-altitude economy and fulfill its core functions [4]. While this vision is compelling, its realization requires overcoming formidable technical challenges in real-world applications. Ensuring high levels of autonomy and safe operation of UAVs is the fundamental prerequisite for the large-scale deployment of such applications.
The realization of UAV autonomy and safe operation is critically dependent on its ability to perceive the operational environment with high precision and robustness [5]. To investigate and push the performance boundaries of existing perception methods, this paper focuses on urban ports as the research scenario. These ports pose an extreme challenge for the low-altitude economy. The unique operational complexities of ports impose stringent demands on current perception algorithms [6]. These demands are driven by critical use-cases such as automated port logistics, maritime safety patrols, and infrastructure security monitoring. These complexities include the land–sea mixed scenes, extreme scale variations, and dense object distributions. This context raises core scientific questions, namely whether current object detection models are sufficient for such extreme scenarios and what their fundamental algorithmic limitations might be [7].
Although general-purpose object detection, such as the You Only Look Once (YOLO) [8] and End-to-end Object Detection with Transformers (DETR) [9] series, has made significant progress, its performance degrades sharply when applied to UAV aerial perspectives. This is due to unique challenges like vast scale variations, poor rotational invariance, and missed detections of small objects [10]. To address these challenges, the academic community has introduced aerial datasets like VisDrone [11] and corresponding specialized models. However, these solutions mostly focus on relatively simple scenarios such as urban streets [12]. These studies do not adequately cover the unique traits of urban ports, such as land–sea mixed scenes, extreme scale variations, and dense object distributions. Consequently, there is a pressing need within the research field for an efficient perception model tailored to these complex low-altitude environments [13].
To fill the aforementioned research gap, this paper proposes AUP-DETR, a novel end-to-end perception framework designed for UAV perspectives in urban ports. The model is based on an efficient DETR architecture. Its core is a meticulously designed encoder that integrates several innovative modules. This architecture efficiently fuses multi-scale features and captures global contextual relationships. Consequently, the ability to understand small aerial objects and complex scenes is significantly improved. Furthermore, to advance related research, we have constructed the Urban Coastal Aerial Detection (UCA-Det) dataset. It serves as a new dataset tailored to the challenges of urban port environments. The main contributions of this paper are as follows:
  • We introduce the UCA-Det (Urban Coastal Aerial Detection) dataset. It is a large-scale new dataset designed for object detection in urban port environments from a UAV perspective. This dataset addresses the shortcomings of existing aerial datasets by providing numerous images that feature unique land–sea mixed scenes, extreme scale variations, and dense object distributions.
  • We propose AUP-DETR (Aerial Urban Port Detector). This framework is specifically designed to efficiently process high-resolution aerial images while maintaining high accuracy.
  • We designed the Fusion with Streamlined Hybrid Core (Fusion-SHC), a lightweight module. Its purpose is to significantly enhance small aerial object representation through the efficient fusion of low-level spatial details and high-level semantics.
  • We introduce the Synergistic Spatial Context Fusion (SSCF) module. It adaptively integrates features from all scales to generate an information-rich and highly unified representation for the final detection head.
  • We propose the Spatial Agent Transformer (SAT), which effectively models global context and long-range dependencies. This capability is crucial to distinguish heterogeneous targets, such as ships and vehicles, in complex scenes.

2. Related Works

2.1. General-Purpose Object Detection

The field of general-purpose object detection has evolved through two main paradigms: those based on CNNs and those based on Transformers. In the early stages, two-stage methods represented by Faster R-CNN [14] and one-stage methods of the YOLO series jointly defined the fundamental components of modern detectors. The former class prioritized high accuracy, while the latter excelled in inference speed. However, these approaches commonly relied on hand-crafted components, such as anchor boxes and non-maximum suppression (NMS), which require complex tuning [15].
A paradigm shift in detection was led by DETR. It reformulated object detection as a direct set prediction problem. This model achieved a concise end-to-end pipeline through a Transformer and bipartite matching. Nevertheless, the original DETR faced challenges such as slow convergence and poor performance on small objects. To address these issues, Zhu et al. [16] introduced a deformable attention mechanism, which significantly improved model efficiency and performance. Subsequent works, such as DETR with Improved DeNoising Anchor Boxes (DINO) [17], continued to push the performance boundaries of this family of models. Building on this, Zhao et al. [18] introduced a novel hybrid encoder. It achieved real-time detection for the DETR architecture for the first time, successfully closing the performance gap with the YOLO series. Recently, Zhang et al. [19] further applied this real-time architecture to aerial images and enhanced features by fusing multi-domain information. Although these models represent the technological frontier, they are not specifically optimized for the complex land–sea interaction scenarios of urban ports. This provides the motivation for the targeted architectural innovations proposed in this paper.

2.2. UAV Object Detection

UAV object detection (UAV-OD) faces a series of severe challenges distinct from general-purpose detection due to its unique imaging perspective [20]. A primary challenge is the vast object scale variation that results from drastic changes in flight altitude. Another issue involves numerous small objects that occupy a few pixels and are often densely distributed [21]. Additionally, the arbitrary orientation of objects from the top-down perspective [22] and motion blur during flight further increase detection difficulty. The academic community has proposed various solutions to address these challenges. To address scale and small object problems, researchers employ complex feature fusion strategies, such as Feature Pyramid Network (FPN) and its variant Path Aggregation Network (PANet) [23], to enhance multi-scale representation. Some studies have also explored the use of super-resolution [24] or specific data augmentation techniques, such as Copy-Paste [25], to improve small object visibility. To handle the issue of object orientation, rotated bounding box detectors have also been proposed [26]. Concurrently, some research began to leverage contextual information to aid recognition. Detection robustness is enhanced through models that capture the relationship between targets and their surroundings [27]. Li et al. [28] developed an occlusion-guided multi-task network (OGMN). This network introduces an occlusion localization task to guide object detection. This approach solves feature aliasing and local aggregation issues, which improves the detection of occluded targets in UAV images. Min et al. [29] developed a lightweight UAV object detection network named LWUAVDet. The network optimizes its feature fusion and prediction structures. As a result, it achieves a better balance between accuracy and inference speed on resource-constrained edge devices. Ye et al. [30] developed RTD-Net, a real-time network that combines CNN and Transformer structures. It is designed to enhance the detection of small and occluded objects in UAV vision while maintaining high operational efficiency.
The validation of these algorithms largely relies on mainstream aerial datasets such as VisDrone, UAVDT, and DOTA [31]. While these datasets have significantly advanced the field’s development, their scenarios primarily focus on urban streets, traffic intersections, or rural areas. They generally lack coverage of complex scenarios like urban ports. These environments feature a mix of land and sea with highly intertwined heterogeneous targets, such as ships and vehicles. Therefore, a pressing need remains for a model that can manage extreme scale variations, dense small objects, and complex contexts in port environments. This requirement highlights a gap in existing research.

3. Methods

3.1. Basic Components of AUP-DETR

We introduce AUP-DETR, a novel end-to-end framework, to address the challenges of object detection in dynamic urban ports from drone perspectives. Its overall architecture is presented in Figure 1. The framework uses a standard CNN backbone to extract multi-level feature maps ( S 2 S 5 )—referring to the feature pyramid levels (corresponding to strides 4, 8, 16, and 32), not multi-scale input augmentation—which capture initial object features at different scales. The core innovation lies in a meticulously designed encoder neck that synergistically processes these features. First, the highest-level feature map ( S 5 ) is sent to a SAT for refinement. This module efficiently models the global context and establishes long-range dependencies between distant objects, such as ships and vehicles. Subsequently, the architecture employs a top-down and bottom-up Encoder to progressively fuse features from various scales. We introduce the Fusion-SHC module to improve the detection of small-scale targets, such as pedestrians and small boats. This module integrates rich spatial details from low-level features ( S 2 , S 3 ) with mid-level semantic information from the pyramid. Ultimately, before entering the decoder, all multi-level features are directed to an SSCF module. It performs a final adaptive fusion to resolve spatial and scale conflicts, which creates a high-quality single feature representation. These comprehensively fused features are then passed to the decoder to generate the final detection results. This process enables robust and precise perception of targets across a wide range of scales, from large ships to small vehicles.

3.2. Fusion with Streamlined Hybrid Core (Fusion-SHC)

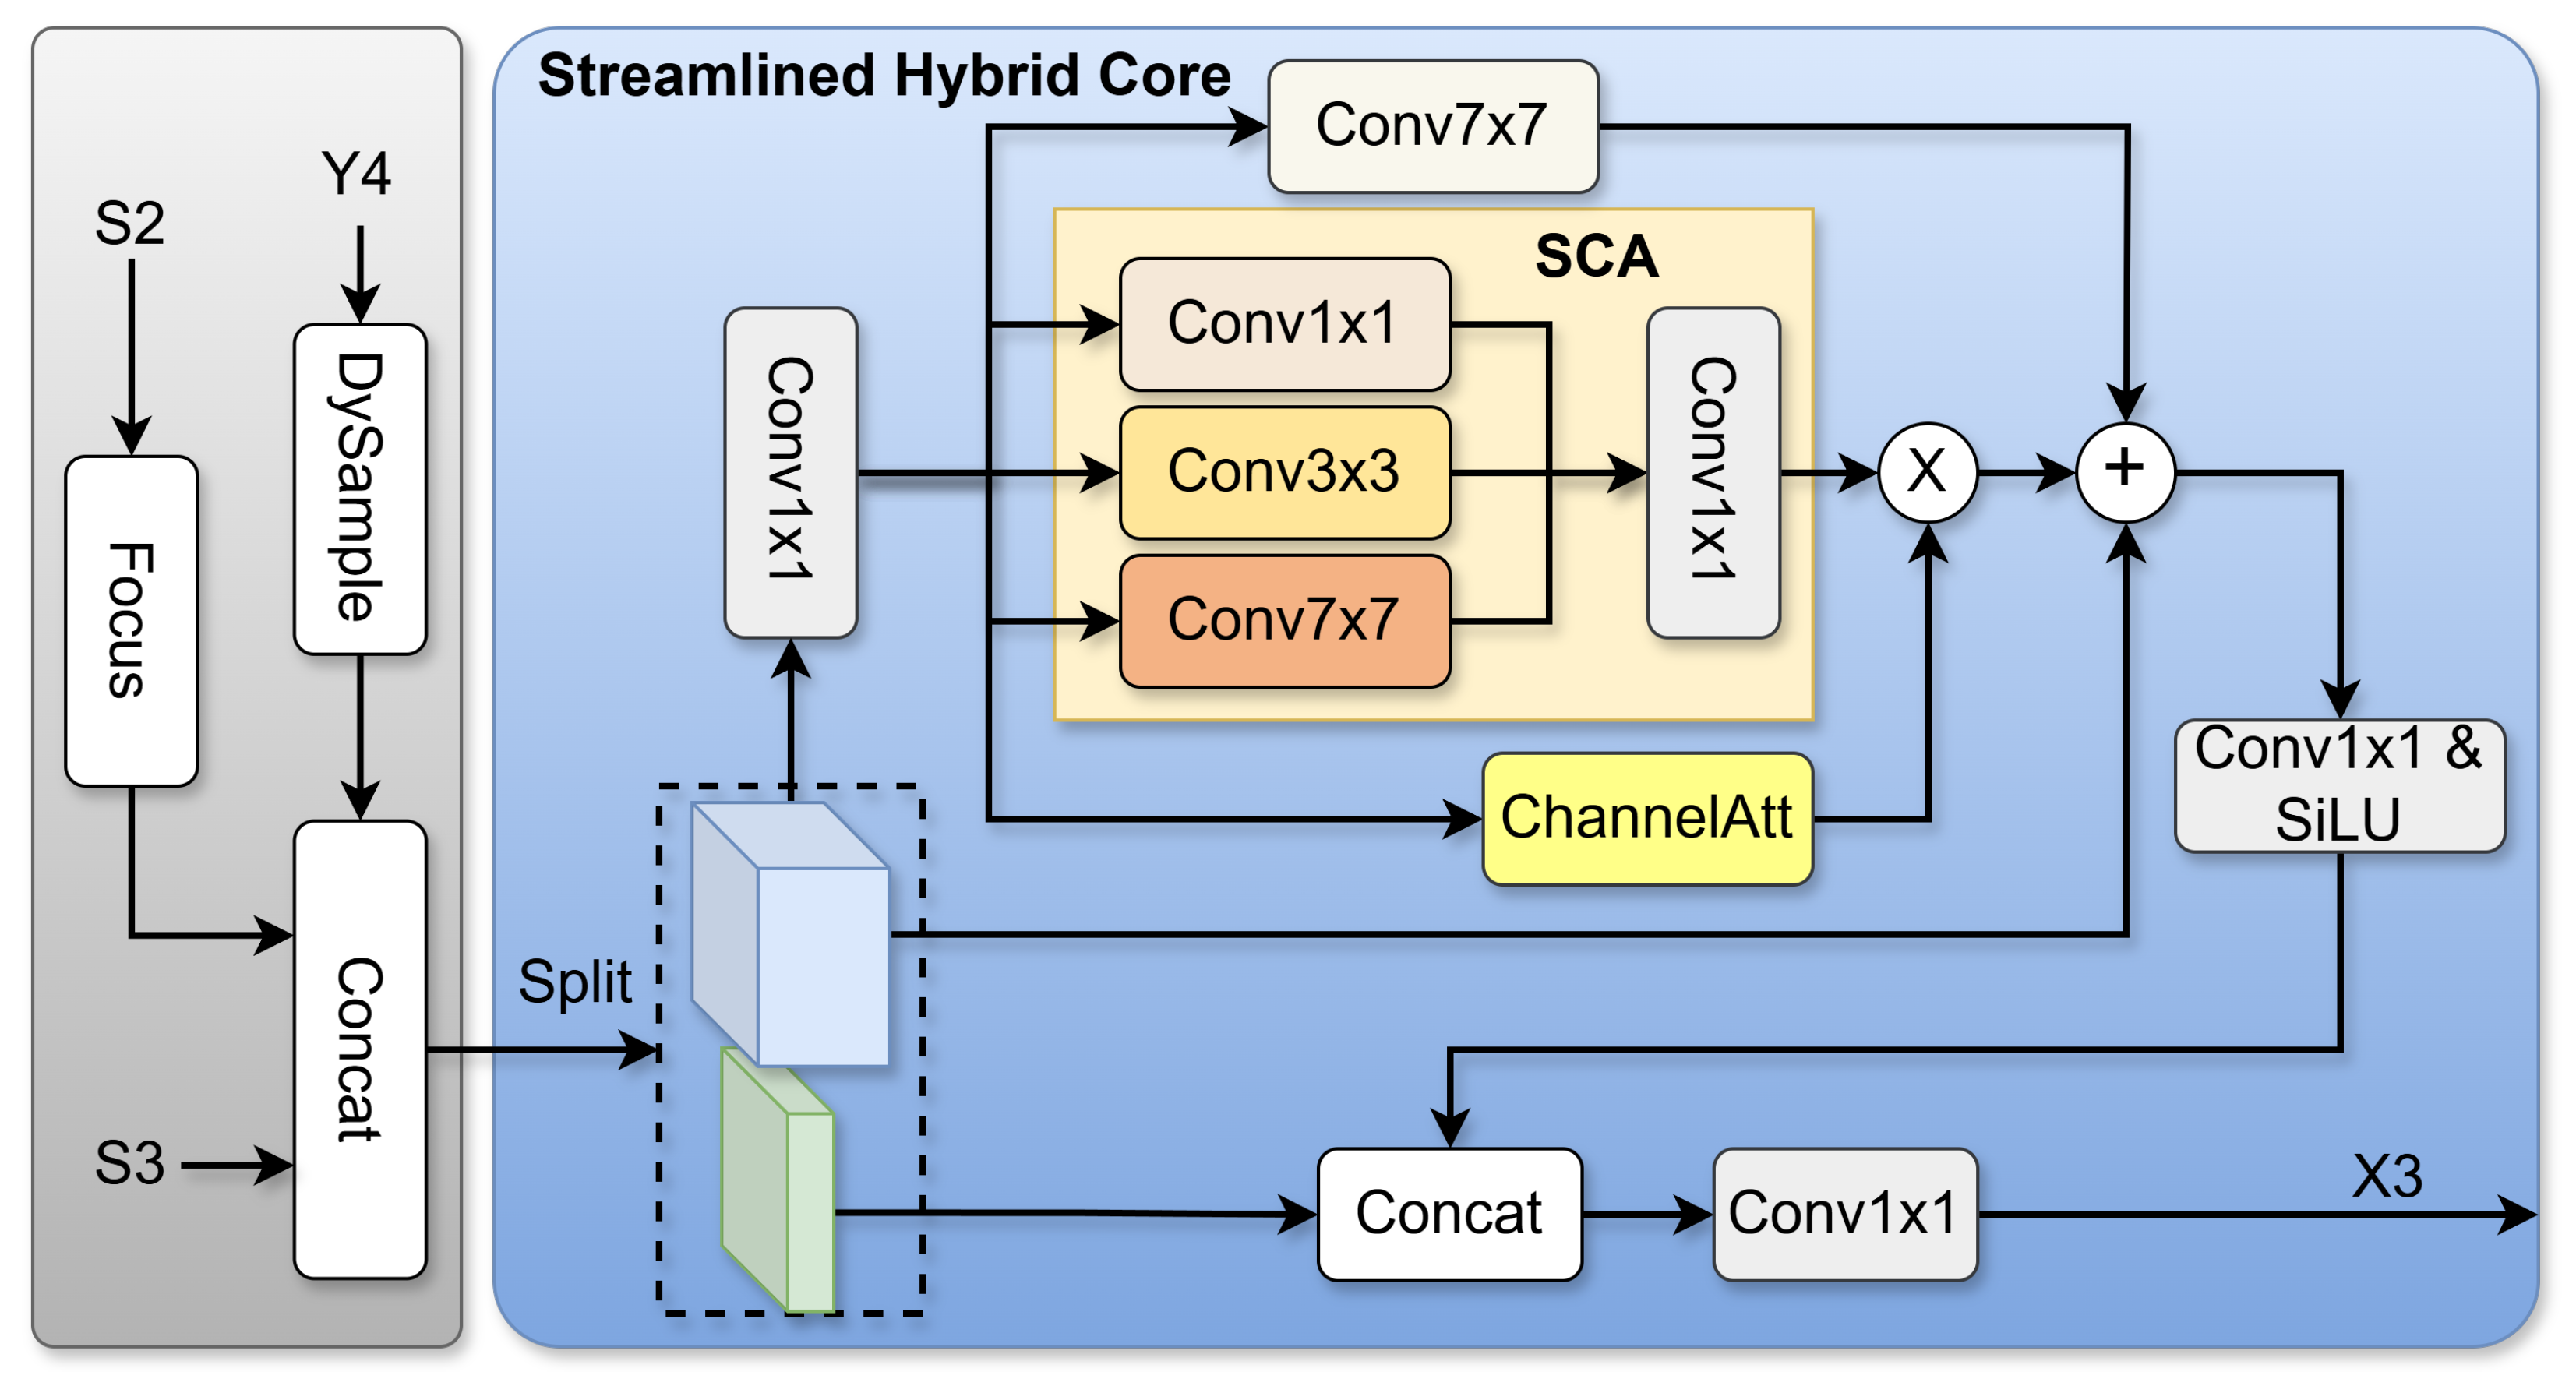
Detecting small-sized objects, such as pedestrians and cycles, in high-altitude aerial images is challenging. These objects often lack sufficient feature information for accurate identification. To address this challenge, we designed the Fusion-SHC module. Its core task is to efficiently fuse rich spatial details from low-level feature maps ( S 2 , S 3 ) with strong semantic information from high-level ones. This fusion enhances the model’s perception of small targets. As shown in Figure 2, the Fusion-SHC process begins with the aggregation of multi-source features. It gathers feature maps from the backbone’s S 2 and S 3 layers and an upsampled map from the preceding fusion stage ( Y 4 ). The feature map from S 2 is processed by a Focus layer to match the spatial dimensions. This aggregation process can be formulated as follows:
F i n = Concat ( Focus ( F S 2 ) , F S 3 , DySample ( F Y 4 ) ) ,
where F S 2 , F S 3 , and F Y 4 represent the feature maps from their corresponding stages. The DySample module, adopted from our baseline, is a dynamic sampler. It achieves upsampling by generating learnable offsets for a sampling grid, which is then applied to the input feature map using bilinear interpolation. This method inherently provides anti-aliasing (compared to nearest-neighbor) and is critical for precisely aligning features for tiny targets.
At the core of this fusion block is our proposed Streamlined Hybrid Core (SHC). It is a lightweight, high-performance module that operates entirely within the spatial domain. To achieve computational efficiency, the SHC adopts a channel-split design. The aggregated features, F i n , first undergo a projection. They are then split into two streams: a processing stream ( F p r o c ) and an identity stream ( F i d e n t ). Complex feature transformations are performed only on F p r o c , the stream with fewer channels. The identity stream, F i d e n t , is preserved without modification.
The processing stream, F p r o c , is fed into the SHC-Kernel. This kernel is a multi-branch structure designed for robust feature extraction. The kernel processes features synchronously through multiple parallel paths to obtain a comprehensive representation. A Spatial Multi-scale Aggregation (SCA) branch uses parallel 1 × 1 , 3 × 3 , and 7 × 7 convolutions to capture features at different spatial scales. Concurrently, a large-kernel enhancement path employs a 7 × 7 convolution ( F L K ) to expand the effective receptive field and capture broader context. To emphasize more informative features, the output of the SCA branch is recalibrated by a lightweight channel attention mechanism. This produces an attention-weighted feature map, F S C A = F S C A W c h , where W c h represents the learned channel weights. These diverse features are then fused with the kernel’s input via a residual connection. The output is defined by the following equation:
F k e r n e l = δ ( Identity + F L K + F S C A ) ,
where δ is the SiLU activation function, and Identity is the input feature to the kernel. Finally, the output of the processing stream is concatenated with the identity stream. A 1 × 1 convolution then fuses them to generate the module’s final output:
F o u t = Conv 1 × 1 ( Concat ( Conv 1 × 1 ( F k e r n e l ) , F i d e n t ) ) .
This purely spatial-domain design provides an efficient and powerful solution for multi-scale feature fusion.

3.3. Synergistic Spatial Context Fusion (SSCF)

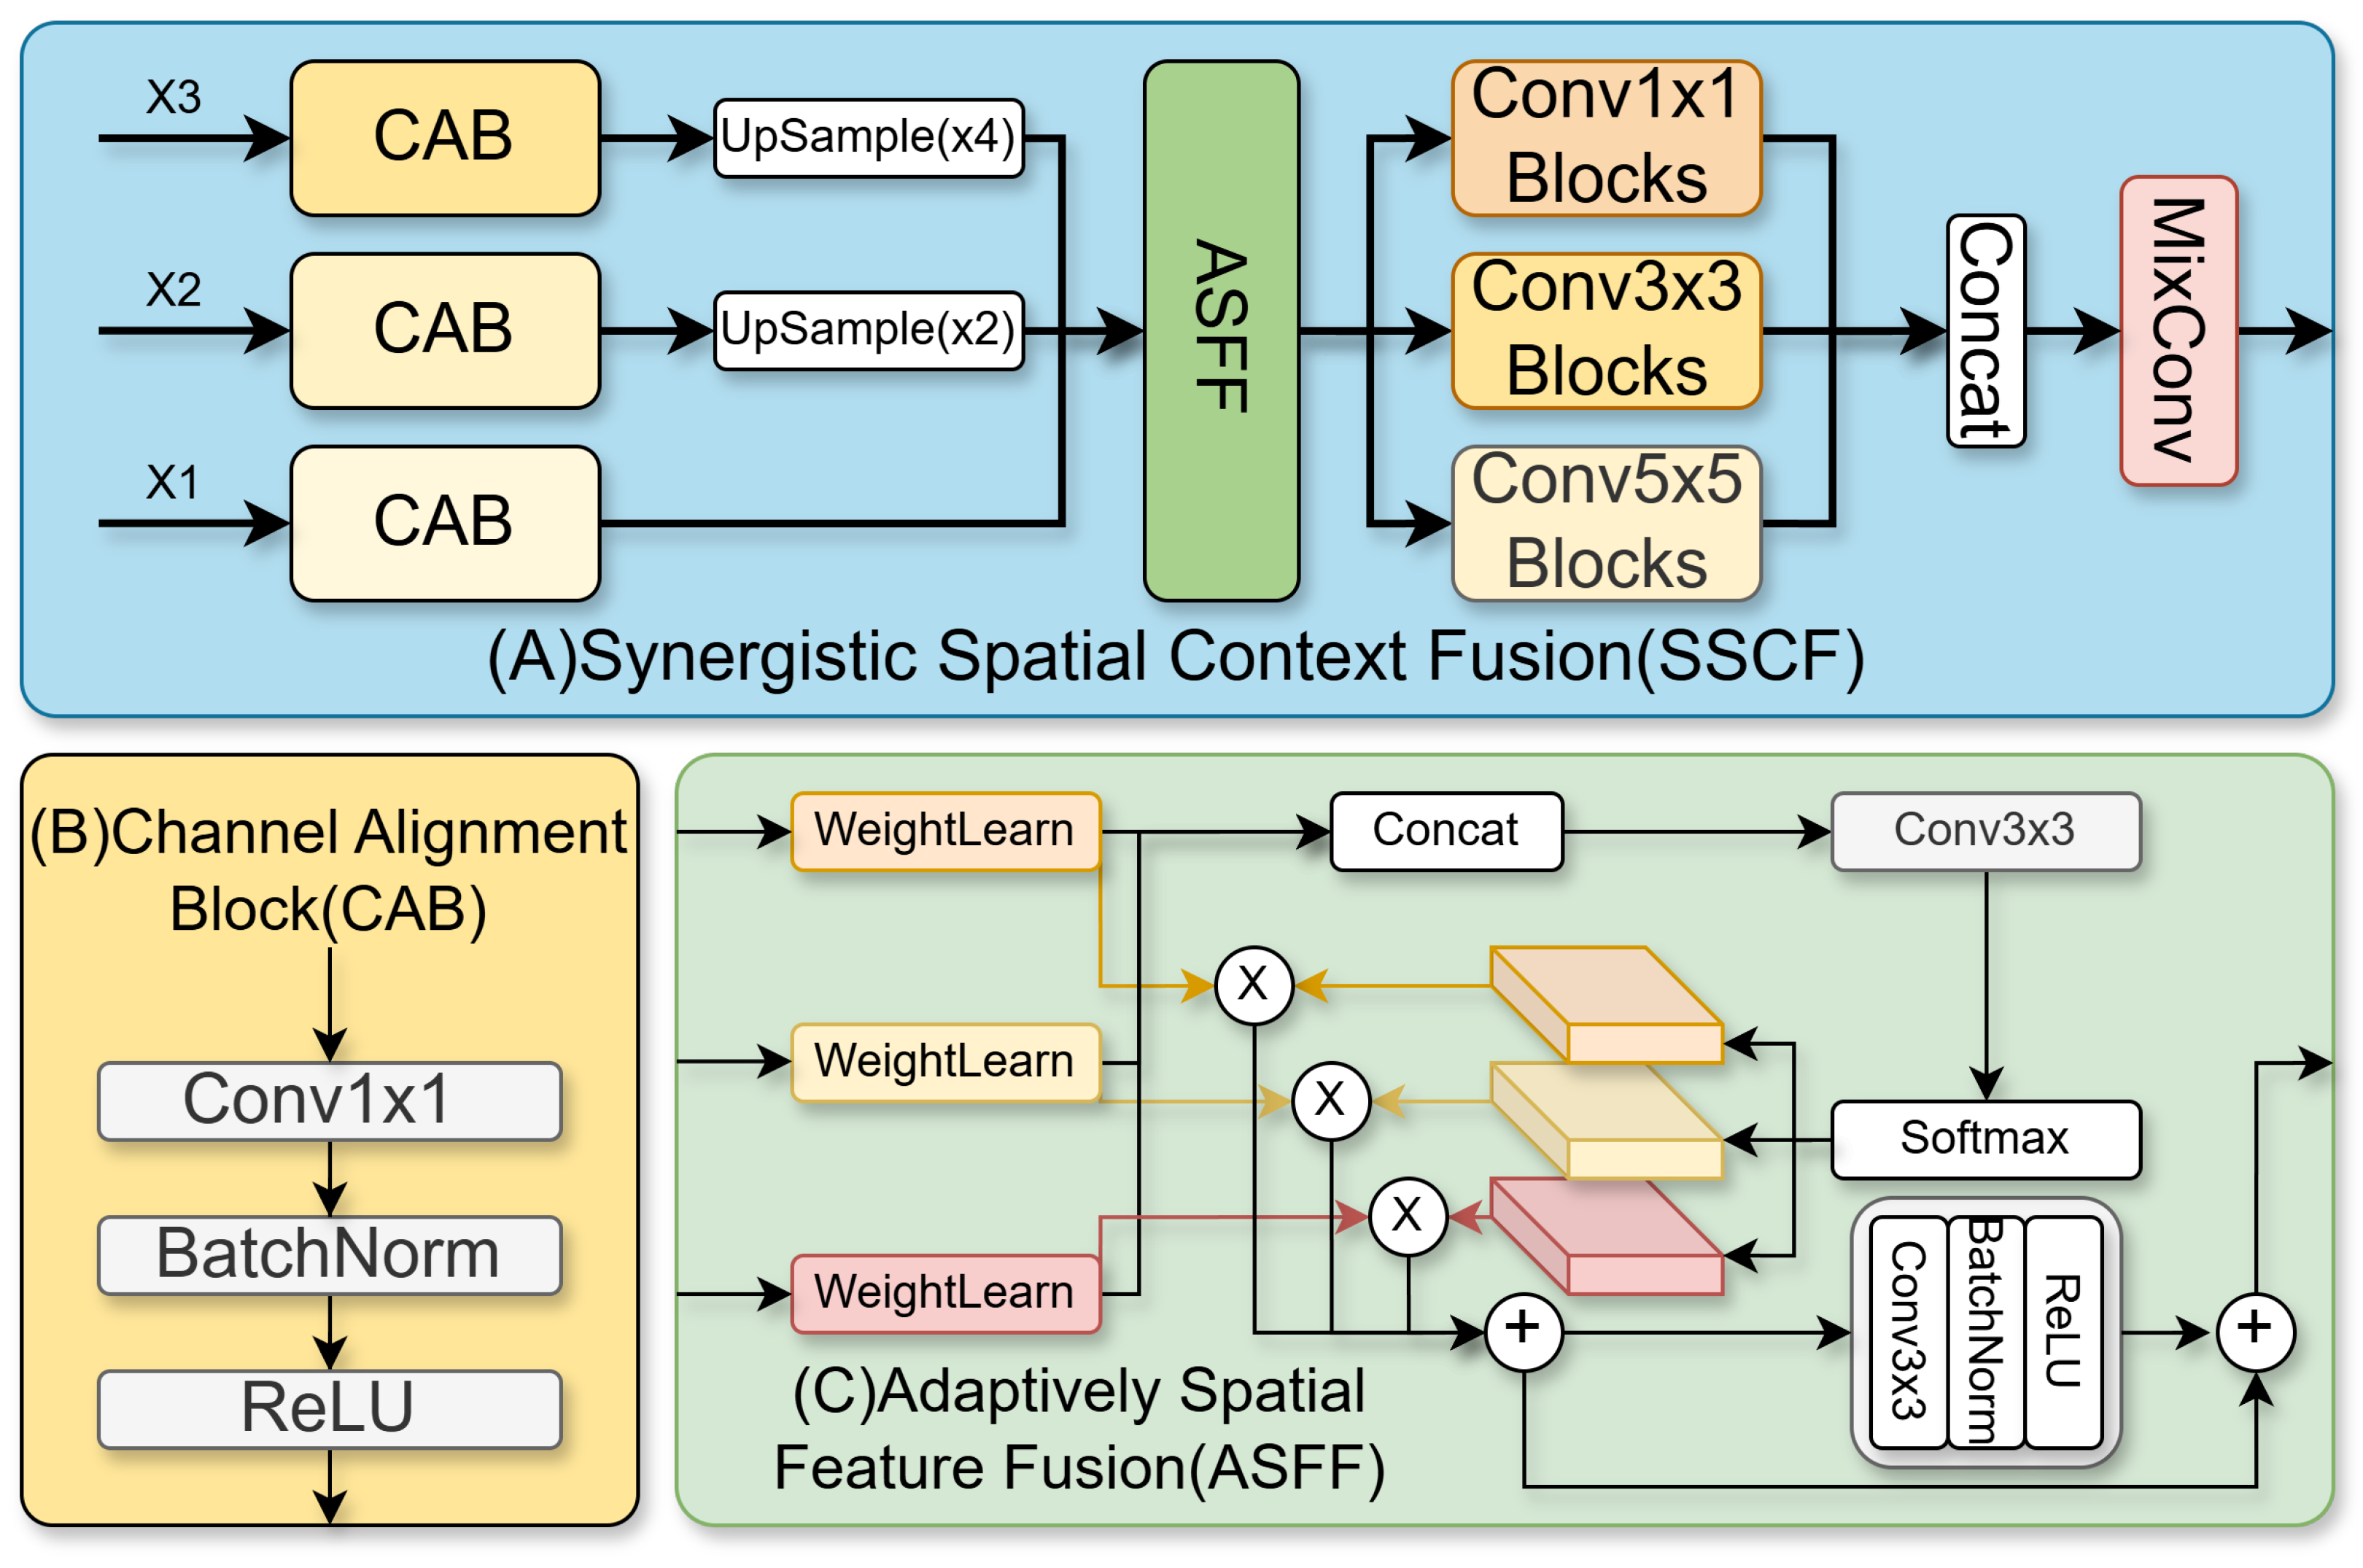
We propose the SSCF module to efficiently fuse multi-level features from the AUP-Encoder. The module also generates a single, high-resolution feature map with rich semantics for the final detection head. As its name implies, the SSCF operates through a two-stage synergistic process. First, it performs adaptive spatial fusion to align features and resolve scale conflicts. Subsequently, it enriches the fused result with multi-scale contextual information. The complete architecture of this module is illustrated in Figure 3. This module receives three sets of feature maps, X 1 , X 2 , and X 3 , from different pyramid levels as input. As depicted in Figure 3A, the process begins with a feature alignment stage. Each input first passes through a Channel Alignment Block (CAB), detailed in Figure 3B. This block utilizes 1 × 1 convolutions to unify the channel dimensions of the inputs. Next, the lower-resolution features ( X 2 , X 3 ) are upsampled to match the spatial size of the highest-resolution feature ( X 1 ). This results in three feature maps, denoted as F 1 , F 2 , and F 3 , which are aligned in both spatial and channel dimensions.
The first core stage is Adaptive Spatial Feature Fusion (ASFF) [32], as shown in Figure 3C. This stage adaptively merges the aligned features by learning pixel-wise spatial weights for each scale. These weights are denoted as α , β , and γ . They are dynamically generated from the input features and normalized via a softmax function. The fusion is accomplished through a weighted sum:
F A S F F = α F 1 + β F 2 + γ F 3 ,
where ⊗ denotes element-wise multiplication. This process allows the model to select and emphasize features from the most effective scale for each spatial location. The result is then enhanced through a 3 × 3 convolution and a residual connection.
The second core stage is Multi-scale Contextual Enhancement. This stage corresponds to the lightweight multi-scale feature fusion block in our design. The spatially fused feature map, F A S F F , is fed into this stage to capture richer contextual information. It employs a parallel, multi-branch architecture. The feature map is processed by convolutional blocks with different kernel sizes ( 1 × 1 , 3 × 3 , and 5 × 5 ). This approach captures information from various receptive fields simultaneously. The outputs of these branches are then concatenated. A final 1 × 1 convolution (MixConv) fuses them to generate the final output. This operation can be formulated as follows:
F o u t = MixConv ( Concat ( ϕ 1 ( F A S F F ) ,   ϕ 3 ( F A S F F ) ,   ϕ 5 ( F A S F F ) ) ) ,
where F A S F F is the enhanced output from the ASFF stage, and ϕ k represents a convolutional block with a k × k kernel. This synergistic two-stage design allows the SSCF module to first resolve spatial conflicts. It then enriches the features with robust multi-scale context. This makes the module highly effective for detecting targets of various scales in complex scenes.

3.4. Spatial Agent Transformer (SAT)

Understanding long-range dependencies is crucial in complex scenarios like urban ports, which are characterized by the coexistence of large-scale, heterogeneous objects. For instance, this involves associating distant ships with vehicles on the shore. To equip the model with this global perception capability, we introduce the SAT. The module is strategically deployed at the network’s highest level, where it processes S 5 features. We chose this highest-level feature map because it possesses the strongest semantic information and the smallest spatial resolution. This design allows the SAT to efficiently model global context at the lowest computational cost. Applying attention mechanisms to higher-resolution mid-level features (e.g., S3 or S4) would introduce a prohibitive computational overhead, which contradicts our goal of creating an efficient framework. SAT’s core function is to efficiently model global context and long-range dependencies. This process enhances high-level semantics and preserves spatial details that are vital for UAV perception. The overall architecture of the SAT is illustrated in Figure 4.
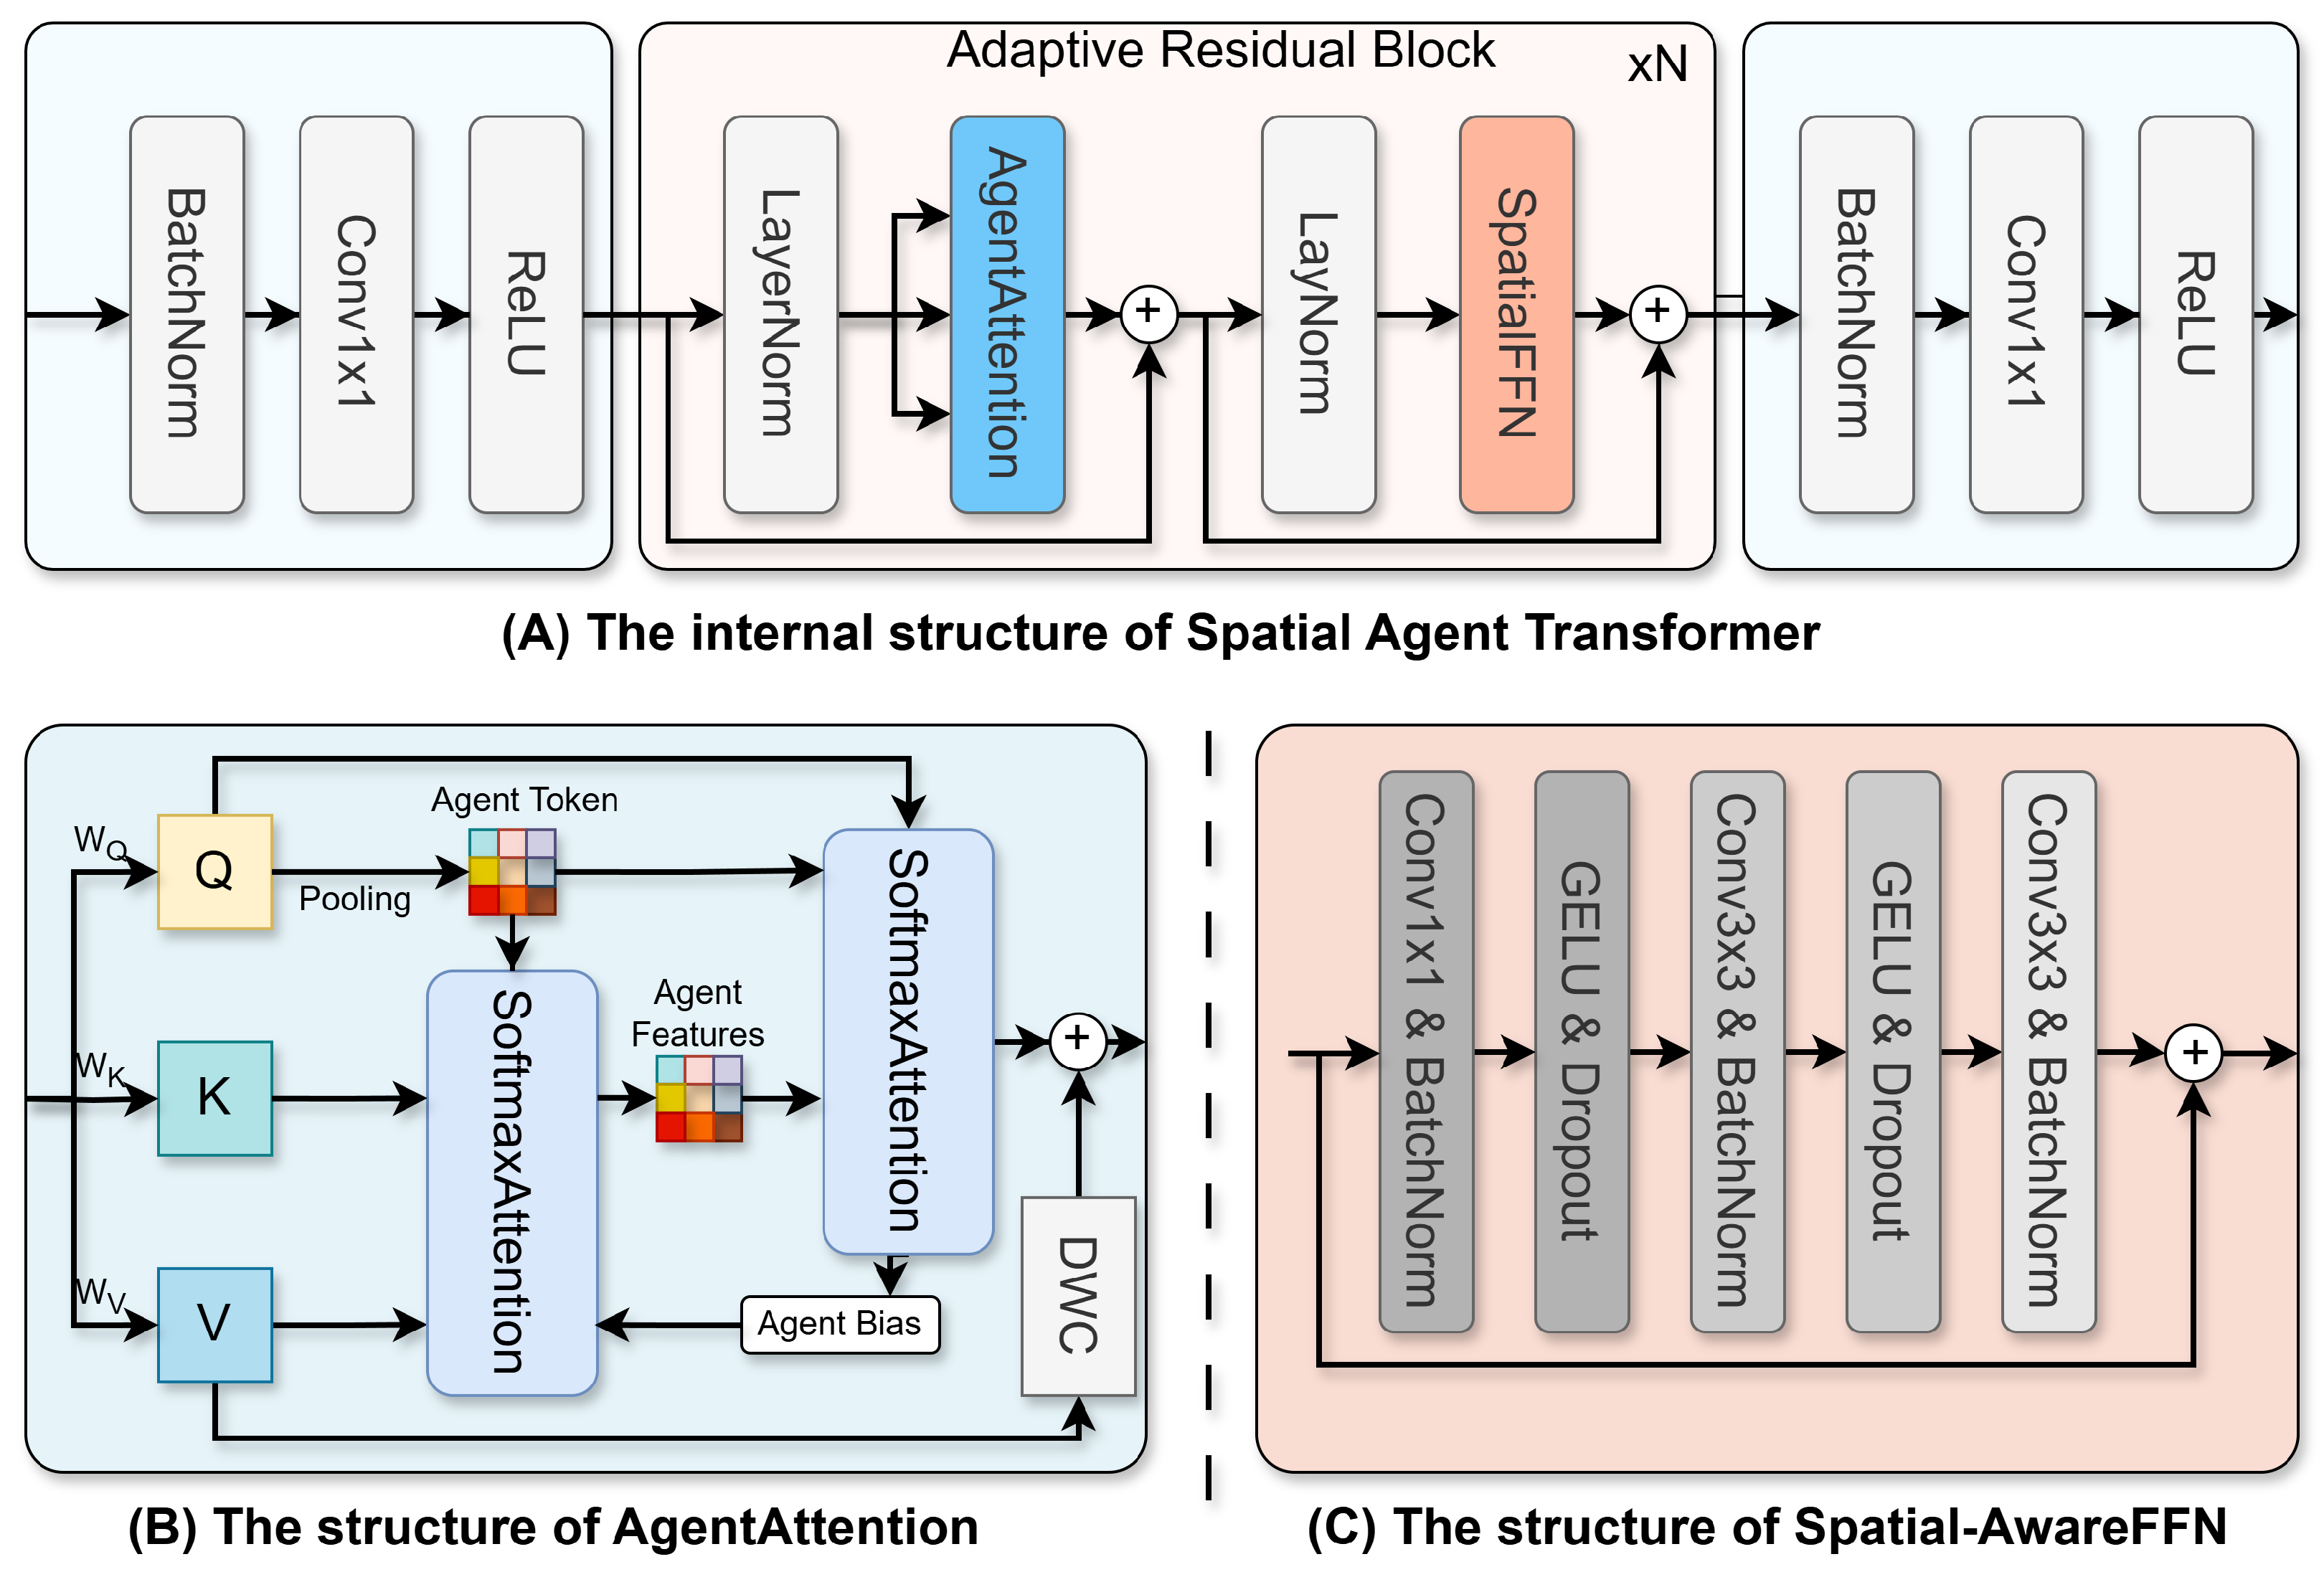
The SAT module consists of a series of stacked Adaptive Residual Blocks (ARBs). Given an input feature map X R B × C × H × W from the backbone, it first undergoes an initial projection. Subsequently, the feature refinement process within a single ARB (Figure 4A) can be formulated as:
X s e q = X s e q + α · AgentAttn ( LN ( X s e q ) )
X o u t = Reshape ( X s e q ) + β · SA FFN ( LN ( Reshape ( X s e q ) ) )
Here, LN denotes Layer Normalization. The terms α and β are learnable scalar parameters. They adaptively adjust the weights of the residual connections to ensure a stable and efficient refinement process.
The Agent Attention (AgentAttn) mechanism, detailed in Figure 4B, follows a two-stage gather-and-broadcast paradigm. A small set of n agent tokens, A R n × C , is dynamically generated through adaptive pooling on the Query (Q) feature map. These agents first gather global context from the Key (K) and Value (V) projections. Then, they broadcast this global information back to all query tokens. This operation introduces an Agent Bias to enhance position awareness and uses a depth-wise separable convolution (DWC) module to restore feature diversity. Its complete definition is as follows:
AgentAttn ( Q , K , V ) = softmax Q A T d k + B 2 softmax A K T d k + B 1 V + DWC ( V )
A key innovation is the Spatial-Aware FFN (SA-FFN), as depicted in Figure 4C. Standard FFNs flatten features, which results in the loss of spatial topology. In contrast, the SA-FFN processes features with a series of convolutional layers, preserving their 2D structure. This preservation is crucial for maintaining precise localization information in dense detection scenarios. The SA-FFN can be formulated as
SA FFN ( X ) = Conv 3 × 3 ( δ ( Conv 3 × 3 ( δ ( Conv 1 × 1 ( X ) ) ) ) )
where δ represents the GELU activation function. By integrating these specialized components, the SAT module effectively models the long-range dependencies required to distinguish between objects like ships and vehicles. It also retains the high-quality spatial hierarchy necessary for localizing smaller targets. These capabilities make the SAT module a cornerstone of AUP-DETR’s exceptional performance in low-altitude applications.

4. Experiments and Discussion

4.1. The Datasets

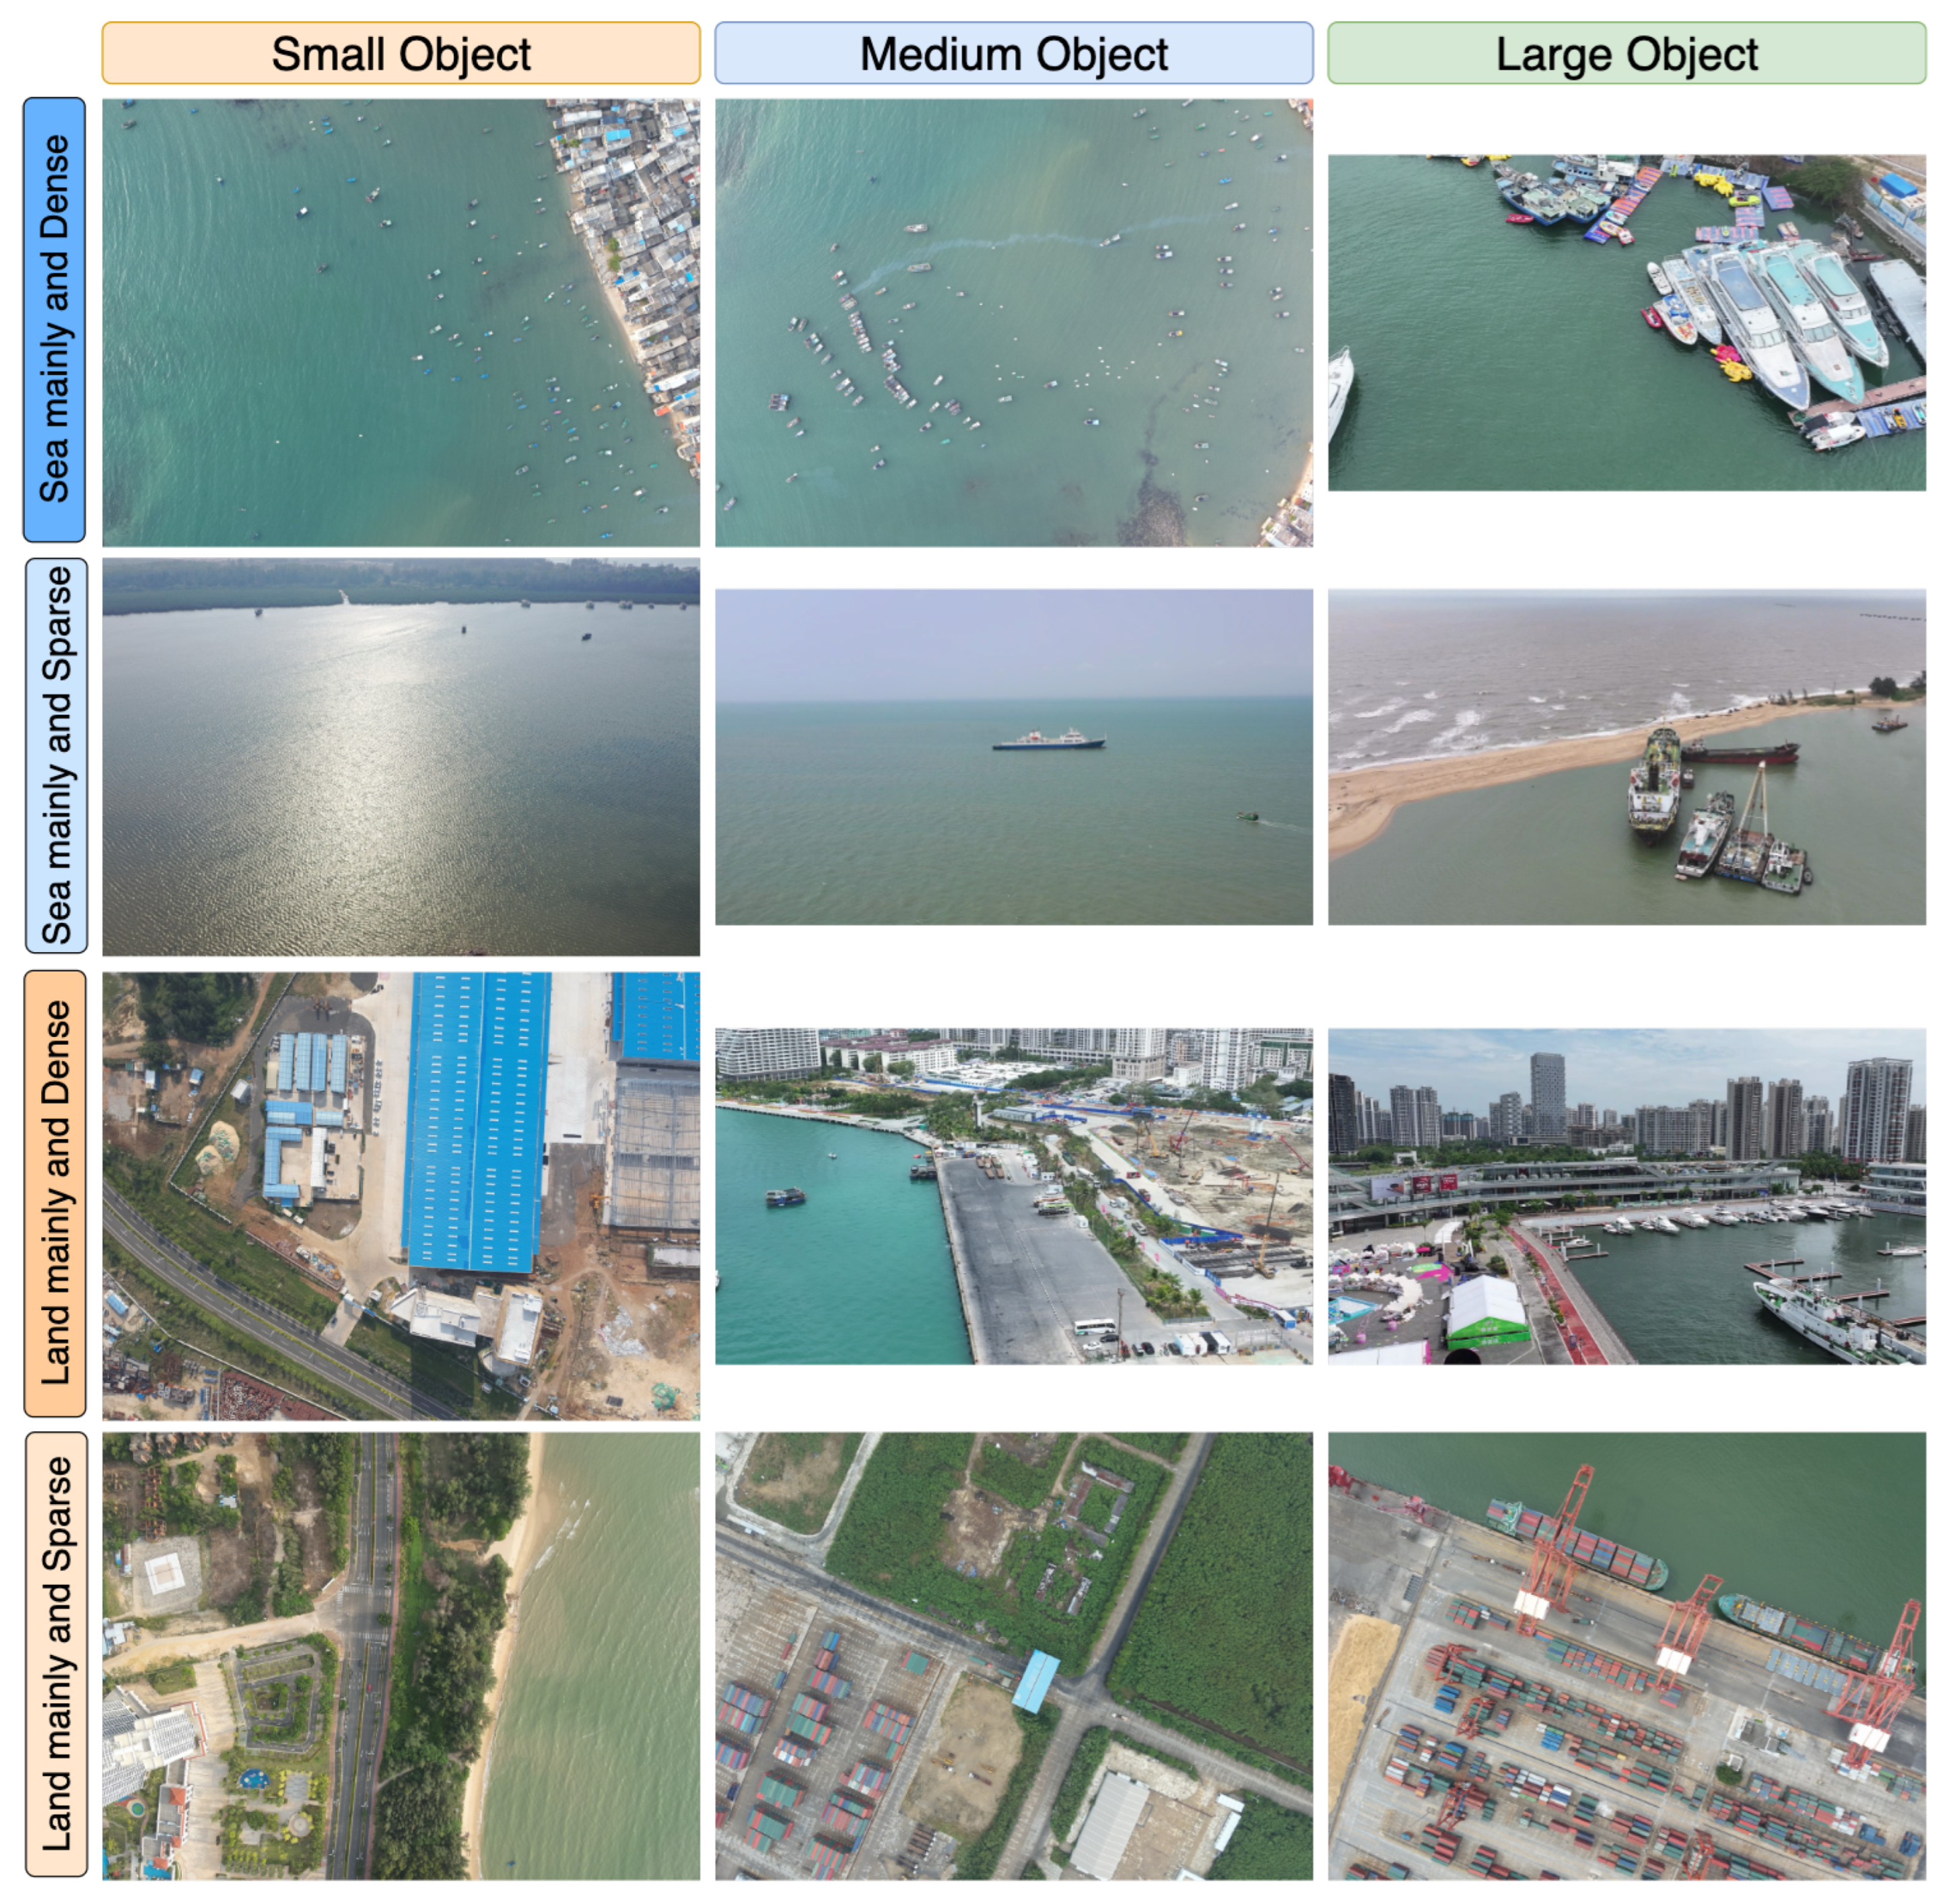
To address the research gap in complex environmental perception for urban coastal low-altitude applications, we constructed a new, high-quality UAV aerial imagery dataset. The dataset is designed to evaluate models for intended use-cases such as port-based automated logistics, traffic monitoring, and security surveillance. We have named it UCA-Det. The data were collected using our proprietary UAVs in the coastal areas of Haikou, Hainan Province, China, primarily using oblique views (to simulate patrol perspectives) with a small number of nadir views, at altitudes ranging from 20 to 150 m. All images have a resolution of 2K or higher, which ensures rich detail. The entire dataset comprises 3501 images, with 2800 designated for training and 701 for validation. UCA-Det contains a total of 17,722 bounding boxes, with an average of 5.06 objects per image. While this average density is moderate, the dataset contains many specific examples of our “dense object distributions” challenge (as shown in Figure 5). The class distribution exhibits a significant imbalance, with ‘ship’ being the predominant category (84.63%). Other categories include ‘car’ (12.00%), ‘people’ (2.81%), and ‘cycle’ (0.56%). This distribution authentically reflects the typical characteristics of a port environment. We selected these four classes as they represent the most common and critical dynamic traffic participants in a port, making them essential for monitoring logistics efficiency and ensuring safety. Furthermore, the dataset is challenging with respect to object scale. According to COCO standards (small: A < 32 2 ; medium: 32 2 A < 96 2 ; large: A 96 2 ), small objects account for 35.97% of the instances, while medium and large objects constitute 50.84% and 13.19%, respectively. This distribution, with small and medium-sized objects combined accounting for 86.81% of instances, poses a significant challenge to the performance of detection models. The dataset contains 14,307 instances in the training split and 3415 in the validation split. Our annotation policy sets a minimum object size of approximately 10 × 10 pixels. The baseline models in this paper do not use specific mitigation techniques (e.g., class-balanced loss or oversampling), which we leave as a key area for future improvement on this benchmark. Figure 5 showcases several sample images from the UCA-Det dataset. We use standard AABB annotations in this work to establish a fair baseline comparison against mainstream detectors, leaving OBB-based analysis as an important direction for future work.
To validate the generalization capability and advanced nature of our model, we conducted comparative experiments using the VisDrone dataset. The VisDrone dataset was created by the AISKYEYE team at Tianjin University. It covers a variety of complex scenes, including both urban and rural environments. The dataset also features aerial images captured under diverse weather, lighting, and occlusion conditions. For the object detection task, it defines ten common categories: pedestrian, people, bicycle, car, van, truck, tricycle, awning-tricycle, bus, and motor. The dataset’s annotation protocol also specifies rules for ignored regions and truncation levels, which we followed. The dataset contains 10,209 high-resolution images, split into 6471 for training, 548 for validation, and 1610 for testing. We trained our model on the training set and evaluated its performance on the validation set using the official evaluation protocol.

4.2. Experimental Setup

4.2.1. Experimental Environment Configuration

The experiments were conducted on a computing platform that runs the Ubuntu operating system. The core hardware included an AMD EPYC 7T83 CPU and four NVIDIA GeForce RTX 4090 GPUs. The software stack was primarily composed of Python 3.10, PyTorch 2.0.0, and CUDA 11.8. The loss function used for AUP-DETR was consistent with that of UAV-DETR. The main hyperparameter settings for the experiments are detailed in Table 1. To handle the high-resolution (2K+) input images, we used a standard letterboxing approach. All images were resized to 640 × 640 for both training and inference, while maintaining the original aspect ratio. The resulting empty areas were padded with gray pixels, and bounding box coordinates were scaled proportionally. To ensure strict training-budget parity for a fair comparison, we clarify that all baseline models (including all YOLO variants and our DETR-based implementations) were trained and evaluated using the identical configuration (e.g., input size, epochs, augmentations, and optimizer settings) detailed in Table 1.

4.2.2. Evaluation Metrics

In the experiments for this study, the evaluation metrics for the object detection categories primarily include the following:
Precision (P) represents the proportion of correctly identified samples among all samples detected as positive. Its calculation formula is as follows:
P = TP TP + FP
where TP is the number of true positives, and FP is the number of false positives.
Recall (R) is the proportion of actual positive samples that are correctly detected. Its formula is given as
R = TP TP + FN
where FN is the number of false negatives.
In object detection tasks, model performance is commonly evaluated using the Precision–Recall (P-R) curve. Average Precision (AP) is defined as the area under the P-R curve, expressed as
AP = 0 1 P ( R ) d R
A higher AP value indicates better detection performance for a given category. Furthermore, mean Average Precision (mAP) represents the average of AP values across all categories. It is calculated with the following formula:
mAP = 1 n i = 1 n ( AP ) i
where n is the total number of categories.
In our specific experiments, we primarily employed two metrics: mAP 50 and mAP 95 . The mAP 50 metric is the mean Average Precision calculated at an IoU threshold of 0.5. It more intuitively reflects the model’s overall detection capability. In contrast, mAP @ 95 is averaged over IoU thresholds ranging from 0.5 to 0.95, with a step size of 0.05. This provides a more comprehensive evaluation of model performance under varying localization precision requirements.

4.3. Ablation Experiment

A series of ablation experiments was conducted to systematically validate the effectiveness of our proposed modules. The results are presented in Table 2. Our ablation study began with UAV-DETR as the baseline (Ablation 1), which established an initial performance of 65.27% mAP50 and 77.08% precision on the UCA-Det dataset. Building on the baseline, we first introduced the Fusion-SHC module (Ablation 2) to enhance the representation of small objects. However, integrating this module alone caused a significant drop in precision metrics, with mAP50 falling from 65.27% to 60.02%. We concluded that this performance drop occurs because Fusion-SHC injects a large volume of raw, low-level spatial details (from S2/S3) directly into the fusion path. Without the subsequent SSCF module, which is designed to adaptively fuse and resolve multi-scale feature conflicts, these ‘unfiltered’ details interfere with the high-level semantic understanding in the final detection head. This hypothesis is strongly supported by the results of Ablation 3, where the addition of SSCF not only reverses the drop but surpasses the baseline, confirming the critical synergistic relationship between these two modules. Subsequently, we added the SSCF module (Ablation 3), which adaptively integrates features from all scales. The model’s performance then recovered and surpassed the baseline. Precision increased to 78.56%, and mAP95 rose to 35.1%. This confirms SSCF’s key role in resolving multi-scale conflicts and creating a rich, unified feature representation, while also showing effective synergy with Fusion-SHC.
Finally, we incorporated the SAT module, creating our final AUP-DETR model (Ablation 4). The SAT module efficiently models global context and long-range dependencies. This capability greatly enhances the model’s ability to distinguish heterogeneous targets in complex scenes. This addition led to the final model achieving optimal results across all metrics. Precision, recall, mAP95, and mAP50 reached 82.24%, 63.74%, 37.8%, and 69.68%, respectively. Compared to the baseline, the mAP50 improved by 4.41 percentage points. Although the parameters and FLOPs increased slightly, the significant performance gain validates our proposed components. It demonstrates that the Fusion-SHC, SSCF, and SAT modules each make clear contributions and yield synergistic benefits. Together, they form the foundation for the exceptional performance of the AUP-DETR model. We acknowledge that these modules introduce a slight increase in computational cost (from 72.5G to 83.6G FLOPs). However, we believe this is a favorable trade-off for the significant 4.41% mAP50 performance improvement achieved.
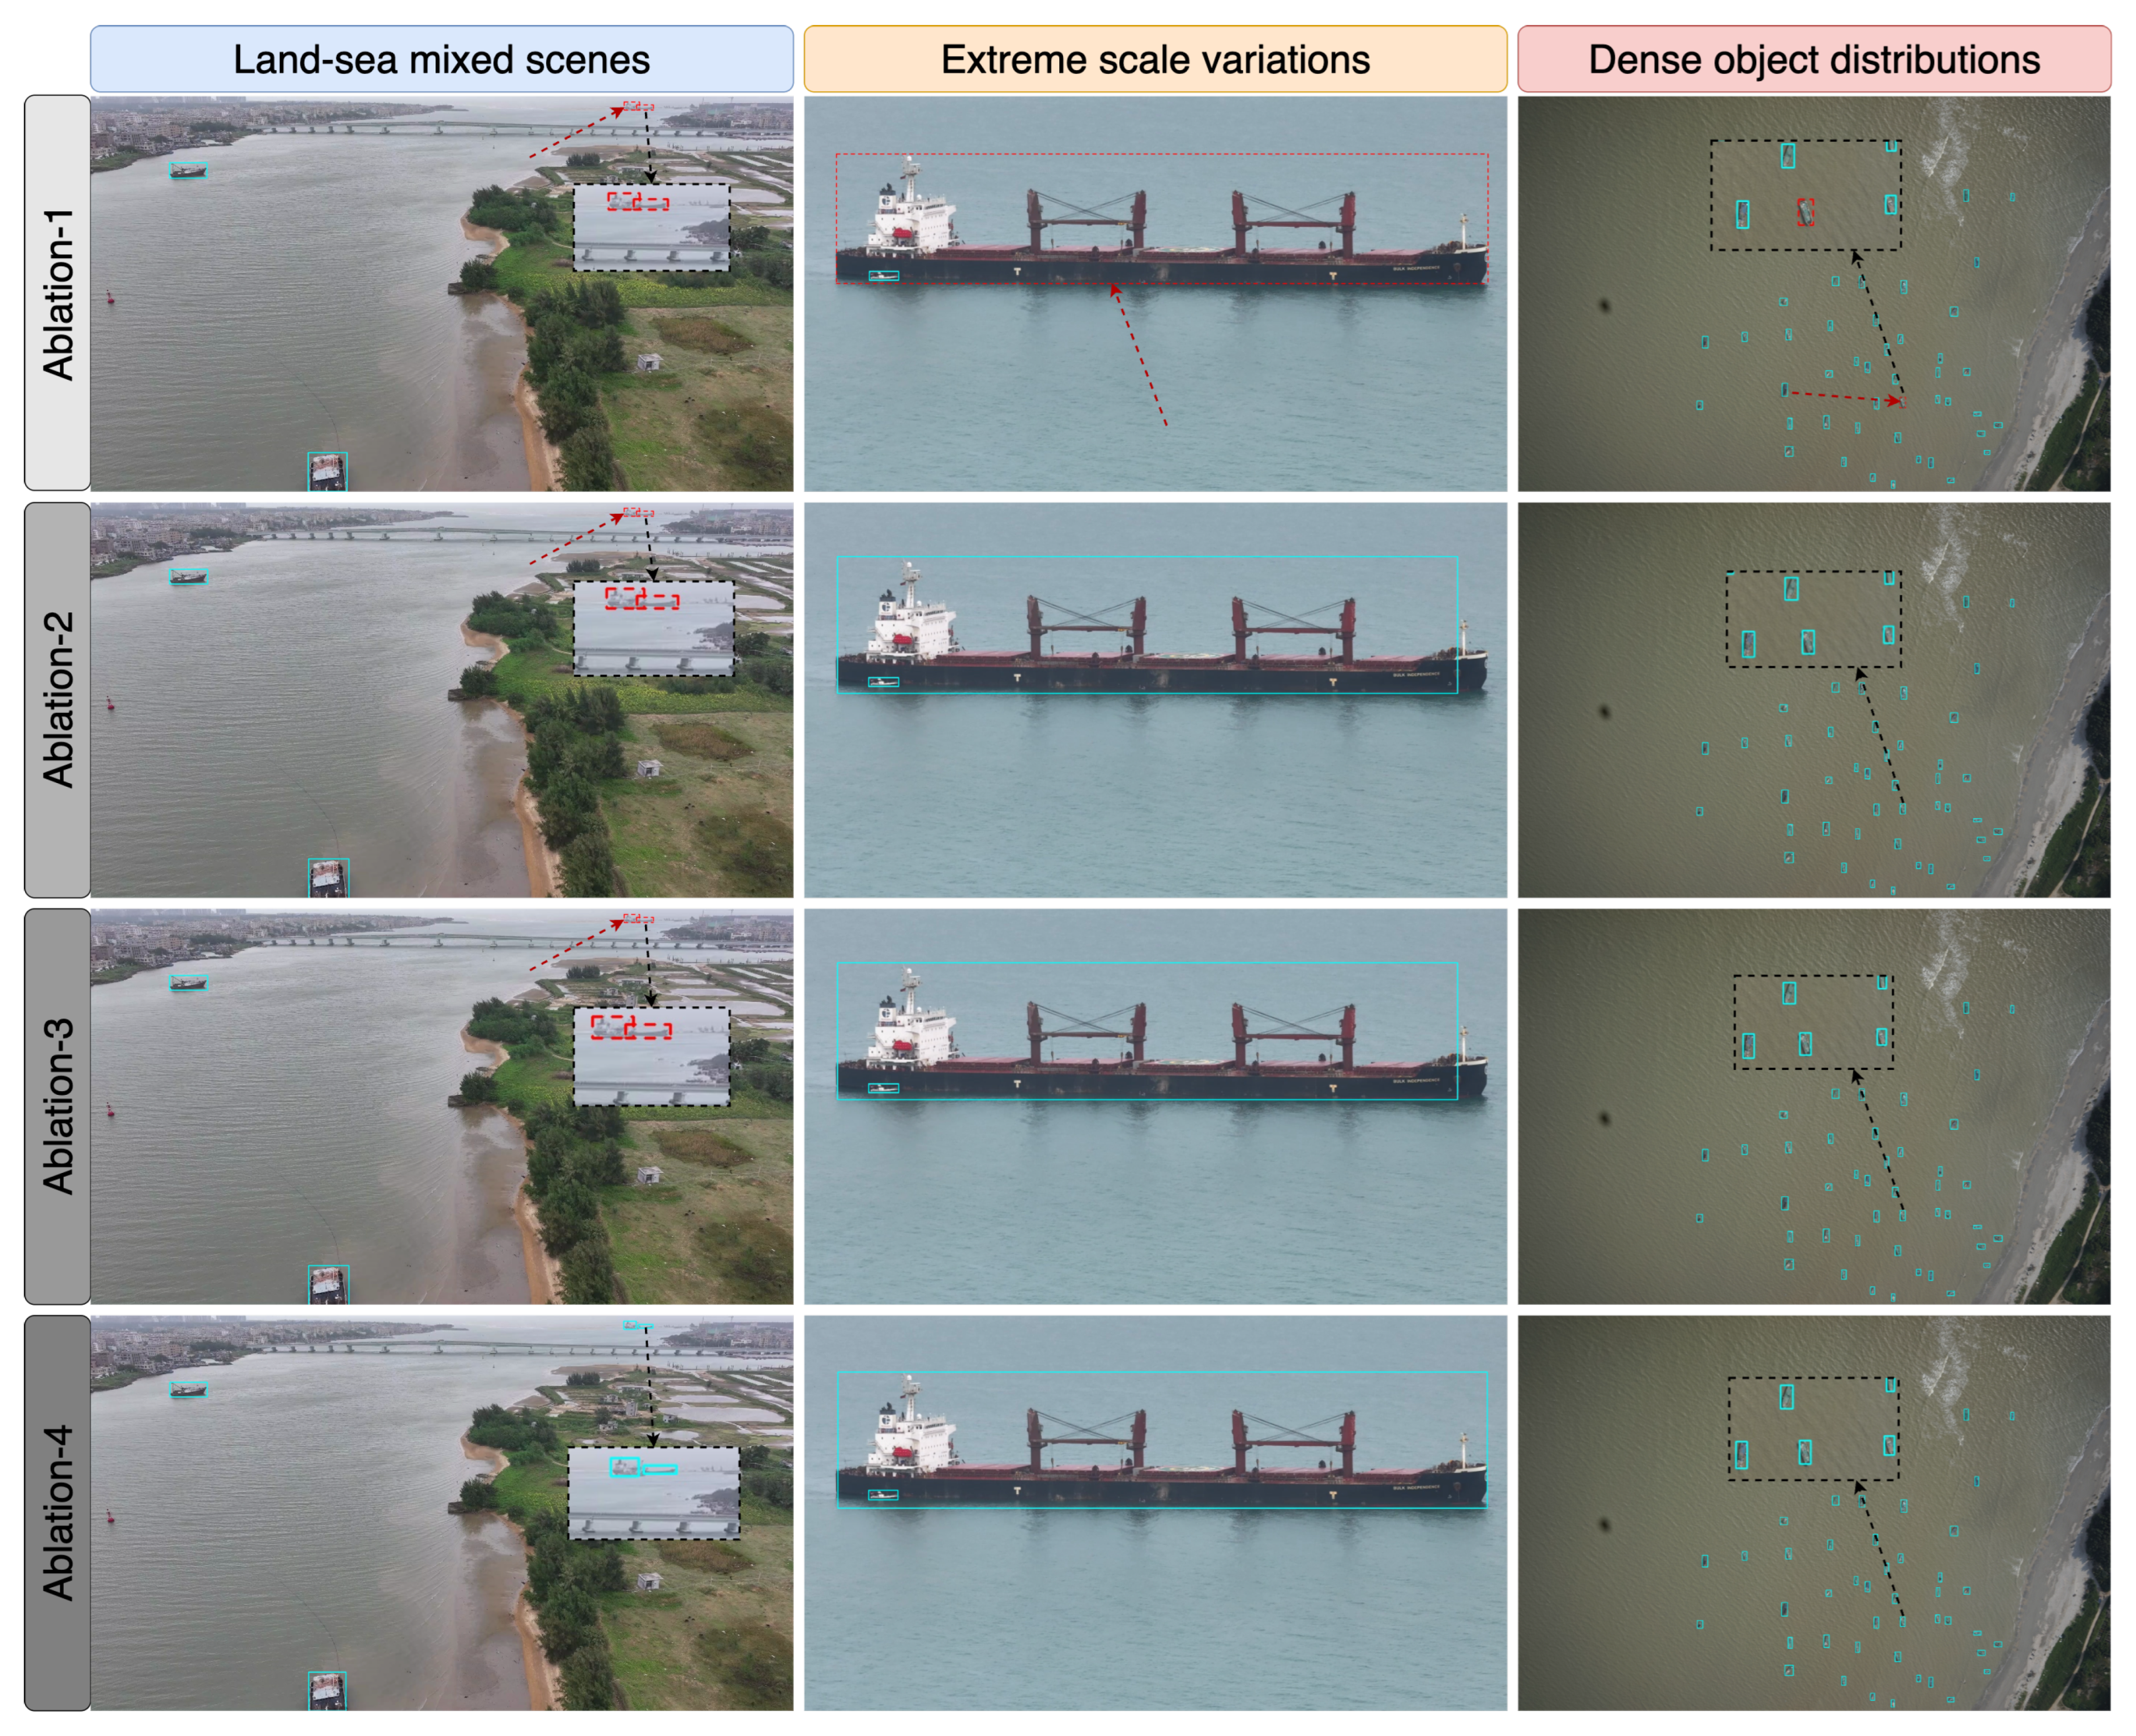
To more intuitively demonstrate the actual contributions of each module, we visualized the detection results of the models from different ablation stages. As shown in Figure 6, the baseline model (Ablation-1) exhibits clear deficiencies in complex scenes. It fails to detect large ship targets, as shown in the middle column, which are indicated by red dashed boxes. Additionally, its recognition capability in areas with dense small objects is quite limited. After introducing the Fusion-SHC module alone (Ablation-2), the issue of missed detections for large targets was resolved. However, the detection performance in small-object regions remained poor. This observation visually explains the quantitative drop in its mAP score. It suggests that enhanced low-level features can cause interference if not effectively coordinated with subsequent modules. With the further integration of the SSCF module (Ablation-3), the model’s ability to handle multi-scale targets improved. The detection results for small objects also began to show improvement. Finally, our complete AUP-DETR model (Ablation-4) demonstrated exceptional performance. It accurately localized various targets and significantly reduced missed and false detections, even in challenging scenes with dense small objects. This series of visualizations strongly corroborates the quantitative analysis. It clearly reveals how our proposed components work in synergy to progressively refine the model’s feature representation and contextual awareness. This process ultimately achieves robust and precise object detection. As this visual comparison between the baseline (Ablation-1) and our full model (Ablation-4) indicates, AUP-DETR achieves certain improvements across all three of the defined challenge scenarios.

4.4. Evaluation of the Number of Adaptive Residual Blocks in SAT

We conducted a detailed evaluation of the number of stacked Adaptive Residual Blocks (ARBs) to pinpoint the optimal depth for the SAT module. The experimental results are presented in Table 3. The study reveals that the number of ARB layers significantly impacts model performance. When the number of layers was increased from one to two, all key model metrics reached their peak values. These included a precision of 82.24%, a recall of 63.74%, an mAP95 of 37.8%, and an mAP50 of 69.68%. This indicates that a two-layer ARB structure most effectively models global context and long-range dependencies, thereby significantly improving detection accuracy. However, further increasing the number of ARB layers did not yield performance gains. Instead, it led to a noticeable decline in performance. When the layer count increased to three or more, all precision metrics, including mAP50, began to decrease. This phenomenon suggests that an excessively deep stack may introduce redundant parameters. This could lead to optimization difficulties or overfitting, which in turn weakens the feature extraction capability. Considering both model performance and computational cost, where parameters and FLOPs grow linearly with the number of layers, we selected the optimal configuration. Therefore, a two-layer ARB was chosen for the SAT module, as it achieves the best balance between accuracy and efficiency.

4.5. Evaluation of the Number of Attention Heads in SAT

To further optimize the internal configuration of the SAT, we experimentally evaluated the number of Attention Heads in its core AgentAttention mechanism. The results are summarized in Table 4. The experimental results clearly indicate that the number of attention heads is a key hyperparameter that influences model performance. As the number of attention heads increased from two to eight, the model’s detection accuracy metrics showed continuous and significant growth. This includes mAP50, which rose from 62.61% to 69.68%, and mAP95, which increased from 35.21% to 37.80%. Optimal performance was achieved with eight heads. This suggests that a moderate increase in the number of heads allows the model to capture complex feature correlations from more diverse subspaces. This process enhances the feature representation capability. However, when the number of heads was further increased to 16 or 32, the model’s performance declined noticeably. This phenomenon indicates that too many attention heads split the feature dimension too finely. As a result, the information allocated to each head is insufficient to learn meaningful contextual relationships. This ultimately impairs the overall performance of the model. Notably, under the standard design of multi-head attention, changing the number of heads does not affect the model’s total parameters or computational load (FLOPs). Therefore, based on this empirical analysis, we selected eight attention heads as the final configuration. It achieves the best detection accuracy without imposing any additional computational burden.

4.6. A Comparison of the Results for Different Datasets

4.6.1. The Results on UCA-Det

The performance of our proposed AUP-DETR framework was comprehensively evaluated against several mainstream object detection models through comparative experiments. These experiments were performed on our custom-built UCA-Det dataset, with detailed results shown in Table 5. The experimental data clearly demonstrate that AUP-DETR achieved the best performance across all evaluation metrics. Its mAP50 reached 69.68%, and its mAP95 reached 37.80%. This performance significantly surpasses that of other advanced models, including the YOLO series and other DETR-based architectures. This result strongly indicates the superiority of our architecture, which was specifically tailored to the unique challenges of UAV-based port scenarios.
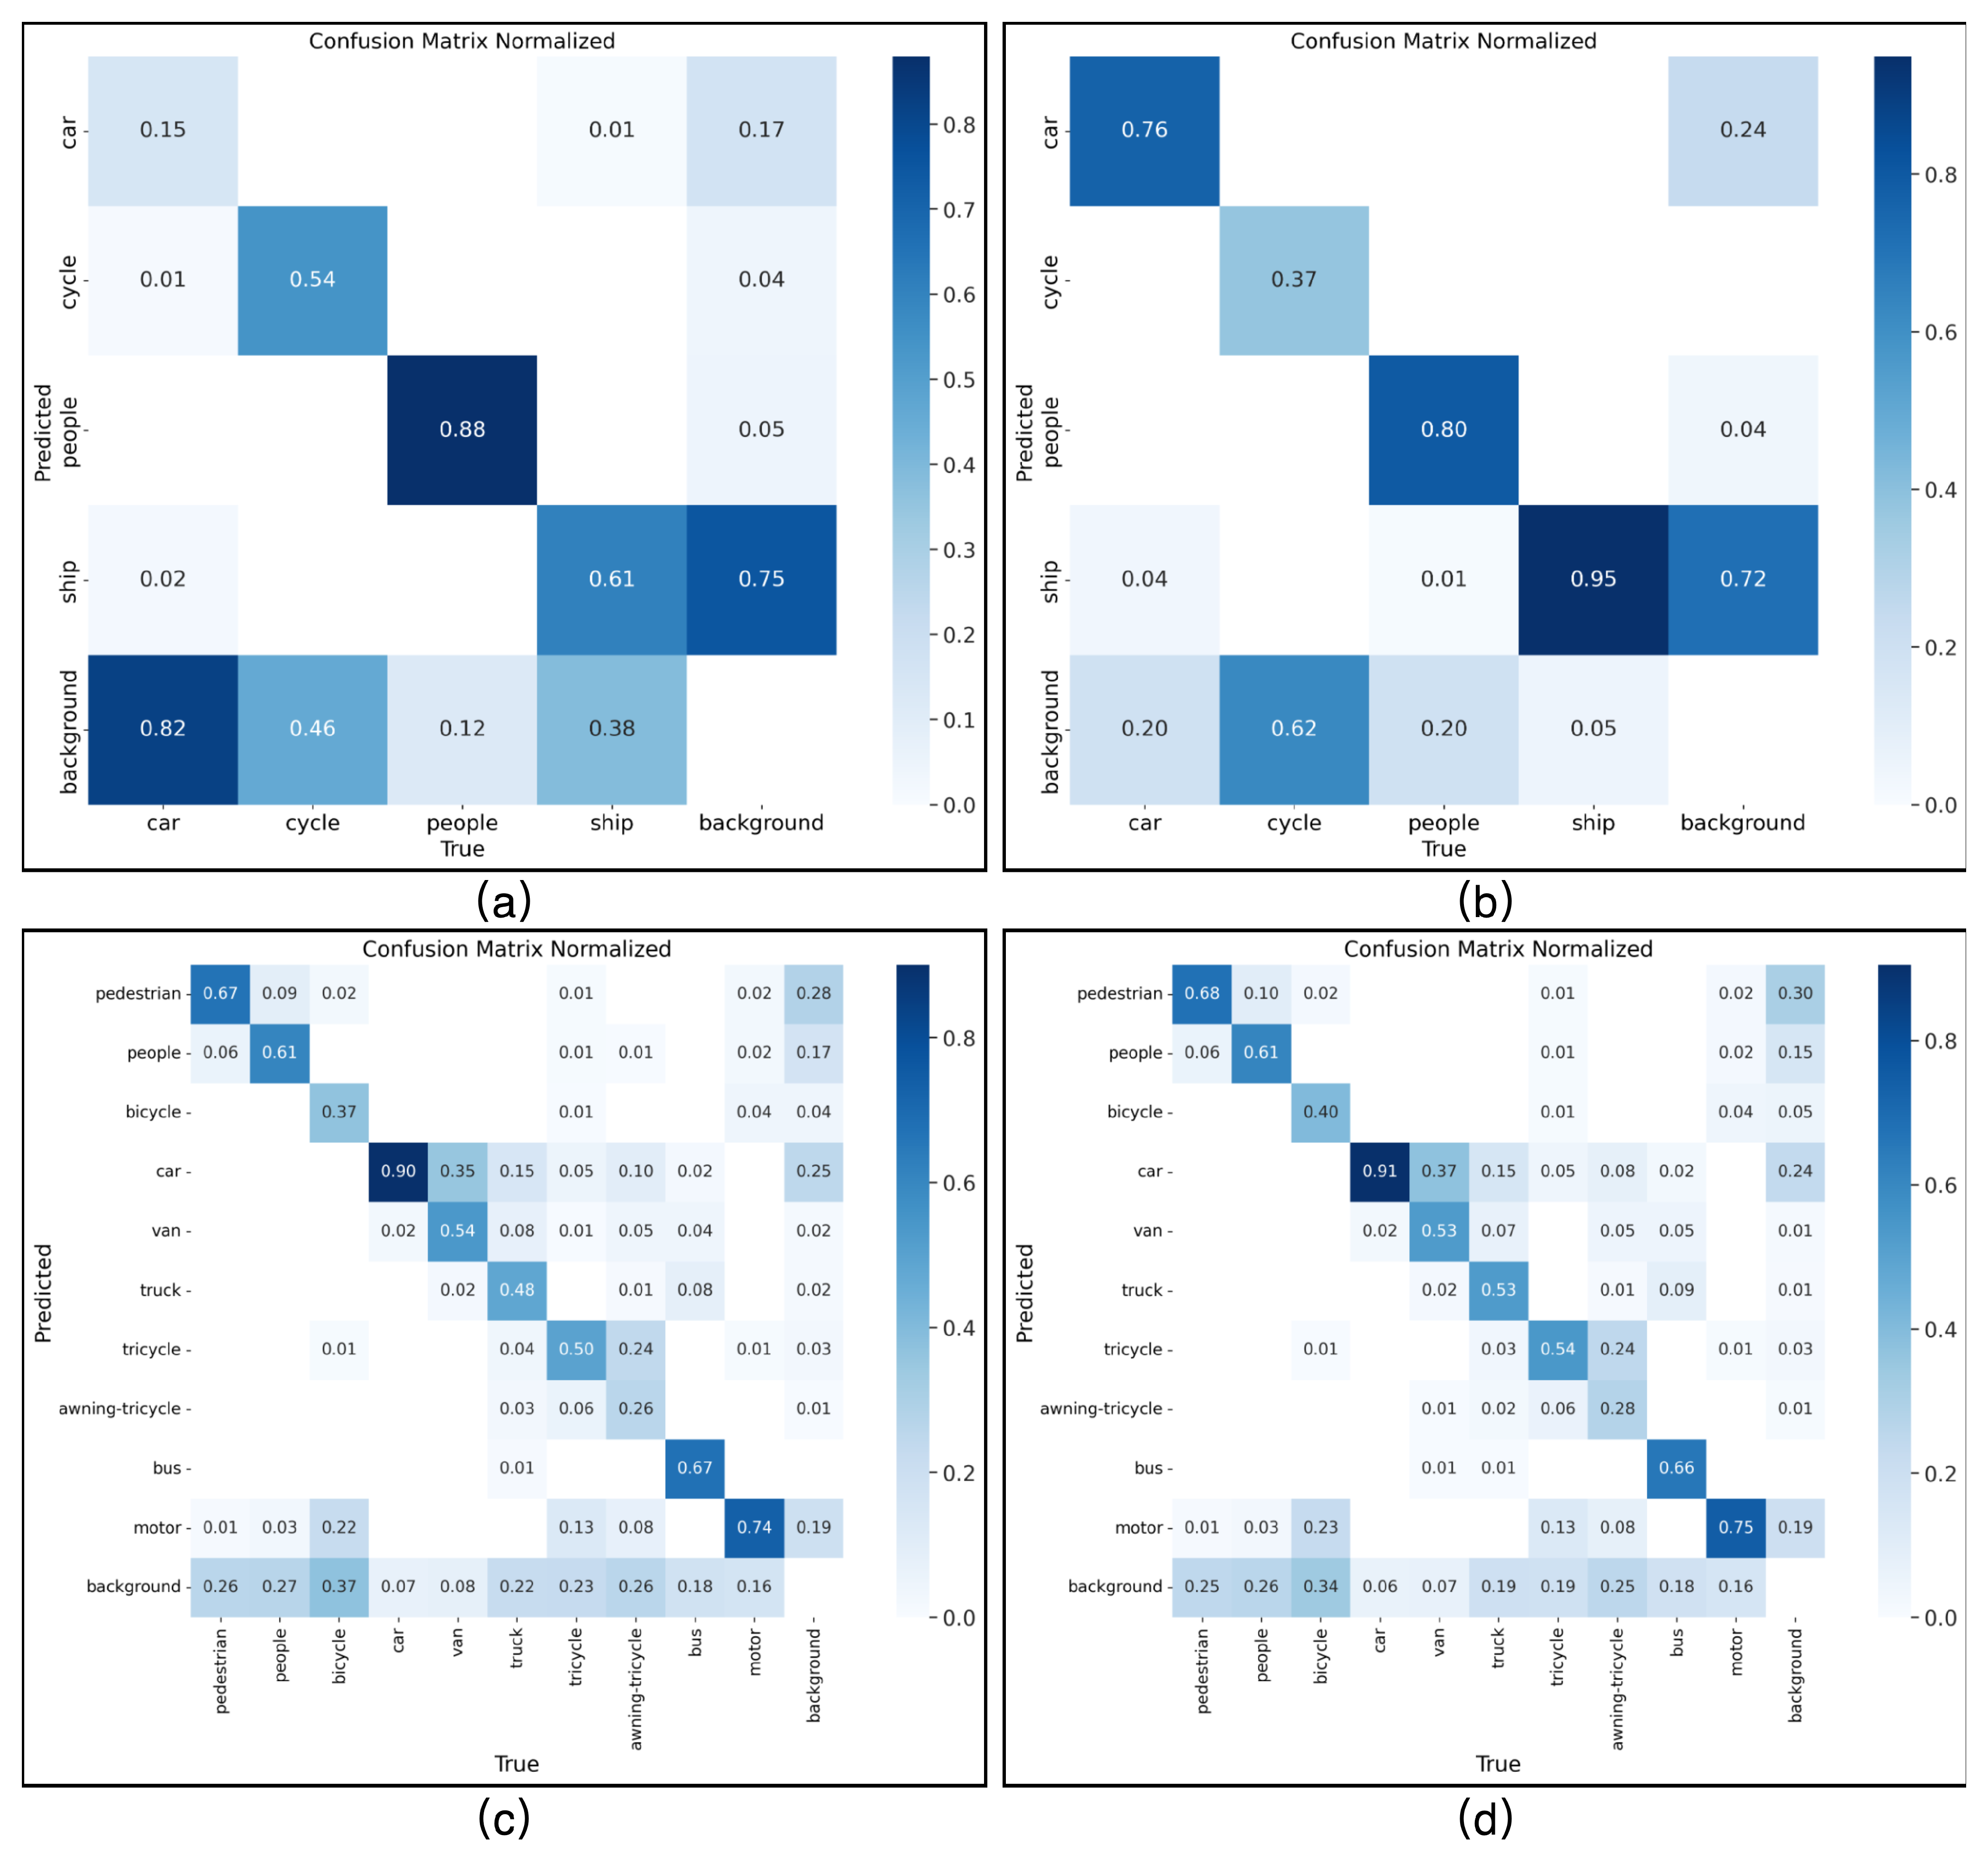
A closer look at the confusion matrices for UCA-Det (Figure 7a,b) reveals the specific advantages of our model. The Baseline (Figure 7a) shows notable challenges, especially in missed detections (FNs), failing to detect 82% of ‘cars’ and 38% of ‘ships’ (see ‘Predicted background’ row). It also exhibits high false positives (FPs), incorrectly identifying 75% of background instances as ‘ships’. Our AUP-DETR (Figure 7b) yields significant improvements, reducing the FN rate for ‘cars’ to 20% and for ‘ships’ to 5%. It also slightly reduces the primary ‘ship’ FPs from 0.75 to 0.72. This effective reduction in both FNs and FPs leads to a much stronger True Positive Rate (TPR) for key classes, such as ‘car’ (0.76 vs. 0.15) and ‘ship’ (0.95 vs. 0.61).
Compared to the baseline model UAV-DETR-R18, AUP-DETR achieves a significant 4.77 percentage point increase in mAP50. This is accomplished with only a minor increase in parameters and computational load. In addition, the performance of UAV-DETRR-R50 is even better than that of UAV-DETRR-R50 with nearly half the number of parameters and calculations. This result proves the effectiveness of our proposed Fusion-SHC, SSCF, and SAT modules. More importantly, AUP-DETR shows a substantial performance advantage on the challenging UCA-Det dataset. This is especially true when it is compared to models like YOLOv8 and YOLOv11, which excel at general-purpose detection. For instance, its mAP50 is nearly 10 percentage points higher than that of the best-performing YOLOv11-L. This highlights the limitations of general-purpose models when they handle extreme scale variations and dense small objects from an aerial perspective. In summary, AUP-DETR not only sets a new benchmark for detection accuracy but also exhibits an excellent balance in model efficiency. This demonstrates its effectiveness and advanced design as a framework tailored for complex low-altitude scenarios.
A direct visual comparison of the detection results between our full AUP-DETR model (Ablation-4) and the baseline (Ablation-1) on the UCA-Det dataset is provided in Figure 6 (Section 4.3), which clearly illustrates the reduction in missed and false detections.

4.6.2. The Results on VisDrone

The generalization capability of our proposed AUP-DETR framework was further validated through an evaluation on the public and highly challenging VisDrone dataset. To rigorously test the model’s robustness and cross-dataset generalization without specific re-tuning, this evaluation used the exact same optimal configuration (e.g., 2 ARB layers and 8 attention heads) determined from our experiments on UCA-Det (as detailed in Section 4.4 and Section 4.5). We compared its performance against several advanced models, with the results presented in Table 6. The experimental results demonstrate that our model exhibits strong generalization and excellent efficiency. Compared to the baseline model UAV-DETR-R18, AUP-DETR achieves highly competitive performance. Its mAP95 was 29.9% and its mAP50 was 48.5%, nearly identical to the baseline’s 29.8% and 48.8%. This proves the robustness of our designed architecture across different UAV aerial scenarios. Although the larger UAV-DETR-R50 achieved the best accuracy on this dataset with an mAP50 of 51.1%, its resource cost was much higher. The model has significantly more parameters and a greater computational load (42M/170G). AUP-DETR achieved comparable performance to the baseline with nearly half the parameters (22.0M) and computational cost (85.0G). This fully demonstrates the advanced nature of our model’s design. It also highlights the excellent balance achieved between accuracy and efficiency, which validates its strong generalization capability.
The confusion matrices for the VisDrone evaluation (Figure 7c,d) further detail this performance. They show that AUP-DETR (Figure 7d) achieves slightly improved True Positive Rates (TPR) for several challenging classes compared to the baseline (Figure 7c), such as ‘bicycle’ (0.40 vs. 0.37) and ‘truck’ (0.53 vs. 0.48). This is balanced by minor trade-offs in other areas, such as a slight increase in False Positives (FPs) for ‘pedestrian’ (0.30 vs. 0.28). This complex trade-off explains the highly competitive but similar mAP scores, while still highlighting the model’s robust adaptation to a new dataset.
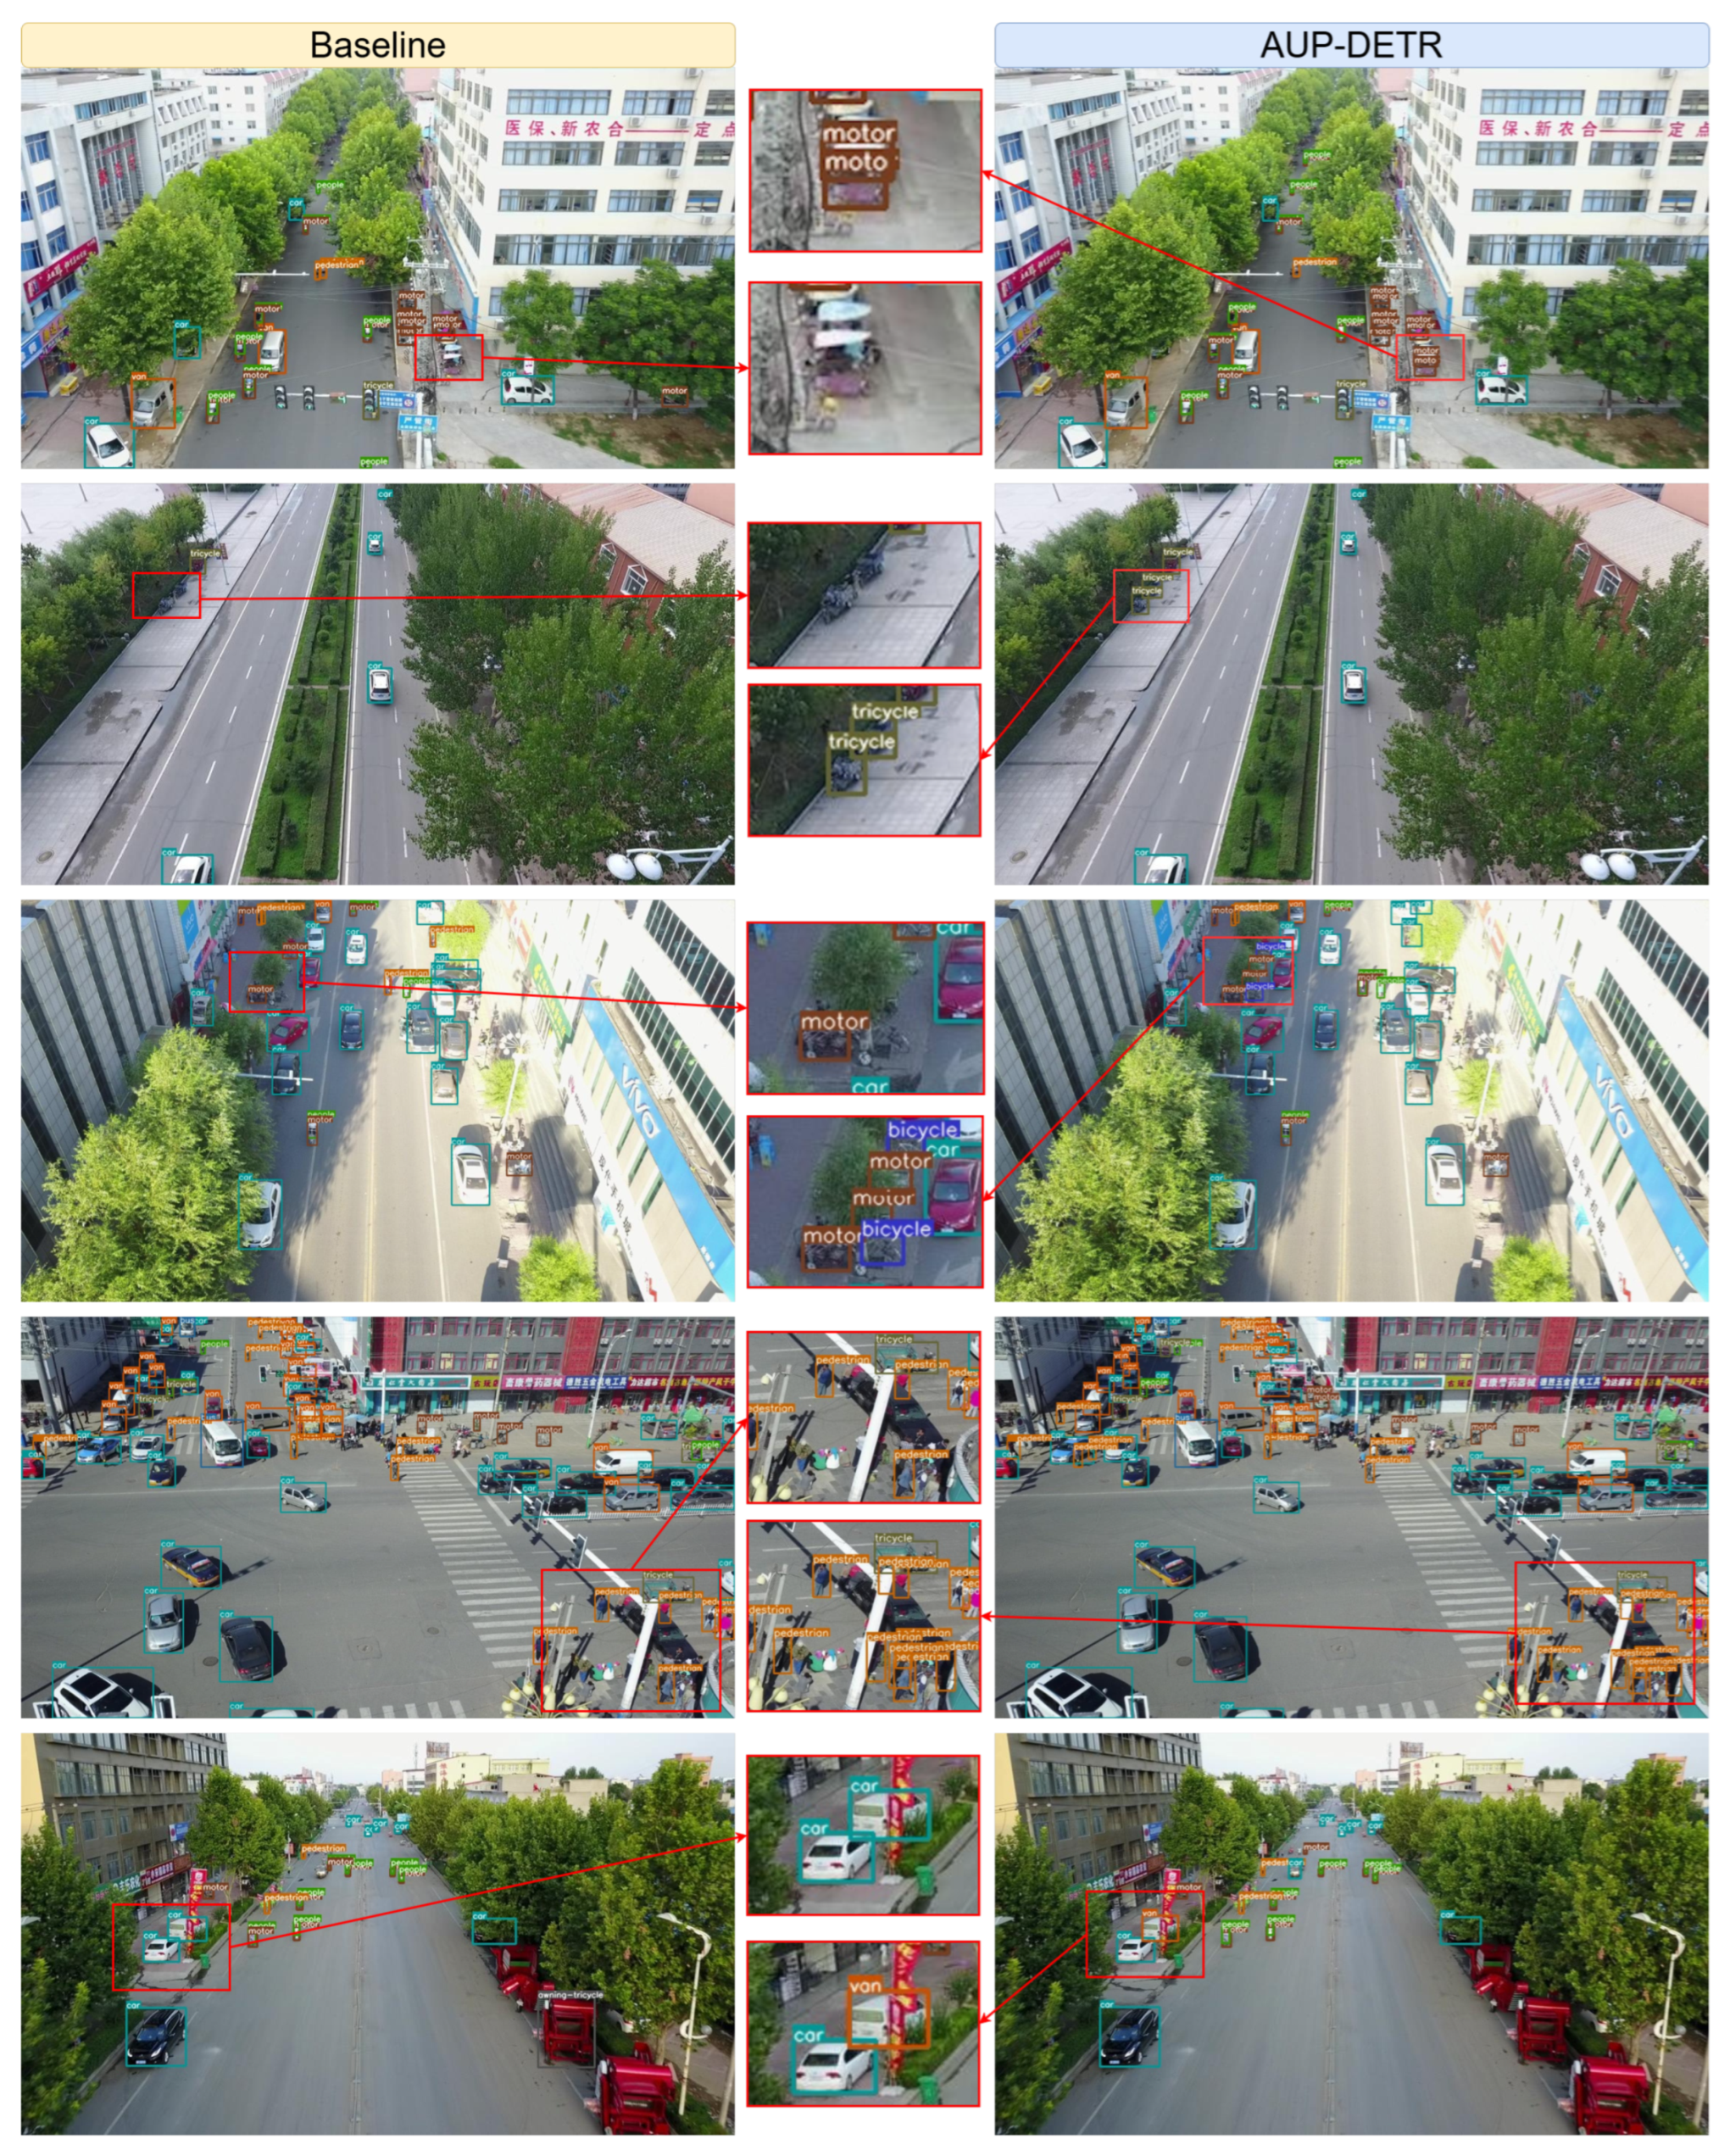
To more intuitively showcase the generalization performance of AUP-DETR on the VisDrone dataset, Figure 8 provides a visual comparison. The figure compares our model with the baseline across several complex urban scenarios. From the figure, it is clear that the baseline model has significant issues with missed detections. This occurs when it handles small, distant, and partially occluded targets, as shown in rows one to three. In contrast, AUP-DETR identifies as many of these challenging targets as possible. Furthermore, in the highly dense scene shown in row four, AUP-DETR’s bounding box localization is more precise. It effectively distinguishes between adjacent and overlapping objects. Meanwhile, the comparison in row five demonstrates our model’s improved classification accuracy, where it correctly identifies the object as a ‘van’, while the baseline misclassifies it as a ‘car’. This further enhances the overall reliability of the detection results. These visual results provide strong evidence that supports the quantitative analysis. They intuitively demonstrate the excellent generalization capability of AUP-DETR. The model maintains high accuracy and reliability even in general aerial environments. These environments differ from the specific characteristics of the training data.

4.7. Visual Analysis

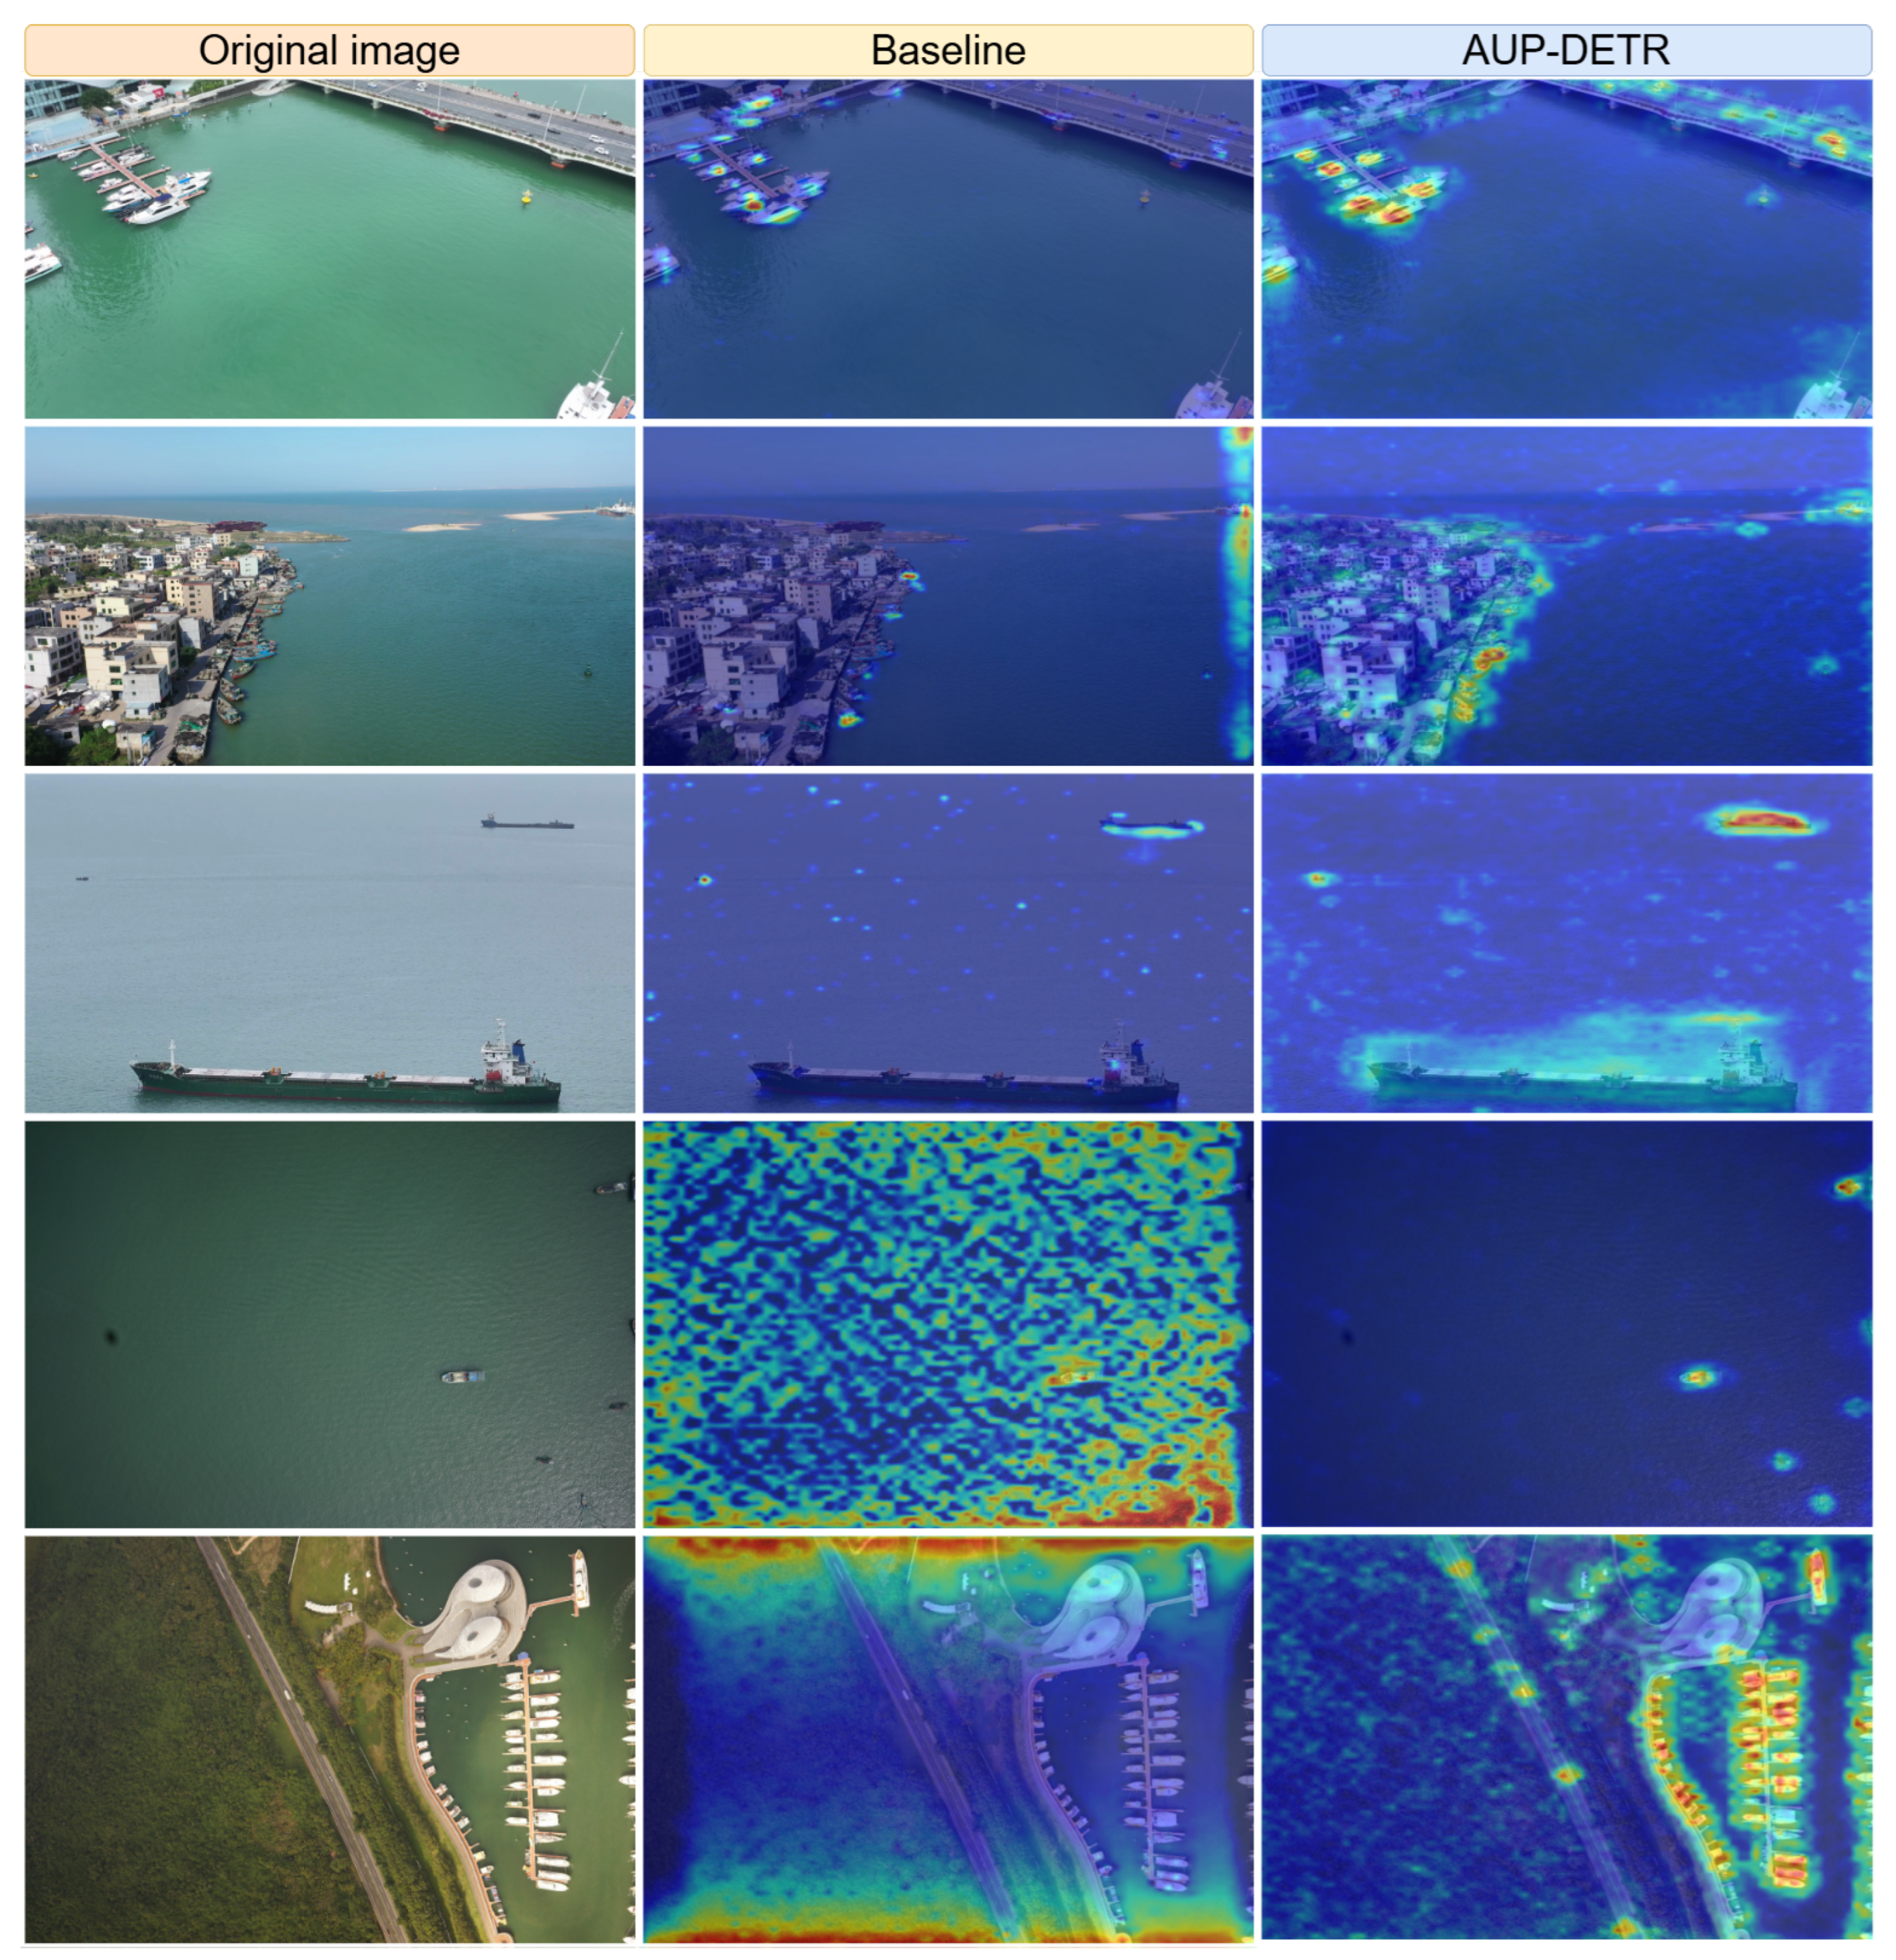
An analysis of attention distributions offers a deeper investigation into the internal mechanisms behind AUP-DETR’s performance improvement compared to the baseline (UAV-DETR-R18). We used heatmaps for this visual analysis, as shown in Figure 9. The heatmaps clearly reveal the limitations of the baseline model’s attention allocation. For example, in the “land–sea mixed scene” (row one), it shows insufficient focus on onshore targets. It also lacks a holistic perception of the large target in the “extreme scale variations” scene (row three). In the “land–sea mixed scene” with a tilted perspective (row two), the baseline’s attention on coastal ships is clearly deficient. In contrast, AUP-DETR precisely focuses on the ship targets along the coast. For the small-object scene in row four, AUP-DETR effectively suppresses background noise from the water surface. This allows it to achieve precise target localization. Conversely, the baseline model’s attention appears chaotic and unfocused. For the “dense object distributions” scene (row five), AUP-DETR also demonstrates more fine-grained attention, which allows it to better distinguish and locate each individual vessel. In summary, these visualizations indicate that AUP-DETR appears to employ a more effective and precise attention mechanism. This mechanism allows the model to better suppress background noise and focus on diverse, true targets. As a result, the model’s detection performance is significantly improved.
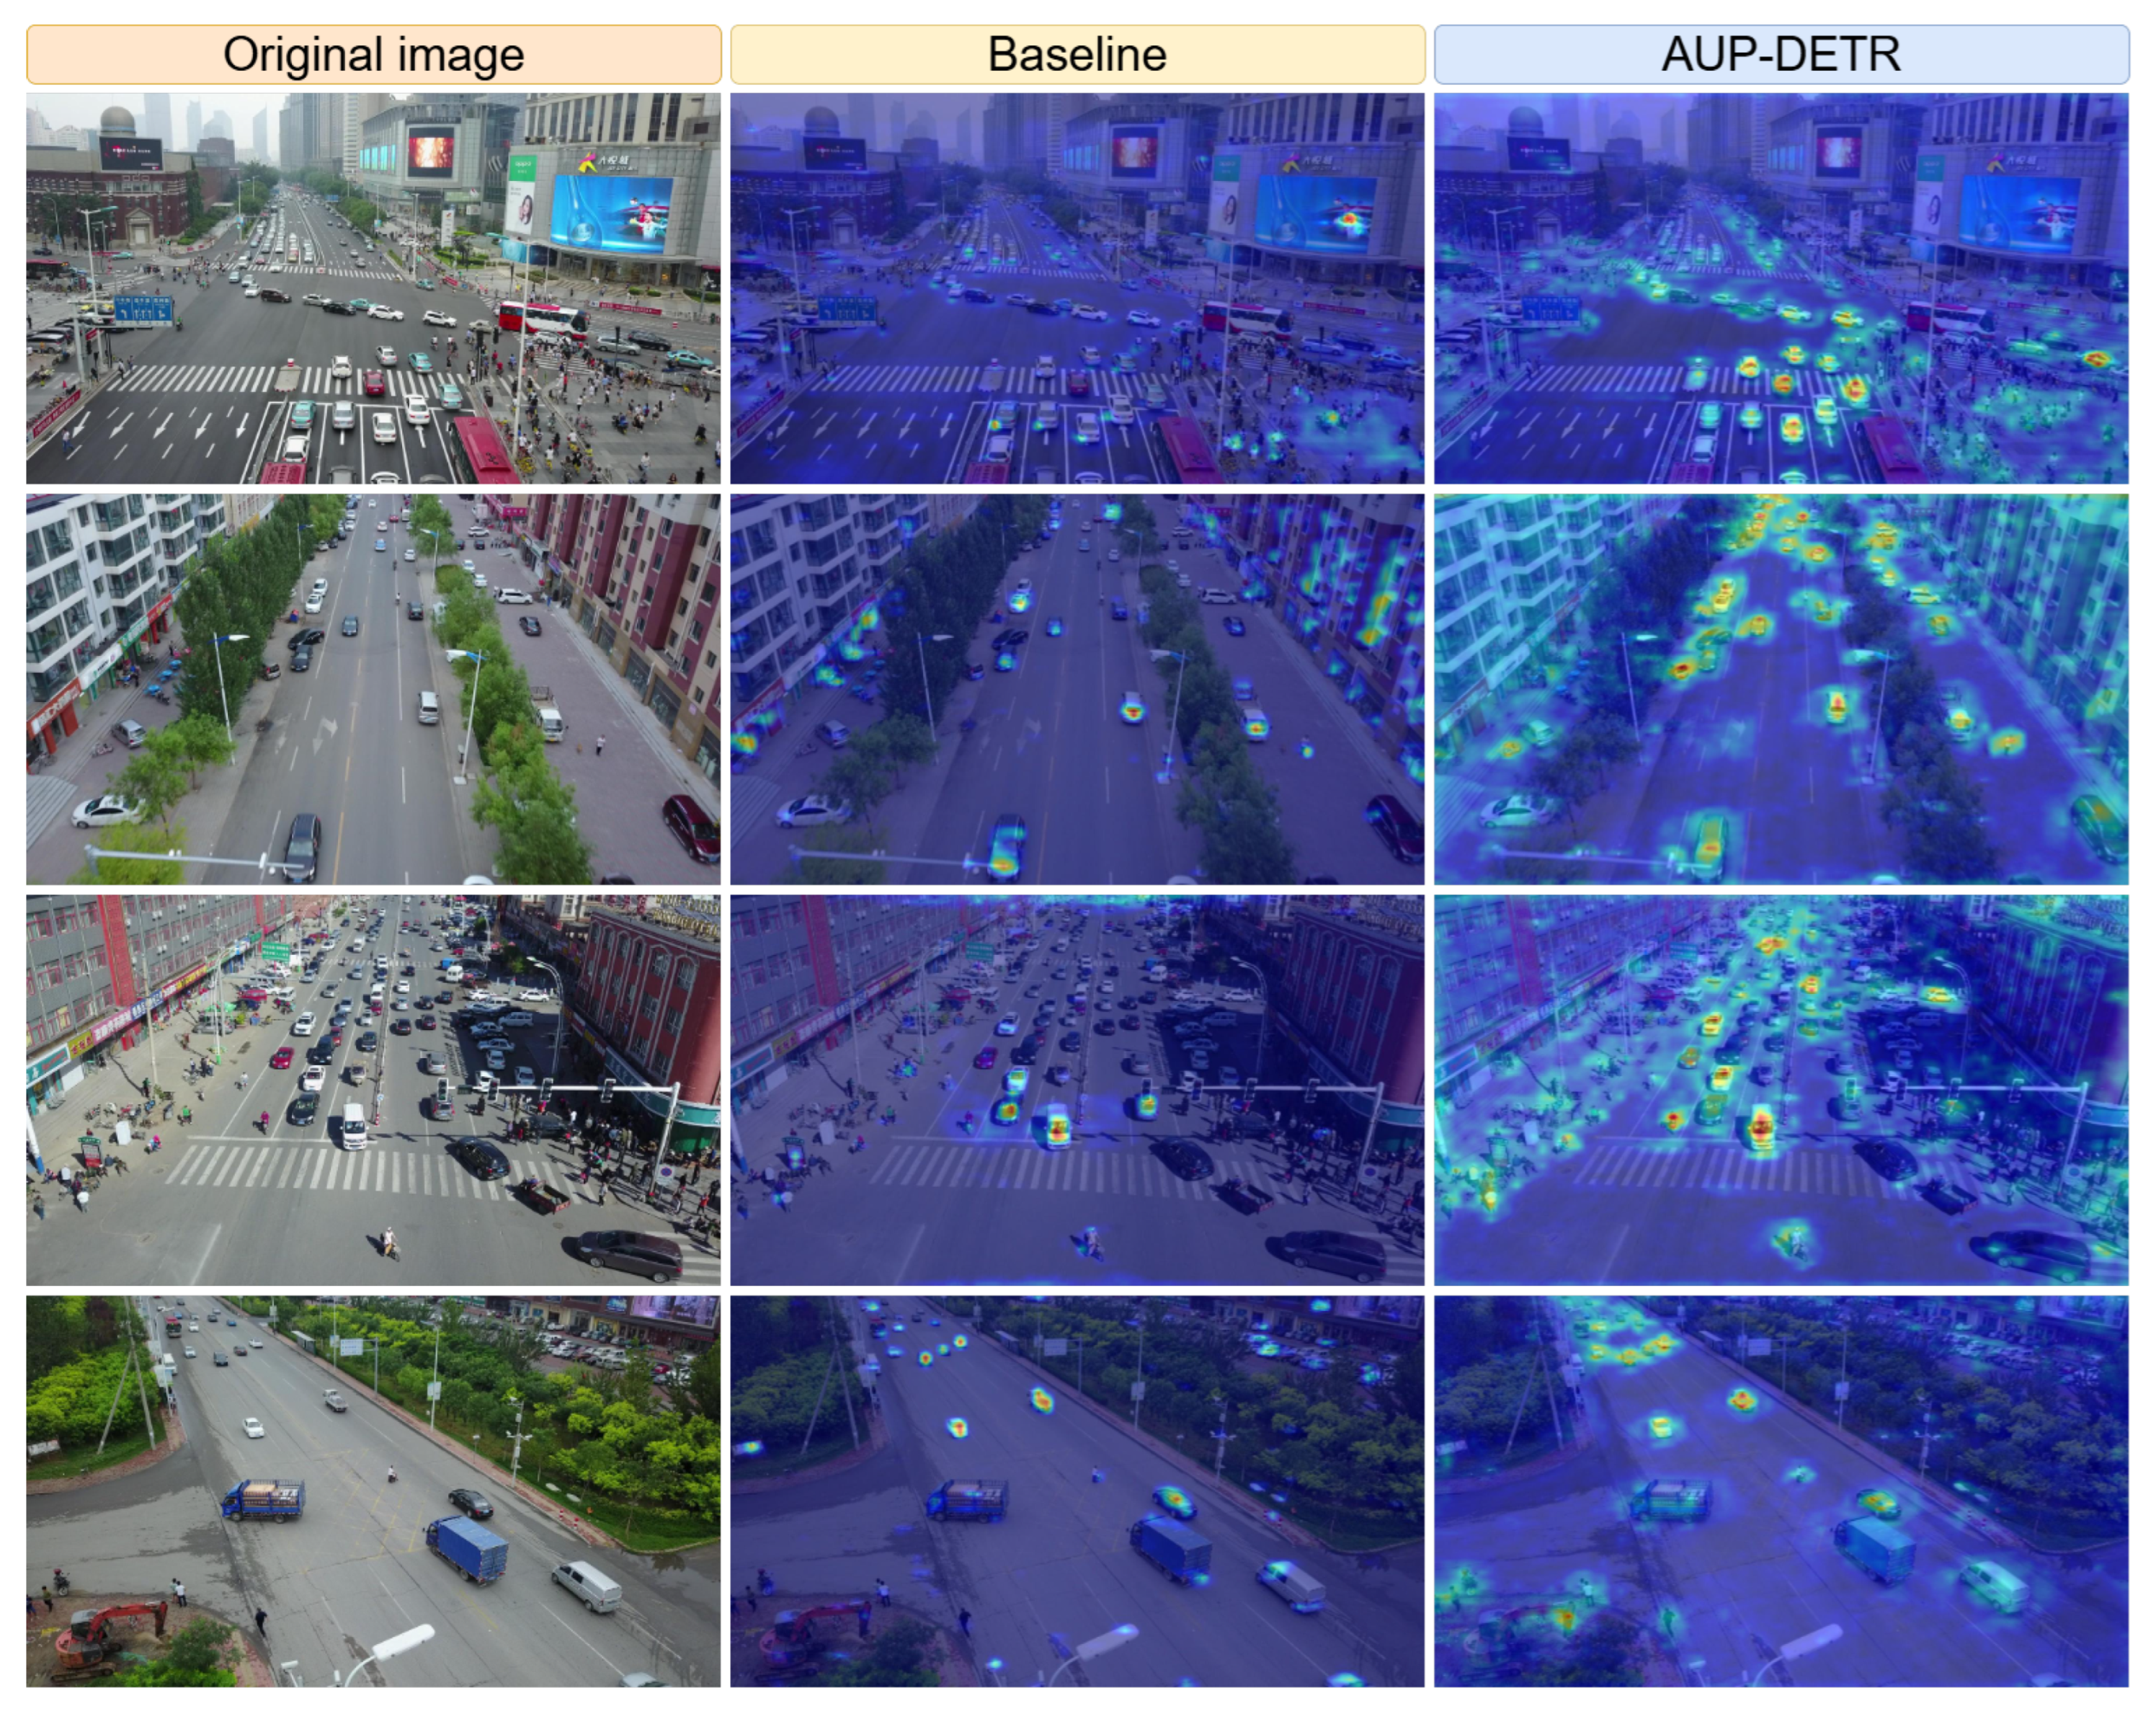
To further validate the generalization capability of AUP-DETR, we also generated attention heatmaps on the VisDrone dataset. As shown in Figure 10, these maps were used to compare the feature-focusing abilities of our model and the baseline in general aerial scenarios. The comparison reveals that the baseline’s attention is often scattered and weak in various complex urban traffic environments. As a result, it tends to overlook distant, small, or densely packed objects. In contrast, AUP-DETR exhibits a significantly superior attention-focusing mechanism. Our model produces stronger and more precise activation areas in various scenes. These include intersections with dense vehicles and pedestrians (rows one and three). They also include road scenes with large target scale variations (rows two and four), which allows for comprehensive coverage of most true targets. This visual evidence again confirms that AUP-DETR’s architectural improvements are effective. The model can more efficiently extract and enhance target features from complex backgrounds. This capability boosts performance in specific scenarios and provides strong support for its powerful generalization in generic UAV vision tasks.

5. Conclusions

In this paper, we addressed the pressing challenges of UAV visual perception within the complex urban port scenarios of the low-altitude economy. We proposed AUP-DETR, a novel end-to-end object detection framework that integrates three specialized modules—Fusion-SHC, SSCF, and SAT—to significantly enhance feature representation for multi-scale objects and improve global contextual understanding. To advance research in this domain, we also introduced UCA-Det, a specialized dataset designed to benchmark perception in land–sea mixed scenes, filling a critical gap in existing resources.
Extensive experiments demonstrate the superior performance and efficiency of our framework. On the UCA-Det dataset, AUP-DETR achieves an mAP50 of 69.68% and an mAP95 of 37.80%. This represents a quantifiable improvement of 4.41% in mAP50 over the baseline model (UAV-DETR) and surpasses the state-of-the-art YOLOv11-L by approximately 10%. On the public VisDrone dataset, the model exhibits strong generalization with an mAP50 of 48.5%, maintaining performance comparable to the baseline. Furthermore, AUP-DETR achieves these results with 22.7M parameters and 83.6G FLOPs, confirming that it strikes an excellent balance between high accuracy and computational efficiency suitable for UAV deployment.
Despite these contributions, we acknowledge certain limitations that define our future work. The current baseline does not specifically address the class imbalance in UCA-Det, which necessitates the exploration of class-balanced loss functions. To mitigate information loss for tiny objects caused by the current 640 × 640 input resolution, we plan to investigate tiling strategies or higher-resolution inference. Developing Oriented Bounding Box (OBB) detectors also remains a key direction to better handle the arbitrary orientation of targets in port scenarios. Beyond these improvements, we will prioritize comprehensive ablation studies on the VisDrone dataset to further verify the cross-dataset generalization of our proposed modules. Ultimately, addressing these challenges will pave the way for robust and reliable UAV perception systems essential for the future of the low-altitude economy.

Author Contributions

Conceptualization, J.X. and X.L. (Xiaozhang Liu); methodology, J.X.; software, J.X. and X.L. (Xiulai Li); validation, J.X. and X.L. (Xiulai Li); formal analysis, X.L. (Xiulai Li); investigation, J.X. and Y.H.; resources, X.L. (Xiaozhang Liu) and Y.H.; data curation, J.X. and Y.H.; writing—original draft preparation, J.X.; writing—review and editing, J.X., X.L. (Xiaozhang Liu) and X.L. (Xiulai Li); visualization, J.X.; supervision, X.L. (Xiaozhang Liu); project administration, X.L. (Xiaozhang Liu); funding acquisition, X.L. (Xiaozhang Liu). All authors have read and agreed to the published version of the manuscript.

Funding

This work is supported by the Key R&D Project of Hainan Province (Grant no. ZDYF2025SHFZ059) and the Key Science and Technology Project of Haikou City (No. 2023-054).

Data Availability Statement

The VisDrone dataset used to support the findings of this study is openly available at https://github.com/VisDrone/VisDrone-Dataset (accessed on 6 May 2025). The UCA-Det dataset generated during the current study is not publicly available but can be obtained from the corresponding author upon reasonable request for academic and research purposes.

Conflicts of Interest

Author Yuanyan Hu is the legal representative and director of the company Hangda Hanlai (Tianjin) Aviation Technology Co., Ltd. The remaining authors—Jiajing Xu, Xiaozhang Liu, and Xiulai Li—declare that the research was conducted in the absence of any commercial or financial relationships that could be construed as a potential conflict of interest.

References

  1. Jiang, Y.; Li, X.; Zhu, G.; Li, H.; Deng, J.; Han, K.; Shen, C.; Shi, Q.; Zhang, R. Integrated sensing and communication for low altitude economy: Opportunities and challenges. IEEE Commun. Mag. 2025. Early Access. [Google Scholar] [CrossRef]
  2. Zhou, Y. Unmanned aerial vehicles based low-altitude economy with lifecycle techno-economic-environmental analysis for sustainable and smart cities. J. Clean. Prod. 2025, 499, 145050. [Google Scholar] [CrossRef]
  3. Huang, C.; Fang, S.; Wu, H.; Wang, Y.; Yang, Y. Low-altitude intelligent transportation: System architecture, infrastructure, and key technologies. J. Ind. Inf. Integr. 2024, 42, 100694. [Google Scholar] [CrossRef]
  4. Song, Y.; Zeng, Y.; Yang, Y.; Ren, Z.; Cheng, G.; Xu, X.; Xu, J.; Jin, S.; Zhang, R. An overview of cellular ISAC for low-altitude UAV: New opportunities and challenges. IEEE Commun. Mag. 2025. Early Access. [Google Scholar] [CrossRef]
  5. Bai, Y.; Zhao, H.; Zhang, X.; Chang, Z.; Jäntti, R.; Yang, K. Toward autonomous multi-UAV wireless network: A survey of reinforcement learning-based approaches. IEEE Commun. Surv. Tutor. 2023, 25, 3038–3067. [Google Scholar] [CrossRef]
  6. Wang, J.; Zhou, K.; Xing, W.; Li, H.; Yang, Z. Applications, evolutions, and challenges of drones in maritime transport. J. Mar. Sci. Eng. 2023, 11, 2056. [Google Scholar] [CrossRef]
  7. Leng, J.; Ye, Y.; Mo, M.; Gao, C.; Gan, J.; Xiao, B.; Gao, X. Recent advances for aerial object detection: A survey. ACM Comput. Surv. 2024, 56, 1–36. [Google Scholar] [CrossRef]
  8. Redmon, J.; Divvala, S.; Girshick, R.; Farhadi, A. You only look once: Unified, real-time object detection. In Proceedings of the IEEE Conference on Computer Vision and Pattern Recognition, Las Vegas, NV, USA, 27–30 June 2016; pp. 779–788. [Google Scholar]
  9. Carion, N.; Massa, F.; Synnaeve, G.; Usunier, N.; Kirillov, A.; Zagoruyko, S. End-to-end object detection with transformers. In Proceedings of the European Conference on Computer Vision, Glasgow, UK, 23–28 August 2020; Springer: Berlin/Heidelberg, Germany, 2020; pp. 213–229. [Google Scholar]
  10. Ding, J.; Xue, N.; Xia, G.S.; Bai, X.; Yang, W.; Yang, M.Y.; Belongie, S.; Luo, J.; Datcu, M.; Pelillo, M.; et al. Object detection in aerial images: A large-scale benchmark and challenges. IEEE Trans. Pattern Anal. Mach. Intell. 2021, 44, 7778–7796. [Google Scholar] [CrossRef] [PubMed]
  11. Zhu, P.; Wen, L.; Du, D.; Bian, X.; Fan, H.; Hu, Q.; Ling, H. Detection and tracking meet drones challenge. IEEE Trans. Pattern Anal. Mach. Intell. 2021, 44, 7380–7399. [Google Scholar] [CrossRef]
  12. Du, D.; Qi, Y.; Yu, H.; Yang, Y.; Duan, K.; Li, G.; Zhang, W.; Huang, Q.; Tian, Q. The unmanned aerial vehicle benchmark: Object detection and tracking. In Proceedings of the European Conference on Computer Vision (ECCV), Munich, Germany, 8–14 September 2018; pp. 370–386. [Google Scholar]
  13. Jiao, Z.; Wang, M.; Qiao, S.; Zhang, Y.; Huang, Z. Transformer-based Object Detection in Low-Altitude Maritime UAV Remote Sensing Images. IEEE Trans. Geosci. Remote Sens. 2025, 63, 4210413. [Google Scholar] [CrossRef]
  14. Ren, S.; He, K.; Girshick, R.; Sun, J. Faster R-CNN: Towards real-time object detection with region proposal networks. IEEE Trans. Pattern Anal. Mach. Intell. 2016, 39, 1137–1149. [Google Scholar] [CrossRef]
  15. Hosang, J.; Benenson, R.; Schiele, B. Learning non-maximum suppression. In Proceedings of the IEEE Conference on Computer Vision and Pattern Recognition, Honolulu, HI, USA, 21–26 July 2017; pp. 4507–4515. [Google Scholar]
  16. Zhu, X.; Su, W.; Lu, L.; Li, B.; Wang, X.; Dai, J. Deformable detr: Deformable transformers for end-to-end object detection. arXiv 2020, arXiv:2010.04159. [Google Scholar]
  17. Zhang, H.; Li, F.; Liu, S.; Zhang, L.; Su, H.; Zhu, J.; Ni, L.M.; Shum, H.Y. Dino: Detr with improved denoising anchor boxes for end-to-end object detection. arXiv 2022, arXiv:2203.03605. [Google Scholar]
  18. Zhao, Y.; Lv, W.; Xu, S.; Wei, J.; Wang, G.; Dang, Q.; Liu, Y.; Chen, J. Detrs beat yolos on real-time object detection. In Proceedings of the IEEE/CVF Conference on Computer Vision and Pattern Recognition, Seattle, WA, USA, 16–22 June 2024; pp. 16965–16974. [Google Scholar]
  19. Zhang, H.; Liu, K.; Gan, Z.; Zhu, G.N. UAV-DETR: Efficient end-to-end object detection for unmanned aerial vehicle imagery. arXiv 2025, arXiv:2501.01855. [Google Scholar]
  20. Hua, W.; Chen, Q. A survey of small object detection based on deep learning in aerial images. Artif. Intell. Rev. 2025, 58, 162. [Google Scholar] [CrossRef]
  21. Liu, C.; Gao, G.; Huang, Z.; Hu, Z.; Liu, Q.; Wang, Y. Yolc: You only look clusters for tiny object detection in aerial images. IEEE Trans. Intell. Transp. Syst. 2024, 25, 13863–13875. [Google Scholar] [CrossRef]
  22. Ye, T.; Qin, W.; Li, Y.; Wang, S.; Zhang, J.; Zhao, Z. Dense and small object detection in UAV-vision based on a global-local feature enhanced network. IEEE Trans. Instrum. Meas. 2022, 71, 2515513. [Google Scholar] [CrossRef]
  23. Liu, S.; Qi, L.; Qin, H.; Shi, J.; Jia, J. Path aggregation network for instance segmentation. In Proceedings of the IEEE Conference on Computer Vision and Pattern Recognition, Salt Lake City, UT, USA, 18–22 June 2018; pp. 8759–8768. [Google Scholar]
  24. Bashir, S.M.A.; Wang, Y. Small object detection in remote sensing images with residual feature aggregation-based super-resolution and object detector network. Remote Sens. 2021, 13, 1854. [Google Scholar] [CrossRef]
  25. Zhang, L.; Xing, Z.; Wang, X. Background instance-based copy-paste data augmentation for object detection. Electronics 2023, 12, 3781. [Google Scholar] [CrossRef]
  26. Qian, W.; Yang, X.; Peng, S.; Zhang, X.; Yan, J. RSDet++: Point-based modulated loss for more accurate rotated object detection. IEEE Trans. Circuits Syst. Video Technol. 2022, 32, 7869–7879. [Google Scholar] [CrossRef]
  27. Han, W.; Li, J.; Wang, S.; Wang, Y.; Yan, J.; Fan, R.; Zhang, X.; Wang, L. A context-scale-aware detector and a new benchmark for remote sensing small weak object detection in unmanned aerial vehicle images. Int. J. Appl. Earth Obs. Geoinf. 2022, 112, 102966. [Google Scholar] [CrossRef]
  28. Li, X.; Diao, W.; Mao, Y.; Gao, P.; Mao, X.; Li, X.; Sun, X. OGMN: Occlusion-guided multi-task network for object detection in UAV images. ISPRS J. Photogramm. Remote Sens. 2023, 199, 242–257. [Google Scholar] [CrossRef]
  29. Min, X.; Zhou, W.; Hu, R.; Wu, Y.; Pang, Y.; Yi, J. Lwuavdet: A lightweight uav object detection network on edge devices. IEEE Internet Things J. 2024, 11, 24013–24023. [Google Scholar] [CrossRef]
  30. Ye, T.; Qin, W.; Zhao, Z.; Gao, X.; Deng, X.; Ouyang, Y. Real-time object detection network in UAV-vision based on CNN and transformer. IEEE Trans. Instrum. Meas. 2023, 72, 2505713. [Google Scholar] [CrossRef]
  31. Xia, G.S.; Bai, X.; Ding, J.; Zhu, Z.; Belongie, S.; Luo, J.; Datcu, M.; Pelillo, M.; Zhang, L. DOTA: A large-scale dataset for object detection in aerial images. In Proceedings of the IEEE Conference on Computer Vision and Pattern Recognition, Salt Lake City, UT, USA, 18–22 June 2018; pp. 3974–3983. [Google Scholar]
  32. Liu, S.; Huang, D.; Wang, Y. Learning spatial fusion for single-shot object detection. arXiv 2019, arXiv:1911.09516. [Google Scholar] [CrossRef]
  33. Varghese, R.; Sambath, M. Yolov8: A novel object detection algorithm with enhanced performance and robustness. In Proceedings of the 2024 International Conference on Advances in Data Engineering and Intelligent Computing Systems (ADICS), Chennai, India, 18–19 April 2024; IEEE: Piscataway, NJ, USA, 2024; pp. 1–6. [Google Scholar]
  34. Wang, C.Y.; Yeh, I.H.; Mark Liao, H.Y. Yolov9: Learning what you want to learn using programmable gradient information. In Proceedings of the European Conference on Computer Vision, Milan, Italy, 29 September–4 October 2024; Springer: Berlin/Heidelberg, Germany, 2024; pp. 1–21. [Google Scholar]
  35. Wang, A.; Chen, H.; Liu, L.; Chen, K.; Lin, Z.; Han, J. Yolov10: Real-time end-to-end object detection. Adv. Neural Inf. Process. Syst. 2024, 37, 107984–108011. [Google Scholar]
  36. Khanam, R.; Hussain, M. Yolov11: An overview of the key architectural enhancements. arXiv 2024, arXiv:2410.17725. [Google Scholar] [CrossRef]
  37. PaddlePaddle Authors. PaddleDetection, Object Detection and Instance Segmentation Toolkit Based on PaddlePaddle. 2019. Available online: https://github.com/PaddlePaddle/PaddleDetection (accessed on 24 November 2025).
  38. Yang, C.; Huang, Z.; Wang, N. QueryDet: Cascaded sparse query for accelerating high-resolution small object detection. In Proceedings of the IEEE/CVF Conference on Computer Vision and Pattern Recognition, New Orleans, LA, USA, 19–24 June 2022; pp. 13668–13677. [Google Scholar]
  39. Yang, F.; Fan, H.; Chu, P.; Blasch, E.; Ling, H. Clustered object detection in aerial images. In Proceedings of the IEEE/CVF International Conference on Computer Vision, Seoul, Republic of Korea, 27 October–2 November 2019; pp. 8311–8320. [Google Scholar]
  40. Xu, C.; Ding, J.; Wang, J.; Yang, W.; Yu, H.; Yu, L.; Xia, G.S. Dynamic coarse-to-fine learning for oriented tiny object detection. In Proceedings of the IEEE/CVF Conference on Computer Vision and Pattern Recognition, Vancouver, BC, Canada, 18–22 June 2023; pp. 7318–7328. [Google Scholar]
  41. Tang, S.; Zhang, S.; Fang, Y. HIC-YOLOv5: Improved YOLOv5 for small object detection. In Proceedings of the 2024 IEEE International Conference on Robotics and Automation (ICRA), Yokohama, Japan, 13–17 May 2024; IEEE: Piscataway, NJ, USA, 2024; pp. 6614–6619. [Google Scholar]
  42. Roh, B.; Shin, J.; Shin, W.; Kim, S. Sparse detr: Efficient end-to-end object detection with learnable sparsity. arXiv 2021, arXiv:2111.14330. [Google Scholar]
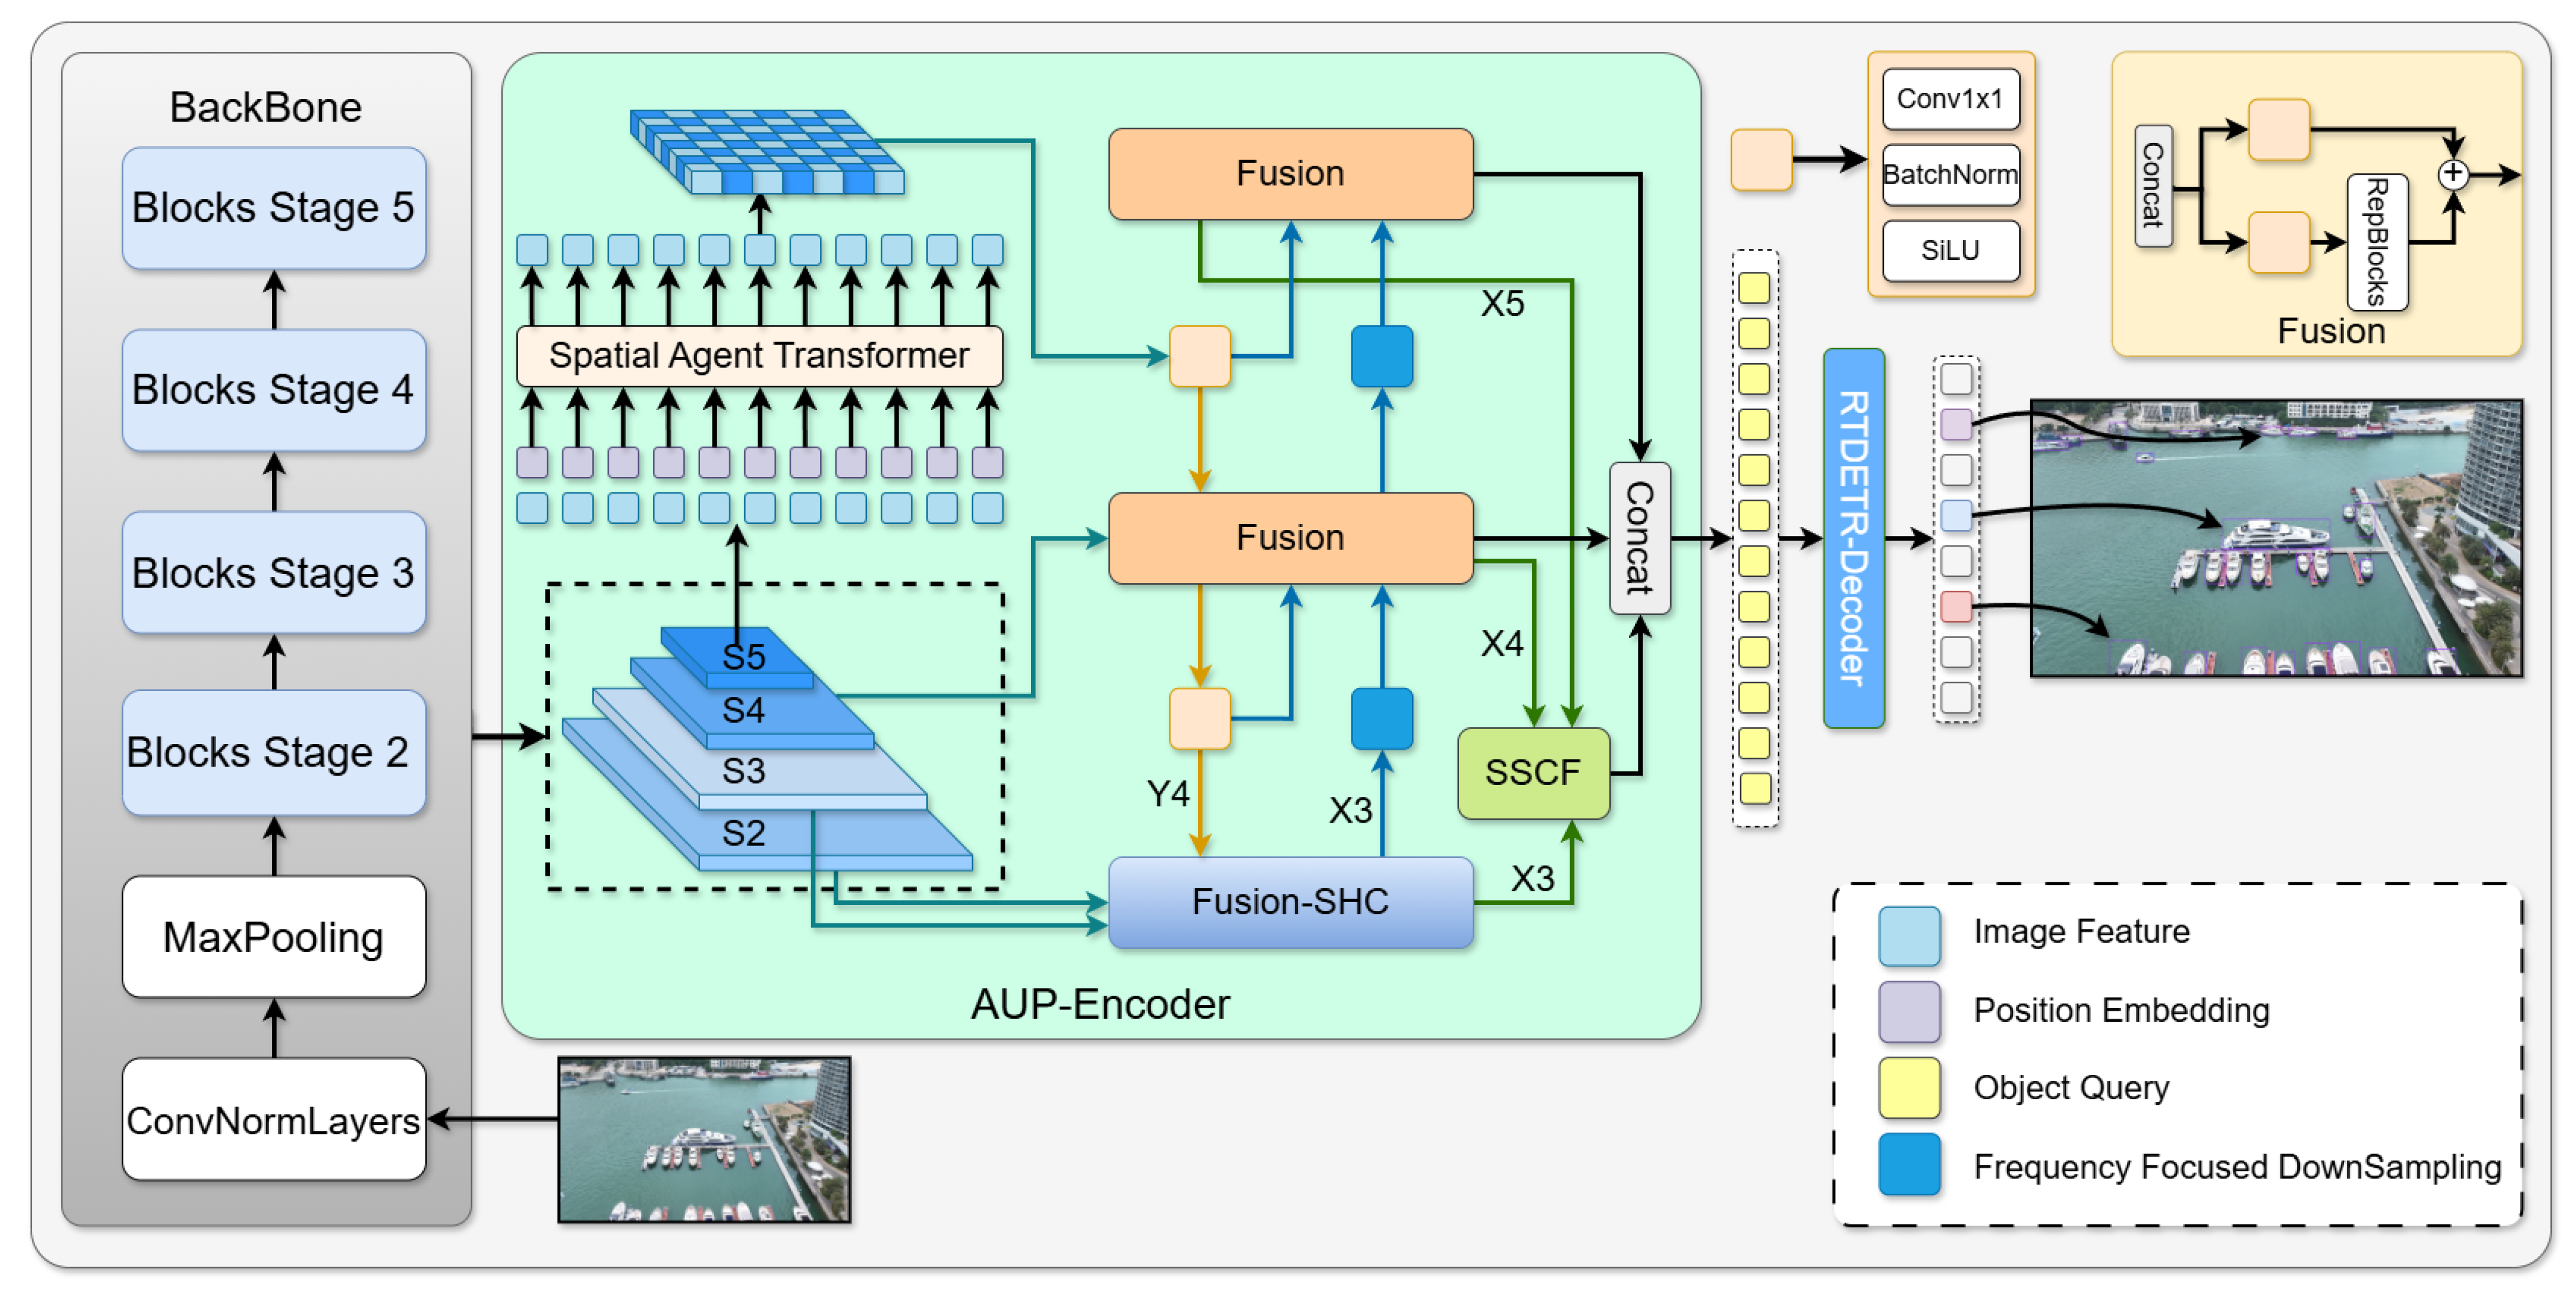
Figure 1. The overall architecture of AUP-DETR. The framework consists of a CNN backbone, a well-designed AUP-Encoder, and a standard DETR decoder. The AUP-Encoder is the core of our innovation. It sequentially processes multi-scale features via three key modules: the SAT, Fusion-SHC, and SSCF.
Drones 09 00822 g001
Figure 2. Structure of Fusion-SHC module.
Drones 09 00822 g002
Figure 3. Structure of the SSCF module.
Drones 09 00822 g003
Figure 4. Detailed structure of the SAT: (A) The overall workflow of the SAT, which consists of input/output mapping layers and N stacked Adaptive Residual Blocks (ARBs). The expanded view shows the internal structure of an ARB. It comprises two core components: (B) AgentAttention and (C) Spatial-Aware FFN.
Drones 09 00822 g004
Figure 5. Sample images from the UCA-Det dataset. Columns represent extreme scale variations (Small, Medium, and Large Objects). Rows represent combinations of land–sea mixed scenes and dense object distributions (mainly sea/mainly land and dense/sparse).
Drones 09 00822 g005
Figure 6. Visualization of detection results from the ablation study. The columns demonstrate performance across the three core challenges: “land–sea mixed scenes” (first column), “extreme scale variations” (second column), and “dense object distributions” (third column). All results are generated using an IoU threshold of 0.5. Areas indicated by red arrows and enclosed in red dashed boxes represent missed or false detections by the model.
Drones 09 00822 g006
Figure 7. Normalized confusion matrices for the baseline (UAV-DETR-R18) and our AUP-DETR: (a) Baseline on UCA-Det. (b) AUP-DETR on UCA-Det. (c) Baseline on VisDrone. (d) AUP-DETR on VisDrone. Darker shades on the diagonal indicate higher true positive rates (TPRs).
Drones 09 00822 g007
Figure 8. Visual comparison of detection results between the baseline and AUP-DETR on the VisDrone validation set. Zoomed-in insets are provided for better visualization in challenging scenarios. All results are generated using an IoU threshold of 0.5. As can be seen, AUP-DETR performs better in several challenging scenarios. For example, it reduces missed detections of small and occluded objects (rows one to three). It also improves localization accuracy in dense scenes (row four). Finally, the model demonstrates improved classification accuracy (row five), where it correctly identifies the object as a ‘van’, while the baseline misclassifies it as a ‘car’.
Drones 09 00822 g008
Figure 9. Visual analysis of AUP-DETR and the baseline model (UAV-DETR-R18) on the UCA-Det dataset. Red colors indicate high attention values, while blue colors indicate low attention values.
Drones 09 00822 g009
Figure 10. Visual analysis of AUP-DETR and the baseline model (UAV-DETR-R18) on the VisDrone dataset. Red colors indicate high attention values, while blue colors indicate low attention values.
Drones 09 00822 g010
Table 1. Main hyperparameter settings for the experiments.
HyperparameterValue
Total Epochs400
Patience20
Batch Size4
Input Image Size640 × 640
OptimizerAdamW
Initial Learning Rate0.0001
Weight Decay0.0001
Warmup Steps2000
Warmup Momentum0.8
Horizontal Flip0.5
Mosaic1
Mixup0.2
Table 2. Ablation study results of different modules on the UCA-Det dataset. The symbols ✗ and ✓ indicate the absence and presence of the module, respectively.
AblationFusion-SHCSSCFSATP (%)R (%)mAP95 (%)mAP50 (%)Params (M)Flops (G)
177.0860.5734.8465.2721.372.5
266.4756.2733.1460.0221.171.3
378.5657.3935.1063.1521.682.6
482.2463.7437.8069.6822.783.6
Table 3. Effect of different numbers of ARB layers in SAT on model performance.
ARB LayerP (%)R (%)mAP95 (%)mAP50 (%)Params (M)Flops (G)
181.5260.9234.6663.9222.183.1
282.2463.7437.8069.6822.783.6
376.2961.0136.0766.6623.484.1
472.0261.2735.8165.9324.084.6
570.0061.9534.5865.0124.685.0
Table 4. Effect of different numbers of attention heads in SAT on model performance.
Attention HeadP (%)R (%)mAP95 (%)mAP50 (%)Params (M)Flops (G)
268.8360.7535.2162.6122.783.6
474.1159.7434.7862.9822.783.6
882.2463.7437.8069.6822.783.6
1675.2057.5134.7361.3122.783.6
3264.2660.0733.3761.1022.783.6
Table 5. Performance comparison of different detection models on the UCA-Det dataset. The best results in each column are in bold, and the second-best are underlined.
ModelP (%)R (%)mAP95 (%)mAP50 (%)APS (%)APM (%)APL (%)Params (M)Flops (G)
YOLOv8-M [33]73.4252.6031.4255.7318.035.756.825.978.9
YOLOv8-L [33]73.0249.3932.1255.8719.536.560.043.7165.2
YOLOv8-X [33]60.5348.3231.1153.9818.335.051.868.2257.8
YOLOv9-S [34]78.0244.3426.0948.6013.430.940.47.226.9
YOLOv9-M [34]60.8851.5729.9554.1016.535.255.020.176.8
YOLOv10-M [35]65.7445.4531.0853.6617.437.748.815.459.1
YOLOv10-L [35]74.6347.7929.9853.2316.134.353.424.4120.4
YOLOv10-X [35]68.7450.9730.7955.2120.235.550.529.5160.4
YOLOv11-N [36]56.5535.6721.1840.209.525.640.42.66.5
YOLOv11-S [36]56.3150.3829.6953.4816.834.354.69.421.5
YOLOv11-M [36]67.1452.8330.7756.0619.134.857.420.168.0
YOLOv11-L [36]65.4056.5033.2259.8619.339.854.825.386.9
YOLOv11-X [36]62.6257.7833.8259.1020.040.664.757.0194.9
RT-DETR-R18 [18]66.9665.9635.2266.6229.337.135.826.167.6
RT-DERT-R50 [18]71.0654.9535.4062.8428.238.936.442.0129.6
UAV-DETR-R18 [19]77.0860.5734.8465.2729.136.041.421.372.5
UAV-DETR-R50 [19]78.7961.0036.9064.9131.439.237.344.6161.4
AUP-DETR (Ours)82.2463.7437.8069.6832.038.042.322.783.6
Table 6. Performance comparison of different detection models on the VisDrone dataset. The best results in each column are in bold, and the second-best are underlined.
ModelmAP95 (%)mAP50 (%)Params (M)Flops (G)
YOLOv8-M [33]24.640.725.978.9
YOLOv8-L [33]26.142.743.7165.2
YOLOv8-X [33]29.146.768.2257.8
YOLOv9-S [34]22.738.37.226.9
YOLOv9-M [34]25.242.020.176.8
YOLOv10-M [35]24.540.515.459.1
YOLOv10-L [35]26.343.124.4120.4
YOLOv10-X [35]29.647.129.5160.4
YOLOv11-N [36]18.831.92.66.5
YOLOv11-S [36]23.038.79.421.5
YOLOv11-M [36]25.943.120.168.0
YOLOv11-L [36]29.447.225.386.9
YOLOv11-X [36]31.049.257.0194.9
PP-YOLOE-P2-Alpha-l [37]30.148.954.1111.4
QueryDet [38]28.348.133.9212.0
ClusDet [39]26.750.630.2207.0
DCFL [40]32.136.1157.8
HIC-YOLOv5 [41]26.044.39.431.2
DETR [9]24.140.160.0187.0
Deformable DETR [16]27.142.240.0173.0
Sparse DETR [42]27.342.540.9121.0
RT-DETR-R18 [18]26.744.626.167.6
RT-DETR-R50 [18]28.447.042.0129.6
UAV-DETR-EV2 [19]28.747.513.042.9
UAV-DETR-R18 [19]29.848.821.372.5
UAV-DETR-R50 [19]31.551.144.6161.4
AUP-DETR (Ours)29.948.522.783.6
Disclaimer/Publisher’s Note: The statements, opinions and data contained in all publications are solely those of the individual author(s) and contributor(s) and not of MDPI and/or the editor(s). MDPI and/or the editor(s) disclaim responsibility for any injury to people or property resulting from any ideas, methods, instructions or products referred to in the content.