Article

Refined Extraction of Sugarcane Planting Areas in Guangxi Using an Improved U-Net Model

1
College of Geomatics and Geoinformation, Guilin University of Technology, Guilin 541004, China
2
Guangxi Key Laboratory of Spatial Information and Geomatics, Guilin University of Technology, Guilin 541004, China
3
Guangxi Academy of Artificial Intelligence, Nanning 530200, China
4
Wuhan Kedao Geographic Information Engineering Co., Ltd., Wuhan 430080, China
5
Natural Resources Information Center of Guangxi Zhuang Autonomous Region, Nanning 530200, China
*
Author to whom correspondence should be addressed.
Drones 2025, 9(11), 754; https://doi.org/10.3390/drones9110754 (registering DOI)
Submission received: 22 September 2025 / Revised: 25 October 2025 / Accepted: 28 October 2025 / Published: 30 October 2025

Highlights

What are the main findings?
  • The proposed RCAU-Net model, which integrates ResNet50, CBAM, and ASPP modules, achieved 97.19% overall accuracy and a 94.47% mean Intersection over Union, significantly refining the accuracy of sugarcane extraction based on UAV imagery.
  • The model effectively suppresses misclassification of spectrally similar crops, minimizes internal holes in large continuous patches, reduces false extractions in small or boundary regions, and produces results with smoother and more accurate boundaries.
What are the implications of the main findings?
  • The model developed in this study enables high-precision, large-scale sugarcane monitoring, providing critical support for sugar industry supply security and smart agricultural management.
  • The framework offers a transferable solution for the refined extraction of similar economic crops, facilitating efficient and accurate UAV remote sensing applications in agriculture.

Abstract

Sugarcane, a vital economic crop and renewable energy source, requires precise monitoring of the area in which it has been planted to ensure sugar industry security, optimize agricultural resource allocation, and allow the assessment of ecological benefits. Guangxi Zhuang Autonomous Region, leveraging its subtropical climate and abundant solar thermal resources, accounts for over 63% of China’s total sugarcane cultivation area. In this study, we constructed an enhanced RCAU-net model and developed a refined extraction framework that considers different growth stages to enable rapid identification of sugarcane planting areas. This study addresses key challenges in remote-sensing-based sugarcane extraction, namely, the difficulty of distinguishing spectrally similar objects, significant background interference, and insufficient multi-scale feature fusion. To significantly enhance the accuracy and robustness of sugarcane identification, an improved RCAU-net model based on the U-net architecture was designed. The model incorporates three key improvements: it replaces the original encoder with ResNet50 residual modules to enhance discrimination of similar crops; it integrates a Convolutional Block Attention Module (CBAM) to focus on critical features and effectively suppress background interference; and it employs an Atrous Spatial Pyramid Pooling (ASPP) module to bridge the encoder and decoder, thereby optimizing the extraction of multi-scale contextual information. A refined extraction framework that accounts for different growth stages was ultimately constructed to achieve rapid identification of sugarcane planting areas in Guangxi. The experimental results demonstrate that the RCAU-net model performed excellently, achieving an Overall Accuracy (OA) of 97.19%, a Mean Intersection over Union (mIoU) of 94.47%, a Precision of 97.31%, and an F1 Score of 97.16%. These results represent significant improvements of 7.20, 10.02, 6.82, and 7.28 percentage points in OA, mIoU, Precision, and F1 Score, respectively, relative to the original U-net. The model also achieved a Kappa coefficient of 0.9419 and a Recall rate of 96.99%. The incorporation of residual structures significantly reduced the misclassification of similar crops, while the CBAM and ASPP modules minimized holes within large continuous patches and false extractions of small patches, resulting in smoother boundaries for the extracted areas. This work provides reliable data support for the accurate calculation of sugarcane planting area and greatly enhances the decision-making value of remote sensing monitoring in modern agricultural management of sugarcane.

1. Introduction

Sugarcane is a vital global economic crop and renewable energy source [1,2]. Guangxi Zhuang Autonomous Region, as China’s foremost production base, accounts for over 63% of the national cultivation area, playing a strategic role in sugar security [3]. The ongoing advancement of agriculture towards intelligent systems [4,5,6] has created a pressing demand for high-precision, efficient spatial crop data for supporting decision-making regarding resource allocation, yield forecasting, and smart management [7]. This situation underscores the critical need for automated remote sensing technologies capable of large-scale, accurate sugarcane planting area extraction [8].
Against the backdrop of conventional remote sensing [9,10,11], unmanned aerial vehicle (UAV) remote sensing has emerged as a key tool for agricultural monitoring due to its high spatial resolution and flexibility [12,13,14,15]. In crop monitoring, this technology demonstrates significant value in field area estimation [16], growth status assessment [17], yield prediction [18], and crop-disease/pest identification [19]. For instance, Wang et al. [20] integrated multi-feature factors from UAV RGB imagery with object-based classification, achieving high-precision detection of maize lodging severity and optimizing sowing density and fertilization strategies. Dimyati et al. [21] evaluated four consumer-grade UAV multispectral cameras in rice fields, finding and validating strong correlations between low-cost visible-band VARI index and NDVI data. Li et al. [22] combined UAV RGB and hyperspectral imaging, extracting plant height via Digital Surface Models (DSMs) to establish machine learning models for potato biomass estimation and yield forecasting. Narmilan et al. [23] utilized UAV multispectral imagery along with machine learning algorithms and vegetation indices to achieve high-accuracy detection of the severity of sugarcane white leaf disease. Xu et al. [24] employed UAV LiDAR data and random forest regression to precisely estimate sugarcane aboveground fresh weight, generating high-resolution yield distribution maps.
In recent years, deep learning techniques have demonstrated remarkable advantages in intelligent remote sensing image processing [25,26]. In agricultural remote sensing, deep learning methods have been extensively applied to diverse tasks: Maimaitijiang et al. [27] fused multi-sensor canopy features from low-altitude UAVs with a deep neural network (DNN-F2) to predict soybean and potato yields. Yang et al. [28] employed semantic segmentation networks (FCN-AlexNet and SegNet) combined with vegetation indices (ExG, ExR, and ExGR) pertaining to UAV visible-light imagery to precisely identify rice lodging areas. Kerkech et al. [29] developed an optimized image registration algorithm and SegNet segmentation model, fusing visible and near-infrared imagery for pixel-level detection of grapevine powdery mildew. Modi et al. [30] utilized smartphone field imagery with six deep learning models and data augmentation to automate sugarcane weed recognition, providing a low-cost visual decision solution for intelligent weeding equipment through hyperparameter optimization. Adrian et al. [31] integrated Sentinel-1 SAR and Sentinel-2 optical imagery via a U-net model on Google Earth Engine, achieving high-precision classification of 10 crop types in complex agricultural landscapes. However, in regions like Guangxi that are characterized by intensive double-ratoon cropping, a key challenge arises: sugarcane plants at drastically different growth stages coexist in a single image due to decentralized management. This phenological heterogeneity creates significant intra-class spectral variance and complexity that existing studies [27,28,29,30,31] have not adequately addressed, particularly for the automated, high-precision extraction of sugarcane planting areas across large regions.
To address this region-specific challenge and meet the practical need for accurate sugarcane mapping, this study focuses on the precise extraction of sugarcane amidst multi-growth-stage complexity. The aim of this study was to develop a robust deep learning solution for this task. We propose an improved model named RCAU-net. This model enhances the standard U-net architecture [32,33,34], which has become a crucial tool for agricultural remote sensing information extraction [35,36,37]. The proposed RCAU-net features a ResNet50 backbone [38,39] for deeper feature learning, a Convolutional Block Attention Module (CBAM) [40] to enhance feature discriminability, and an Atrous Spatial Pyramid Pooling (ASPP) module [41] to capture multi-scale contextual information. This integration is designed to allow precise extraction of sugarcane planting areas containing crops at various growth stages. The research outcomes are expected to provide a robust solution for smart agricultural management in Guangxi and offer a methodological reference for similar crops.

2. Materials and Methods

2.1. Study Area Overview

Located in Southern China, Guangxi Zhuang Autonomous Region (20°54′09″ N–26°23′19″ N, 104°26′48″ E–112°03′24″ E; Figure 1) occupies a transitional zone between the southeastern edge of the Yunnan–Guizhou Plateau (China’s second topographic tier) and the western Lingnan Hills. Bordered by the Beibu Gulf to the south, the terrain exhibits a general northwest-to-southeast slope [42]. The Tropic of Cancer crosses the central part of the region, which falls within the subtropical monsoon climate zone. As a major sugarcane-producing area in China, Guangxi benefits from an average annual temperature of 20–24 °C, annual precipitation ranging from 1200 to 1800 mm, and abundant sunlight, providing the critical hydrothermal conditions for sugarcane growth across different developmental stages.

2.2. Image Data Acquisition

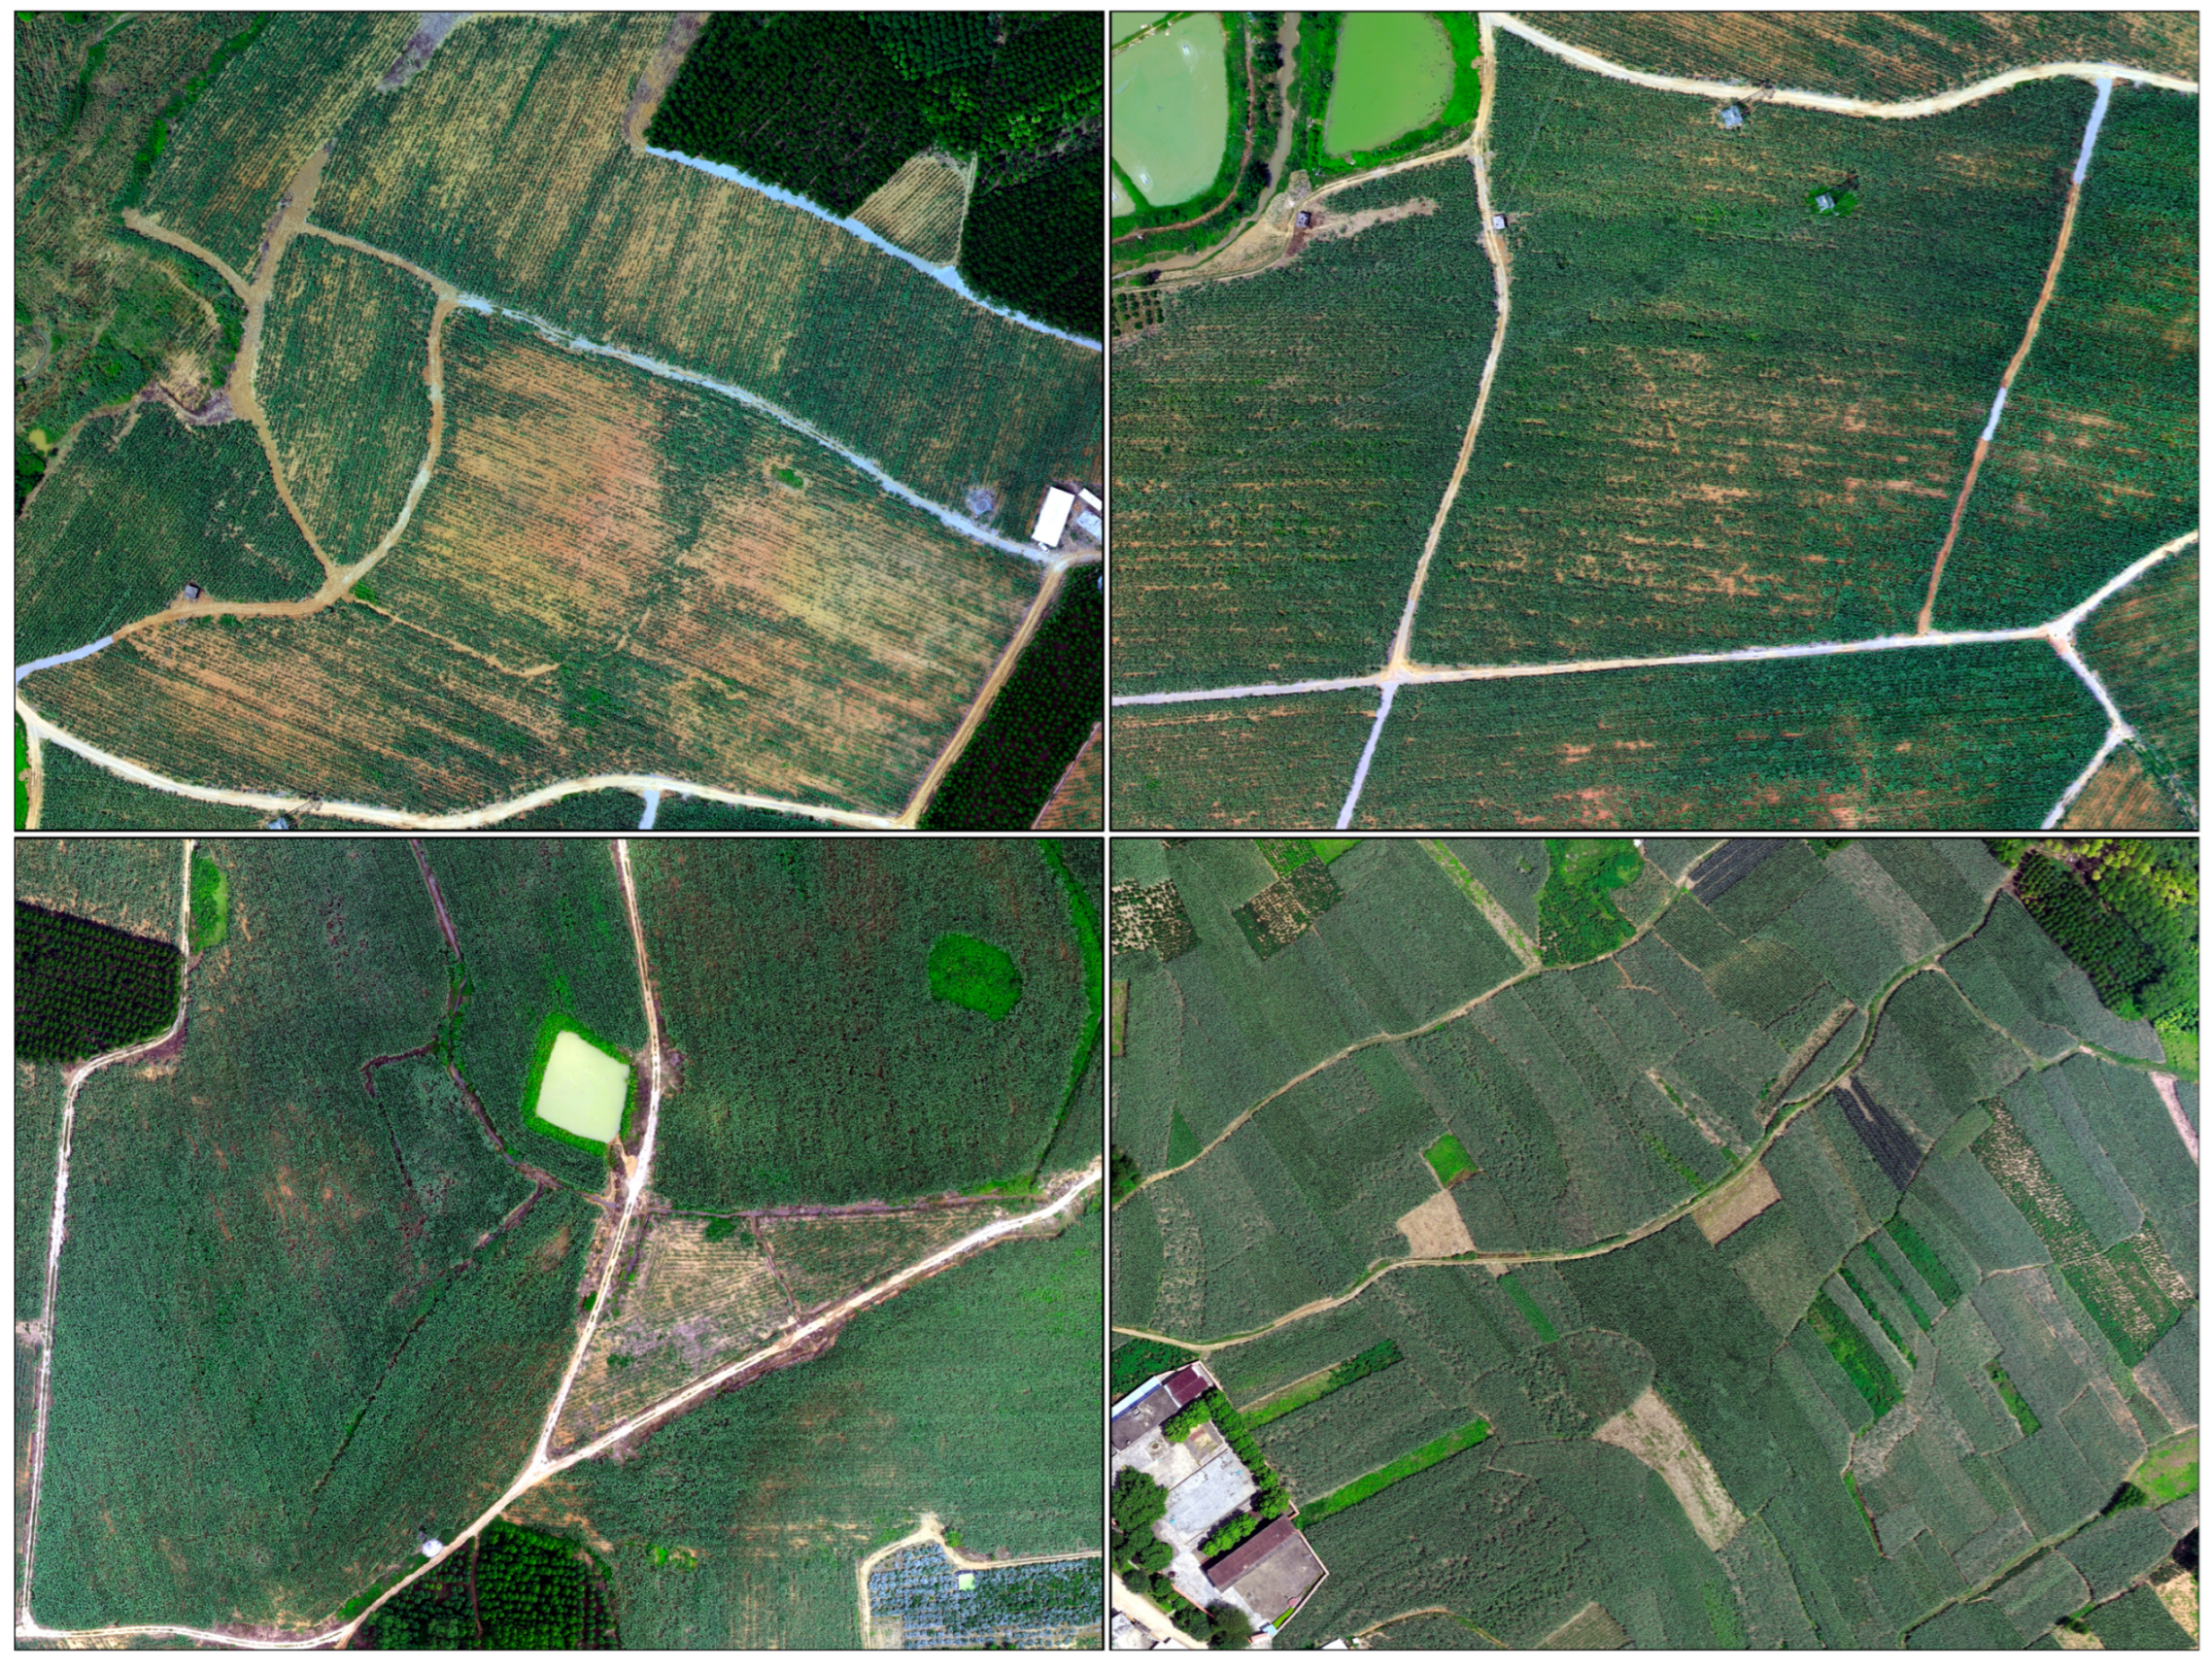
The image data were acquired via aerial photography using a DJI Phantom 4 RTK unmanned aerial vehicle (UAV) equipped with a 2.54 cm CMOS sensor (20 million effective pixels). Data were collected from January to April in 2023 over sugarcane planting areas across six distinct locations in Guangxi, covering a total area of approximately 24.63 km2. The configuration of the flight mission was an altitude of 150 m, a forward overlap of 80%, and a side overlap of 65% to ensure high-quality data acquisition. The flight altitude was set to achieve a ground-sampling distance of approximately 4.0 cm, balancing the need for high spatial resolution with maintaining effective coverage per flight mission. A lower altitude would improve resolution but reduce coverage efficiency, while a higher altitude would compromise the visibility of fine crop features essential for accurate segmentation and manual visual interpretation. The acquired images were processed using photogrammetric software, namely, Pix4Dmapper v 4.5.6, to generate orthomosaics. Details on the sampling locations and extents are provided in Table 1 and Figure 2. Importantly, the column ‘Number of Orthomosaic Scenes’ in Table 1 refers to the number of final, complete georeferenced orthomosaic map products generated for each study area. Notably, for three locations—Wuning Town (Wuming District, Nanning), the border between Siyang Town and Jiao’an Town (Shangsi County, Fangchenggang), and Laituan Town (Jiangzhou District, Chongzuo)—the images were captured over the same regions during two distinct periods. This multi-temporal acquisition strategy was designed to capture the phenological changes in sugarcane across different growth stages, thereby allowing the construction of a more comprehensive sample dataset for these specific areas. Conversely, imagery from Luwo Town (Nanning) was reserved exclusively for testing model performance, and it was not incorporated into the construction of the sample database.
All images were uniformly processed into a three-band RGB format, resampled to a spatial resolution of 0.1 m × 0.1 m, standardized to an 8-bit unsigned integer pixel depth, and georeferenced using the CGCS2000 projected coordinate system within its 3-degree zoning framework.

2.3. Dataset

2.3.1. Data Annotation

Target samples were extracted through manual visual interpretation involving vector polygon delineation and attribute assignment on tiled sample imagery. Parcels exhibiting definitive spectral–textural characteristics of sugarcane were classified as positive samples, while areas featuring complete shadow occlusion, unidentifiable land cover types, and non-target features were designated negative samples. Post-annotation, all label vectors underwent topological validation and attribute logic verification. The sample annotation results are illustrated in Figure 3.
Due to hardware constraints, the original image dimensions exceeded computational load thresholds. To ensure training stability, both the raw imagery and resampled labels were processed using sliding-window cropping with a size of 512 × 512 pixels and a 20% overlap. The patch with dimensions of 512 × 512 was selected because it offers a sufficiently broad contextual field of view for recognizing sugarcane plots while remaining computationally manageable within the 24 GB GPU memory available. The 20% overlap helps mitigate the loss of contextual information and reduces potential edge artifacts at patch boundaries during prediction, thereby facilitating the reconstruction of seamless extraction results without substantially increasing the total number of patches.

2.3.2. Data Augmentation

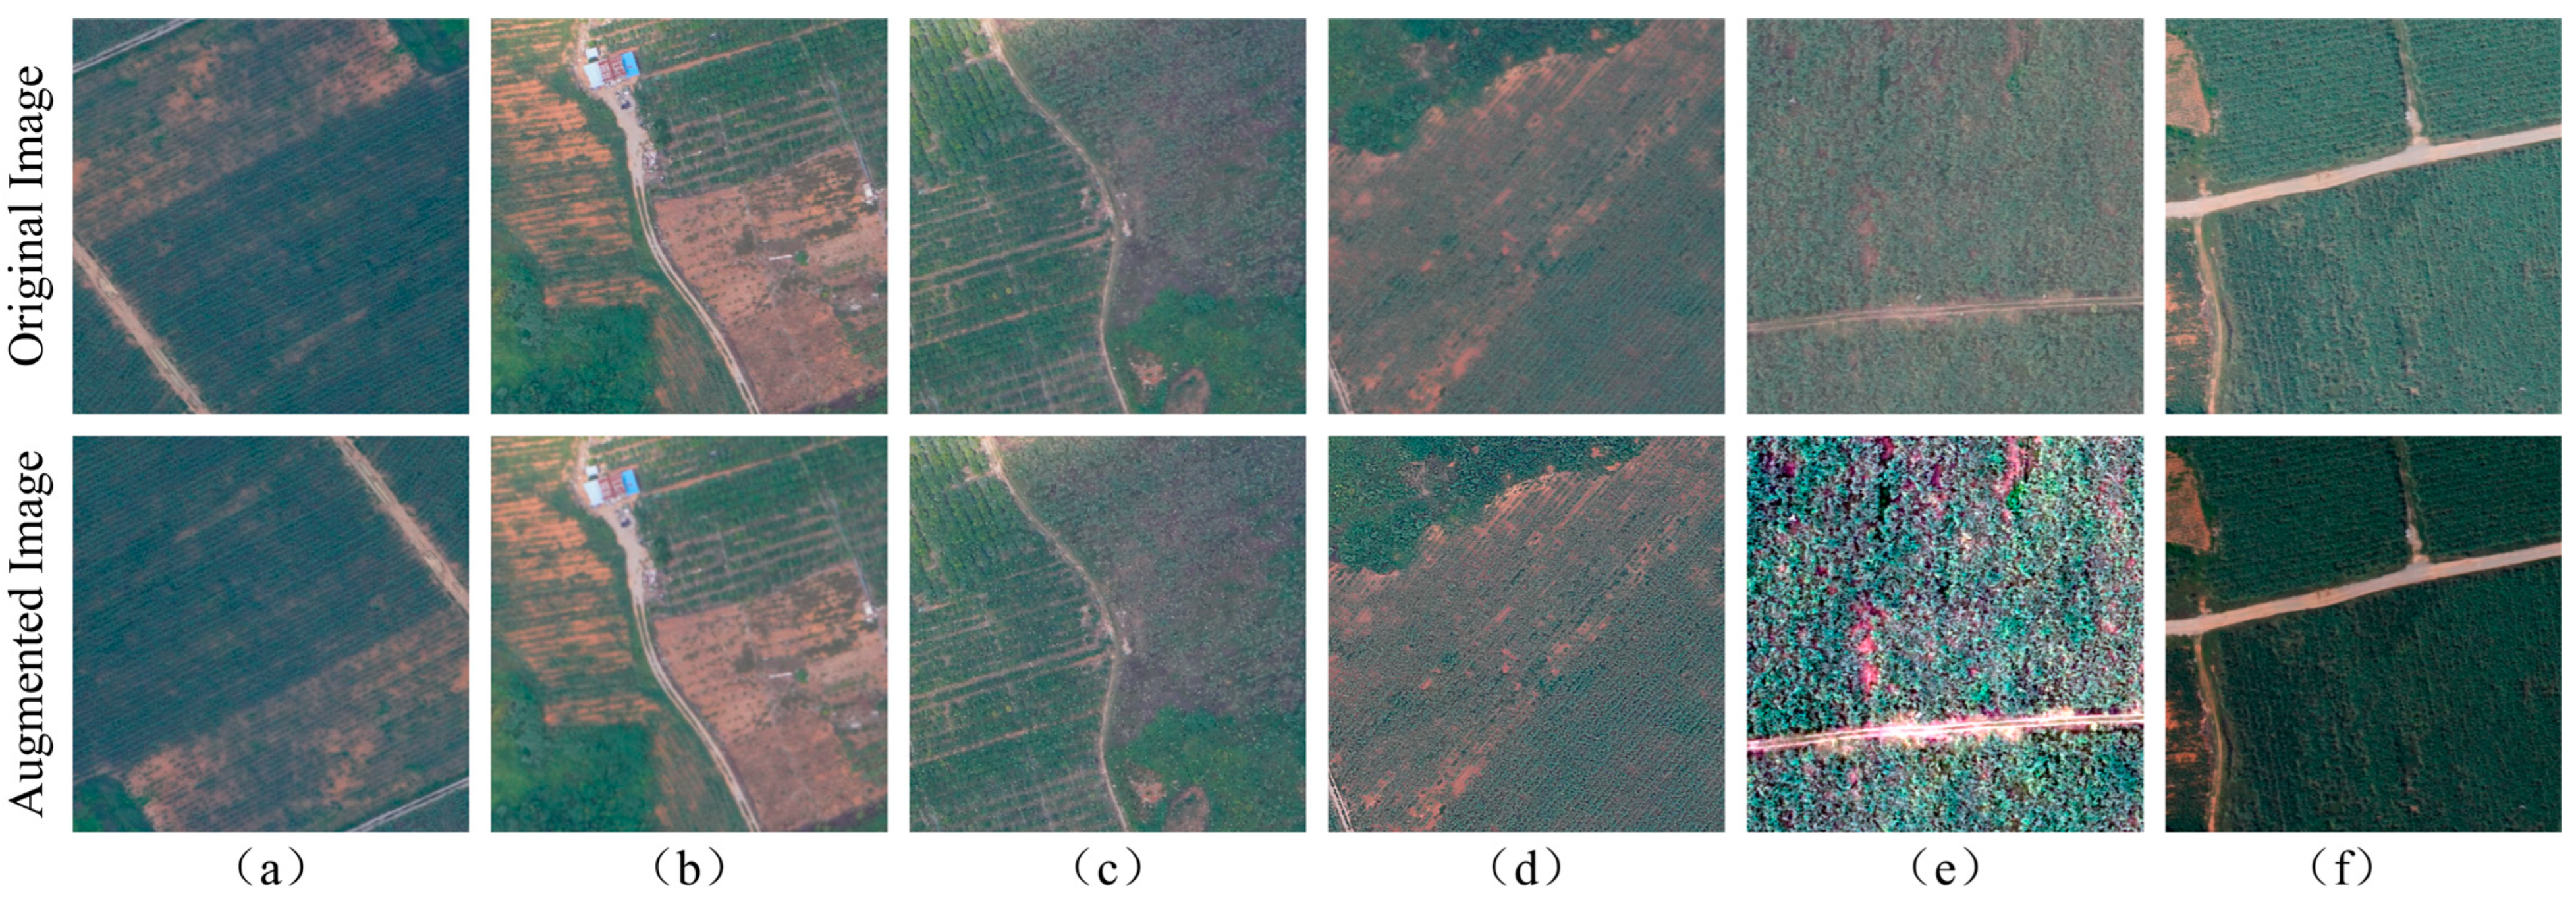
The training effectiveness of deep learning models is highly dependent on having large-scale, high-quality datasets. Having sufficient samples enhances a model’s ability to represent complex features and improves its generalization across diverse scenarios. However, manual data collection is hampered by challenges such as high annotation costs and time-consuming processes. To maximize the value of limited data and mitigate the risk of overfitting [43,44], we randomly divided the sugarcane sample database into training and validation sets in a 7:3 ratio. Specifically, the training set contains 13,127 images and their corresponding labels, while the validation set consists of 5626 images and labels. Data augmentation was further applied to the training set using the following methods: diagonal mirroring, Gaussian blur, salt-and-pepper noise generation, image sharpening, linear stretching, and gamma transformation (Figure 4).
Applying all methods uniformly to each sample would generate identical derivative sets, impairing training effectiveness. Thus, a random selection of augmentation techniques was applied to the training set images, expanding the training set from 13,127 to 64,564 samples. The test set comprised orthophotos from distinct spatiotemporal sugarcane areas, independently selected outside the sample library.

2.4. Method

2.4.1. Residual Block

The residual structure, proposed by He et al. in ResNet (2015) [38], addresses the degradation problem where model performance declines with increasing network depth. As deep learning advances and computational power grows, deeper networks are expected to extract more complex features for superior classification. However, beyond a certain depth, performance plateaus because of exponentially decaying gradient correlations in standard feedforward networks.
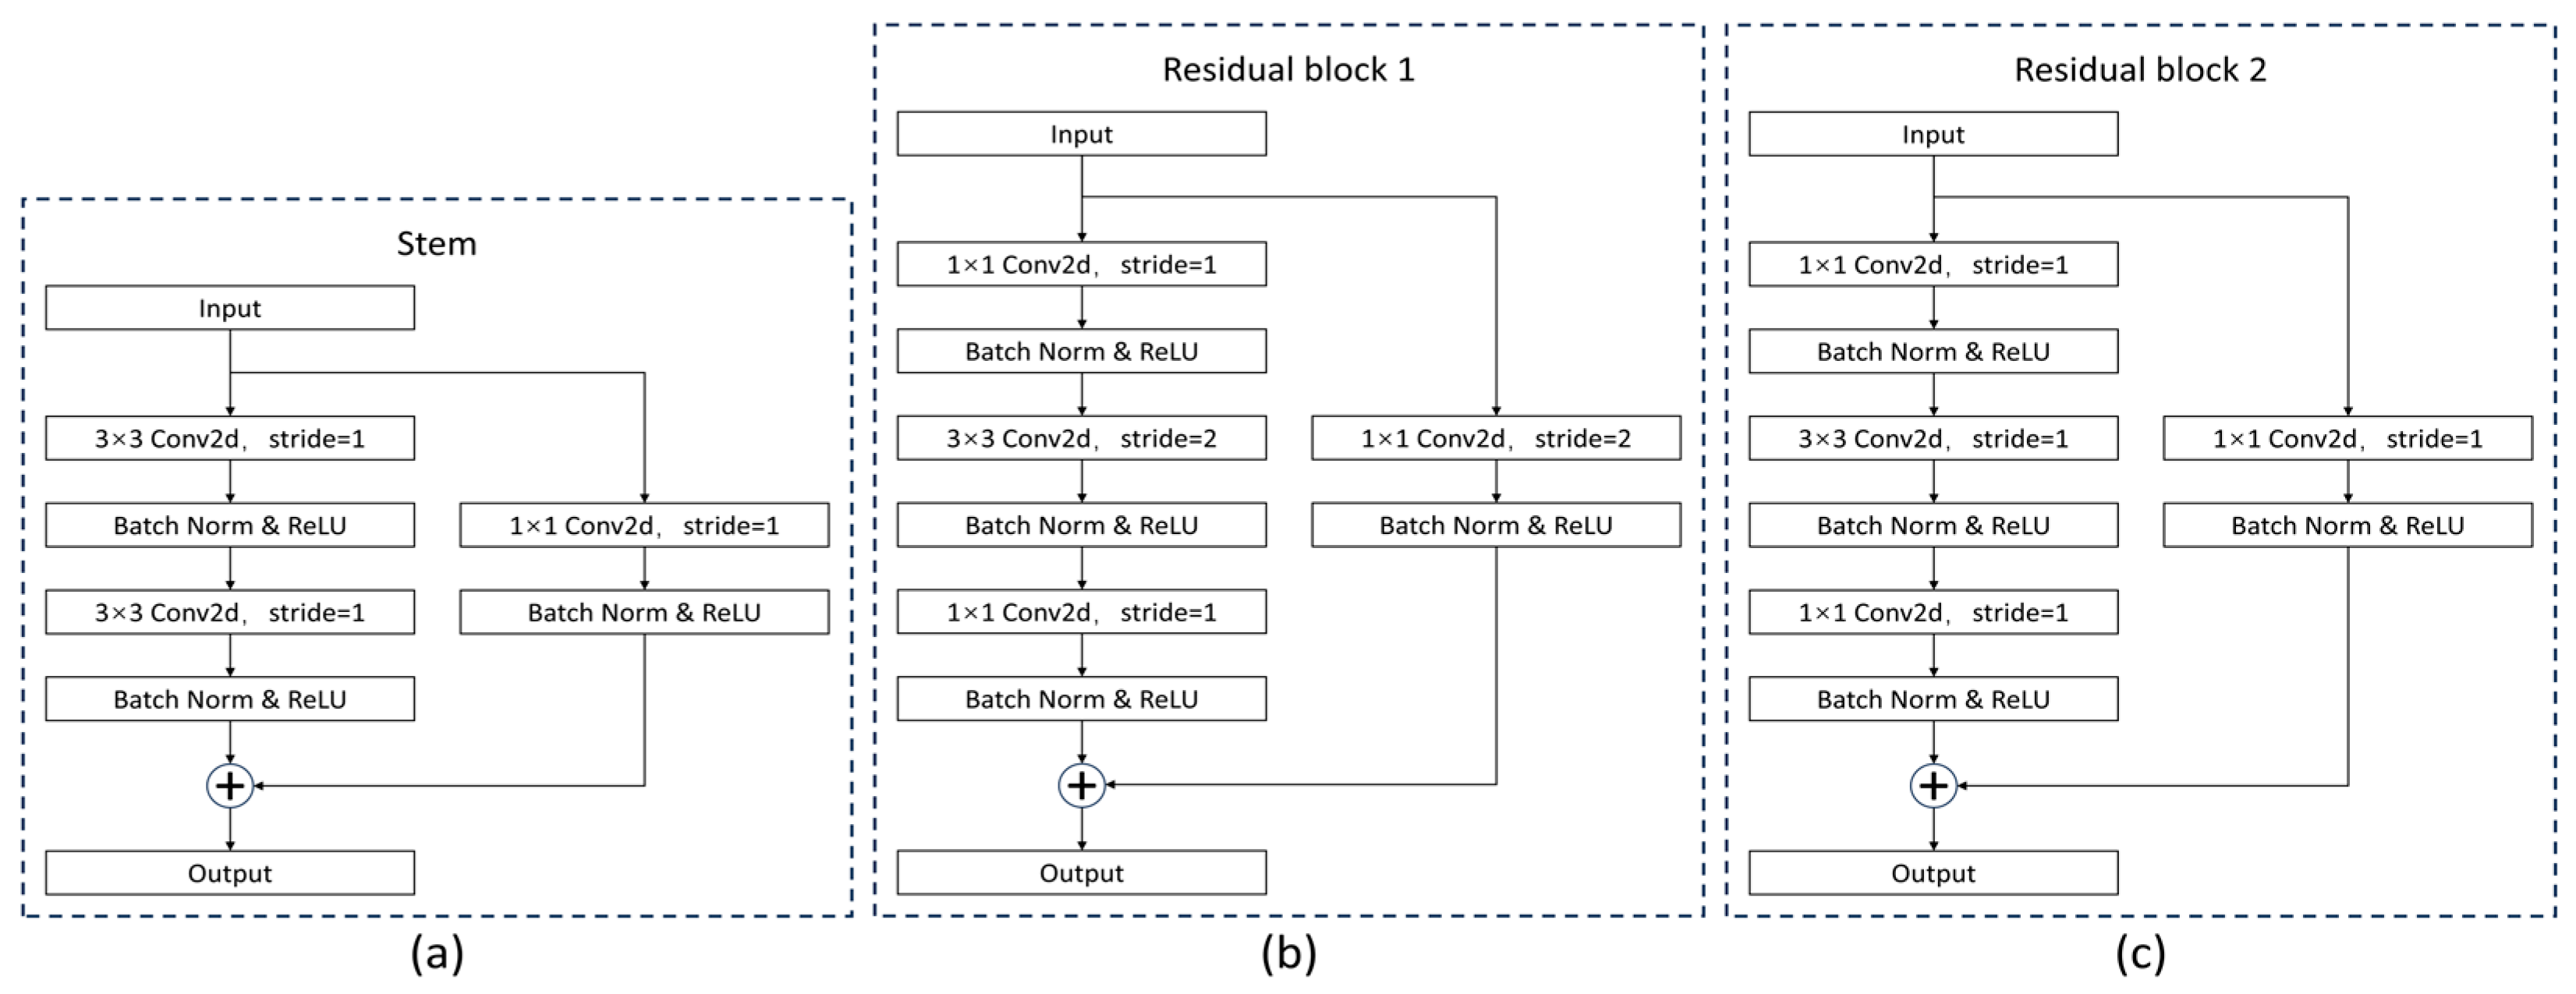
He et al. developed two residual variants: a basic residual block for shallower networks (ResNet18/34) and a bottleneck residual block for deeper architectures (ResNet50/101/152) [39]. Aligning with our experimental platform, we integrated both types to enhance U-net’s backbone, designing three modules (Figure 5):
  • Stem module: This is an input adaptation layer inspired by the basic block, adjusting channel dimensions.
  • Residual block 1: This block replaces max-pooling with stride = 2 convolution for downsampling, minimizing information loss.
  • Residual block 2: This block maintains resolution in non-downsampling layers.

2.4.2. Convolutional Block Attention Module (CBAM)

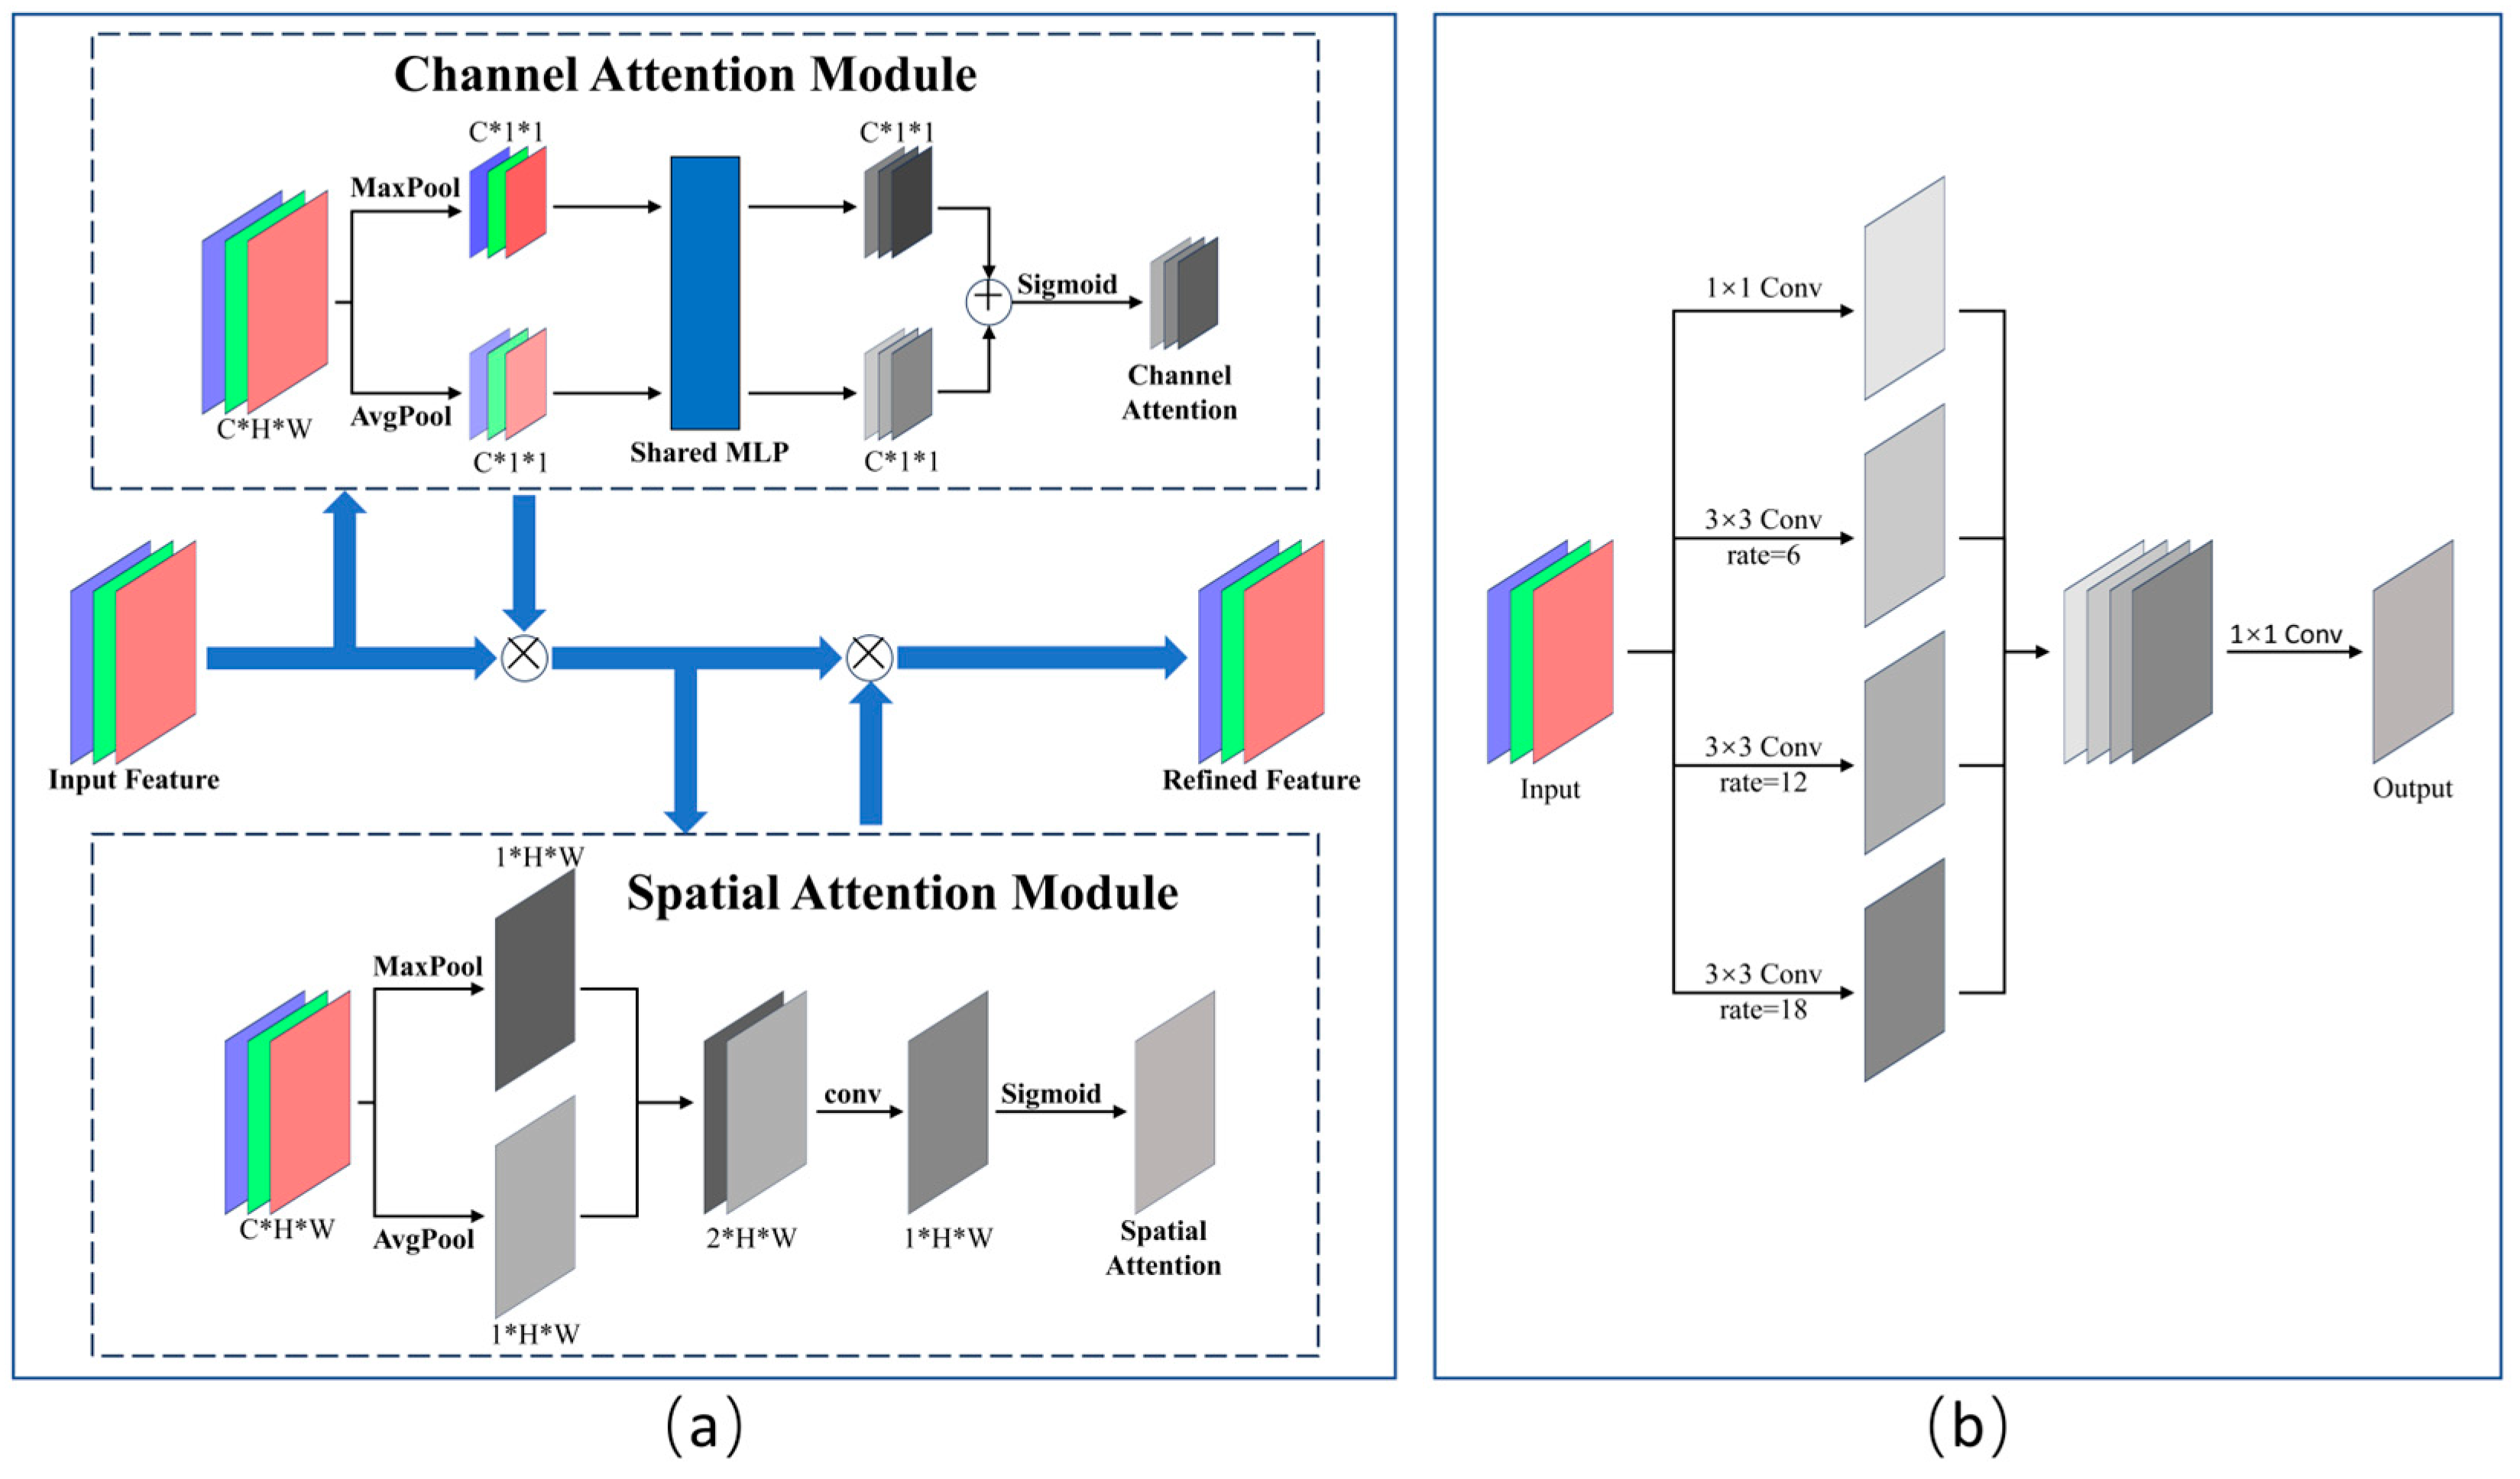
The CBAM [40], a lightweight attention mechanism designed by Woo et al. (2018), serially combines channel and spatial attention to enhance feature focus while suppressing irrelevant backgrounds. The channel attention mechanism employs global average/max pooling and MLP to weight important channels, while the spatial attention mechanism uses convolutional layers to generate spatial weight maps. This dual mechanism dynamically adjusts feature responses, significantly boosting performance in classification and segmentation tasks, with minimal computational overhead (Figure 6a).

2.4.3. Atrous Spatial Pyramid Pooling (ASPP)

Proposed by Chen et al. in DeepLab series [41], ASPP solves multi-scale object perception through parallel dilated convolutions with varying dilation rates, thereby preserving feature map resolution while capturing local details and global semantics across receptive fields. Integrated with global average pooling, ASPP enables robust recognition of multi-scale targets in complex scenes (Figure 6b).

2.4.4. RCAU-Net

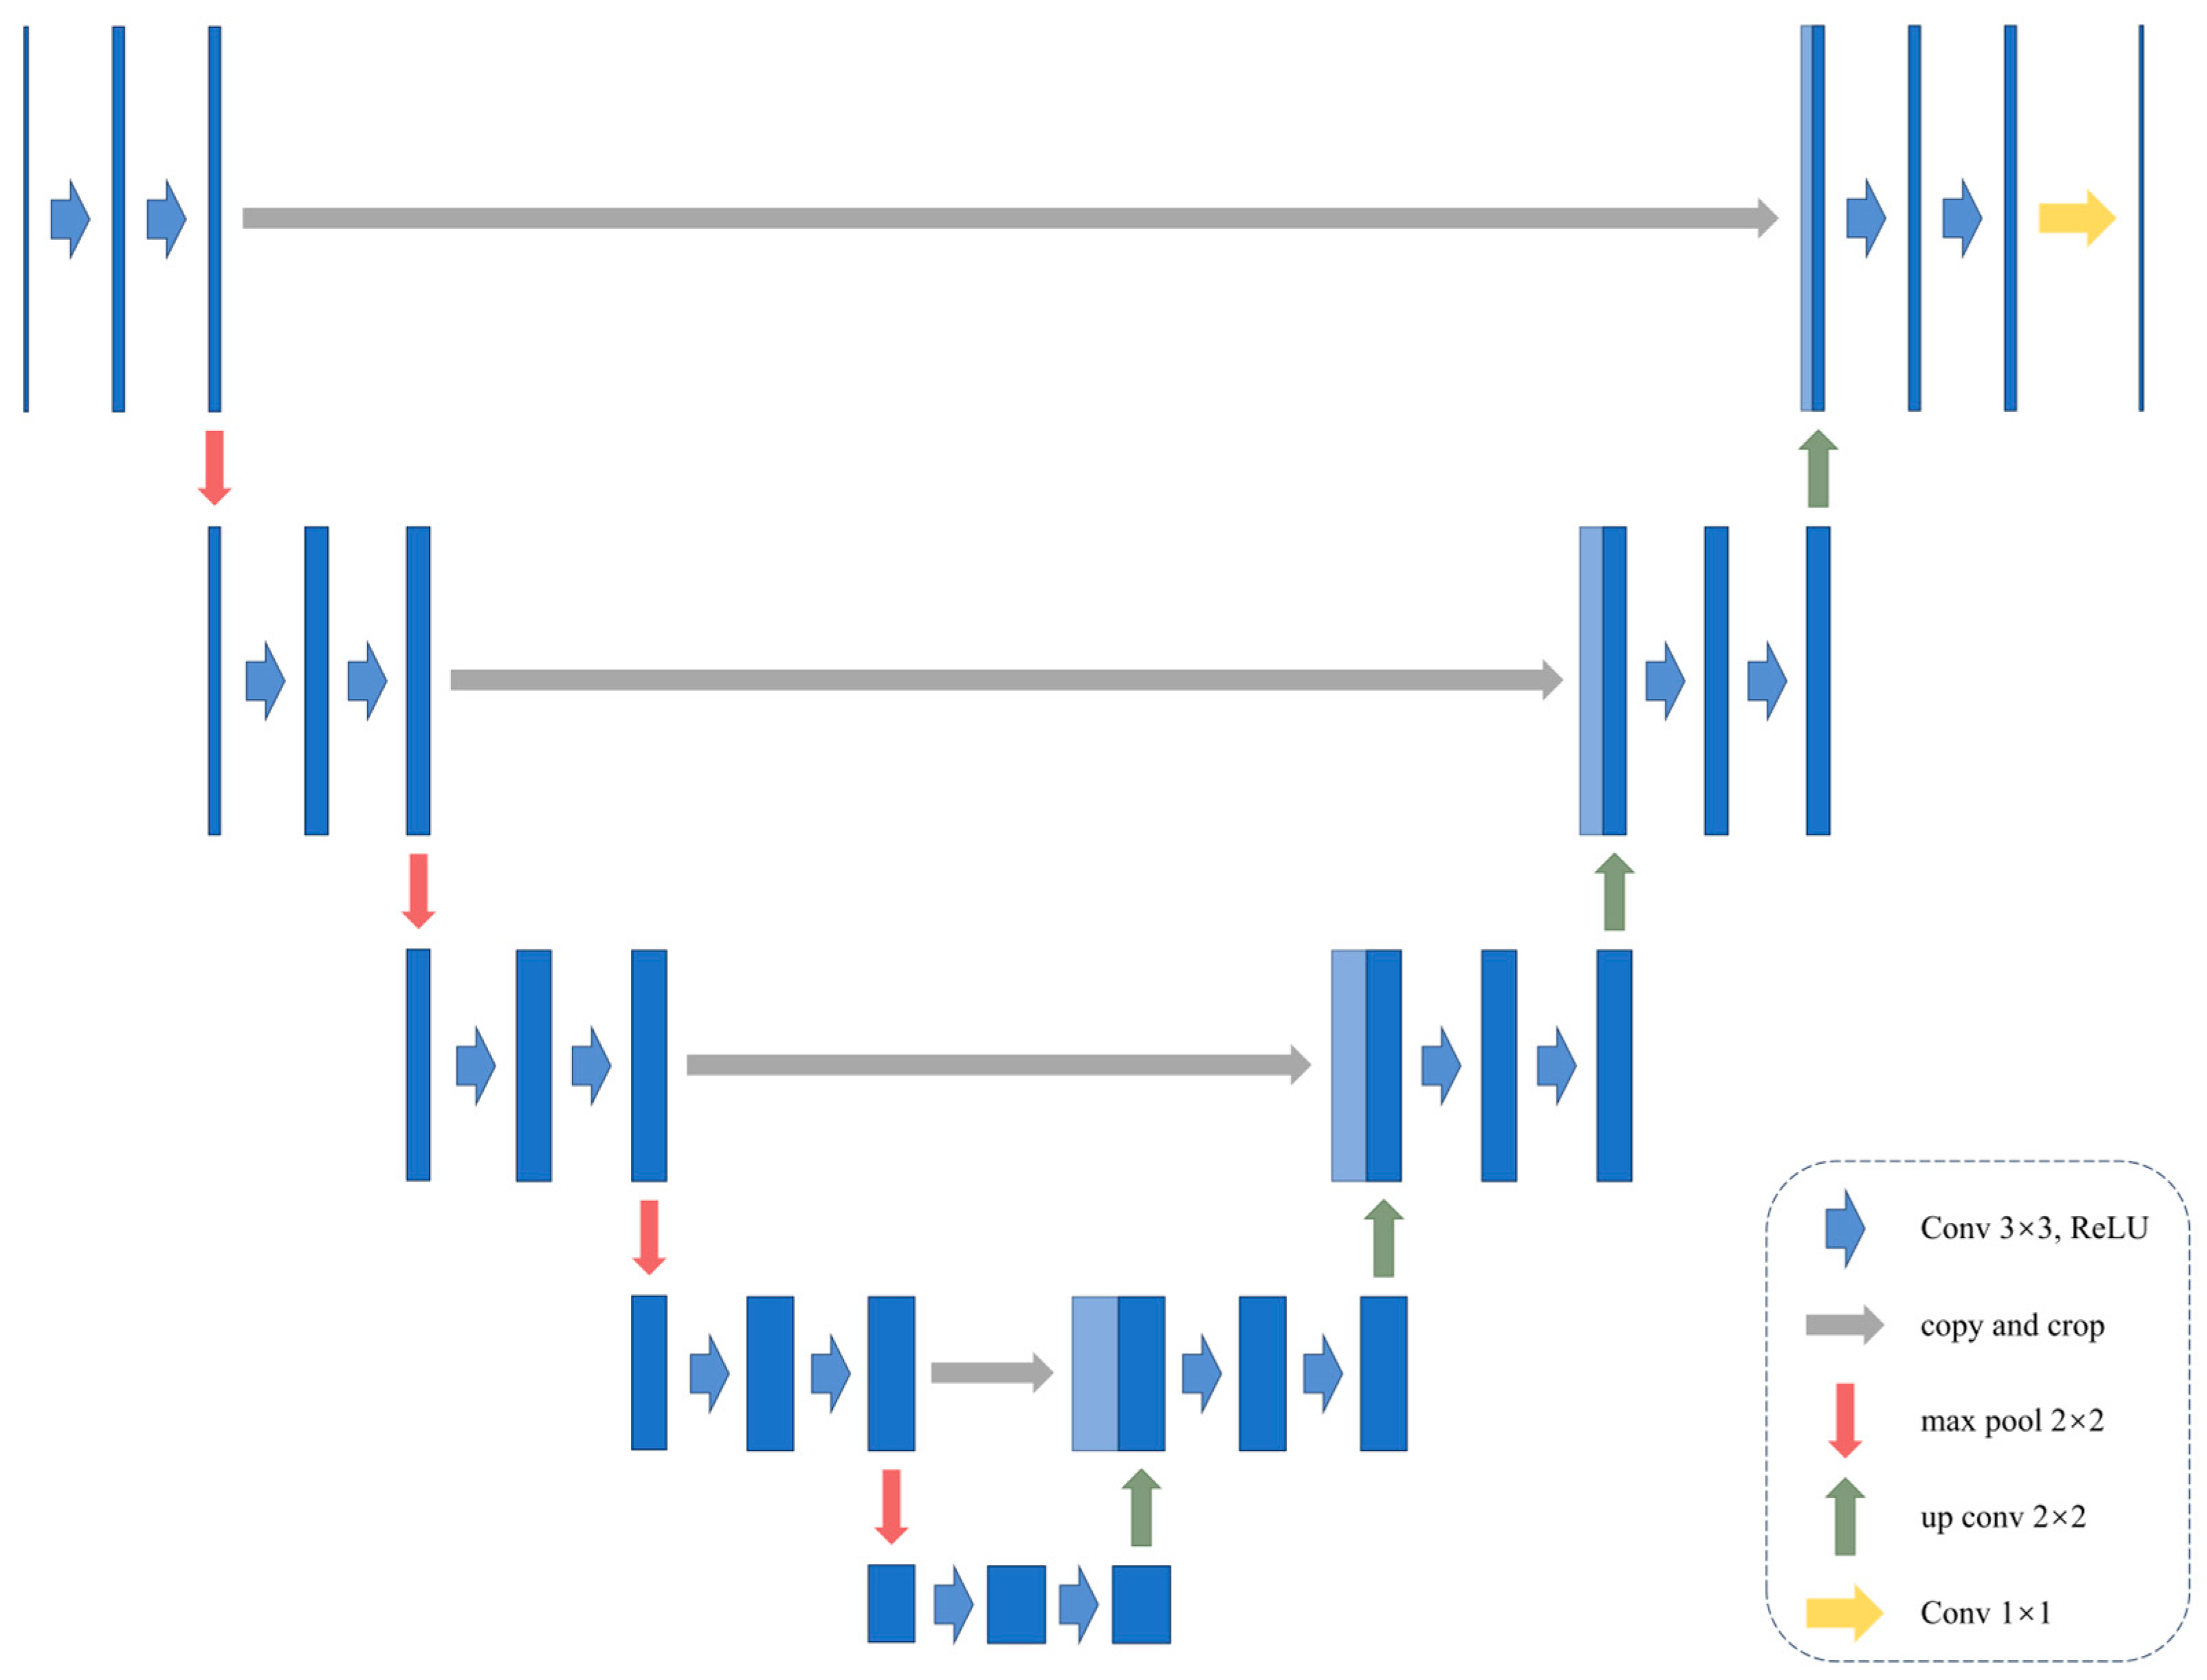
The original U-net model exhibits limitations such as overfitting, slow convergence, gradient vanishing, and imprecise edge segmentation when handling complex backgrounds or multi-class scenarios. To enhance its robustness, generalization capability, and boundary refinement, we integrated residual modules, a CBAM attention mechanism, and Atrous Spatial Pyramid Pooling (ASPP) into an improved architecture while preserving U-net’s fundamental encoder–skip connection–decoder U-shaped framework (Figure 7).
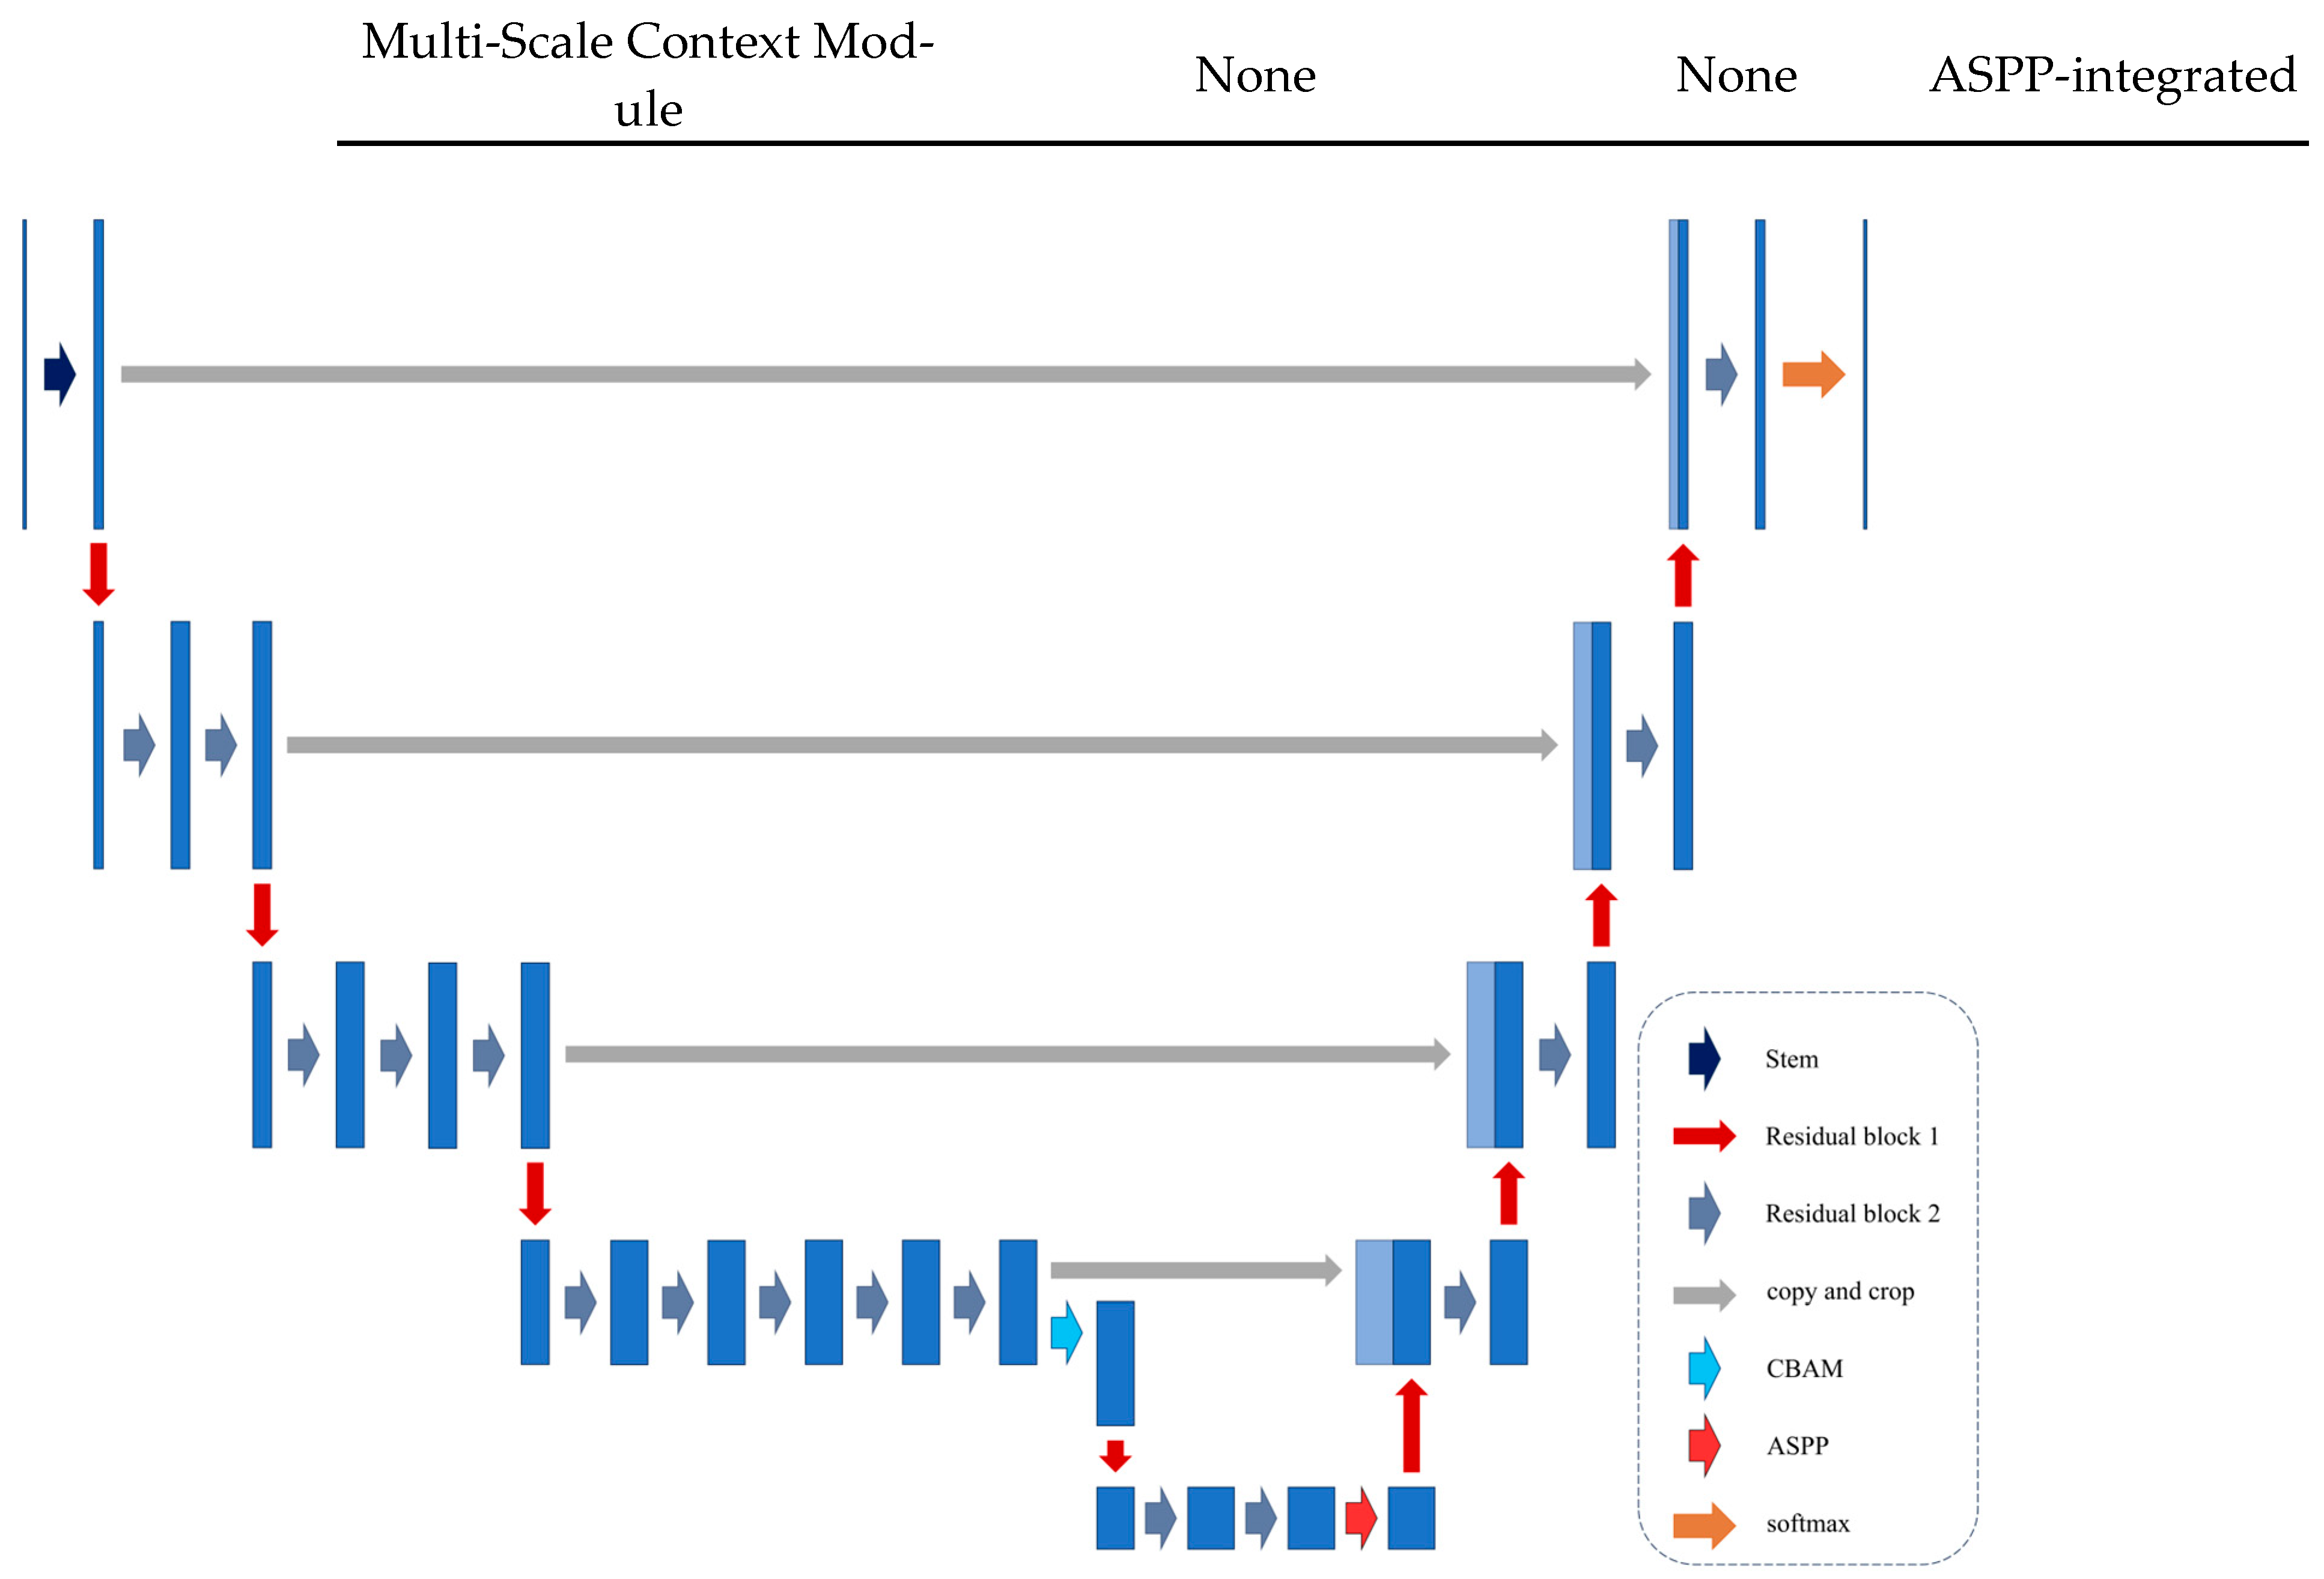
We designed the backbone for the encoder based on ResNet50’s architecture but adjusted the number of residual modules in each stage to 3, 4, 6, and 3 for Stages 1 to 4, respectively, to better adapt it to our specific task and dataset. The first module in each stage is Residual_block_1, which performs downsampling via strided convolution (replacing max-pooling). The subsequent modules are all Residual_block_2 modules, which maintain feature resolution without spatial reduction.
Within the decoder, standard double convolution operations are replaced by Residual_block_2 modules. Feature maps undergo four-step upsampling from depths corresponding to Stages 4 to 1. At each step, skip connections concatenate downsampled features from the corresponding encoder stage before residual processing. Final pixel-wise class probabilities are computed through Softmax activation, establishing the RU-net.
Further enhancements embed the CBAM at the terminus of Stage 3 to amplify deep feature discrimination capabilities. Additionally, ASPP substitutes the final encoder convolutions to capture multi-scale semantic contexts. This integrated framework constitutes RCAU-net (Figure 8), which is specifically engineered to optimize agricultural target extraction in complex environments. A comparative summary of the key architectural components across U-net, RU-net, and the proposed RCAU-net is provided in Table 2 to clearly illustrate the incremental improvements.

2.5. Experimental Setup

Model training was conducted on a Linux computer using an Intel Xeon Gold 6430 CPU and an NVIDIA RTX 4090 GPU (24 GB VRAM, CUDA 12.4). The core parameters included input size (512, 512, 3), 200 epochs, and a batch size of 16. We employed the Adam optimizer with gradient clipping by value (clipvalue = 0.5) to ensure training stability and prevent exploding gradients. A warm-up cosine-annealing scheduler initializing at 10−6, peaking at 10−4 over 2 warm-up cycles, and decaying to 10−6 periodically restarted learning rates to balance exploration and convergence. Early stopping was also implemented with a patience of 20 epochs based on the validation loss to automatically halt training when no further improvement was observed (Table 3).

2.6. Accuracy Evaluation Metrics

Quantitative assessment of classification performance requires confusion matrix analysis. As a core analytical tool, the confusion matrix structurally represents correspondence between model predictions and ground-truth labels, enabling multidimensional performance evaluation. Specifically, this N × N matrix has rows corresponding to true labels and columns corresponding to predicted labels. For binary classification (Table 4), four fundamental components define classification outcomes:
  • TP (True Positive): correctly predicted positive samples;
  • FP (False Positive): negative samples misclassified as positive;
  • TN (True Negative): correctly predicted negative samples;
  • FN (False Negative): positive samples misclassified as negative.
(1)
Overall Accuracy (OA)
OA calculates the ratio of correctly classified samples (TP + TN) to total samples:
O A = T P + T N T P + F N + F P + T N
(2)
Recall
Recall (sensitivity) measures the proportion of actual positives correctly identified as such:
Re c a l l = T P T P + F N
(3)
Mean Intersection-Over-Union (mIoU)
Intersection-Over-Union (IoU) computes the ratio between the intersection and union of actual and predicted positive areas:
I o U = T P T P + F N + F P
mIoU averages IoU values across all classes:
m I o U = i N I o U N
(4)
Kappa Coefficient
Kappa quantifies agreement beyond random chance; it is commonly used in remote sensing semantic segmentation:
K a p p a = N × T P + F N T P + T N × T P + F P + F P + F N × T N + F N N 2 T P + T N × T P + F P + F P + F N × T N + F N

3. Results

3.1. Comprehensive Performance Evaluation of Progressive Model Enhancements

To ensure a fair comparison between the U-net, RU-net, and RCAU-net models, all three were trained with identical hyperparameters and sample datasets. Comparative plots of training/validation accuracy and loss for each model are presented in Figure 9.
The plots demonstrate that all three models exhibit rapid accuracy saturation on the training set, indicating strong fitting capabilities. However, significant divergences in validation performance emerged: U-net displays slower initial convergence compared to its improved counterparts but maintains progressive accuracy improvement with eventual stabilization. RU-net achieves faster convergence and higher validation accuracy, attributable to improved feature extraction via residual blocks, though its loss curve shows more pronounced periodic fluctuations than the baseline U-net. RCAU-net, through integrating the Convolutional Block Attention Module (CBAM) and Atrous Spatial Pyramid Pooling (ASPP), strengthens global context modeling while intensifying focus on critical regions. This configuration yields peak validation accuracy (0.9789), minimal loss with negligible oscillations, and the most stable training process.
As detailed in Table 5, the RCAU-net model achieved optimal performance across all evaluated metrics. It attained the highest scores in Overall Accuracy (OA, 97.19%), Recall (96.99%), Precision (97.31%), F1 Score (97.16%), and Mean Intersection Over Union (mIoU, 94.47%), significantly outperforming both the baseline U-net model and the intermediate RU-net model. The incorporation of the Convolutional Block Attention Module (CBAM) and Atrous Spatial Pyramid Pooling (ASPP) modules is the key driver of this comprehensive performance gain. This evidence validates the effective synergy between the Convolutional Block Attention Module (CBAM), which enhances feature selectivity through channel-spatial attention, and Atrous Spatial Pyramid Pooling (ASPP), which refines segmentation details via multi-scale feature fusion. RU-net attained a 95.52% OA, a 95.30% Recall, a 95.70% Precision, a 95.47% F1 Score, a 92.19% mIoU, and a 0.9195 Kappa. This represents improvements of 5.53, 5.74, 5.21, 5.59, and 7.74 percentage points in OA, Recall, Precision, F1 Score, and mIoU, respectively, over the baseline U-net model. These across-the-board gains confirm that the residual structures not only effectively mitigate gradient vanishing but also enhance the model’s overall discriminative power and segmentation consistency. Although U-net, as the baseline, demonstrates lower performance (90.49% Precision, 89.99% OA, an 89.88% F1 Score, 89.56% Recall, an 84.45% mIoU, and a 0.8379 Kappa), it retains fundamental usability. Its limitations likely stem from insufficient deep-layer feature representation capacity.
Collectively, the metrics exhibit a stepwise progression across models, reflecting a positive correlation between architectural enhancements and performance gains. RCAU-net surpasses its predecessors in accuracy, stability, and extraction capability, establishing itself as the optimal architecture.

3.2. Visualization and Quantitative Analysis of Results

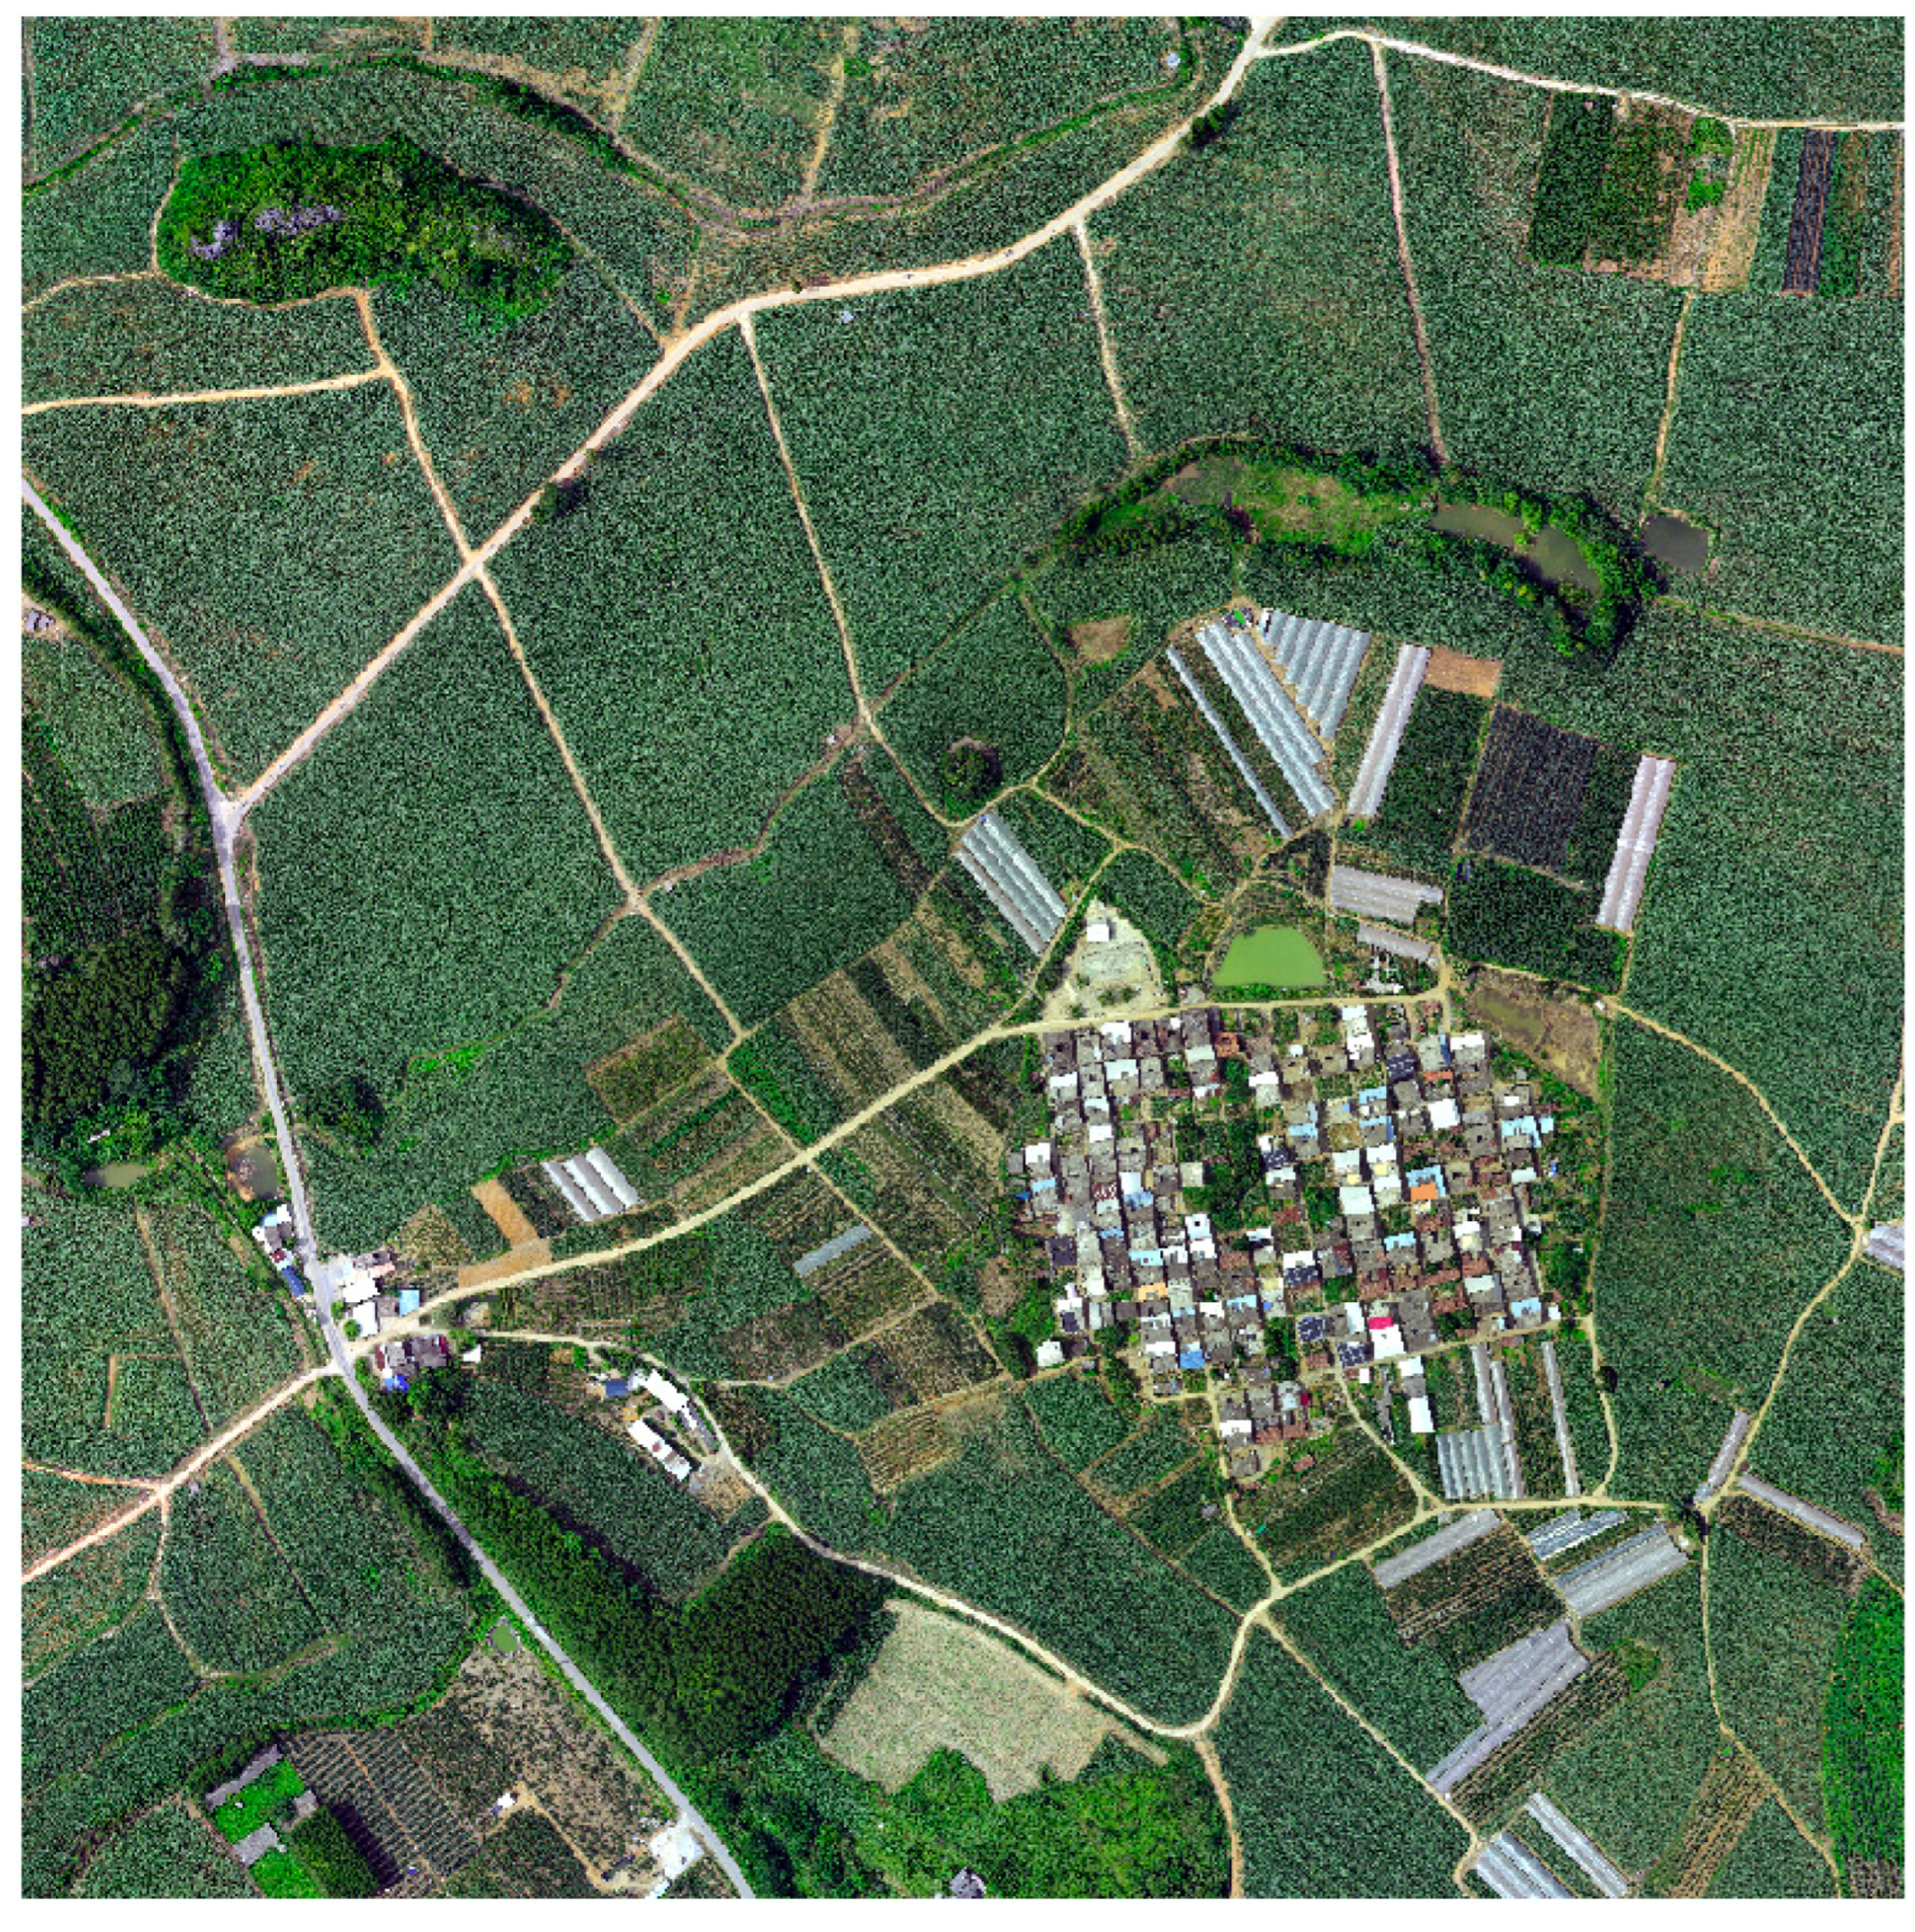
The test area is situated near Luwo Town, Wuming District, Nanning City, Guangxi, covering approximately 1 km2. The UAV imagery for this region is presented in Figure 10.
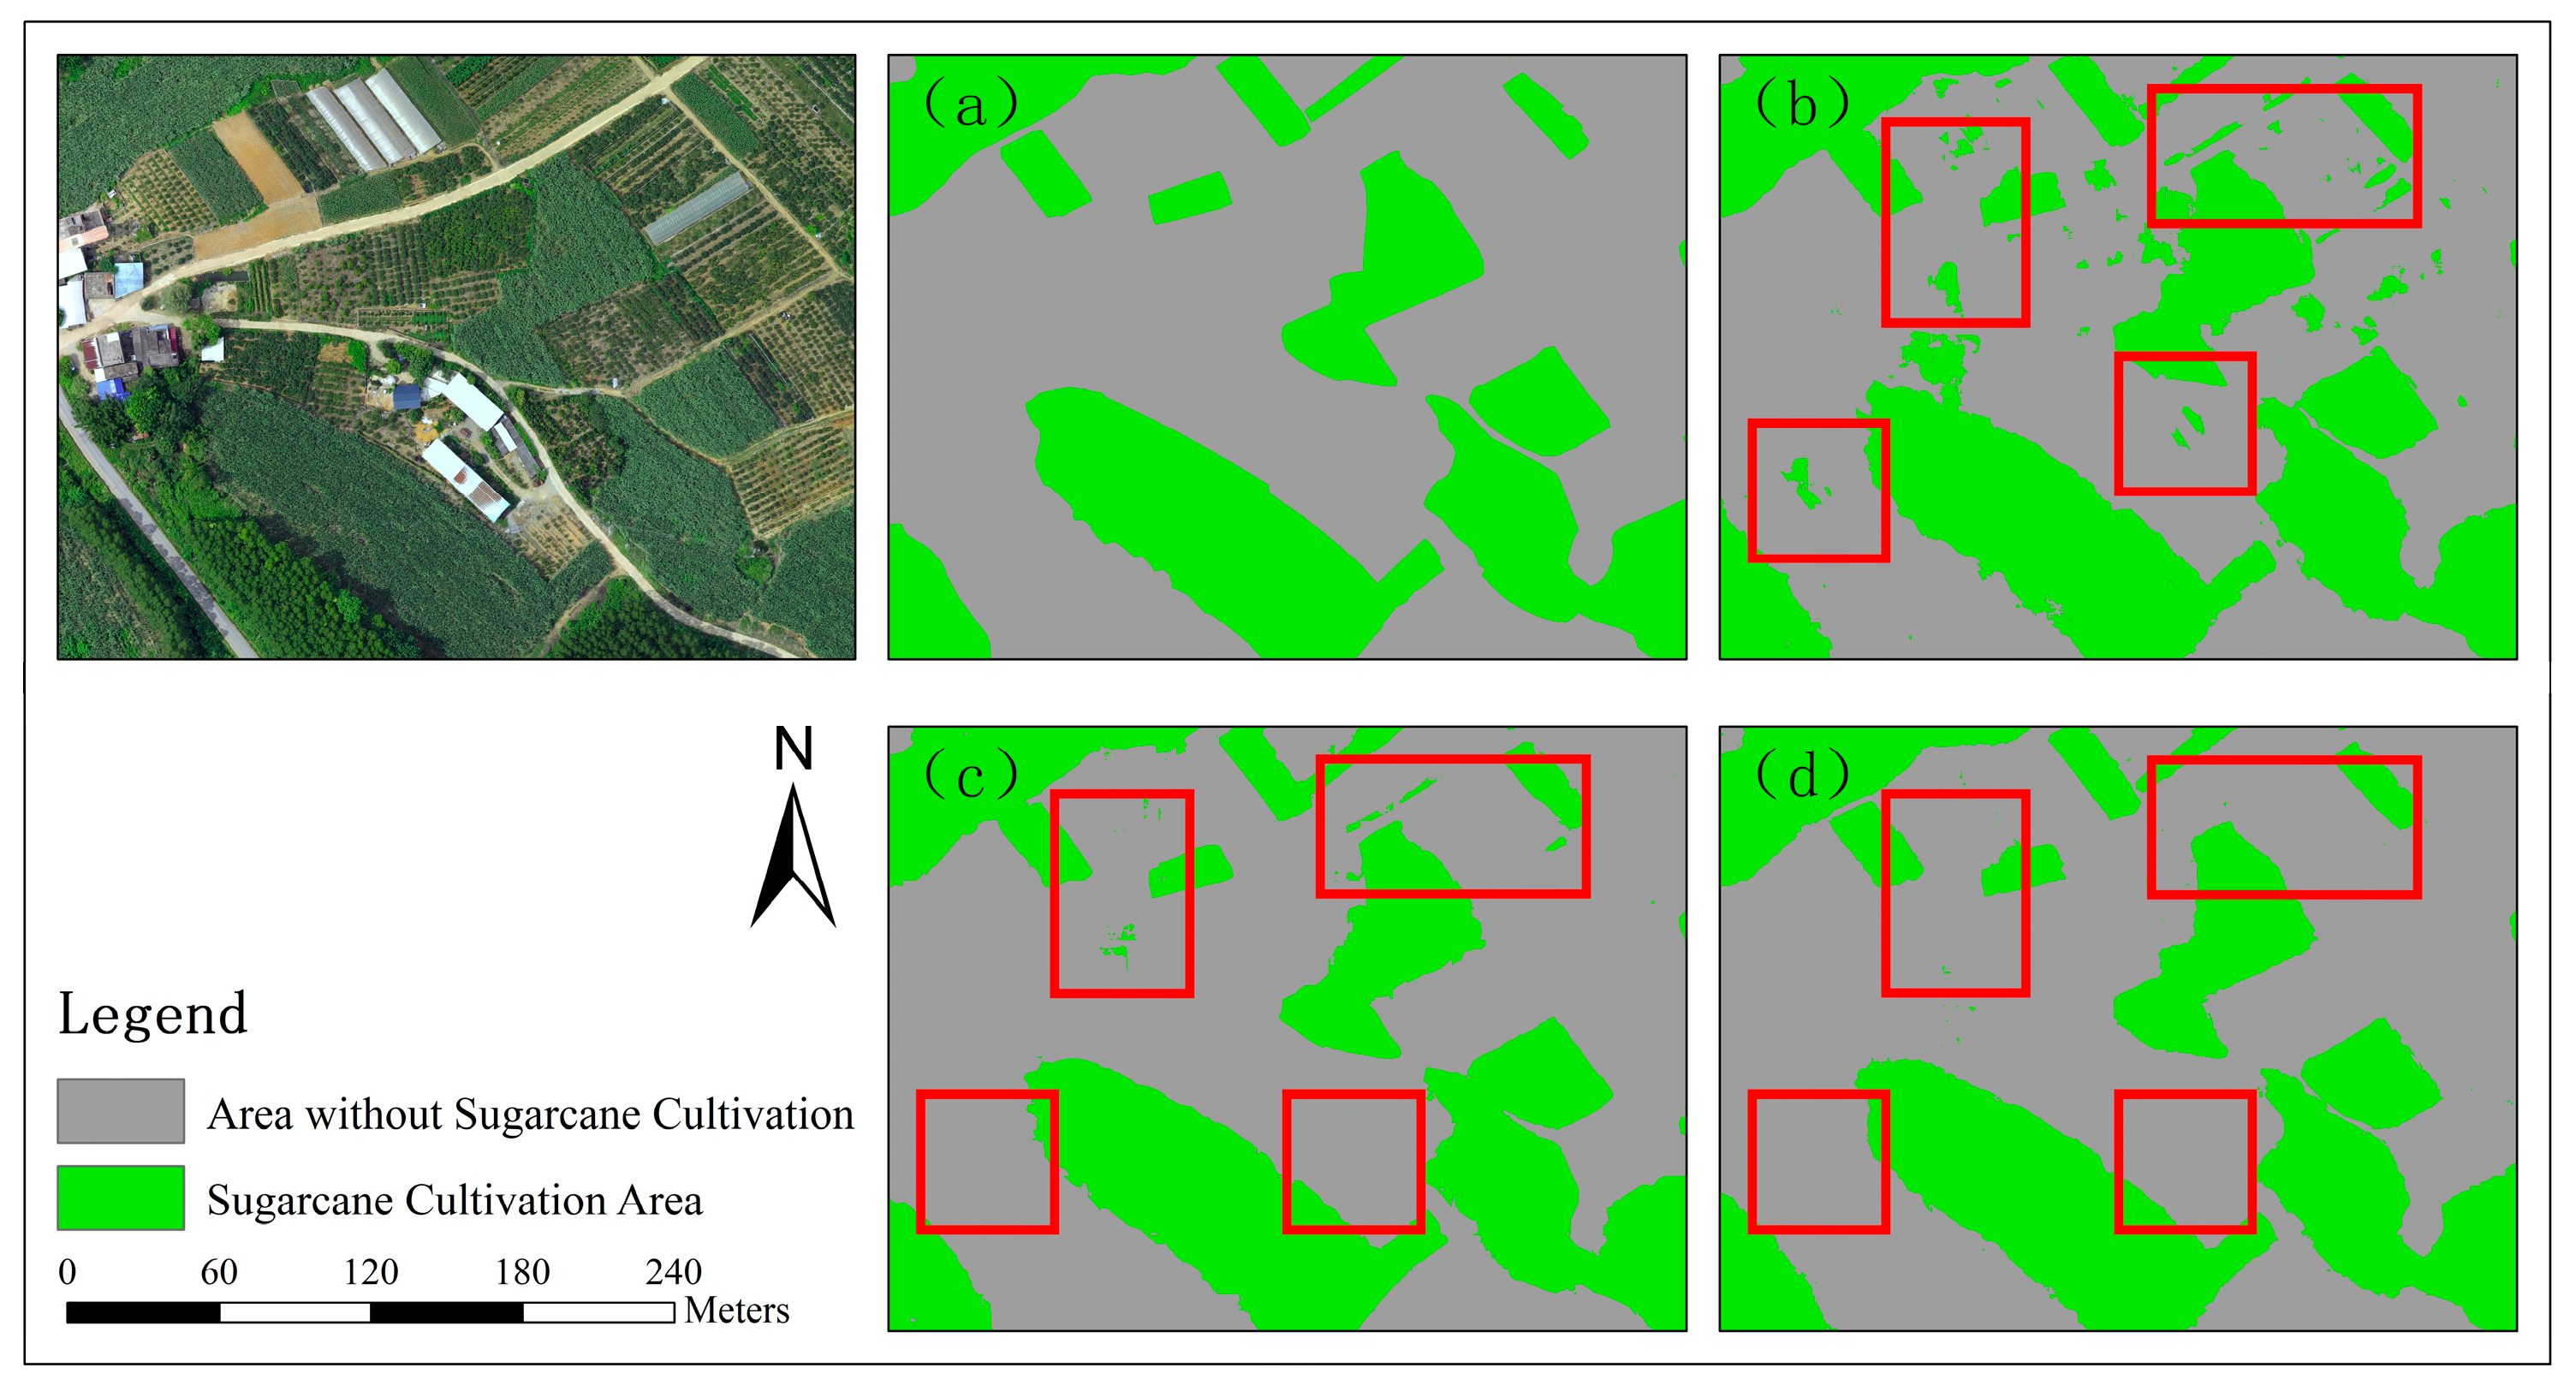
Comparative analysis of the extraction results across models (Figure 11, Figure 12 and Figure 13) reveals that the baseline U-net model exhibits substantial voids within sugarcane planting areas, pronounced mis-extraction in non-sugarcane zones, and significant boundary adhesion between adjacent sugarcane fields.
Regarding void issues within sugarcane planting areas, i.e., discontinuous regions misclassified as non-sugarcane zones, Figure 11 demonstrates that U-net (Figure 11b) generates numerous irregular voids clustered along field edges, while RU-net (Figure 11c) significantly reduces void numbers through residual blocks, with only sporadic marginal occurrences. RCAU-net (Figure 11d) not only virtually eliminates these marginal voids but also delivers the smoothest field contours. A closer comparative examination between RU-net (c) and RCAU-net (d) reveals that the latter provides a more consistent and precise delineation, particularly minimizing very-fine-scale misclassifications and yielding boundaries that more closely adhere to the ground truth (a). This refinement, achieved through the integration of CBAM and ASPP, is crucial for accurate area estimation.
Beyond voids, fragmentation issues encompass mis-extracted green patches in non-sugarcane zones and fragmented planting areas. U-net (Figure 12b) exhibits extensive mis-extraction on field roads/bare soil, severe jagged-edge fragmentation, and large-scale misclassification of similar crops. RU-net (Figure 12c) markedly improves on this by eliminating bulk mis-extraction and reducing fine fragments. RCAU-net (Figure 12d) achieves near-complete fragment removal closest to the ground truth.
As evidenced in Figure 12 and Figure 13, all the models exhibit boundary adhesion manifested as distorted or erroneously connected edges between adjacent fields. U-net (Figure 12b and Figure 13b) shows sugarcane-eroding linear features like roads and ridges. RU-net (Figure 12c and Figure 13c) aggravates adhesion post-residual introduction with a greater number of edge burrs. RCAU-net (Figure 12d and Figure 13d) leverages CBAM’s attention weighting for critical regions and ASPP’s expanded receptive field for contextual capture, suppressing adhesion while enhancing boundary precision.
Comprehensive analysis confirms that the baseline U-net model suffers critical flaws including pervasive voids, pronounced mis-extraction, and severe boundary adhesion. RU-net demonstrates superior performance with reduced mis-extraction, improved field integrity, and fewer voids, validating residual efficacy. RCAU-net excels in extraction completeness, edge smoothness, and misclassification control through CBAM-ASPP synergy, fully establishing its technical superiority.

4. Conclusions

Addressing the demand for high-precision remote sensing extraction of sugarcane planting areas in Guangxi, in this study, we propose an improved U-net model (RCAU-net) integrating a Convolutional Block Attention Module (CBAM), Atrous Spatial Pyramid Pooling (ASPP), and residual structures, significantly improving extraction accuracy in complex environments. We utilized high-resolution UAV imagery that captured multiple growth stages to construct a sugarcane sample library, expanded to 64,564 training samples through six data augmentation techniques, substantially enhancing model generalization. The improved model achieves superior performance through
  • The CBAM intensifying focus on critical features;
  • ASPP fusing multi-scale contextual information;
  • Residual blocks alleviating gradient vanishing.
The experimental results demonstrate RCAU-net’s test-set performance: 97.19% overall accuracy (OA), 96.99% Recall, 97.31% Precision, a 97.16% F1 Score, a 94.47% mIoU, and a 0.9419 Kappa coefficient. This performance represents improvements of 7.20, 7.43, 6.82, 7.28, and 10.02 percentage points in OA, Recall, Precision, F1 Score, and mIoU, respectively, over the baseline U-net model, unequivocally validating the efficacy of the architectural enhancements and modular synergy. Compared to the original model, RCAU-net exhibits significant advantages: residual structures enhance deep-feature separability to suppress misclassification of similar crops while stabilizing training convergence; the CBAM drastically reduces the quantity of fragmented false positives caused by background interference via spatial-channel attention; and ASPP minimizes voids within sugarcane plots while smoothening boundaries through multi-scale fusion.
The synergistic effect of these modules effectively compensates for the limitations in standalone residual improvements, substantially mitigating boundary adhesion between adjacent plots and enhancing extraction integrity. Although minor mis-extraction persists near complex field ridges or pathways, RCAU-net excels overall in suppressing errors, reducing voids, smoothing edges, and resolving adhesion. In summary, RCAU-net demonstrates outstanding performance in enhancing plot integrity, reducing false positives, and strengthening anti-interference capability, providing robust technical support for dynamic sugarcane monitoring and smart agricultural management.
Despite the promising results, it is important to acknowledge the limitations of this study. The performance of the RCAU-net model was validated primarily on UAV imagery from specific regions in Guangxi under particular subtropical climatic conditions. Its generalizability and transferability to sugarcane fields in vastly different geographical or climatic zones, or to other types of crops with similar spectral characteristics, require further investigation. Additionally, the current framework relies solely on RGB imagery; incorporating multispectral or hyperspectral data could potentially enhance feature discrimination, especially for crops at different phenological stages. Furthermore, this study primarily focused on maximizing extraction accuracy for post-flight analysis scenarios. A detailed analysis of the trade-off between accuracy and computational efficiency (e.g., inference speed, model size, and FLOPs) was not conducted, as such an endeavor falls outside the immediate scope of this paper, whose aim is to present a novel architecture. However, we recognize this trade-off is crucial for real-time UAV deployment and embedded applications, and it represents an important direction for our future work. In future work, we will focus on several avenues to build upon this research. We plan to integrate multispectral data to leverage additional spectral information. Testing the model’s robustness across different regions and various similar economic crops will also be a priority. Furthermore, exploring temporal analysis by tracking sugarcane growth stages throughout the season using time-series UAV imagery could foster dynamic monitoring capabilities. Additionally, optimizing the proposed model for faster inference speed and lower computational resource consumption to meet the demands of real-time applications will be investigated.

Author Contributions

Conceptualization, T.Y. and Z.L.; methodology, T.Y., J.H. and Z.L.; software, J.H. and Z.L.; validation, Z.L.; investigation, H.F. and Z.L.; writing—original draft preparation, T.Y. and Z.L.; writing—review and editing, H.F. and Z.L.; visualization, H.F., S.M., J.T., Z.L. and H.H.; supervision, T.Y., Y.T., J.H. and Y.C.; project administration, T.Y.; funding acquisition, T.Y. All authors have read and agreed to the published version of the manuscript.

Funding

The study was supported by the Open Project Fund of the Open Research Fund of Territorial-spatial Intelligence Open Lab, Natural Resources Information Center of Guangxi Zhuang Autonomous Region (No. A202504), the National Natural Science Foundation of China (Grant No. 42201463), the Guangxi Key Technologies R&D Program (AB24010057 and AB25069093), the Guangxi Natural Science Foundation (2024GXNSFAA010341), and the Guangxi Key Laboratory of Spatial Information and Geomatics (21-238-21-21, 21238-21-29).

Data Availability Statement

The datasets analyzed during this study are not publicly available because they are part of an ongoing study, but they are available from the corresponding author upon reasonable request.

Conflicts of Interest

Author Yuebiao Tang was employed by the company Wuhan Kedao Geographic Information Engineering Co., Ltd. The remaining authors declare that the research was conducted in the absence of any commercial or financial relationships that could be construed as a potential conflict of interest.

References

  1. Xin, S.Z.; Lin, X.; Yang, J.; Yang, Y.; Li, H.X.; Chen, G.; Liu, J.H.; Deng, Y.H.; Yi, H.Y.; Xia, Y.H.; et al. Research Status of Sugarcane Varieties and Product Processing in China. Farm Prod. Process. 2020, 12, 73–76+79. [Google Scholar] [CrossRef]
  2. Østergaard, P.A.; Duic, N.; Noorollahi, Y.; Kalogirou, S. Renewable Energy for Sustainable Development. Renew. Energy 2022, 199, 1145–1152. [Google Scholar] [CrossRef]
  3. Deng, Y.C.; Liu, X.T.; Huang, Y.; Fan, B.N.; Lu, W.; Zhang, F.J.; Ding, M.H.; Wu, J.M. Investigation on Sugarcane Production in Chongzuo Sugarcane Area of Guangxi in 2022. China Seed Ind. 2022, 10, 48–51. [Google Scholar] [CrossRef]
  4. Lin, N.; Chen, H.; Zhao, J.; Chi, M.X. Application and Prospects of Lightweight UAV Remote Sensing in Precision Agriculture. Jiangsu Agric. Sci. 2020, 48, 43–48. [Google Scholar] [CrossRef]
  5. Reddy Maddikunta, P.K.; Hakak, S.; Alazab, M.; Bhattacharya, S.; Gadekallu, T.R.; Khan, W.Z.; Pham, Q.-V. Unmanned Aerial Vehicles in Smart Agriculture: Applications, Requirements, and Challenges. IEEE Sens. J. 2021, 21, 17608–17619. [Google Scholar] [CrossRef]
  6. Wang, X.C.; Zhao, T.T.; Guo, H. Optimization Path of New Quality Productivity Empowering Smart Agriculture Development. Agric. Econ. 2025, 6, 3–6. [Google Scholar] [CrossRef]
  7. Phang, S.K.; Chiang, T.H.A.; Happonen, A.; Chang, M.M.L. From Satellite to UAV-Based Remote Sensing: A Review on Precision Agriculture. IEEE Access 2023, 11, 127057–127076. [Google Scholar] [CrossRef]
  8. Radoglou-Grammatikis, P.; Sarigiannidis, P.; Lagkas, T.; Moscholios, I. A Compilation of UAV Applications for Precision Agriculture. Comput. Netw. 2020, 172, 107148. [Google Scholar] [CrossRef]
  9. Yang, H.; Chen, E.; Li, Z.; Zhao, C.; Yang, G.; Pignatti, S.; Casa, R.; Zhao, L. Wheat Lodging Monitoring Using Polarimetric Index from RADARSAT-2 Data. Int. J. Appl. Earth Obs. Geoinf. 2015, 34, 157–166. [Google Scholar] [CrossRef]
  10. Liang, J.; Zheng, Z.W.; Xia, S.T.; Zhang, X.T.; Tang, Y.Y. Crop Identification and Evaluation Using Red-Edge Features of GF-6 Satellite. J. Remote Sens. 2020, 24, 1168–1179. [Google Scholar]
  11. Cai, Z.W.; He, Z.; Wang, W.J.; Yang, J.Y.; Wei, H.D.; Wang, C.; Xu, B.D. Meter-Resolution Cropland Extraction Based on Spatiotemporal Information from Multi-Source Domestic GF Satellites. J. Remote Sens. 2022, 26, 1368–1382. [Google Scholar]
  12. Li, D.R.; Li, M. Research Progress and Application Prospects of UAV Remote Sensing Systems. Geomat. Inf. Sci. Wuhan Univ. 2014, 39, 505–513+540. [Google Scholar] [CrossRef]
  13. Pajares, G. Overview and Current Status of Remote Sensing Applications Based on Unmanned Aerial Vehicles (UAVs). Photogram. Engng. Rem. Sens. 2015, 81, 281–330. [Google Scholar] [CrossRef]
  14. Watts, A.C.; Ambrosia, V.G.; Hinkley, E.A. Unmanned Aircraft Systems in Remote Sensing and Scientific Research: Classification and Considerations of Use. Remote Sens. 2012, 4, 1671–1692. [Google Scholar] [CrossRef]
  15. Boursianis, A.D.; Papadopoulou, M.S.; Diamantoulakis, P.; Liopa-Tsakalidi, A.; Barouchas, P.; Salahas, G.; Karagiannidis, G.; Wan, S.; Goudos, S.K. Internet of Things (IoT) and Agricultural Unmanned Aerial Vehicles (UAVs) in Smart Farming: A Comprehensive Review. Internet Things 2022, 18, 100187. [Google Scholar] [CrossRef]
  16. Hu, L.W.; Zhou, Z.F.; Yin, L.J.; Zhu, M.; Huang, D.H. Identification of Rapeseed at Seedling Stage Based on UAV RGB Images. J. Agric. Sci. Technol. 2022, 24, 116–128. [Google Scholar] [CrossRef]
  17. Ore, G.; Alcantara, M.S.; Goes, J.A.; Oliveira, L.P.; Yepes, J.; Teruel, B.; Castro, V.; Bins, L.S.; Castro, F.; Luebeck, D.; et al. Crop Growth Monitoring with Drone-Borne DInSAR. Remote. Sens. 2020, 12, 615. [Google Scholar] [CrossRef]
  18. Huang, Q.; Feng, J.; Gao, M.; Lai, S.; Han, G.; Qin, Z.; Fan, J.; Huang, Y. Precise Estimation of Sugarcane Yield at Field Scale with Allometric Variables Retrieved from UAV Phantom 4 RTK Images. Agronomy 2024, 14, 476. [Google Scholar] [CrossRef]
  19. Amarasingam, N.; Powell, K.; Sandino, J.; Bratanov, D.; Ashan Salgadoe, A.S.; Gonzalez, F. Mapping of Insect Pest Infestation for Precision Agriculture: A UAV-Based Multispectral Imaging and Deep Learning Techniques. Int. J. Appl. Earth Obs. Geoinf. 2025, 137, 104413. [Google Scholar] [CrossRef]
  20. Wang, Z.; Nie, C.; Wang, H.; Ao, Y.; Jin, X.; Yu, X.; Bai, Y.; Liu, Y.; Shao, M.; Cheng, M.; et al. Detection and Analysis of Degree of Maize Lodging Using UAV-RGB Image Multi-Feature Factors and Various Classification Methods. ISPRS Int. J. Geo-Inf. 2021, 10, 309. [Google Scholar] [CrossRef]
  21. Dimyati, M.; Supriatna, S.; Nagasawa, R.; Pamungkas, F.D.; Pramayuda, R. A Comparison of Several UAV-Based Multispectral Imageries in Monitoring Rice Paddy (A Case Study in Paddy Fields in Tottori Prefecture, Japan). ISPRS Int. J. Geo-Inf. 2023, 12, 36. [Google Scholar] [CrossRef]
  22. Li, B.; Xu, X.; Zhang, L.; Han, J.; Bian, C.; Li, G.; Liu, J.; Jin, L. Above-Ground Biomass Estimation and Yield Prediction in Potato by Using UAV-Based RGB and Hyperspectral Imaging. ISPRS J. Photogramm. Remote Sens. 2020, 162, 161–172. [Google Scholar] [CrossRef]
  23. Narmilan, A.; Gonzalez, F.; Salgadoe, A.S.A.; Powell, K. Detection of White Leaf Disease in Sugarcane Using Machine Learning Techniques over UAV Multispectral Images. Drones 2022, 6, 230. [Google Scholar] [CrossRef]
  24. Xu, J.-X.; Ma, J.; Tang, Y.-N.; Wu, W.-X.; Shao, J.-H.; Wu, W.-B.; Wei, S.-Y.; Liu, Y.-F.; Wang, Y.-C.; Guo, H.-Q. Estimation of Sugarcane Yield Using a Machine Learning Approach Based on UAV-LiDAR Data. Remote. Sens. 2020, 12, 2823. [Google Scholar] [CrossRef]
  25. Cheng, G.; Xie, X.; Han, J.; Guo, L.; Xia, G.-S. Remote Sensing Image Scene Classification Meets Deep Learning: Challenges, Methods, Benchmarks, and Opportunities. IEEE J. Sel. Top. Appl. Earth Obs. Remote Sens. 2020, 13, 3735–3756. [Google Scholar] [CrossRef]
  26. Jiang, H.; Peng, M.; Zhong, Y.; Xie, H.; Hao, Z.; Lin, J.; Ma, X.; Hu, X. A Survey on Deep Learning-Based Change Detection from High-Resolution Remote Sensing Images. Remote. Sens. 2022, 14, 1552. [Google Scholar] [CrossRef]
  27. Maimaitijiang, M.; Sagan, V.; Sidike, P.; Hartling, S.; Esposito, F.; Fritschi, F.B. Soybean Yield Prediction from UAV Using Multimodal Data Fusion and Deep Learning. Remote Sens. Environ. 2020, 237, 111599. [Google Scholar] [CrossRef]
  28. Yang, M.-D.; Tseng, H.-H.; Hsu, Y.-C.; Tsai, H.P. Semantic Segmentation Using Deep Learning with Vegetation Indices for Rice Lodging Identification in Multi-Date UAV Visible Images. Remote Sens. 2020, 12, 633. [Google Scholar] [CrossRef]
  29. Kerkech, M.; Hafiane, A.; Canals, R. Vine Disease Detection in UAV Multispectral Images Using Optimized Image Registration and Deep Learning Segmentation Approach. Comput. Electron. Agric. 2020, 174, 105446. [Google Scholar] [CrossRef]
  30. Modi, R.U.; Kancheti, M.; Subeesh, A.; Raj, C.; Singh, A.K.; Chandel, N.S.; Dhimate, A.S.; Singh, M.K.; Singh, S. An Automated Weed Identification Framework for Sugarcane Crop: A Deep Learning Approach. Crop Prot. 2023, 173, 106360. [Google Scholar] [CrossRef]
  31. Adrian, J.; Sagan, V.; Maimaitijiang, M. Sentinel SAR-Optical Fusion for Crop Type Mapping Using Deep Learning and Google Earth Engine. ISPRS J. Photogramm. Remote Sens. 2021, 175, 215–235. [Google Scholar] [CrossRef]
  32. Wang, B.; Chen, Z.L.; Wu, L.; Xie, P.; Fan, D.L.; Fu, B.L. Road Extraction from High-Resolution Remote Sensing Images Using U-Net with Connectivity. J. Remote Sens. 2020, 24, 1488–1499. [Google Scholar]
  33. Chen, Z.; Wang, C.; Li, J.; Xie, N.; Han, Y.; Du, J. Reconstruction Bias U-Net for Road Extraction from Optical Remote Sensing Images. IEEE J. Sel. Top. Appl. Earth Obs. Remote Sens. 2021, 14, 2284–2294. [Google Scholar] [CrossRef]
  34. Ronneberger, O.; Fischer, P.; Brox, T. U-Net: Convolutional Networks for Biomedical Image Segmentation 2015. In Medical Image Computing and Computer-Assisted Intervention—MICCAI 2015; Springer: Cham, Switzerland, 2015. [Google Scholar]
  35. Xu, H.M. Research on Classification Method of High-Resolution Remote Sensing Images Based on Deep Learning U-Net Model. Master’s Thesis, Southwest Jiaotong University, Chengdu, China, 2018. Available online: https://d.wanfangdata.com.cn/thesis/CiBUaGVzaXNOZXdTMjAyNTA2MTMyMDI1MDYxMzE2MTkxNhIJRDAxNDYzOTEwGgh3ZmR0dDZoZQ== (accessed on 27 October 2025).
  36. Zhao, X.; Yuan, Y.; Song, M.; Ding, Y.; Lin, F.; Liang, D.; Zhang, D. Use of Unmanned Aerial Vehicle Imagery and Deep Learning UNet to Extract Rice Lodging. Sensors 2019, 19, 3859. [Google Scholar] [CrossRef]
  37. Solórzano, J.V.; Mas, J.F.; Gao, Y.; Gallardo-Cruz, J.A. Land Use Land Cover Classification with U-Net: Advantages of Combining Sentinel-1 and Sentinel-2 Imagery. Remote Sens. 2021, 13, 3600. [Google Scholar] [CrossRef]
  38. He, K.; Zhang, X.; Ren, S.; Sun, J. Deep Residual Learning for Image Recognition. arXiv 2015, arXiv:1512.03385. [Google Scholar] [CrossRef]
  39. He, K.; Zhang, X.; Ren, S.; Sun, J. Identity Mappings in Deep Residual Networks. In Proceedings of the Computer Vision—ECCV 2016—14th European Conference, Amsterdam, The Netherlands, 11–14 October 2016. [Google Scholar]
  40. Woo, S.; Park, J.; Lee, J.-Y.; Kweon, I.S. CBAM: Convolutional Block Attention Module 2018. In Computer Vision—ECCV 2018; Springer: Cham, Switzerland, 2018. [Google Scholar]
  41. Chen, L.-C.; Papandreou, G.; Kokkinos, I.; Murphy, K.; Yuille, A.L. DeepLab: Semantic Image Segmentation with Deep Convolutional Nets, Atrous Convolution, and Fully Connected CRFs. IEEE Trans. Pattern Anal. Mach. Intell. 2018, 40, 834–848. [Google Scholar] [CrossRef] [PubMed]
  42. Huang, T.; Xu, J. Spatio-Temporal Evolution Characteristics, Causes and Countermeasures of Cultivated Land Conversion in Guangxi over the Past 40 Years. Chin. J. Agric. Resour. Reg. Plan. 2023, 44, 40–51. Available online: https://d.wanfangdata.com.cn/periodical/zgnyzyyqh202310007 (accessed on 27 October 2025).
  43. Shorten, C.; Khoshgoftaar, T.M. A Survey on Image Data Augmentation for Deep Learning. J. Big Data 2019, 6, 60. [Google Scholar] [CrossRef]
  44. Yang, Z.; Sinnott, R.O.; Bailey, J.; Ke, Q. A Survey of Automated Data Augmentation Algorithms for Deep Learning-Based Image Classification Tasks. Knowl. Inf. Syst. 2023, 65, 2805–2861. [Google Scholar] [CrossRef]
Figure 1. Location of the study area.
Drones 09 00754 g001
Figure 2. Sample images of the study areas.
Drones 09 00754 g002
Figure 3. Sample annotation results: Sugarcane fields delineated by red boundaries.
Drones 09 00754 g003
Figure 4. Augmentation examples: (a) diagonal mirroring, (b) Gaussian blur, (c) salt-and-pepper noise generation, (d) image sharpening, (e) linear stretching, and (f) gamma correction.
Drones 09 00754 g004
Figure 5. Stem module and residual blocks 1 and 2: (a) stem module, (b) residual block 1, and (c) residual block 2.
Drones 09 00754 g005
Figure 6. CBAM and ASPP: (a) CBAM and (b) ASPP.
Drones 09 00754 g006
Figure 7. U-net baseline architecture.
Drones 09 00754 g007
Figure 8. RCAU-net Architecture.
Drones 09 00754 g008
Figure 9. Training and validation curves: (a) U-net, (b) RU-net, and (c) RCAU-net.
Drones 09 00754 g009
Figure 10. UAV image of the test area.
Drones 09 00754 g010
Figure 11. Localized extraction comparison: (a) ground-truth labels, (b) U-net, (c) RU-net, and (d) RCAU-net.
Drones 09 00754 g011
Figure 12. Localized extraction comparison: (a) ground-truth labels, (b) U-net, (c) RU-net, and (d) RCAU-net.
Drones 09 00754 g012
Figure 13. Localized extraction comparison: (a) ground-truth labels, (b) U-net, (c) RU-net, and (d) RCAU-net.
Drones 09 00754 g013
Table 1. UAV image acquisition locations.
No.LocationLatitude–Longitude RangeNumber of Orthomosaic ScenesAcquisition PeriodArea per Scene (km2)
1Wuning Town, Wuming District, Nanning108°10′1″ E~108°10′55″ E
23°7′55″ N~23°8′56″ N
2January & February 20232.88
2Siyang/Jiao’an Town Border, Shangsi County, Fangchenggang107°56′28″ E~107°57′29″ E
22°7′1″ N~22°7′34″ N
2February & March 20231.80
3Xinhe Town, Jiangzhou District, Chongzuo107°14′31″ E~107°15′22″ E
22°32′10″ N~22°33′00″ N
1February 20232.25
4Changping Township, Fusui County, Chongzuo107°52′23″ E~107°53′31″ E
22°42′14″ N~22°43′08″ N
1April 20233.20
5Laituan Town, Jiangzhou District, Chongzuo107°31′19″ E~107°32′31″ E
22°25′08″ N~22°26′13″ N
2March & April 20234.41
6Luwo Town, Wuming District, Nanning108°17′40″ E~108°18′16″ E
23°15′00″ N~23°15′35″ N
1April 20231
Table 2. Comparison of model architectures.
Feature/ComponentU-NetRU-NetRCAU-Net
Encoder BackboneStandard convolutional blocksResNet50-basedResNet50-based
Core Building BlockDouble convolution and ReLUResidual blocksResidual blocks
Attention MechanismNoneNoneCBAM-integrated
Multi-Scale Context ModuleNoneNoneASPP-integrated
Table 3. Training environment and parameters.
ParameterSpecification
CPUXeon Gold 6430
GPURTX 4090 (24 GB VRAM)
CUDA Version12.4
Input Size(512, 512, 3)
Epochs200
Batch Size16
OptimizerAdam
Clipvalue0.5
Learning Rate ScheduleWarm-Up Cosine Decay
Warm-up Phase2 cycles
Initial LR1 × 10−6
Maximum LR1 × 10−4
Minimum LR1 × 10−6
Early Stopping20 epochs
Table 4. Example binary confusion matrix.
Confusion MatrixPredicted PositivePredicted Negative
Actual PositiveTPFN
Actual NegativeFPTN
Table 5. Sugarcane extraction accuracy evaluation.
ModelPrecisionOAF1 ScoreRecallmIoUKappa
U-net0.90490.89990.89880.89560.84450.8379
RU-net0.95700.95520.95470.95300.92190.9195
RCAU-net0.97310.97190.97160.96990.94470.9419
Disclaimer/Publisher’s Note: The statements, opinions and data contained in all publications are solely those of the individual author(s) and contributor(s) and not of MDPI and/or the editor(s). MDPI and/or the editor(s) disclaim responsibility for any injury to people or property resulting from any ideas, methods, instructions or products referred to in the content.