Article

MCD-Net: Robust Multi-UAV Cooperative Detection via Secondary Matching and Hybrid Fusion for Occluded Objects

College of Intelligence Science and Technology, National University of Defense Technology, Changsha 410008, China
*
Author to whom correspondence should be addressed.
These authors contributed equally to this work.
Drones 2025, 9(11), 739; https://doi.org/10.3390/drones9110739 (registering DOI)
Submission received: 24 August 2025 / Revised: 18 October 2025 / Accepted: 19 October 2025 / Published: 24 October 2025
(This article belongs to the Section Artificial Intelligence in Drones (AID))

Abstract

Multi-Unmanned Aerial Vehicle (UAV) cooperative detection systems enhance perception by sharing object information from well-perceived UAVs to perception-limited UAVs via cross-view projection. However, such projections often suffer from misalignment due to environmental complexities and dynamic conditions, while existing fusion methods lack the robustness to handle these inaccuracies effectively. To address this issue, we propose a novel Multi-UAV Cooperative Detection Network (MCD-Net), which introduces a secondary matching method and a hybrid fusion strategy to mitigate the adverse effects of projection misalignment. The secondary matching method integrates both background and object features to refine the inter-view projection transformation matrix, improving the reliability of cross-view information supplementation. The hybrid fusion strategy combines (1) Confidence-Based Decision Fusion for initial screening; (2) a Region Consistency Measurement module to evaluate similarity before and after projection, eliminating inconsistent results; and (3) a Vehicle Parts Perception module to detect occluded objects in potential regions, reducing false detections. Additionally, we contribute a dedicated vehicle parts dataset to train the classifier within the perception module. Experimental results demonstrate that MCD-Net achieves significant improvements over single-UAV detection, with higher recall and F-score metrics. Specifically, the recall for occluded objects improves by an average of 9.88%, highlighting the robustness and effectiveness of our approach in challenging scenarios.

1. Introduction

Unmanned Aerial Vehicles (UAVs) have become pivotal for real-time perception tasks such as intelligent transportation systems, public safety surveillance, and post-disaster assessment. While significant progress has been made in single-UAV object detection [1,2,3,4,5], the performance of these systems is fundamentally limited by the single-viewpoint problem. This constraint frequently leads to object occlusion, where targets are partially or fully obscured by other objects or environmental structures. As a result, the incomplete visual features available from a single perspective cause even state-of-the-art detectors to fail, compromising situational awareness and decision-making. To address this limitation, multi-UAV cooperative detection has emerged as a powerful paradigm. By fusing information from multiple, spatially distributed viewpoints, these systems can construct a more holistic understanding of the scene, theoretically overcoming the challenge of occlusion. The core mechanism enabling this is cross-view information sharing, which typically relies on projecting object data from one UAV’s coordinate system to another. However, the efficacy of this entire cooperative framework hinges on the precision of this projection. In real-world scenarios, factors such as camera calibration errors, dynamic flight conditions, and complex environments invariably introduce projection misalignments. This leads to a critical research gap: while multi-UAV systems offer a solution to occlusion, existing fusion methods often presuppose perfect data alignment and lack the robustness to handle the inevitable projection inaccuracies, which can degrade or even corrupt the final detection results.
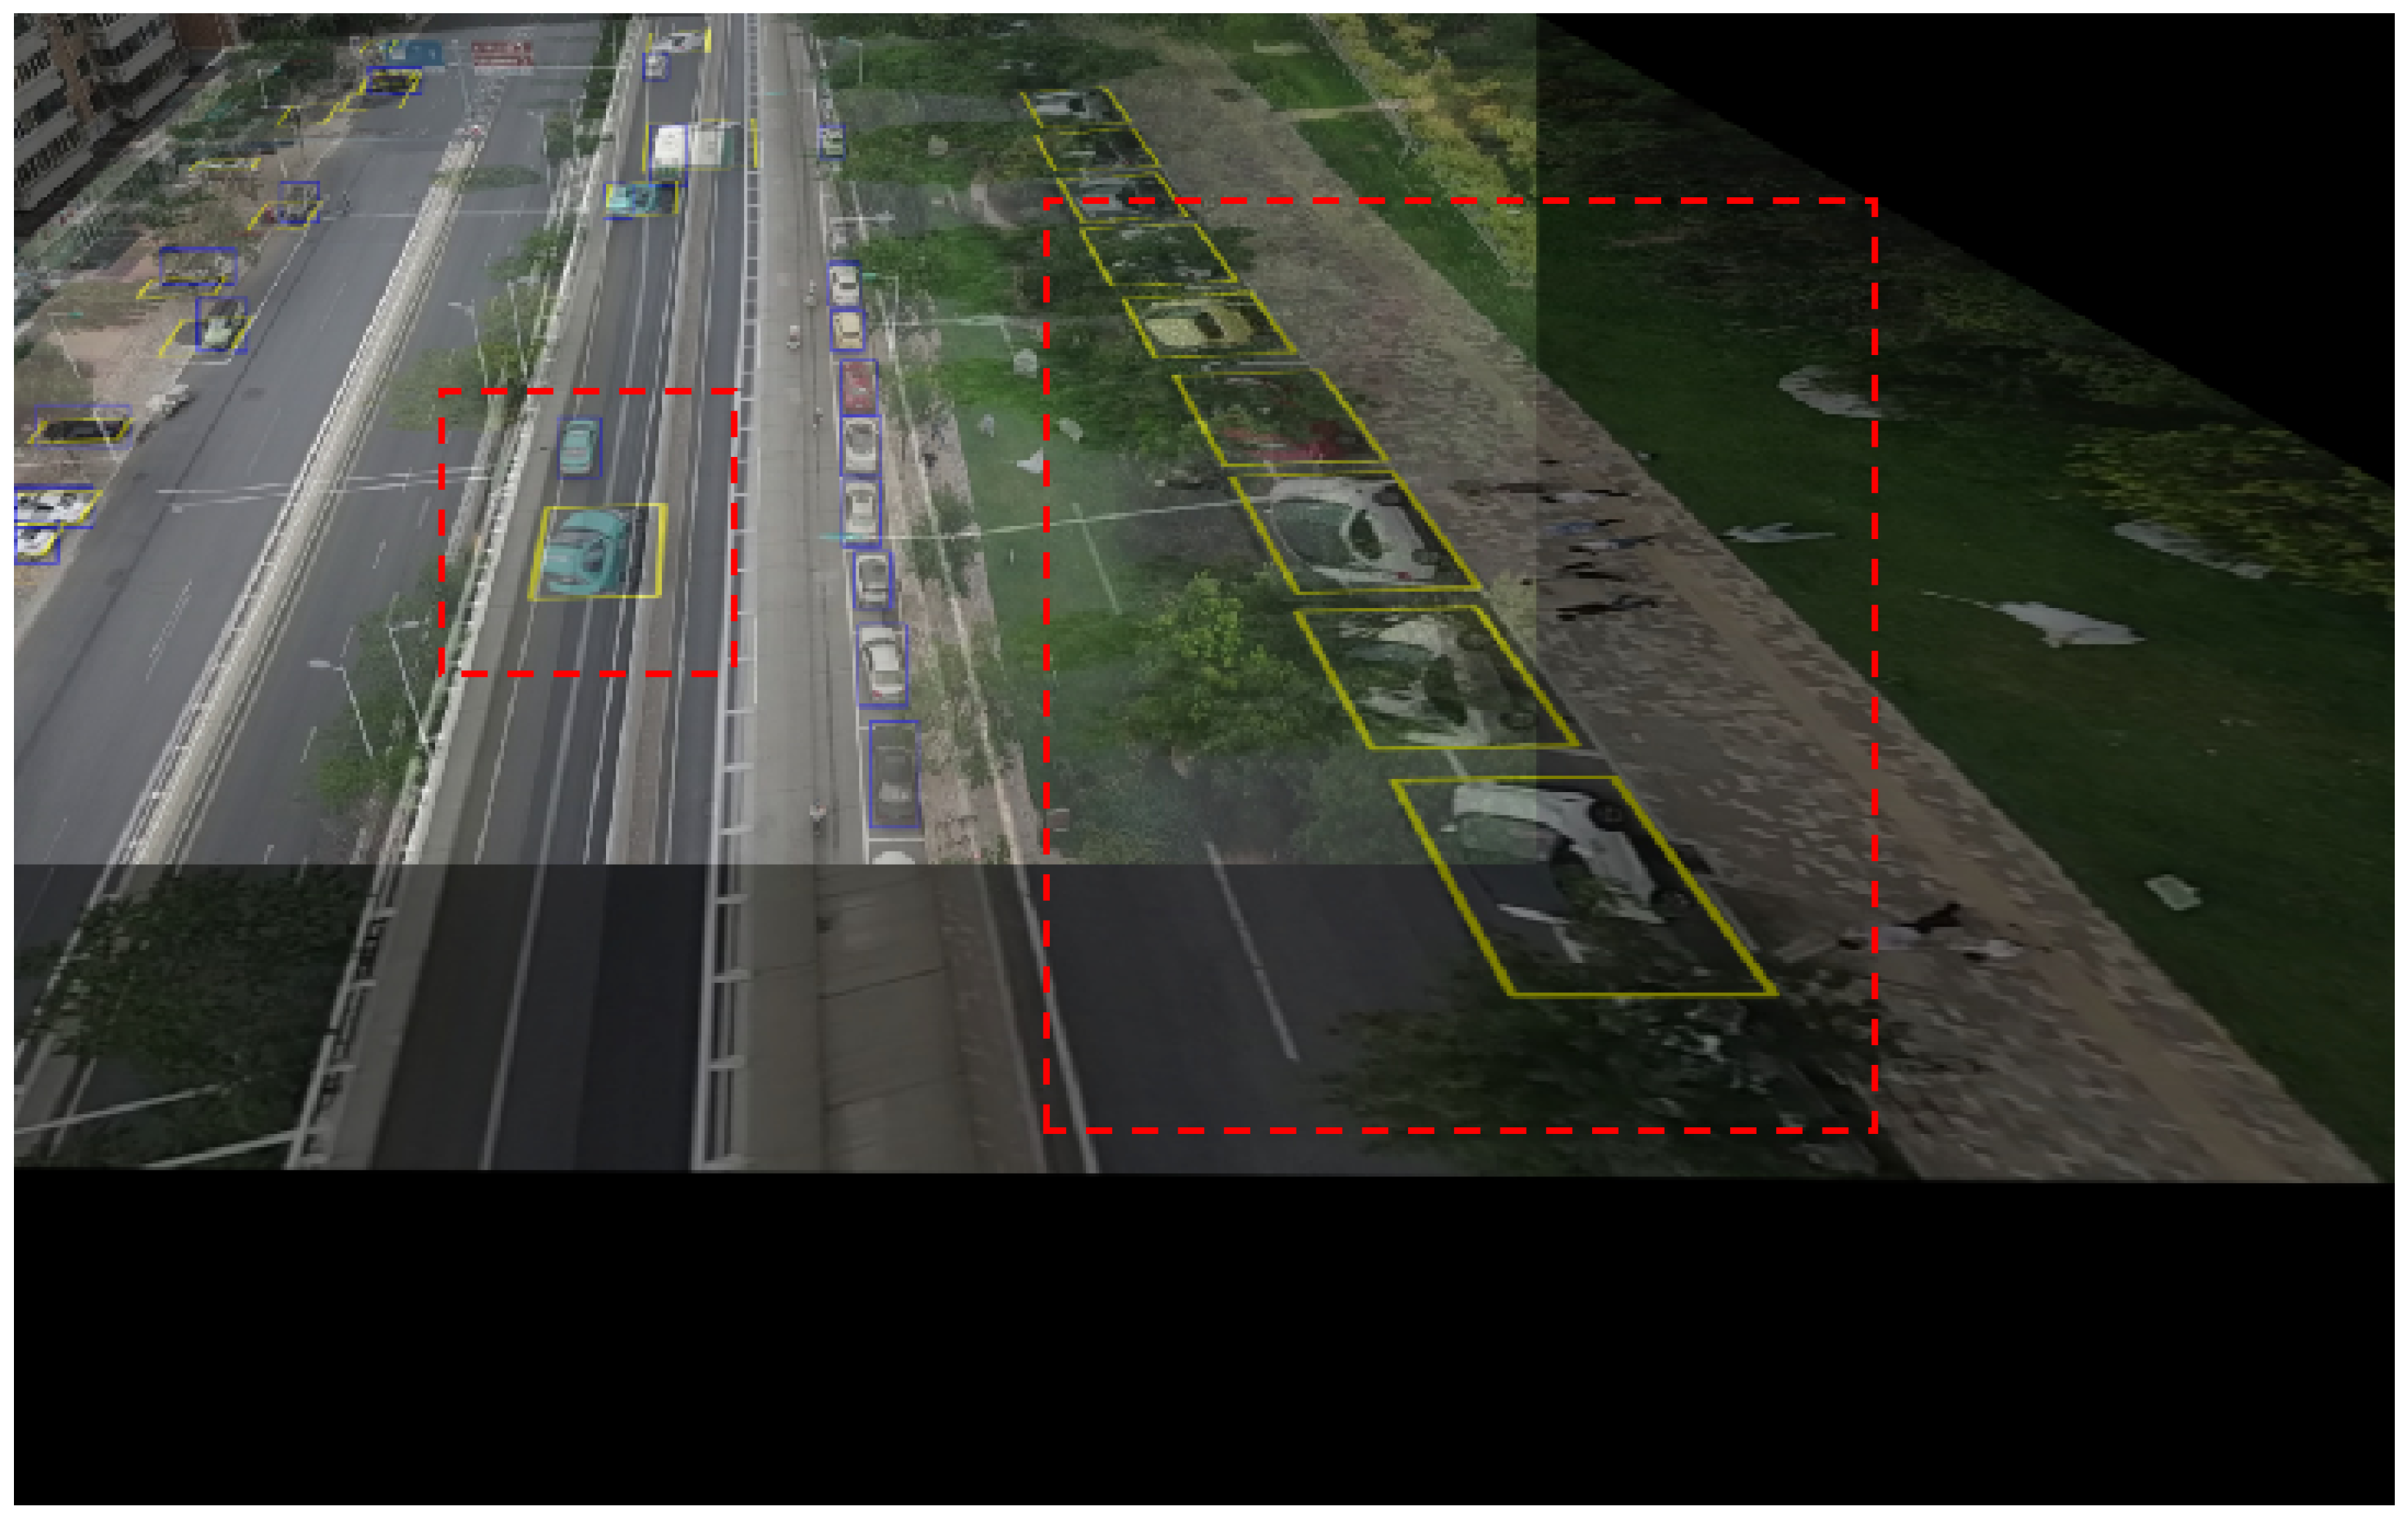
Association matching is an important part of cross-view information sharing. Li et al. (2022) utilized the triangular topological features between objects to achieve the association [6]. This method only requires the pixel coordinates of the objects, but may not work when the number of objects is small. Pan et al. (2023) explored object association using coordinates in 3D space and improved the matching accuracy through topological mapping relationships between cameras [7]. This method relies on the UAV’s own positioning information and pod attitude, which is susceptible to vibration errors due to motion in the real world. Some methods computed the projection transformation matrix between two views by extracting feature points to find the transformation relationship between different pixel coordinate systems [8,9,10], so that the objects can be transformed to the same coordinate system for object association, which is a common matching paradigm with good adaptability. SuperGlue and LightGlue are feature extraction and matching methods based on deep learning [11,12,13], which are obtained through large data training. Using directly without training can achieve more accurate results than traditional methods such as SIFT [14]. However, even with LightGlue, there are still some deviations after projection transformations when dealing with some cases with large view differences (as shown in Figure 1). These deviations will have an adverse effect on the subsequent fusion.
Common multi-source information fusion approaches are feature fusion methods and decision fusion methods [15,16,17]. The former aims to transform data from different sources into a unified feature space for comprehensive analysis. But if the projection matrix used for the transformation process has a large deviation, the generated feature maps may introduce noise or error information which may affect the performance of the whole system. In contrast, decision-level fusion is relatively less affected because information is not merged until the final decision-making stage, but error messages are still introduced. In practice, deviations in projection transformations are unavoidable, but existing fusion methods lack corresponding countermeasures.
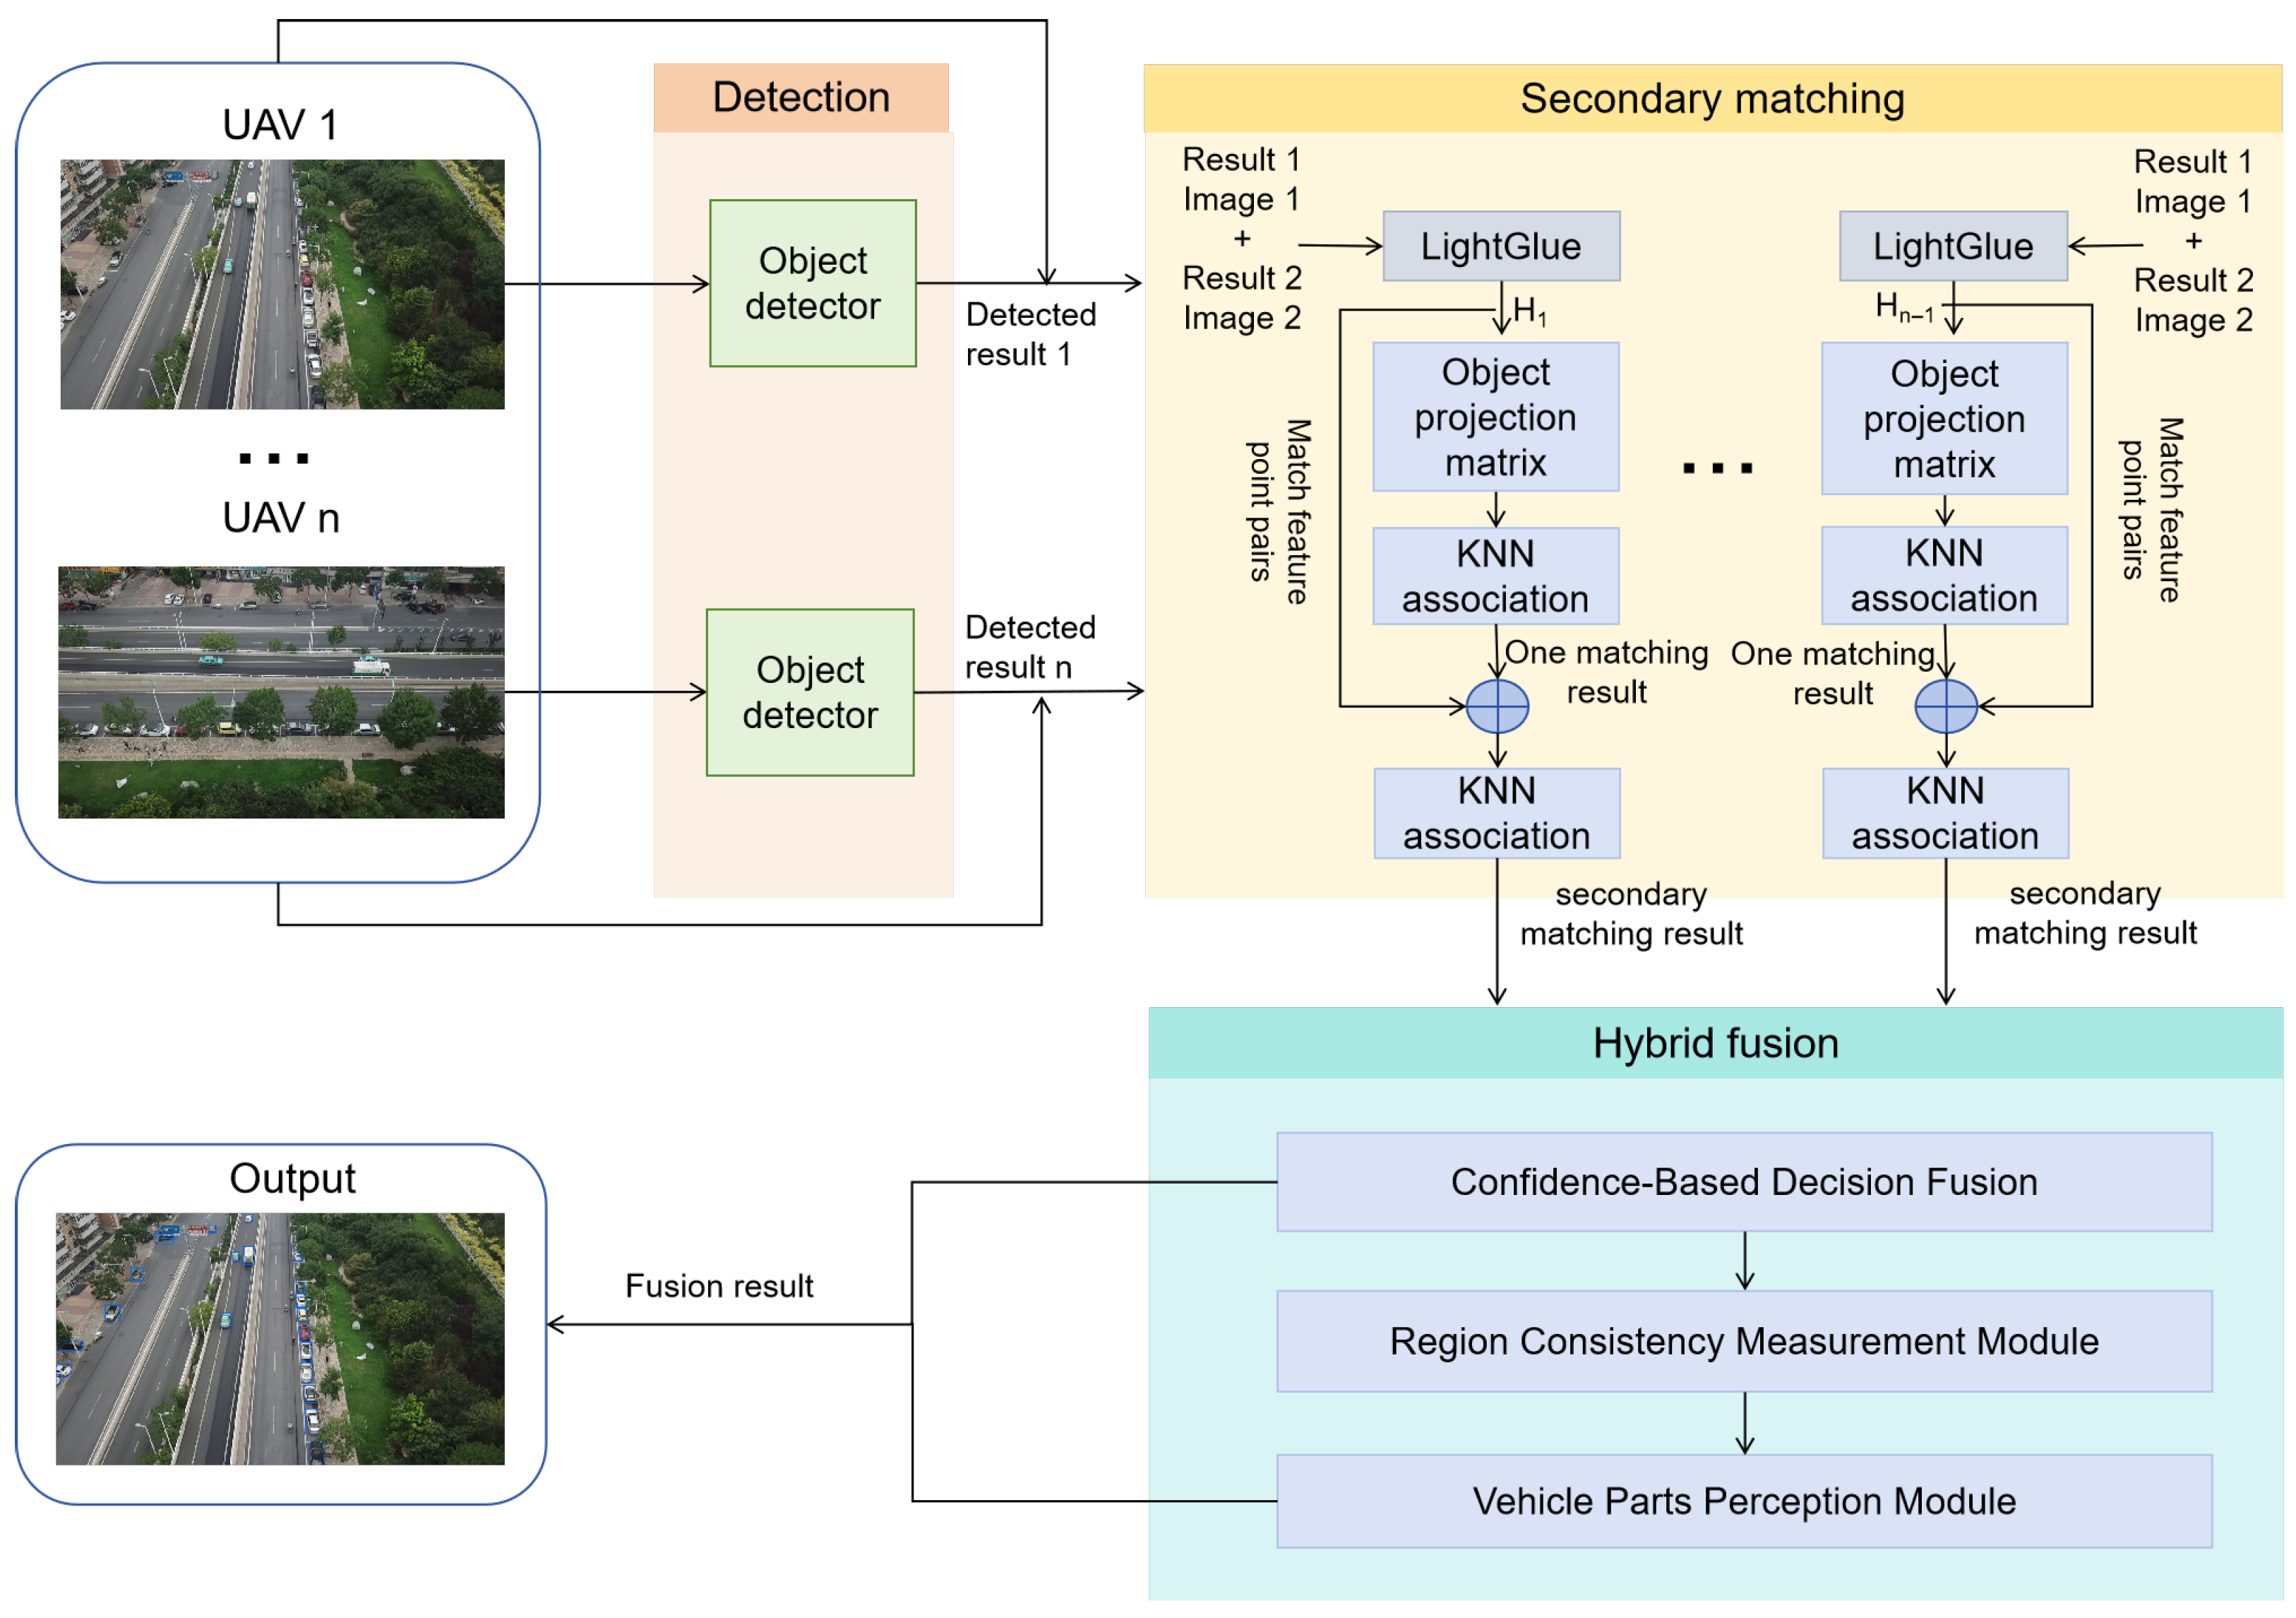
In order to mitigate the adverse effects of projection transformation misalignment on fusion and also to better utilize the complementary information of multiple views, we propose an effective Multi-UAV Cooperative Detection Network (MCD-Net), which consists of three segments: single-UAV detection, multi-UAV matching, and hybrid fusion. A secondary matching method is designed in the multi-UAV matching phase to improve matching accuracy by integrating background features with object information. The focus is on hybrid fusion, including Confidence-Based Decision Fusion (CD Fusion), Region Consistency Measurement module (RCM module) and Vehicle Parts Perception module (VPP module). The CD Fusion is a simple confidence-based filter, and the RCM module measures the similarity of the corresponding areas before and after projection to reduce error information due to projection deviations. For the projected area that is excluded by the RCM module, the VPP module is designed to further determine whether there is an occluded vehicle object in it to reduce false detection, and a vehicle parts dataset was made for training the classifier in VPP module. The experimental results show that MCD-Net can achieve higher F 1   s c o r e than single-UAV and simple decision fusion results, and can balance recall and precision better.
The rest of the paper is organized as follows: Section 2 describes our approach and the specific implementation of each module, Section 3 describes the construction of the vehicle parts dataset, the experiments, and the results, and Section 4 concludes the full paper and looks forward to future work.

2. Our Method

2.1. MCD-Net Architecture

In this section, we propose a flexible and effective multi-UAV detection network based on hybrid fusion. The overview of the network architecture is shown in Figure 2. The process is divided into three parts: single-agent detection, secondary matching, and hybrid fusion. The entire cooperative workflow selects one designated UAV as the host viewpoint, with other UAV performing one-to-one matching and fusion with the host. Overlapping results are then eliminated to obtain the final detection output. In the single-UAV detection stage, independent object detection is performed on the images from each UAV. Assuming the detection results predicted by each UAV form a set B   B o x e s , this set may contain multiple object entries, with each object’s information represented as ( x l e f t t o p , y l e f t t o p , x r i g h t b o t t o m , y r i g h t b o t t o m , c o n f ), where ( x l e f t t o p , y l e f t t o p ) represents the coordinates of the top-left corner of the bounding box, ( x r i g h t b o t t o m , y r i g h t b o t t o m ) represents the coordinates of the bottom-right corner, and c o n f denotes the confidence score of the object.
The methods used for matching and fusion will be introduced in the following sections.

2.2. Secondary Matching Method

The secondary matching method proposed in this paper is based on the LightGlue-based projection matching approach. However, using LightGlue alone for projection matching may result in misalignment, causing the prompted location on the host UAV’s image to deviate from the true position. In cases of slight projection misalignment, the prompted location may partially shift relative to the actual object position. When the misalignment is severe, the prompted location may become completely displaced, pointing to an entirely wrong position. To address this issue, we propose a secondary matching method that integrates both object information and background context to improve matching accuracy and robustness.
In cross-drone target association, we employed an image rotation strategy to enhance the quality of feature matching [10]. Specifically, each image was rotated by integer multiples of 90°, including 0°, 90°, 180°, and 270°, to determine the optimal matching angle under different viewpoints. LightGlue was then applied at each rotation angle to extract and match feature points across the (Table S1). To improve computational efficiency, we retained only the rotation angle that yielded the highest number of feature points and used it as the benchmark for subsequent matching. Additionally, we utilized the Random Sample Consensus (RANSAC) algorithm (Table S1) to exclude false matches and ensure the robustness of the matching results [18].
The matched feature points are used to compute the projection transformation matrix H B A from view B to view A. The transformation matrix H B A can be used to calculate the pixel coordinates ( x , y ) in view B corresponding to the projected pixel coordinates ( x , y ) in view A. The calculation formula is shown in (1).
s x y 1 = H B A x y 1 = h 11 h 12 h 13 h 21 h 22 h 23 h 31 h 32 h 33 x y 1
Using the H B A , the detection results B B o x e s B under view B can be projected to view A to get the potential object set B B o x e s B . After projection, the results whose center point coordinates are less than 0 or bigger than the length and width of the image are considered to be not in the common field of view and deleted.The Euclidean distances between each object center in B B o x e s B and each object center in B B o x e s A are used as matching criteria. These distances are calculated sequentially, as shown in (2).
C o s t M a t r i x m   ×   n [ i , j ] = ( x B , i x A , j ) 2 + ( y B , i y A , j ) 2
C o s t M a t r i x m   ×   n is the constructed distance cost matrix, where m is the number of objects in B B o x e s B , and n is the number of objects in B B o x e s A . The element C o s t M a t r i x m × n [ i , j ] represents the Euclidean distance between the i-th object center in B B o x e s B and the j-th object center in B B o x e s A .
The K-Nearest Neighbor (KNN) method (Table S1) is used for matching [19], with a distance threshold set at 200. A match is considered valid only if the Euclidean distance between the centers of two objects is less than this threshold. The pseudocode for the algorithm is shown in Algorithm 1.
Three sets are obtained after matching: the matching set [ B B o x e s A M , B B o x e s B M ], the unmatched set B B o x e s A U M which is the set of unmatched object coordinates from the results of view A, and the unmatched projection set [ B B o x e s B U M , B B o x e s B U M ]. B B o x e s B U M is the set of unmatched object coordinates in the set of potential objects, and B B o x e s B U M is the set of object coordinates in view B before transformation, corresponding to the coordinates in B B o x e s B U M .
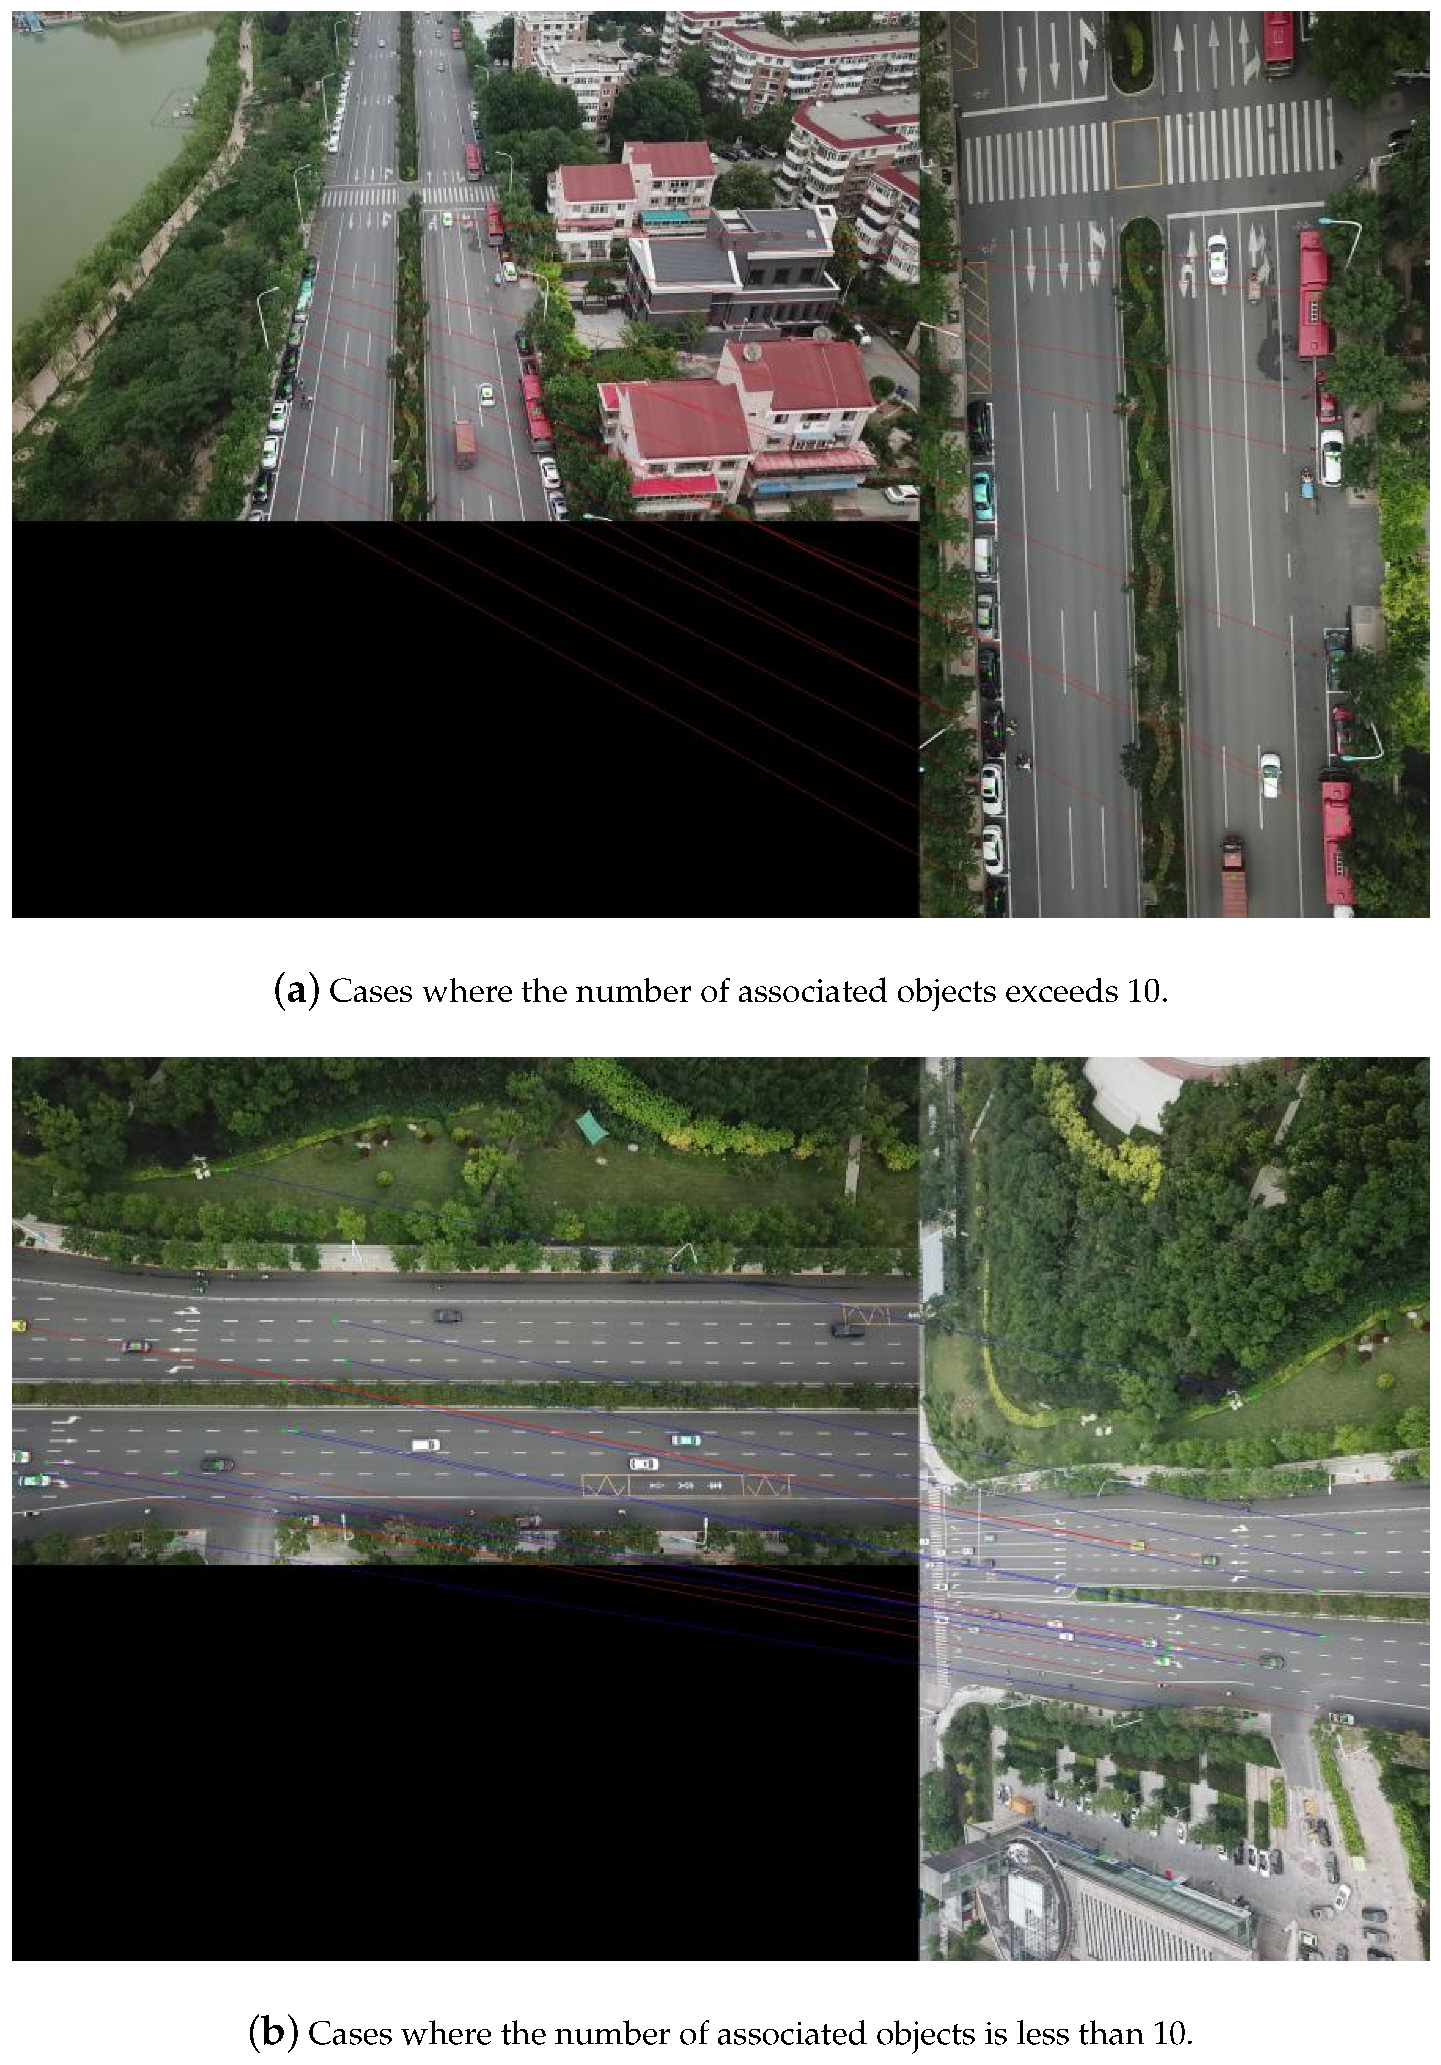
To mitigate the impact of projection misalignment, the matched result [ B B o x e s A M , B B o x e s B M ] obtained from the LightGlue-based projection matching method, along with the pre-projection object coordinates B B o x e s B M corresponding to B B o x e s B M , are combined to form a new set of matched objects across the two views [ B B o x e s A M , B B o x e s B M ]. The center positions of corresponding objects B B o x e s A M in and B B o x e s B M are treated as a pair of matching points. If the number of matched object coordinate pairs is sufficient (greater than 10), a new transformation matrix H o p _ B A is computed directly, using only the object location information. If the number of matched objects is insufficient, the 10 closest feature point pairs from the background features matched by LightGlue are selected and combined with the matched object points to jointly compute H o p _ B A , as shown in Figure 3, where red lines connect matched object pairs and blue lines connect matched background feature points. Incorporating matched object information allows for more object constraints on the matching results, yielding more accurate projections. Moreover, this strategy is not limited by the number of matched objects; when object information is insufficient, the transformation matrix can still be reliably estimated by combining object and background features (Supplementary S3).
After computing the new transformation matrix H o p _ B A , the distance cost matrix between B B o x e s A M and B B o x e s B M is recalculated. The KNN algorithm is then applied for object association, obtaining three sets of object information after matching: the matched object set [ B B o x e s A M , B B o x e s B M ], the unmatched object set B B o x e s A U M , and the unmatched projected object set [ B B o x e s B U M , B B o x e s B U M ]. These three sets form the foundation for the subsequent fusion process.
Algorithm 1 Pseudo-code of KNN-based object association algorithm
Require: 
Distance cost matrix C o s t M a t r i x m × n
Ensure: 
Matched indices list m a t c h _ i n d i c e s ; unmatched indices u n m a t c h _ B and u n m a t c h _ A
1:
Initialize lists: k n n _ m a t c h e s , m a t c h _ i n d i c e s [ ]
2:
Initialize maps: f o r w a r d _ m a t c h , b a c k w a r d _ m a t c h { }
3:
// Phase 1: Find K-Nearest Neighbors
4:
for  i 0 to m 1  do
5:
    r o w C o s t M a t r i x [ i ]
6:
    s o r t e d _ i n d i c e s indices of top k smallest values in r o w
7:
   for each j in s o r t e d _ i n d i c e s  do
8:
     if  r o w [ j ] distance_threshold  then
9:
        Append ( i , j ) to k n n _ m a t c h e s
10:
     end if
11:
   end for
12:
end for
13:
// Phase 2: Forward matching (B to A)
14:
for each ( B _ i d x , A _ i d x ) in k n n _ m a t c h e s  do
15:
   if  B _ i d x f o r w a r d _ m a t c h or C o s t M a t r i x [ B _ i d x ] [ A _ i d x ] < C o s t M a t r i x [ B _ i d x ] [ f o r w a r d _ m a t c h [ B _ i d x ] ]  then
16:
      f o r w a r d _ m a t c h [ B _ i d x ] A _ i d x
17:
   end if
18:
end for
19:
// Phase 3: Backward matching (A to B)
20:
for each ( B _ i d x , A _ i d x ) in k n n _ m a t c h e s  do
21:
   if  A _ i d x b a c k w a r d _ m a t c h   or  C o s t M a t r i x [ B _ i d x ] [ A _ i d x ] < C o s t M a t r i x [ b a c k w a r d _ m a t c h [ A _ i d x ] ] [ A _ i d x ]  then
22:
      b a c k w a r d _ m a t c h [ A _ i d x ] B _ i d x
23:
   end if
24:
end for
25:
// Phase 4: Mutual verification
26:
for each B _ i d x in f o r w a r d _ m a t c h  do
27:
    A _ i d x f o r w a r d _ m a t c h [ B _ i d x ]
28:
   if  b a c k w a r d _ m a t c h [ A _ i d x ] = B _ i d x  then
29:
     Append ( B _ i d x , A _ i d x ) to m a t c h _ i n d i c e s
30:
   end if
31:
end for
32:
// Identify unmatched objects
33:
u n m a t c h _ B { i i [ 0 , m 1 ] , i { b ( b , a ) m a t c h _ i n d i c e s } }
34:
u n m a t c h _ A { j j [ 0 , n 1 ] , j { a ( b , a ) m a t c h _ i n d i c e s } }
35:
return  m a t c h _ i n d i c e s , u n m a t c h _ B , u n m a t c h _ A

2.3. Hybrid Fusion

For the set [ B B o x e s B U M , B B o x e s B U M ], there are two cases. The first one is that if the projection produces a deviation, the pixel region in view A delineated by the position of B B o x e s B U M corresponding to the object region in view B of B B o x e s B U M is inconsistent. The second one is that if the projection is correct, the pixel region in view A delineated by the B B o x e s B U M position really has a object, but it may not be detected due to occlusion. To address the abovementioned problems, we design a hybrid fusion method to screen. Confidence-Based Decision Fusion is performed first to conduct a preliminary screening of the three sets. Then, the consistency measurement module is used to process the set of unmatched projections, thereby excluding non-corresponding results. Finally, the Vehicle Parts Perception module is used to classify the potential object area ( B B o x e s B U M ) in view A to reduce false detection and missing detection. The final result will be displayed on the selected host view. In the following sections, we will introduce the specific modules in hybrid fusion.

2.3.1. Confidence-Based Decision Fusion

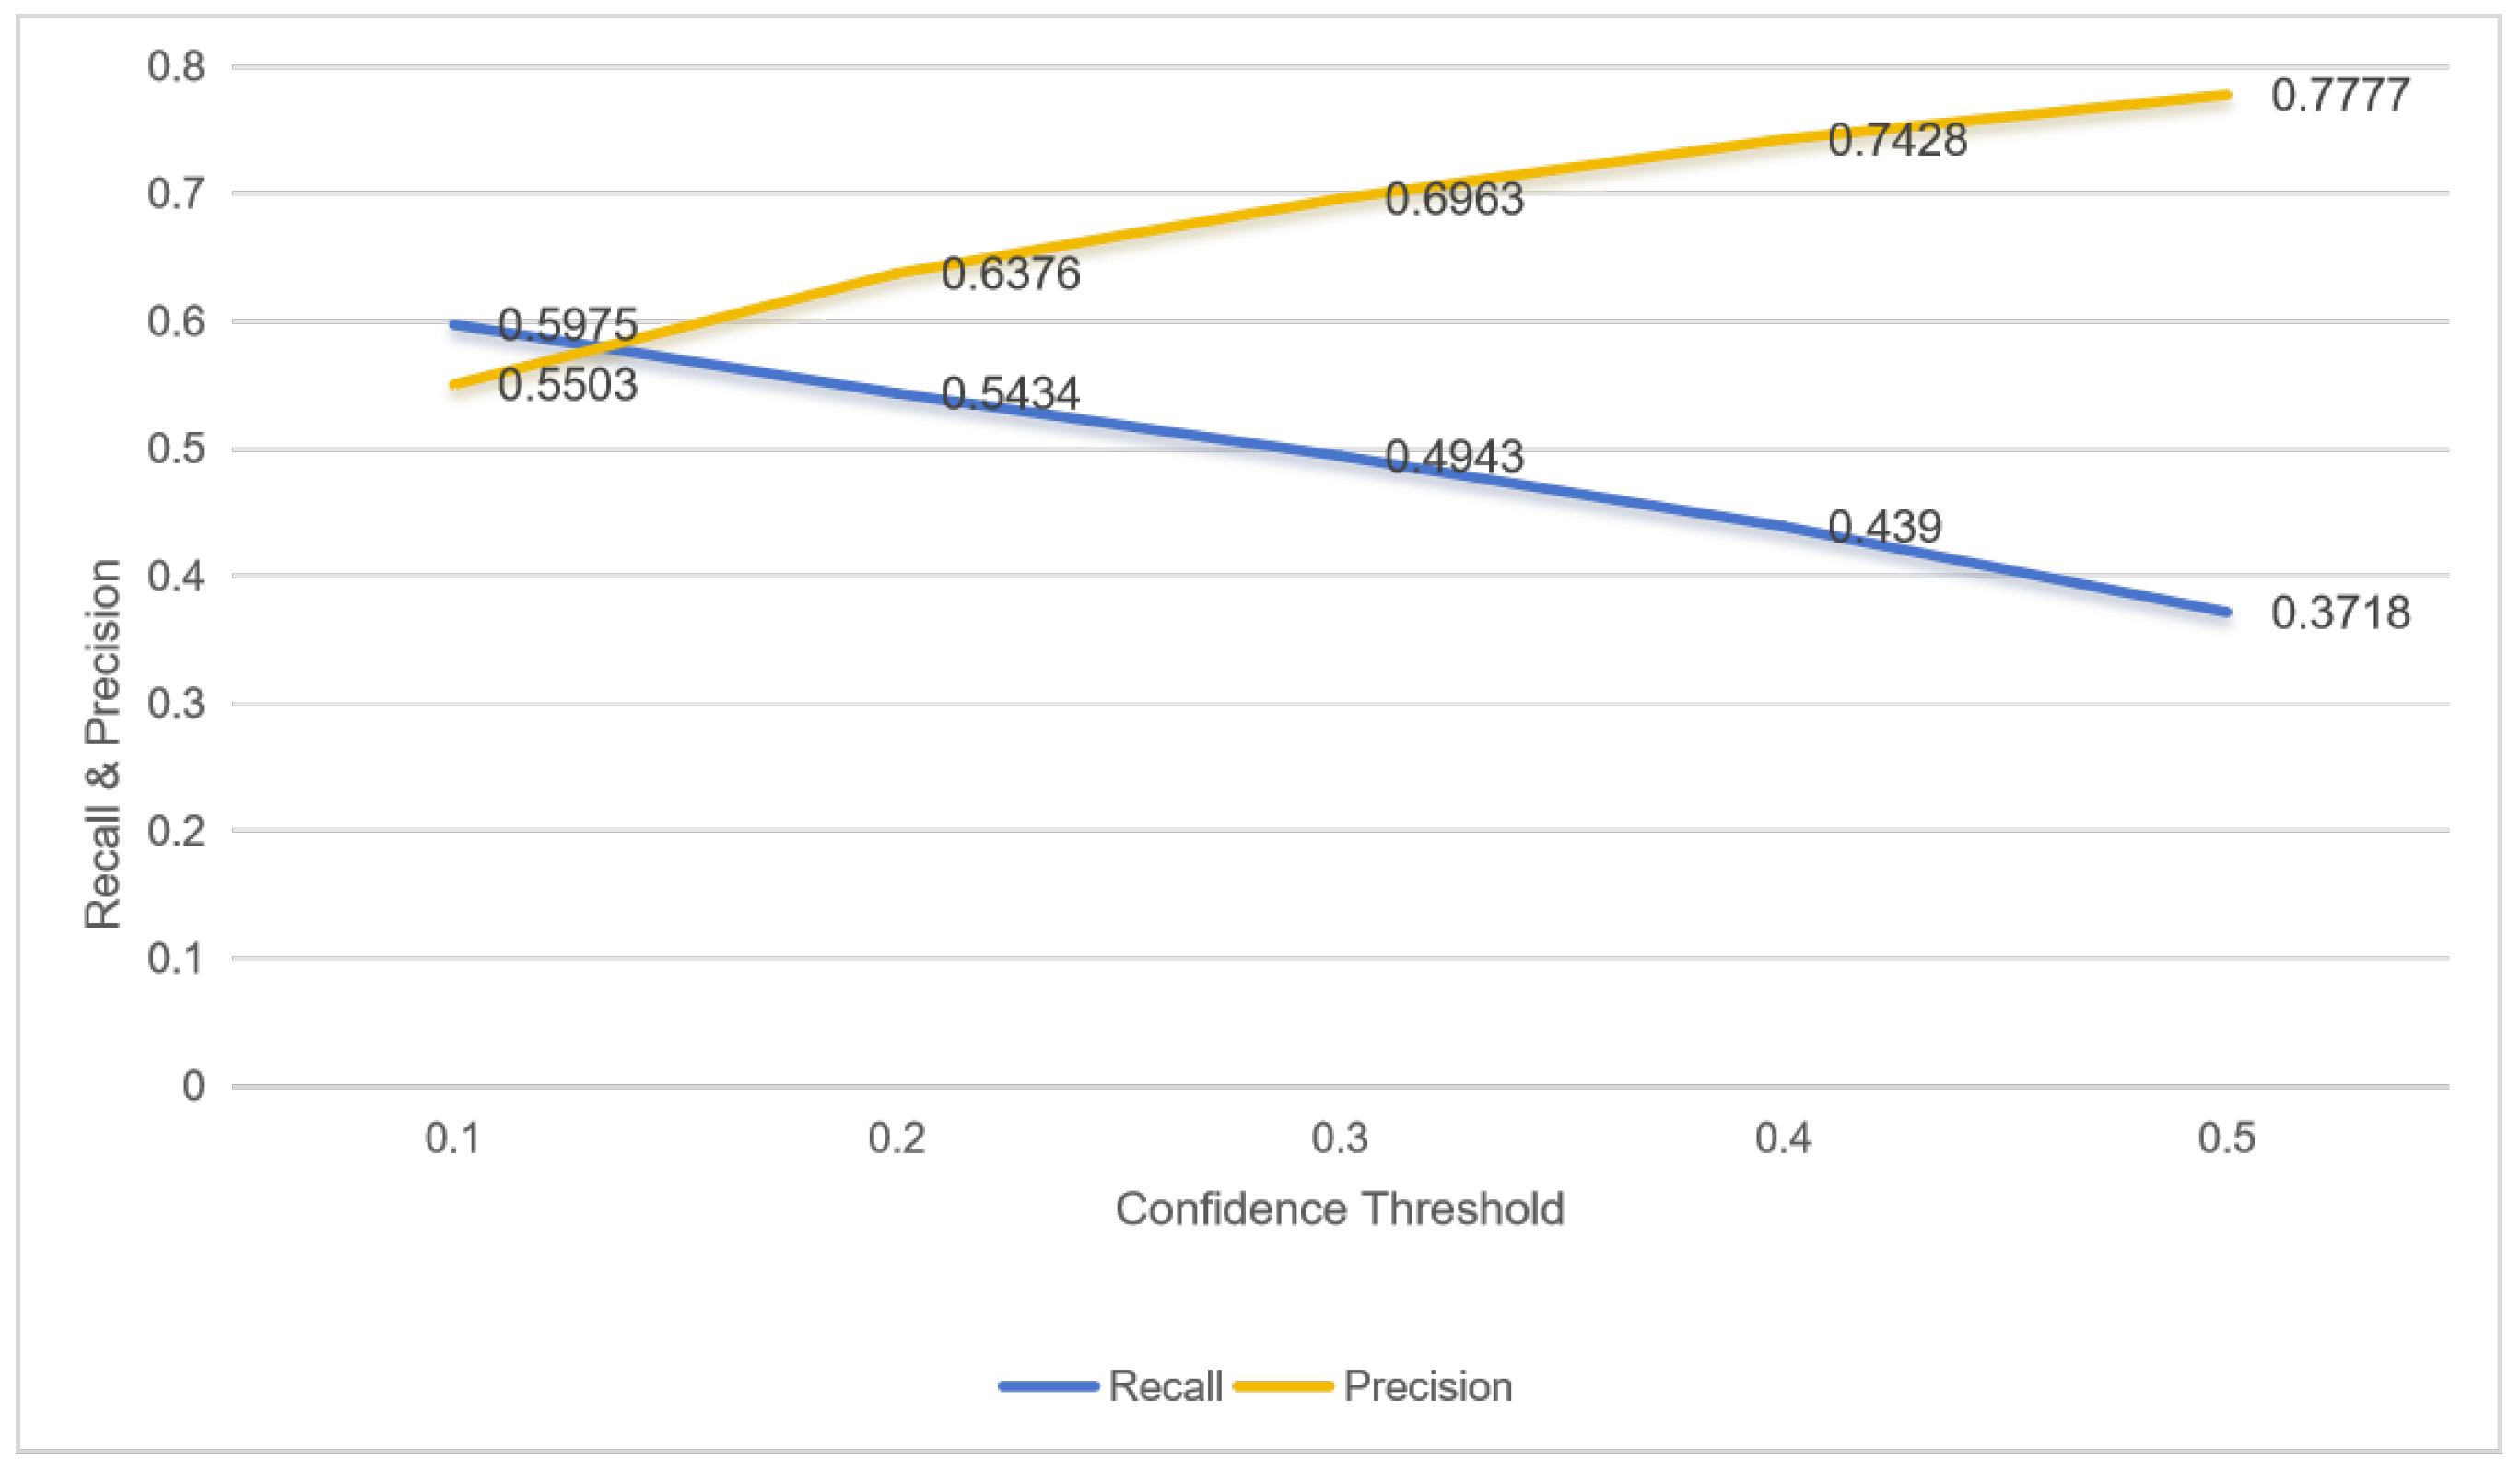
In detection tasks, a confidence threshold is typically set, and only results above this threshold are considered reliable. Bytetrack suggests that low-confidence detection results may contain information about occluded objects [20]. This paper verifies this on the MDMT dataset using a single-UAV detection task, by varying the confidence threshold and calculating the recall and precision of occluded objects in the results. The trends of these two metrics with changing confidence thresholds are shown in Figure 4. As can be seen from the figure, the precision of occluded objects increases as the confidence threshold rises, while the recall decreases. This indicates that using a lower confidence threshold can indeed capture more information about occluded objects, but at the same time introduces more false detections.
Considering that this paper objects multi-UAV tasks, detection results can be obtained from multiple sources. To more reasonably preserve these low-confidence results while reducing the risk of false detections, this paper proposes Confidence-Based Decision Fusion, which applies different confidence thresholds to filter the results from single-UAV and multi-UAV detections, respectively.
For the unmatched set B B o x e s A U M and the unmatched projection set [ B B o x e s B U M , B B o x e s B U M ] with single-UAV results, we set a base confidence threshold of conf1 and delete results below conf1. The unmatched projection set will be further filtered by subsequent modules.
For the matching objects set [ B B o x e s A M , B B o x e s B M ] that both UAVs detect and match, we set a low confidence threshold conf2 (conf2 < conf1). Because the same object may exhibit different characteristics under different viewpoints, the confidence score for object detection in one viewpoint might be low due to occlusion or other factors. However, when observed from another viewpoint, the object may be largely unoccluded, resulting in a higher confidence score. Moreover, even if the object is occluded in both viewpoints, leading to low confidence scores, the integrated judgment combining information from both viewpoints is significantly more reliable than relying solely on a low-confidence result from single viewpoint. Since the final result will be overlaid onto viewpoint A for display, results with medium confidence above conf2 in B B o x e s A M are directly retained.

2.3.2. Region Consistency Measurement Module

Due to inaccuracies in projection transformation, pixel coordinate mapping across different viewpoints often fails to ensure that corresponding points align with the exact same real-world location. To address this, we leverage the computation of image feature similarity to determine whether regions before and after projection correspond to the same physical location. However, under different viewpoints, image appearance may be affected by complex factors such as illumination changes, scale variations, and occlusion, leading to changes in visual features. Traditional feature extraction methods (e.g., color histograms and structural similarity) often struggle to handle these challenges effectively. While trained neural networks can manage certain complex scenarios to some extent, their performance heavily depends on the quality and diversity of the training data, which limits their stability and generalization capability.
To address this, we introduces the Contrastive Language–Image Pretraining (CLIP) model as the image feature extractor [21]. The image encoder of CLIP is based on the Vision Transformer architecture. Through image–text contrastive learning, it maps visual features into a multimodal semantic space aligned with text, enabling a deep understanding of image content. Moreover, since CLIP is pretrained on large-scale cross-modal data, it possesses strong feature representation capability and zero-shot transfer ability. As a result, its image feature extraction is highly stable and can be applied directly without fine-tuning.
Leveraging these advantages, we design a Region Consistency Measurement module (RCM Module) based on CLIP’s image encoder. The specific process is as follows: First, based on the projection set [ B B o x e s B U M , B B o x e s B U M ], we extract the corresponding image patches from viewpoint A and viewpoint B, respectively. These image patches are then fed into CLIP’s image encoder to extract features. The encoder outputs 512-dimensional feature vectors v 1 and v 2 , representing the features of the two regions. Subsequently, these feature vectors undergo L2 normalization to ensure that the cosine similarity computation depends solely on the direction of the vectors, rather than their magnitudes. This step is critical for obtaining accurate and scale-invariant similarity measurements. Finally, the cosine similarity between the two feature vectors is computed as shown in (3). A similarity threshold of 0.9 is set; if the calculated similarity exceeds this threshold, the two regions are considered to correspond to the same physical area and are passed to the next step for further verification to confirm the presence of an object.
The RCM module proposed in this paper provides an effective solution for addressing the issue of misaligned regions across multiple viewpoints. Based on the CLIP pretrained model, this module can determine projection discrepancies by calculating the semantic similarity between images without requiring additional training. Compared to traditional methods, this approach enhances the system’s adaptability in complex scenarios.
c o s i n e _ s i m i l a r i t y ( v 1 , v 2 ) = v 1 · v 2 | | v 1 | | · | | v 2 | |

2.3.3. Vehicle Parts Perception Module

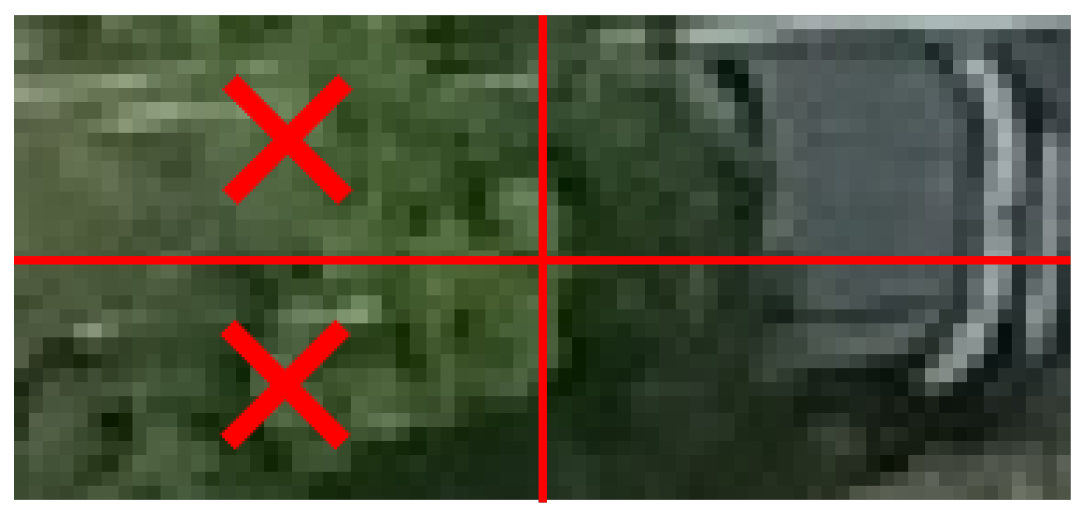
Objects occlusion will seriously affect the performance of UAV detection algorithms. While making masks for occluded objects can improve the network’s ability to perceive occlusions [22], fine annotations take a lot of time and cannot cover all occlusion cases. We observed that when splitting images of occluded vehicles, some of the resulting image blocks are often unoccluded. For example, in the case shown in Figure 5, although the overall occlusion rate exceeds fifty percent, after dividing the image into four quadrants and examining each block individually, it becomes evident that the two left blocks consist almost entirely of background information, while the two right blocks retain relatively intact features of vehicle parts.
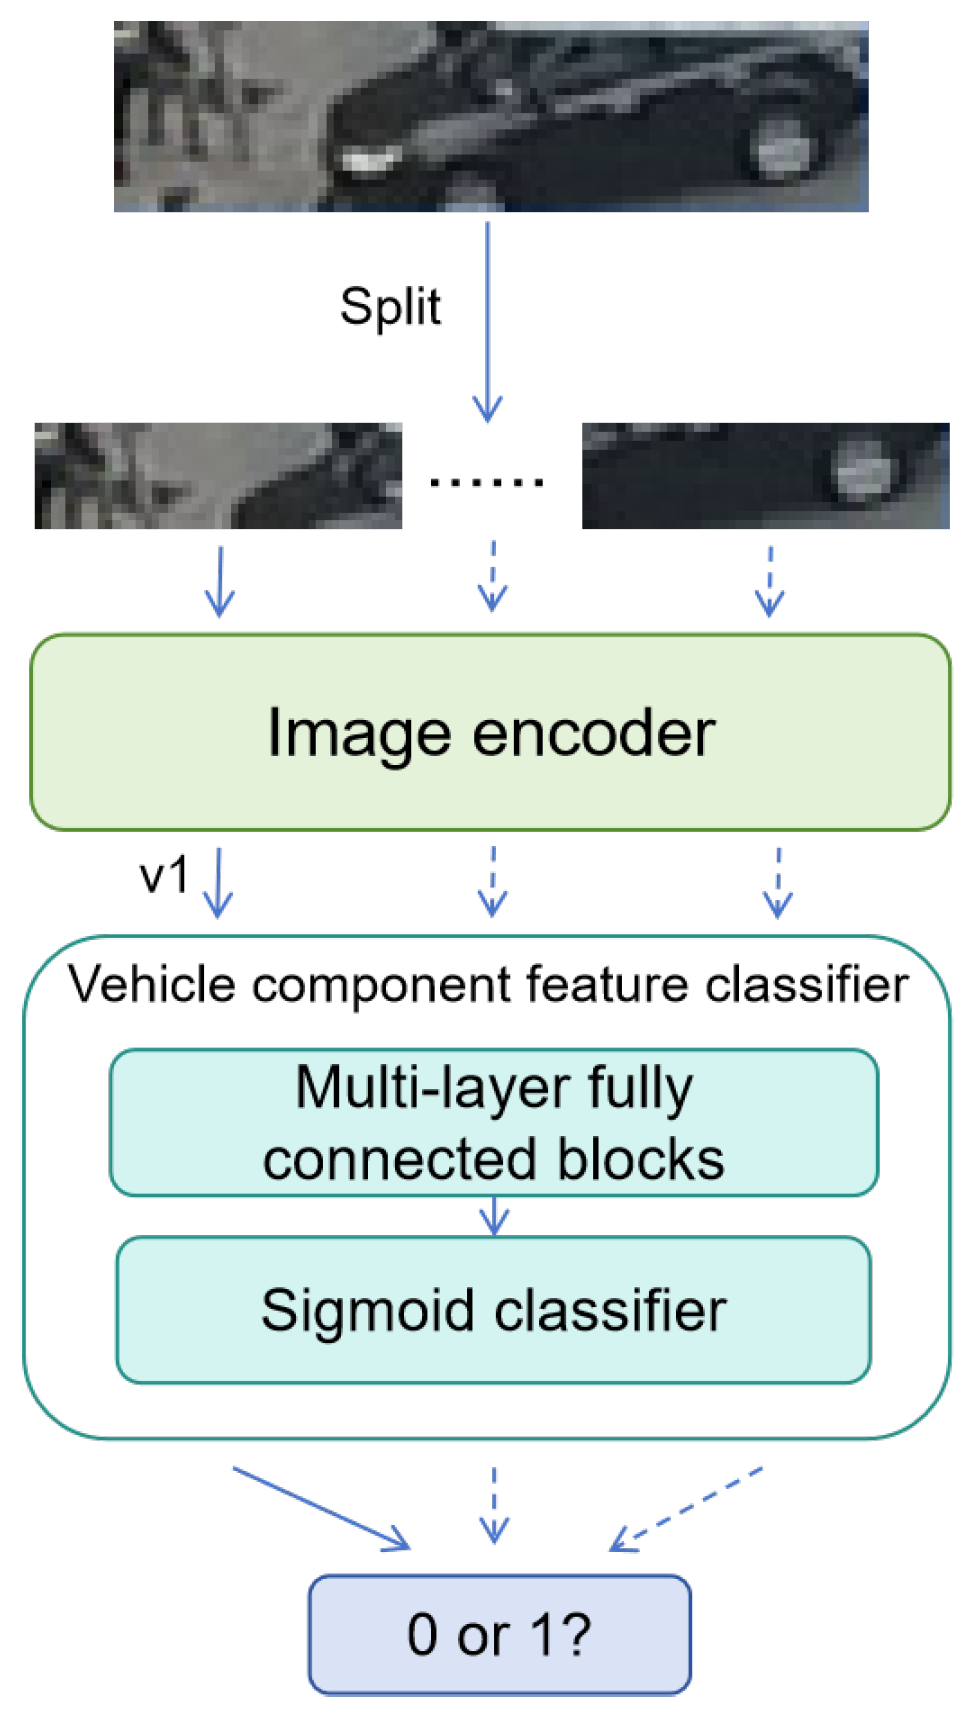
To avoid requiring the detection network to directly handle the complex problem of occlusion, we proposes a Vehicle Parts Perception module (VPP module) to perceive vehicle part features based on local semantic characteristics. This method divides the suspicious region image blocks—deemed to pass by the region consistency measurement module—into several smaller patches, then extracts semantic features from each patch and classifies them according to vehicle part characteristics. Considering that specific vehicle parts (e.g., windows, wheels) are often too small under the UAV’s perspective, making annotation and detection challenging, the method does not classify specific part types, but instead categorizes whether a region contains vehicle parts. By analyzing local information, this approach confirms the presence of a object without relying on a complete, holistic view of the entire object.
The framework of the VPP module is illustrated in Figure 6. First, multiple image patches are extracted from each potential object region to cover different locations. This approach ensures that even if parts of the object are occluded, characteristic features indicating its presence can still be captured. Next, the image encoder of CLIP is used to extract feature vectors from each image patch. These feature vectors contain rich semantic information, which benefits the subsequent classification task. Finally, the feature vectors are fed into a vehicle part feature classifier for classification.
The classifier consists of a two-layer fully connected block, with the specific structure as follows: the input layer receives a 512-dimensional feature vector, consistent with the dimensionality of the image features extracted by CLIP. The two hidden layers contain 512 and 32 neurons, respectively, enhancing the model’s expressive capacity. The output layer produces two classes, corresponding to the positive sample (vehicle part present) and negative sample (no vehicle part present). Cross-entropy loss is used as the classification loss for label prediction, as shown in (4); y ^ is the output of the classifier and y is the label. Considering the occlusion issue, if at least one image patch within a region is classified as a positive sample, the region is deemed to contain a object.
We simplifies the complex occlusion problem by transforming it into a vehicle part classification task on image patches. This approach not only reduces the time cost associated with fine-grained annotation, but also enhances the robustness and accuracy of the system. Meanwhile, the integration of multi-view information helps to narrow down the potential object regions, providing an effective prerequisite for the classifier, and can overcome the challenges posed by occlusion to a certain extent and improves the overall performance of object detection.
L o s s = y log ( y ^ ) + ( 1 y ) log ( 1 y ^ )

3. Experiments

3.1. Datasets

MDMT Dataset: MDMT dataset provides time-aligned dual UAV view images containing 88 video sequences of 11,454 objects with different IDs in different scenarios and different weather [8]. Each object contains not only bounding boxes and ID annotations, but also occlusion annotations. Since the original dataset only provided tracking task labels, we converted them to detection labels while keeping the occlusion and ID annotations. Our method only focuses on vehicles. Due to the small number of vehicle objects in sequence 59, we exclude it.
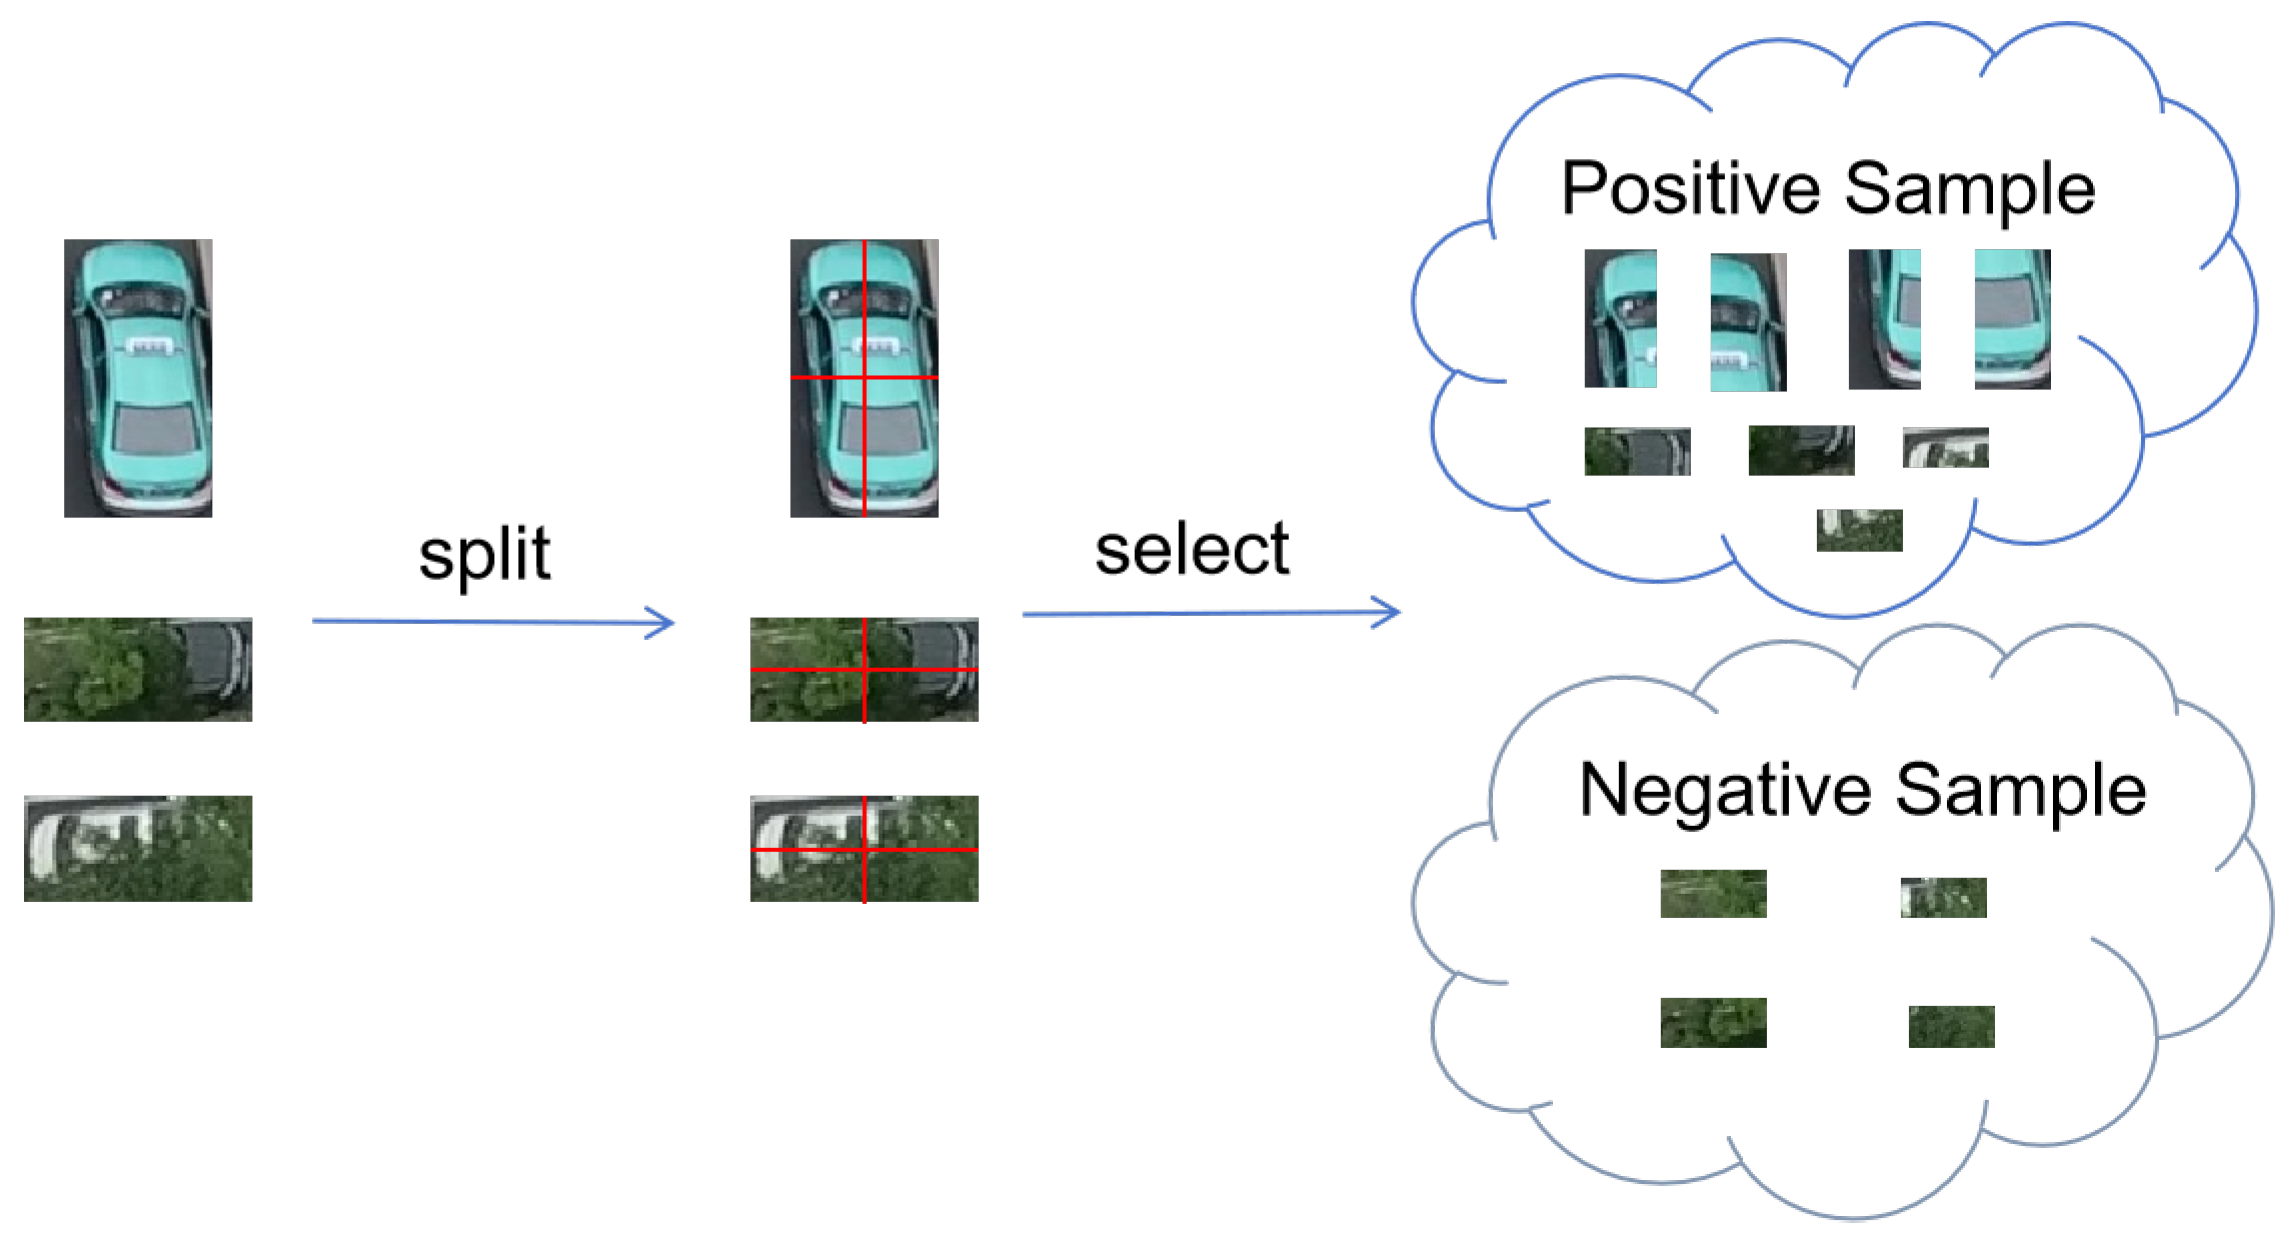
Vehicle Parts Dataset: Existing datasets are labeled for complete vehicles, so we constructed a vehicle parts dataset based on the training set of the MDMT dataset and only processed vehicle objects [23,24]. The vehicle objects are cropped according to their labels. Then, they are segmented according to the four quadrants. All the image blocks are saved. The reason for this cropping is that in the top view perspective, the distinctive features of vehicles are mainly concentrated on the four corners. Due to occlusion, there are background blocks in the obtained blocks. Therefore, it is necessary to manually screen the blocks. Figure 7 shows a screening example. After screening, the dataset was composed of 10,569 positive samples and 4012 negative samples.

3.2. Evaluation Metrics

In order to comprehensively evaluate the performance of the proposed method, we adopts different evaluation metrics for the matching task and the detection task.
For the matching method, A c c u r a c y and D i s t a n c e are used as evaluation metrics. A c c u r a c y is calculated as shown in (5), where n a l l denotes the total number of proposed matched objects, and n r i g h t denotes the number of correctly matched objects. D i s t a n c e is the average of the distances between the center coordinates of the matched object pairs proposed by the matching method.
A c c u r a c y = n r i g h t n a l l
The Euclidean distance d i j for a single projection between UAV-i and UAV-j is calculated as:
d i j = ( x ^ i j x j ) 2 + ( y ^ i j y j ) 2
The symbol p i = ( x i , y i ) denotes the pixel coordinate of a target detected by UAV i in its own image coordinate system. The projection coordinate p ^ i j = ( x ^ i j , y ^ i j ) represents the corresponding coordinate point obtained by projecting p i into the viewpoint of UAV j through geometric transformation. The Euclidean distance d i j is calculated as the Euclidean distance between the projection coordinate p ^ i j and the target coordinate p j detected and reported by UAV j. This distance visually reflects the pixel deviation caused by the information provided by UAV i after projection transformation in the viewpoint of UAV j. The overall metric Distance is then defined as the average of all such valid pairwise projection distances:
Distance = 1 N i = 1 M j i d i j
The system scale parameters are defined as follows: M represents the total number of UAVs participating in collaborative perception, and N denotes the total number of effective projection-matching pairs formed between all UAVs in the system. This value is used to calculate the average distance.
For the detection method, we use r e c a l l (R), p r e c i s i o n (P) and F 1   s c o r e ( F 1 ) as the main evaluation metrics. And in order to reflect the detection effect on occluded objects, r e c a l l o c ( R o c ) is computed for occluded object detection. For each sequence, the r e c a l l , p r e c i s i o n and F 1   s c o r e are calculated, with the average of these results as the final results (Supplementary S2).
F 1 = 2 × Recall × Precision Recall + Precision

3.3. Implementation Details

We implemented our method using Pytorch==2.1.1 and ran it on the workstation using 1 NVIDIA RTX 3090Ti GPU (NVIDIA, Santa Clara, CA, USA) with CUDA version 11.4. The YOLOv8n model was chosen for the detection model. We trained it on VisDrone dataset with epochs of 100 and other parameters by default [23]. The detector confidence threshold was 0.5. In the CD Fusion, conf1 was set to 0.5 and conf2 was set to 0.1. The classifier in VPP Module was trained on the vehicle parts dataset. The dataset was randomly divided into training and test sets in the ratio of 8:2, and then involved using CLIP with clip-vit-base-patch32 weight to extract image features. The obtained 512-dimensional feature vectors were used for the training classifier with epochs of 100 and a learning rate of 0.01.

3.4. Performance Comparisons

The Multi-UAV Cooperative Detection Network (MCD-Net) proposed in this paper primarily consists of two core modules: the secondary matching method and the hybrid fusion method. To comprehensively evaluate the performance of these two modules, systematic evaluations were conducted on the MDMT dataset.

3.4.1. Performance Comparison of Different Matching Methods

To verify the effectiveness of the proposed secondary matching method in multi-UAV collaborative detection tasks, a systematic comparative experiment was conducted on the MDMT dataset against a LightGlue-based matching method. The evaluation was carried out from two dimensions: matching accuracy and object detection performance.
In terms of matching performance, the comparison results in Table 1 show that the proposed secondary matching method achieves a slightly higher object matching accuracy than the LightGlue-based method, while reducing the average distance between the centers of matched objects by nearly 4 pixels. This result verifies that the secondary matching method, which combines background features and object information, improves viewpoint registration accuracy to some extent.
In terms of object detection performance, Table 2 shows that for the detection of all objects, the secondary matching method combining background features and object information achieves higher r e c a l l , p r e c i s i o n , and F 1   s c o r e on the UAV1 viewpoint compared to the LightGlue-based matching method. On the UAV2 viewpoint, although the r e c a l l is slightly lower than that of the LightGlue-based method, it still achieves better results in p r e c i s i o n and F 1   s c o r e .
In addition, Table 3 presents the performance of different matching methods in recognizing occluded objects. For the detection of occluded objects, the secondary matching method demonstrates higher recall rates on both the UAV1 and UAV2 viewpoints.

3.4.2. Performance Comparison Results of Different Fusion Methods

To verify the effectiveness of the proposed Multi-UAV Cooperative Detection Network (MCD-Net), systematic comparative experiments were designed. The MCD-Net is compared with single-UAV detection (with a confidence threshold of 0.5) and a Decision-level Fusion Network (DF-Net) that only uses Confidence-Based Decision Fusion. In the MCD-Net and DF-Net, the single-UAV detection threshold is set to 0.5, while the multi-UAV detection threshold is set to 0.1. To further validate the complementary roles of multi-view information and low-confidence information, an additional comparative experiment group is set up where both the single-UAV and multi-UAV detection thresholds are set to 0.5.
As shown in Table 4, the single-UAV detection method achieves the highest p r e c i s i o n , but its r e c a l l performance is suboptimal, with an average r e c a l l of only 65.09% across the two viewpoints. When information from additional viewpoints is incorporated as a supplement, the r e c a l l of the DF-Net (threshold 0.5) improves significantly, increasing by 3.13% and 4.64% for UAV1 and UAV2 viewpoints, respectively. However, due to the influence of projection misalignment and false detections from individual machines, the p r e c i s i o n drops noticeably. When low-confidence information is further integrated, the DF-Net achieves the best r e c a l l , with an average r e c a l l of 71.69% across the two viewpoints, representing a 6.6% improvement over single-UAV detection. This result demonstrates the effectiveness of the Confidence-Based Decision Fusion approach in improving object recall. However, it also introduces more false detections, resulting in the lowest p r e c i s i o n .
In contrast, the MCD-Net achieves a better balance in detection performance through the hybrid fusion strategy. Although its r e c a l l is slightly lower than that of the DF-Net, it shows a significant improvement over single-UAV detection. Meanwhile, its p r e c i s i o n is improved by 18.11% and 9.12% on the UAV1 and UAV2 viewpoints, respectively, compared to the DF-Net. Most importantly, the MCD-Net achieves the highest F 1   s c o r e s on both viewpoints, reaching 82.78% and 71.95% on UAV1 and UAV2, respectively. This indicates the advantages of the hybrid fusion strategy in mitigating projection misalignment and enhancing system robustness.
In addition, as shown in Table 5, the MCD-Net improves the detection performance for occluded objects, achieving an average r e c a l l of 47.06% for occluded objects, which is 9.88% higher than the single-UAV result. This further demonstrates the effectiveness of utilizing multi-view information and low-confidence information as a valuable supplement for recognizing occluded objects.

3.4.3. Visualization of Detection Results from Different Methods

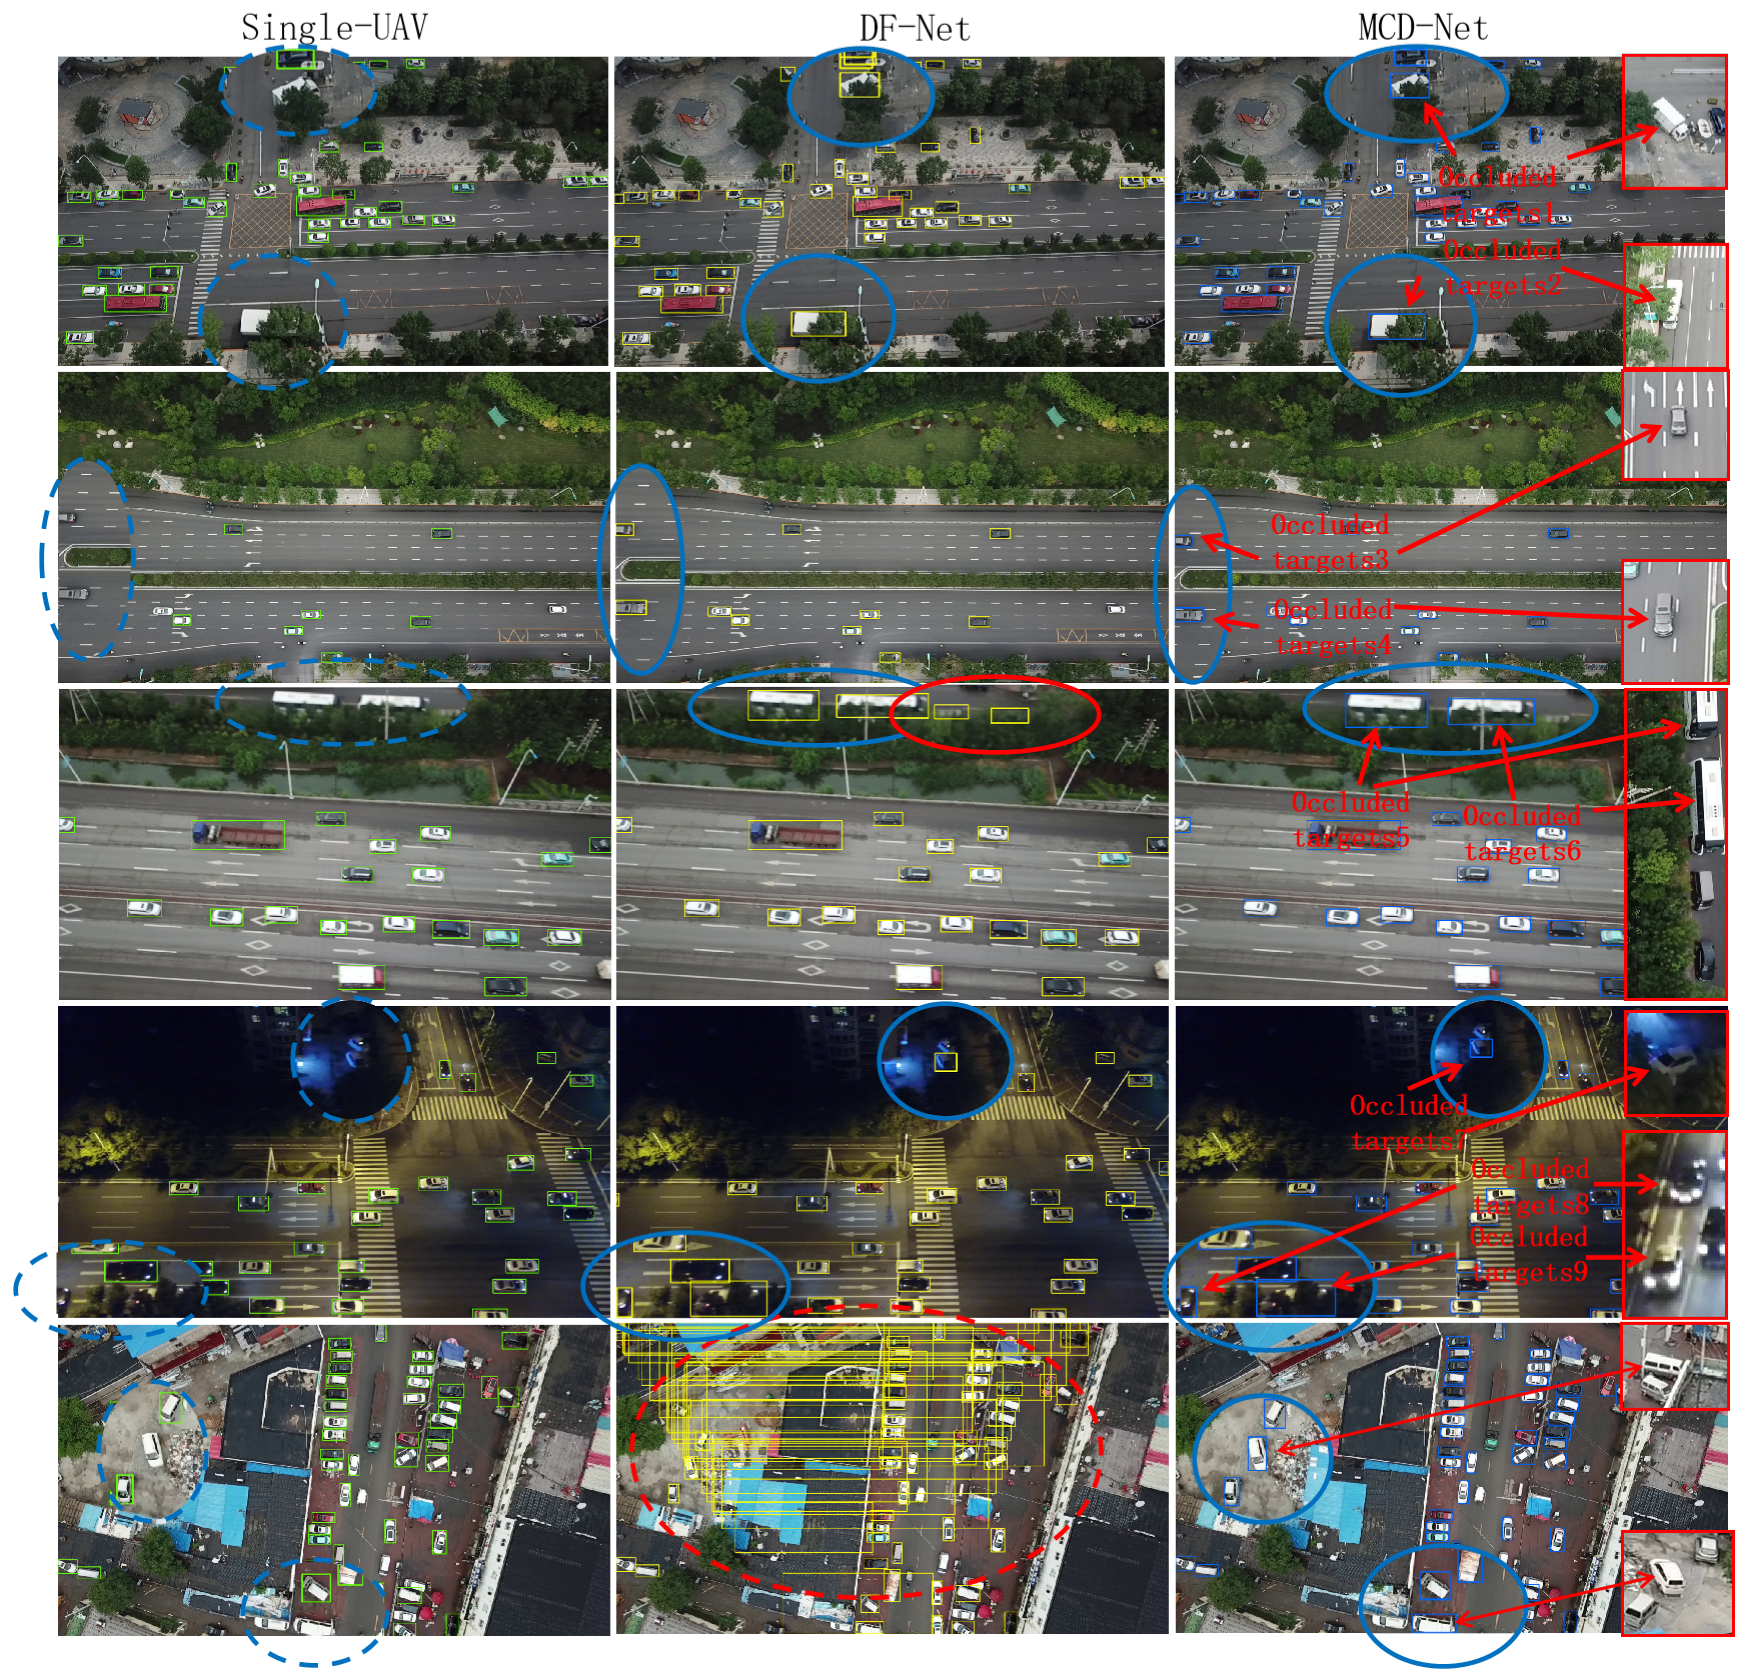
The visualization of results from different methods is shown in Figure 8, where positions marked with blue dashed circles indicate objects missed by single-UAV detection, and those marked with blue solid circles represent detection results after multi-UAV fusion. The small images on the far right show the view of the same object from another drone’s perspective. Overall, all three methods exhibit a certain degree of missed detections in practical applications. However, compared to single-UAV detection, the multi-UAV fusion strategies (including the DF-Net and the MCD-Net method) significantly alleviate the issue of missed detections. When a object is occluded, as long as another drone can effectively observe it, cross-view information supplementation makes it possible to successfully detect the object. Even in challenging scenarios such as blurry conditions (shown in the third row) and nighttime scenes (shown in the fourth row), some occluded objects that were missed by single-machine detection can still be successfully identified.
It is worth noting that in the image in the second column of the third row, the location marked by the red solid circle indicates that the drone from another viewpoint suggests the presence of a object. The DF-Net retains these hints from other viewpoints. However, since these objects are fully occluded in the local viewpoint, the MCD-Net identifies such information as unreliable and filters it out. This indicates that when multi-view projections are relatively accurate, using DF-Net allows for the possibility of detecting regions where objects may exist, even if they are completely occluded in the local view, by leveraging supplementary information from other viewpoints. In such cases, DF-Net may achieve better results than MCD-Net.
However, when facing projection misalignment issues, the performance of the two methods shows significant differences. For example, in the image in the second column of the fifth row, the area marked by the red dashed circle indicates an incorrectly matched region caused by projection errors. In this case, the DF-Net introduces a large number of false detections, whereas the MCD-Net effectively suppresses these erroneous inputs through consistency verification, significantly reducing the negative impact caused by projection misalignment. This indicates that in complex environments with high geometric uncertainty or non-ideal matching conditions, the MCD-Net demonstrates stronger advantages in enhancing system stability and reducing false detections.

3.5. Ablation Study

In this section, an ablation study is conducted on the hybrid fusion method within the MCD-Net, with particular focus on the effectiveness of the Region Consistency Measurement module (RCM) and the Vehicle Parts Perception module (VPP) in resisting projection misalignment. Given that fusion strategy is an essential component in the multi-UAV collaborative detection process, the Confidence-Based Decision Fusion is adopted as the baseline for comparative analysis. The experimental results are shown in Table 6.
As shown in the table, the baseline network using only the Confidence-Based Decision Fusion method achieves relatively low p r e c i s i o n . Through modular analysis, it is found that introducing either the RCM module or the VPP module alone leads to a significant improvement in p r e c i s i o n , with average p r e c i s i o n increasing by 9.04% and 7.26%, respectively, compared to the baseline, confirming the effectiveness of both modules in eliminating false detections. Notably, the network with the VPP module achieves the highest p r e c i s i o n of 89.36% on the UAV1 viewpoint, an improvement of 18.15% over the baseline, fully validating the design advantages of the VPP module.
Furthermore, the hybrid fusion method that integrates both the RCM and VPP modules demonstrates superior overall performance: precision reaches 89.32% and 87.18% on the UAV1 and UAV2 viewpoints, respectively, representing an average improvement of 13.0% compared to the baseline network. This improvement is primarily attributed to three aspects: the RCM module effectively corrects cross-view projection errors; the VPP module enhances the discriminative capability of local features; and the synergistic operation of both modules produces a positive combined effect. The experimental results fully demonstrate the significant effectiveness of the proposed fusion strategy in improving the accuracy of UAV collaborative detection.

3.6. Detailed Analysis

Comparison of different object association methods In order to evaluate the performance of different association methods, we compared the performance of K-nearest neighbor (KNN) method and Hungarian association method on the same distance matrix which was calculated from the detection results and the projection transformation matrix. The results are presented in Table 7. “Total Associations” refers to the total number of object matches proposed by association methods, and “Correct Associations” are the number of correctly matched objects.
As can be seen from the Table 7, although the Hungarian method generates a larger number of associated pairs, both the number of correct associations and the association success rate are lower than those of the KNN method. This difference mainly arises from the fundamental characteristics of the two algorithms: the Hungarian method attempts to achieve a globally optimal solution, making it more susceptible to interference from objects without true associations in practical applications. In contrast, the KNN algorithm, which adopts a locally optimal strategy, demonstrates greater practicality and robustness. Even in the presence of false detections, it achieves an association success rate of 85%. Given the significant advantage in association success rate (a 6% improvement) and considerations of system reliability, this study ultimately adopts the KNN algorithm as the object association method. This choice effectively enhances the overall performance of the multi-UAV collaborative detection system. Experimental results show that in real-world application scenarios with incomplete association relationships (such as missed detections or false alarms), association methods based on a local optimal strategy may have advantages over traditional globally optimal approaches.
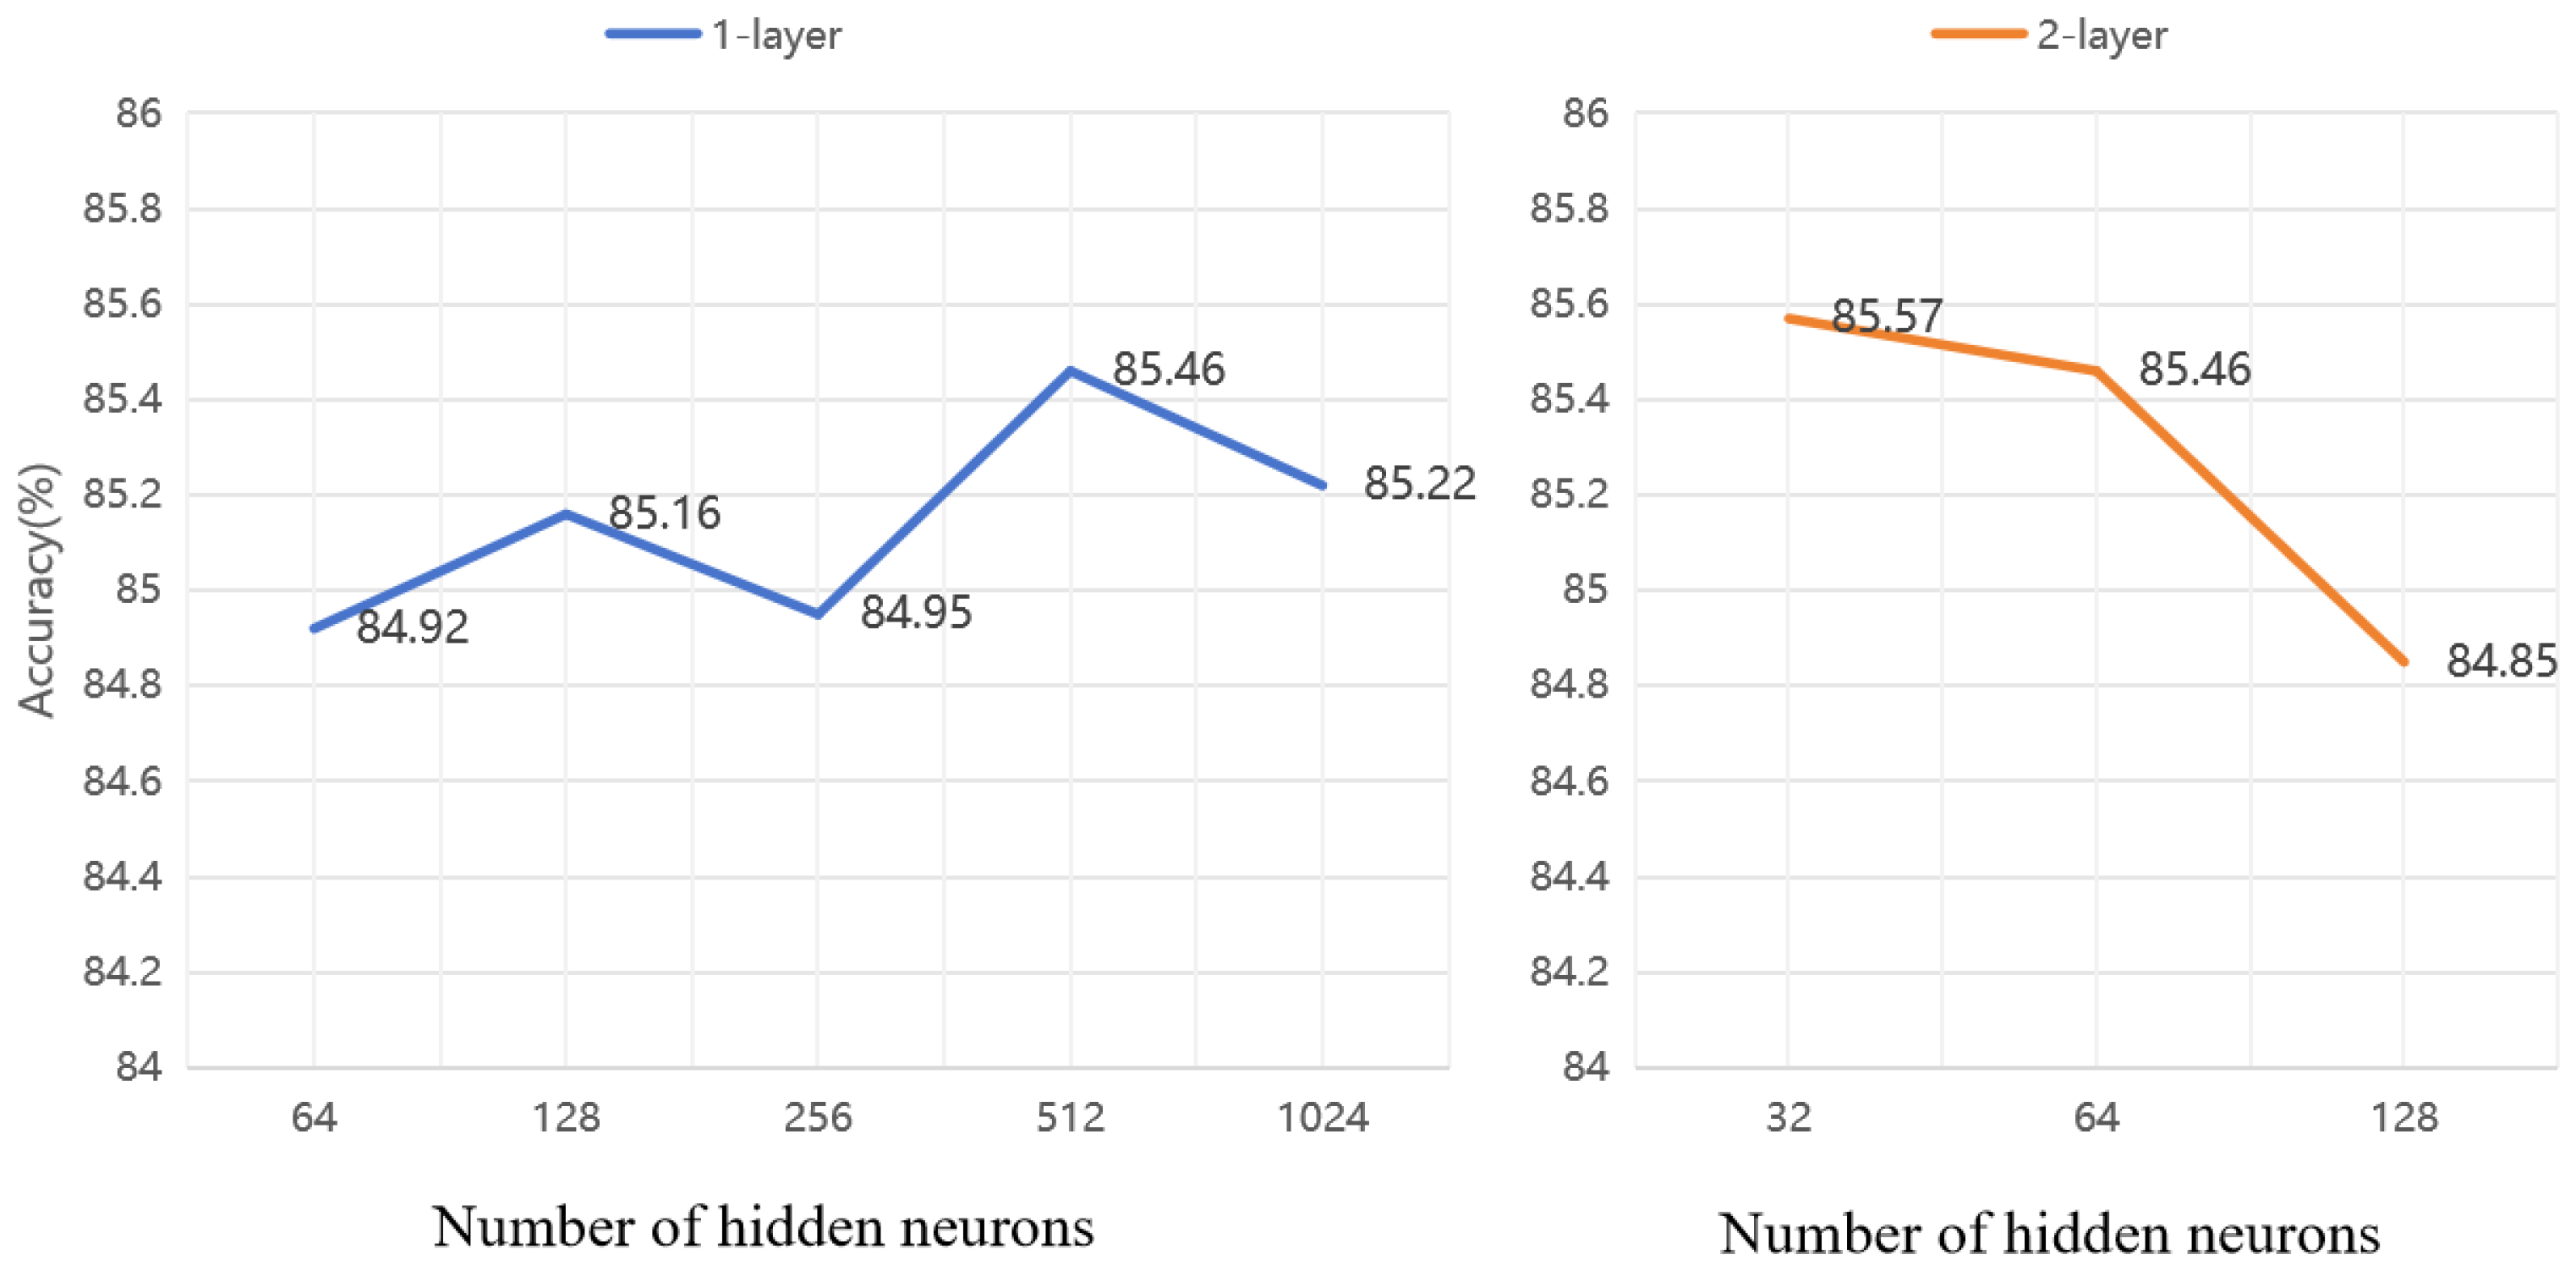
The structure of the image feature classifier in the VPP module. The structure of the vehicle part feature classifier plays a crucial role in the VPP module. Based on a self-constructed vehicle part dataset, the impact of network depth and width on classification performance was investigated, with results shown in Figure 9. The left side shows the classification accuracy as a function of the number of neurons (K1) in a single hidden layer. It can be seen from the figure that when K1 = 512, the classifier achieves optimal performance, with an accuracy of 85.46%. With K1 fixed at 512, the influence of the number of neurons in a second hidden layer (K2) on classification performance was studied. As shown on the right, the best classification performance, with an accuracy of 85.57%, is achieved when K1 = 512 and K2 = 32. When the network width is further expanded, the classification performance decreases. This indicates that moderate expansion of network depth or width can enhance feature representation capability, but excessive network parameters may lead to performance degradation.
Different splitting ways in the VPP module. The vehicle part feature classifier within the VPP module is trained using standard vehicle quadrants (four-quadrant division) as samples. However, during actual inference, projection transformation errors may cause misalignment of regions and introduce background interference. Therefore, the impact of different image-partitioning methods—10 × 10 sliding window, 20 × 20 sliding window, and four-quadrant division—on performance is compared. As shown in Table 8, the network using the four-quadrant division method achieves the highest precision during inference, reaching 88.25%. Based on this result, the proposed algorithm adopts the four-quadrant division strategy during inference.

4. Conclusions and Future Work

In this paper, we identified that the prevalent detection-matching-fusion paradigm in multi-UAV systems is highly susceptible to projection errors, which degrades detection robustness. To address this, we proposed the Multi-UAV Collaborative Detection Network (MCD-Net), a novel framework featuring a secondary matching method to refine projection accuracy and a hybrid fusion strategy to mitigate the impact of misalignments. Our experiments confirm that MCD-Net significantly improves recall and F1-scores for both general and occluded objects compared to single-UAV methods. While these results validate the algorithmic robustness of our approach, transitioning this framework to practical, real-world applications requires addressing broader system-level challenges.
Therefore, our future work will extend beyond algorithmic improvements to emphasize system-level efficiency and resilience. We plan to investigate and develop strategies for asynchronous data fusion and bandwidth-efficient communication protocols to mitigate the effects of latency and network constraints commonly encountered in real-world multi-UAV operations. In parallel, we will pursue the design of more lightweight and decentralized network architectures. This integrated approach aims to distribute computational loads more effectively, reduce individual node burdens, and thereby significantly improve the system’s scalability, resilience, and fault tolerance. These efforts are essential toward enabling robust and practical deployment of UAV swarms in highly dynamic and unstructured environments.

Supplementary Materials

The following supporting information can be downloaded at: https://www.mdpi.com/article/10.3390/drones9110739/s1, Table S1. The limitations of the existing matching strategies. S2. Evaluation Index, Table S2. Symbol definition. S3. Multi-view Projective Geometry Principles, Figure S1. Schematic Illustration of Aerial Views from Different Perspectives.

Author Contributions

Conceptualization, H.Z. (Huijie Zhou); Validation, H.Z. (Huijie Zhou); Formal analysis, Z.Y.; Data curation, A.M.; Writing review and editing, H.Z. (Hong Zhang) and Z.Y.; software, W.Z.; Visualization, H.Z. (Huijie Zhou); Supervision, Y.N.; Resources, Y.N.; Project administration, Y.N.; Funding acquisition, A.M. and Y.N. All authors have read and agreed to the published version of the manuscript.

Funding

This work was supported by National Natural Science Foundation of China (No. 62576349 and No. 61876187) and Postgraduate Scientifc Research Innovation Project of Hunan Province under Grant 4345191G15.

Data Availability Statement

Data related to the current study are available from the corresponding author upon reasonable request. The codes used during the study are available from the corresponding author upon request.

Conflicts of Interest

The authors declare no conflicts of interest.

References

  1. Chen, Y.; Ye, Z.; Sun, H.; Gong, T.; Xiong, S.; Lu, X. Global-Local Fusion with Semantic Information-Guidance For Accurate Small Object Detection in UAV Aerial Images. IEEE Trans. Geosci. Remote Sens. 2025, 63, 4701115. [Google Scholar] [CrossRef]
  2. Wang, H.; Wang, C.; Fu, Q.; Zhang, D.; Kou, R.; Yu, Y.; Song, J. Cross-modal oriented object detection of UAV aerial images based on image feature. IEEE Trans. Geosci. Remote Sens. 2024, 62, 5403021. [Google Scholar] [CrossRef]
  3. Zhou, L.; Zhao, S.; Wan, Z.; Liu, Y.; Wang, Y.; Zuo, X. MFEFNet: A multi-scale feature information extraction and fusion network for multi-scale object detection in UAV aerial images. Drones 2024, 8, 186. [Google Scholar] [CrossRef]
  4. Huang, S.; Ren, S.; Wu, W.; Liu, Q. Discriminative features enhancement for low-altitude UAV object detection. Pattern Recognit. 2024, 147, 110041. [Google Scholar] [CrossRef]
  5. Zhang, Y.; Wu, C.; Guo, W.; Zhang, T.; Li, W. CFANet: Efficient detection of UAV image based on cross-layer feature aggregation. IEEE Trans. Geosci. Remote Sens. 2023, 61, 5608911. [Google Scholar] [CrossRef]
  6. Li, X.; Wu, L.; Niu, Y.; Ma, A. Multi-target association for uavs based on triangular topological sequence. Drones 2022, 6, 119. [Google Scholar] [CrossRef]
  7. Pan, T.; Dong, H.; Deng, B.; Gui, J.; Zhao, B. Robust Cross-Drone Multi-Target Association Using 3D Spatial Consistency. IEEE Signal Process. Lett. 2023, 31, 71–75. [Google Scholar] [CrossRef]
  8. Liu, Z.; Shang, Y.; Li, T.; Chen, G.; Wang, Y.; Hu, Q.; Zhu, P. Robust multi-drone multi-target tracking to resolve target occlusion: A benchmark. IEEE Trans. Multimed. 2023, 25, 1462–1476. [Google Scholar] [CrossRef]
  9. Ji, D.; Gao, S.; Zhu, L.; Zhu, Q.; Zhao, Y.; Xu, P.; Lu, H.; Zhao, F.; Ye, J. View-centric multi-object tracking with homographic matching in moving uav. arXiv 2024, arXiv:2403.10830. [Google Scholar]
  10. Qiao, Y.; Fan, H.; Wang, Q.; Zhao, T.; Tang, Y. STCA: High-Altitude Tracking via Single-Drone Tracking and Cross-Drone Association. Remote Sens. 2024, 16, 3861. [Google Scholar] [CrossRef]
  11. Sarlin, P.E.; DeTone, D.; Malisiewicz, T.; Rabinovich, A. Superglue: Learning feature matching with graph neural networks. In Proceedings of the IEEE/CVF Conference on Computer Vision and Pattern Recognition, Seattle, WA, USA, 13–19 June 2020; pp. 4938–4947. [Google Scholar]
  12. Lindenberger, P.; Sarlin, P.E.; Pollefeys, M. Lightglue: Local feature matching at light speed. In Proceedings of the IEEE/CVF International Conference on Computer Vision, Paris, France, 1–6 October 2023; pp. 17627–17638. [Google Scholar]
  13. Lecun, Y.; Bottou, L.; Bengio, Y.; Haffner, P. Gradient-based learning applied to document recognition. Proc. IEEE 1998, 86, 2278–2324. [Google Scholar] [CrossRef]
  14. Low, D.G. Distinctive image features from scale-invariant keypoints. J. Comput. Vis. 2004, 60, 91–110. [Google Scholar] [CrossRef]
  15. Hou, Y.; Zheng, L.; Gould, S. Multiview detection with feature perspective transformation. In Proceedings of the Computer Vision–ECCV 2020: 16th European Conference, Glasgow, UK, 23–28 August 2020; Proceedings, Part VII 16. Springer: Berlin/Heidelberg, Germany, 2020; pp. 1–18. [Google Scholar]
  16. Wang, Z.; Cheng, P.; Chen, M.; Tian, P.; Wang, Z.; Li, X.; Yang, X.; Sun, X. Drones help drones: A collaborative framework for multi-drone object trajectory prediction and beyond. arXiv 2024, arXiv:2405.14674. [Google Scholar] [CrossRef]
  17. Zhou, H.; Ma, A.; Liu, Y.; Niu, Y. Multi-view Detection Method for UAVs Based on Probabilistic Fusion. In Proceedings of the International Conference on Autonomous Unmanned Systems, Nanjing, China, 9–11 September 2023; Springer: Berlin/Heidelberg, Germany, 2023; pp. 422–432. [Google Scholar]
  18. Fischler, M.A.; Bolles, R.C. Random sample consensus: A paradigm for model fitting with applications to image analysis and automated cartography. Commun. ACM 1981, 24, 381–395. [Google Scholar] [CrossRef]
  19. Cover, T.; Hart, P. Nearest neighbor pattern classification. IEEE Trans. Inf. Theory 1967, 13, 21–27. [Google Scholar] [CrossRef]
  20. Zhang, Y.; Sun, P.; Jiang, Y.; Yu, D.; Weng, F.; Yuan, Z.; Luo, P.; Liu, W.; Wang, X. Bytetrack: Multi-object tracking by associating every detection box. In Proceedings of the European Conference on Computer Vision, Tel Aviv, Israel, 23–27 October 2022; Springer: Berlin/Heidelberg, Germany, 2022; pp. 1–21. [Google Scholar]
  21. Radford, A.; Wook, J.; Aditya, H.; Gabriel, R.; Sandhini, G.; Sastry, G.; Askell, A.; Mishkin, P.; Clark, J.; Krueger, G.; et al. CLIP: Learning Transferable Visual Models from Natural Language Supervision. arXiv 2019, arXiv:2103.00020. [Google Scholar]
  22. Li, X.; Diao, W.; Mao, Y.; Gao, P.; Mao, X.; Li, X.; Sun, X. OGMN: Occlusion-guided multi-task network for object detection in UAV images. Isprs J. Photogramm. Remote Sens. 2023, 199, 242–257. [Google Scholar] [CrossRef]
  23. Cao, Y.; He, Z.; Wang, L.; Wang, W.; Yuan, Y.; Zhang, D.; Zhang, J.; Zhu, P.; Van Gool, L.; Han, J.; et al. VisDrone-DET2021: The vision meets drone object detection challenge results. In Proceedings of the IEEE/CVF International Conference on Computer Vision, Virtual, 11–17 October 2021; pp. 2847–2854. [Google Scholar]
  24. Du, D.; Qi, Y.; Yu, H.; Yang, Y.; Duan, K.; Li, G.; Zhang, W.; Huang, Q.; Tian, Q. The unmanned aerial vehicle benchmark: Object detection and tracking. In Proceedings of the European conference on Computer Vision (ECCV), Munich, Germany, 8–14 September 2018; pp. 370–386. [Google Scholar]
Figure 1. Misalignment occurs after projection transformation. Red dashed boxes indicate the locations of misalignment.
Drones 09 00739 g001
Figure 2. The architecture of MCD-Net.
Drones 09 00739 g002
Figure 3. Example of matching points used in secondary matching.
Drones 09 00739 g003
Figure 4. Trend of recall and precision varying with confidence threshold.
Drones 09 00739 g004
Figure 5. One of the occluded vehicle image in the annotations is divided into blocks; the left two blocks are the background, but the right two are the complete vehicle parts.
Drones 09 00739 g005
Figure 6. The structure of the VPP module.
Drones 09 00739 g006
Figure 7. Example of screening vehicle part samples.
Drones 09 00739 g007
Figure 8. Visualization results of different methods. The positions marked by blue dashed circles indicate missed detections by the single-UAV approach, while the blue solid circles highlight the detections successfully recovered through multi-UAV fusion. The red dashed circles denote false detections caused by projection bias or other limitations.
Drones 09 00739 g008
Figure 9. Classification results of classifiers with different network.
Drones 09 00739 g009
Table 1. Performance comparison results of different matching methods.
n all n right Accuracy  (%) Distance ( Pixels )
LightGlue186,537158,91285.1913.68
Secondary Matching185,777158,47585.309.76
Table 2. Performance comparison results of different matching methods for the detection of all objects.
UAV1UAV2
R  (%) P  (%) F 1  (%) R  (%) P  (%) F 1  (%)
LightGlue79.3689.2182.6863.2586.9271.93
Secondary Matching79.5089.3282.7863.2187.1871.95
Table 3. Performance comparison results of different matching methods for occluded object detection.
UAV1- R oc (%)UAV2- R oc (%)Average- R oc (%)
LightGlue54.4939.2146.85
Secondary Matching54.8839.2547.06
Table 4. Performance comparison results of different detection methods for all objects. A threshold of 0.5 represents the confidence threshold for multi-UAV detection.
UAV1UAV2
R  (%) P  (%) F 1  (%) R  (%) P  (%) F 1  (%)
Single-UAV73.8994.7981.5356.2994.0268.68
DF-Net (threshold 0.5)77.0271.9372.0560.9378.3766.94
DF-Net79.8171.2172.8663.5878.0668.37
MCD-Net (threshold 0.5)76.4890.9881.7860.1687.9870.28
MCD-Net79.5089.3282.7863.2187.1871.95
Table 5. Performance comparison results of different detection methods for occluded objects. A threshold of 0.5 represents the confidence threshold for multi-UAV detection.
UAV1- R oc (%)UAV2- R oc (%)Average- R oc (%)
Single-UAV43.8030.5737.18
DF-Net (threshold 0.5)49.5236.5343.02
DF-Net55.8339.9947.91
MCD-Net (threshold 0.5)48.0235.0741.54
MCD-Net54.8839.2547.06
Table 6. Ablation study results of the core modules.
BaselineRCMVPPUAV1-P (%)UAV2-P (%)Average-P (%)
--71.2178.0678.13
-88.2486.1187.17
-89.3681.4285.39
89.3287.1888.25
Table 7. Comparison results of different object association methods.
MethodTotal AssociationsCorrect AssociationsMatching Accuracy
Hungarian18,53714,61579%
KNN18,57727,30289%
Table 8. Performance comparison results of different splitting methods.
MethodPrecision (%)
10 × 10 sliding window split88.18
20 × 20 sliding window split87.97
Four-quadrant segmentation88.25
Disclaimer/Publisher’s Note: The statements, opinions and data contained in all publications are solely those of the individual author(s) and contributor(s) and not of MDPI and/or the editor(s). MDPI and/or the editor(s) disclaim responsibility for any injury to people or property resulting from any ideas, methods, instructions or products referred to in the content.