Article

Natural Disaster Information System (NDIS) for RPAS Mission Planning

Department of Geological Sciences and Geological Engineering, Queen’s University, Kingston, ON K7L 3N6, Canada
*
Author to whom correspondence should be addressed.
Drones 2025, 9(11), 734; https://doi.org/10.3390/drones9110734
Submission received: 15 August 2025 / Revised: 10 October 2025 / Accepted: 17 October 2025 / Published: 23 October 2025

Highlights

What are the main findings?
  • A lightweight, modular information system was developed to support RPAS (drone) mission planning for geohazard contexts.
  • The framework integrates hazard type, hazard stage, and sensor–drone compatibility using a structured, rule-based approach.
What is the implication of the main finding?
  • NDIS enables rapid and informed decision-making and planning of drone missions for hazard monitoring and disaster response.
  • The system can be adapted across different disaster types and operational needs to support mitigation strategies globally.

Abstract

Today’s rapidly increasing number and performance of Remotely Piloted Aircraft Systems (RPASs) and sensors allows for an innovative approach in monitoring, mitigating, and responding to natural disasters and risks. At present, there are 100s of different RPAS platforms and smaller and more affordable payload sensors. As natural disasters pose ever increasing risks to society and the environment, it is imperative that these RPASs are utilized effectively. In order to exploit these advances, this study presents the development and validation of a Natural Disaster Information System (NDIS), a geospatial decision-support framework for RPAS-based natural hazard missions. The system integrates a global geohazard database with specifications of geophysical sensors and RPAS platforms to automate mission planning in a generalized form. NDIS v1.0 uses decision tree algorithms to select suitable sensors and platforms based on hazard type, distance to infrastructure, and survey feasibility. NDIS v2.0 introduces a Random Forest method and a Critical Path Method (CPM) to further optimize task sequencing and mission timing. The latest version, NDIS v3.8.3, implements a staggered decision workflow that sequentially maps hazard type and disaster stage to appropriate survey methods, sensor payloads, and compatible RPAS using rule-based and threshold-based filtering. RPAS selection considers payload capacity and range thresholds, adjusted dynamically by proximity, and ranks candidate platforms using hazard- and sensor-specific endurance criteria. The system is implemented using ArcGIS Pro 3.4.0, ArcGIS Experience Builder (2025 cloud release), and Azure Web App Services (Python 3.10 runtime). NDIS supports both batch processing and interactive real-time queries through a web-based user interface. Additional features include a statistical overview dashboard to help users interpret dataset distribution, and a crowdsourced input module that enables community-contributed hazard data via ArcGIS Survey123. NDIS is presented and validated in, for example, applications related to volcanic hazards in Indonesia. These capabilities make NDIS a scalable, adaptable, and operationally meaningful tool for multi-hazard monitoring and remote sensing mission planning.

1. Introduction

Remotely Piloted Aircraft Systems (RPASs) have become increasingly prevalent in environmental monitoring, emergency response, and hazard assessment [1]. Their mobility, high spatial resolution, and ability to operate in challenging terrain make them effective tools for surveying natural disasters [2]. In recent years, the growing diversity of RPAS platforms and lightweight geophysical and remote sensing sensors has expanded the potential for autonomous or semi-autonomous survey planning in both urban and remote environments [3].
Despite these technological advances, mission planning for RPAS-based hazard monitoring remains largely manual [4]. Operators must match geohazard characteristics to appropriate platforms/drones and sensors, often under tight time constraints and with limited contextual data. Furthermore, existing geospatial tools offer limited integration between hazard databases and drone-specific operational parameters such as payload capacity, communication range, and endurance [5]. As a result, RPAS missions are often constrained by trial-and-error workflows or reliance on expert judgment, which is not always available for such time-critical missions.
Previous studies have highlighted the use of uncrewed aerial systems in disaster mapping and emergency response [1,2,3]. However, few have attempted to unify hazard intelligence with platform-sensor compatibility in a structured decision framework. However, few have attempted to unify hazard intelligence with platform–sensor compatibility in a structured decision framework. While decision support systems (DSS) have been developed for natural hazard applications, including those used by national agencies such as the United States Geological Survey (USGS), their scope is typically limited to hazard assessment, mapping, or resource prioritization [6,7]. Broader reviews of hazard-focused DSS indicate a focus on flood forecasting, landslide susceptibility, and community resilience evaluation [7,8], rather than integrated mission planning or platform–sensor pairing. In practice, sensor and platform selection remains highly dependent on manual workflows or domain-specific expertise, with no standardized logic across hazard types or operational settings. This limitation is further compounded by the fragmented nature of geohazard data, which are maintained separately across different institutions: volcanic data by the Smithsonian Institution, earthquake records by the International Seismological Centre (ISC) and USGS, tsunami databases by NOAA’s National Centers for Environmental Information (NCEI), landslide inventories by NASA’s Global Landslide Catalog, and fault data by the GEM Foundation. These sources are rarely interoperable and are not directly linked to RPAS deployment requirements or survey logistics.
Examples of existing decision support systems include the Copernicus Emergency Management Service (EMS), which provides satellite-derived mapping products for flood, wildfire, and other hazards across Europe [9,10]; RiskScape, developed by GNS Science and NIWA, which supports multi-hazard loss modeling in New Zealand [11,12]; and InaSAFE, a scenario-based tool designed to assess the impact of hazard events on populations and infrastructure in Southeast Asia [13]. While these systems support situational awareness and impact estimation, they do not include operational decision logic for drone-based survey coordination. Similarly, earthquake response tools such as ShakeMap and PAGER from the USGS provide impact visualization and casualty estimation [14,15,16], but are not designed to support platform–sensor pairing or automated RPAS mission planning. To date, no operational system has combined hazard-specific databases with drone and sensor configuration logic in a unified, modular structure.
This study introduces the Natural Disaster Information System (NDIS), a modular decision-support framework for RPAS mission planning in geohazard contexts. NDIS integrates a spatial hazard database with a catalogue of RPAS platforms and sensor payloads, employing both rule-based logic and machine learning algorithms to identify suitable configurations. The system addresses essential mission parameters such as hazard type, distance from infrastructure for take-off and landing, and survey feasibility. By incorporating sequential decision logic, NDIS enables platform and sensor selection based on disaster stage, survey method, and operational constraints.
The system implements a five-stage, rule-based decision structure that guides users toward suitable platform-sensor combinations. The framework supports standardized mission planning and demonstrates how structured logic can be applied to real-world hazard response contexts. Therefore, NDIS closely aligns with the objectives of the United Nations Sustainable Development Goals [17], particularly Goal 11 (for Resilient Urbanization) and Goal 17 (Empower Technology for Disaster Risk Reduction).
This manuscript is structured into 5 sections. Section 2 describes the data used for the database and the method to process the information. Section 3 shows the implementation of NDIS with example applications. Section 4 presents a discussion of the NDIS and its functionality, and Section 5 provides conclusions.

2. Data and Methods

This section outlines the datasets, preprocessing techniques, and decision logic used to implement the NDIS for RPAS-based hazard mission planning. The system integrates geohazard data from multiple sources, combining spatial geometry with hazard-specific parameters such as magnitude, Volcanic Explosivity Index (VEI), and reported human impacts, among others. Where direct economic loss data were unavailable, estimates were derived using severity indicators and casualty records, with dataset-specific procedures detailed in subsequent sections.
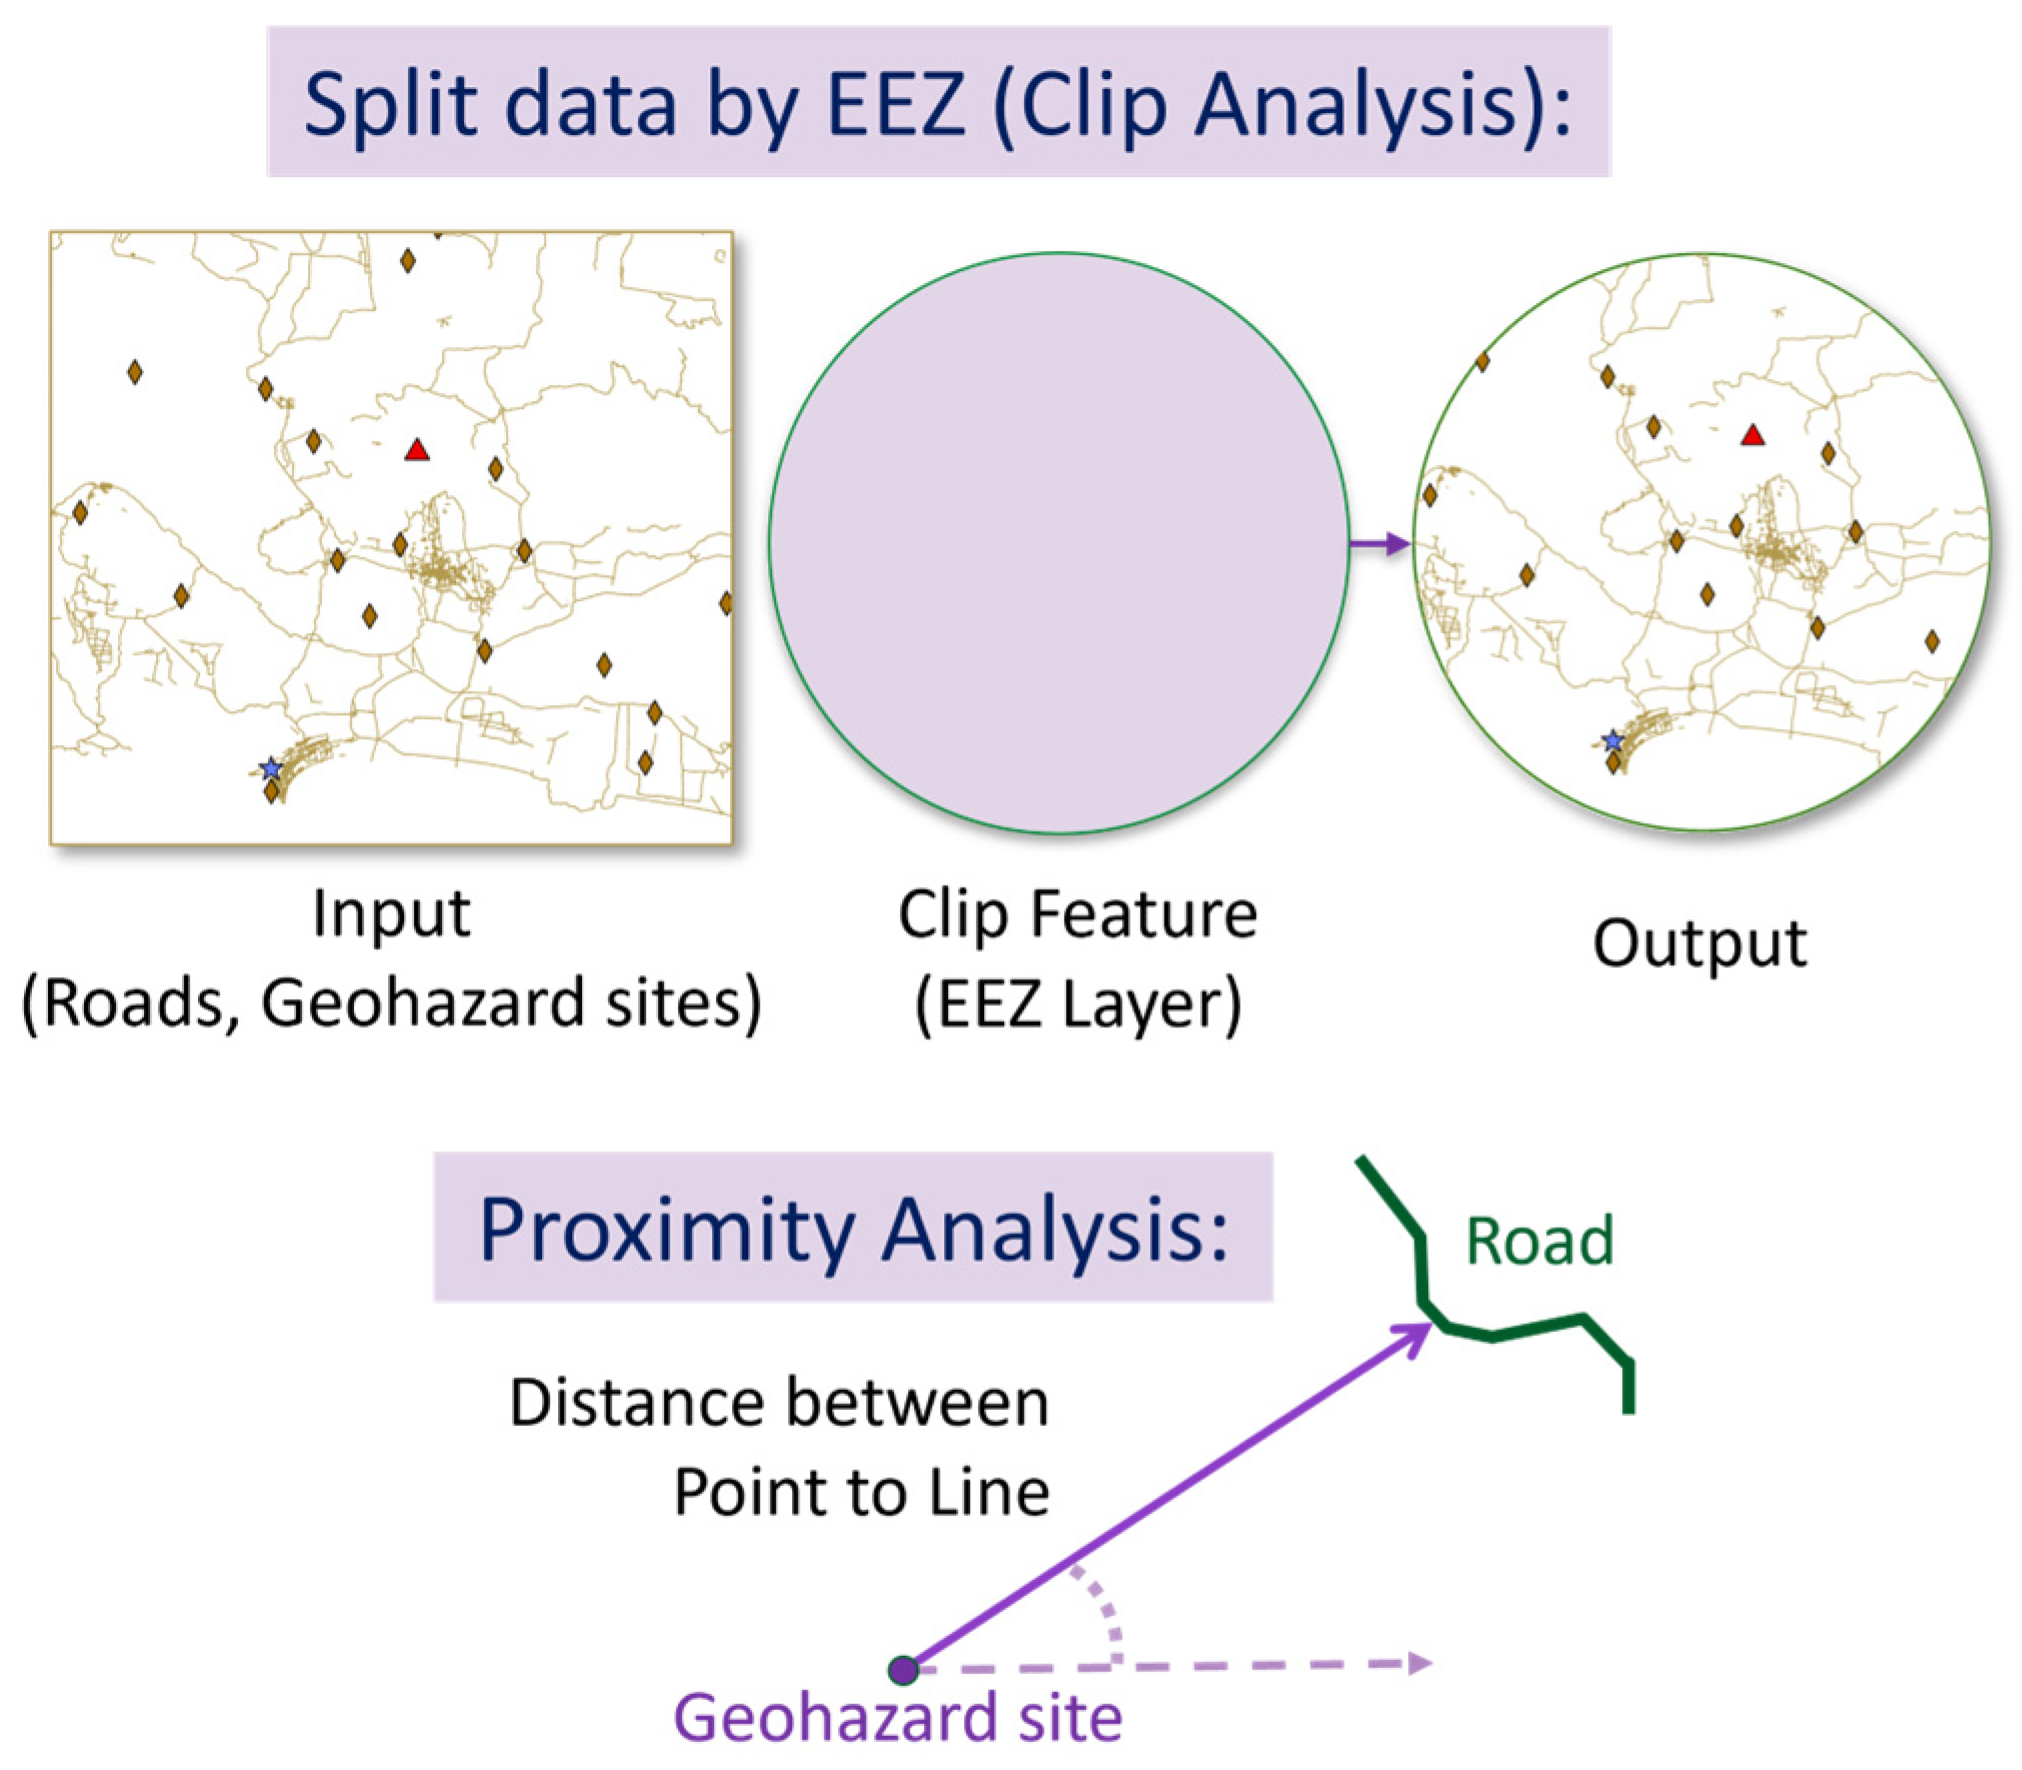
Data preprocessing involves a series of geospatial analysis techniques, including proximity analysis, zonal statistics, and spatial clipping to Exclusive Economic Zone (EEZ) boundaries, in order to constrain geohazard distribution to relevant maritime and territorial regions. These operations were performed using ArcGIS Pro, which also served as the primary environment for early-stage logic testing and scenario validation prior to backend deployment.
To support platform and sensor selection, a combination of scientometric review and rule-based decision logic was employed. Although supervised learning approaches such as decision trees and ensemble models were initially evaluated, their limited generalizability led to the adoption of a staggered decision workflow for final RPAS and sensor recommendations. Figure 1 provides an overview of the NDIS implementation pipeline, from data collection to sensor–drone mission recommendation. This schematic is referenced throughout the remainder of the section to contextualize the described methods.

2.1. Geohazard Dataset and Engineering

The geohazard inventory compiled for the NDIS framework includes both site-based and event-based records. Sites are persistent features such as volcanoes or fault lines. Events are discrete occurrences, for instance earthquakes or tsunamis. These hazards differ in both physical mechanism and monitoring requirements. Volcanoes are surface expressions of subsurface magma movement. Landslides are mass movements of soil or rock, often triggered by rainfall or seismic activity. Tsunamis are water displacement events, often triggered by earthquakes or landslides. Faults represent mapped geological structures that may generate future earthquakes. Earthquakes are sudden releases of energy due to fault rupture. Although related, not all earthquakes occur on mapped faults, and not all faults exhibit current seismicity. Faults are spatially persistent geological features representing zones of structural weakness, whereas earthquakes are discrete seismic events originating along such faults or elsewhere. Within this study, fault features are treated as potential risk zones requiring proactive monitoring, while earthquakes represent past or ongoing episodic events.
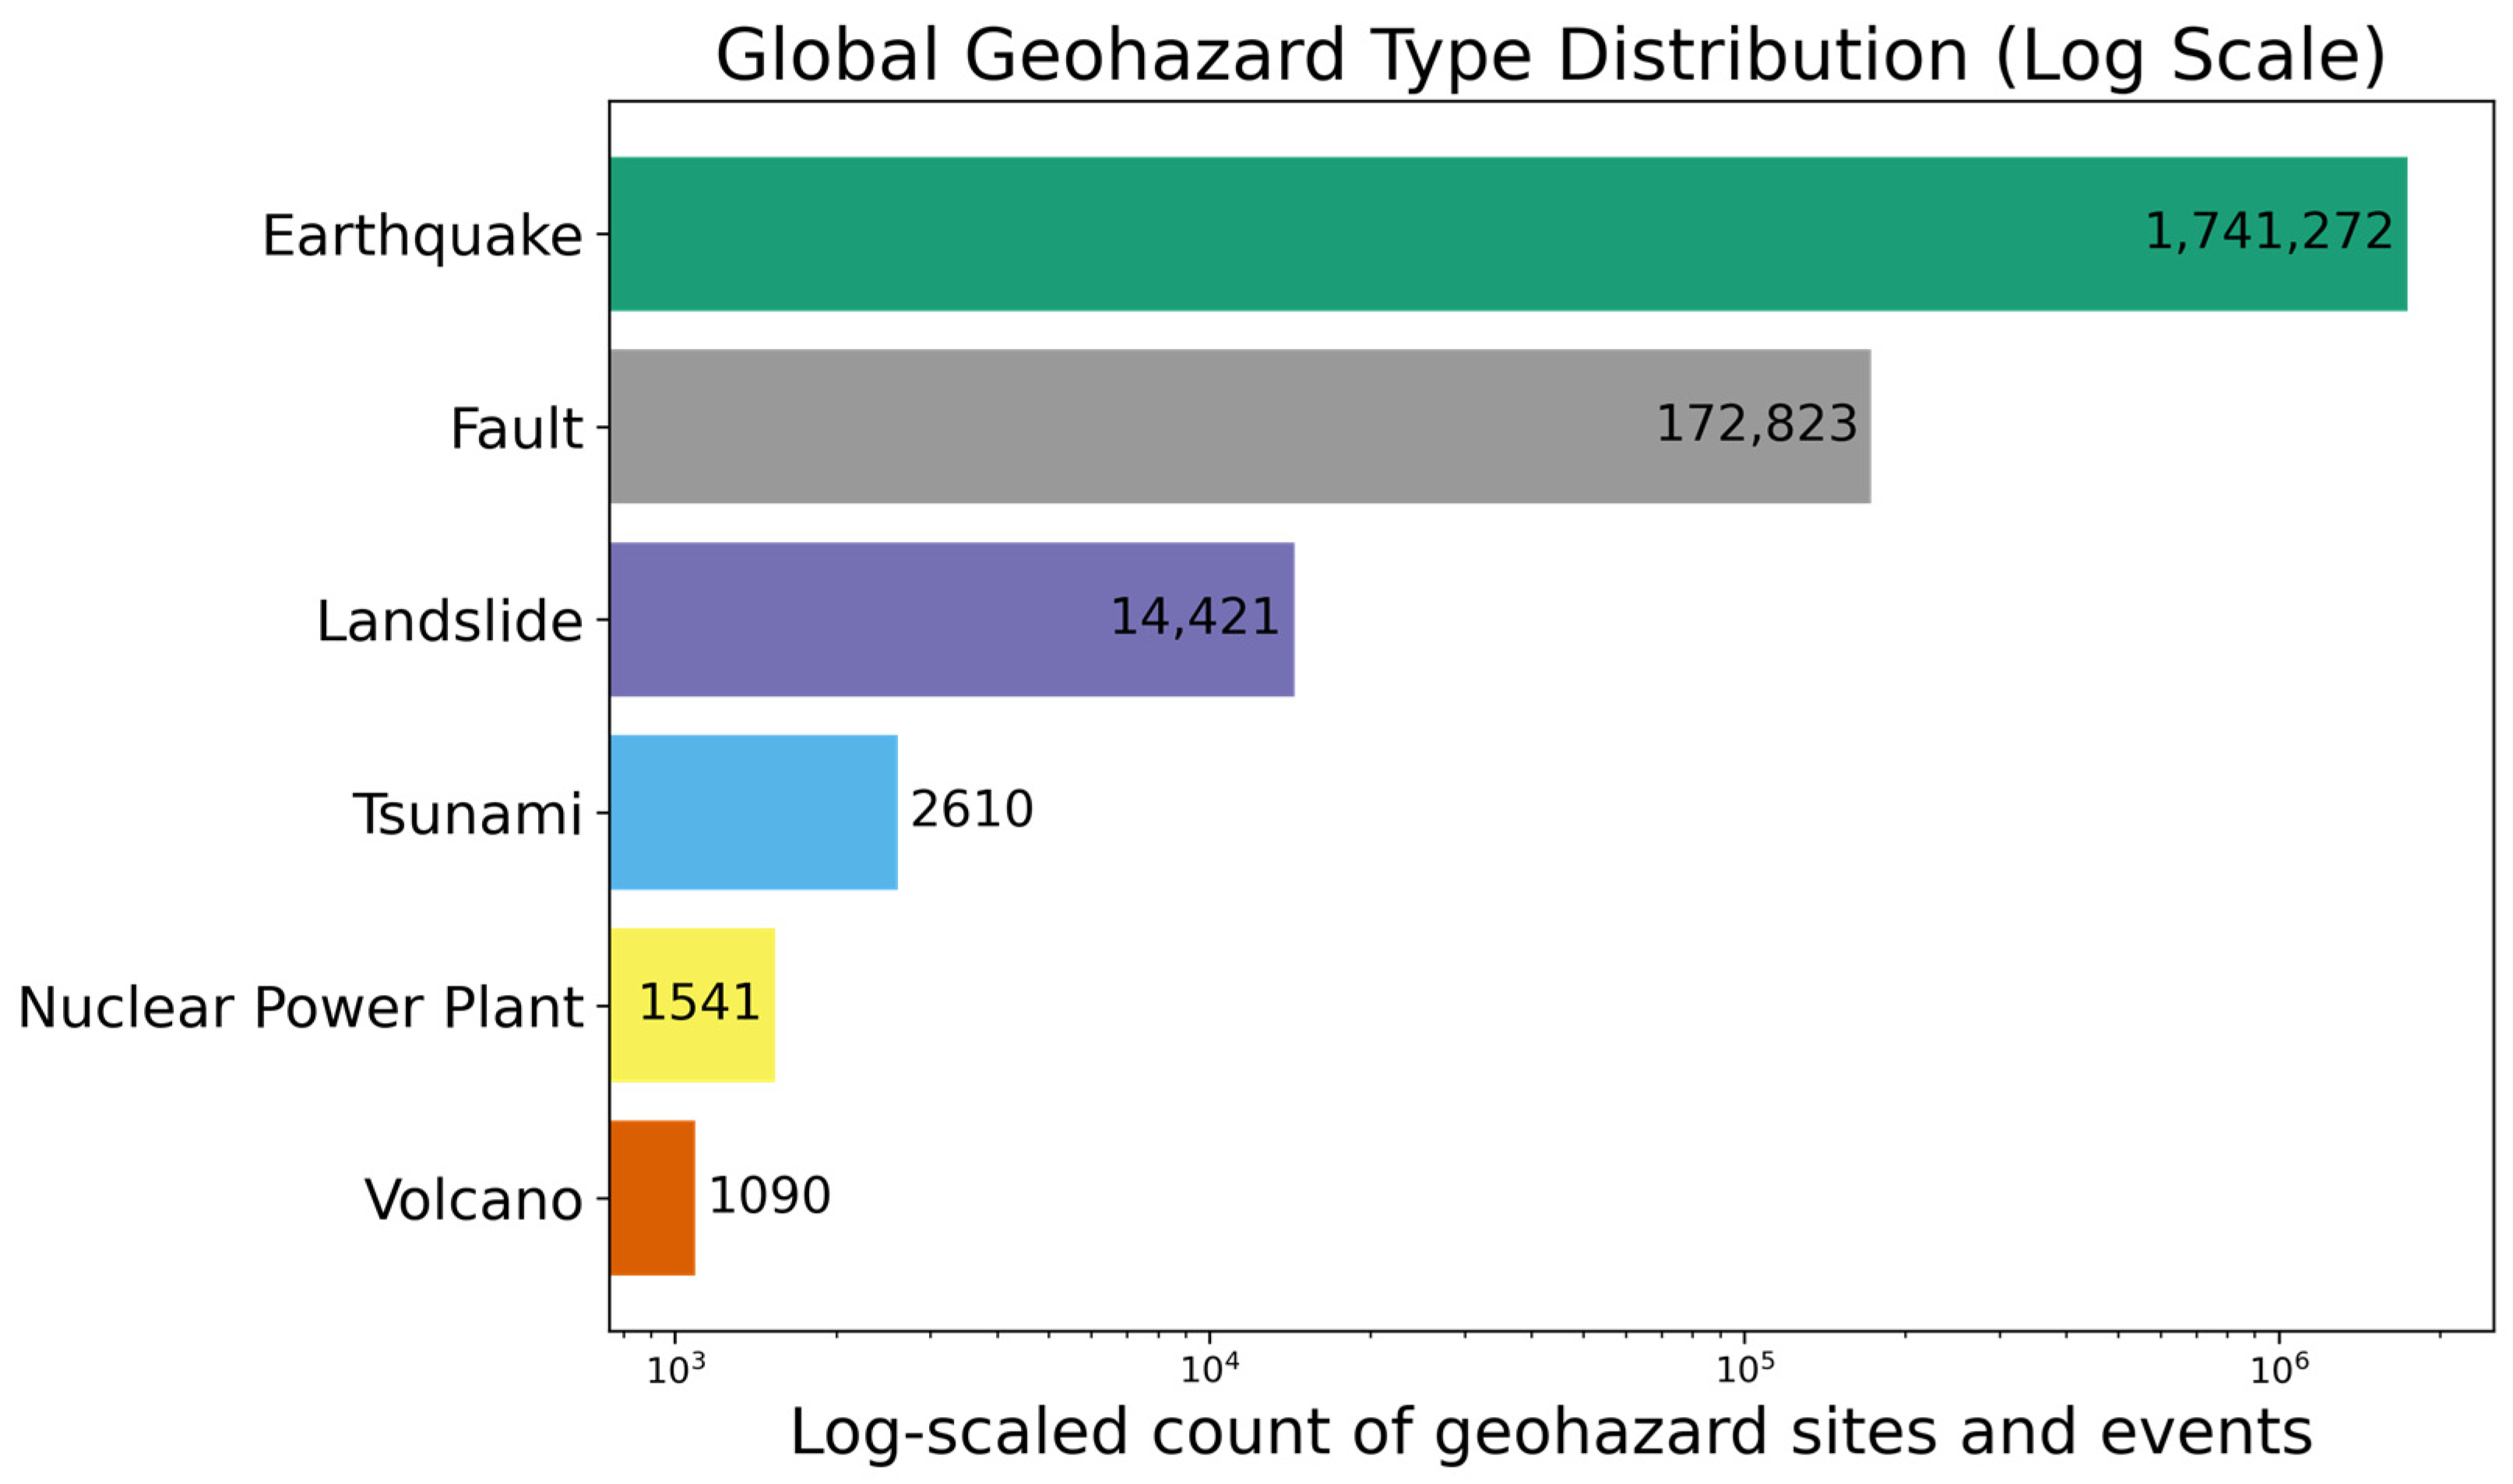
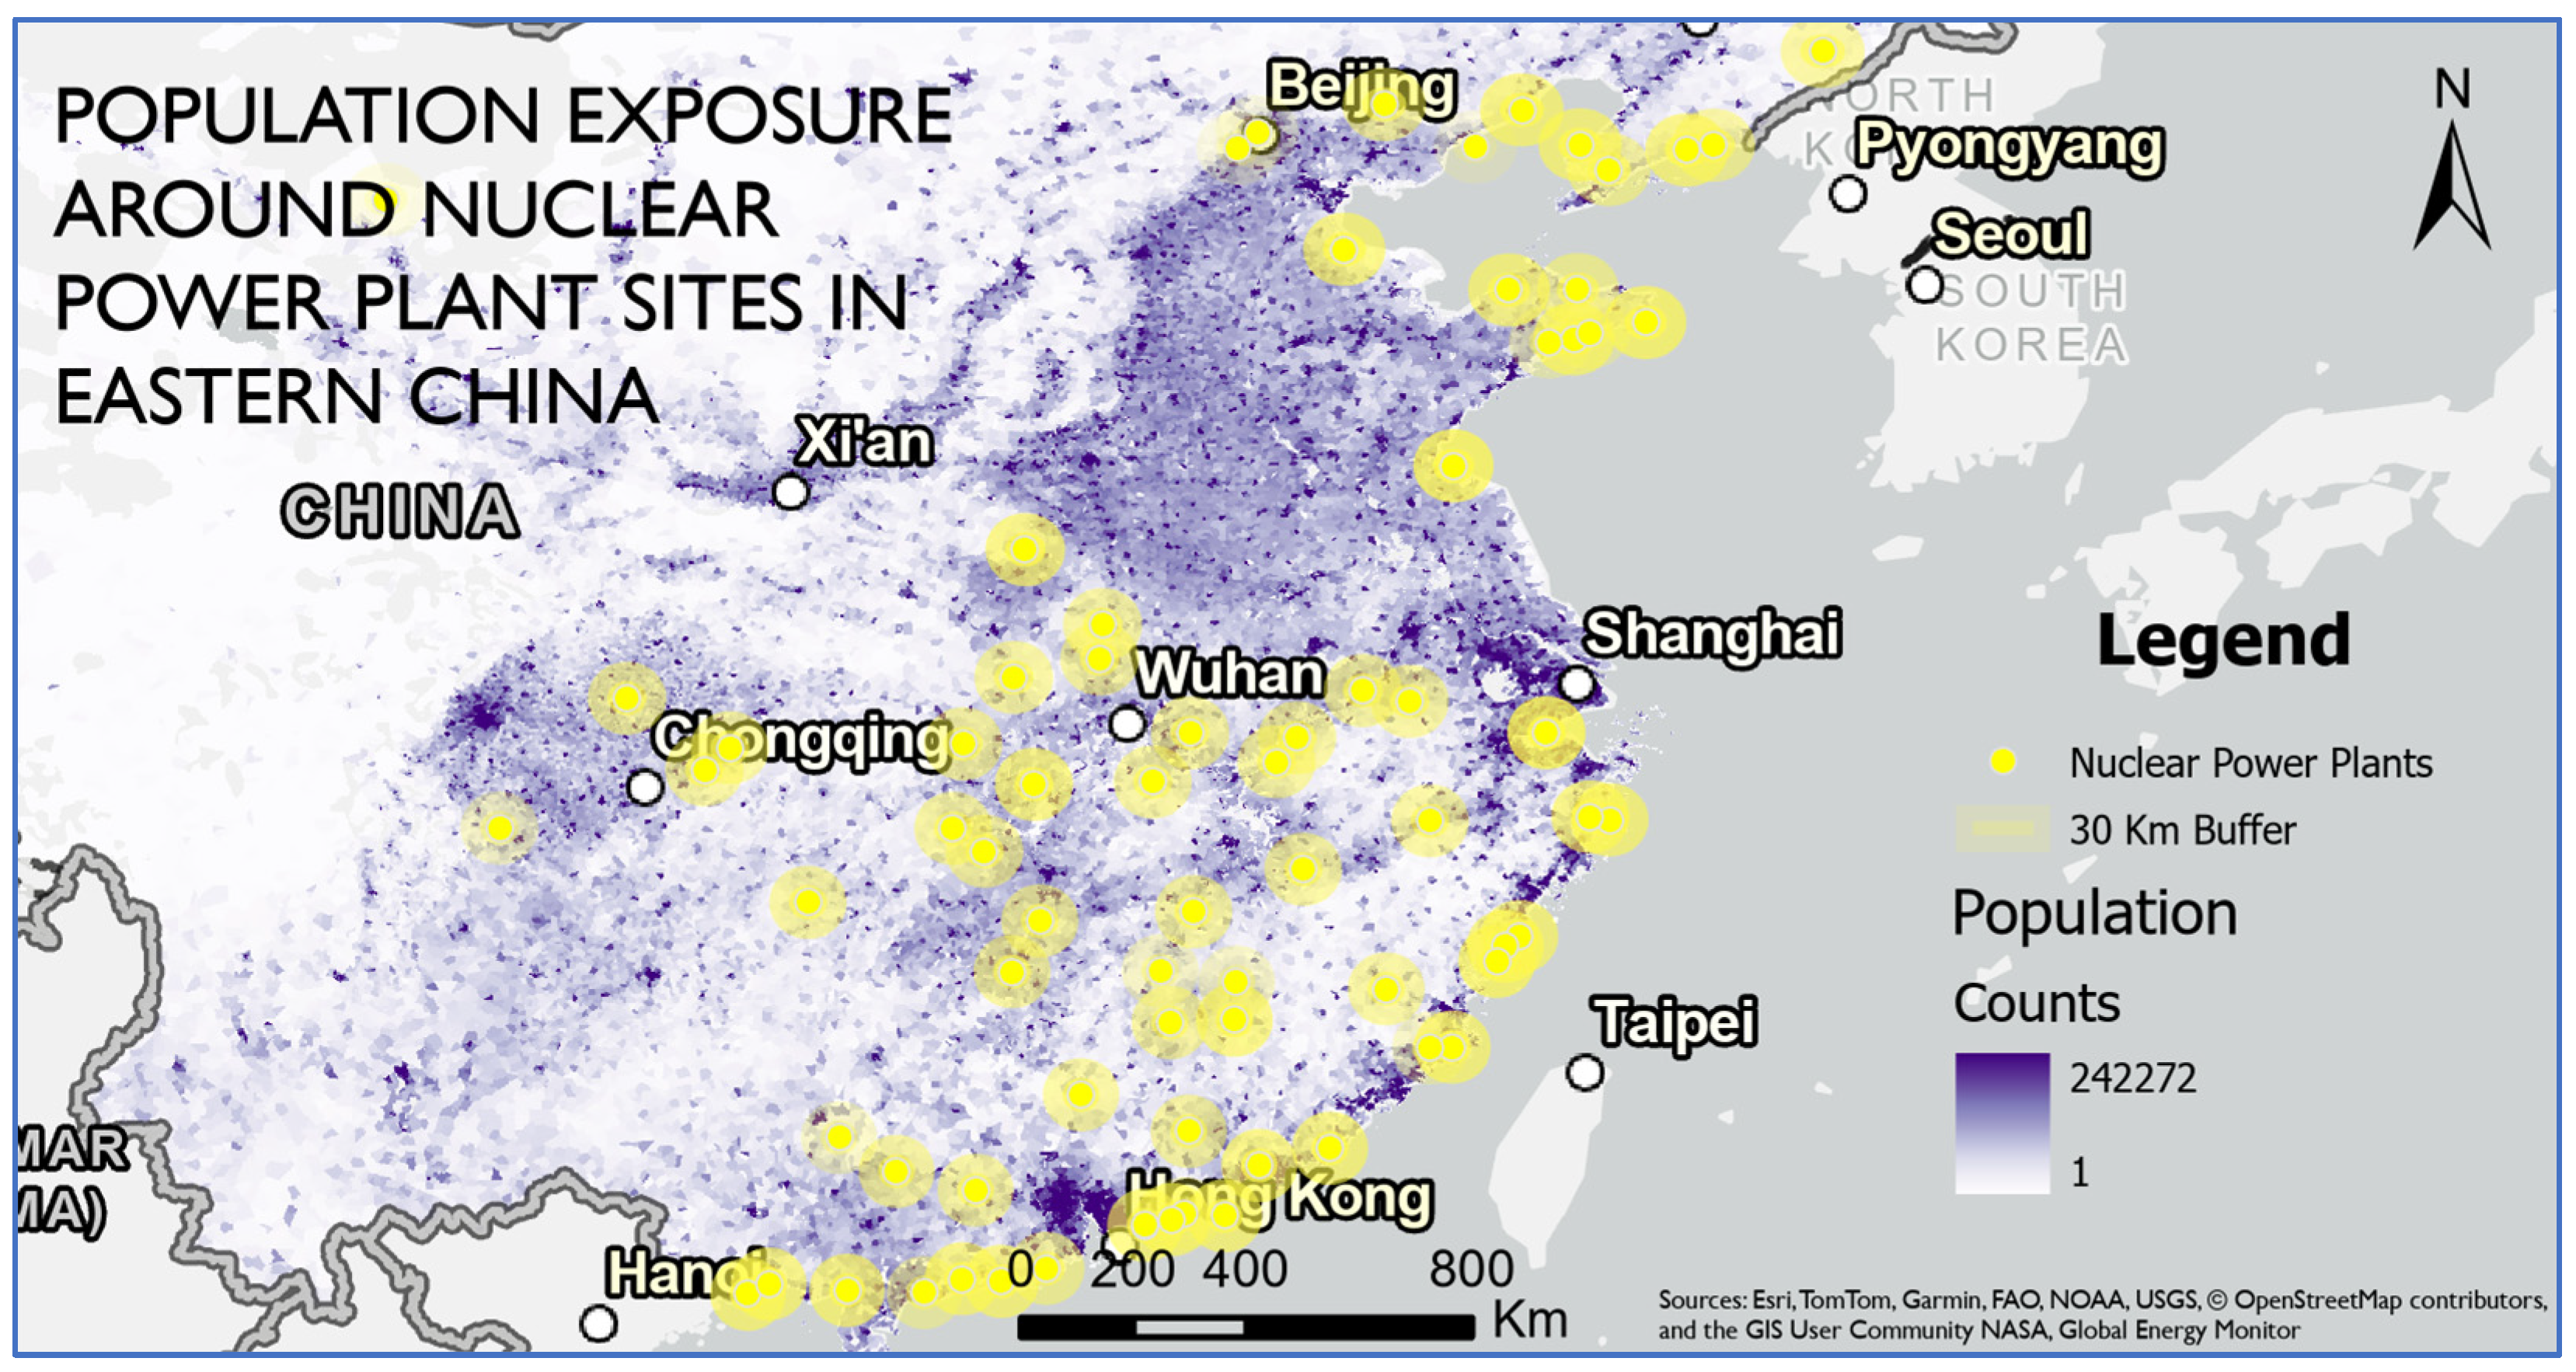
In addition to natural geohazards, the NDIS includes human-made facilities susceptible to geological activity, such as nuclear power plants. Although not geohazards themselves, their inclusion supports planning in regions where geological events may pose operational risks (e.g., Fukushima, Japan [18]). Figure 2 summarizes the relative distribution of records by hazard type and spans the period from 1900 to 2023. Earthquake events comprise the majority of entries due to their high frequency and global data availability. Source details for each hazard are provided in their respective Section 2.1.1, Section 2.1.2, Section 2.1.3, Section 2.1.4, Section 2.1.5 and Section 2.1.6.
Each dataset was reviewed and processed to derive attributes (Table 1) relevant to RPAS mission planning, including hazard type, distance to infrastructure, event intensity, and estimated economic loss (Table 2). For tsunamis, the logarithmic intensity transformation shown in Table 2 follows the formulation introduced by Soloviev and Imamura [19]. Further feature engineering involved the calculation of critical path metrics (CPM) and hazard-specific risk factors. Three supplementary datasets were also integrated: global population raster (for 30 km zonal statistics), global road networks (for proximity analysis), and Exclusive Economic Zones (for spatial clipping). All datasets were verified and aligned to the WGS 1984 geodetic reference system.
The Critical Path Method (CPM) was used to estimate the total mission duration for each RPAS-based geohazard survey. It comprises three additive components: travel time from the nearest access point to the hazard location, on-site monitoring or data collection time, and a setup buffer accounting for pre-flight preparation. Travel time was calculated using the distance to the hazard and an average cruise speed of 16 m/s, which reflects the typical operational range for multirotor RPAS based on empirical studies and performance modeling [8,9]. This value was applied uniformly across all mission types in the absence of drone-specific cruise velocity data.
Monitoring time was determined based on the operational characteristics of the selected sensor. For mapping-type missions involving optical or LiDAR sensors, a mapping speed of 5 m/s was applied to account for moderate-altitude flight with overlap requirements [10,11,12]. Ground-penetrating radar (GPR) and thermal missions were assigned a slower speed of 3 m/s due to their typically lower altitude and finer spatial resolution [11,13]. Magnetometer surveys were assigned to a higher mapping speed of 10 m/s [14,15]. For point-based missions, such as seismic node delivery or bottom pressure recorder (BPR) deployment, a fixed monitoring duration of 3 min was used.
The setup buffer was defined based on the operational complexity of the mission. For delivery-type tasks, such as seismic node deployment or thermal spot checks, where the mission distance is equivalent to the hazard distance, a buffer of 20 min was assigned to account for equipment checks and ground control station initialization. Whereas mapping-type mission, such as those using LiDAR, camera, or GPR, were assigned a 40-min buffer to accommodate additional tasks such as setting ground control points (GCPs), calibrating sensors, and configuring flight paths. These durations were selected to represent typical field conditions and were applied uniformly within each mission category.

2.1.1. Volcanoes

The volcano dataset used in this study combines two authoritative sources. The primary spatial dataset was obtained from the Smithsonian Institution’s Global Volcanism Program (GVP) through the Volcanoes of the World (VOTW) Web Feature Service. This Holocene database contains georeferenced records for 1323 volcanoes, detailing eruption history, morphology, and volcano type from the Holocene epoch to the present [20]. To supplement this, eruption-specific attributes were integrated from the National Centers for Environmental Information (NCEI) Significant Volcanic Eruption Database, maintained by NOAA’s National Geophysical Data Center. This secondary dataset provides event-level data including eruption dates, explosivity indices, and human impact indicators such as fatalities, injuries, and damage estimates [21].
Mission-relevant variables were derived to support RPAS planning in NDIS. VEI values, where available, were mapped to the NDIS ordinal intensity scale (Table A1 in Appendix A.1). For missing VEI records, values were estimated from reported fatality counts or sampled probabilistically based on global eruption frequency (details in Appendix A.1). Eruption durations were calculated from reported start and end dates or simulated from VEI-class ranges (Appendix A.1). Economic loss was taken from reported values, converted from qualitative descriptors, or simulated using intensity-weighted population and casualty factors (Table 2; Appendix A.1). For each volcano, the longest recorded eruption was retained to represent maximum hazard persistence.
This harmonized dataset provides geospatial, physical, and socio-economic indicators for volcanic hazards within the NDIS framework.

2.1.2. Landslides

Landslide data were obtained from NASA’s Cooperative Open Online Landslide Repository (COOLR), which compiles globally reported events from both institutional and citizen sources [22,23]. The dataset includes essential attributes such as event coordinates, hazard classification, and size descriptors. Data were preprocessed to align with NDIS schema. The ev_id (event id) field was retained as HazardID, and geometric attributes were preserved for spatial analyses.
To estimate event intensity, landslide size classifications (ls_size) were first mapped to a five-level ordinal scale, ranging from small, medium, large, very large to catastrophic. Where available, fatality and injury counts were incorporated to refine intensity by a composite score. A normalized casualty factor was combined with size weights (70:30) to reflect both physical scale and human impact, consistent with approaches used in disaster impact modeling [24]. Duration estimates were assigned using landslide size categories, following empirical guidance from USGS reports that describe landslide events ranging from sudden movements over minutes to prolonged displacement lasting weeks or longer, depending on slide type and material properties [25].

2.1.3. Tsunamis

Tsunami data are derived from the Global Historical Tsunami Database curated by the National Centers for Environmental Information (NCEI). This database includes over 2400 tsunami events spanning from 2100 BCE to the present and provides attributes such as location, intensity, runup height, and impact summaries based on observational and sensor-based records [26].
Preprocessing of this dataset involved standardizing significant fields such as hazard identification field (HazardID), spatial coordinates, hazard classification, and aligning the structure with the NDIS database schema. Tsunami intensity, derived from the Soloviev–Imamura scale, may range from approximately –1 to +8—though typical global records fall between –0.5 and +6 [19,27]. To harmonize within the NDIS 1–5 ordinal framework, intensities are mapped to thresholds, with extremes capped at the top ordinal level. To ensure consistency across the NDIS multi-hazard framework, this continuous scale was harmonized to an ordinal 1–5 classification using defined thresholds as shown in Table A2 (Appendix A.2). When unavailable, alternative fields were applied in sequence: Tsunami intensity (TS_INTENSITY, similarly rescaled), maximum event runup height (MAX_EVENT_RUNUP, interpreted as shoreline run-up height) using a logarithmic equation in Table 2 [19], and randomly assigned values using fixed probabilities based on observed distribution.
Estimated durations were mapped by tsunami intensity levels to empirically informed time ranges, where higher intensities correspond to longer durations (e.g., intensity 1 ≈ 15–30 min, intensity 5 ≈ 6–12 h). This approach reflects patterns described in historical tsunami impact records [19,27]. Where intensity values were unavailable, durations were entered using fallback values within a plausible range (e.g., 1–4 h), attempting for temporal consistency across all events.
Economic loss values were compiled from reported data if available or estimated using descriptive damage categories. In cases of missing information, final simulations were computed based on tsunami intensity, population exposure, and reported casualties. Previous studies, such as Jongman et al. (2012), have shown wide variability in modeled flood losses due to differences in inundated area, land use, and exposure [28]. In this study, simplified discrete ranges and proportional scaling are applied to approximate damage values, supporting the generation of varied mission planning scenarios without requiring fully empirical input.

2.1.4. Active Faults

The fault dataset utilized in this study was obtained from the GEM Global Active Faults Database (GAF-DB), which compiles fault records from national and regional catalogs [29]. To facilitate integration with point-based geohazard records, the original polyline geometry of fault traces was converted into evenly spaced point features at 5–10 km intervals. This spacing captures the segment-scale variability observed in fault evolution models [30].
Synthetic attributes were then engineered to support hazard assessment and drone mission prioritization. These include fault intensity, duration, and economic loss, derived using normalized geophysical parameters and fallback logic consistent with other hazards.
Because original features lacked unique IDs, a structured format was created by appending a reserved numeric prefix (177) and zero-padding applied to the original index. Multiple points from the same fault received hierarchical suffixes to ensure traceability and uniqueness within the broader hazard database.
Duration was estimated based on the assigned intensity. Faults are known to exhibit prolonged rupture behavior compared to rapid-onset hazards. Accordingly, a range of durations was simulated: from 1–3 h for minor events (Intensity 1) to up to 2 days for major events (Intensity 5). This range-based duration reflects generalized tectonic rupture timelines used in seismic fault modeling [31].
Economic loss, expressed in millions of USD, was simulated using a population-scaled multiplier mapped to the intensity class. Higher intensity levels were associated with broader economic impact ranges. A fallback population value of one million was assigned where data was missing, ensuring continuity of the simulation process.

2.1.5. Earthquakes

The earthquake dataset used in this study integrates multiple catalogs to ensure both temporal depth and parameter consistency. Historical events were sourced from the GEM Global Historical Earthquake Catalogue (GHEC) and the SHARE European Earthquake Catalogue (SHEEC), which provide macroseismic records from the years 1000 to 1903 and 1000 to 1899, respectively. These catalogs compile data from parametric sources and macroseismic intensity reports, with epicentral locations and magnitude estimates derived through cross-verification with regional and national earthquake bulletins [32,33,34,35]. Instrumental records from the modern era (1904–present) were incorporated from the ISC Bulletin [36] and the ISC-GEM Global Instrumental Earthquake Catalogue [37], which provide homogenized magnitude values and refined epicentral locations based on standardized seismological models such as ak135.
Event identifiers were standardized (as HazardID), and geospatial attributes such as epicenter coordinates and depth were retained for spatial analysis. In addition to magnitude, earthquake depth was utilized to refine ground-shaking intensity estimates. While magnitude represents the energy released at the source, depth is a proxy for surface impact [38]. Shallow earthquakes (<10 km) were assigned an intensity adjustment of +1 due to stronger surface shaking, whereas deeper events (>70 km) were scaled down accordingly. These adjustments were implemented using depth buckets, reflecting established empirical and seismological relationships between focal depth and surface shaking intensity [38,39,40]. This transformation enabled consistent integration of seismic hazard levels within the broader geohazard classification in NDIS framework.
To simulate potential economic losses for each earthquake event, a simplified intensity-based model was applied. Each intensity class (1 to 5) was assigned a synthetic range of potential loss values (in millions USD), reflecting plausible damage scales based on population exposure. A uniform random value within the designated range was then multiplied by the estimated population within a 30 km radius, normalized by millions. This method draws conceptually from prior global seismic risk models that relate ground shaking intensity and exposure to expected losses [41], but the exact numerical ranges used here are scenario-based assumptions intended for prioritization purposes only and not actual loss estimation. The values used herein can be changed, hence, the selected values do not limit the usability of the NDIS.

2.1.6. Nuclear Power Plants

Nuclear hazard data were sourced from the Global Nuclear Power Tracker by the Global Energy Monitor [42]. This spatial dataset includes plant names, coordinates, and capacity in megawatts (MW). This dataset does not represent historical disasters but serves as a record of potential high-impact facilities. While nuclear incidents are rare, their consequences can be extreme, justifying their inclusion within the geohazard framework despite the absence of a standard event-based catalogue such as those maintained for earthquakes or volcanoes [43].
As most fields serve as placeholders for mission planning and risk modeling, preprocessing focused on cleaning numeric attributes and assigning standardized parameters. A synthetic HazardID was generated by appending a numerical suffix of 111 to the GEM unit identifier. Hazard intensity was assigned a default high value of 5.0 to reflect the severity potential of nuclear emergencies. Likewise, an assumed event duration of 1440 min (24 h) and a standard monitor time of 120 min were applied across all records.
Economic loss was estimated based on facility capacity, using a multiplier of $11.5 million per megawatt. This figure approximates the replacement or decommissioning cost associated with nuclear infrastructure, scaled from an average of $11.5 billion per gigawatt [44]. This harmonized and enriched dataset was then integrated into the unified geohazard database to support multi-hazard risk analysis and geospatial mission planning. Note that the monitoring efforts are limited to the initial disaster, and not the long-term effects to the surrounding environment and society. This choice was made to make the nuclear hazard comparable to natural hazards. Long-term monitoring is also not urgent to warrant a fast response, which the NDIS focusses on.

2.1.7. Supporting Geospatial Layers and Preprocessing

To support hazard prioritization and mission feasibility analysis, three global datasets were integrated: Exclusive Economic Zones (EEZ), Global Roads Inventory Project (GRIP), and Gridded Population of the World.
Hazard points were spatially filtered (illustrated in Figure 3) using a union of Exclusive Economic Zones (EEZ) and national boundaries, based on the Maritime Boundaries dataset [45]. Points located outside EEZ limits were retained in a separate dataset for documentation but excluded from operational prioritization. These features are likely situated in remote oceanic zones such as mid-ocean ridges or deep-sea basins, where the nearest land-based access exceeds 200 km. Such distances fall well beyond the range of typical RPAS operations. As the current mission framework emphasizes deployability using commercially available platforms, these offshore records were flagged for exclusion from immediate survey consideration. Out of 1,938,335 total geohazard entries, approximately 83,322 (~4.3%) were located outside EEZ limits or in remote offshore regions (e.g., mid-ocean ridges). These records were excluded from mission prioritization but retained for documentation purposes.
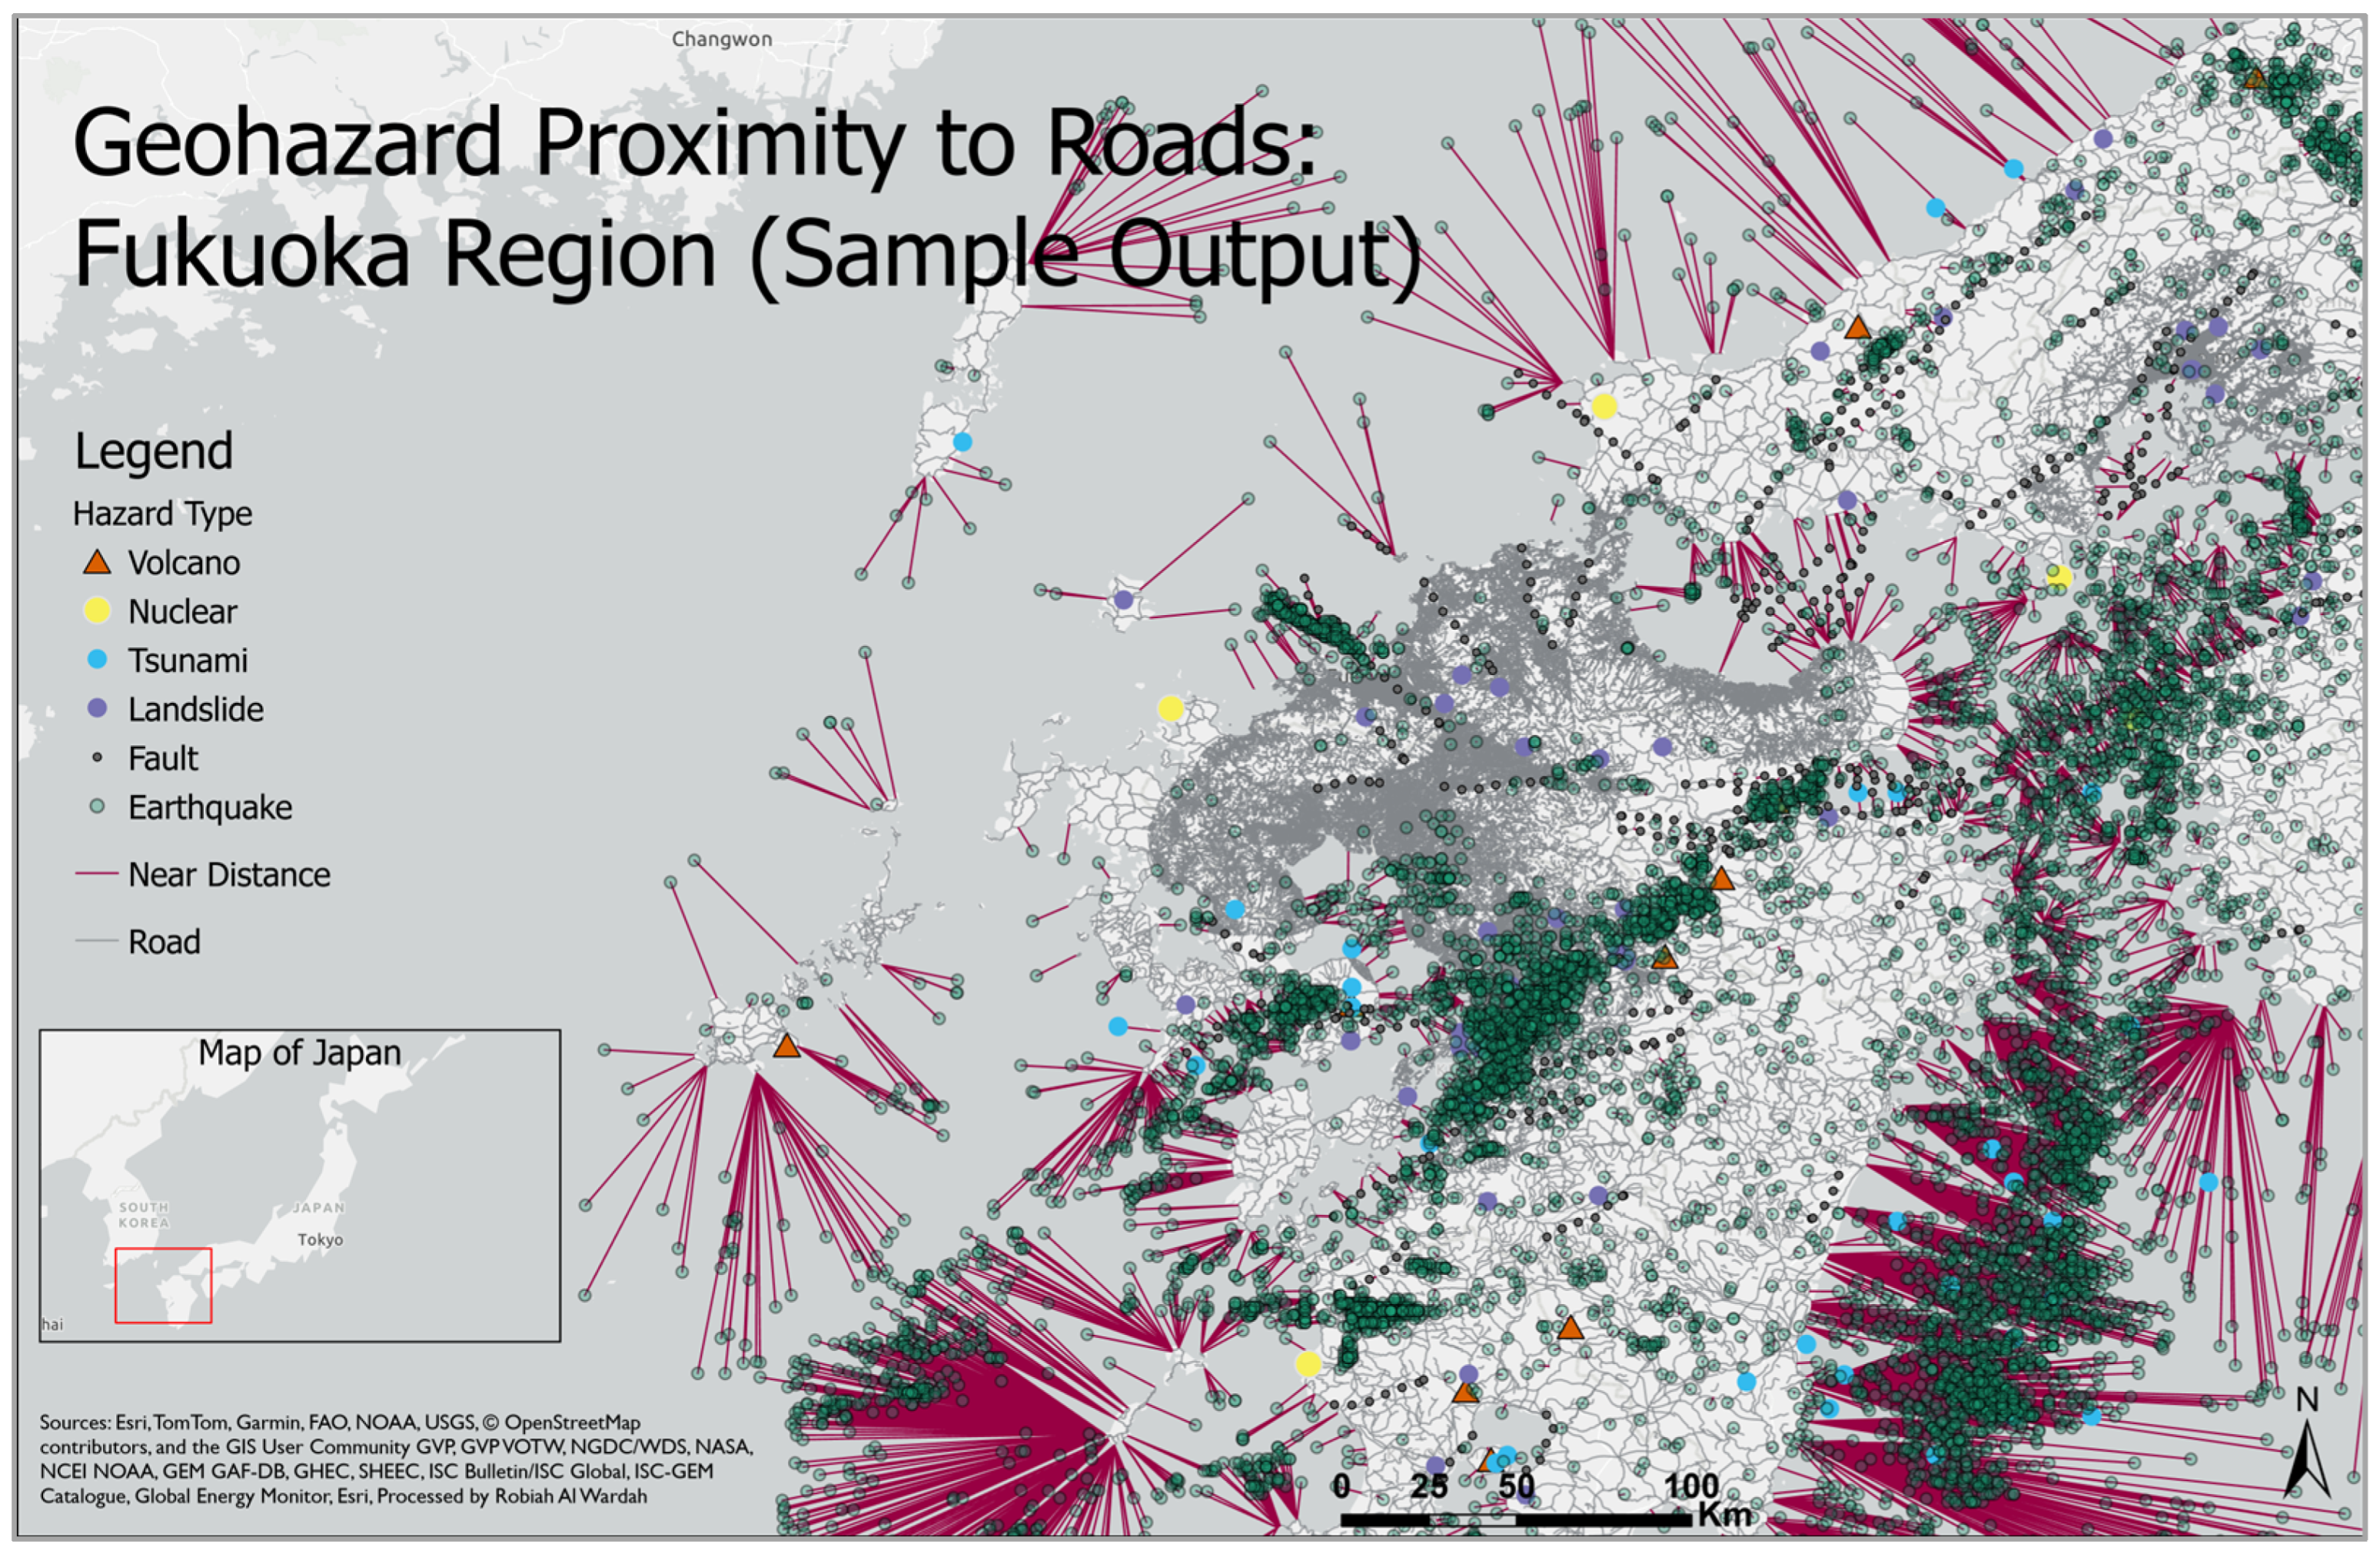
While RPAS provide flexibility in operations on site, most systems do need to be deployed from access roads to avoid lengthy approaches which limit endurance. Hence, an access point was defined at the nearest road. The proximity to transportation infrastructure was calculated by performing an analysis between each clipped geohazard layer and the global road network (illustrated in Figure 3). Road segments were derived from the Global Roads Inventory Project (GRIP), which provides harmonized coverage of global road infrastructure at multiple administrative levels [46]. For each geohazard point, the geodesic distance to the nearest road segment was computed (see Figure 4 for distance category from the total of geohazard sites and events), and the resulting values were recorded as a distance field. This metric was later used for platform-sensor mission planning, particularly in estimating deployment feasibility. A sample output of this preprocessing is illustrated in Figure 5, showing distance-to-road computation for geohazard points in the Fukuoka region. While such static views are interpretable at a local scale, they become heavily cluttered when applied globally across multiple hazard types, spatial layers, and recommended sensor-platform combinations. This visualization constraint—along with the need for real-time interaction—motivated the development of the NDIS web application as a more scalable alternative.
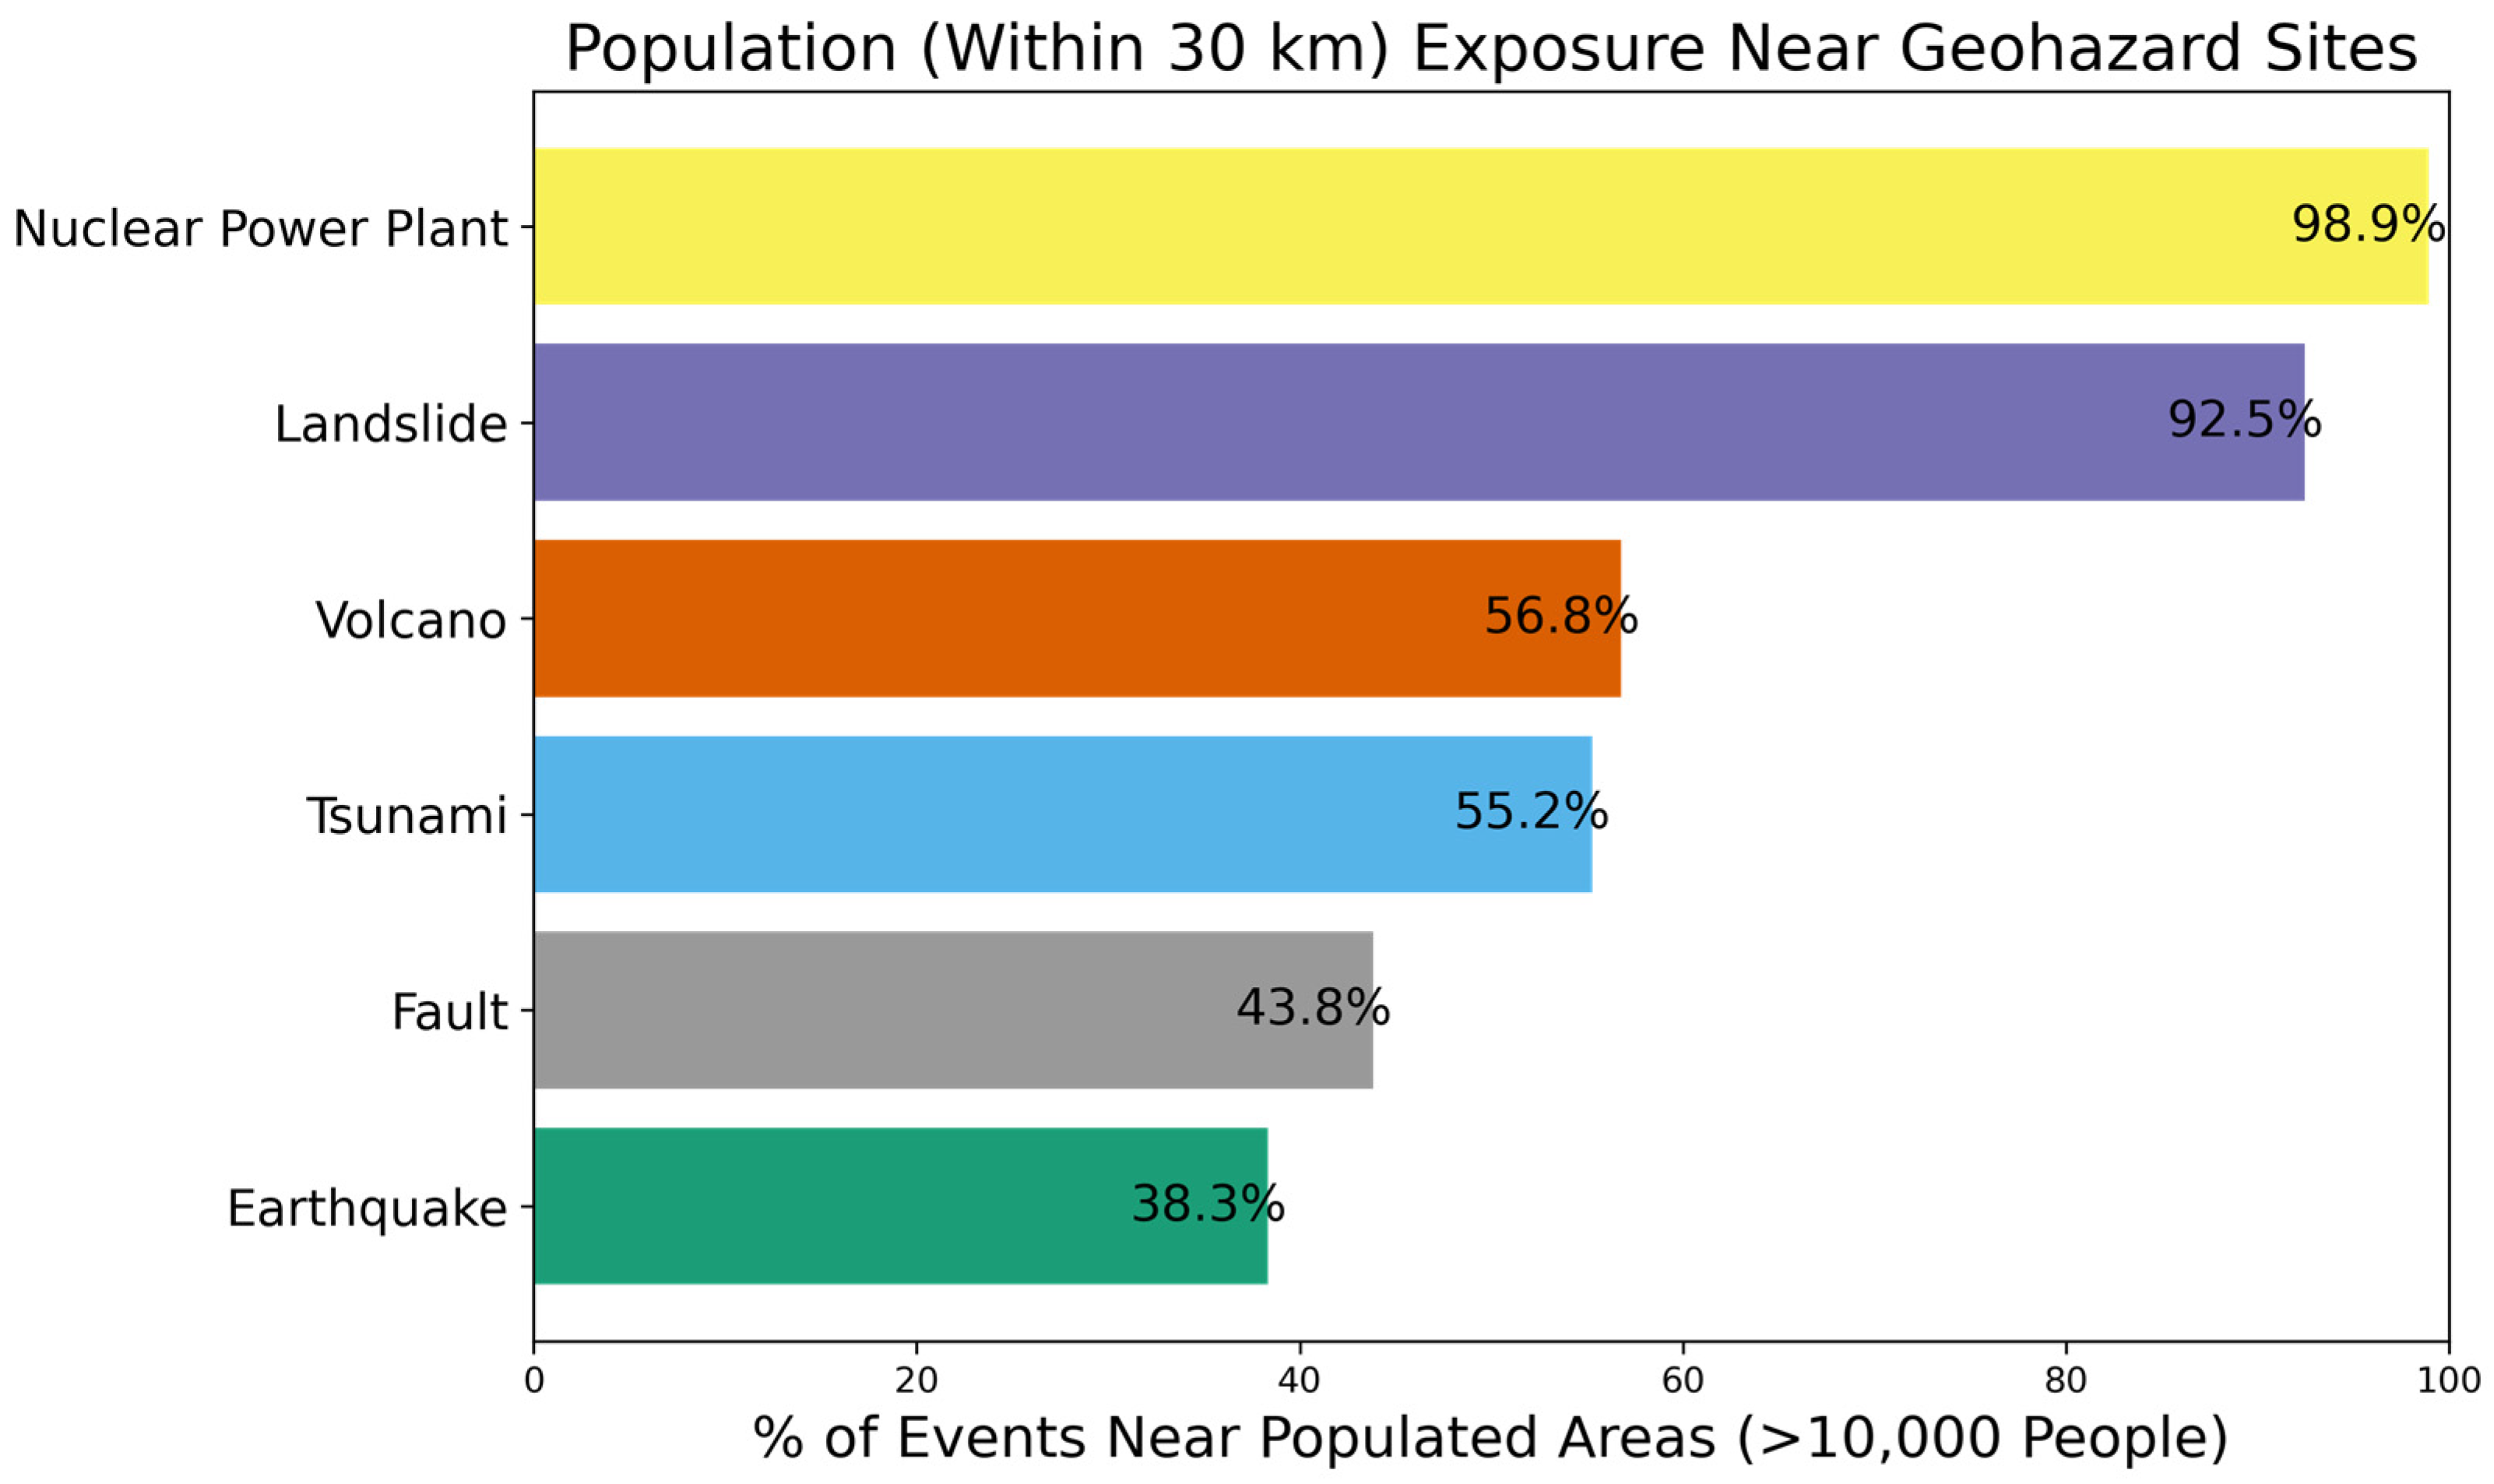
Zonal statistics were used to estimate population exposure within a 30 km buffer surrounding each geohazard (Figure 6 represents the percentages of hazard events and sites within populated areas). Using the Gridded Population of the World v4.11 raster dataset [47], buffered geometries were analyzed in batches to derive population counts based on aggregated cell values. The population raster was preprocessed to remove extreme or missing values and converted to integer format to ensure numerical stability. All raster cells intersecting each buffer were included to avoid underestimation at boundary zones. Invalid or undefined outputs were excluded, and unusually high totals were flagged for manual review. This approach enabled scalable and consistent estimation of affected populations, while accounting for spatial irregularities and data sparsity.
Together, these three layers—EEZ-defined boundaries, global road network, and population data—served distinct roles in spatial preprocessing. Hazard points were first clipped to EEZ boundaries to define sovereign zones, which were then used to segment the global road and hazard datasets for proximity analysis. Within each zone, the geodesic distance from each hazard point to the nearest road was computed using the GRIP dataset. Separately, a 30 km buffer was applied around each hazard point to estimate local population exposure using gridded population data (snippet in Figure 7). The resulting attributes—road distance and buffered population—were then appended to the geohazard dataset to support downstream mission planning and prioritization.

2.1.8. RPAS Database Compilation and Classification

The RPAS database was compiled through manual data collection from publicly available sources. An initial list of manufacturers was obtained from Drone Industry In-sights’ market infographic [48], which included names and logos of commercial drone producers. As the infographic did not contain technical specifications, additional information was obtained from publicly available materials, including manufacturer websites, datasheets, brochures, and technical product documentation.
A total of 179 drone models were identified and compiled into a structured dataset. Each entry was associated with multiple attributes, including maximum payload capacity, endurance, maximum takeoff weight (MTOW), communication range, speed, distance range, operational temperature, regulatory category, default payload configuration, image reference, unit price, and source website, among other specifications. For the purposes of classification and platform filtering, payload capacity, communication range, and distance range were treated as the primary criteria, given their direct relevance to geophysical and remote sensing survey requirements.
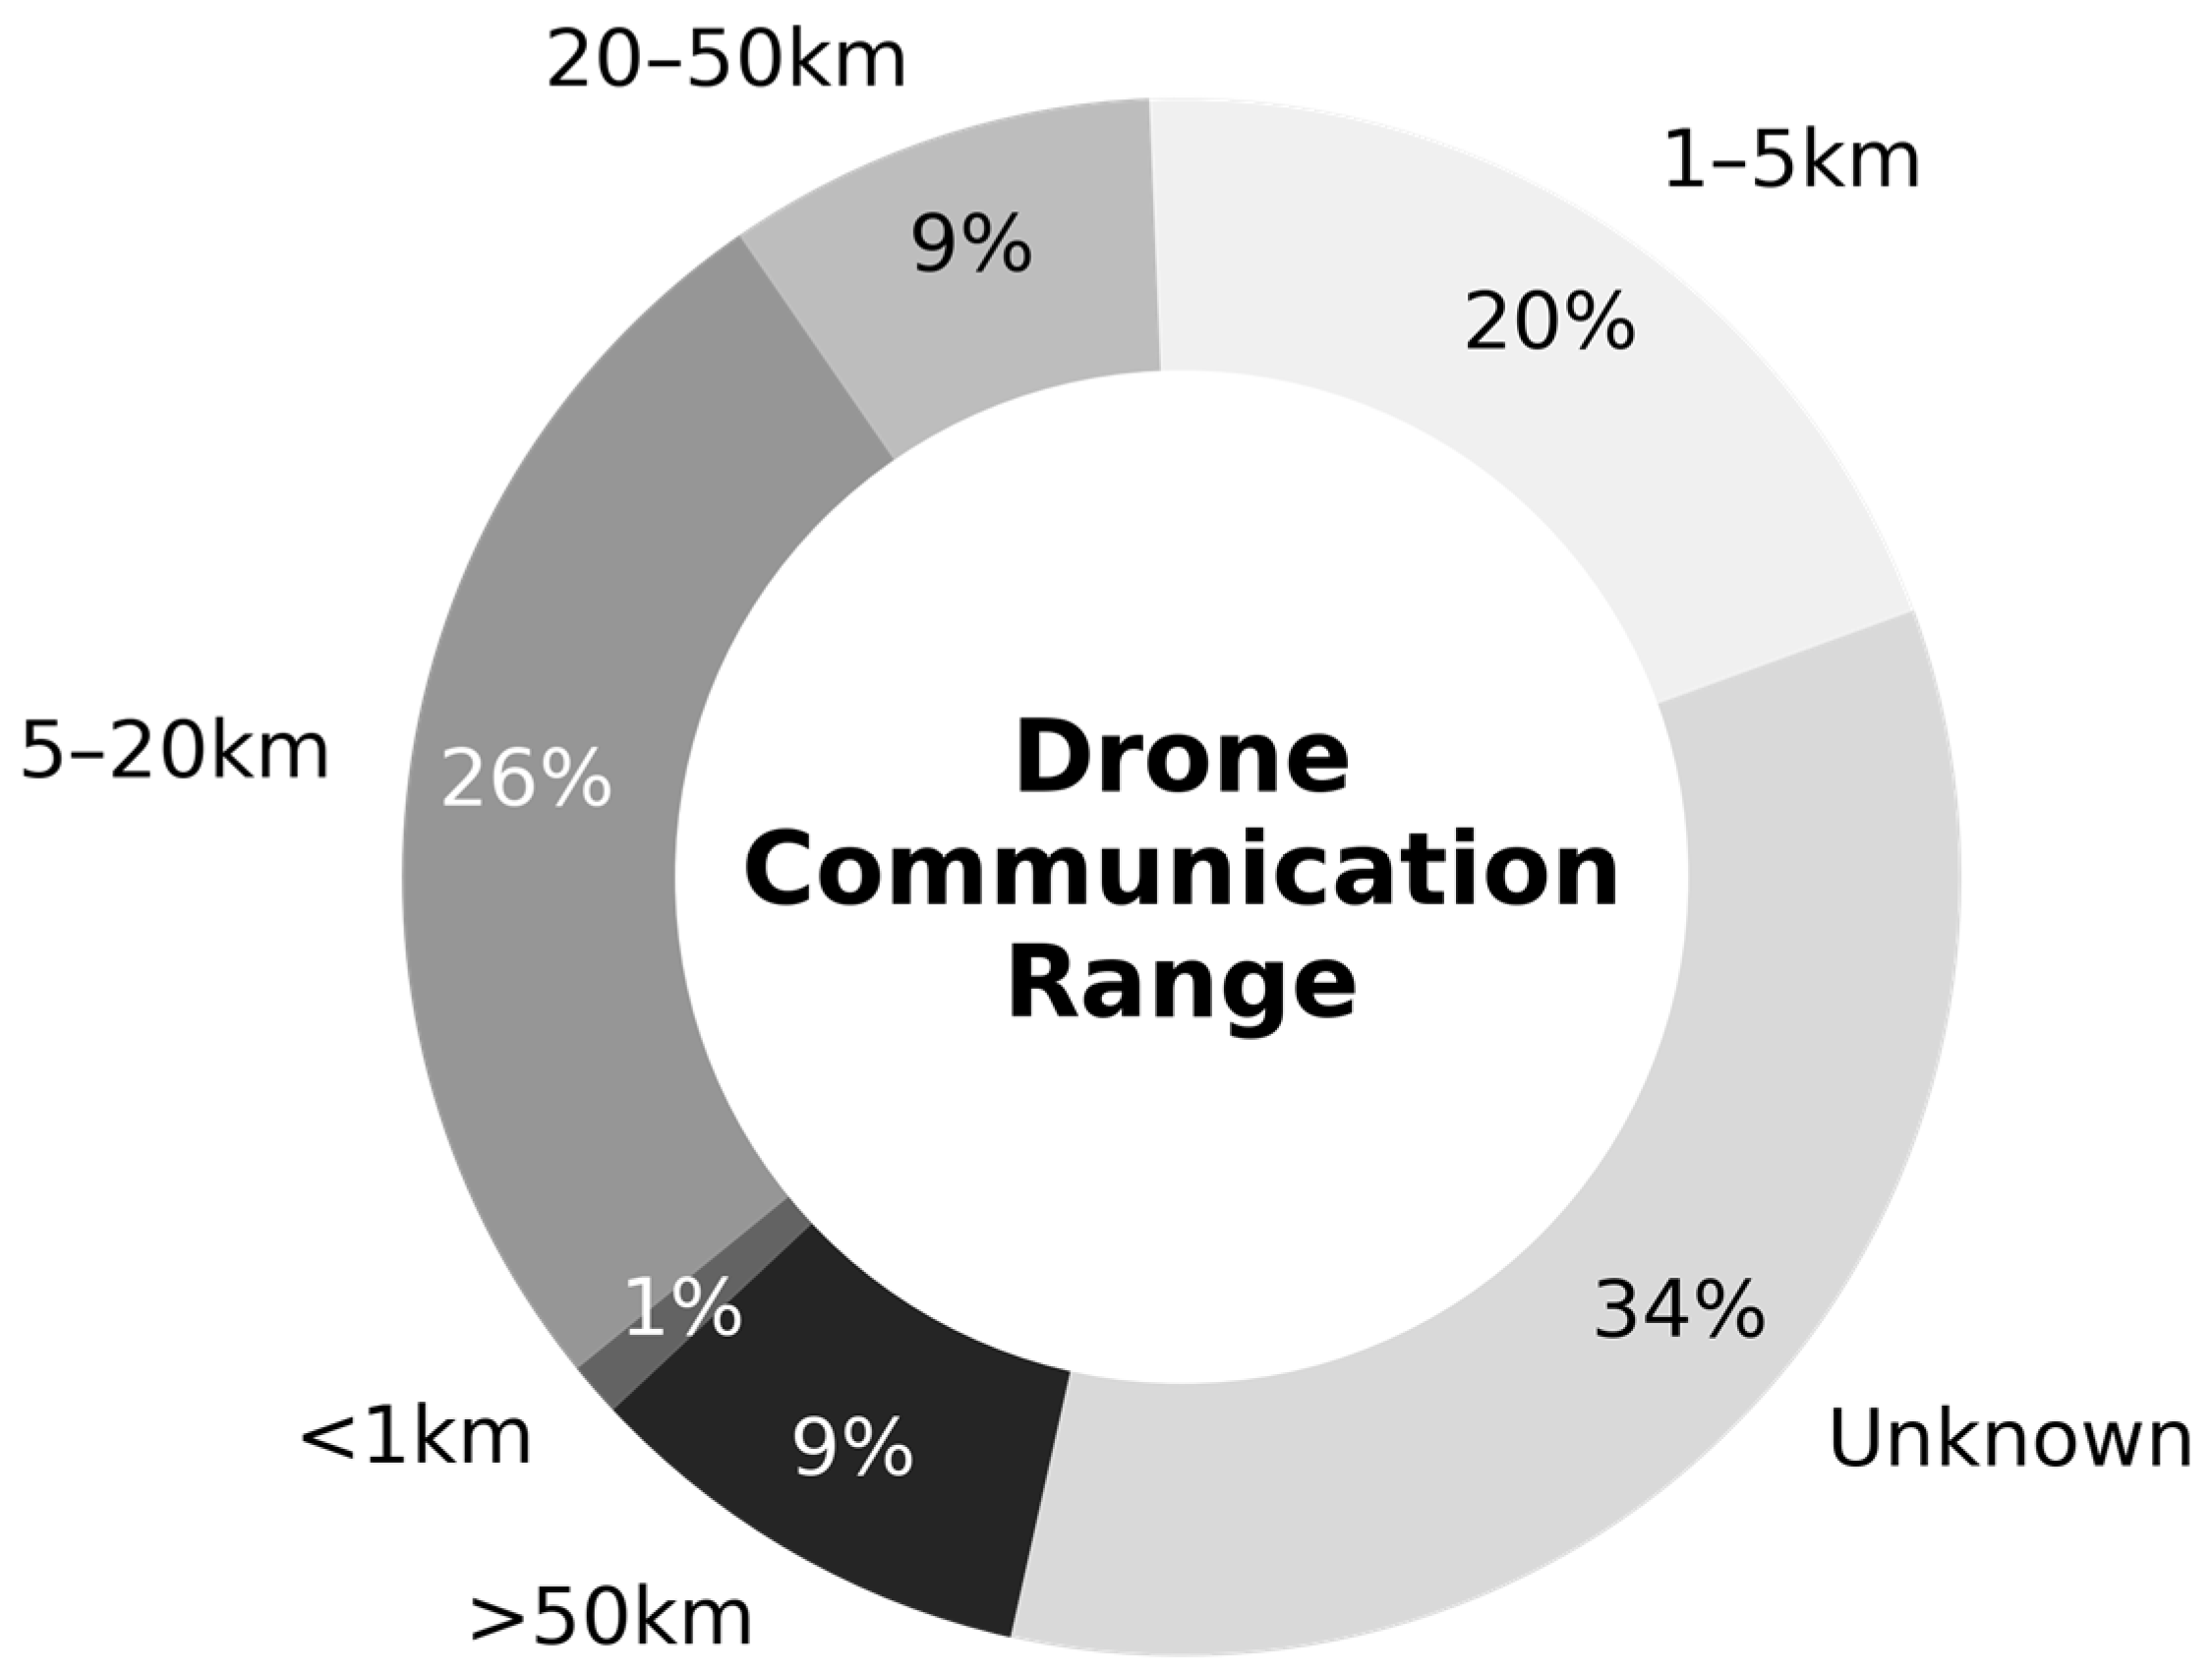
Drones in the RPAS database were categorized by two operational constraints: communication range and payload capacity. Communication range refers to the maximum distance over which a drone can reliably maintain a connection with its ground control station, which directly influences how far the drone can travel from its launch site during a mission. Drones were grouped into five communication range categories (Figure 8): less than 1 km (1.7%), 1–5 km (20.7%), 5–20 km (26.3%), 20–50 km (8.9%), and greater than 50 km (8.4%). Drones without explicitly stated communication ranges but equipped with GSM or cellular modules (e.g., LTE, 4G, 5G) were conservatively classified into the >50 km category. This classification reflects their theoretical capability to operate over long distances, assuming continuous mobile network coverage. While actual performance de-pends on terrain, infrastructure, and regulatory constraints, cellular communication modules enable Beyond Visual Line-of-Sight (BVLOS) operations in many jurisdictions under supervised or experimental conditions.
The remaining drones, which lacked clear communication range specifications, were grouped into an “Unknown” category. Many of these models likely use general-purpose telemetry systems operating on unlicensed frequency bands such as 2.4 GHz or 5.8 GHz. These frequencies are commonly used in consumer and prosumer drones and generally support short- to mid-range operations, typically spanning 1 to 20 km under ideal conditions. However, range can vary significantly based on transmission power, antenna con-figuration, terrain, and line-of-sight conditions. In some cases—particularly with low-er-frequency systems (e.g., 900 MHz) or directional antennas—longer-distance performance may be possible, though not always guaranteed or documented.
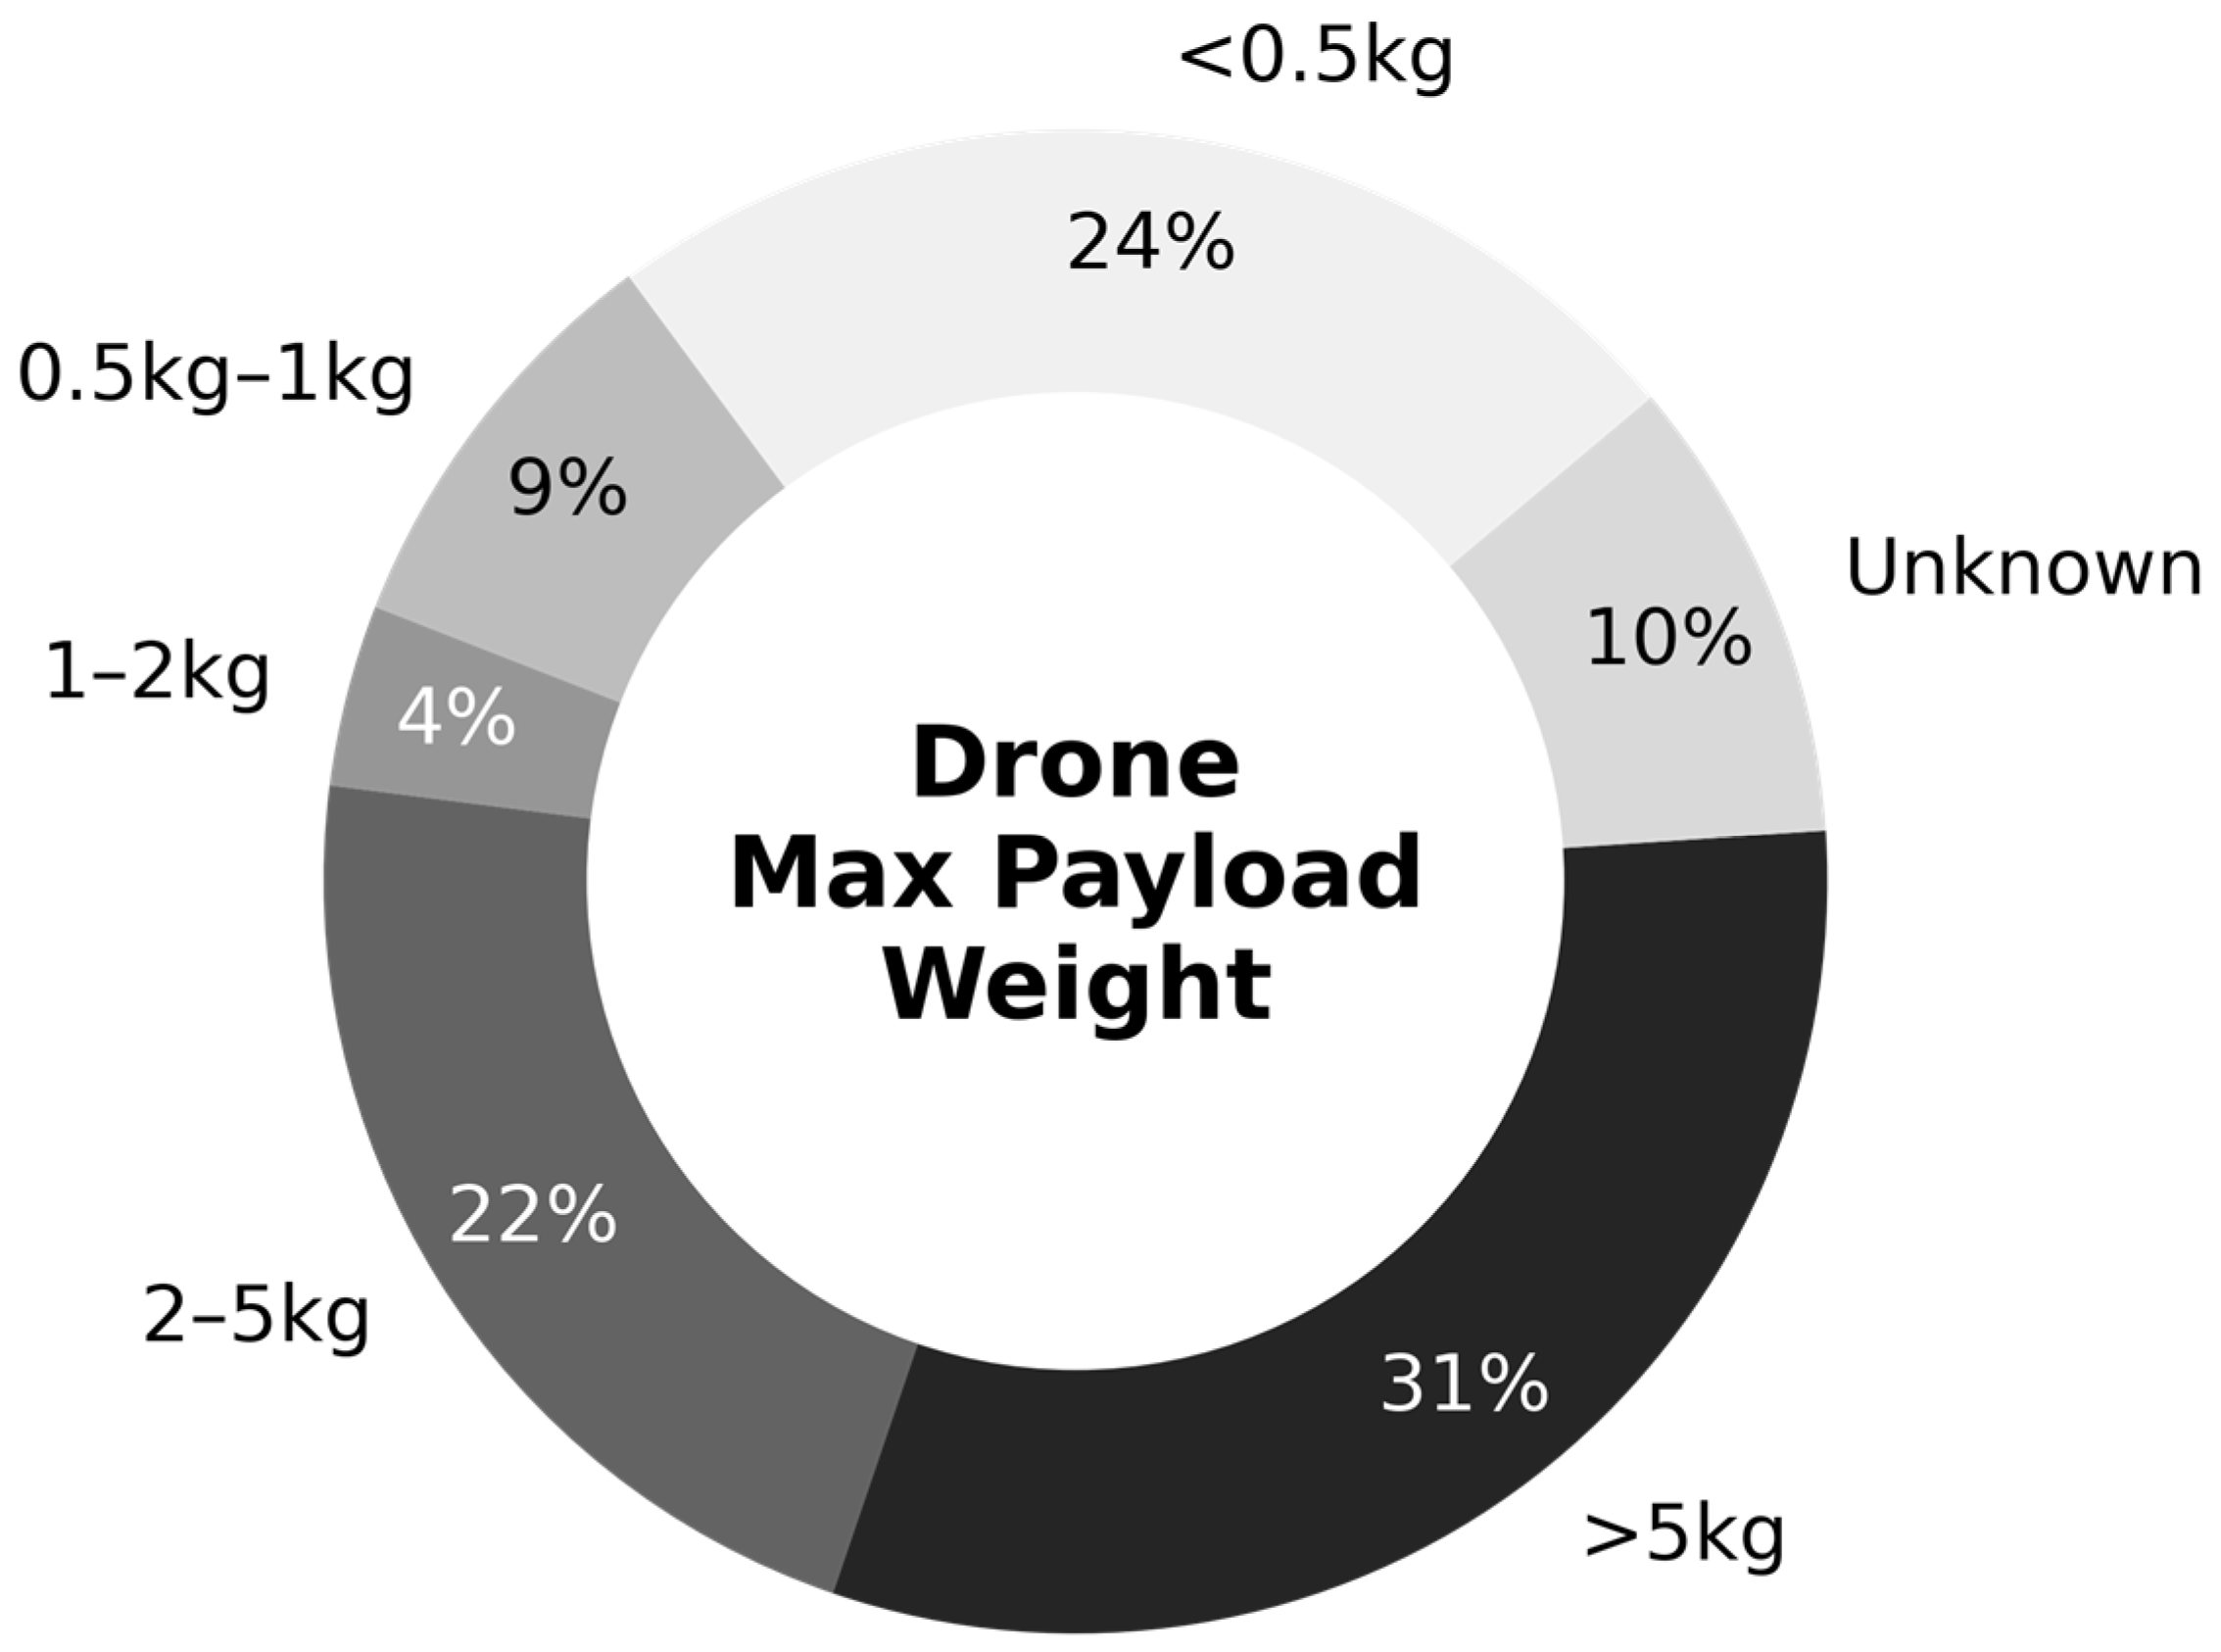
Payload capacity, defined as the maximum weight a drone can carry, was used as a filtering parameter for assessing platform compatibility with sensor payloads. Among 161 drone records with available payload data, models were grouped into five categories (Figure 9): <500 g (25.2%), 500 g–1 kg (8.9%), 1–2 kg (3.9%), 2–5 kg (21.8%), and >5 kg (40.2%). This classification was designed to represent a range of sensor deployment requirements and to align with common operational and regulatory thresholds. These groupings were used in the NDIS staggered decision logic to constrain platform selection based on sensor weight.
The structured RPAS database is used within the NDIS drone-matching module to relate drone specifications to sensor parameters and operational constraints. This association informs deployment planning in both accessible and remote geohazard environments.

2.1.9. Geophysical and Remote Sensing Sensors

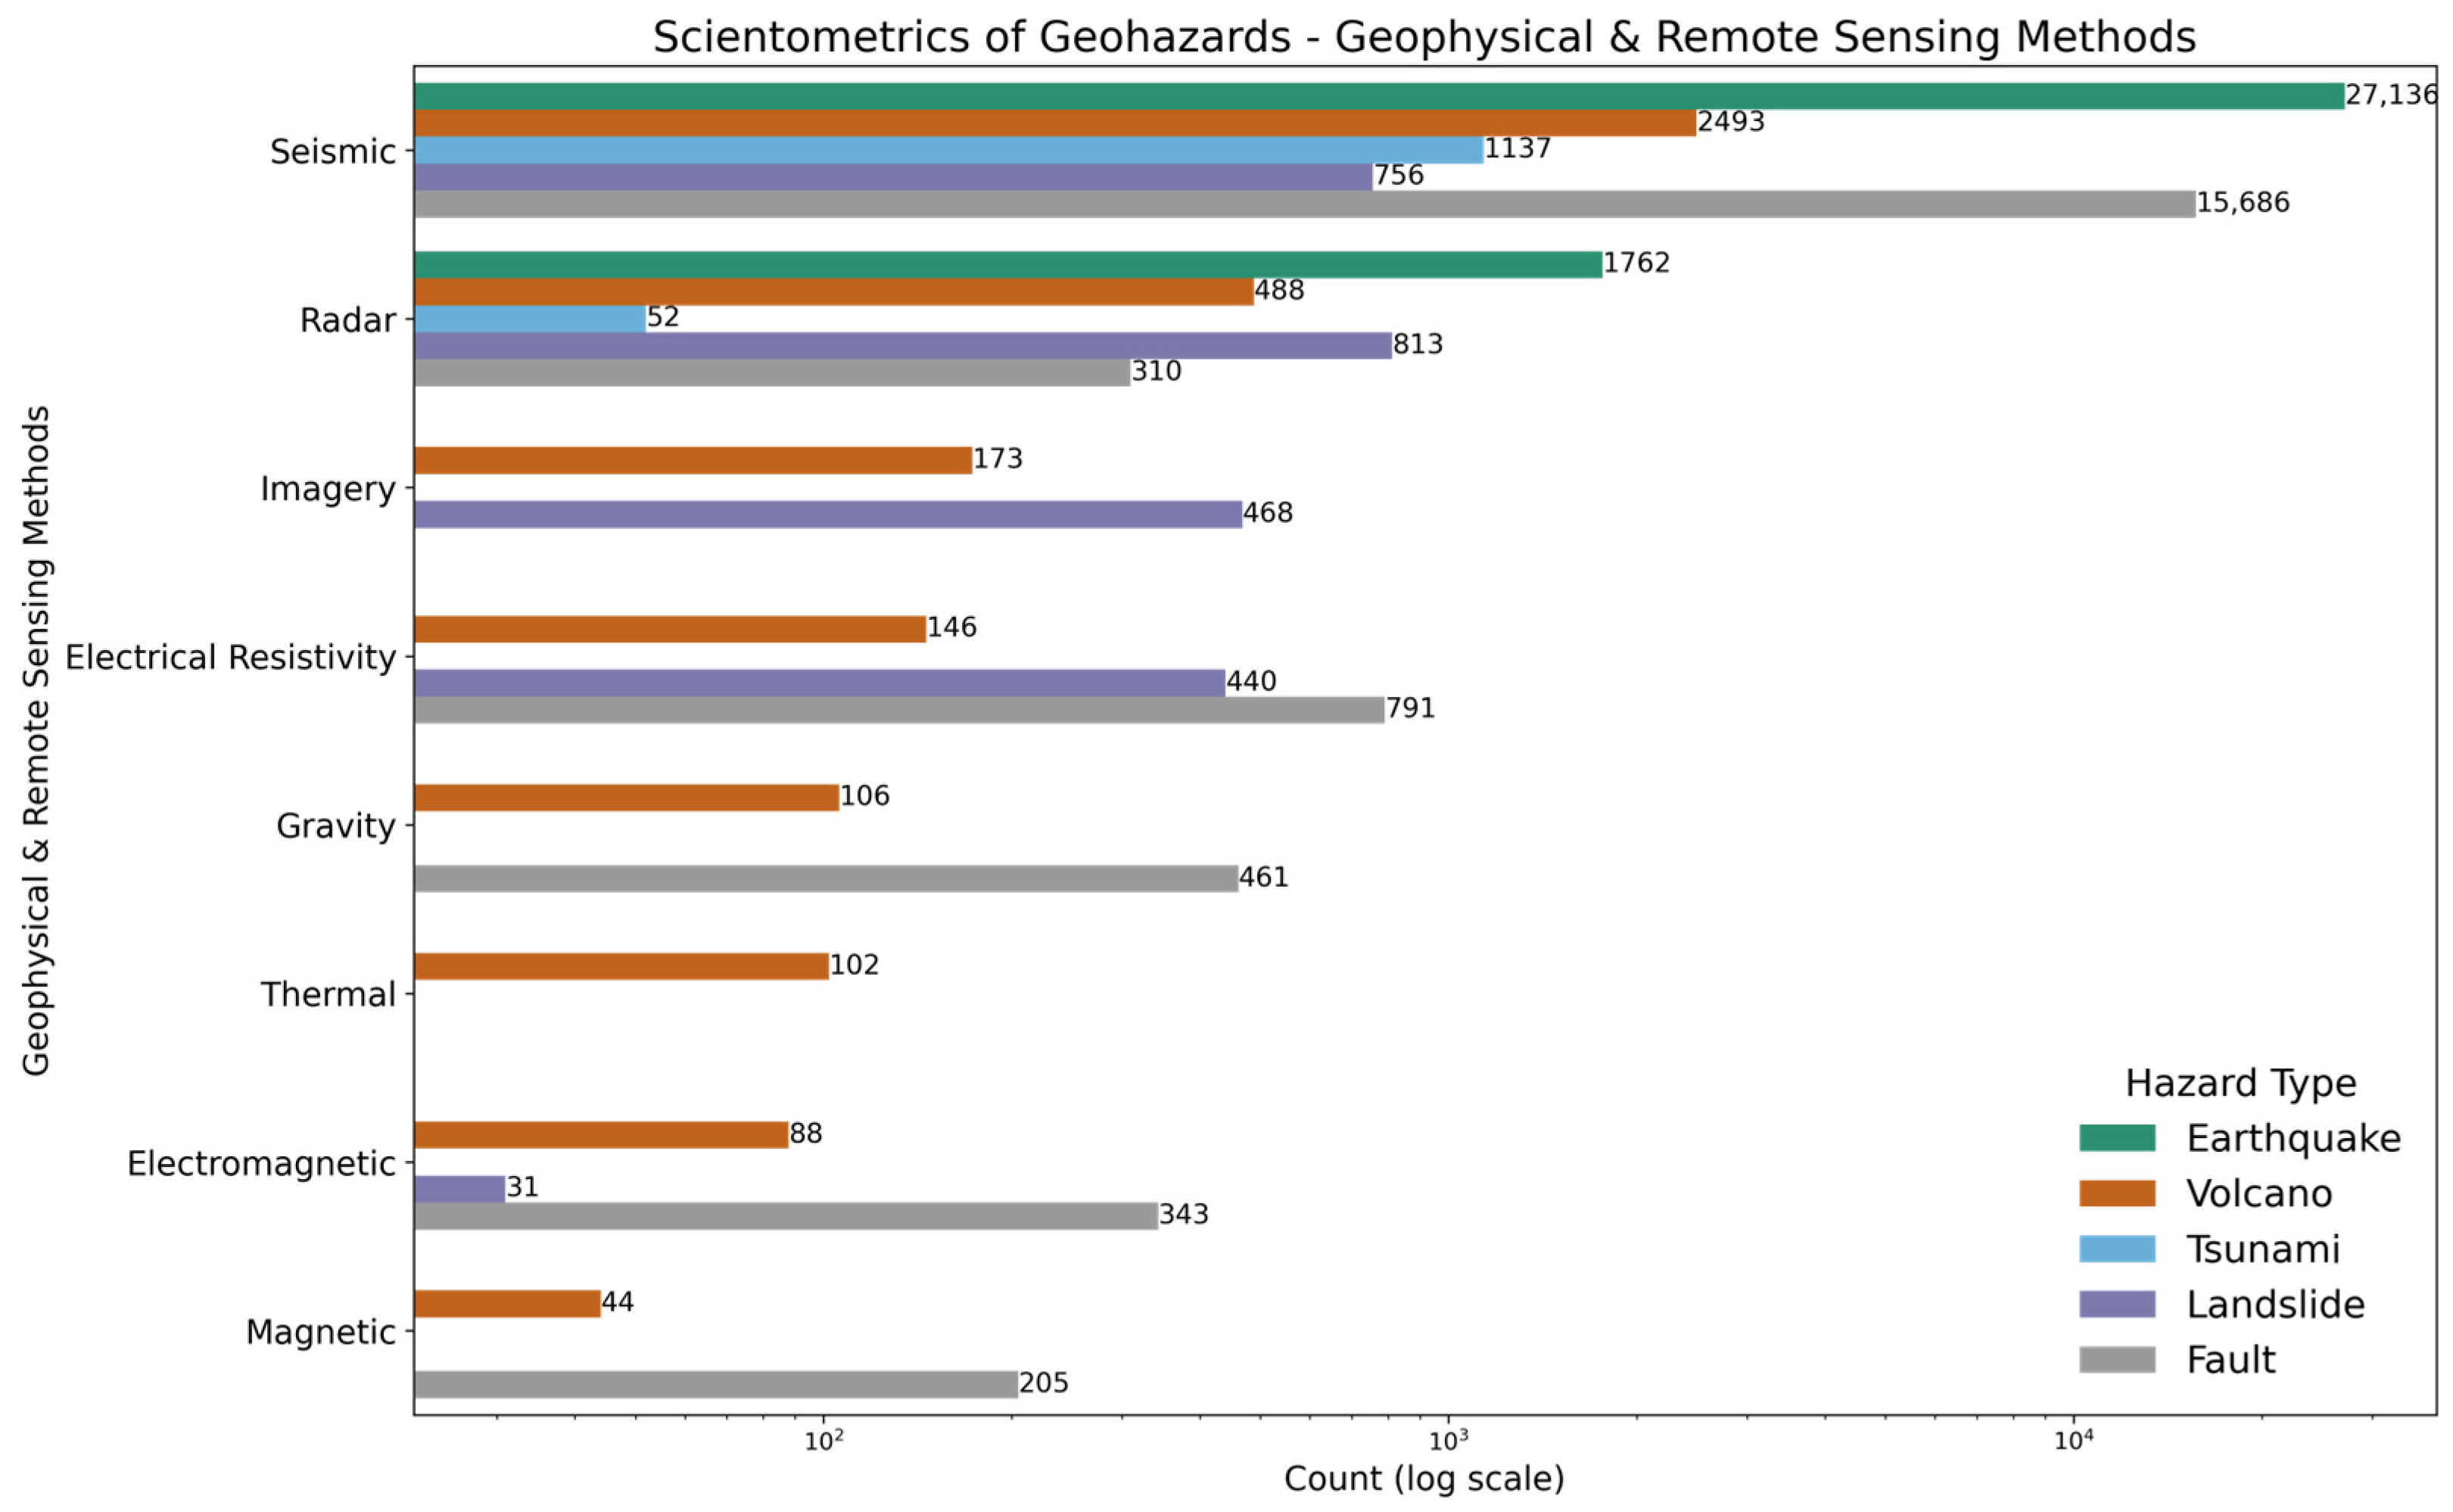
The sensor component of the NDIS database focuses on geophysical and remote sensing methods suitable for deployment with RPAS in geohazard monitoring contexts. To characterize current usage patterns, a literature-based review was conducted using a scientometric approach. Scientometric methods apply quantitative analysis to published literature to identify trends and associations across research domains [49]. In this study, a structured query was implemented via Elsevier’s Engineering Village platform [50], using controlled vocabulary filters related to geohazard types, geophysical methods, and remote sensing technologies. The resulting publication data were used to identify commonly applied sensor types in geohazard monitoring (Figure 10 and to inform the inclusion of representative sensor payloads within the NDIS.
Seismic methods were the most frequently cited in field-based geohazard monitoring, particularly in relation to earthquakes, faults, and landslides. Magnetic and electromagnetic (EM) sensors were also identified, primarily for subsurface investigations in volcanic and landslide-prone areas. Optical and thermal imaging systems were commonly associated with studies of volcanic activity, landslides, and fault zones, where surface-level observations are required. Synthetic aperture radar (SAR) appeared in publications related to ground deformation monitoring, though its application was typically limited to satellite or crewed aircraft platforms due to payload and power constraints.
While drone specifications were not used to guide the scientometric analysis directly, the results were later cross-referenced with the RPAS payload database to ensure that selected sensors were physically deployable via drones.

2.2. Methods

During the development of the NDIS decision engine, four approaches were evaluated to assign drone–sensor combinations for geohazard missions. These include: (i) independent decision tree for sensor and drone selection, (ii) a combined decision tree model, (iii) a random forest classifier trained on joint sensor–drone pairings, and (iv) the final staggered decision method. While the machine learning models (i–iii) yielded high accuracy scores, they were ultimately discarded due to limitations in generalizability, constraint handling, and practical mission planning. The final approach (iv)—a rule-based, modular decision framework—was selected for implementation due to its transparency, compatibility enforcement, and adaptability.
The initial approach (i) used separate decision trees for sensor and drone selection. These models were trained using hazard attributes and equipment specifications, producing interpretable classification outcomes. However, due to the limited variety of available sensors and drones, the models overfitted to dominant classes and failed to generalize. This resulted in repetitive recommendations and implausible pairings, particularly for underrepresented hazard types.
To address these shortcomings, a combined decision tree model (ii) was developed to jointly optimize sensor and drone assignment. While this model introduced payload constraints and distance-based filtering, it still suffered from output rigidity and failed to scale with new equipment entries. Its fixed structure also made it difficult to enforce scenario-adaptive logic or accommodate updates to sensor requirements, making it impractical for operational use.
Approach (iii) trained a random forest classifier on pre-labeled sensor–drone pairs derived from the existing hazard dataset. Although the ensemble model reported high classification accuracy, it exhibited class imbalance, overfitting to frequent pairings such as seismic sensors with long-range drones and lacked constraint awareness for payload compatibility. Despite these limitations, the random forest model served as a valuable diagnostic tool to validate patterns in the deterministic rulebase.
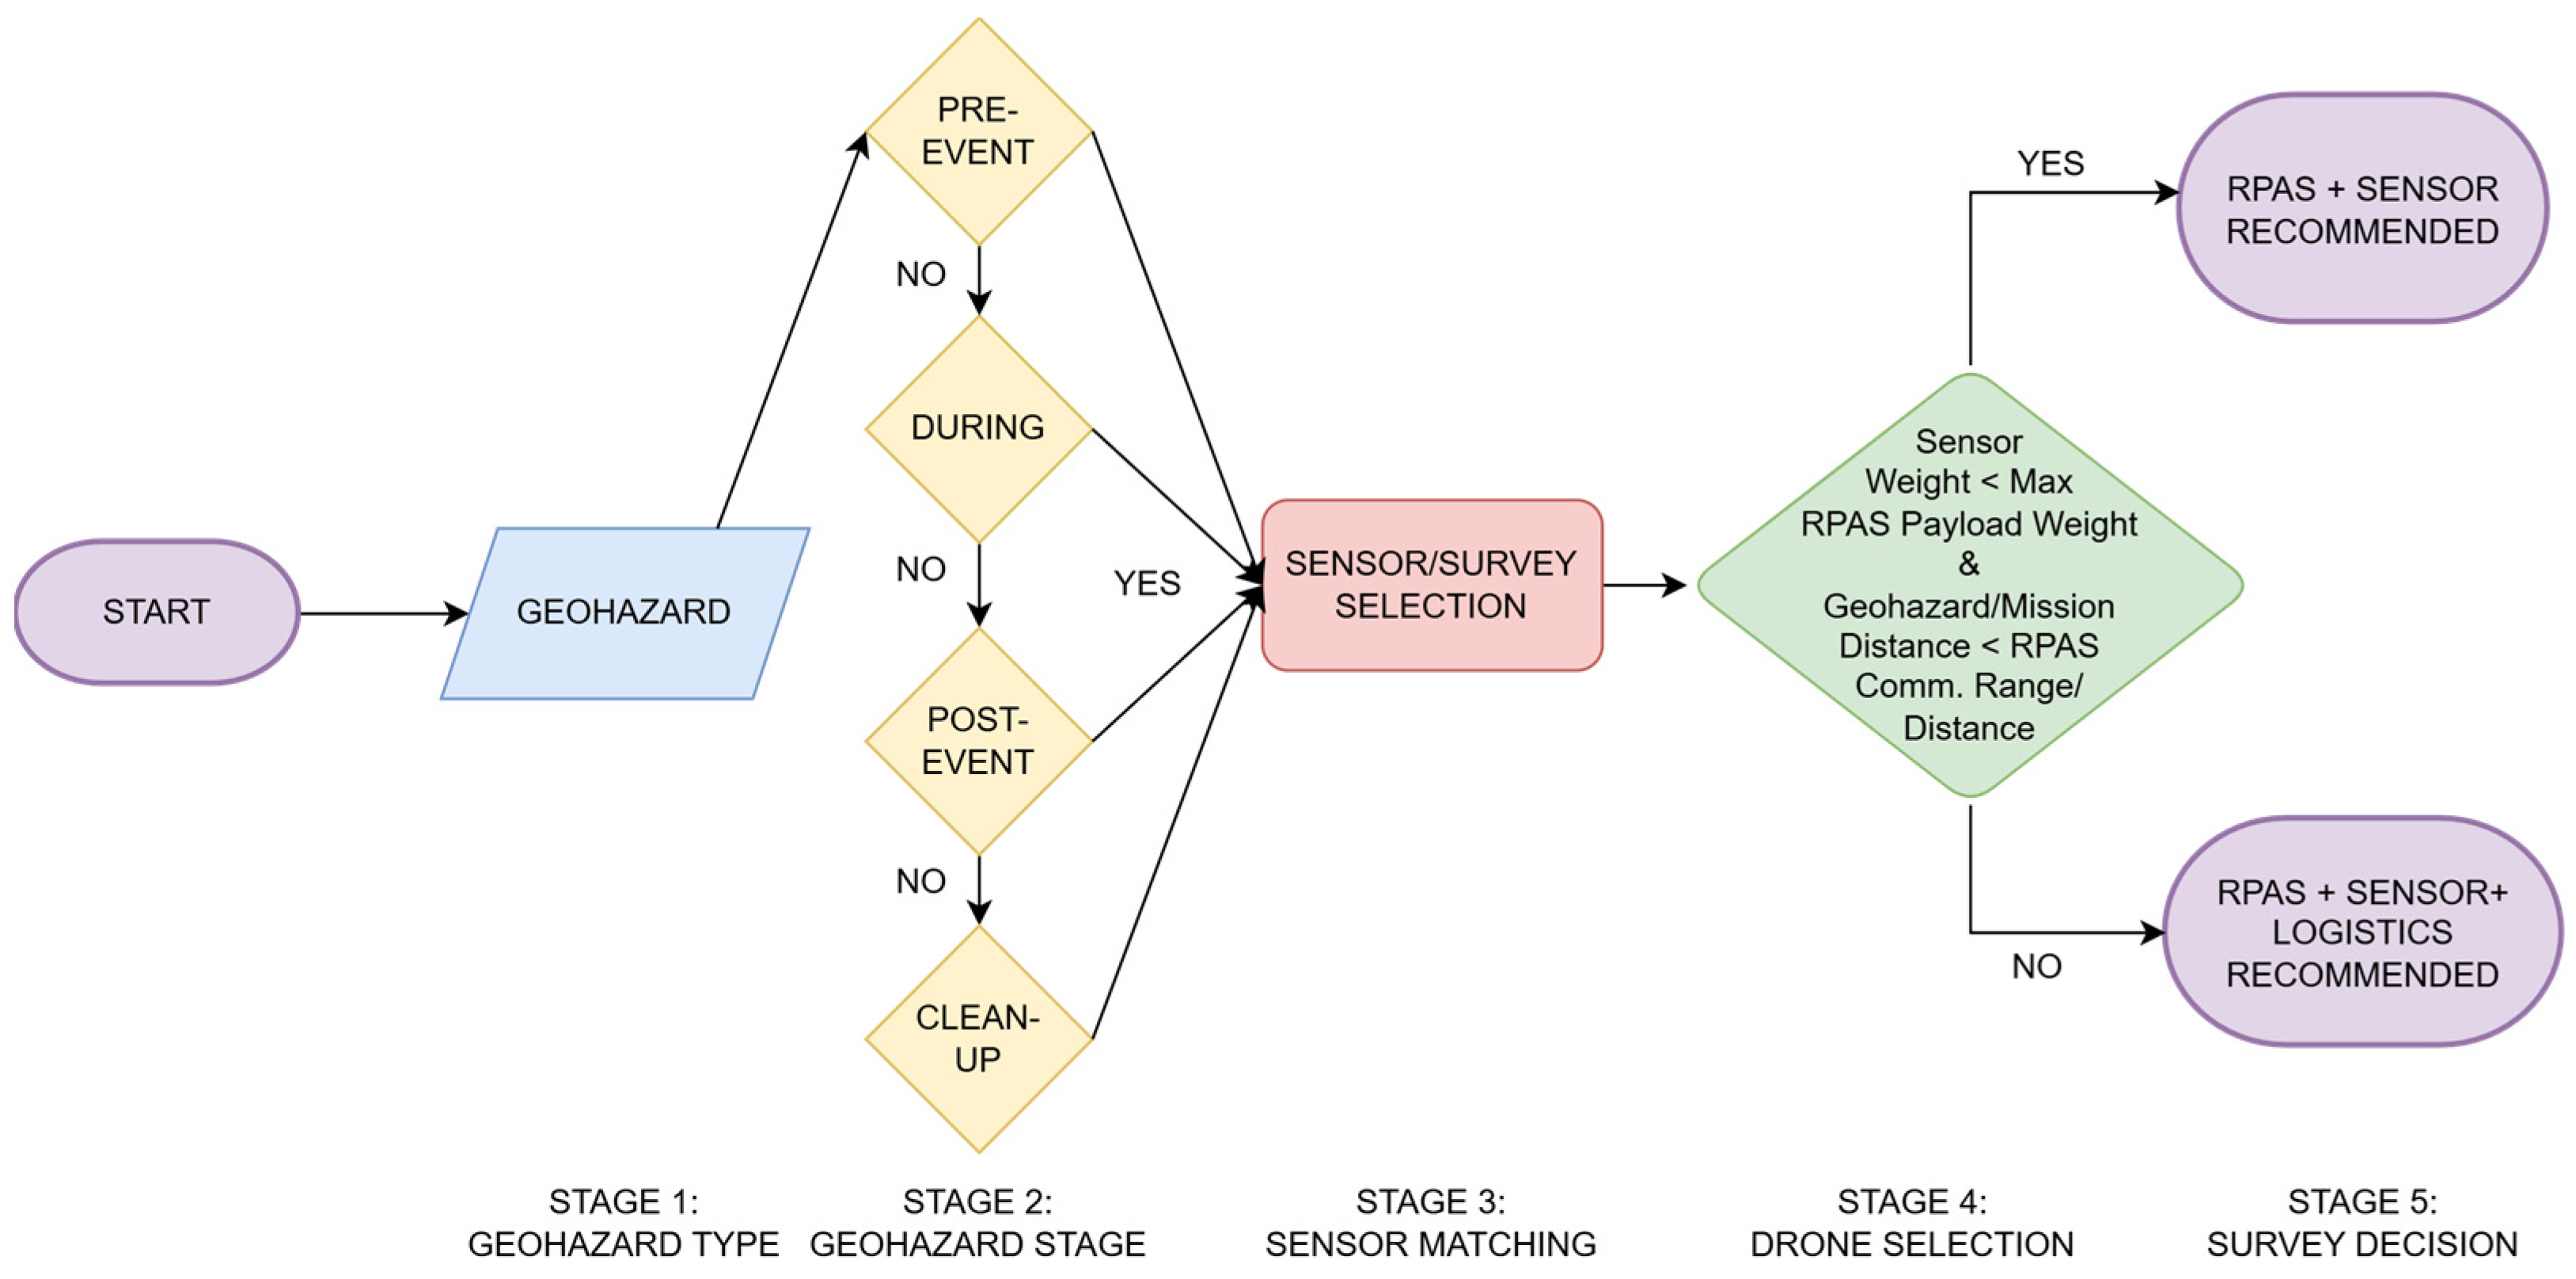
To address the limitations observed in classification models, a structured decision framework (iv) was developed to reflect practical field planning logic. Termed herein as the “Staggered Decision method”, this approach draws conceptually from hierarchical decision-making and operational modularity. Rather than treating drone-sensor selection as a flat classification problem, the staggered method decomposes the decision into ordered stages—mirroring how human operators prioritize requirements under mission constraints. This framework was designed to ensure interpretability, reproducibility, and flexibility in hazard-specific mission planning. The core logic follows a five-step workflow (Figure 11): (1) identification of the hazard type, (2) classification of the disaster phase (pre-event, active, post-event, or clean-up), (3) selection of the appropriate survey method (e.g., mapping, structural integrity, or perimeter monitoring), (4) assignment of the optimal sensor type based on geophysical methods, and (5) matching of a compatible drone platform based on payload, range, and mission constraints (evaluation summary presented in Table 3).
Geohazards differ substantially in their physical characteristics, monitoring needs, and operational constraints. For example, volcanic activity during an eruption may require airborne thermal imaging to monitor vent temperature and ash plumes, while seismic sensors are commonly applied in fault and earthquake monitoring to characterize ground motion and stress conditions. Tsunami assessments frequently involve visual sensors for documenting post-impact conditions, and nuclear sites are typically surveyed using optical sensors at a distance. These variations in monitoring approaches reflect the need for hazard-specific decision logic, which may not be effectively represented by a single model or fixed rule base.
Table 4 which identified commonly reported sensor–hazard associations in the geohazard monitoring literature. Radar-based sensors mentioned in the reviewed publications were substituted with LiDAR in the current implementation to align with payload constraints and drone compatibility. Seismic sensors were typically associated with pre-event monitoring of earthquakes and faults, while LiDAR appeared more frequently in post-disaster applications involving surface or structural assessment. Table 4 presents the resulting sensor–hazard mapping used to guide subsequent stages of sensor and drone selection.
While gamma-ray spectrometry was included for nuclear post-event and clean-up stages due to its relevance in radiation detection, other specialized sensors—such as spectrometers and electromagnetic (EM) instruments—were not incorporated in the current system design, as these are more commonly deployed in geological or mineral surveys rather than time-sensitive RPAS-based hazard response [51,52]. Nonetheless, adding new sensors can easily be accomplished if sufficient examples have been reviewed and added to the database.
The staggered decision framework was implemented through a rule-based pipeline by assigning a top-three sensor list to each geohazard point, based on hazard type and disaster phase as defined in Table 4). Each sensor is then evaluated against the target area using predefined area templates and line spacing assumptions to estimate the required flight path length. For example, sensors like “LiDAR” or “Magnetometers” follow a line-grid coverage model where spacing is used to compute flight paths (e.g., number of swaths × area length), while seismic or BPR surveys simply match the point-to-point hazard distance. These computed distances are then compared against drone endurance and payload capacities.
Drone selection is conducted using a weighted scoring system that balances proximity (by distance binning), payload feasibility, overkill penalty (excess payload capacity), and tight-fit bonuses (minimal excess). A fallback mechanism ensures that even when no ideal drone is found, a deployable alternative is chosen from the closest available match in a flexible threshold bin. Distance and communication range constraints are dynamically adjusted depending on sensor type. For instance, “Seismic” requires communication bin matching, while “Camera” is exempt from payload thresholds as it is low-weight and a valuable addition to any mission.
The staggered decision method was implemented to enable modular updates and constraint-aware logic without requiring model retraining. Each stage of the rule base—such as sensor thresholds or platform specifications—can be independently adjusted as new data become available. Operational parameters including payload capacity, communication range, and fallback logic are directly encoded to support consistent filtering across diverse mission contexts.
The method produces outputs based on explicit rules, which facilitates interpretability and supports downstream processes such as Critical Path Method (CPM) scheduling and urgency scoring. It remains adaptable to revisions in hazard datasets and sensor inventories, while maintaining consistency through a predefined structure.
To address development considerations in the system design, the method was structured around four objectives: generalizability across hazard types and platforms; customizability for different operational phases; optimizability within mission constraints; and compatibility with validation needs. To support ongoing refinement, a contribution module allows users to provide or review hazard records, which are subject to verification prior to integration. The rule-based design is consistent with established practices in multi-criteria decision analysis (MCDA) and spatial decision support systems (SDSS) [53,54].

3. Results

This section demonstrates the implementation outcomes and examples of the NDIS framework. It highlights both outputs from the backend logic and deployment insights relevant to operational readiness and real-world use scenarios.

3.1. System Implementation and Deployment

The final version of the NDIS was deployed as a browser-accessible geospatial application. This version integrates a frontend interface developed using ArcGIS Experience Builder (ArcGIS Online, 2025 cloud-hosted release) with a backend inference engine implemented in FastAPI, a Python framework designed for building web-based application programming interfaces (APIs). An API refers to a structured set of rules that allows different software components to communicate—here, enabling the frontend to request and receive mission recommendations from the backend in real time.
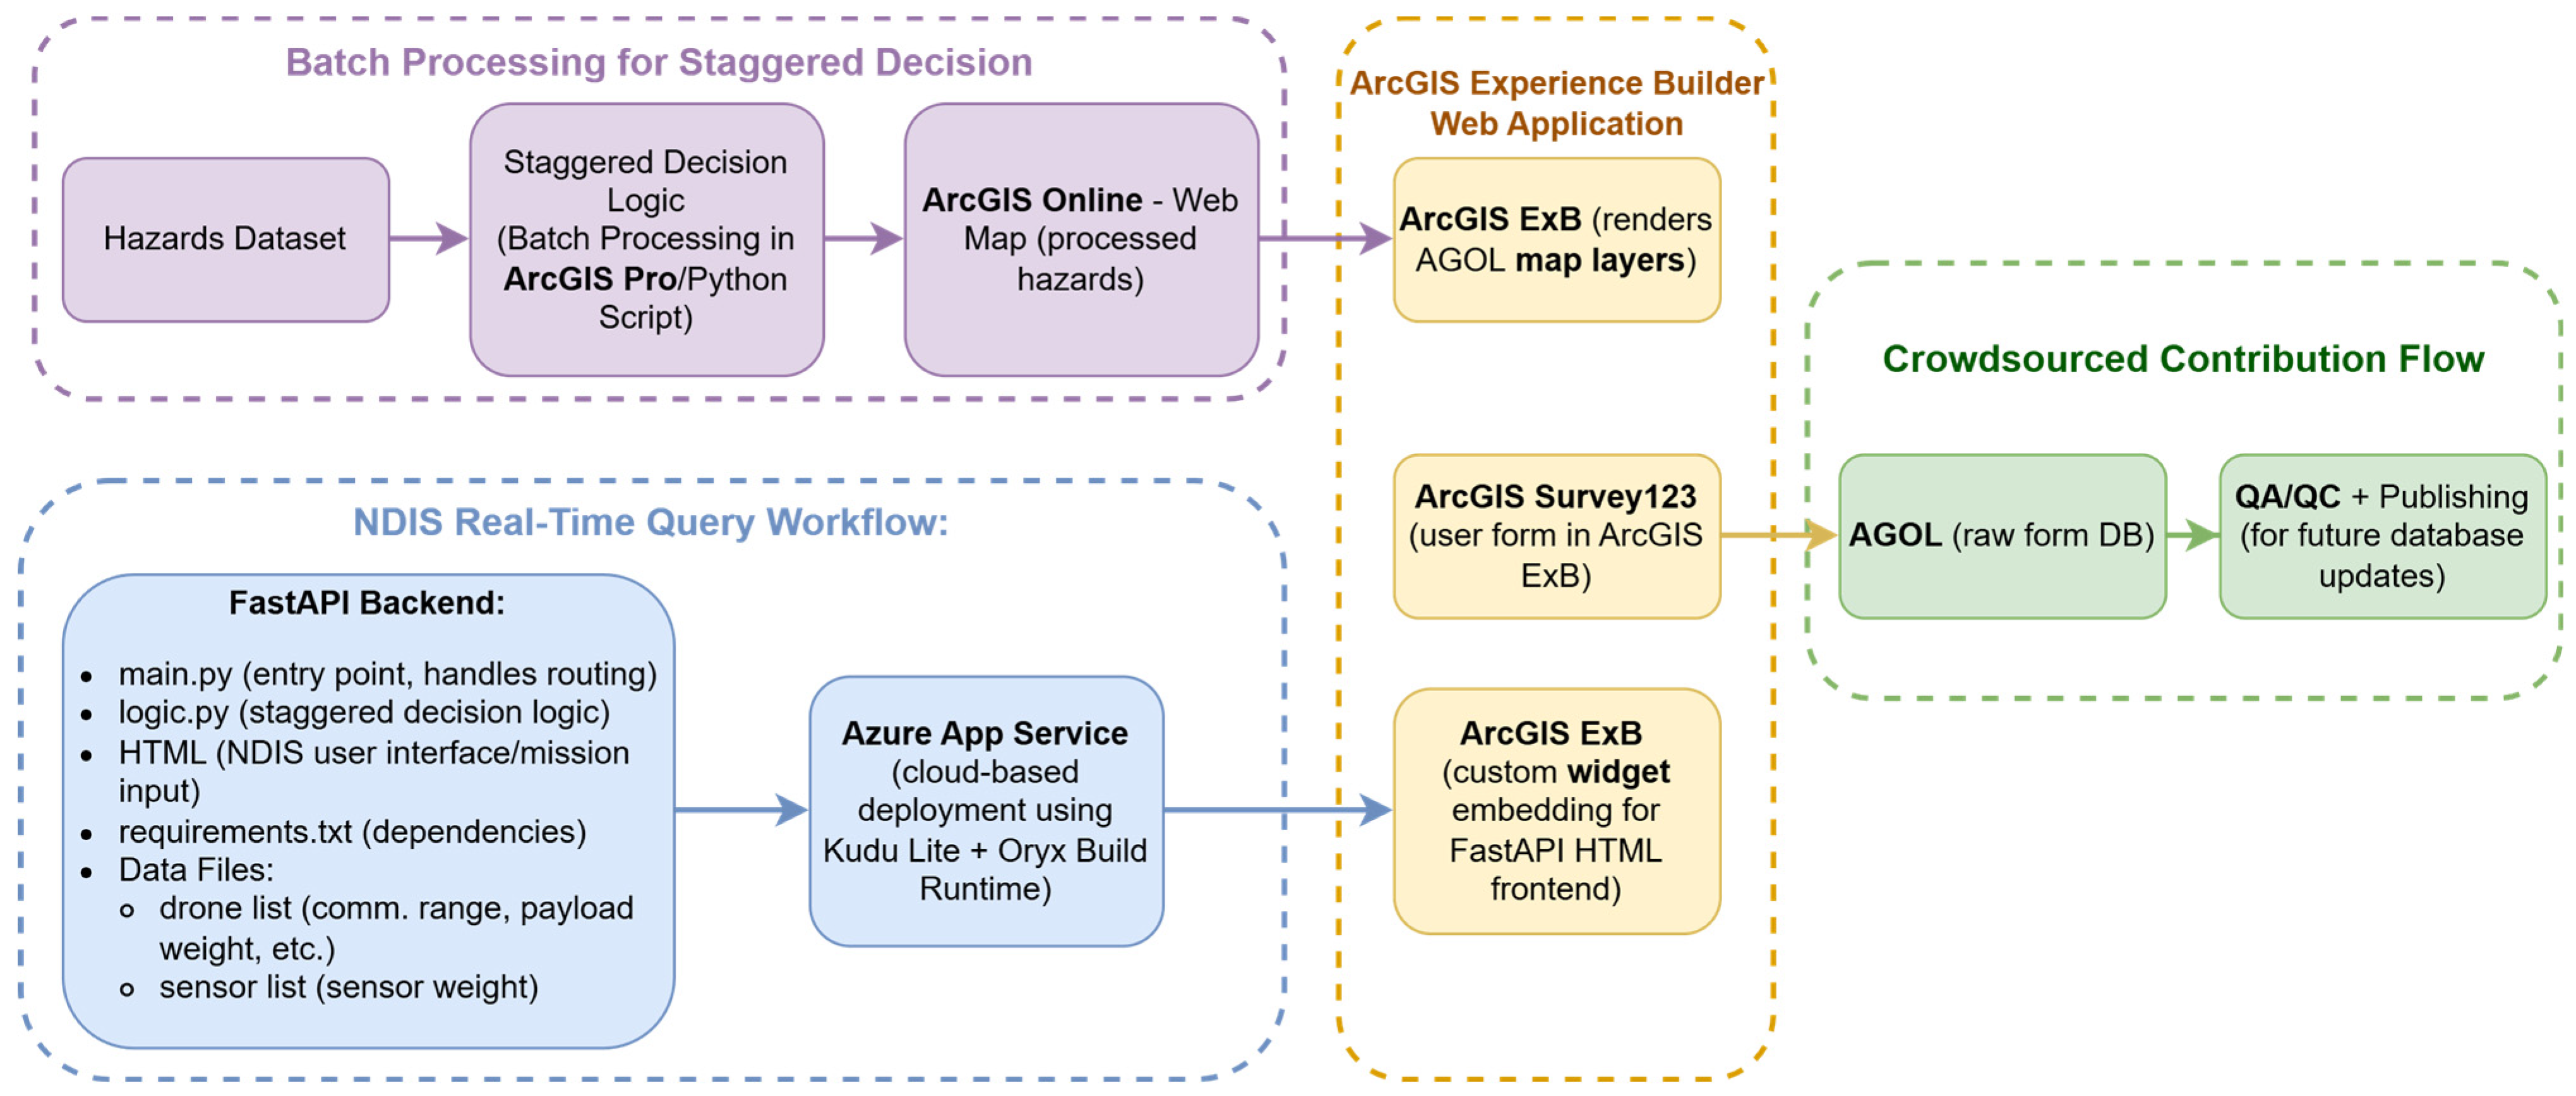
The NDIS integrates three main data flows (Figure 12) to support both automated and user-driven mission planning. In the first flow (purple box in Figure 12), preprocessed geohazard records are evaluated using the staggered decision logic, with the resulting mission recommendations published as feature layers in ArcGIS Online and visualized in the ArcGIS Experience Builder (ExB) frontend. The second flow (blue box in Figure 12) enables user-defined mission planning in real time. This interactive component is powered by a FastAPI backend hosted on Microsoft Azure App Service (Python 3.10 runtime stack), using Oryx to automatically configure the Python runtime environment during deployment.
The backend includes the main application script (main.py), the core decision logic (logic.py), and supporting files such as the sensor and drone databases. These components are connected to a lightweight HTML interface embedded within ExB via a custom widget, enabling users to input coordinates and mission parameters directly through the frontend. A third flow (green box in Figure 12) supports crowdsourced data contributions. User-submitted hazard reports entered via ArcGIS Survey123 are stored in ArcGIS Online, reviewed for quality control, and optionally incorporated into the geohazard dataset for future mission planning. Together, these flows form a closed-loop system (yellow box in Figure 12) in a web application format that combines backend automation with user input and validation.

3.1.1. Deployment Procedure

The backend was deployed to Azure App Service, a lightweight cloud-based platform provided by Microsoft that enables Python-based web applications to be hosted without server maintenance. Deployment was developed for a Linux-based environment managed via KuduLite, a simplified container designed specifically for resource-constrained hosting. The application files were first compressed into a ZIP archive and uploaded through Azure’s Deployment Center, which handles the unpacking and environment setup.
To enable reproducibility, version control, and incremental updates, the backend folder was linked to a GitHub repository. This repository functions as both an archival record and the source for the backend logic, allowing others to examine the implementation and, if needed, replicate or adapt the system. The repository includes logic.py, main.py, configuration templates, and dependency files. Large datasets, including the geohazard and RPAS databases, are not included due to file size limitations and hosting constraints.
In addition, a Continuous Integration and Continuous Deployment (CI/CD) pipeline was configured using GitHub Actions. CI/CD is an automation process that ensures any new update (such as debugging/code corrections or logic enhancements) pushed to the GitHub repository is automatically detected by Azure, built, and redeployed without manual intervention. This mechanism reduces human error, accelerates iteration cycles, and preserves consistency across development environments.

3.1.2. System Integration

Once deployed e.g., at https://ndisv3-cmcpgaembbcafpby.canadacentral-01.azurewebsites.net/ (accessed on 16 October 2025), the FastAPI endpoint was integrated into the ArcGIS Experience Builder frontend through a custom widget. This widget allows end-users to interact with the system by either clicking directly on the map or entering location coordinates and mission parameters via form inputs. These inputs are transmitted to the backend, which processes them using the encoded logic and returns recommended sensors, drone configurations, and associated parameters, which are displayed to the user through the interface. This integration allows the NDIS to function as a lightweight, modular Software-as-a-Service (SaaS) platform.

3.2. Web Application Capabilities

The Natural Disaster Information System (NDIS) web application was developed to operationalize the mission planning logic described in this paper. It provides an interactive, map-based interface for exploring historical geohazard records, retrieving precomputed recommendations, and simulating user-defined drone–sensor missions. The application is publicly accessible at: https://experience.arcgis.com/experience/0f4b603be71d4039bda2fe92541422a6 (accessed on 16 October 2025).
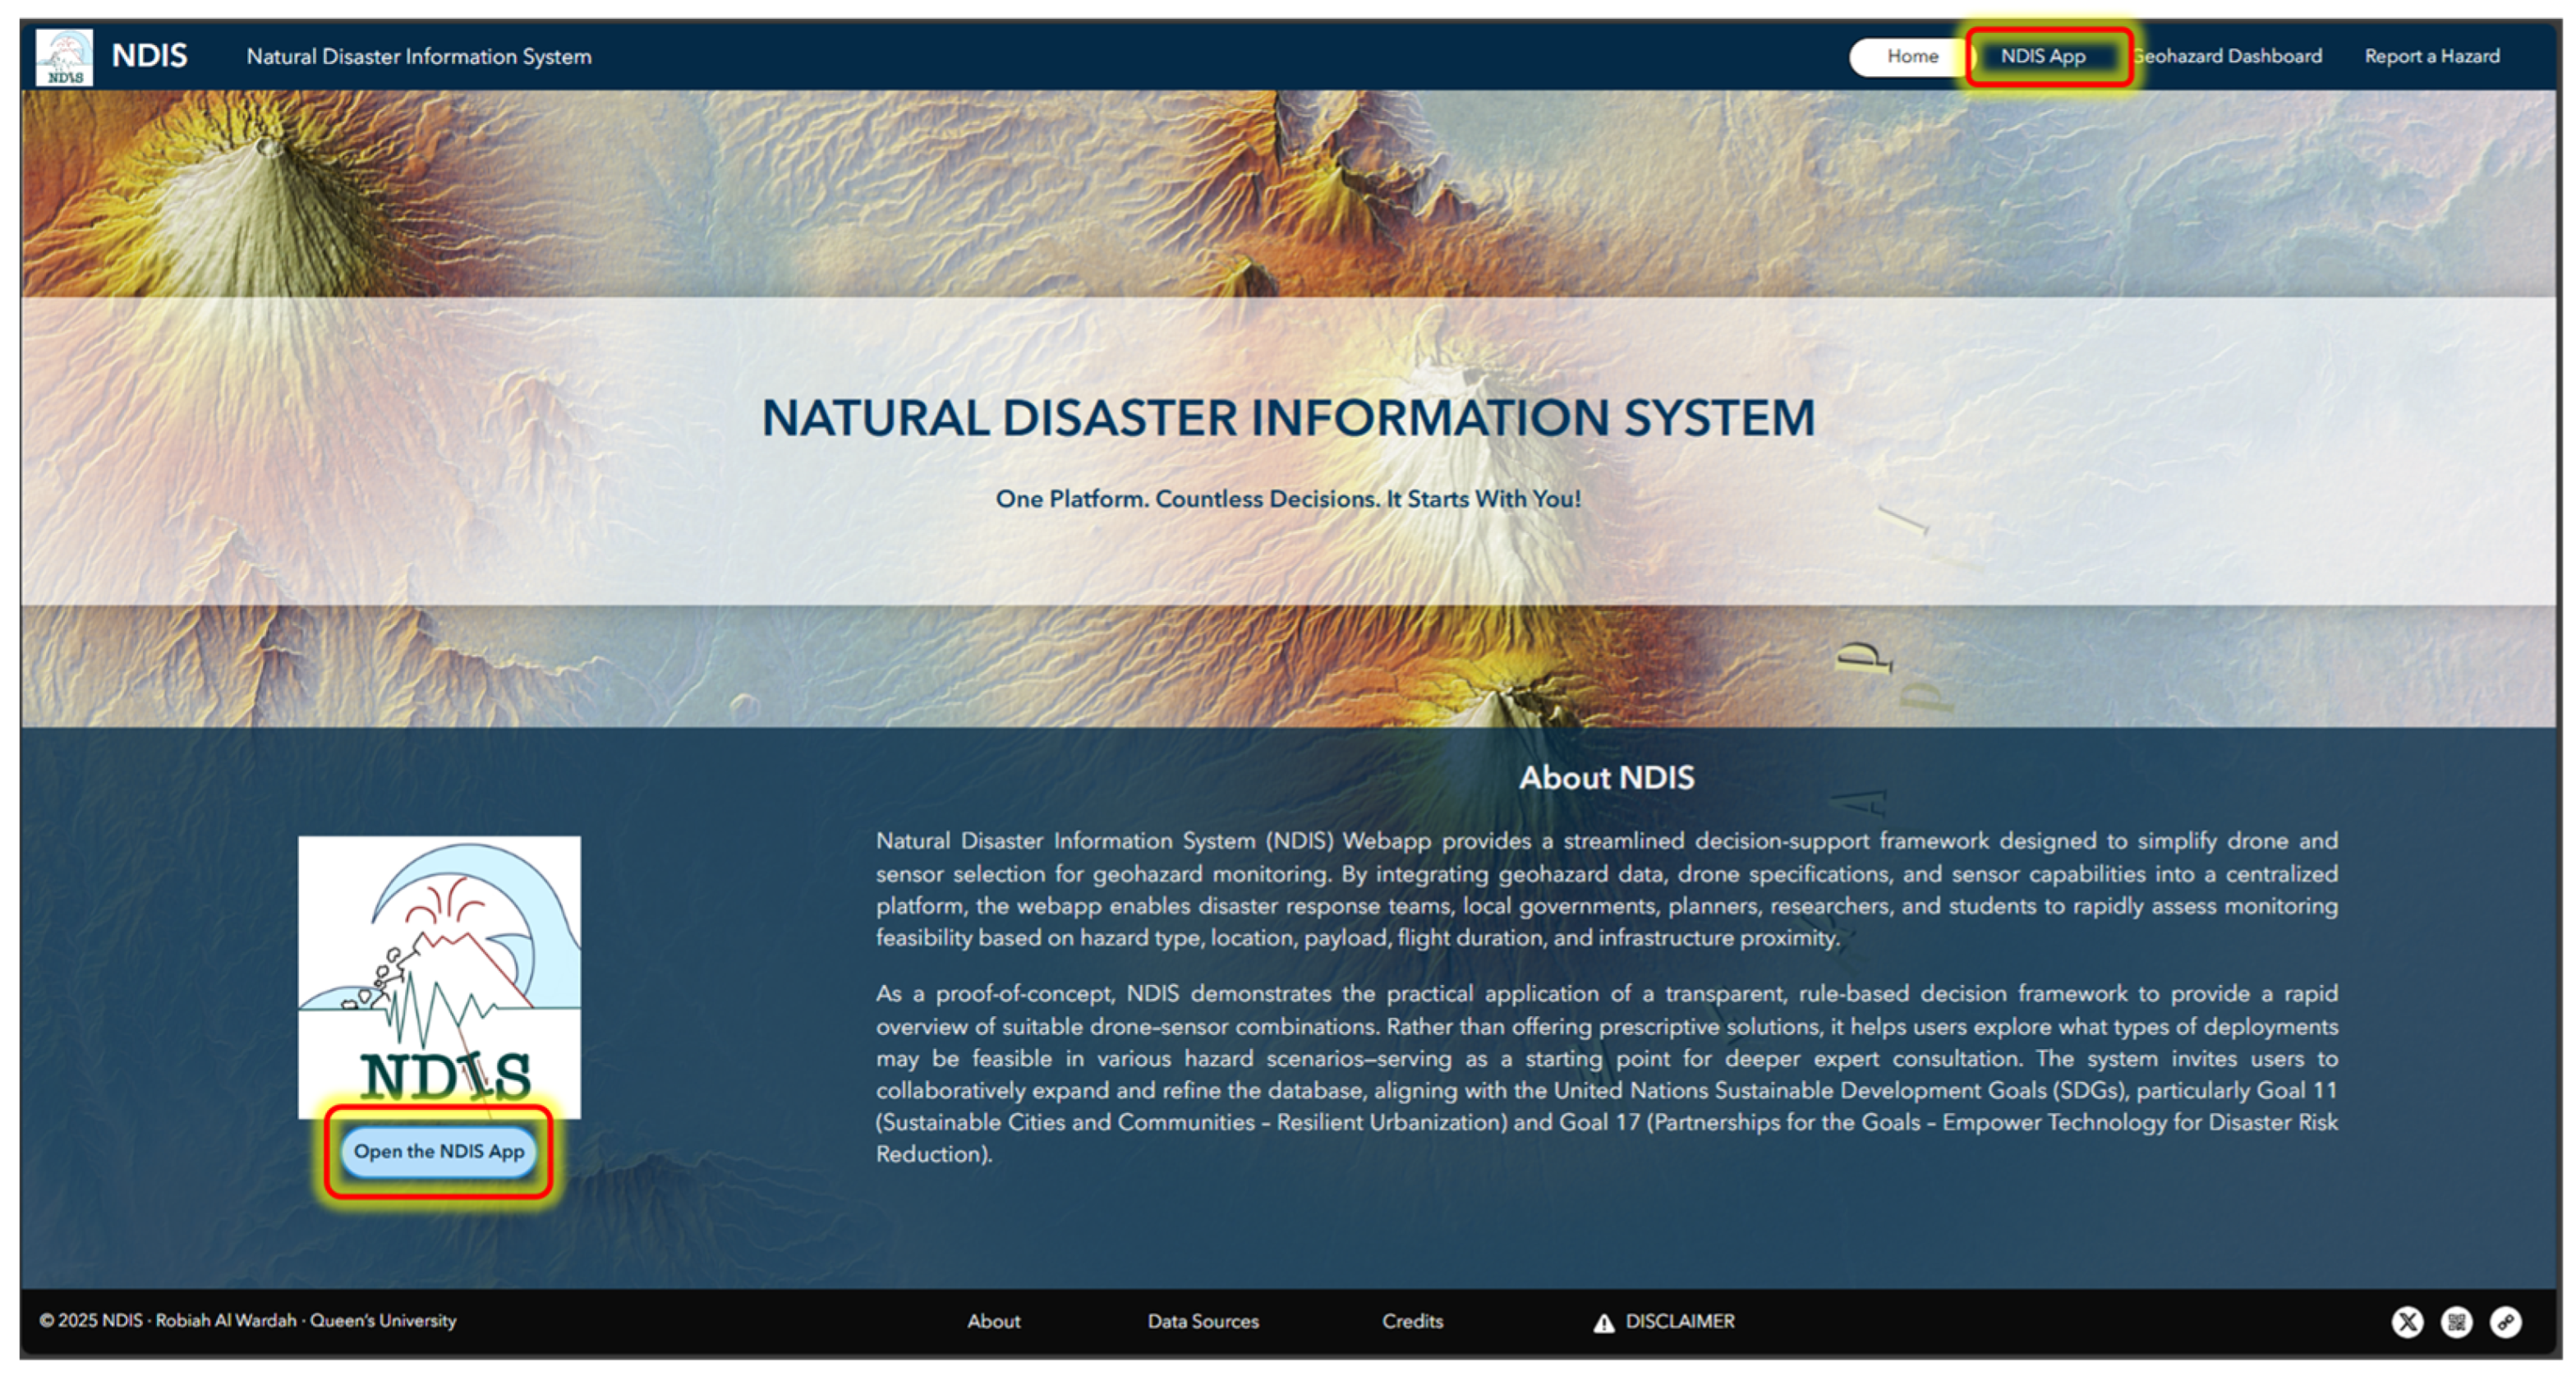
The interface is organized into four sequentially structured pages. The first page (Figure 13) serves as a static landing page introducing the NDIS framework, its intended use, and access instructions. From this page, users can select the “NDIS App” tab or click the icon beneath the NDIS logo to open the main interactive interface.
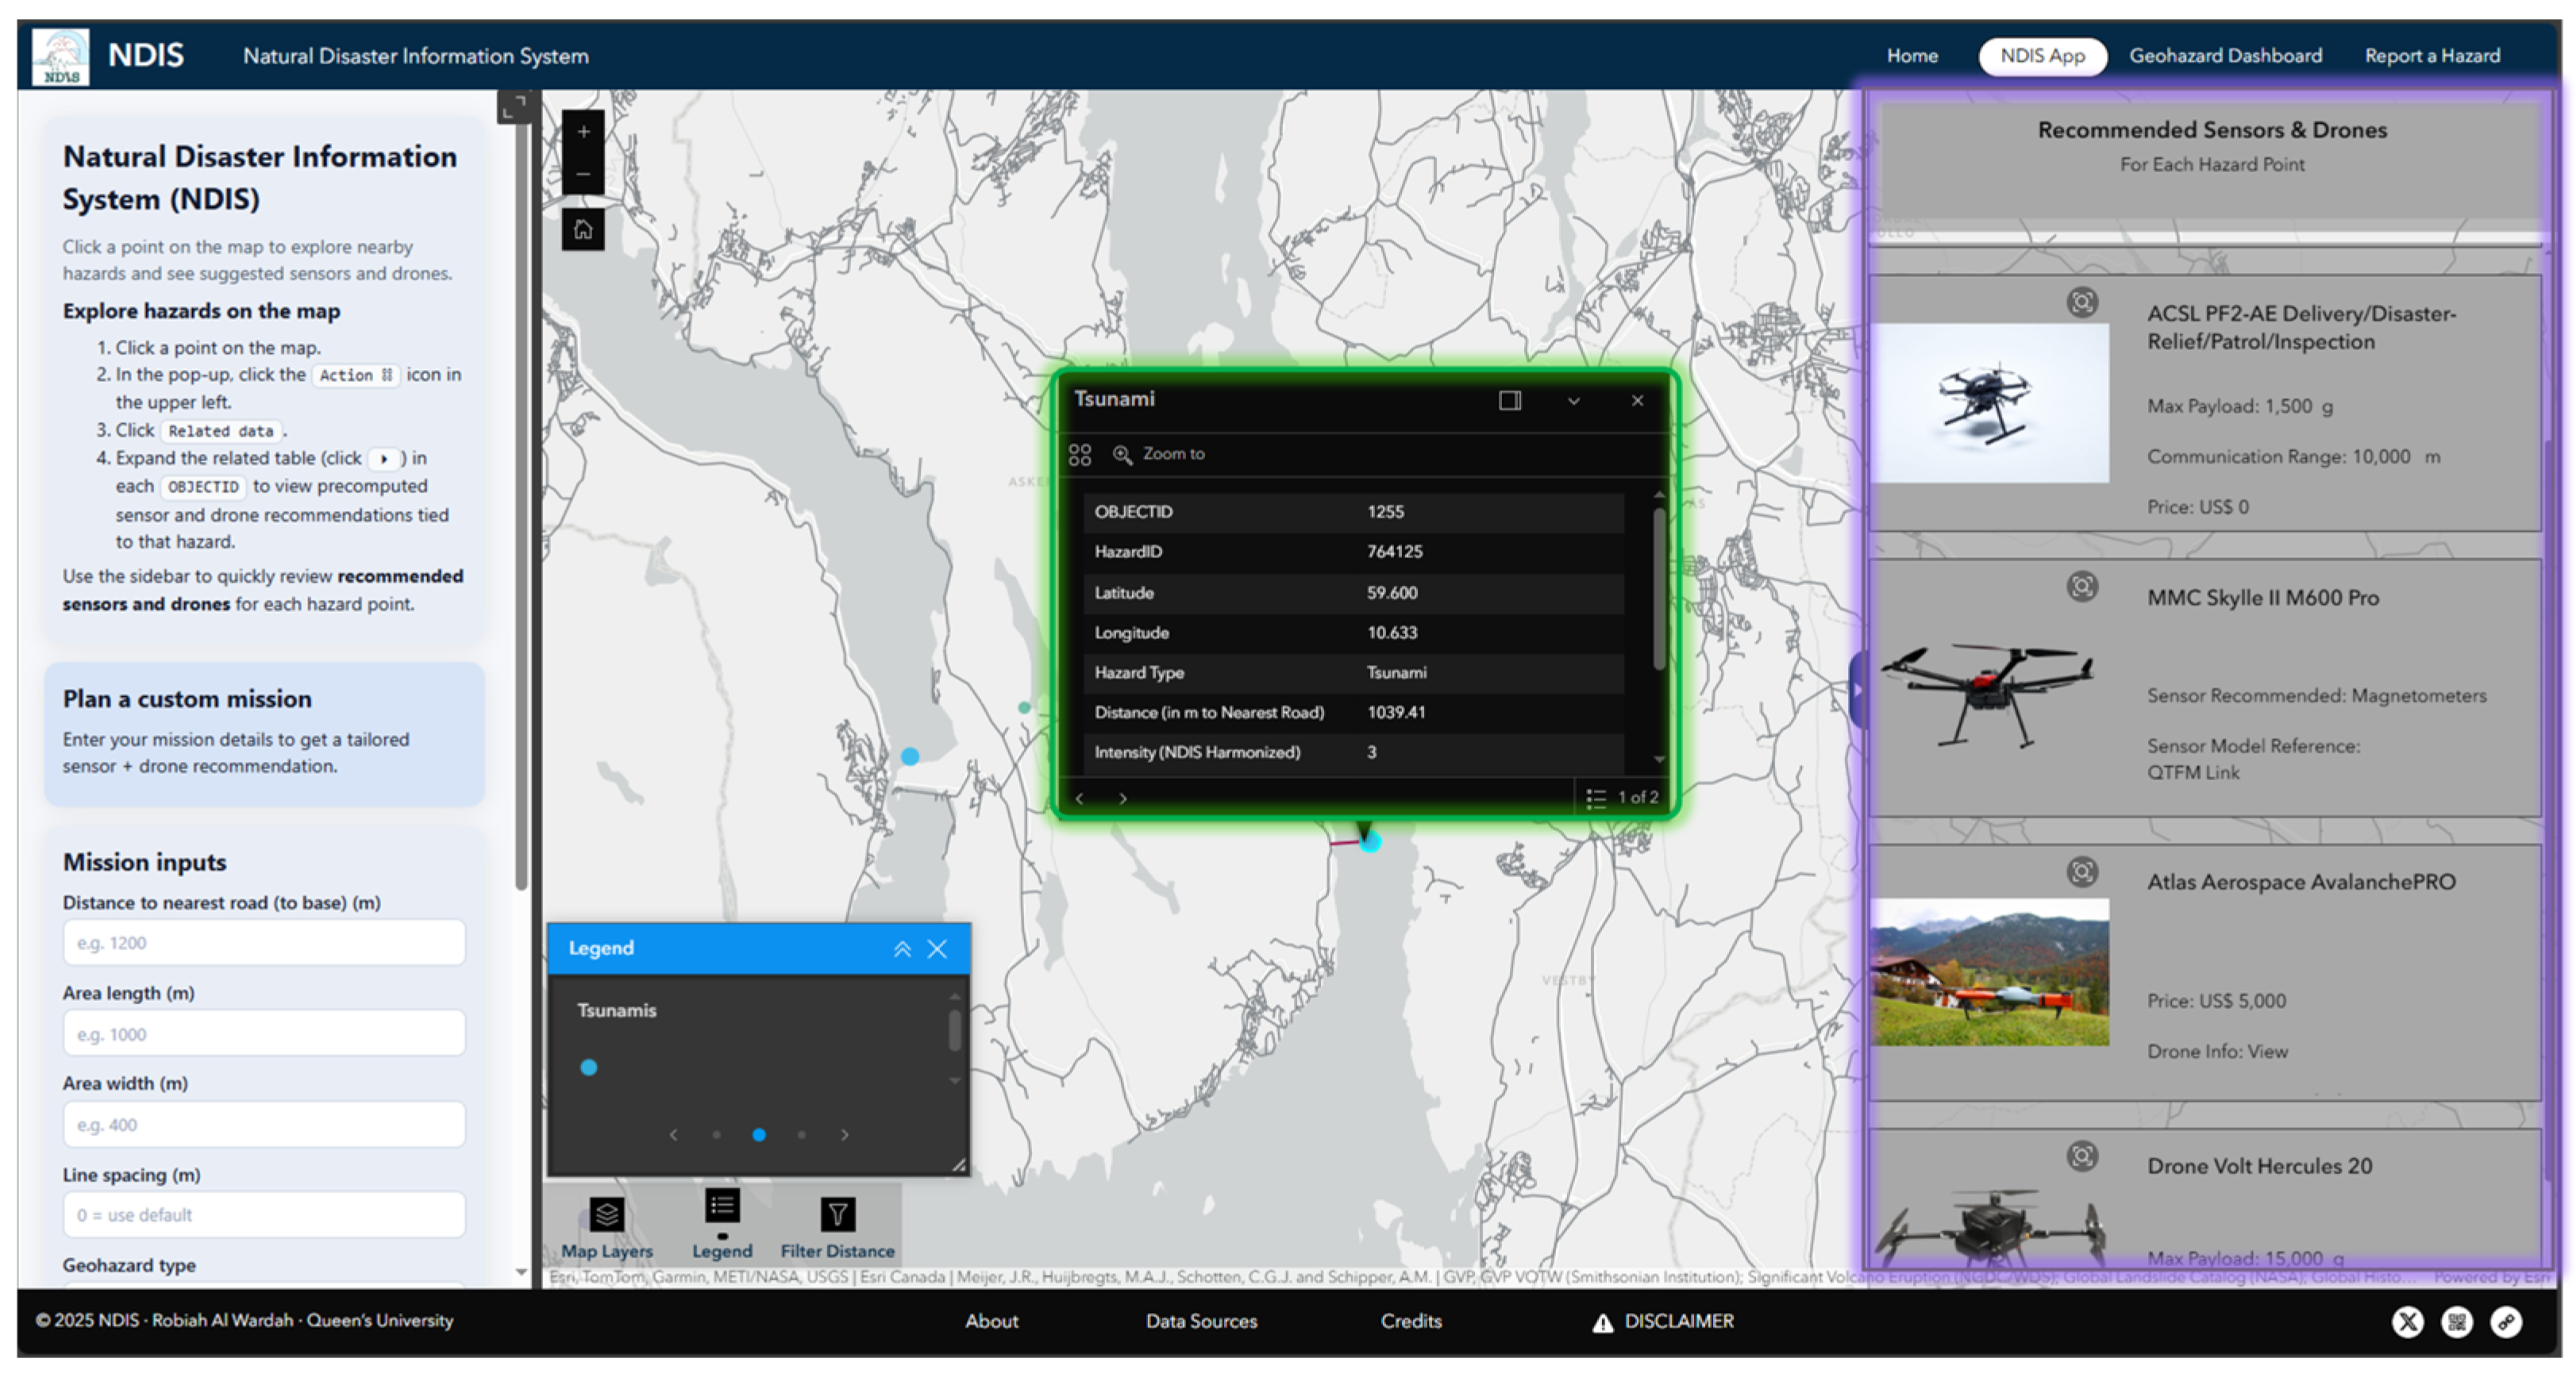
The second page (Figure 14) provides the primary platform for mission planning. The right-hand side of the page displays geohazard points, each linked to preprocessed drone–sensor combinations. Selecting a point triggers a pop-up window (green box) containing mission-specific attributes, including hazard intensity, estimated economic loss, population exposure within a 30 km buffer, and distance to the nearest road. A legend menu on the left side of the map provides symbology references for easier interpretation. In the example shown in Figure 14, a tsunami event near Edvard Munch’s villa, approximately 34 km south of Oslo, Norway, displays a distance of approximately 1 km to the nearest road. The system subsequently recommends multirotor platforms (on a sidebar in purple box in Figure 14) suitable for short-range missions that require high maneuverability. The sidebar, which also displays default platform recommendations when no point is selected, includes drone specifications and paired sensor details.
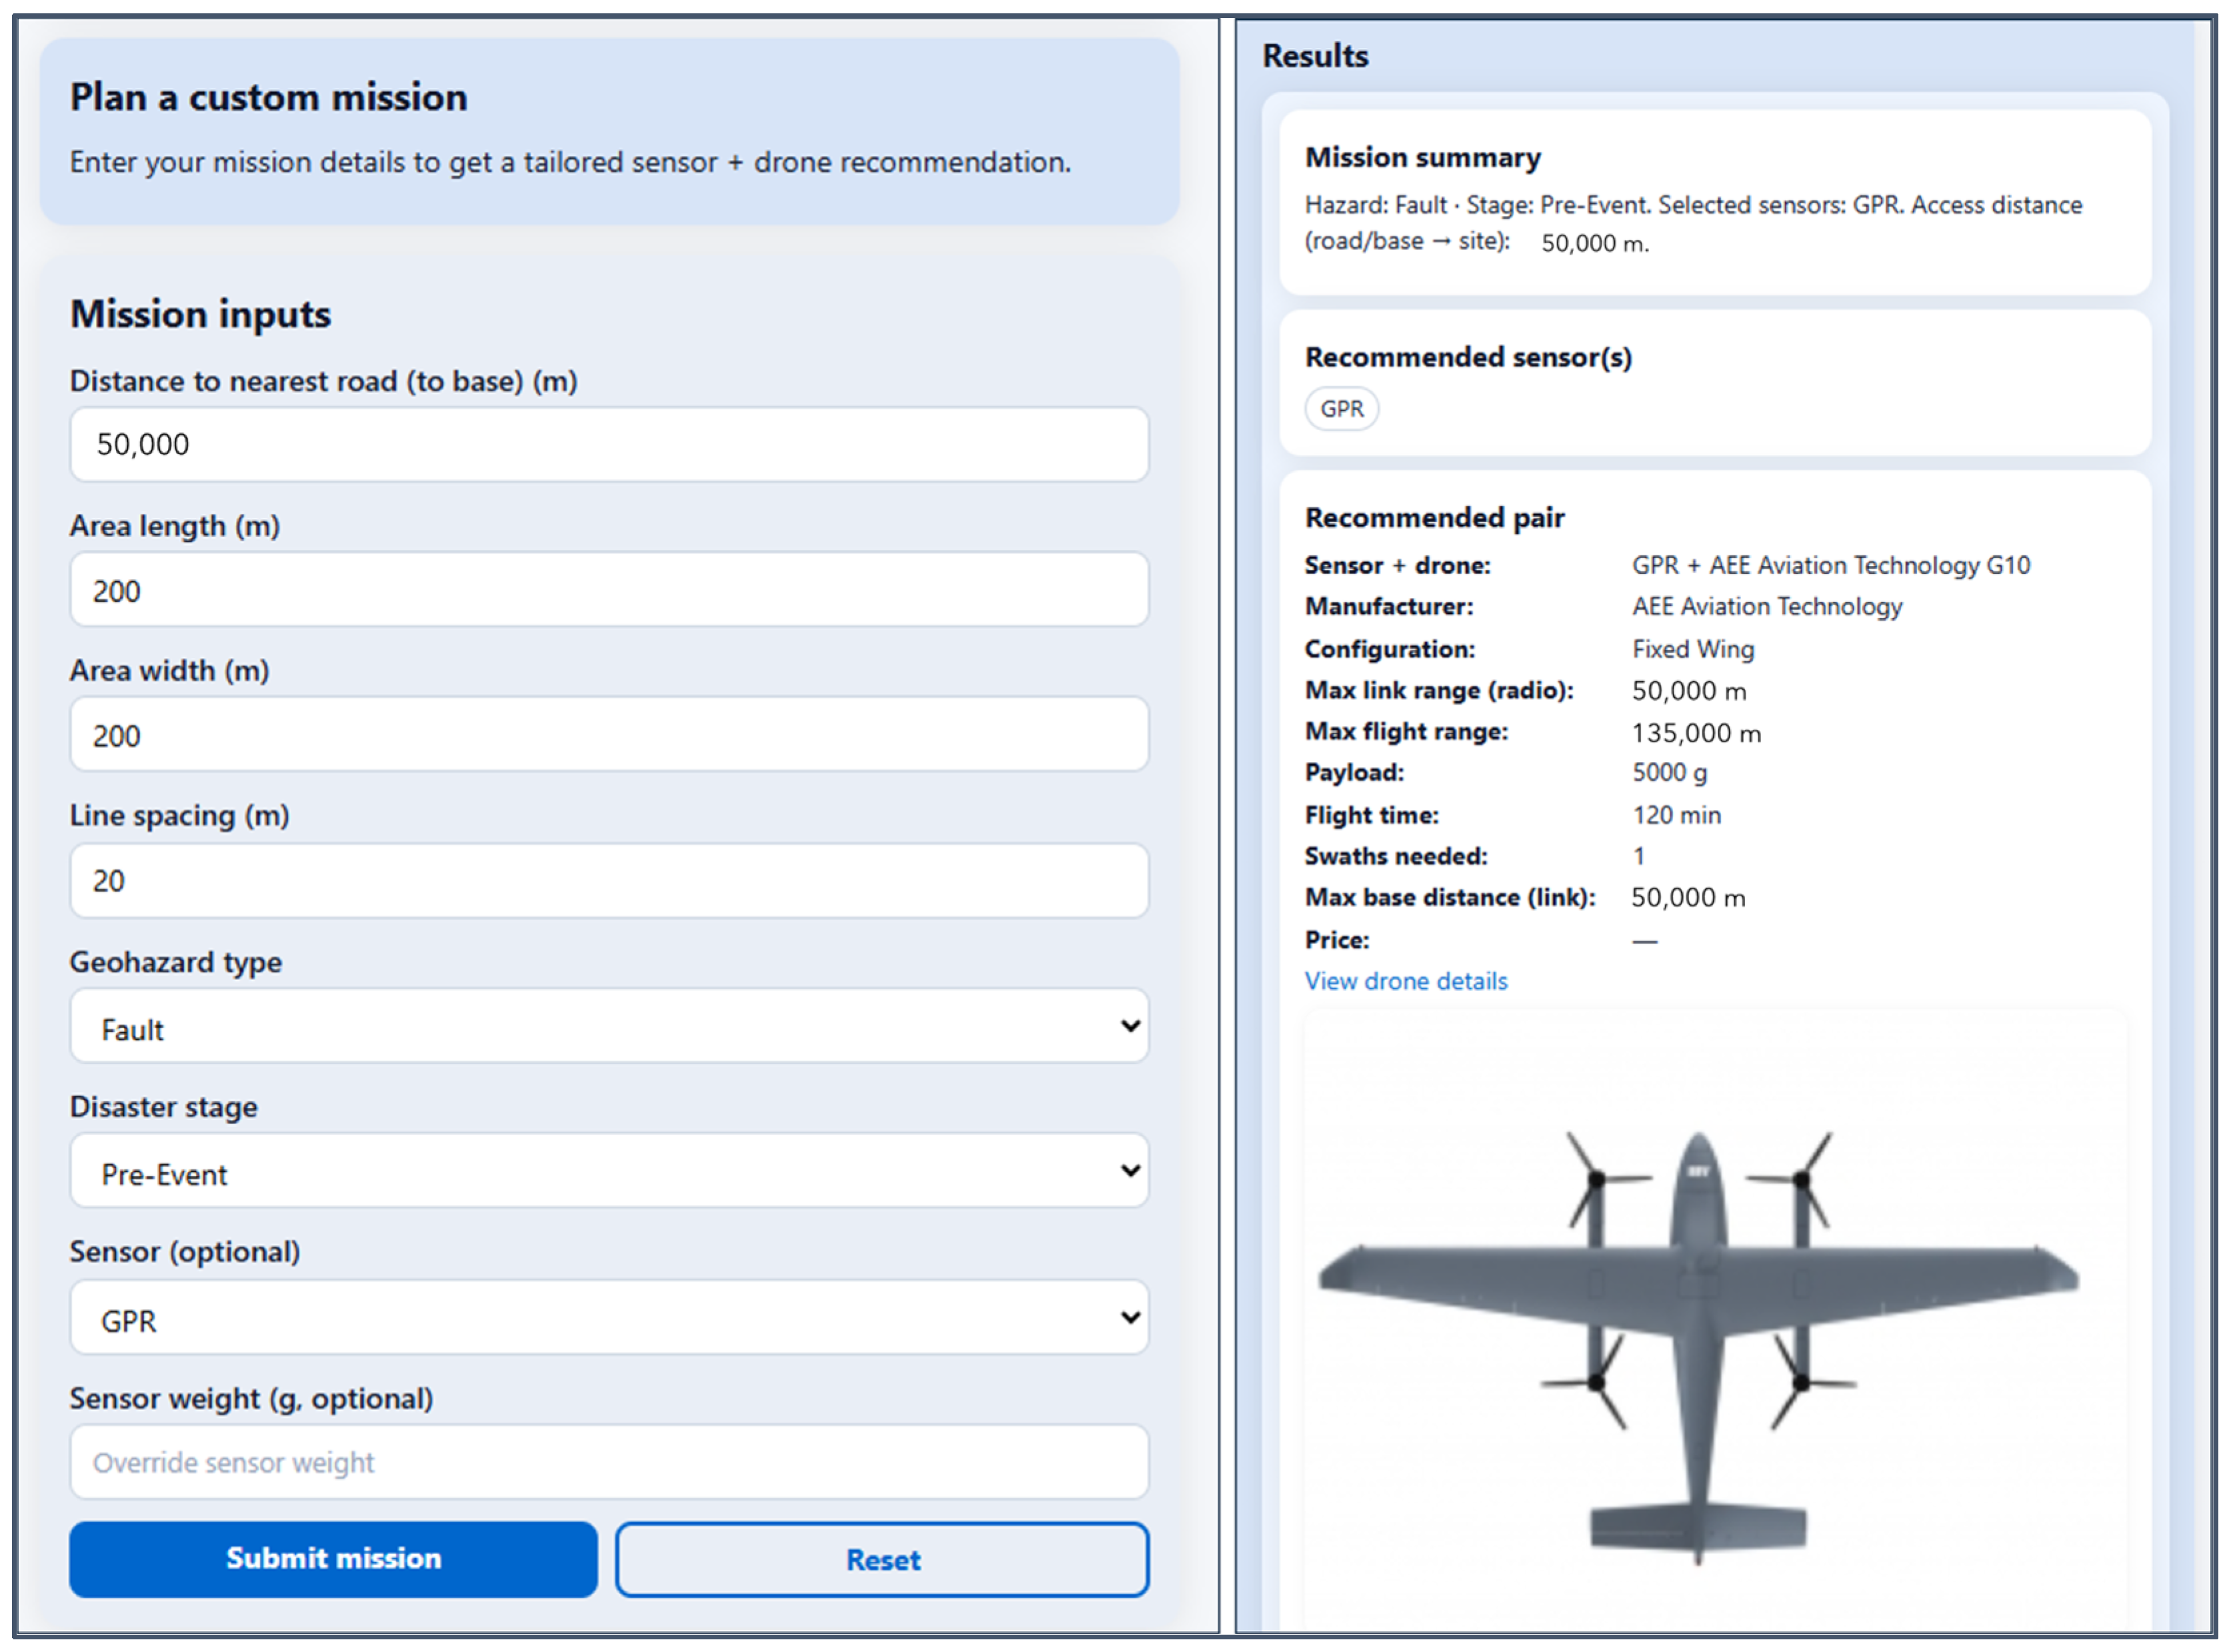
On the left-hand side of the interface of page 2 (Figure 14 left side), users may define a custom mission by completing a parameter form (Figure 15). For instance, a simulated mission for a pre-event active fault survey using a GPR sensor, located 50 km from the nearest road with a 200 m × 200 m survey area and 20 m spacing, results in recommendations favoring fixed-wing drones more suited to long-range deployment. After submitting a mission, the system returns a mission summary, a top-ranked sensor–drone pair (Figure 15 right side), and two alternative drone options, as shown in Figure A1 in Appendix B.
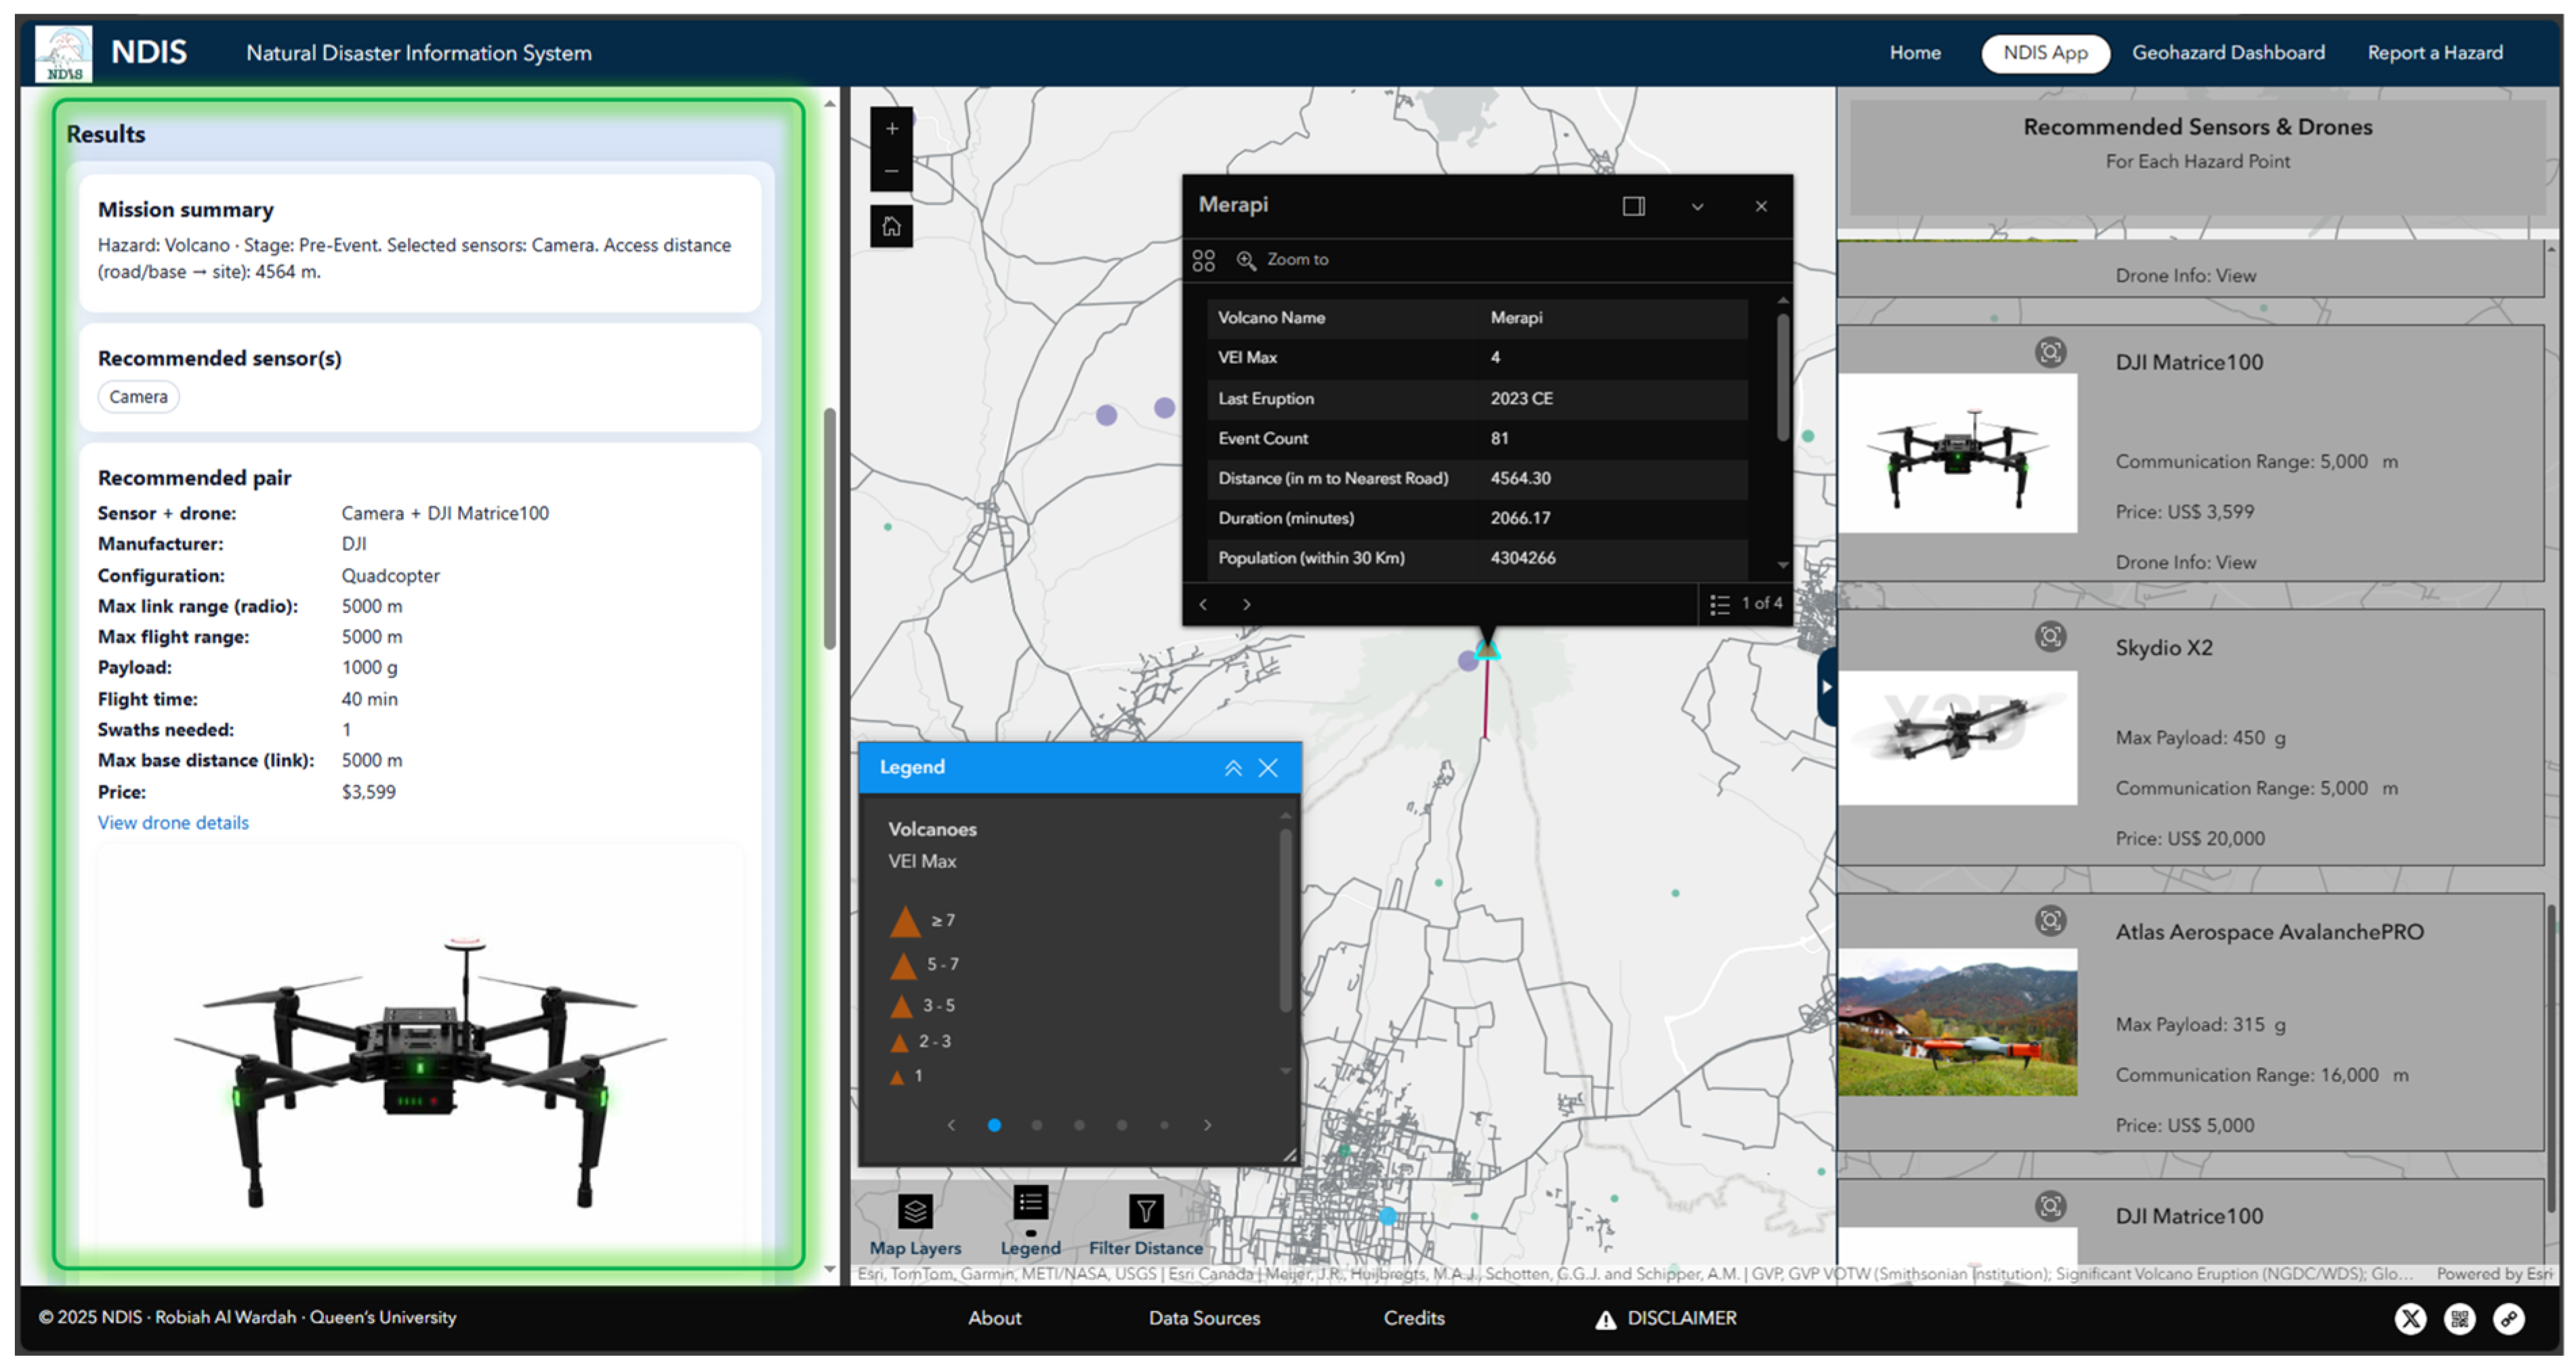
To demonstrate both applicability and consistency, this functionality was tested on volcanic hazard scenarios in Indonesia, specifically the Merapi volcano (Figure 16). For this site, the system generated drone–sensor recommendations include the DJI Matrice 100 (max payload 1000 g, equipped with the Zenmuse X3 12.4 MP CMOS camera as the default payload), Skydio X2 (12.3 MP camera), and Atlas Aerospace AvalanchePRO (12.7 MP CMOS camera). These outputs correspond well to prior field deployments at Merapi that used DJI Phantom 3 and DJI Mavic Pro drones—both featuring 12 MP cameras [55] with comparable flight characteristics, despite their lower payload capacities. Although these historical deployments were not used as training data, the similarity in sensor resolution, flight behavior, and mission parameters reinforces the plausibility and operational validity of the NDIS recommendations, particularly for optical survey missions.
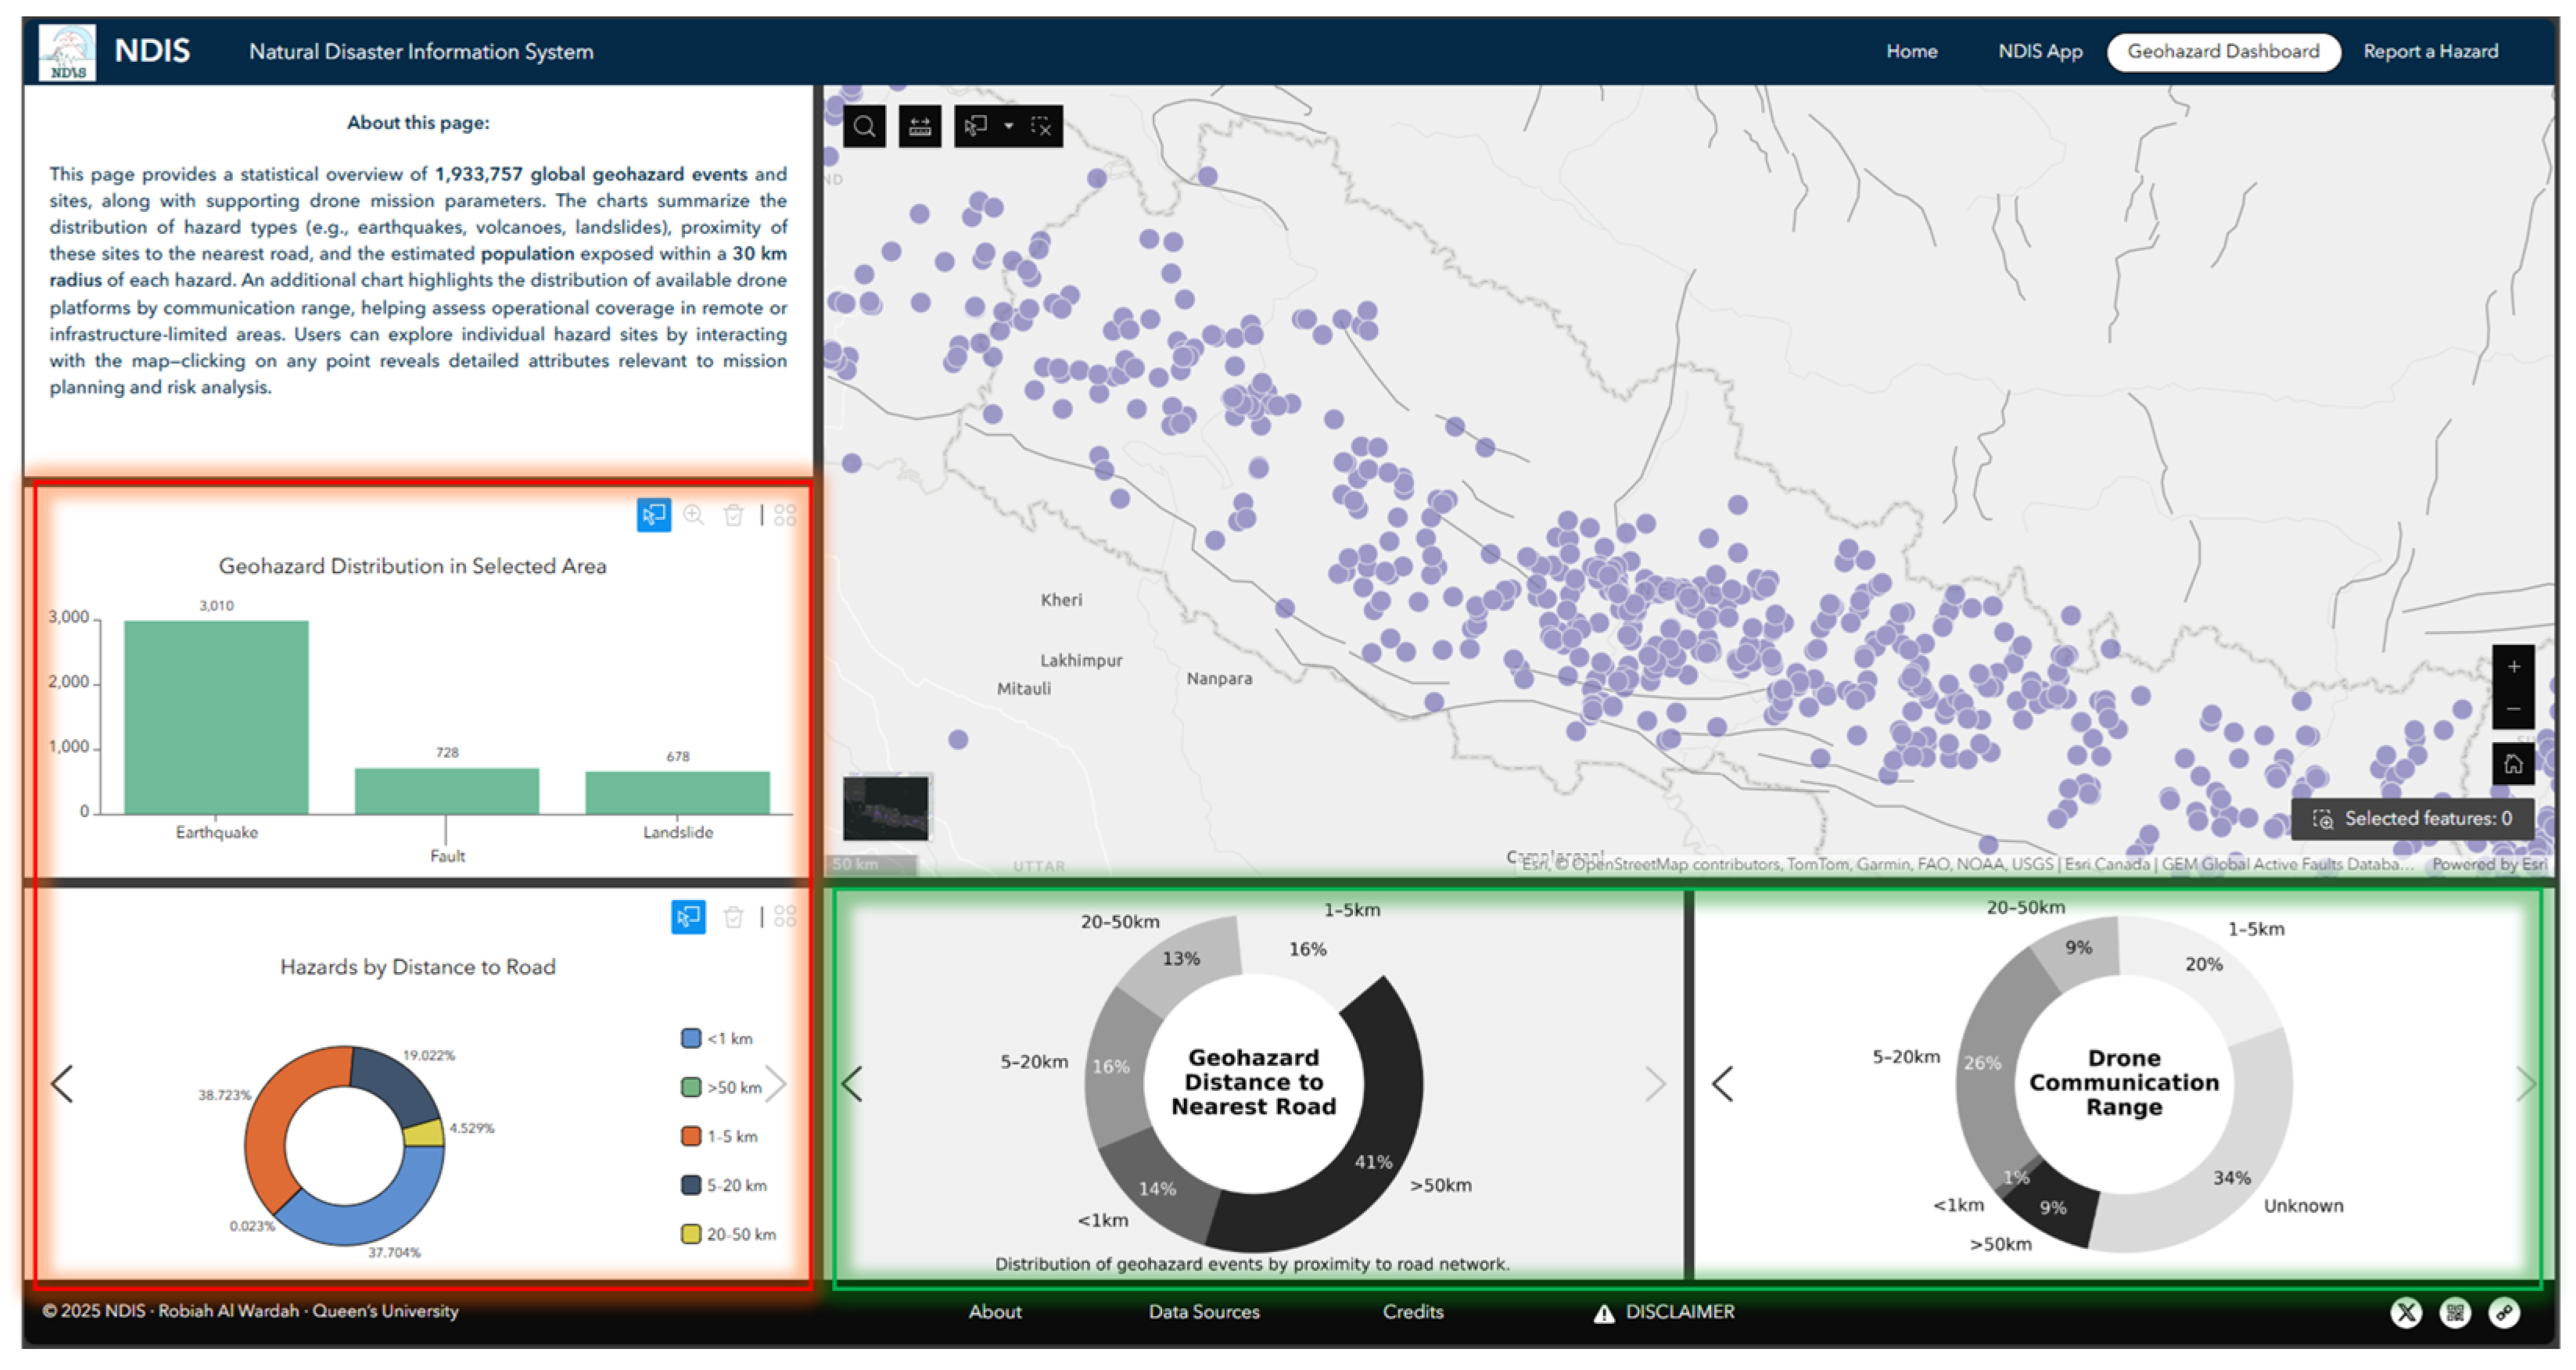
The third page of the application (Figure 17) presents a geohazard dashboard containing both dynamic (red box in Figure 17) and static statistics (green box in Figure 17) derived from the backend database. Dynamic views, such as hazard frequency over time in Nepal, allow for focused spatial-temporal exploration, while aggregate statistics at the bottom of the page summarize attributes of the full dataset. These include hazard distribution by type, proximity to infrastructure, drone’s communication range and drone’s weight distributions, which serve to contextualize the data and support interpretation by researchers, field operators, and policy planners.
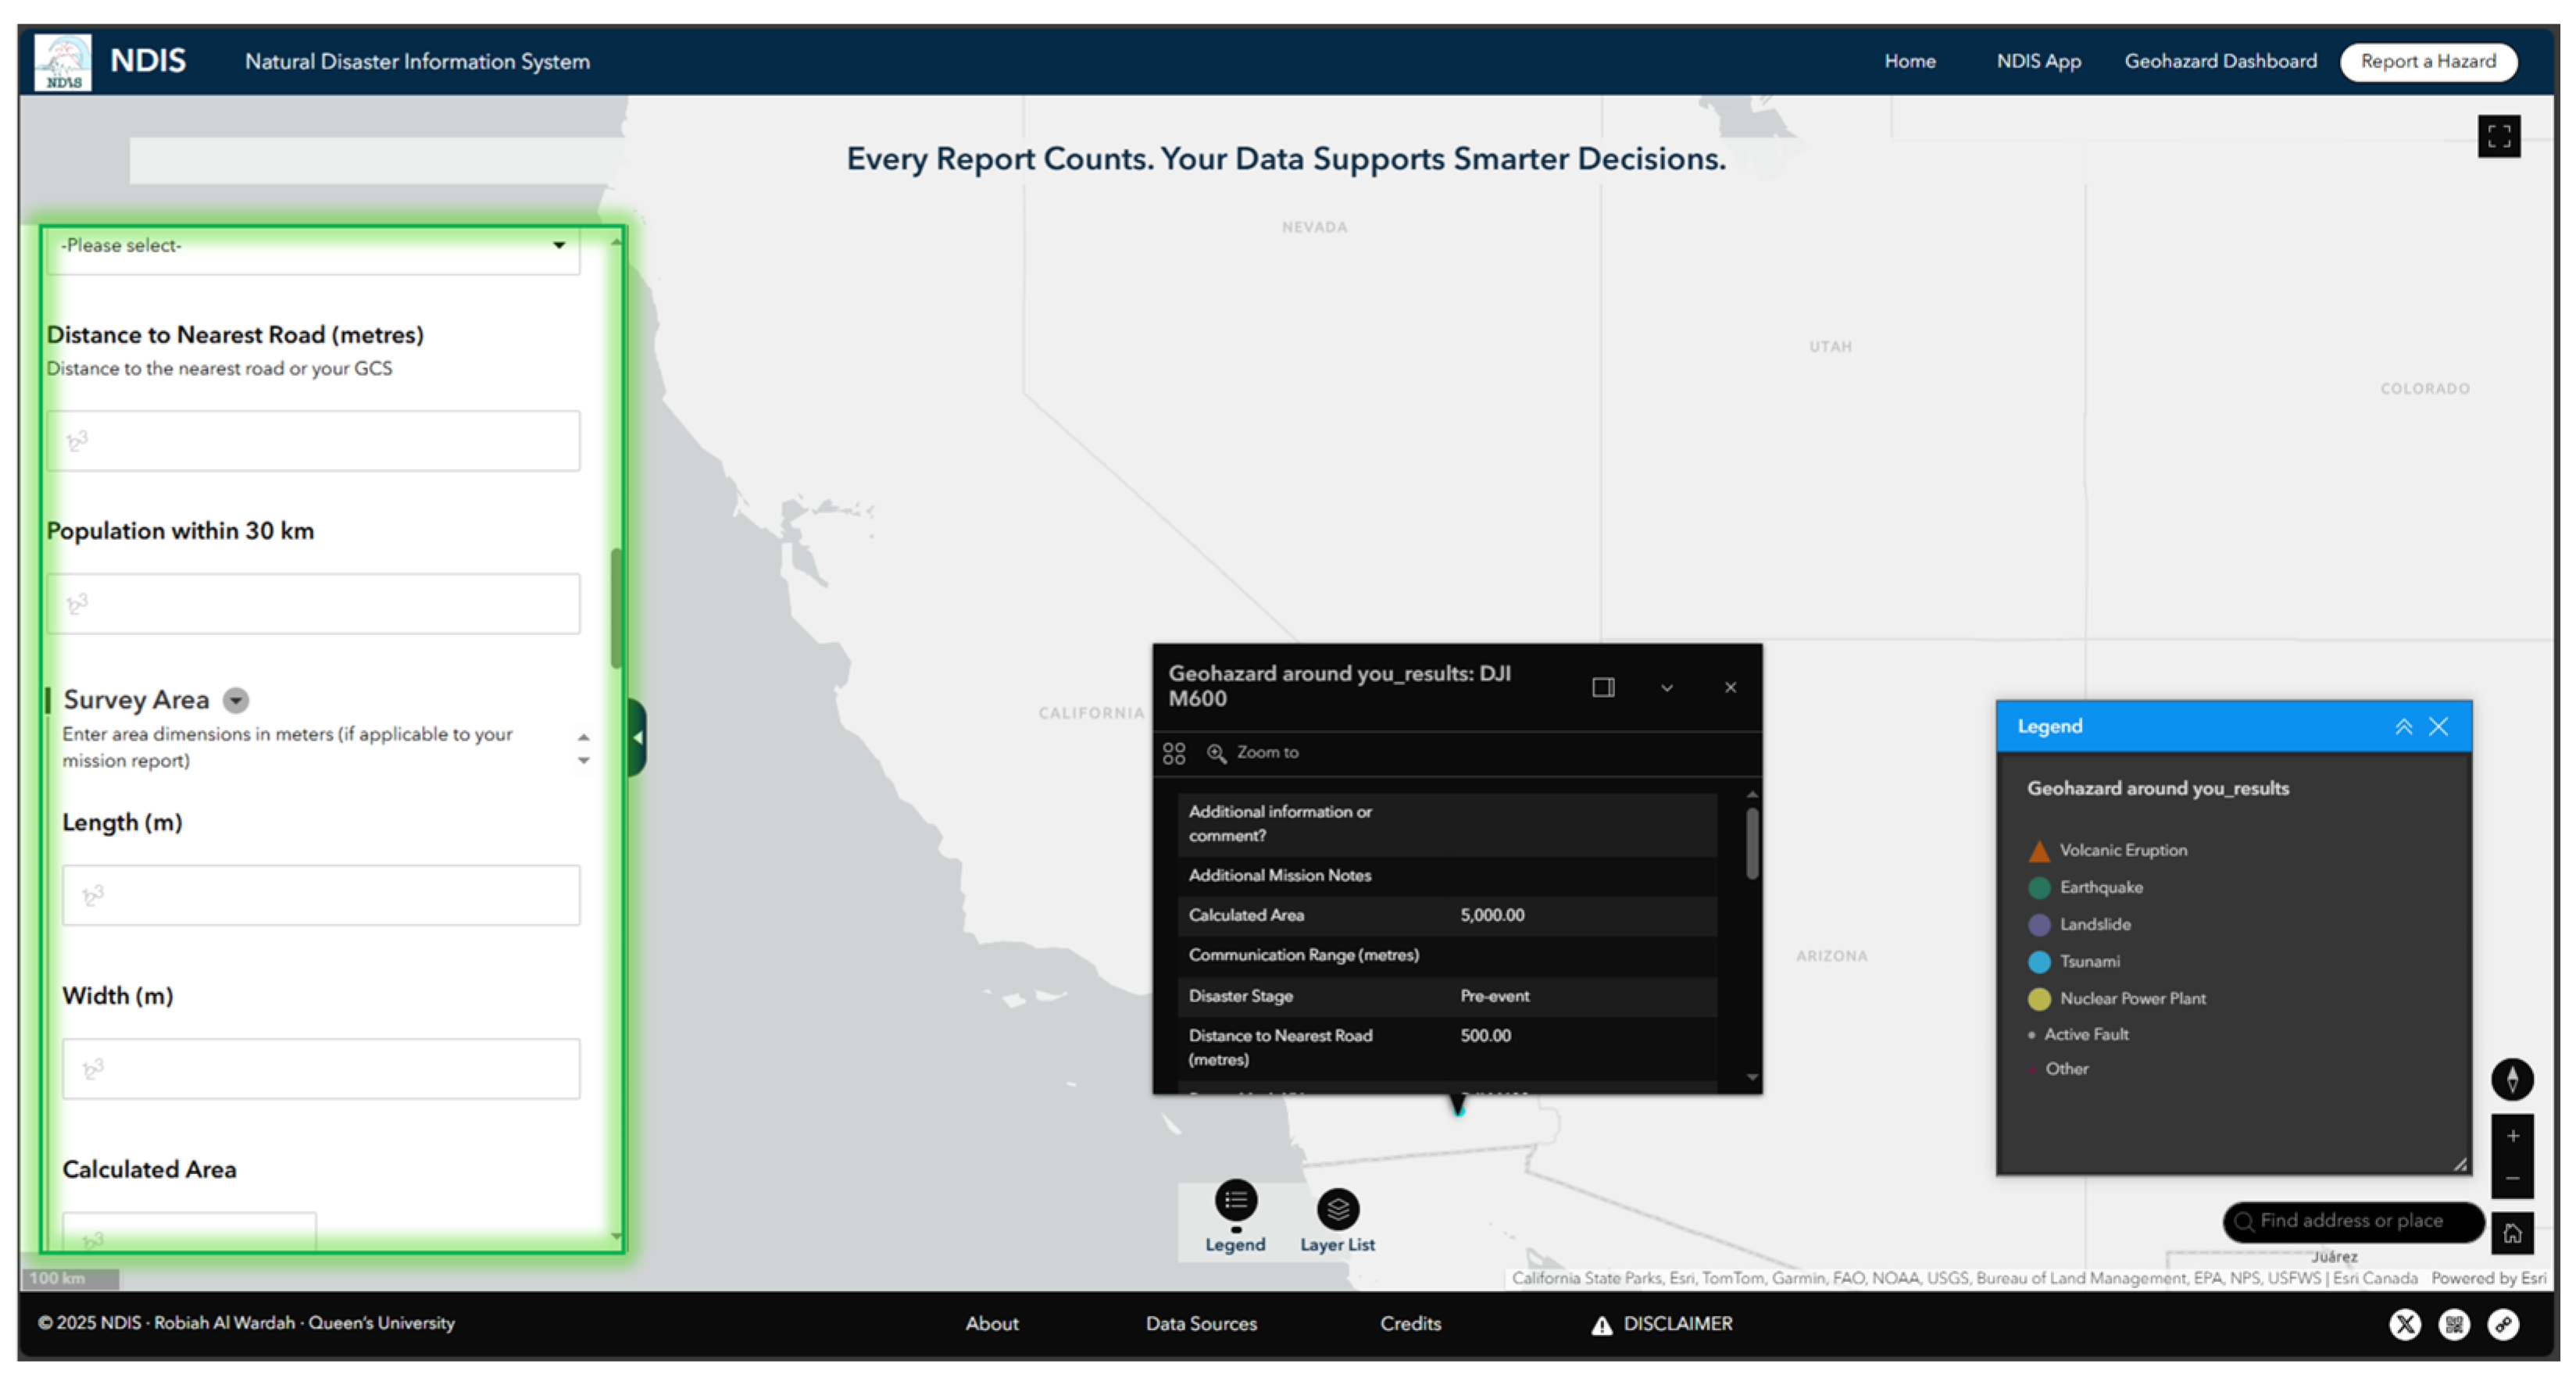
The fourth page (Figure 18) integrates a public reporting tool developed using ArcGIS Survey123. This interface allows users to submit new geohazard observations or revise existing records. The form structure reflects the staggered decision logic, capturing inputs such as hazard type, stage, distance, and optional sensor overrides. Additional fields allow contributors to include references or supporting documentation, which can greatly assist in the verification process. For example, a user may define a mission near the San Andreas Fault, approximately 156 km east of San Diego, California, and specify survey attributes to generate a structured mission profile.
Submitted records are reviewed through a quality assurance and quality control (QA/QC) procedure prior to inclusion in the system. This involves checking for field completeness, consistency with existing data, and relevance of any attached references. Verified records may be appended to the database and included in future mission planning workflows at the discretion of the developers.
In addition to field-oriented and open-access environments, the system was tested against a hypothetical scenario set in a highly restricted jurisdiction. For example, a gamma spectrometry mission was simulated near a nuclear facility (Figure 19) in the Democratic People’s Republic of Korea (North Korea), where publicly available information indicates that drone operations are restricted to government-authorized agencies, with no provision for civilian or private use [56]. In this case, the system proceeded to generate platform recommendations assuming ideal conditions, such as a longer transmission range multirotor (DJI FlyCart 30 with a signal transmission of 20 km) capable of supporting radiation sensors. While speculative, this test illustrates the system’s ability to return technically feasible outputs even in contexts where legal deployment may be constrained or undefined.
The NDIS framework does not enforce country-specific aviation laws, but rather adheres to generalized parameters derived from technical profiles (e.g., takeoff weight, sensor payload, endurance). This design choice is consistent with broader international frameworks such as those outlined by the International Civil Aviation Organization (ICAO) and the Joint Authorities for Rulemaking on Unmanned Systems (JARUS), which provide technical categorization and operational guidance without prescribing enforcement at the national level [57]. Accordingly, responsibility for regulatory compliance rests with the end user or governing authority.
To improve readability and visual clarity, map products were styled using light-themed, colorblind-accessible palettes adapted from ColorBrewer and Paul Tol’s color schemes [58,59,60]. The layout emphasized consistency and legibility across components, with minimal visual noise to accommodate diverse user needs, including those with neurodivergent processing styles.
To ensure accessibility across different devices, the interface was configured using ArcGIS Experience Builder’s built-in display modes for desktop, tablet, and mobile environments. These responsive settings allow the application to scale appropriately across screen sizes and maintain functional integrity for both technical and non-technical users.
Drone images displayed in the NDIS interface are sourced via publicly available URLs provided by manufacturers or licensed third-party platforms. These images are not owned by the authors and are used solely for non-commercial, academic purposes to illustrate drone specifications within the decision-support system. All trademarks and brand assets remain the property of their respective rights holders, and hyperlinks within the platform direct users to the original source for full context.
A complementary ArcGIS StoryMap is also available at: https://storymaps.arcgis.com/stories/c5053d195bdd41539805a195d765467d (accessed on 16 October 2025). The StoryMap provides a narrative overview of the NDIS development process, including system rationale, conceptual design, and field trials. Although not integrated into the core application, it offers additional insight for outreach, education, and public engagement.

3.3. Distribution of Recommended Drone Models and Sensor Utilization Across Hazards

For large-scale processing of approximately 1.9 million geohazard records, the staggered decision logic was applied within ArcGIS Pro using a standalone script-based workflow. While the underlying logic mirrors the Python function used in the web API, this batch process was executed locally to leverage ArcGIS Pro’s more efficient handling of geospatial operations.
In the batch workflow, each geohazard record is processed independently using attributes such as geographic coordinates, hazard type, hazard stage, and distance. These parameters are passed through a rule-based decision logic that assigns up to three relevant sensors per record, depending on the operational requirements of the identified hazard. For each sensor, the system identifies suitable drone platforms by evaluating payload compatibility and communication range. The resulting output is a one-to-many table, where each input point may correspond to multiple platform–sensor configurations.
For example, expanding on the Merapi volcano scenario introduced earlier, the same batch logic was applied to all volcano records labeled as being in the pre-event stage (see Table 4). For each record, the system mapped sensor priorities—typically magnetometers, seismic sensors, and cameras—and identified compatible drones based on site-specific parameters such as distance and payload capacity. In the Merapi case, this resulted in recommendations like the ACSL AirTruck, DJI S900, and Draganfly Starling X.2, which support heavier payloads suitable for magnetometers such as the GEM GSMP-35U series that weigh about 805 grams [61]. This example illustrates how the system generates tailored mission outputs for diverse hazard types and sensor requirements, enabling users to retrieve these configurations directly by selecting any hazard point on the map, without requiring additional input or customization.
The implementation of NDIS version 3.8.3 reflects the intended design as outlined in Section 2.2. Integration with ArcGIS Experience Builder and Survey123 facilitates user interaction, data contribution, and the distribution of mission outputs. This approach allows newly added drones, sensors, or hazard records to be used in the inference process without requiring retraining or manual code modification.

4. Discussion

The NDIS serves as a structured application of rule-based logic for drone and sensor selection in geohazard monitoring. This section examines the outcomes observed during implementation, identifies current limitations, and considers the system’s relevance within broader geospatial decision support frameworks. These observations inform future directions for enhancing scalability, improving end-user adaptability, and facilitating integration with complementary planning tools.

4.1. Interpretation of Drone-Sensor Assignment Patterns

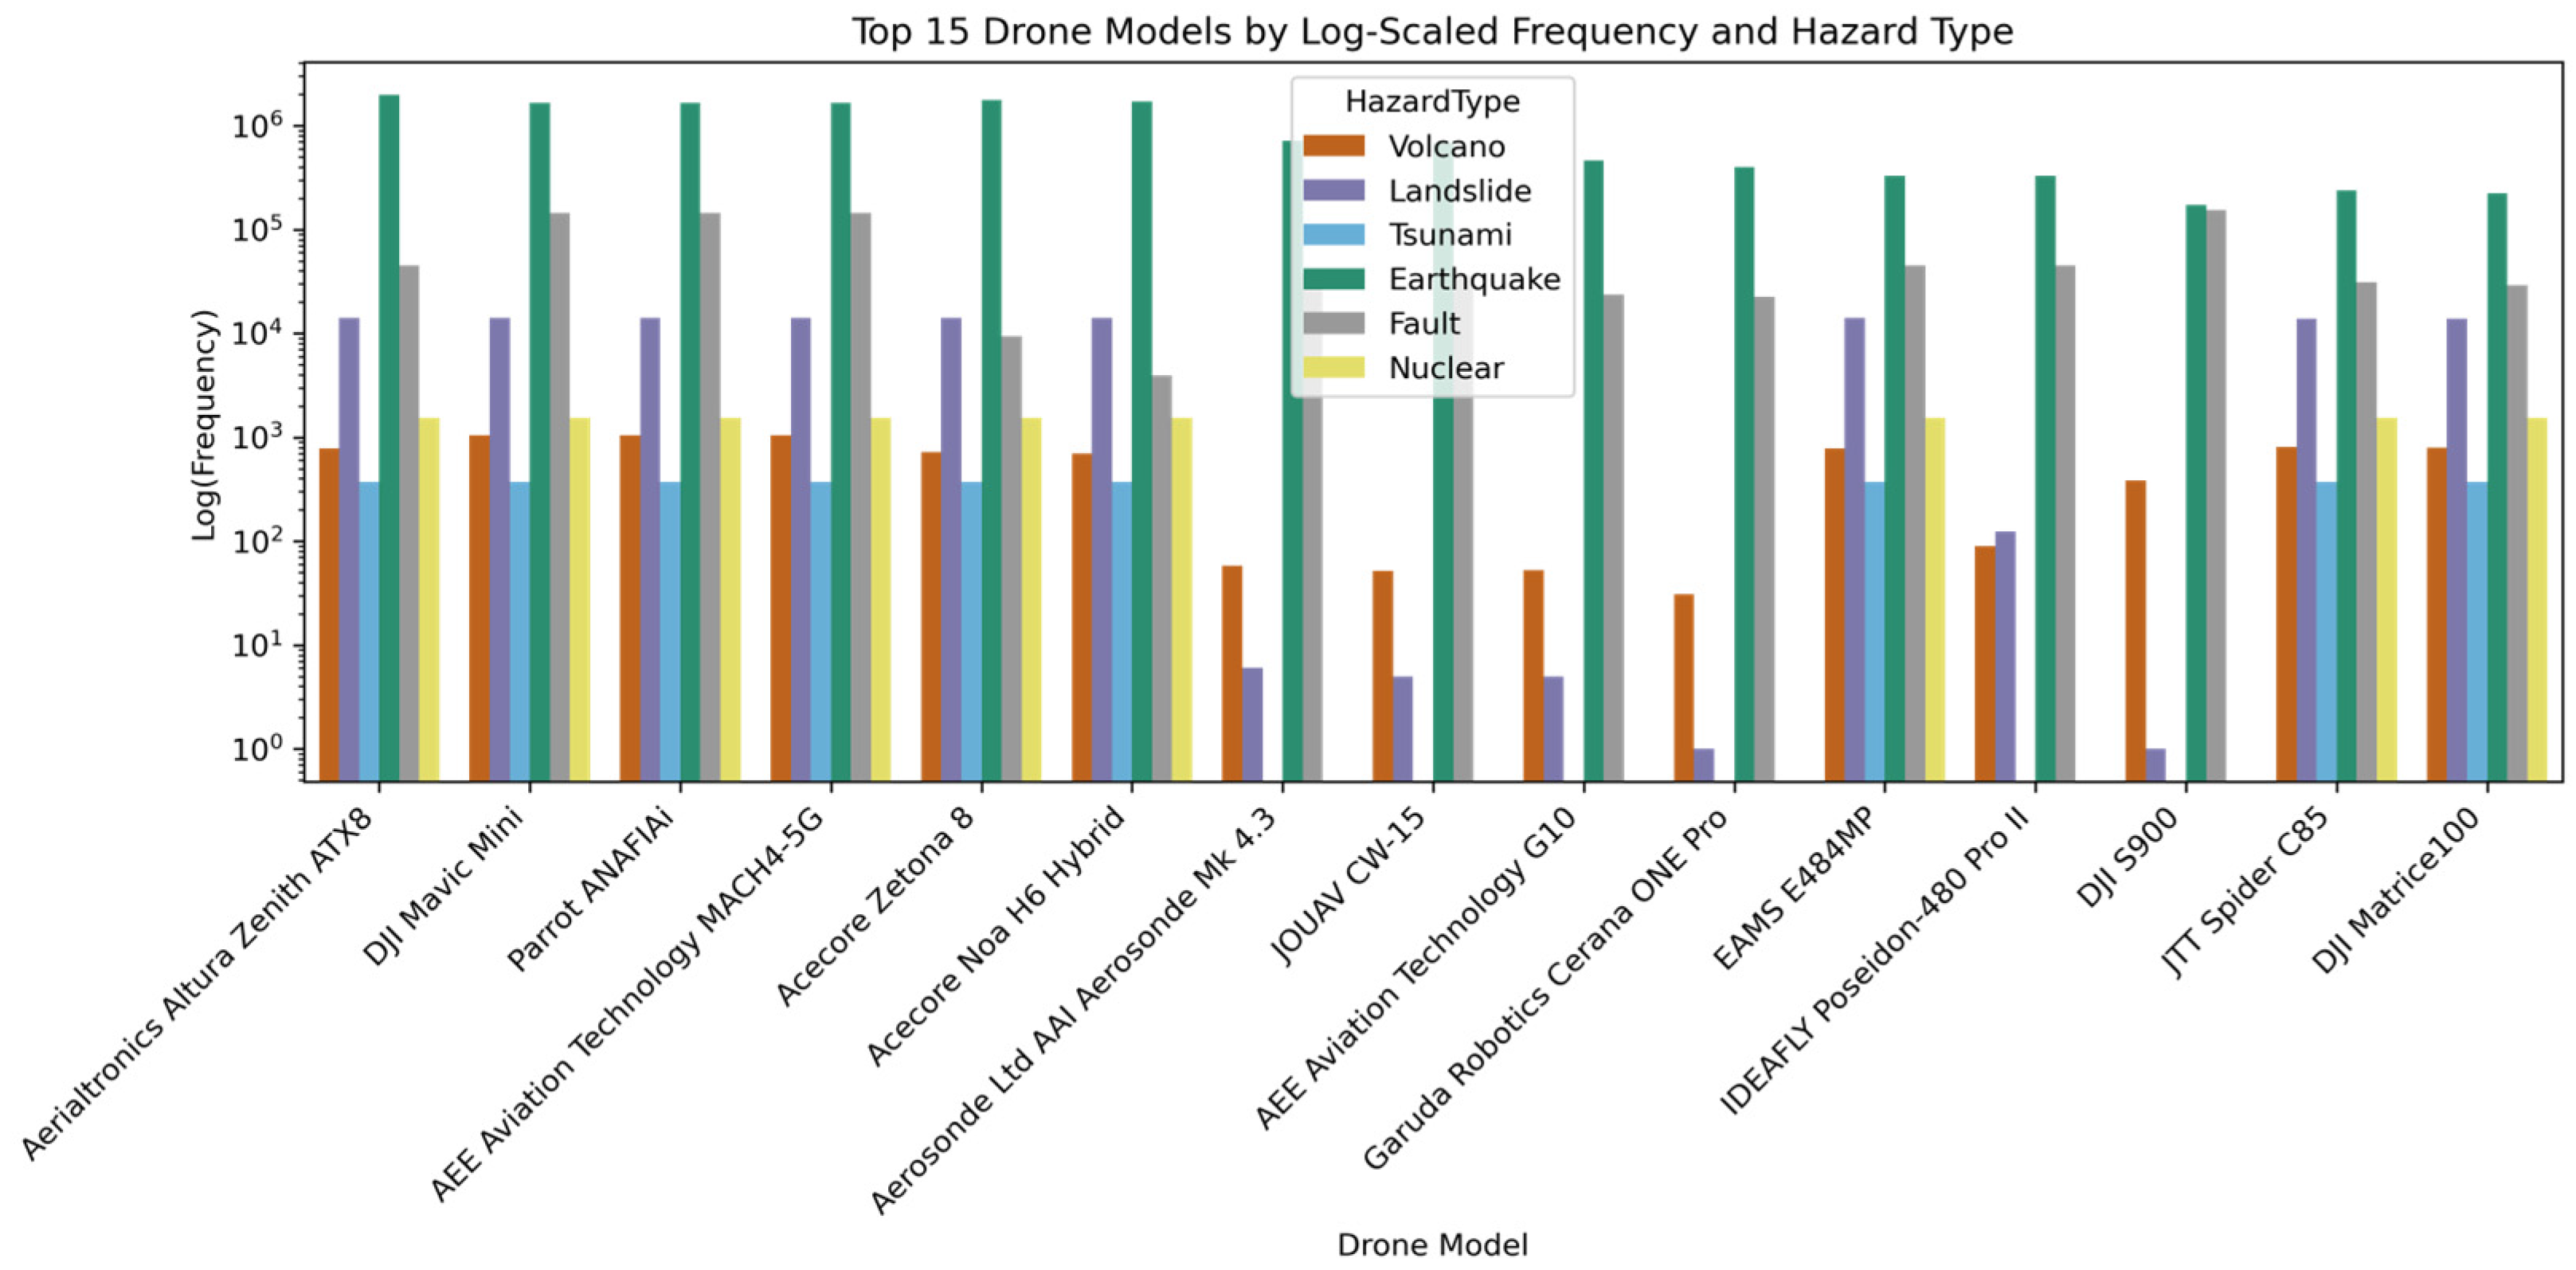
The distribution of recommended drone models across hazard types reflects both the structure of the staggered decision logic and the practical constraints embedded in the NDIS framework. Figure 20 presents fifteen most frequently assigned drone platforms, grouped by hazard type. These results illustrate recurring selection patterns that are consistent with the mission profiles associated with different hazards.
Several platforms, such as the Aerialtronics Altura Zenith ATX8, DJI Mavic Mini, and Parrot Anafi Ai, were recommended across multiple hazard types. These platforms are generally multirotor systems—such as quadcopters or octocopters—with moderate endurance and limited payload capacity. Their frequent selection corresponds to missions requiring high maneuverability, especially in contexts where manual flight or visual inspection is necessary. This is particularly relevant for during- or post-event phases involving optical or thermal sensors, where fixed flight paths (e.g., lawnmower grids used in mapping) are less suitable, and rapid deployment or operator control may be prioritized. Although spatial constraints such as airspace or built environment proximity were not explicitly encoded in the decision logic, the dominance of multirotor models aligns with the types of sensors assigned in many scenarios—such as cameras, thermal cameras, or seismic payloads—across volcanic, landslide, tsunami, and nuclear hazards.
In contrast, fixed-wing platforms such as the Aerosonde Mk 4.3 and AEE G10 were more frequently recommended for tsunami and fault hazards. These cases typically involve expansive or remote environments—such as coastal zones or inland fault systems—where longer flight ranges and larger coverage areas are operationally required. The assignments were based on estimated distance and flight path dimensions, using platform endurance values to identify models suitable for the spatial extent of each mission. Similarly, hybrid VTOL drones such as the JOUAV CW-15 were assigned in contexts where vertical takeoff and landing were necessary due to terrain constraints, while still enabling efficient fixed-wing travel for larger survey coverage.
Heavy-lift multirotor platforms such as the DJI S900, Acecore Noa H6 Hybrid, and EAMS E484MP were recommended primarily in volcano, earthquake, and fault hazards involving sensors with higher payload requirements. These platforms, typically configured as quadcopters or hexacopters with lift capacities exceeding 3 kg, are suitable for carrying geophysical instruments such as airborne GPR systems, magnetometers or for delivering deployable sensors like seismic nodes or BPR. Their vertical lift capabilities and flight stability support short-range missions that require precise payload handling, particularly in uneven or obstructed terrain.
An analysis of hazard assignments by drone model indicates that distribution patterns correspond to platform configuration and operational parameters. The Aerialtronics Altura Zenith ATX8 appeared across all six hazard types, likely due to its moderate payload capacity and multirotor configuration, which supports stable operation in varied environments. In contrast, platforms such as the Aerosonde Mk 4.3, JOUAV CW-15, AEE G10, and IDEAFLY Poseidon-480 Pro II were assigned to a narrower range of hazards. These platforms are primarily fixed-wing or hybrid types, designed for extended flight duration, and were selected in contexts requiring long-range or offshore coverage. This assessment does not mean that one RPAS type is better than another, but it demonstrates that the selections of the NDIS can be validated using scientific reasoning. As this reasoning is implemented in the NDIS, it gives users the ability to make RPAS and sensor selections without the need to query all previous missions and applications.
Platform selection was determined by technical fit rather than brand, as no single manufacturer appeared across all hazards. RPAS cost was included in the query results where available, based on unit price data compiled up to 2024 in U.S. dollars. Not all platforms had publicly available pricing, and values for some units were obtained through direct inquiry to manufacturers. These prices are provided for reference only and may not reflect current market conditions.

4.2. Advantages of the NDIS Framework

Table 5 presents a comparison between NDIS and several representative hazard-related decision-support systems, including ShakeMap, PAGER, Copernicus EMS, and InaSAFE. These systems primarily focus on impact estimation, alerting, or situational awareness and do not include operational logic for platform–sensor matching or mission configuration. By contrast, NDIS integrates multi-hazard inputs with constraint-aware recommendations for drone and sensor selection based on user-defined mission parameters such as hazard type, distance to road, survey area, and survey method. The output includes not only pre-processed combinations but also estimated deployment time and supporting specifications for planning.
While the NDIS framework falls within the broader category of decision-support systems (DSSs), it differs from traditional spatial DSSs (SDSSs) and multi-criteria decision analysis (MCDA) models in both structure and function. SDSS tools are often used for scenario modeling and spatial prioritization, while MCDA frameworks commonly apply weighted scoring across predefined criteria to rank alternatives. In contrast, NDIS uses a staged filtering approach based on technical constraints such as payload capacity, communication range, distance to road, and hazard-specific survey needs. Rather than optimizing across a weighted preference scale, the system narrows feasible combinations through conditional logic applied in sequence. The outputs are best interpreted as indicative planning tools, offering constraint-based recommendations to support mission configuration, rather than predictive models or statistical forecasts. This approach emphasizes interpretability, operational transparency, and alignment with real-world deployment considerations, particularly for RPAS-based missions where binary constraints (e.g., payload exceeds limit) are more relevant than preference-based rankings. The system’s outputs are generated from deterministic logic rather than probabilistic scoring, making them more suitable for environments where mission feasibility must be explicitly defined.
The system architecture relies on two integrated environments: an open-source backend built with FastAPI and a geospatial interface developed using Esri’s ArcGIS platform. This setup enables consistent data transfer between the processing logic and the user-interface, avoids additional translation layers, reduces maintenance overhead, and improves workflow stability.

4.3. Limitations and Trade-Offs

The rule-based architecture in NDIS introduces certain limitations. The deterministic logic aids transparency but limits flexibility in handling multi-hazard contexts (e.g., landslide and flood hazard), novel mission profiles (RPAS swarms), or emerging technologies not captured in the current threshold definitions (e.g., vibrometers, drone-deployable SAR). Several attributes within the geohazard database are synthetically derived or estimated to support consistent processing across hazard types. While appropriate for system prototyping and comparative analysis, these engineered values may deviate from ground-truth measurements and should be interpreted accordingly before the implementation of a mission.
The current implementation assumes ideal operating and regulatory conditions. Although parameters like takeoff weight are included to reflect typical licensing categories (e.g., 250 g–25 kg), jurisdiction-specific flight rules are not explicitly enforced. Some recommended platforms may require certified operators or special authorization. Furthermore, integration with Esri’s tools—such as ArcGIS Experience Builder or ArcGIS Online—depends on specific file structures and deployment environments. Adapting the system to other GIS platforms or cloud services may require additional configuration. The platform has not been tested under concurrent multi-user scenarios. Its current deployment, hosted on a student-tier Azure App Service using Kudu-Lite, may not meet the performance requirements of emergency response or institutional-scale operations. Additional performance details are provided in Appendix C.

4.4. Operational Implications

The NDIS framework able to link hazard characteristics with platform and sensor feasibility, facilitating standardized mission planning across different phases of the disaster management cycle. This includes pre-event risk assessment, during-event response, and post-event reconnaissance.
In time-sensitive situations, such as search and rescue operations, the real-time mission planner supports rapid drone–sensor pairing based on local hazard parameters and site accessibility. This enables faster deployment planning without requiring manual trial-and-error.
At the institutional level, NDIS may be used as a first step to coordinate survey logistics and hazard data collection. Its consistent rule structure helps ensure that platform assignments are reproducible and aligned with hazard-specific needs, supporting planning efforts across multiple regions and operational teams.
Integration with participatory tools such as ArcGIS Survey123 enables local stakeholders to contribute observations, photographs, and contextual details, which can inform data verification and refinement. This participatory input complements the system’s rule-based logic, allowing for more consistent data formatting while maintaining transparency in decision support. Rather than replacing expert input, the system serves as a preparatory aid—helping users to understand technical requirements and operational feasibility before deployment. While expert-based planning may offer more tailored recommendations, it often requires days or weeks. In contrast, NDIS produces indicative outputs within minutes and could be used as initial plans for experts and decision makers. It integrates existing knowledge from the databases into the decision-making process but still needs to be validated with human subject matter expertise.
In this context, NDIS functions as a bridge between hazard identification and actionable mitigation. Whether applied in early monitoring or post-disaster phases such as search and rescue (SAR), the system provides structured outputs to support situational understanding and logistical planning. These functions contribute to broader efforts in resilient urbanization and disaster risk reduction, as outlined in SDGs 11 and 17.

4.5. Future Work

Several opportunities remain for enhancing the functionality, resilience, and usability of the NDIS platform:
  • Uncertainty modeling: The current rule-based system operates under deterministic assumptions. Incorporating probabilistic elements—such as wind variability, sensor reliability, or communication loss—could support the generation of robustness indicators or confidence levels for each mission recommendation.
  • Flight path trajectory visualization: Present outputs include estimated distance and duration; however, visualizing projected flight paths could improve operational planning. Such features would support airspace coordination, obstacle avoidance, and endurance validation, especially in mission operations with terrain constraints.
  • Workflow continuity: As NDIS operates within the Esri environment, future development could explore integration with ArcGIS Flight or equivalent modules. This would enable direct transfer of recommended flight parameters into established mission planning tools, facilitating smoother transitions from decision support to field implementation.
  • Integration with real-time data feeds: The current system uses static input layers. Future versions may incorporate live feeds through standard-compliant interfaces such as Web Feature Services (WFS). For example, volcano monitoring data from the Smithsonian Global Volcanism Program (GVP) is accessible via OGC-compatible endpoints (GeoJSON, CSV, Shapefile). Extending this capability to other sources, such as the ISC Bulletin or national warning systems, would support more timely and adaptive mission planning.
Note: The current system (NDIS v3.8.3) was developed using the standard edition of ArcGIS Experience Builder, which requires manual coordinate input due to decoupled map–widget architecture. An internal developer edition is under active development to implement native map integration, allowing direct coordinate capture. This enhancement is not fully described in the present manuscript to maintain scope clarity and avoid replication.

5. Conclusions

The Natural Disaster Information System provides a flexible and scalable framework for drone-based geohazard monitoring by integrating spatial data processing, decision logic, and sensor–platform assignment into a unified geospatial system. Developed using a modular architecture across the Esri ecosystem, FastAPI, and Azure App Service, NDIS supports both real-time queries and batch mission planning across diverse hazard types.
By applying a rule-based decision approach rather than machine learning models, NDIS maintains transparency and consistency in its recommendations. This improves traceability—an important consideration in disaster response operations where decision accountability is required.
Technical and regulatory constraints—such as payload limits, communication range, and platform weight classes—are encoded into the decision workflow, enabling mission planning to proceed as a structured reasoning task within a spatial context. The platform incorporates both institutional datasets and user-contributed inputs, allowing use across multiple spatial and organizational scales. Integration with Esri-based tools enables interoperability between backend processing and geospatial interfaces. Through its staggered logic, hazard-stage awareness, and support for participatory data, NDIS produces automated recommendations that reflect practical deployment conditions. As geohazard datasets grow and RPAS usage expands, such systems may support more timely, repeatable, and spatially targeted decision-making. Of note is that NDIS supports natural hazard response teams but is not suited to replace human expertise.

Author Contributions

Conceptualization, R.A.W. and A.B.; methodology, R.A.W.; software, R.A.W.; validation, R.A.W. and A.B.; formal analysis, R.A.W.; investigation, R.A.W.; resources, A.B.; data curation, R.A.W.; writing—original draft preparation, R.A.W.; writing—review and editing, R.A.W. and A.B.; visualization, R.A.W.; supervision, A.B.; project administration, A.B.; funding acquisition, A.B. All authors have read and agreed to the published version of the manuscript.

Funding

This research was funded by the NSERC CREATE UTILI Program (Uninhabited aircraft systems Training, Innovation and Leadership Initiative); Queen’s University (Carl Reinhardt Graduate Scholarship, iQGA, SGSPA); KEGS Foundation and Geosoft Earth Scholarship; CSEG Foundation Scholarship; SEG Foundation/Chevron Scholarship; Mitacs.

Data Availability Statement

All processing scripts, database schemas, and decision logic used in this study are openly available in the project’s GitHub repository at https://github.com/redrobbit/ndis. The processed outputs are deployed as feature services within the cloud-based NDIS web application and are not available as standalone files. The complete operational system, including all processed results, is publicly accessible at https://experience.arcgis.com/experience/0f4b603be71d4039bda2fe92541422a6 accessed on 16 October 2025.

Acknowledgments

The authors acknowledge the collaborative input from the Esri Canada Education & Research team during the research and prototyping stages, which informed workflow refinement. Administrative and technical support were provided through institutional access to geospatial software and cloud deployment platforms. During the preparation of this manuscript, the authors used OpenAI ChatGPT (GPT-5 model) for grammar refinement and code scripting assistance. The authors reviewed and edited all AI-generated content and take full responsibility for the accuracy and integrity of the manuscript.

Conflicts of Interest

The authors declare no conflicts of interest. The funders had no role in the design of the study; in the collection, analyses, or interpretation of data; in the writing of the manuscript; or in the decision to publish the results.

Abbreviations

The following abbreviations are used in this manuscript:
AGOLArcGIS Online
APIApplication Programming Interface
CI/CDContinuous Integration/Continuous Deployment
CPMCritical Path Method
CSVComma-Separated Values
DTDecision Tree
EMElectromagnetic
ExBExperience Builder (from ArcGIS Experience Builder)
GISGeographic Information System
GPRGround Penetrating Radar
GVPGlobal Volcanism Program
HTMLHyperText Markup Language
ISCInternational Seismological Centre
JSONJavaScript Object Notation
LiDARLight Detection and Ranging
MCDAMulti-Criteria Decision Analysis
NDISNatural Disaster Information System
OGCOpen Geospatial Consortium
RFRandom Forest
RPASRemotely Piloted Aircraft Systems
SaaSSoftware-as-a-Service
SARSynthetic Aperture Radar
SARSearch and Rescue
SDSSSpatial Decision Support System
SMOTESynthetic Minority Oversampling Technique
UAVUnmanned Aerial Vehicle
VEIVolcano Explosivity Index
VTOLVertical Takeoff and Landing
WFSWeb Feature Service

Appendix A. Geohazard Dataset and Engineering Supplementary Material

This appendix contains extended technical details on data harmonization and synthetic variable generation used in the NDIS framework, including fallback estimation rules, categorical mappings, and probabilistic simulation parameters. These steps were essential for preparing consistent mission-planning attributes (e.g., intensity, duration, economic loss) across heterogeneous hazard datasets. All scripts, structured workflows, and sample inputs used for the procedures described herein are publicly available on the project’s open-source GitHub repository: https://github.com/redrobbit/ndis/tree/main/ArcGIS_Pro_processing (accessed on 16 October 2025).

Appendix A.1. Volcanoes

Within ArcGIS Pro, a preprocessing workflow was developed to retain essential attributes and standardize field names. The original “Volcano Number” was renamed to HazardID to ensure a unique identifier across all hazard datasets. Coordinates were preserved as point geometries, and the HazardType field was assigned to denote volcanic hazards for consistency across multi-hazard records.
To derive mission-relevant variables, additional feature engineering was conducted:
  • Intensity: A weighted assignment of Volcanic Explosivity Index (VEI) was applied using a random distribution favoring lower VEIs to reflect natural eruption frequency patterns. The intensity category (Table A1) was derived from the Volcanic Explosivity Index (VEI) using a simplified classification scheme, loosely based on the original VEI scale proposed by Newhall and Self [62].
Table A1. Mapping of Volcanic explosivity index (VEI) ranges to intensity categories used in the NDIS framework.
VEI RangeNDIS Ordinal IntensityLabel
0–11Very Low
22Low
3–43Moderate
5–64High
7–85Extreme
  • Duration: Eruption duration was derived from the start and end date fields when available. While source data varied in temporal scale (e.g., minutes, days, or longer), all durations were standardized to minutes. For incomplete records, fallback durations were assigned using VEI-based ranges, reflecting observed correlations between eruption magnitude and temporal extent [62,63]. This estimation supports applications in mission scheduling and prioritization, where longer-duration events may indicate persistent hazards requiring extended monitoring. For each volcano, the longest recorded eruption was retained to represent maximum hazard persistence.
  • Economic Loss: Direct damage estimates were derived from a supplementary dataset containing both numeric and descriptive damage records. Where available, direct estimates from DAMAGE_MILLIONS_DOLLARS_TOTAL were used. For entries with missing financial values, qualitative descriptors (e.g., “Limited”, “Severe”) were converted into approximate monetary ranges following established disaster categorization approaches [24,64]. Remaining gaps were then estimated using intensity-based probabilistic methods, under the assumption that more intense events tend to incur greater losses [65], a common assumption in disaster impact literature.

Appendix A.2. Tsunami Ordinal Table

Table A2. Mapping of tsunami intensity values to the NDIS ordinal classification (1–5). Intensity values from TS_MT_II and TS_INTENSITY were rescaled using fixed thresholds, while fallback estimates from MAX_EVENT_RUNUP were computed using equation in Table 2.
NDIS Ordinal IntensityTS_MT_II/TS_INTENSITY Rangeh (m)
1<1.0h < 1.41
21.0–2.991.41 ≤ h < 5.66
33.0–4.495.66 ≤ h < 22.63
44.5–5.9922.63 ≤ h < 64.00
5≥ 6.0h ≥ 64.00

Appendix A.3. Notation Key Parameters for Table 1

  • d = hazard distance
  • L ,   W ,   p = predefined/user defined survey parameters (length, width, line spacing)
  • v c r u i s e = 16   m / s (average cruising speed)
  • v s e n s o r = mapping speed:
    -
    Camera, LiDAR, Hyperspectral, Multispectral, EM, Gravimeter, Gamma: 5 m/s
    -
    GPR, Thermal: 3 m/s
    -
    Magnetometer: 10 m/s
  • t d e l i v e r y = 3 min
  • T C P M = T t r a v e l + T m o n i t o r + T s e t u p

Appendix A.4. Notation Key Parameters for Table 2

  • I : Intensity (ordinal scale, 1–5)
  • T : Duration in minutes
  • L : Simulated economic loss in millions USD
  • U [ a , b ] : Uniform random sampling between a and b
  • P : Estimated population within buffer (30 km)
  • L i , U i : Minimum and maximum economic loss values for a given intensity class
  • S : Landslide size index (normalized)
  • C : Casualty index = fatalities + 0.5 × injuries
  • h : Tsunami wave height in meters at the shoreline [19].
  • M : Earthquake magnitude
  • D : Earthquake depth (km)
  • d i p ,   s l i p ,   V s e p : Fault parameters: average dip, net slip rate, vertical separation rate
  • C a p a c i t y M W : Nuclear power plant capacity in megawatts
  • f ( x ) : Mapping function to intensity (e.g., binning, scaling)

Appendix B. Additional Figures for Web Application Capabilities
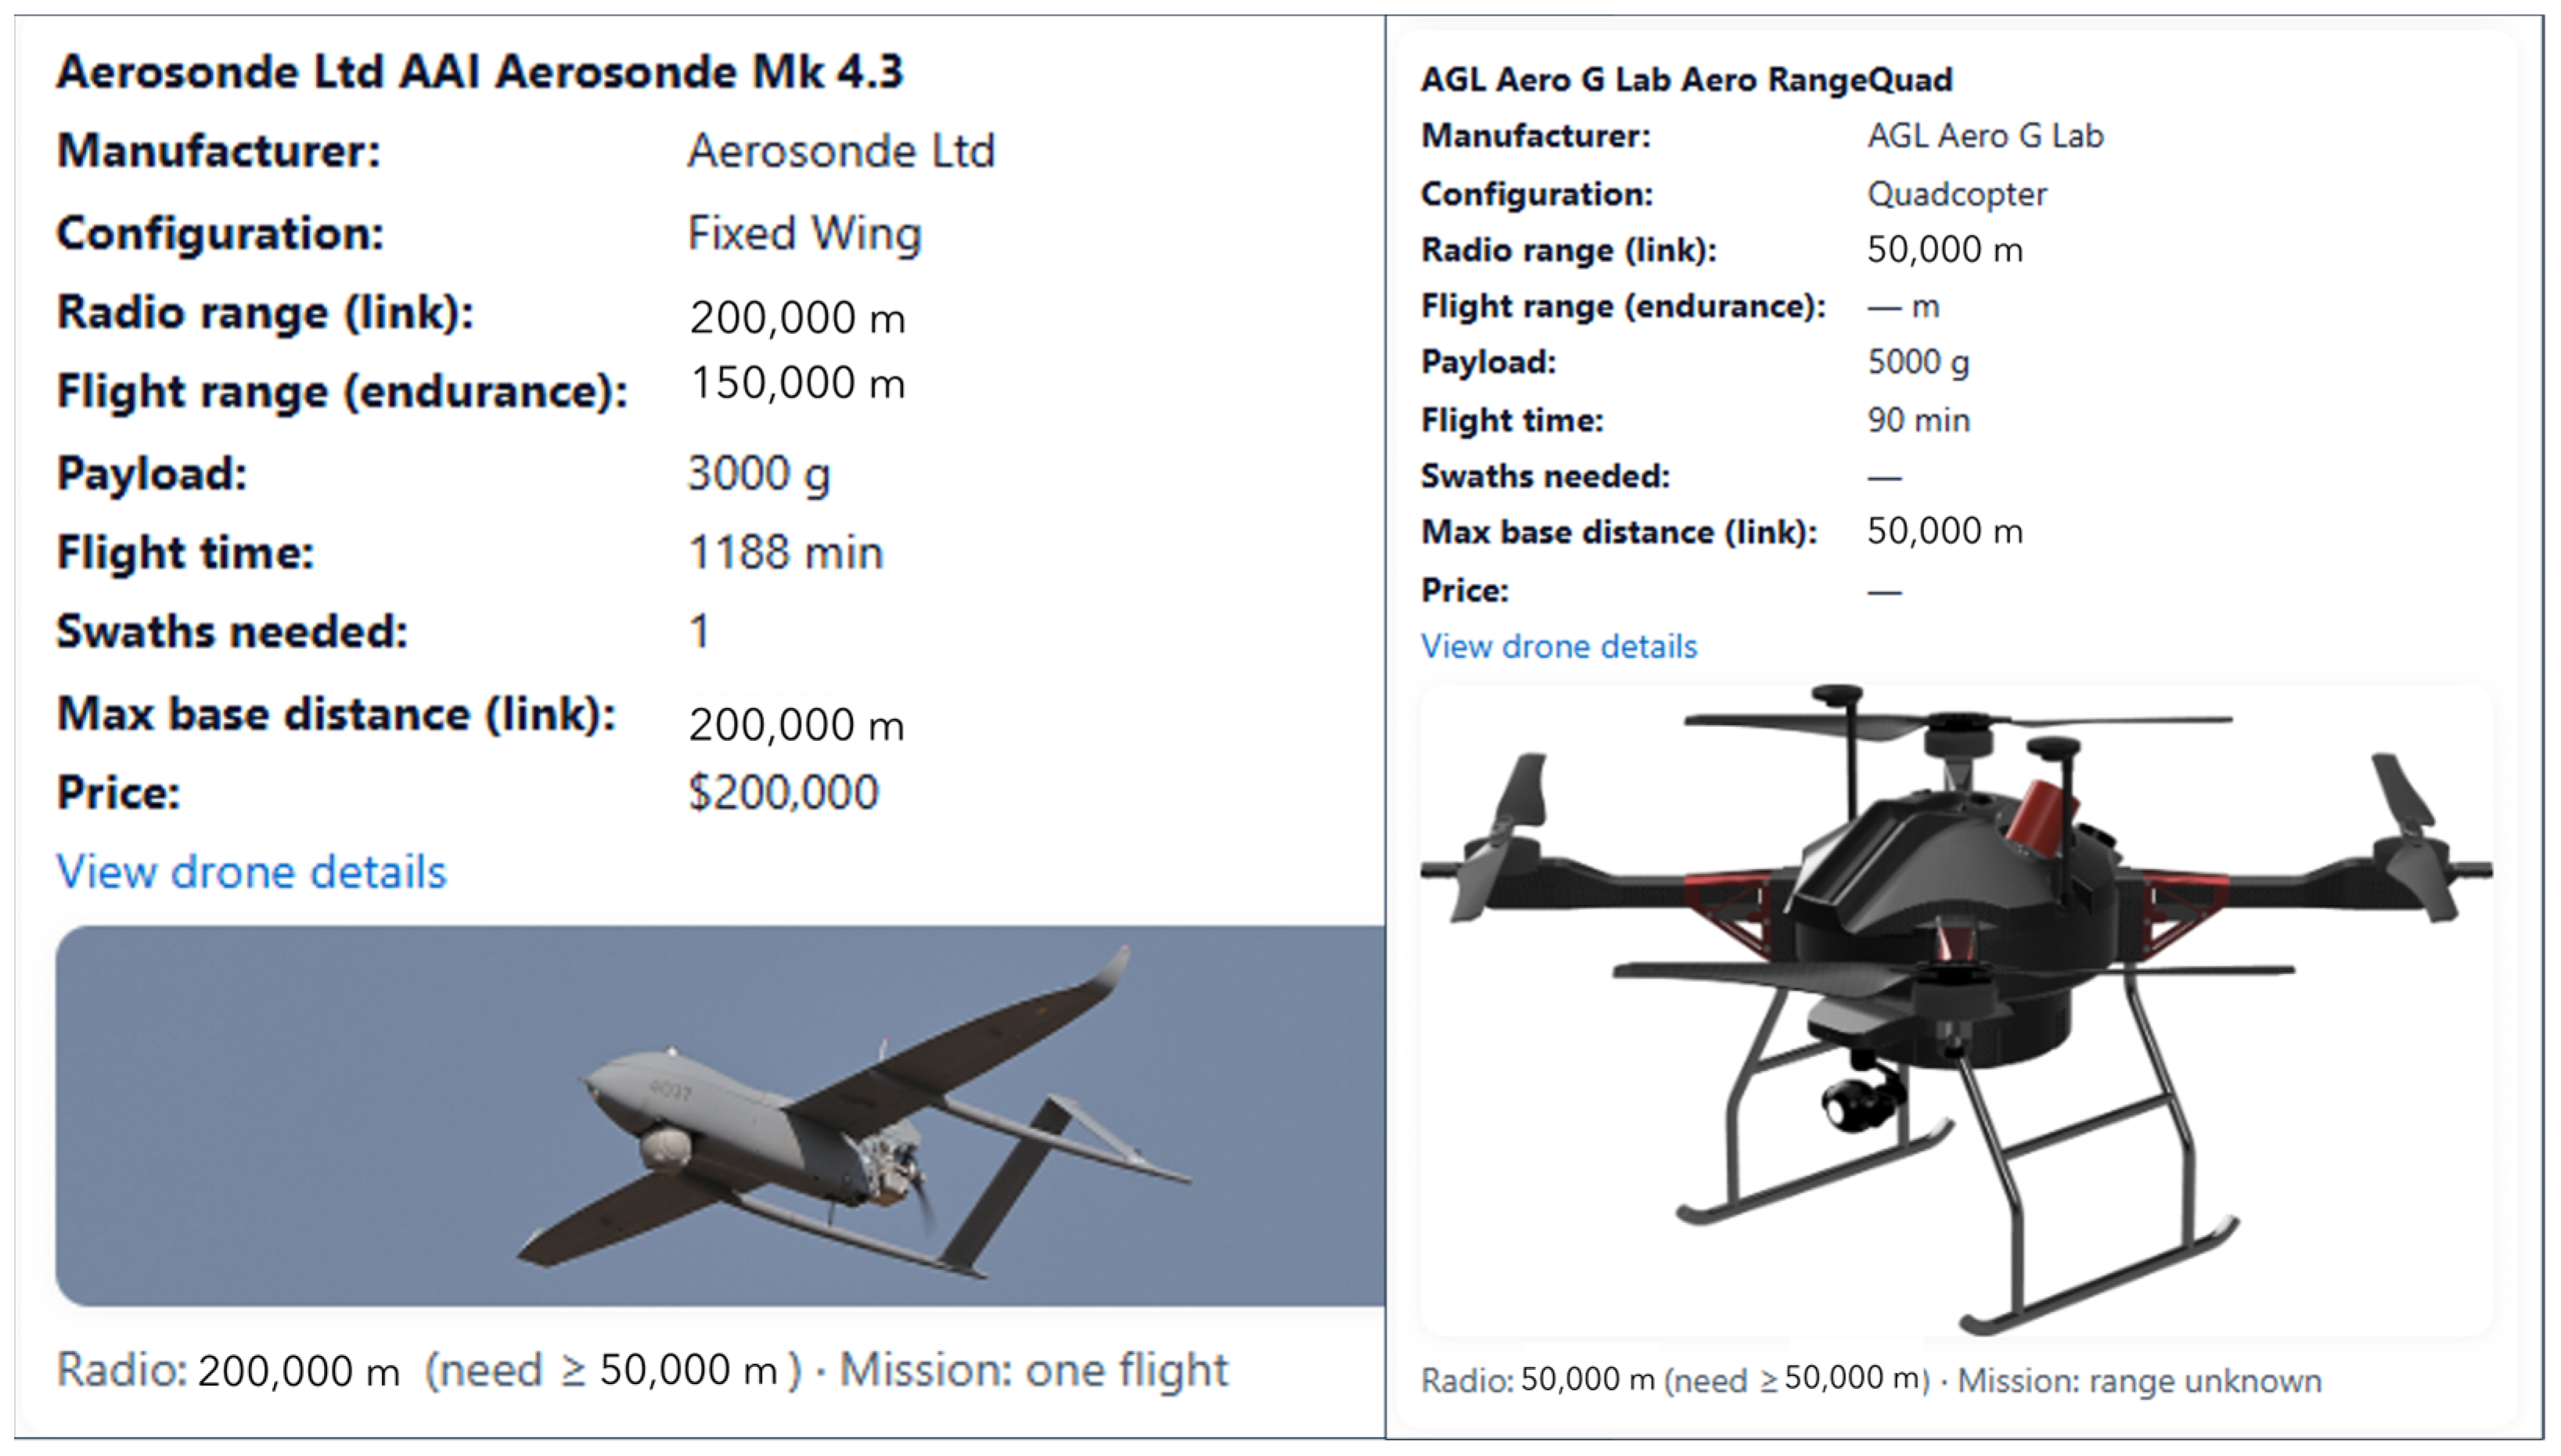
Figure A1. NDIS returns two alternative platform options for user defined mission on page 2 of the system.
Drones 09 00734 g0a1

Appendix C. System Performance and Hosting Configuration

The geospatial preprocessing tasks for the global geohazard database—including road proximity analysis, EEZ-based clipping, and zonal statistics for population exposure—were performed on a personal computing environment with the following specifications:
  • Processor: Intel(R) Core(TM) i3-5005U CPU @ 2.00 GHz
  • RAM: 16.0 GB
  • Storage: 466 GB SSD (HP SSD S700 500 GB)
  • Graphics: NVIDIA GeForce 920M (2 GB) + Intel(R) HD Graphics 5500
  • System Type: 64-bit operating system, x64-based processor
The full preprocessing pipeline, executed in ArcGIS Pro (using Python notebooks), processed approximately 1.8 million geohazard records. Runtime for the heaviest task—zonal statistics using buffered geometries—was approximately 4628 min (~3.2 days) on the above system.
Code and notebook for this workflow are publicly available in the GitHub repository: https://github.com/redrobbit/ndis/blob/main/ArcGIS_Pro_processing/00_DataPreprocessing_.ipynb accessed on 16 October 2025.
Following preprocessing, data layers were uploaded to ArcGIS Online (AGOL) and visualized through ArcGIS Experience Builder (ExB), which are managed by Esri’s cloud infrastructure and can accommodate higher user loads. The real-time mission planner—located on Page 2 of the NDIS application—calls a FastAPI backend hosted on Microsoft Azure App Services (Basic B1 SKU) with the following specifications:
  • vCPU: 1 Core
  • RAM: 1.75 GB
  • Storage: 10 GB
  • Performance Tier: Basic B1
  • Hosting Runtime: Python 3.10.16, deployed via Kudu-Lite
Typical response times for single-point mission planning remain under 3 seconds, depending on user input and regional load times. While suitable for pilot applications and training environments, users are advised to deploy on higher tiers or containerized environments for institutional or emergency operations.

References

  1. Tepylo, N.; Debelle, L.; Laliberte, J. Public Perception of Remotely Piloted Aircraft Systems in Canada. Technol. Soc. 2023, 73, 102242. [Google Scholar] [CrossRef]
  2. Manfreda, S.; McCabe, M.F.; Miller, P.E.; Lucas, R.; Pajuelo Madrigal, V.; Mallinis, G.; Ben Dor, E.; Helman, D.; Estes, L.; Ciraolo, G.; et al. On the Use of Unmanned Aerial Systems for Environmental Monitoring. Remote Sens. 2018, 10, 641. [Google Scholar] [CrossRef]
  3. Li, T.; Wang, C.; Meng, M.Q.-H.; de Silva, C.W. Coverage Sampling Planner for UAV-Enabled Environmental Exploration and Field Mapping. In Proceedings of the 2019 IEEE/RSJ International Conference on Intelligent Robots and Systems (IROS), Macau, China, 4–8 November 2019. [Google Scholar]
  4. Gómez-López, J.M.; Pérez-García, J.L.; Mozas-Calvache, A.T.; Delgado-García, J. Mission Flight Planning of RPAS for Photogrammetric Studies in Complex Scenes. ISPRS Int. J. Geo-Inf. 2020, 9, 392. [Google Scholar] [CrossRef]
  5. Quamar, M.M.; Al-Ramadan, B.; Khan, K.; Shafiullah, M.; El Ferik, S. Advancements and Applications of Drone-Integrated Geographic Information System Technology—A Review. Remote Sens. 2023, 15, 5039. [Google Scholar] [CrossRef]
  6. Dinitz, L.; Forney, W.; Byrd, K. Decision-Support Systems for Natural-Hazards and Land-Management Issues; U.S. Geological Survey: Reston, VA, USA, 2012. [Google Scholar]
  7. Newman, J.P.; Maier, H.R.; Riddell, G.A.; Zecchin, A.C.; Daniell, J.E.; Schaefer, A.M.; van Delden, H.; Khazai, B.; O’Flaherty, M.J.; Newland, C.P. Review of Literature on Decision Support Systems for Natural Hazard Risk Reduction: Current Status and Future Research Directions. Environ. Model. Softw. 2017, 96, 378–409. [Google Scholar] [CrossRef]
  8. Elkady, S.; Hernantes, J.; Labaka, L. Decision-Making for Community Resilience: A Review of Decision Support Systems and Their Applications. Heliyon 2024, 10, e33116. [Google Scholar] [CrossRef] [PubMed]
  9. Donezar-Hoyos, U.; Albizua-Huarte, L.; Amezketa-Lizarraga, E.; Barinagarrementeria-Arrese, I.; Ciriza, R.; De Blas-Corral, T.; Larrañaga-Urien, A.; Ros-Elso, F.; Tamés-Noriega, A.; Viñuales-Lasheras, M.; et al. The Copernicus EMS Validation Service as a Vector for Improving the Emergency Mapping Based on Sentinel Data. Rev. Teledetec. 2020, 56, 23–34. [Google Scholar] [CrossRef]
  10. Montoya-Montes, I.; Quental, L.; Galindo, I.; Holohan, E.P.; Jaud, M.; Parker, K.; Rodrigues, D.; Gonçalves, P.; Sánchez, N.; García, I.; et al. Copernicus Services and Geohazards Management. Lessons Learnt from Citizens’ Observatories. In Citizens’ Observatories on Geohazards: Lessons from Five Pilots; Springer Nature: Cham, Switzerland, 2025; pp. 43–67. [Google Scholar]
  11. Deligne, N.; King, A.; Jolly, G.; Wilson, G.; Wilson, T.; Lindsay, J. RiskScape Volcano: Development of a Risk Assessment Tool for Volcanic Hazards. In Proceedings of the EGU General Assembly Conference Abstracts, Vienna, Austria, 7–12 April 2013; p. 6159. [Google Scholar]
  12. King, A.; Bell, R. Riskscape New Zealand—A Multihazard Loss Modelling Tool. In Proceedings of the Earthquake Engineering in the 21st Century (EE-21C) Conference, Skopje-Ohrid, Macedonia, 27 August–1 September 2005; Volume 5. [Google Scholar]
  13. Pranantyo, I.R.; Fadmastuti, M.; Chandra, F. InaSAFE Applications in Disaster Preparedness. In AIP Conference Proceedings; AIP Publishing LLC: Melville, NY, USA, 2015; p. 060001. [Google Scholar]
  14. Wald, D.J.; Earle, P.S.; Allen, T.I.; Jaiswal, K.; Porter, K.; Hearne, M. Development of the U.S. Geological Survey’s PAGER System (Prompt Assessment of Global Earthquakes for Response). In Proceedings of the 14th World Conference on Earthquake Engineering, Beijing, China, 12–17 October 2008; USGS Publications Warehouse: Reston, VA, USA, 2008. [Google Scholar]
  15. Wald, D.J.; Jaiswal, K.S.; Marano, K.D.; Hearne, M. Earthquakes, PAGER; Geologic Hazards Science Center: Golden, CO, USA, 2019; pp. 1–5. [Google Scholar]
  16. Wald, D.; Wald, L.; Worden, B.; Goltz, J. ShakeMap, a Tool for Earthquake Response; Fact Sheet 087-03; U.S. Geological Survey: Reston, VA, USA, 2003. [Google Scholar] [CrossRef]
  17. United Nations. The 17 Goals. Available online: https://sdgs.un.org/goals (accessed on 13 January 2022).
  18. Anzai, K.; Ban, N.; Ozawa, T.; Tokonami, S. Fukushima Daiichi Nuclear Power Plant Accident: Facts, Environmental Contamination, Possible Biological Effects, and Countermeasures. J. Clin. Biochem. Nutr. 2011, 50, 2–8. [Google Scholar] [CrossRef] [PubMed]
  19. Soloviev, S.L.; Go, C.N. Catalogue of Tsunamis on the Western Shore of the Pacific Ocean; Canadian Translation of Fisheries and Aquatic Sciences: Ottawa, ON, Canada, 1974. [Google Scholar]
  20. Volcanoes of the World, v.4.3.4. Available online: https://volcano.si.edu/database/webservices.cfm (accessed on 7 July 2022).
  21. National Geophysical Data Center/World Data Service (NGDC/WDS). NCEI/WDS Global Significant Volcanic Eruptions Database; NOAA National Centers for Environmental Information: Boulder, CO, USA, 2001. [Google Scholar] [CrossRef]
  22. Kirschbaum, D.B.; Adler, R.; Hong, Y.; Hill, S.; Lerner-Lam, A. A Global Landslide Catalog for Hazard Applications: Method, Results, and Limitations. Nat. Hazards 2010, 52, 561–575. [Google Scholar] [CrossRef]
  23. Kirschbaum, D.; Stanley, T.; Zhou, Y. Spatial and Temporal Analysis of a Global Landslide Catalog. Geomorphology 2015, 249, 4–15. [Google Scholar] [CrossRef]
  24. Wallemacq, P.; House, R. Economic Losses, Poverty and Disasters 1998–2017; Centre for Research on the Epidemiology of Disasters (CRED): Brussels, Belgium; United Nations Office for Disaster Risk Reduction (UNDRR): Geneva, Switzerland, 2018. [Google Scholar]
  25. Highland, L.M.; Bobrowsky, P. The Landslide Handbook—A Guide to Understanding Landslides; US Geological Survey: Reston, VA, USA, 2008. [Google Scholar]
  26. National Geophysical Data Center/World Data Service NCEI/WDS. NCEI/WDS Global Historical Tsunami Database; NOAA National Centers for Environmental Information: Boulder, CO, USA, 2024. [Google Scholar] [CrossRef]
  27. Papadopoulos, G.; Imamura, F. Proposal for a New Tsunami Intensity Scale. ITS 2001 Proc. 2001, 5, 1–5. [Google Scholar]
  28. Jongman, B.; Kreibich, H.; Apel, H.; Barredo, J.I.; Bates, P.D.; Feyen, L.; Gericke, A.; Neal, J.; Aerts, J.C.J.H.; Ward, P.J. Comparative Flood Damage Model Assessment: Towards a European Approach. Nat. Hazards Earth Syst. Sci. 2012, 12, 3733–3752. [Google Scholar] [CrossRef]
  29. Styron, R.; Pagani, M. The GEM Global Active Faults Database. Earthq. Spectra 2020, 36, 160–180. [Google Scholar] [CrossRef]
  30. Pan, S.; Naliboff, J.; Bell, R.; Jackson, C. Bridging Spatiotemporal Scales of Normal Fault Growth During Continental Extension Using High-Resolution 3D Numerical Models. Geochem. Geophys. Geosystems 2022, 23. [Google Scholar] [CrossRef]
  31. Solares-Colón, M.M.; Goldberg, D.E.; Melgar, D.; Vanacore, E.A.; Sahakian, V.J.; Yeck, W.L.; Hernández, F.; López-Venegas, A.M. Slow Rupture, Long Rise Times, and Multi-Fault Geometry: The 2020 M6.4 Southwestern Puerto Rico Mainshock. Geophys. Res. Lett. 2025, 52, e2024GL109740. [Google Scholar] [CrossRef]
  32. Albini, P.; Musson, R.M.W.; Rovida, A.; Locati, M.; Gomez Capera, A.A.; Viganò, D. The Global Earthquake History. Earthq. Spectra 2014, 30, 607–624. [Google Scholar] [CrossRef]
  33. Albini, P.; Musson, R.M.W.; Gomez Capera, A.A.; Locati, M.; Rovida, A.; Stucchi, M.; Viganò, D. Global Historical Earthquake Archive and Catalogue (1000–1903); GEM Technical Report 2013-01 V1.0.0; GEM Foundation: Pavia, Italy, 2013. [Google Scholar]
  34. Albini, P.; Musson, R.M.W.; Gómez Capera, A.A.; Locati, M.; Rovida, A.; Stucchi, M.; Viganò, D. Global Historical Earthquake Catalogue (GHEC v1.0); GEM Foundation: Pavia, Italy, 2013; Available online: https://www.emidius.eu/GEH/ (accessed on 4 August 2023).
  35. Stucchi, M.; Rovida, A.; Gomez Capera, A.A.; Alexandre, P.; Camelbeeck, T.; Demircioglu, M.B.; Gasperini, P.; Kouskouna, V.; Musson, R.M.W.; Radulian, M.; et al. The SHARE European Earthquake Catalogue (SHEEC) 1000–1899. J. Seism. 2013, 17, 523–544. [Google Scholar] [CrossRef]
  36. International Seismological Centre. ISC Bulletin ISC On-line Bulletin; International Seismological Centre: Thatcham, UK, 2023. [Google Scholar] [CrossRef]
  37. Storchak, D.A.; Harris, J.; Brown, L.; Lieser, K.; Shumba, B.; Verney, R.; Di Giacomo, D.; Korger, E.I.M. Rebuild of the Bulletin of the International Seismological Centre (ISC), Part 1: 1964–1979. Geosci. Lett. 2017, 4, 32. [Google Scholar] [CrossRef]
  38. Gutenberg, B.; Richter, C.F. Magnitude and Energy of Earthquakes. Ann. Geophys. 1956, 9, 1–15. [Google Scholar] [CrossRef]
  39. Houston, H. Influence of Depth, Focal Mechanism, and Tectonic Setting on the Shape and Duration of Earthquake Source Time Functions. J. Geophys. Res. Solid Earth 2001, 106, 11137–11150. [Google Scholar] [CrossRef]
  40. Sbarra, P.; Burrato, P.; Tosi, P.; Vannoli, P.; De Rubeis, V.; Valensise, G. Inferring the Depth of Pre-Instrumental Earthquakes from Macroseismic Intensity Data: A Case-History from Northern Italy. Sci. Rep. 2019, 9, 15583. [Google Scholar] [CrossRef]
  41. Jaiswal, K.; Wald, D. An Empirical Model for Global Earthquake Fatality Estimation. Earthq. Spectra 2010, 26, 1017–1037. [Google Scholar] [CrossRef]
  42. Global Energy Monitor Global Nuclear Power Tracker. July 2024 Release; Global Energy Monitor: San Francisco, CA, USA. Available online: https://globalenergymonitor.org/projects/global-nuclear-power-tracker/download-data/ (accessed on 2 April 2025).
  43. Ayoub, A.; Wainwright, H.M.; Sansavini, G.; Gauntt, R.; Saito, K. Resilient Design in Nuclear Energy: Critical Lessons from a Cross-Disciplinary Analysis of the Fukushima Dai-Ichi Nuclear Accident. iScience 2024, 27, 109485. [Google Scholar] [CrossRef]
  44. Locknear, F. Cost To Build A Nuclear Power Plant: 2025 Prices & Rates. The Cost Guys. Available online: https://thecostguys.com/business/build-nuclear-power-plant (accessed on 2 April 2025).
  45. Flanders Marine Institute. Union of the ESRI Country Shapefile and the Exclusive Economic Zones (Version 4); Flanders Marine Institute (VLIZ): Ostend, Belgium, 2024; Available online: https://www.marineregions.org/ (accessed on 20 February 2025).
  46. Meijer, J.R.; Huijbregts, M.A.J.; Schotten, K.C.G.J.; Schipper, A.M. Global Patterns of Current and Future Road Infrastructure. Environ. Res. Lett. 2018, 13, 064006. [Google Scholar] [CrossRef]
  47. Center for International Earth Science Information Network; CIESIN-Columbia University. Population of the World, Version 4 (GPWv4): Population Count, Revision 11 (Version 4.11) [Data Set]; NASA Socioeconomic Data and Applications Center (SEDAC): Palisades, NY, USA, 2018. [Google Scholar]
  48. Drone Industry Insights The Drone Market Environment Map 2022. Available online: https://droneii.com/project/drone-market-environment-map (accessed on 23 May 2023).
  49. Nalimov, V.V.; Mulchenko, Z.M. Scientometrics: Studies of the Development of Science as an Information Process; Foreign Technology Division, Wright-Patterson Air Force Base: Dayton, OH, USA, 1971; Edited machine translation of the 1969 Russian original by Robert D. Hill, NTIS Issue No. 197205. [Google Scholar]
  50. Elsevier Engineering Village. Available online: https://www.engineeringvillage.com/ (accessed on 6 February 2024).
  51. Vallée, M.A.; Mazur, S. Advances in Magnetic and Electromagnetic Techniques for Mineral Exploration: Enhancing Resource Discovery. Minerals 2025, 15, 595. [Google Scholar] [CrossRef]
  52. Pour, A.B.; Zoheir, B.; Pradhan, B.; Hashim, M. Editorial for the Special Issue: Multispectral and Hyperspectral Remote Sensing Data for Mineral Exploration and Environmental Monitoring of Mined Areas. Remote Sens. 2021, 13, 519. [Google Scholar] [CrossRef]
  53. Keenan, P.B. Spatial Decision Support Systems. In Decision-Making Support Systems; IGI Global: Hershey, PA, USA, 2003; pp. 28–39. [Google Scholar]
  54. Malczewski, J. GIS-based Multicriteria Decision Analysis: A Survey of the Literature. Int. J. Geogr. Inf. Sci. 2006, 20, 703–726. [Google Scholar] [CrossRef]
  55. Darmawan, H.; Walter, T.R.; Brotopuspito, K.S.; Nandaka, I.G.M.A. Morphological and Structural Changes at the Merapi Lava Dome Monitored in 2012–2015 Using Unmanned Aerial Vehicles (UAVs). J. Volcanol. Geotherm. Res. 2018, 349, 256–267. [Google Scholar] [CrossRef]
  56. Drone-Laws Drone Laws in North Korea. Available online: https://drone-laws.com/drone-laws-in-north-korea (accessed on 3 October 2025).
  57. JARUS. JARUS Guidelines on Specific Operations Risk Assessment (SORA); Joint Authorities for Rulemaking on Unmanned Systems: Brussels, Belgium, 2019; Available online: http://jarus-rpas.org/publications/ (accessed on 25 October 2022).
  58. Brewer, C.; Harrower, M. The Pennsylvania State University Color Brewer 2.0: Color Advice for Cartography. Available online: https://colorbrewer2.org/#type=qualitative&scheme=Dark2&n=3 (accessed on 10 June 2025).
  59. Frerebeau, N. Tol: Colour Schemes for Data Visualization, Version 0.4.2; 2025. Available online: https://cran.r-project.org/web/packages/khroma/vignettes/tol.html (accessed on 11 June 2025).
  60. Tol, P. Colour Schemes and Templates; SRON Netherlands Institute for Space Research: Utrecht, The Netherlands, 2021; Available online: https://sronpersonalpages.nl/~pault/ (accessed on 11 June 2025).
  61. GEM Systems. DRONEmag™ UAV Magnetometer—Technical Specifications; GEM Systems Advanced Magnetometers: Ontario, Canada, 2023; Available online: https://www.gemsys.ca/wp-content/themes/gemsystems/pdf/GEM_Drone_Mag-GSMP_35U.pdf (accessed on 15 July 2025).
  62. Newhall, C.G.; Self, S. The Volcanic Explosivity Index (VEI) an Estimate of Explosive Magnitude for Historical Volcanism. J. Geophys. Res. Ocean. 1982, 87, 1231–1238. [Google Scholar] [CrossRef]
  63. Auker, M.R.; Sparks, R.S.J.; Siebert, L.; Crosweller, H.S.; Ewert, J. A Statistical Analysis of the Global Historical Volcanic Fatalities Record. J. Appl. Volcanol. 2013, 2, 2. [Google Scholar] [CrossRef]
  64. Guha-Sapir, D.; Hoyois, P.; Below, R. Annual Disaster Statistical Review 2015: The Numbers and Trends; Université Catholique de Louvain: Brussels, Belgium, 2016. [Google Scholar]
  65. Delforge, D.; Wathelet, V.; Below, R.; Sofia, C.L.; Tonnelier, M.; Loenhout, J.v.; Speybroeck, N. EM-DAT: The Emergency Events Database. Int. J. Disaster Risk Reduct. 2025, 102, 105509. [Google Scholar] [CrossRef]
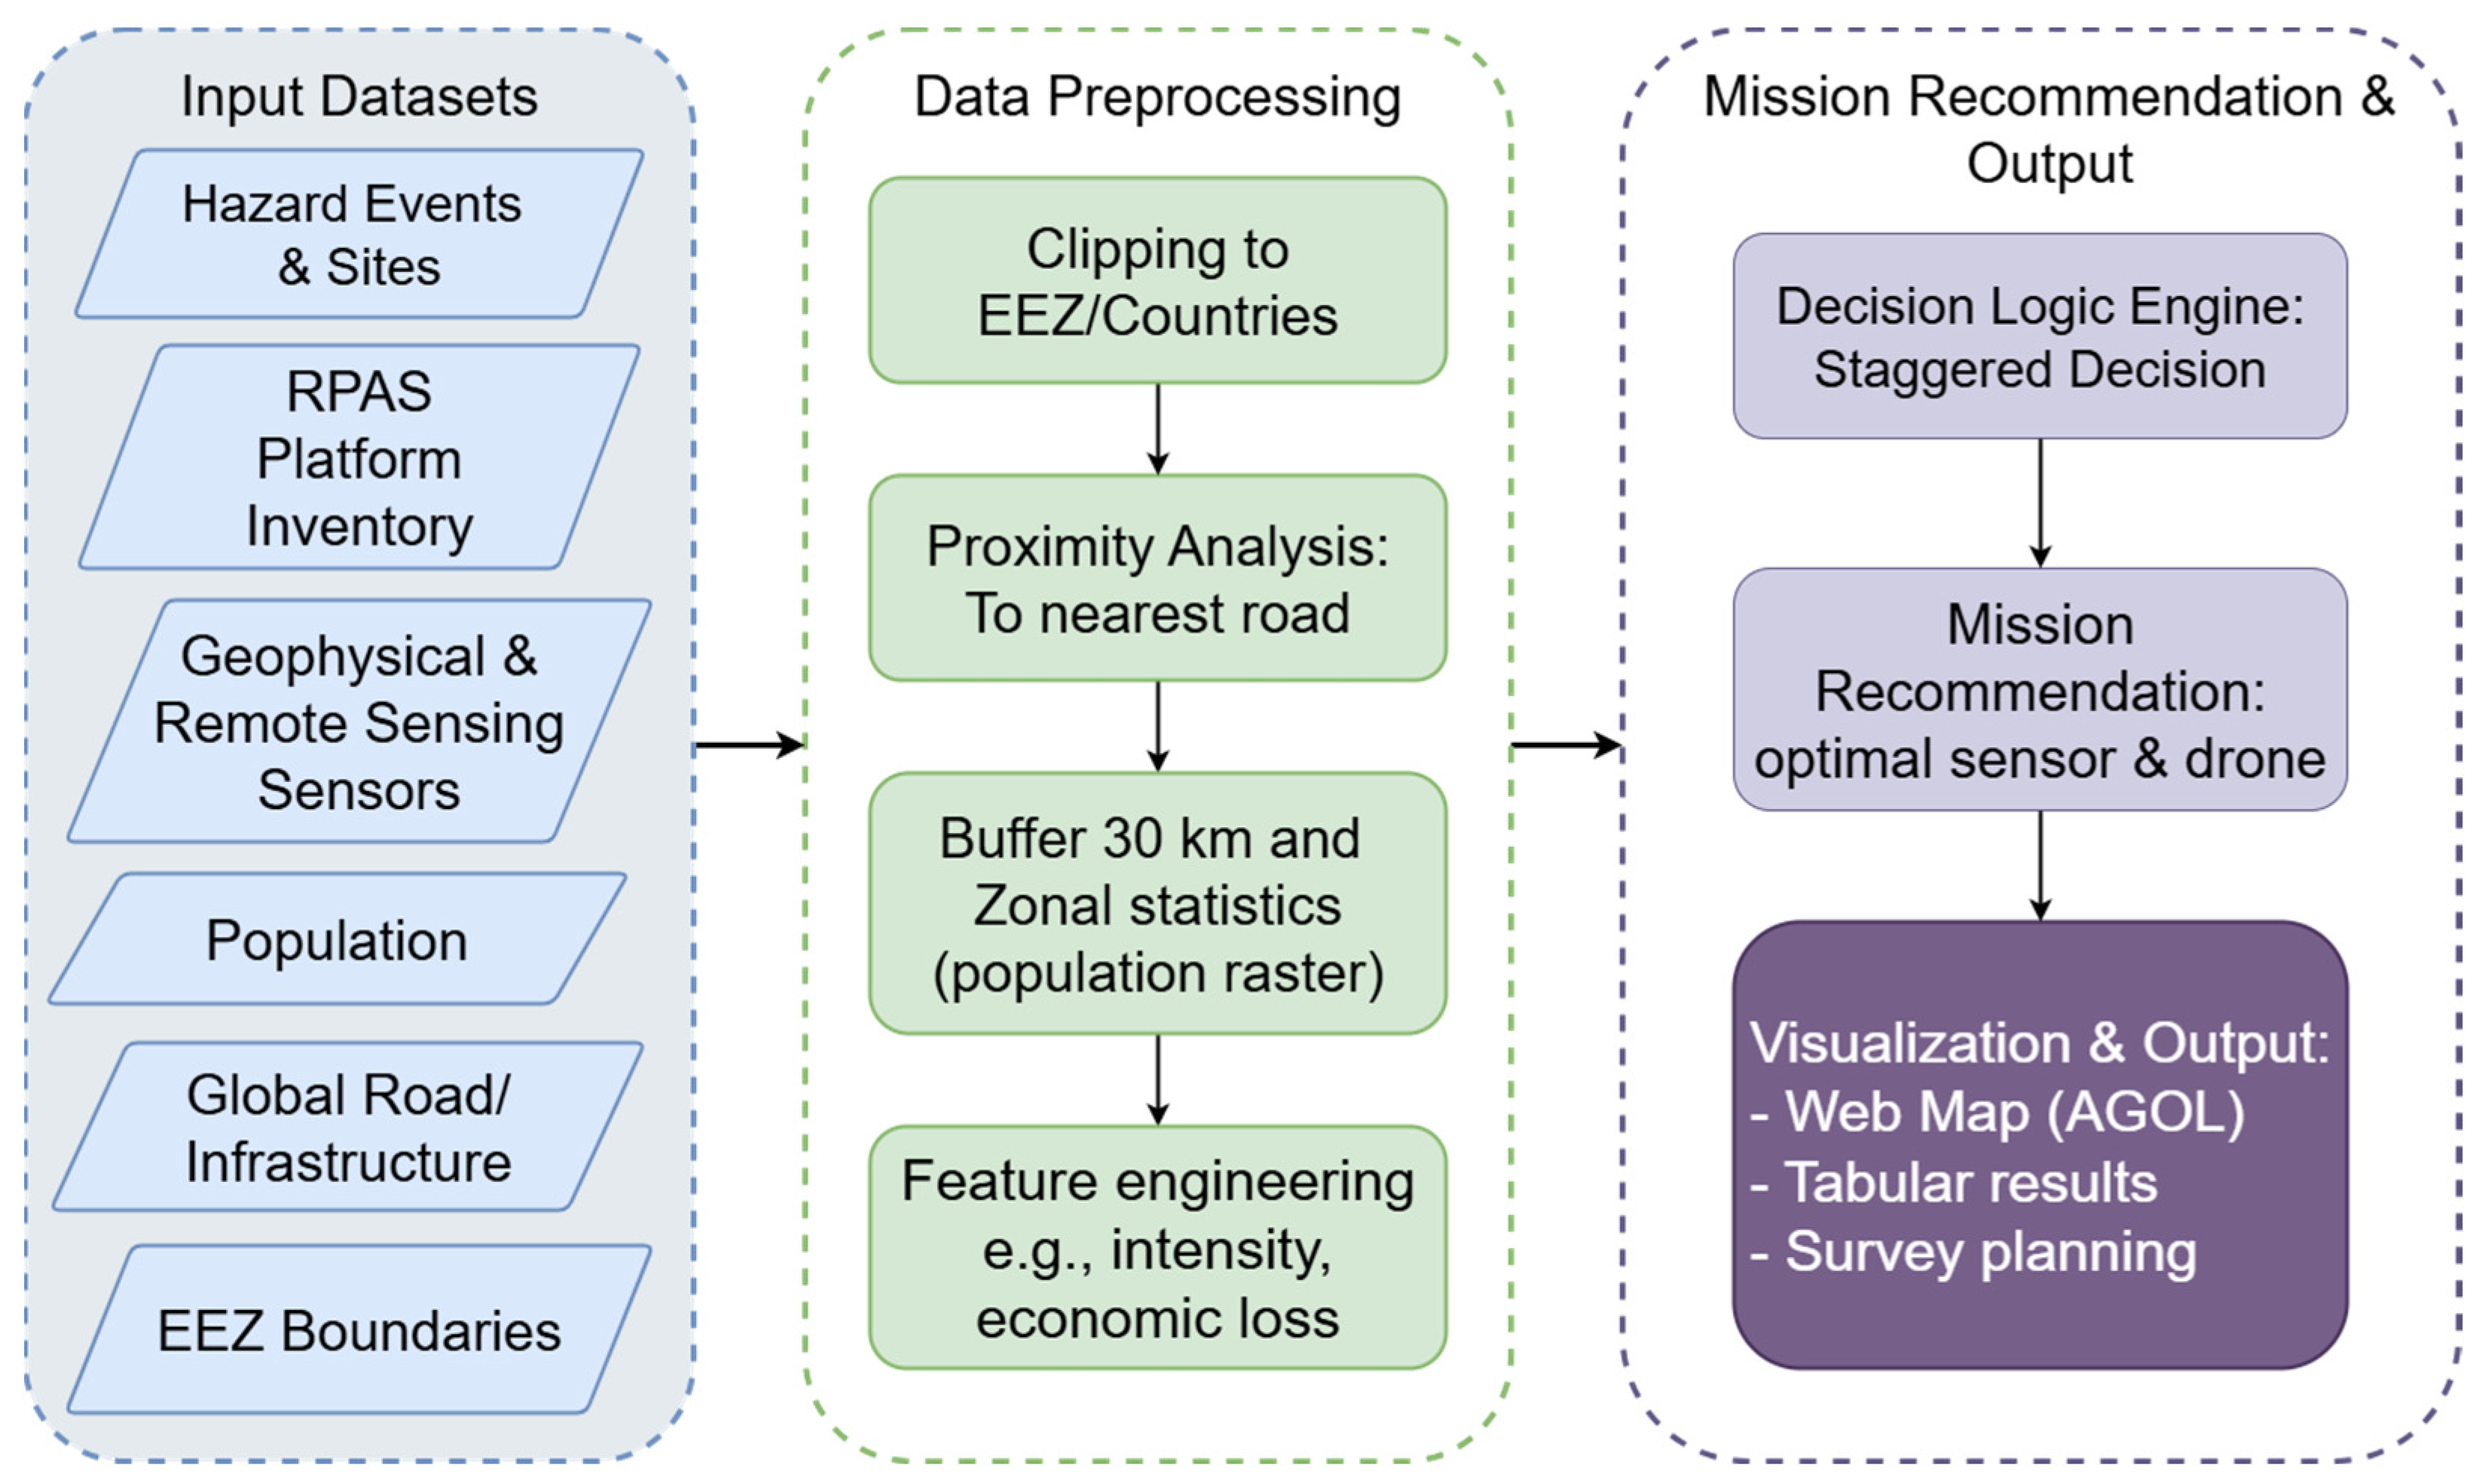
Figure 1. Schematic overview of the NDIS implementation pipeline, illustrating the sequence from data compilation, preprocessing, and decision logic to sensor–drone mission recommendation.
Drones 09 00734 g001
Figure 2. Distribution of hazard entries by type in the compiled dataset (1900–2023). Data were aggregated from multiple sources (for specific sources, see subsections in the text). Hazard types are ordered by record count for visualization purposes. The processing order in the manuscript differs slightly based on dataset structure and harmonization workflows.
Drones 09 00734 g002
Figure 3. Workflow for spatial preprocessing of geohazard data. Hazard points were first clipped to Exclusive Economic Zones (EEZ) boundaries (Clip Analysis) to define operational areas. Subsequently, proximity analysis was performed to compute the geodesic distance from each geohazard site to the nearest road segment.
Drones 09 00734 g003
Figure 4. Distribution of geohazard events and sites by proximity to the global road network. Distances are given in geodesic distance.
Drones 09 00734 g004
Figure 5. Sample map of geohazard–road proximity analysis in the Fukuoka region, Japan. Distance values were calculated using the GRIP road dataset to support RPAS deployment planning.
Drones 09 00734 g005
Figure 6. Hazard events and sites within 30 km of populated areas (Over 10,000 People). Colors correspond to hazard categories and follow the color palette used in the NDIS interface: nuclear power plant (yellow), landslide (purple), volcano (orange), tsunami (blue), fault (gray), and earthquake (green).
Drones 09 00734 g006
Figure 7. Sample buffering and zonal statistics process for estimating population exposure around a nuclear power plant in eastern China.
Drones 09 00734 g007
Figure 8. Communication range distribution of 118 RPAS with available range data.
Drones 09 00734 g008
Figure 9. Distribution of maximum payload weight for 161 RPAS used herein.
Drones 09 00734 g009
Figure 10. Scientometrics analysis of geohazards and geophysical methods, where the x-axis is the count of publications found, and the y-axis shows geophysical methods.
Drones 09 00734 g010
Figure 11. Workflow of the “Staggered Decision Method” implemented in NDIS version 3.
Drones 09 00734 g011
Figure 12. Information flow and system architecture of the NDIS platform. Details about the components are given in the text and are not repeated here.
Drones 09 00734 g012
Figure 13. Landing page of the NDIS web application (Page 1), showing the homepage layout with the NDIS App tab and icon below the logo. Users can access the main interface by selecting either entry point.
Drones 09 00734 g013
Figure 14. Main interface of the NDIS application (Page 2), showing user-defined mission input panel (left) and preprocessed geohazard recommendations (right). Sidebar (purple box) displays recommended drone–sensor combinations and mission parameters and pop-up windows (green box).
Drones 09 00734 g014
Figure 15. User-defined mission interface of the NDIS application (Page 2), showing the parameter form used to specify hazard type, distance, and survey area. After submission, the system returns a mission summary with a recommended sensor–drone pair.
Drones 09 00734 g015
Figure 16. Main NDIS Application interface on page 2 (left part: user defined mission parameter and results (green box), right part: predefined recommendations).
Drones 09 00734 g016
Figure 17. NDIS Interface page 3 with statistical information about hazard events and sites driven by the geohazards database.
Drones 09 00734 g017
Figure 18. Crowdsourced data submission interface on Page 4 of the NDIS web application, implemented using ArcGIS Survey123 (green box).
Drones 09 00734 g018
Figure 19. Hypothetical NDIS output for a high--restriction jurisdiction scenario, showing the recommended platforms for a simulated gamma spectrometry mission near a North Korean site. The yellow box highlights the DJI FlyCart 30 among the suggested drones for extended transmission--range operations.
Drones 09 00734 g019
Figure 20. Top 15 most frequently recommended drone models by hazard type.
Drones 09 00734 g020
Table 1. Attributes and engineered features used in RPAS mission planning, summarized by mission type. Variables include hazard distance, mission distance, travel time, monitoring time, setup buffer, and total CPM duration.
Mission TypeMission Distance
D
Travel Time
T t r a v e l
Monitor Time
T m o n i t o r
Setup Buffer
T s e t u p
CPM Total Time
T C P M
Delivery D = d d v c r u i s e · 60 t d e l i v e r y 20 min T t r a v e l + T m o n i t o r + T s e t u p
Mapping D =   W p · L
or
D =   π d
(LiDAR alternative)
d v c r u i s e · 60 D v s e n s o r · 60 40 min T t r a v e l + T m o n i t o r + T s e t u p
Note: See Appendix A.3 for full notation key and parameter definitions.
Table 2. Harmonized derived attributes for each hazard type used in the NDIS framework. All hazard-specific intensity metrics (e.g., VEI for volcanoes, Soloviev–Imamura scale for tsunamis, magnitude and depth for earthquakes) were converted to a unified NDIS ordinal intensity scale (1–5). Duration and economic loss values were either obtained from source records or simulated using hazard-specific engineered equations and fallback logic. These attributes were not intended as predictive models but as internally consistent prioritization inputs for RPAS mission planning.
Hazard TypeIntensityDuration (min)Economic Loss (in M US$)
Volcanoes I = f ( V E I ) , where
  V E I = R e p o r t e d R a n d   w e i g h t e d
See Table A1 for ordinal scale
T = ( t e n d t s t a r t ) · 1440 ,   i f   k n o w n U a , b ,     b a s e d   o n   V E I L = R e p o r t e d     D e s c r i p t o r   U L i , U i
Landslides I = 0.7⋅S + 0.3⋅C
S =   size ,   C = s c a l e d   c a s s u a l t i e s
T ~ U a , b , based on I L = U L i , U i · P 10 6 + 0.05 · ( f a t a l i t i e s + 0.5 · i n j u r i e s )
Tsunamis I =   f(TS_MT_II)
or
I =   l o g 2 2 · h
Eq. reference [19].
See Table A2 for ordinal scale
T ~ U a , b , based on I L = U L i , U i · P 10 6 + 0.1 · ( f a t a l i t i e s + 0.5 · i n j u r i e s )
Faults I = 0.3 · d i p 90 + + 0.4 · s l i p 100 + 0.3 · V s e p 50 T ~ U a , b , based on I L = U L i , U i · P 10 6
Earthquakes I = F ( M ) +   D
D =   + 1 ,   i f   D < 10   km 0 ,   10 D < 70   km 1 ,   70 D < 300   km 2 ,   D 300   km
T ~ U a , b , based on I L = U L i , U i · P 10 6
Nuclear Power Plants I = 5 T = 1440 L = 11 .   5 · C a p a c i t y M W
Note: See Appendix A.3 for full notation key and parameter definitions.
Table 3. Evaluation Summary of Sensor–Drone Assignment Methods (DT = decision tree, RF = random forest).
ApproachDescriptionInterpretabilityAdaptabilityConstraint HandlingOutcome
(i) Independent DTSeparate trees for sensor & droneHighLowWeakDiscarded
(ii) Combined DTJoint tree for sensor–droneMediumLowModerateDiscarded
(iii) RF ClassifierEnsemble classifierLowLowWeakDiscarded
(iv) Staggered DecisionModular logic-based systemHighHighStrongSelected
Table 4. Recommended geophysical survey methods based on hazard type and disaster stage. (Adapted from scientometric review; radar-based methods are substituted with LiDAR for payload harmonization.).
Hazard TypeDisaster PhaseRecommended Sensors
VolcanoPre-EventMagnetometers, Seismic, Camera
VolcanoDuringThermal Camera, Camera, LiDAR
VolcanoPost-EventLiDAR, Camera, Seismic
VolcanoClean-UpLiDAR, Camera, Seismic
EarthquakePre-EventSeismic, Magnetometers, Camera
EarthquakeDuringSeismic, Camera, LiDAR
EarthquakePost-EventLiDAR, Camera, Seismic
FaultPre-EventSeismic, Magnetometers, Camera
FaultPost-EventSeismic, Camera, LiDAR
LandslidePre-EventLiDAR, GPR, Camera
LandslideDuringCamera, Thermal Camera, LiDAR
LandslidePost-EventLiDAR, Seismic, Camera
LandslideClean-UpCamera, LiDAR, Seismic
TsunamiDuringBPR, Camera, Seismic
TsunamiPost-EventBPR, LiDAR, Camera
TsunamiClean-UpCamera, LiDAR, Thermal Camera
NuclearPre-EventThermal Camera, Camera, LiDAR
NuclearDuringThermal Camera, Camera, LiDAR
NuclearPost-EventCamera, LiDAR, Gamma Spectrometer
NuclearClean-UpCamera, LiDAR, Gamma Spectrometer
Table 5. Comparative Features of Selected Hazard Decision-Support Systems and NDIS.
FeatureShakeMapPAGERCopernicus EMSInaSAFENDIS
Hazard InputEarthquake onlyEarthquake onlyMultipleMultipleMultiple
Data SourceUSGSUSGS +
Pop. Data
Satellite
imagery
Local hazard
layers
Global
multisource
Mission
Planning
Sensor
Matching
Drone
Matching
Output TypeMaps, AlertsCasualty EstimatesThematic MapsImpact
Summary
Drone-Sensor Pair+CPM
Disclaimer/Publisher’s Note: The statements, opinions and data contained in all publications are solely those of the individual author(s) and contributor(s) and not of MDPI and/or the editor(s). MDPI and/or the editor(s) disclaim responsibility for any injury to people or property resulting from any ideas, methods, instructions or products referred to in the content.