Article

Full-Vehicle Experimental Investigation of Propeller Icing on a Hovering Quadcopter

by
Hamdi Ercan
1 and
Ahmet Dalkın
2,3,*
1
Department of Avionics, Faculty of Aeronautics and Astronautics, Erciyes University, Kayseri 38280, Türkiye
2
Department of Electronics and Automation, Yeşilyurt Demir Çelik Vocational School, Ondokuz Mayıs University, Samsun 55100, Türkiye
3
Department of Avionics, Graduate School of Natural and Applied Sciences, Erciyes University, Kayseri 38280, Türkiye
*
Author to whom correspondence should be addressed.
Drones 2025, 9(11), 729; https://doi.org/10.3390/drones9110729
Submission received: 4 September 2025 / Revised: 8 October 2025 / Accepted: 18 October 2025 / Published: 22 October 2025
(This article belongs to the Special Issue Recent Development in Drones Icing)

Abstract

This study investigated the ice accretion process on unmanned aerial vehicle (UAV) propeller blades rotating under various conditions. The experimental tests were carried out in the cold chamber laboratory, and two typical icing scenarios were applied: rime ice and glaze ice. With high-resolution imaging and flight data analysis, the effects of ice formation patterns on UAV performance were studied in detail. The test results revealed different ice accretion characteristics for each condition. In rime ice conditions, the ice layer formed in perfect harmony with the airfoil of the propeller and was less affected by the rotational effects. Glaze ice conditions created complex needle-like ice formations due to the centrifugal force on unfrozen water with the non-dimensional water-loading parameter confirming substantially higher delivered water in glaze (~3:1 ratio relative to rime). The performance loss experienced in the UAV was determined by analysing the motor speed, motor input power and total battery capacity loss data. Averaged over the icing interval, the electrical input power of the affected motors increased by ≈26.4% (front-left) and ≈15.8% (rear-right) in glaze relative to rime. Glaze ice conditions resulted in more severe performance penalties compared to rime ice conditions, leading to greater power loss and the normalised battery state-of-charge fell to 69.85% under glaze and 74.10% under rime conditions. This study examined in detail the icing process occurring on rotating full vehicle UAV propellers and its impact on flight performance and safety.

1. Introduction

Unmanned aerial vehicles (UAVs) have gained widespread adoption across various industries due to their compact designs and cost-effectiveness. UAV design and operation are highly flexible as they do not need a pilot [1]. Significant advancements in energy storage, optics, computer science, and electronics have driven the rapid development of UAV technology in recent years. Consequently, UAVs have become quite popular in numerous aspects of daily life. A wide range of UAV models has been developed and utilised across various sectors, including oil and gas, agriculture, construction, urban planning, healthcare, wildlife conservation, and many others [2]. Among these types, rotary-wing UAVs hold a considerable share of the market, offering advantages such as enhanced load-lifting capabilities, superior takeoff and landing performance, greater manoeuvrability, and extended endurance compared to fixed-wing UAVs [3,4]. However, these benefits can be severely undermined by adverse weather conditions—in particular, atmospheric icing, which remains a major challenge to UAV reliability and safety.
Atmospheric icing is among the most critical environmental challenges in UAV operations, significantly impacting both performance and safety. In rotary-wing UAVs, the propellers (rotor blades) are the most vulnerable components, accumulating ice more rapidly than fixed-wing lifting surfaces and even the fuselage/body itself [5]. This build-up can severely deteriorate propeller aerodynamic efficiency, leading to a considerable decline in flight performance. Ice formation on the leading edges of both the wings and the propeller blades poses a particular risk during flight through cloud layers that contain super-cooled liquid water. Such ice accretion diminishes lift, increases drag, and reduces the stall angle, which in turn raises the power required to maintain flight in addition, the accreted ice increases the overall aircraft weight. Once icing reaches a critical threshold, a quadcopter may lose control and crash. Small, lightweight UAVs are more susceptible to icing than conventional aircraft because they fly at lower altitudes (where liquid water content is higher and temperatures are warmer), have limited power capacity, operate at lower airspeeds (resulting in prolonged exposure to icing conditions), and depend on sensors that are easily impaired by ice. Multi-rotor quadcopters are particularly vulnerable because their multiple propellers and intricate layouts magnify the threat to flight stability and control [6,7].
Depending on the environmental conditions, a UAV may encounter either rime ice (which is opaque, porous, and relatively light with a rough surface) or glaze ice (which is clear, dense, and smooth) during flight. Colder temperatures with lower liquid water content favor rime ice formation, as droplets freeze immediately upon impact, whereas temperatures just below 0 °C with higher liquid water content lead to glaze ice, where some water remains unfrozen long enough to run back before freezing. Glaze ice accretions are often complex in shape—forming rivulets, horn and needle like protrusions, and icicles—and tend to cause more severe aerodynamic penalties than rime ice [8]. When super-cooled droplets collide with and adhere to propeller surfaces, the degree of ice formation—partial or complete—depends on how rapidly the latent heat of fusion disperses into the ambient air. Below −10 °C, when the airflow has a low level of liquid water content, supercooled droplets freeze and create rime ice that closely matches the propeller’s original contours. On the other hand, in temperatures only slightly below 0 °C, if the liquid water content is higher, not all droplets freeze upon impact; unfrozen water flows along the airframe’s surface before solidifying further downstream. This results in glaze ice, a more complex accretion noted for its moist nature and unpredictable shapes, typically forming horn-like protrusions, needle-shaped crystals, or feather-like extensions into the airflow. Due to these ice formations, the UAV consumes more power, lift force decreases, and drag force increases [9,10].
In a comprehensive experimental analysis, Han et al. investigated ice accretion mechanisms on DJI 9443 UAV propellers during both glaze and rime icing events. The research identified linear ice growth models on the front and span sections of the propeller. In order to understand the effects on aerodynamic performance, glaze and rime ice models were developed with 3D scanning technology; the icing on the propeller reduced the performance of the UAV, increased the power requirement and reduced the lifting force. The study revealed an increase in vibration intensity and changes in vibration frequency along with the effect of icing, which created a potential flight safety risk [1]. In a subsequent study, the same team tested an anti-icing coating on DJI 9443 propellers. Results showed that low-adhesive layers effectively limited ice buildup by reducing how strongly ice stuck to the surface, allowing it to shed more readily [11]. These results demonstrated the feasibility of using surface coatings to mitigate icing, although significant performance degradation still occurred under icing conditions.
Similarly Liu et al. performed tests on rotating propeller models to analyse UAV propellers’ performance and energy consumption under icing conditions, aiming to develop more effective protection strategies. Using a phase-locked imaging method, they tracked the development of ice on rotating propellers over time, offering insight into how icing evolves during flight. Strong ice accretion was observed near the propeller tips, influenced by centrifugal forces and water movement along the blade. Under glaze icing conditions, the propeller’s thrust force dropped by up to 70%, accompanied by a surge in thrust fluctuations by as much as 250%. In icing conditions, power consumption increases in order to maintain a constant rotation speed [9]. This quantification highlights how severely icing can degrade a propeller’s performance. Liu et al. conducted another study that experimentally examined the effects of surface wettability of a rotary UAV propeller model on the icing process. They changed the surface wettability of the propeller to compare hydrophobic and superhydrophobic surfaces and evaluated the icing process and its effects on the aerodynamic performance of the propeller. While power consumption increased with icing on the hydrophobic surface, it was lower due to reduced ice accretion on the superhydrophobic surface. The study found that the superhydrophobic surface reduced the power consumption by up to 75% [10]. Such anti-icing strategies (coatings and surface treatments) can delay ice accretion and lessen its impact, but they may not completely prevent performance losses during prolonged exposure.
Dhulipalla et al. looked into how quadcopters performed in adverse weather conditions, including icing and strong winds. This study focused on controlled flight tests performed in various weather conditions (icing, wind, non-icing). Data such as altitude, speed, direction, motor speed and power consumption were collected through sensors on the UAV. In addition, meteorological data from weather stations were also recorded. After the flight, the iced propellers were meticulously examined using 3D scanning. This study showed that conditions like icing and wind significantly affect both UAV performance and energy requirements, with icing emerging as a substantial challenge for energy consumption [12]. In further trials, the same group observed substantial ice formation on the propellers during flights in freezing fog and used 3D digital image projection scanning to map the ice distribution, confirming significant accretion and corresponding spikes in power demand [13].
Miller et al. conducted a detailed study on how Liquid Water Content (LWC) relates to icing in a multi-rotor UAV when flying through naturally occurring supercooled clouds. Instead of using an external sensor, they tracked changes in current as a way to measure icing intensity; specifically, they measured the rate of current change during heating pulses. The study demonstrated that indirect measurement techniques could be an effective tool for predicting icing conditions and identified the average droplet size as ranging between 9 and 13 μm, emphasising that the impact of larger droplets on icing is not yet fully understood [14]. Together, these real-flight studies underscore the significant impact of icing on UAV endurance and the need for reliable in-flight icing detection and protection methods.
Harvey et al. conducted an experimental study in a cold chamber examining the performance of the Bell Textron APT70 quadcopter rotor under rime and glaze ice icing conditions. Higher LWC, MVD (Median Volume Diameter) and RPM (Revolutions per Minute) values and warmer temperatures led to glaze icing, while low LWC ratios and low temperatures led to rime icing. The study revealed that larger droplets, lower rotor speeds and lower angles of attack lead to faster and more significant thrust losses [15]. A study conducted at the Finland Icing Wind Tunnel characterised the performance of a quadcopter propeller operating at low Reynolds numbers under icing conditions [16]. Another research examined the operation of a multi-rotor UAV with a maximum takeoff weight of 25 kg under icing conditions [17]. Kozomara, on the other hand, experimentally studied the effects of icing on a full-scale quadcopter UAV (≈25 kg) and demonstrated that icing is a serious problem for UAVs, causing major performance degradation in terms of thrust and power required [18]. To better characterise complex ice shapes, one study developed a method to analyse propeller icing using 3D laser scanning data—complex ice formations on the blades were reduced to simplified characteristic curves, enabling more straightforward comparisons of icing severity under different conditions [19]. Müller et al. performed tests on UAV propellers in an icing wind tunnel under various temperatures, rotational speeds and icing durations, observing changes in parameters such as thrust, torque and power consumption. The data obtained were used to develop a propeller performance model that can predict ice accretion, ice-shedding forces and the performance of an iced propeller. The developed model has potential applications in various fields, including flight performance prediction, flight route and mission planning tools, autopilot system training, deicing system design, and flight simulators [20]. Collectively, these wind-tunnel and full-scale experiments underscore the critical need to develop effective icing mitigation and diagnostic strategies for UAVs.
Several recent efforts have focused on active icing mitigation techniques for UAVs. Samad et al.’s study conducted at Iowa State University’s Icing Research Tunnel experimentally examined an electrothermal ice prevention system optimised for UAV rotors. The study showed that coatings alone remain insufficient as a strategy to prevent icing on UAV rotors. However, coatings provided significant advantages when combined with an electrothermal heating (hybrid) system [21]. Similarly, Tu et al. demonstrated that the anti-icing coating they developed enhances UAV safety in freezing weather conditions through its periodic ice removal feature [22].
Beyond empirical studies and hardware solutions, the icing problem can also be addressed using analytical fault-diagnosis techniques. Rotondo et al. proposed a discrete-time linear parameter-varying unknown input observer for the diagnosis of ice accretion (treated as a fault) in UAVs [23]. In addition, López-Estrada et al. presented a fault-diagnosis observer for descriptor Takagi–Sugeno systems, explicitly addressing singular dynamics and uncertainties; this framework can be repurposed to cast ice accretion as an incipient actuator/aerodynamic fault and enable early detection via residuals. Such model-based fault diagnosis methods frame icing as a fault to be isolated and compensated; this perspective informs the approach of the present study, which builds upon the above insights to enhance UAV icing detection and resilience [24].
Particularly for quadcopters, UAVs operating in icy weather conditions pose significant safety risks. Rapid ice accretion on the propeller surfaces can seriously degrade aerodynamic performance, leading to loss of quadcopter control and potential collisions. This significant phenomenon has been examined using a DJI quadcopter model widely utilised in comprehensive experimental studies. The study’s primary objective is to closely monitor and examine the dynamic ice accretion process on rotating UAV propellers. The research was conducted at Ondokuz Mayıs University Cold Chamber Research Laboratory. In the experimental setup, the DJI quadcopter’s propellers were mounted in the regular flight configuration. A camera system aligned with the axis of rotation of the propeller was utilised to record the ice accretion in high resolution. High-quality photos were captured at key stages of ice formation. This technique enables precise documentation of the temporal development of ice accretion and its distribution over the aerodynamic surfaces of the propellers. The data obtained can contribute to future design improvements to enhance the performance and safety of UAVs in icing conditions. This study aims to address the existing knowledge gap by elucidating the comprehensive effects of icing formation on UAV propellers on flight dynamics through experimental analyses conducted in an environment approximating real flight conditions. Most previous experimental studies focused on the icing behaviour of an isolated, rig-mounted propeller, thereby neglecting the complex aero-propulsive and control interactions that occur on a complete vehicle. In contrast, the present work tests a commercially available quadcopter in its full flight configuration, allowing simultaneous observation of multi-propeller icing, flight-controller response, and battery-endurance penalties under controlled yet flight representative icing conditions. Conducting full-vehicle, UAV flights in a controlled laboratory chamber is relatively uncommon in the literature and constitutes a methodologically innovative contribution.

2. Proposed System Overview and Methodology

2.1. UAV Propeller Model

The UAV is a DJI Mavic Air 2 (SZ DJI Technology Co., Ltd., Shenzhen, China), shown in Figure 1, and Table 1 below illustrates several significant technical specifications of the DJI Mavic Air 2.
The DJI Mavic Air 2 is a popular commercial model with a flight time of up to 34 min, advanced obstacle detection systems and Air Sense technology. It also offers creative shooting opportunities in the photography, videography and cinema industries. The operating temperature range of the quadcopter is between −10 °C and 40 °C. The IMU (Inertial Measurement Unit) uses accelerometers and gyroscope sensors to measure the movement and position of the quadcopter. During flight, IMU ensures stability by constantly monitoring movement parameters such as speed, direction, inclination and rotation.
The IMU data is transferred to the flight computer and used for the quadcopter’s automatic stabilisation. It accurately determines the position of the quadcopter using GPS (Global Positioning System). The GNSS (Global Navigation Satellite System) is used to fix the position and altitude of the quadcopter. The optical and ultrasonic sensors located at the bottom stabilise the position of the quadcopter in indoor environments where GPS signals are weak. It prevents collisions by detecting obstacles through front, rear and bottom sensors. APAS 3.0 (Advanced Pilot Assistance System) technology maps obstacles in real-time during flight and automatically avoids them [25].
The DJI Fly application is used for managing the quadcopter’s flight and controlling its camera. The Mavic Air 2’s software system (Mavic Air 2 V01.01.1600) supports flight modes such as ActiveTrack 3.0, QuickShots and HyperLapse. The flight modes of the Mavic Air 2 include Normal Mode, Sport Mode and Tripod Mode. Normal Mode provides stable flight using GNSS and VPS (Vision Positioning System) and is ideal for everyday use. Sport Mode offers higher speed and aggressive maneuvers while disabling some safety sensors. Tripod Mode is used for capturing footage that requires lower speeds and more precise maneuvers [25].
Figure 2 shows the DJI 7238F propeller (SZ DJI Technology Co., Ltd., Shenzhen, China) model, which is designed for the DJI Mavic Air 2. The propeller is manufactured using a lightweight and durable fiber-reinforced nylon composite material, which reduces noise levels during flight with its low-noise design. It offers high aerodynamic efficiency and provides more stable flight.

2.2. Experimental Setup

In this experimental study, the performance of the DJI Mavic Air 2 quadcopter under icing conditions was examined without modifying the original configuration of the device. No changes were made to the quadcopter’s software, flight control system or hardware. All flights were carried out using the latest software version provided by DJI, the integrated flight control system and the original remote control. This approach aimed to accurately assess the behavior of the standard configuration of the device under icing conditions and ensure that the results reflected the actual operational performance of the DJI Mavic Air 2. The quadcopter was flown in Normal mode during all tests. This choice was based on Normal Mode’s capability to provide stable flight through integrated altitude maintenance, making it the optimal configuration for routine operational scenarios requiring reliability and consistent performance.
Most of the research on propeller icing has primarily been conducted under controlled laboratory conditions [26,27,28,29,30,31]. In these studies, an airflow was created using a wind system on a propeller arm placed in an icing tunnel while supercooled water droplets were sprayed through the nozzles. An artificial icing cloud was created by adjusting the LWC. During the icing process, the motors’ thrust, power and torque values were continuously recorded and analysed via a computer system. The motor speed was maintained at a constant level during the experiments using a PID controller. This methodology systematically examined the dynamics of propeller icing and its effects on performance. However, it did not fully reflect the behavior of a quadcopter flying in the air or moving in any direction under icing conditions.
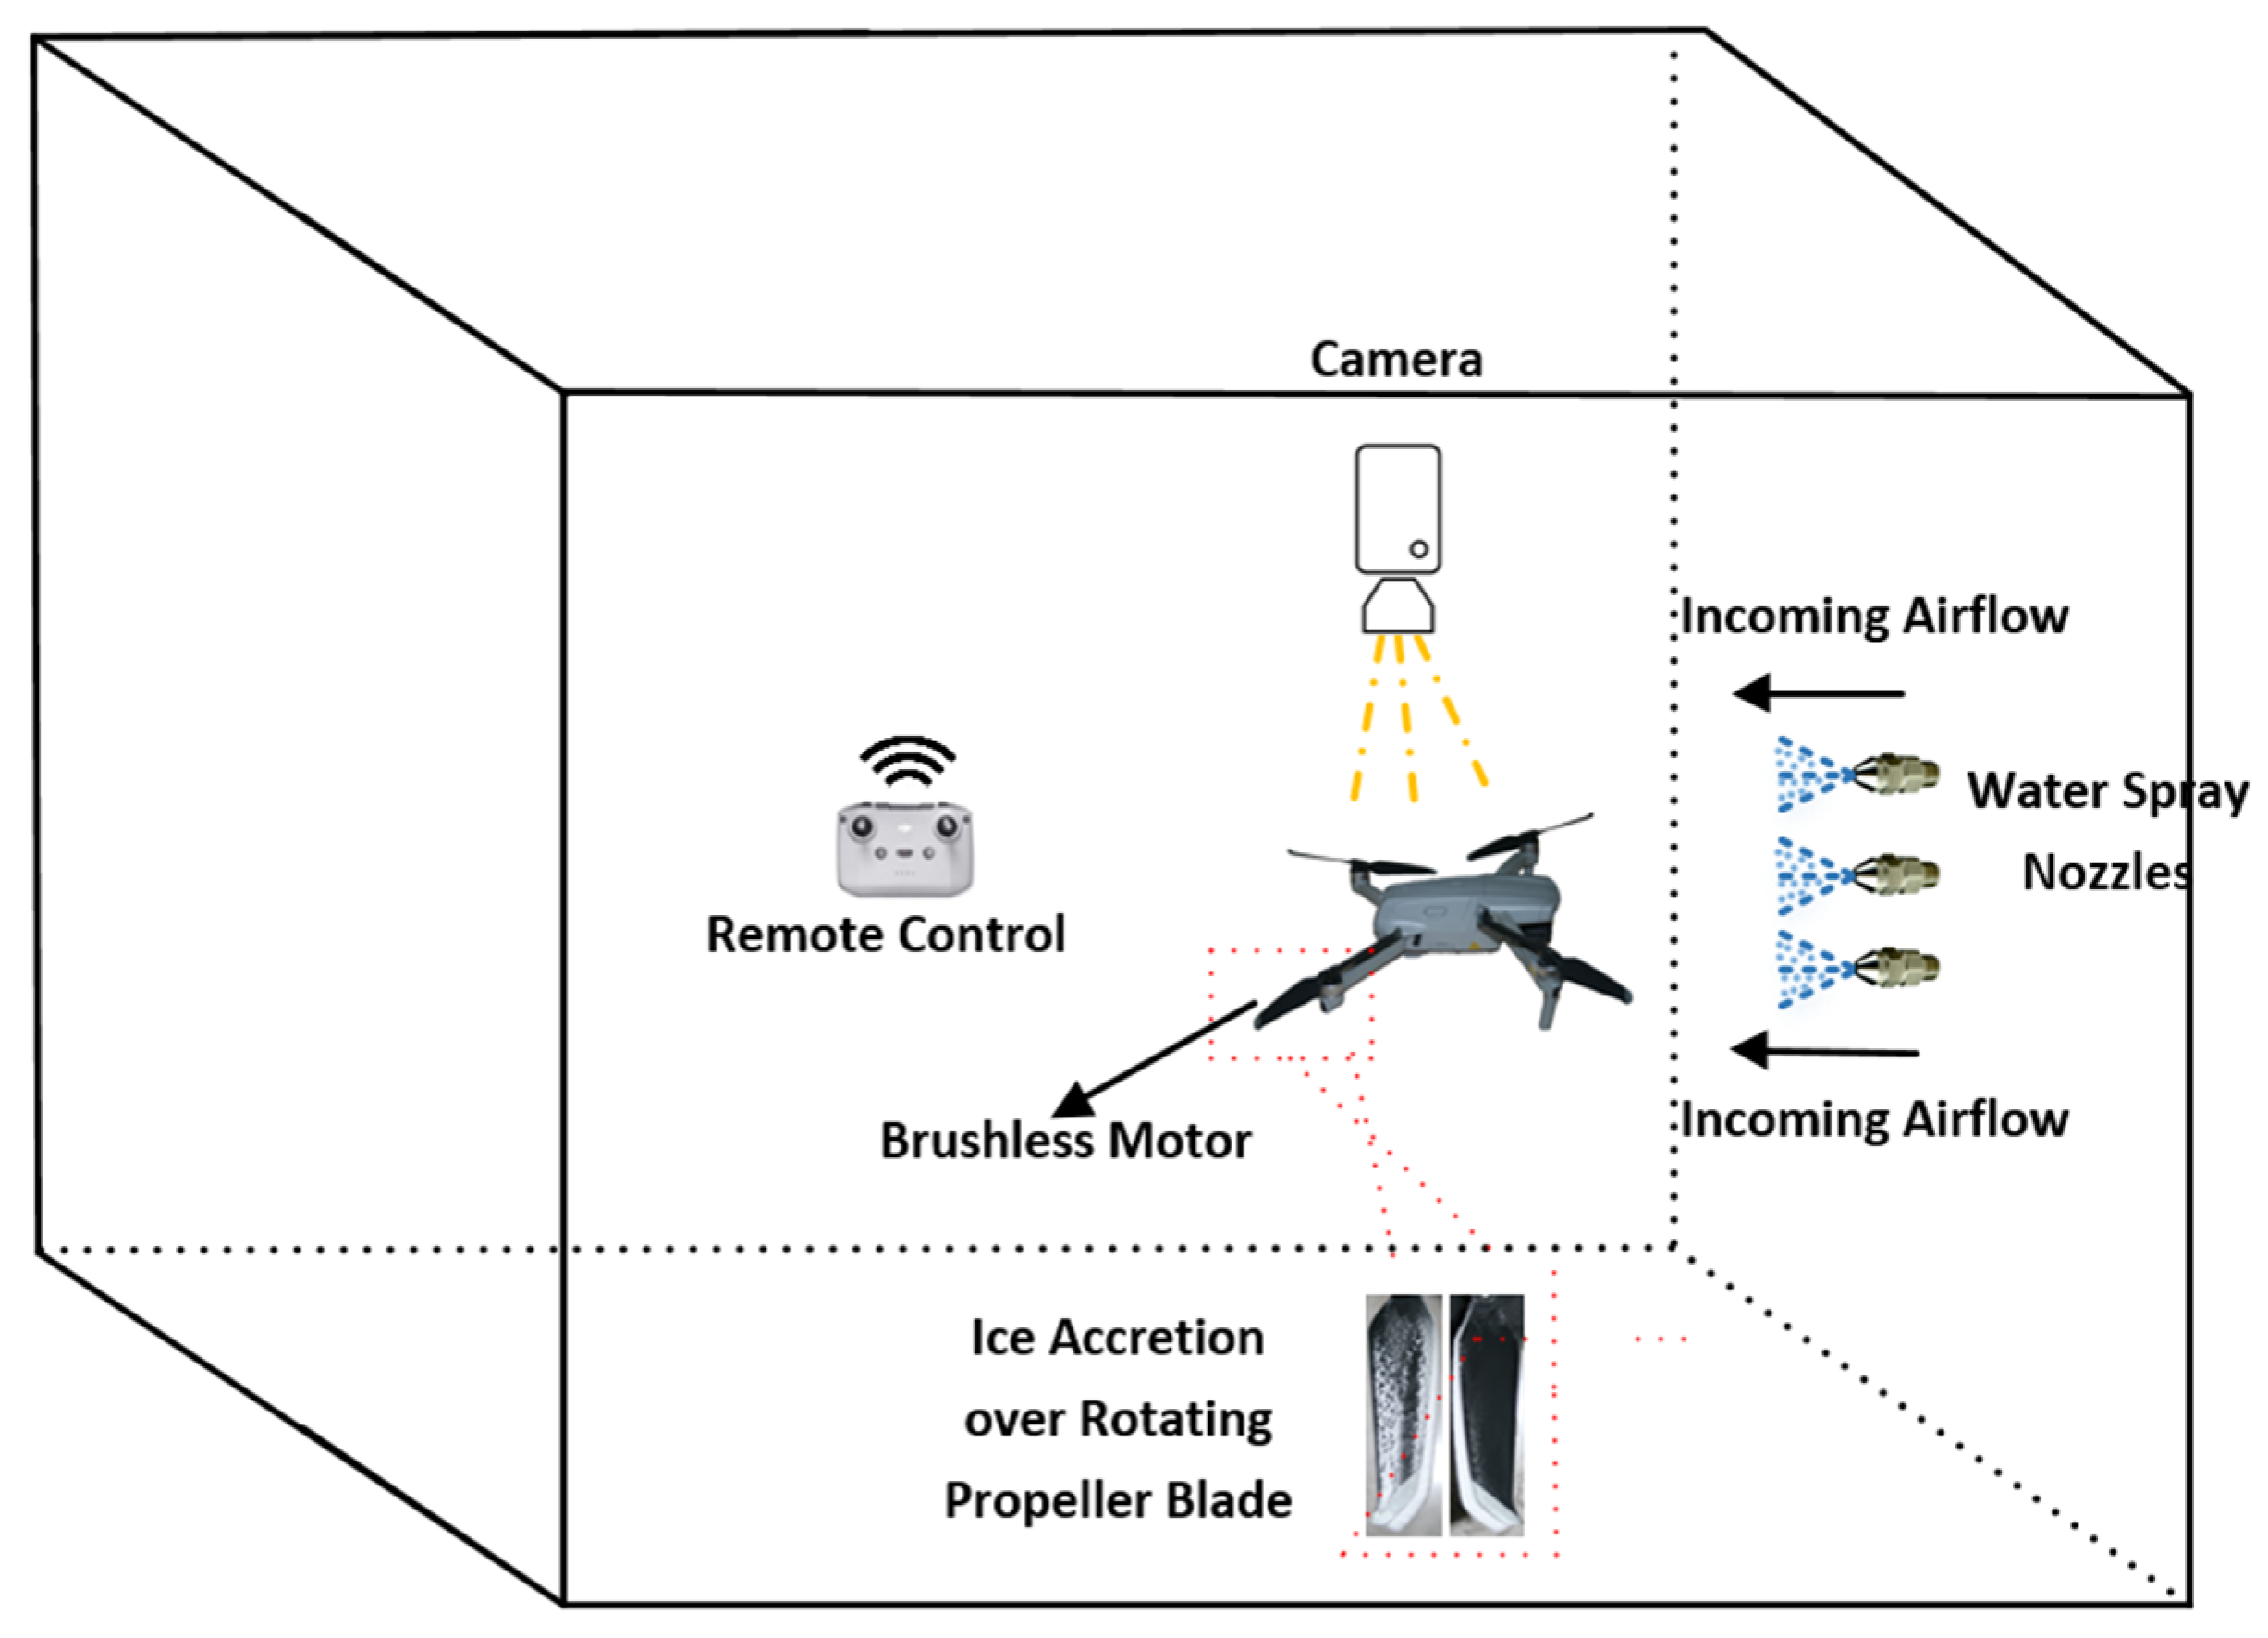
Therefore, an experimental setup, as shown in Figure 3, was designed in a cold chamber for a quadcopter operating in hovering mode at a minimum flight altitude. When analysing the operational dynamics of the quadcopter system, it became clear that the speed parameters of the four motors were not kept at a constant value. Each motor operated at dynamically varying speeds, which were constantly calculated and updated by the system controller. This dynamic speed control is crucial to enable the quadcopter to perform complex flight manoeuvres and respond instantly to environmental factors. Constant changes in motor speeds allowed the quadcopter to compensate for external influences. Atmospheric conditions such as wind, load changes or sudden manoeuvring requirements were managed by adjusting the speed of each motor independently and in real time. To simulate actual flight conditions, the quadcopter was maintained in a hovering state via a flight controller while exposed to a uniform crossflow (V = 5 m/s) and an icing cloud generated by spray nozzles. The spray water was pre-chilled near 0 °C at the nozzle. After atomization, the droplets were convected about 0.5 m through the chamber at 5 m/s. Given the MVD ≈ 20 µm, small spray droplets rapidly approach the surrounding air temperature due to their high surface-area-to-volume ratio and strong convective exchange. Simple heat-transfer estimates indicate millisecond-scale thermal equilibration, implying that droplets reach the air temperature within only a few centimetres of travel from the nozzle [32]. Accordingly, by the time droplets arrive at the blades their temperature is effectively equal to the chamber air temperature, while their phase remains supercooled liquid at −5 to −10 °C (freezing is triggered predominantly upon surface contact rather than mid-air).
Before starting the icing process, the laboratory’s air flow speed and ambient temperature were stabilised. The quadcopter was flown in Normal mode with the help of a remote control during all tests. The test flights were conducted in an environment with sufficient lighting to ensure optimal visual perception conditions. Precise positioning of the quadcopter was achieved using the VPS (Vision Positioning System) due to limitations in signal reception from GPS and GNSS satellite navigation systems. The integrated VPS of the device was actively used, which analyses surface patterns and contours through infrared sensors and cameras to ensure accurate vertical positioning.
According to the manufacturer’s documentation for Mavic Air 2, when the downward vision system is enabled, the quadcopter can hover within ~0.5–60 m relative to the takeoff point, with precise altitude hold specified up to ~0.5–30 m; the downward ToF measurement range is listed as ~0.1–8 m. Vision positioning is intended for well-lit, textured surfaces; performance can degrade over water, highly reflective/transparent or featureless surfaces, or in very low/very bright illumination. Under the 5 m/s cross flow and spray, the flight controller applied small attitude offsets and continuous corrections while VPS provided the position reference and height hold, enabling stable takeoff/landing and a repeatable hover condition for both rime and glaze runs [25].
Thanks to the effective use of VPS, the quadcopter displayed a very precise and stable performance during the takeoff and landing stages. This approach not only improves the consistency of the test protocol but also successfully replicates the device’s behavior under real operating conditions.
Under icing conditions, the experimental protocol was meticulously designed to evaluate the performance of the DJI Mavic Air 2 quadcopter. After stabilising the environmental parameters, the quadcopter was remotely controlled for takeoff and maintained in a hovering position at an altitude of 1 m. Simultaneously, the wind system was activated to start the airflow, and supercooled water droplets were sprayed into the quadcopter through the spray nozzles. Rime ice and glaze ice types of ice accretion were produced using different temperature and LWC parameters within the experimental matrix. The test conditions included two different scenarios described in detail in Table 2, specifying critical parameters such as LWC, temperature and air velocity.
To target Appendix-C small-droplet conditions, the atomiser was configured to produce a target median volumetric diameter (MVD) of ~20 µm (as specified by the vendor for the applied pressure/flow settings) [18]. In situ droplet sizing at the rotor plane was not available; consequently, this value is reported as the target droplet size, and the regime was verified through the imposed temperature–LWC–velocity settings and the time-resolved imagery of the accretion, which showed opaque, granular rime at −10 °C and a thinner, runback-prone glaze at −5 °C.
Uniformity across the rotor plane was promoted by locating the vehicle in the core of the cross-flow and fixing the spray–rotor mixing distance. Temporal uniformity was maintained by steady pump/valve settings. Within instrument resolution, no systematic radial bias in the imposed cloud was detected; the δLE trends at r/R = 0.25, 0.50, and 0.75 remained consistently ordered (0.75R > 0.50R > 0.25R) in both regimes both consistent with a stable LWC field.
Air temperature was controlled to ±0.2 °C (resolution 0.1 °C). Since the DJI Mavic Air 2 has a manufacturer-specified minimum operating temperature of −10 °C, lower temperature conditions could not be tested in the experimental setup
Although static air temperature and LWC are conventional indicators, the glaze–rime classification is fundamentally governed by the local surface heat balance and the associated Messinger freezing fraction n0. The rime regime corresponds to cases in which the impinging liquid freezes essentially completely at impact because sufficient cooling is available (n ≈ 1), whereas glaze corresponds to cases in which a finite liquid film remains upon impact (0 < n < 1). The freezing fraction n0 depends on the flow conditions—e.g., relative velocity/Reynolds number—through the balance between droplet kinetic energy, aerodynamic heating, and convective heat loss. Consequently, glaze may occur at very low ambient temperatures at high Reynolds numbers, while rime may occur close to 0 °C when aerodynamic heating is weak and LWC is low. In this study, aerodynamic heating was limited (hover, V = 5 m/s and aerodynamic heating is negligible in the overall heat balance); however, in the glaze case the combination of high LWC (1.5 g/m3) and −5 °C keeps the freezing fraction below unity (n < 1), yielding glaze-like morphology. Conversely, −10 °C with low LWC (0.5 g/m3) drives the freezing fraction toward unity (n ≈ 1), yielding rime-like morphology. Thus, two settings are representative outcomes within the same heat-balance framework rather than definitions of the regimes.
In the experiment; V = 5 m/s denotes an imposed cross-flow directed across the rotor disk. A representative blade-element Reynolds number was evaluated at r = 0.75R using the chord c = 15 mm and the local relative velocity.

2.3. Analysis of Key Aerodynamic and Icing Parameters

Under crosswind conditions, one side of the propeller moves against the wind (the advancing blade), while the other side moves in the same direction as the wind (the retreating blade). This phenomenon leads to different relative velocities, and consequently, different aerodynamic conditions on the propeller blades. The relative velocity on the advancing blade (Vadv) is the sum of the propeller’s rotational speed and the wind speed, whereas the velocity on the retreating blade (Vret) is the difference between these two speeds. These relative velocities can be expressed by the following equations.
V a d v V r o t + V w i n d = Ω r + V w i n d
V r e t V r o t V w i n d = Ω r V w i n d
where Vrot is the tangential velocity of the propeller, Vwind is the crosswind velocity, Ω is the angular velocity of the propeller in radians per second, and r is the radial distance from the center of the propeller. (More generally, the crosswind contributes through the tangential projection Vwind (sinψ); at the azimuths of maximum/minimum projection, ψ = 90°/270°, Equations (1) and (2) reduce to the ±Vwind forms used here.)
The most critical dimensionless parameter that defines the flow regime and aerodynamic characteristics over the propeller is the Reynolds number (Re). The general equation for the Reynolds number is:
R e = ρ c V μ
Accordingly, the advancing and retreating blade Reynolds numbers can be written as
R e a d v = ρ c ( Ω r + V w i n d ) μ
R e r e t = ρ c ( Ω r V w i n d ) μ
In these equations, ρ denotes the density of air and μ represents the dynamic viscosity, which is a measure of the fluid’s internal resistance to flow. The Reynolds number ranges for both experimental scenarios were calculated separately.
For rime ice conditions, calculations were performed for a temperature of −10 °C. To characterize the overall operational envelope of the system, a combined motor speed range of 5400–7100 RPM was used, representing average minimum and maximum speeds observed across Lfront and Rright motors. The air density ρ ≈ 1.342 kg/m3 and dynamic viscosity μ ≈ 1.6 × 10⁻⁵ Pa.s were taken from standard engineering reference tables for the corresponding temperature. The chord length at the 75% radius was taken as c = 15 mm.
Reynolds Number Range for the Advancing Blade: Re ≈ 5.51 × 10⁴–7.05 × 10⁴
Reynolds Number Range for the Retreating Blade: Re ≈ 4.25 × 10⁴–5.79 × 10⁴
For glaze ice conditions, calculations were performed for a temperature of −5 °C. To characterize the overall operational envelope of the system, a combined motor speed range of 6300–8200 RPM was used, representing average minimum and maximum speeds observed across Lfront and Rright motors. The air density ρ ≈ 1.317 kg/m3 and dynamic viscosity μ ≈ 1.69 × 10⁻⁵ Pa.s were taken from standard engineering reference tables for the corresponding temperature. The chord length at the 75% radius was taken as c = 15 mm.
Reynolds Number Range for the Advancing Blade: Re ≈ 5.88 × 10⁴–7.47 × 10⁴
Reynolds Number Range for the Retreating Blade: Re ≈ 4.71 × 10⁴–6.3 × 10⁴
These Reynolds numbers place the blades in a low-Reynolds-number regime where the boundary layer is predominantly laminar with intermittent transition (often via a laminar-separation bubble). The slightly higher Re in the glaze case stems from the higher motor speeds required, and on the advancing-blade side the larger local relative speed makes earlier transition more likely. In practice, the surface roughness introduced by ice (especially glaze needles) can trip the boundary layer, so portions of the blade may become turbulent sooner, which is consistent with the observed differences in accretion behaviour.
However, the modest increase in Re in the glaze case primarily reflects the higher rotational speed and does not, by itself, account for the observed increases in performance parameters. The dominant control parameters separating the regimes are the delivered liquid-water content and the ensuing ice morphology. To disentangle water-delivery effects from rotor-speed effects, the non-dimensional accumulation index Ac is adopted next.
LWC inevitably delivers more water to the glaze case, so two mechanisms govern the performance gap: (i) ice morphology—glaze grows smooth, needle-like protrusions that disrupt leading-edge flow more than the porous rime structure; (ii) accumulated mass—the higher LWC adds extra ice weight and surface roughness.
To isolate the influence of ice type from the mere amount of super-cooled water impinging on the blades, computed the non-dimensional accumulation parameter [33].
A c = L W C     V   t ρ i   d
Using LWC in kg/m3, V in m/s, t in s, ρᵢ in kg/m3 and d in m, the accumulation index is dimensionless.
A c = L W C     V   t ρ i   d = k g   m 3 ( m   s 1 ) s k g   m 3 m = 1
Here, LWC denotes the liquid-water content, V is the airflow velocity (5 m/s), t is the exposure time (≈430 s), ρᵢ is the density of ice (916 kg/m3) and d is the twice the leading-edge radius of airfoil. The density of solid ice was taken as 916 kg/m3 following NASA icing-scaling practice; although rime ice is less dense, using a single reference value is conventional in Ac definitions.
In this definition, V represents the airflow velocity [9,33]. The similarity analysis from which Ac is derived focuses on conditions along the stagnation line and was developed primarily for fixed airfoils to provide a compact water-catch scaling. For a rotating geometry, using a local relative speed at r/R = 0.75 is indeed appropriate for sectional quantities such as Reynolds number; however, surface-water dynamics and ice shedding on rotors occur away from the stagnation line and are not readily incorporated in this simple Ac scaling. Accordingly, when calculating Ac we intentionally take V as the airflow velocity to obtain a rotor-speed-independent index of delivered liquid water. For rotating blades, the effects of local relative speed and collection efficiency would enter as multiplicative factors; because the geometry and spray arrangement are identical across cases, these factors largely cancel in ratios—hence Ac,glaze/Ac,rime ≈ 3:1 mirrors the imposed LWC ratio. To fully model the dynamic effects of the propeller speed, it is necessary to use additional similarity parameters that incorporate surface water dynamics (e.g., the Weber Number, WeL) or to conduct more complex simulations [33].
When the incoming airflow speed (V) is held constant, the rate at which ice accumulates on the surface is expected to vary in a direct, linear proportion to the flow’s LWC; thus, increasing LWC by any factor produces a commensurate increase in the accretion rate [9]. Because the same blade and section (r/R = 0.75) are used in all runs, the geometric scale d is fixed and cancels in ratios.
A c , g l a z e A c , r i m e 3.00
Because the accretion area grows approximately in proportion to the liquid-water content and exposure time (A ∝ LWC t), we model the relative standard uncertainty of a single area by the root-sum-square (RSS) of the input uncertainties;
u r ( A ) = u r 2 ( L W C ) + u r 2 ( t )
Adopting u r ( L W C ) = 10% and u r ( t ) = 2% gives
u r ( A ) = ( 0.1 ) 2 + ( 0.02 ) 2 = 0.102     ( 10.2 % )
The ratio R = Ac,glaze/Ac,rime is then propagated per GUM (Guide to the Expression of Uncertainty in Measurement). Since the glaze and rime runs were executed on different times with different LWC settings, common-mode cancellation is not expected; we therefore treat the two areas as independent and set the correlation coefficient to ρ = 0;
u r 2 ( R ) = u r 2 ( A c , g l a z e ) + u r 2 ( A c , r i m e ) = 2 u r 2 ( A ) = 2 × 0.102 2 = 0.0208
u r ( R ) = 0.144
With the measured ratio R ≈ 3.00, the combined standard uncertainty is
u r ( R ) = R   u r ( R ) = 0.43
hence
R = 3.00 ± 0.43   ( k   =   1 )
In the GUM framework, the expanded uncertainty is defined U = k uc. The factor k determines the coverage probability of the interval: for an approximately normal output and large effective degrees of freedom, k = 1 corresponds to ≈ 68% coverage and k = 2 to ≈95% coverage.
Experiments showed that Ac,glaze and Ac,rime a ratio of approximately 3:1. This confirms that the glaze test received roughly triple the water loading of the rime test. However, the performance gap cannot be attributed to water loading alone. The explanation lies in ice morphology: glaze ice grows compact, needle-like protrusions that distort the leading-edge pressure field, shorten the laminar run on both faces, and generate pronounced torque ripples when pieces shed. Rime ice, by contrast, freezes instantly into a relatively porous, conformal layer that adds weight and roughness but preserves the original aerodynamic line and sheds more benignly. Consequently, while higher liquid-water content certainly increases power demand, the complex geometry and dynamic shedding behaviour of glaze ice remain the dominant drivers of the observed performance degradation.

3. Measurement Results and Discussion

In the following section, experimental results obtained under rime- and glaze-icing conditions were presented, along with an analysis of their effects on performance. The quadcopter was lifted in Normal mode after activating the water spraying mechanism and stabilised in hovering mode at an altitude of one meter, maintaining this position for ≈430 s (seconds). During the ≈430 s flight duration, control difficulties with the quadcopter began around 230 s and became severe after 360 s, when the quadcopter started to lose its stability while hovering in the air, control became considerably challenging. This control difficulties were even more pronounced in glaze ice conditions compared to rime ice conditions. When the quadcopter’s stability severely deteriorated, the experiments were terminated.
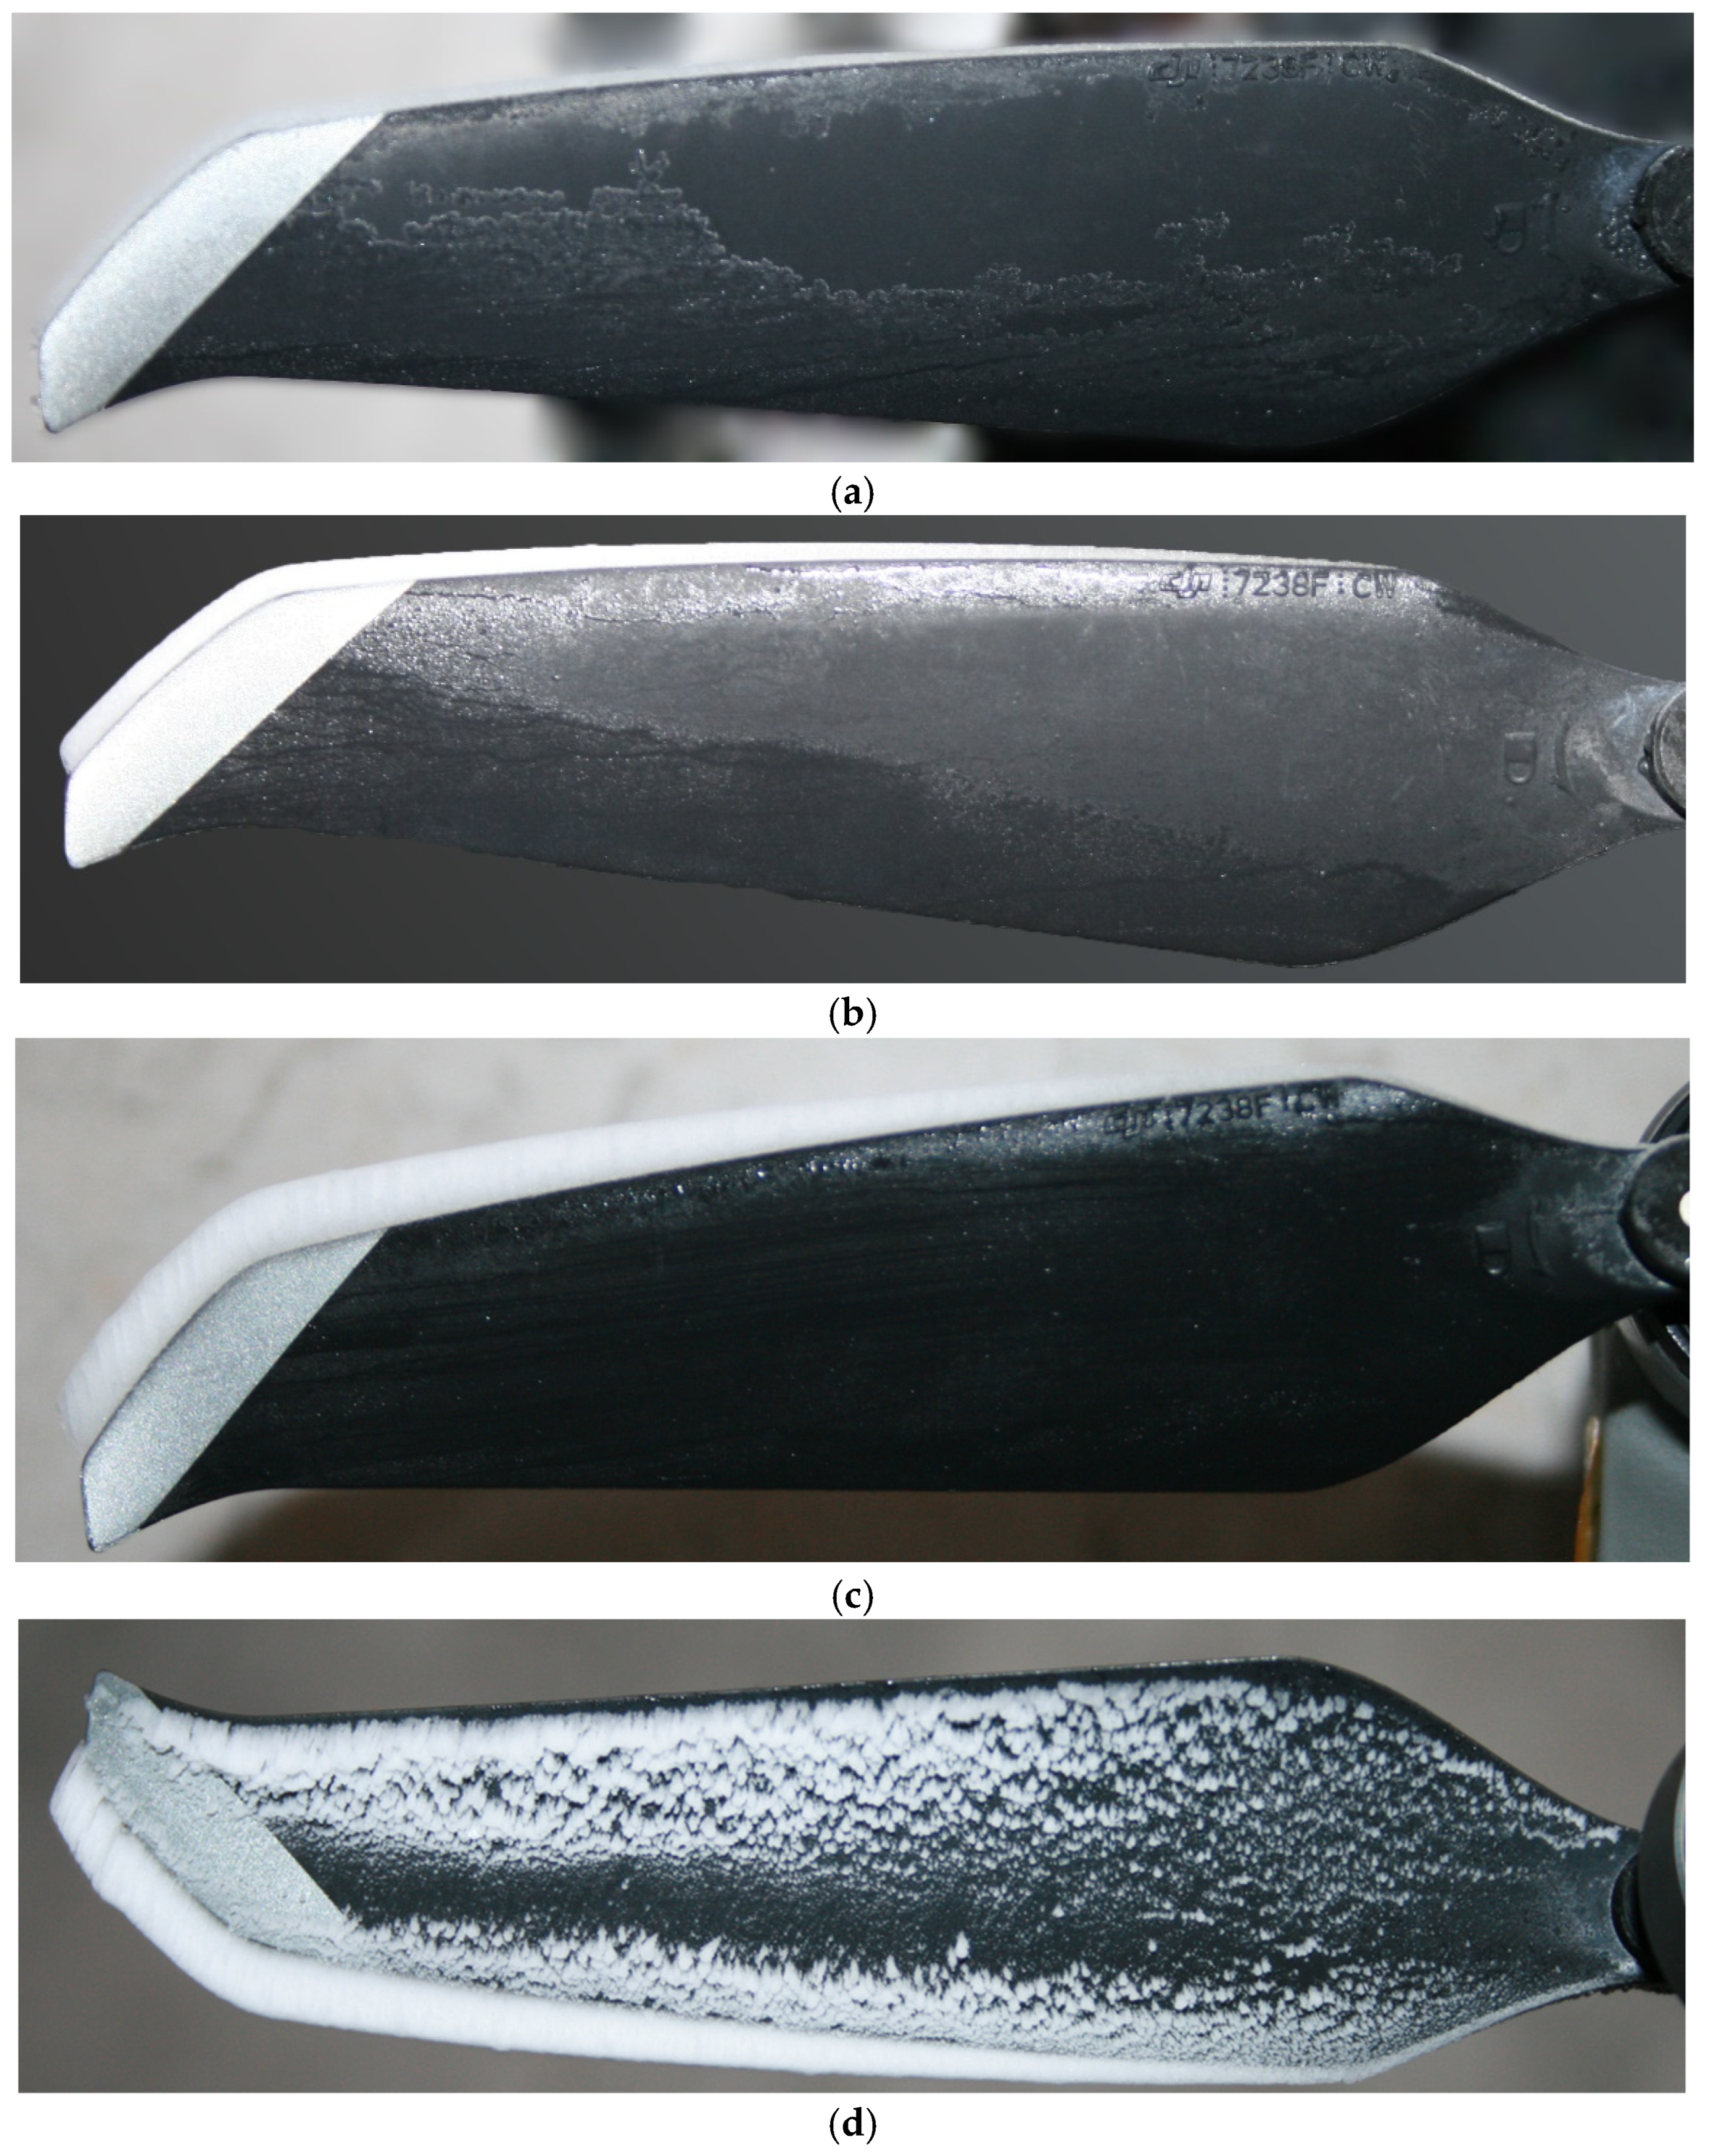
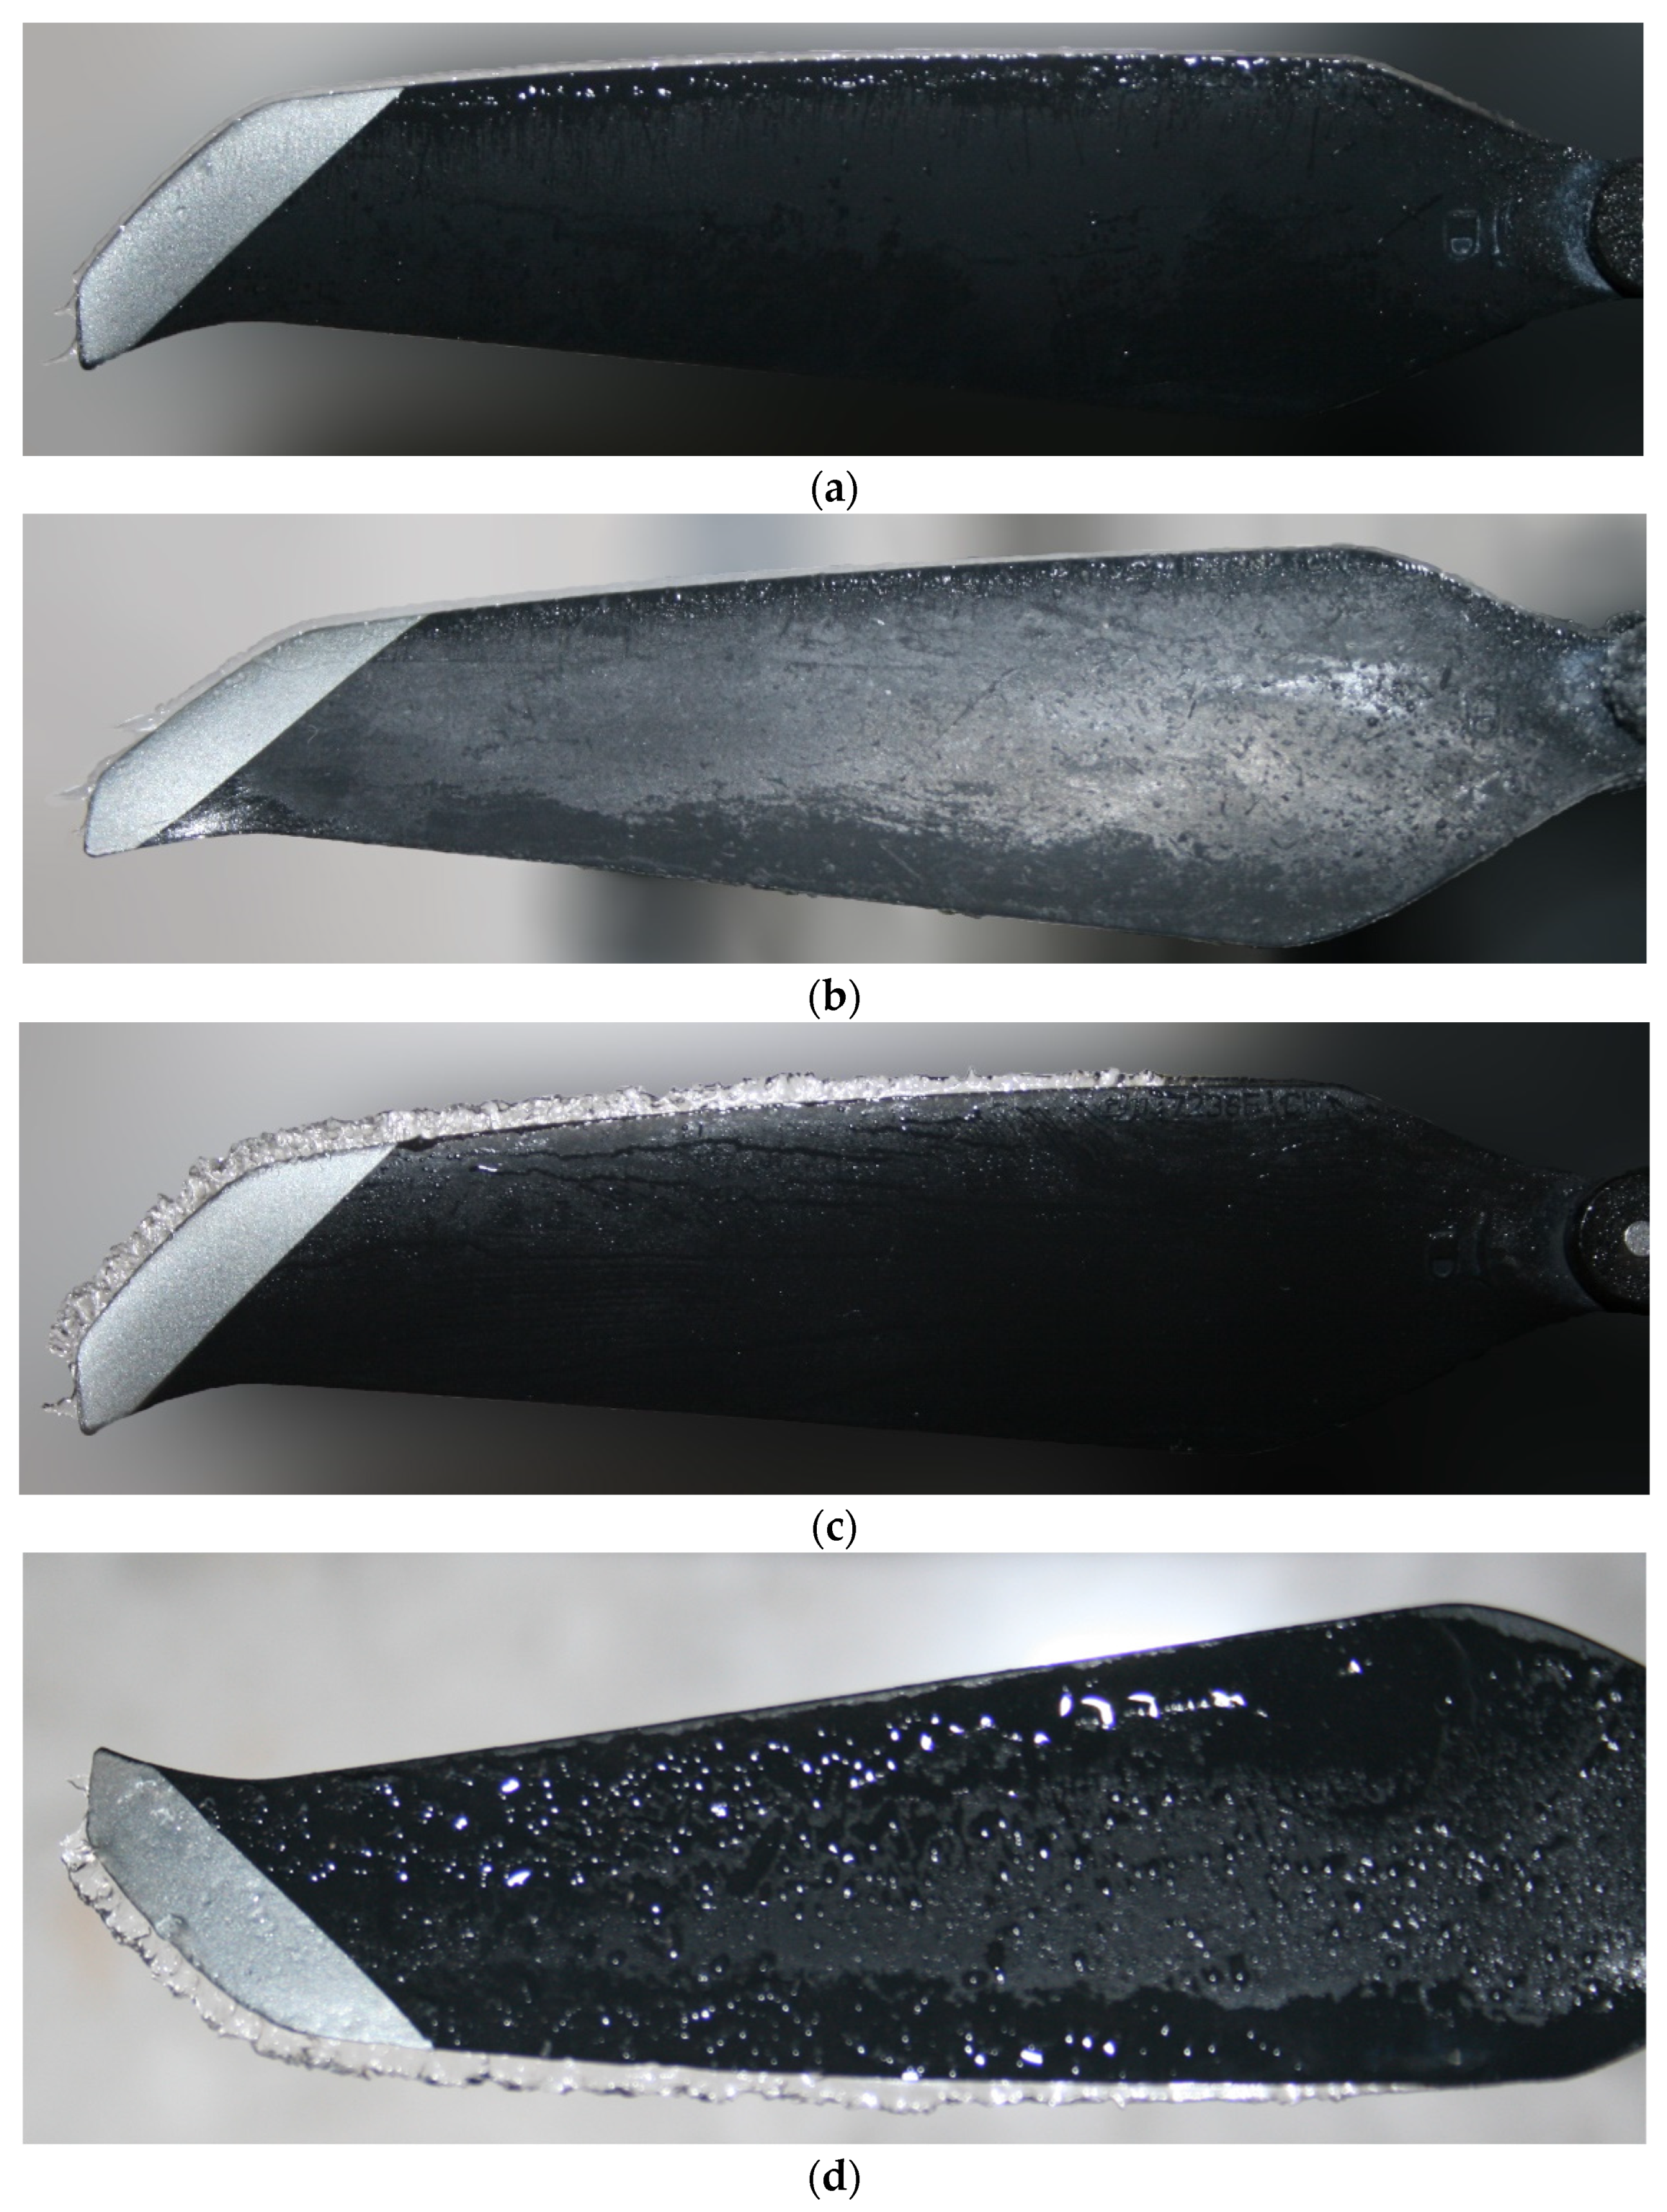
During the flights, photographs of the propellers were taken at t = 100 s, t = 230 s, and t = 420 s for rime ice and t = 430 s for glaze ice to observe the effects of ice accretion over time on the suction side of the propeller. In addition, an extra final-stage photograph was taken after the quadcopter was stopped at t = 428 s in the rime-ice case and t = 435 s in the glaze-ice case to document the ice accumulation on the pressure side of the propeller. The flight data of the quadcopter were automatically recorded in the phone’s memory by the DJI FLY application and analysed using CsvView 4.3.0 software, designed to visualise flight log files. CsvView supports not only .csv files but also .txt files generated by the DJI Fly application, .dat files obtained from various DJI quadcopter models, and log files from the Litchi mobile application. This comprehensive compatibility made CsvView a valuable tool for data analysis in this experimental study.

3.1. Analysis of Rime Ice Accretion on Rotating Propeller Surfaces

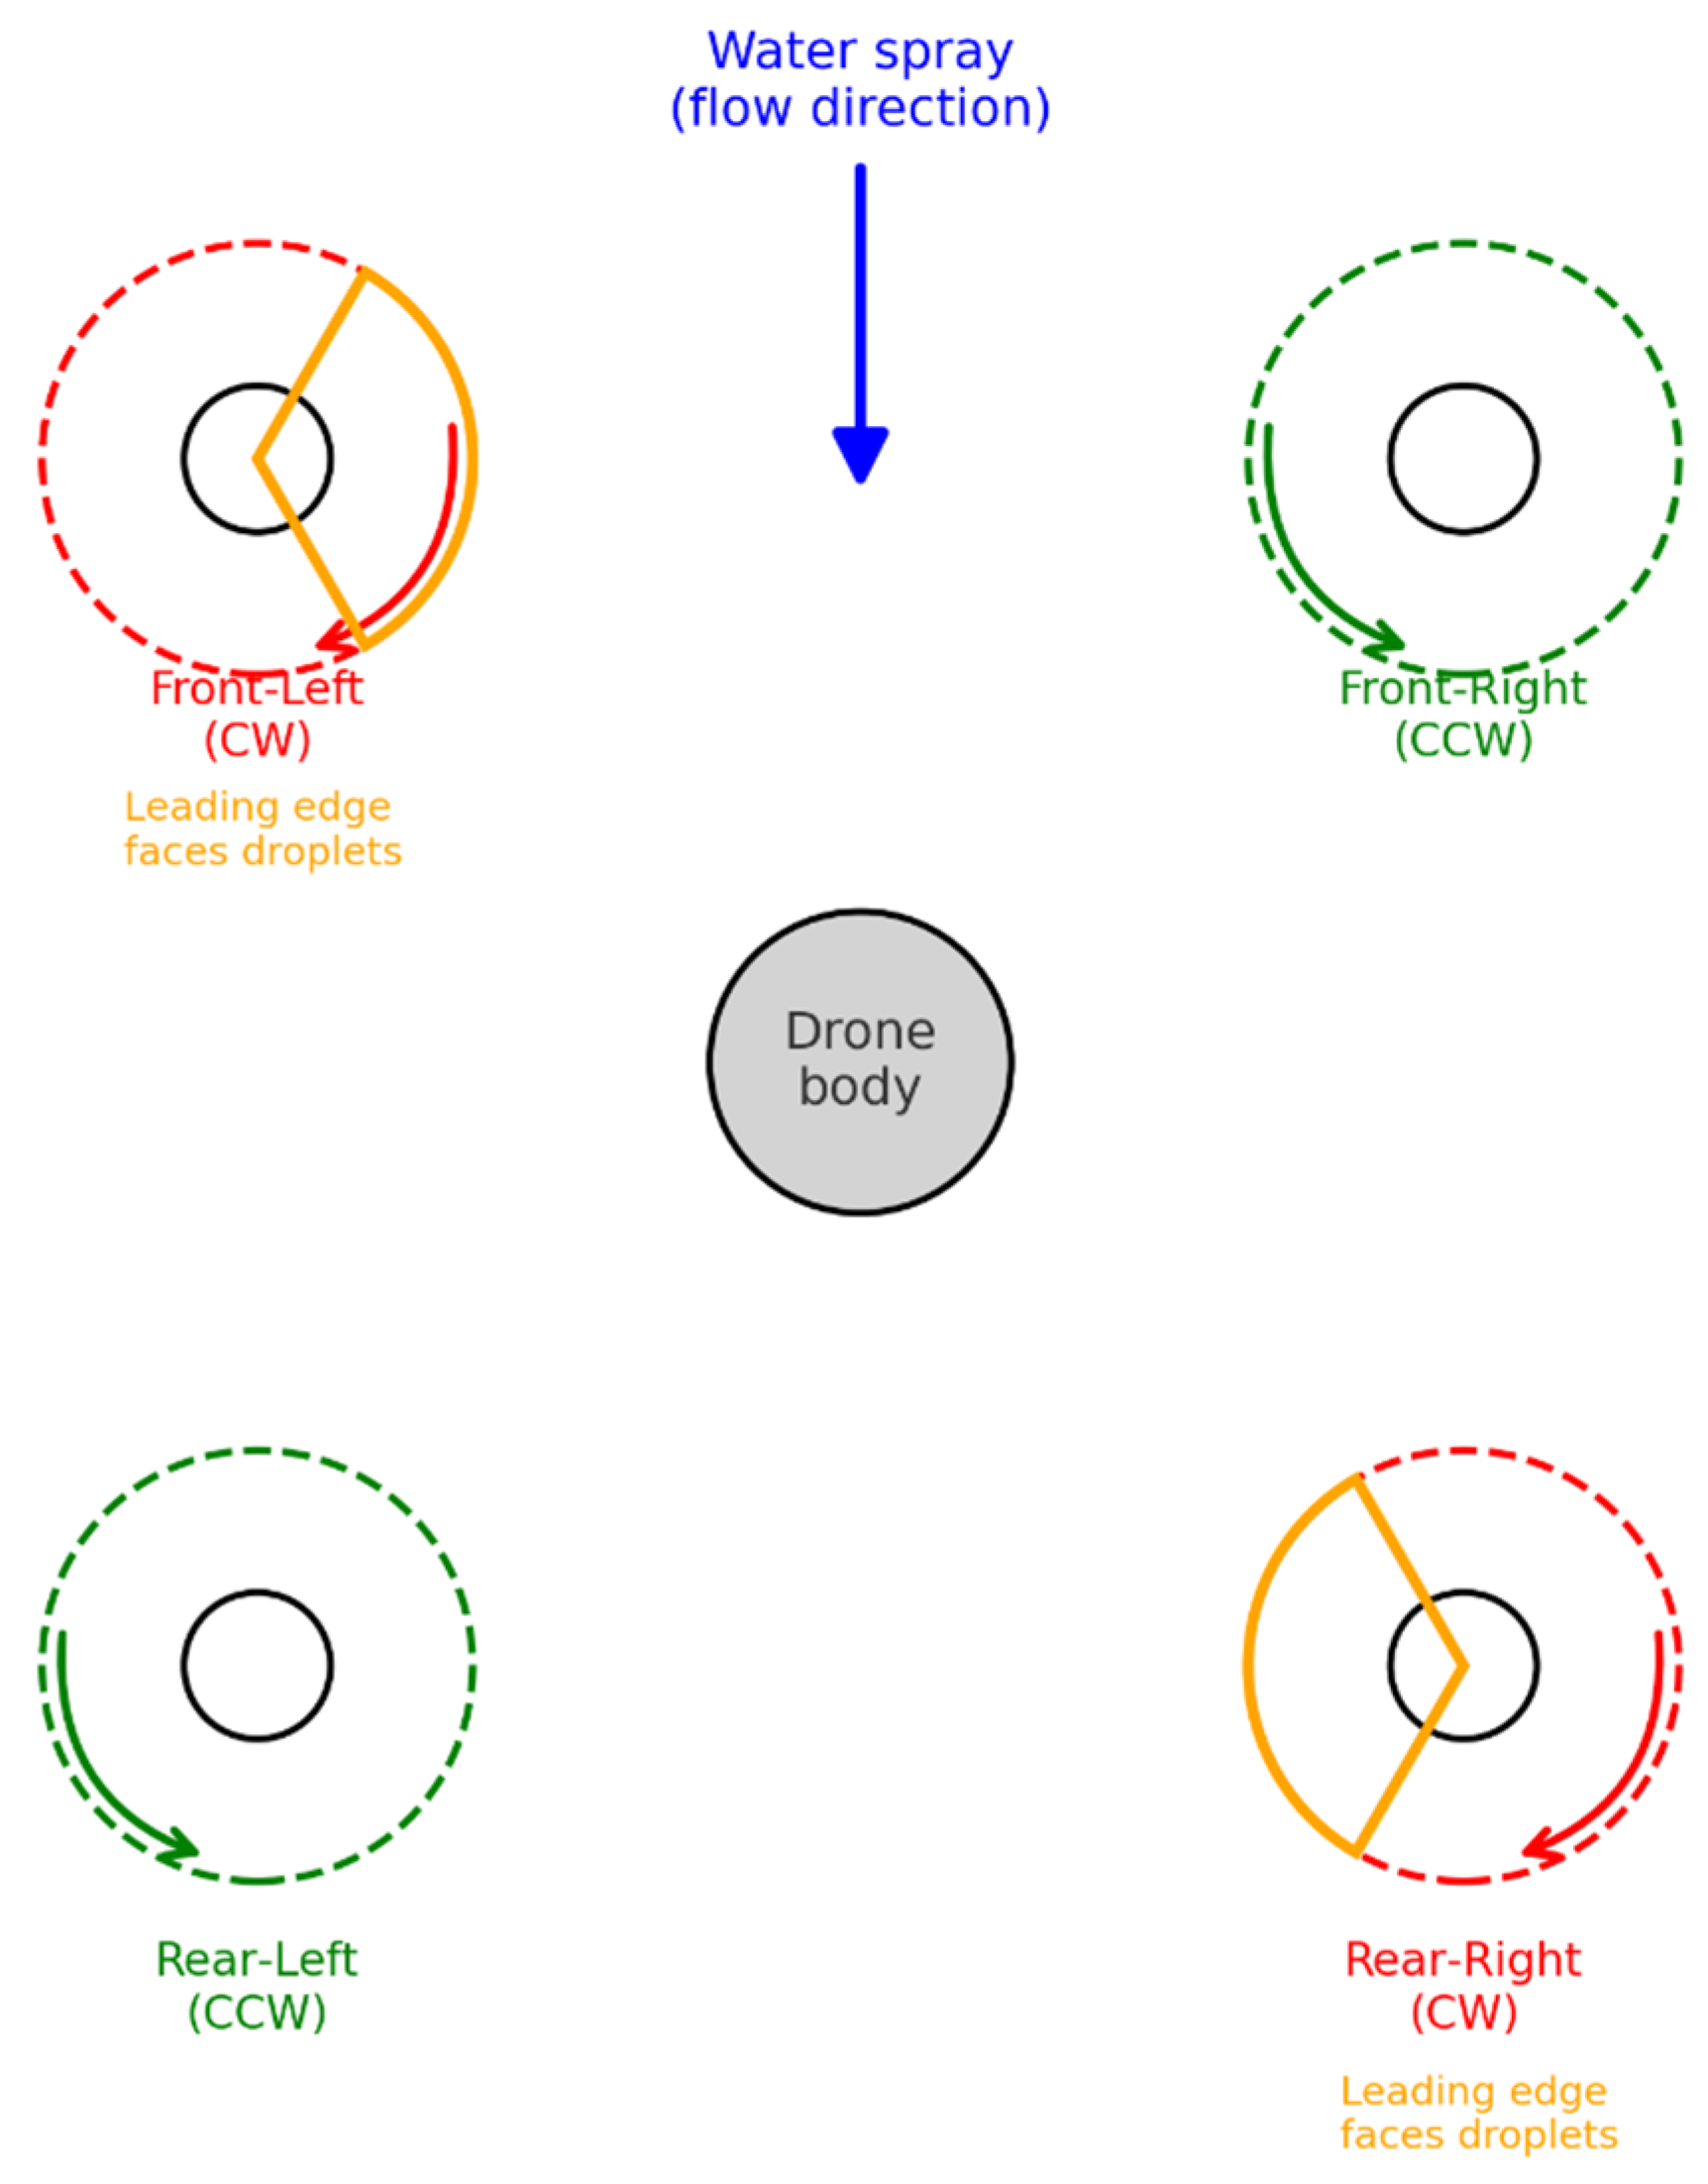
Under the rime-ice condition (−10 °C, 0.5 g/m3 LWC), the high impact rate of water particles resulted in an extensive icing of quadcopter propellers. The size and thickness of the ice accretion on the leading edges of the propellers increased as the rotor radius increased. Partial detachment of accumulated ice was observed in certain propellers. The quadcopter’s body was covered with a thin and smooth layer of ice; however, this did not pose a critical issue during flight. The effects of icing showed significant variations depending on the rotational direction of the propellers. As illustrated in Figure 4, due to the frontward water spray, the front-left (Lfront) and rear-right (Rback) propellers, which rotated CW (Clockwise), exhibited a higher tendency for icing compared to the other propellers rotating CCW (Counterclockwise). This phenomenon is attributed to the more direct and effective contact of water droplets with the front sections of CW-rotating propellers as they move downward. This motion of the propeller intercepted incoming water droplets at the angle of attack which significantly enhanced icing formation. Since the CW-rotating propellers remained in contact with the water droplets for a longer duration and at a higher intensity, ice accretion on their surfaces was considerably greater than on the front-right and rear-left propellers rotating in the CCW direction.
The schematic is drawn in plan view Figure 4. A uniform water-spray stream (blue arrow) is introduced and replicating the airflow and droplet trajectory in the cold-chamber tests. Each rotor disc is outlined by a dashed circle; red discs represent clockwise-rotating (CW) propellers (front-left and rear-right), while green discs represent counter-clockwise (CCW) propellers (front-right and rear-left). The curved arrows on the discs show the sense of rotation.
For the CW rotors, the front-half blade elements travel downward relative to the incoming droplets. The orange wedge marks this “high-exposure sector”: the blade leading edge meets the spray at a steep effective impingement angle and for a longer dwell time, so droplet capture efficiency and subsequent ice accretion are maximised. In contrast, on CCW rotors the front-half blade elements travel upward; the relative motion sweeps droplets away from the leading edge, shortening contact time and reducing ice growth.
Figure 4 therefore explains why, under the forward-spray configuration used in the experiment, the CW propellers accumulated visibly thicker glaze/rime layers than the CCW propellers despite the geometrically symmetrical layout of the vehicle.
Rime ice accumulates under conditions in which the surface energy balance (conductive/convective heat removal and sensible/latent heat terms) is sufficient to freeze impinging supercooled droplets upon contact. The resulting deposit is typically rougher and more opaque [34].
The heat transfer balance at the surface causes the water to freeze before it can flow, leading to ice accumulation being concentrated in a confined area near the propeller’s leading edge. During the first 100 s period, the ice accretion on the propeller was observed to closely follow the propeller profile, effectively increasing the propeller blades’ chord length, as seen in Figure 5a, similar to the findings in [9]. After 100 s, particularly from 230 s onward, the formation of icicles on the pressure side of the propeller disrupted the aerodynamic structure leading to higher power consumption. Direct weighing or melt-volume measurements planned for future tests will clarify the relative mass of rime versus glaze accretion under the present LWC/temperature settings. This process demonstrated the temporal variation in propeller performance and highlighted the complex interaction of ice accretion with aerodynamic effects.

3.2. Analysis of Glaze Ice Accretion on Rotating Propeller Surfaces

Under the glaze ice setting (−5 °C, 1.5 g/m3 LWC), the local surface heat balance leaves a finite liquid fraction. Upon impact, part of the supercooled water freezes, while a thin liquid film persists on the surface and/or atop previously deposited ice. Driven by aerodynamic shear and the blade’s rotation, this mobile film runs back and redistributes along the chord and toward larger radius, where it refreezes locally and can form icicles or irregular roughness. The net outcome is more irregular accretion that extends from the leading edge into the adjacent surfaces and spreads toward the tip region [35].
As a result of this dynamic icing process, the features of the leading edge became serrated and rougher than before. Rugged ice formation alters the airfoil’s aerodynamic characteristics, directly increasing power consumption. Disrupted airflow around the leading edge shortens the laminar flow zone, leading to a measurable decline in aerodynamic performance. Consequently, these icing configurations make airfoils less controllable, and deviations in rotational balance are commonly observed.
On the other hand, the persistence of a liquid phase allows continuous refreezing and facilitates the incremental accumulation of ice layers on the propeller surface. Each layer increases the surface roughness of the underlying ice, leading to a more complex texture. Such a serrated structure can disturb the near-blade airflow and modify local boundary-layer behavior; however, the present dataset does not include flow visualization, so this aerodynamic interpretation is presented as a plausible explanation rather than a demonstrated mechanism. The observed increases in required attitude tilt and power draw under glaze conditions are consistent with this interpretation [36,37].
Similar to rime ice conditions, the front-sprayed supercooled water droplets under glaze ice conditions caused the CW rotating front-left and rear-right propellers to exhibit more severe icing compared to the CCW rotating propellers. This difference arose from the fact that the upper sections of the CW rotating propellers moved downward, directly and more effectively encountering the incoming water droplets. Ice accumulation increased as this movement causes the water droplets to have a higher speed and longer contact time with the propeller surface. Thus, propellers rotating in the CW direction showed a greater tendency to icing compared to front-right and rear-left propellers rotating CCW.
At the initial stage, the speeds of the motors rapidly increased to reach their stable operating levels. At this stage, the impacts of icing were not yet noticeable because no significant ice accumulation had formed on the propellers. As a result of the constant spraying of water, ice accumulated on the propellers and periodically shed. Speed fluctuations were observed in both motors; these fluctuations could be attributed to the irregular ice accumulation on the propellers and the periodic shedding of ice. Weight distribution changes occurring during ice shedding, and the motors’ efforts to compensate for this imbalance led to speed variations. Additionally, liquid water moved from the propeller roots to the tips, causing needle-like ice structures to form at the tips. This process clearly exhibited the characteristic features of glaze ice formation.

3.3. Image-Based Leading-Edge Ice Thickness

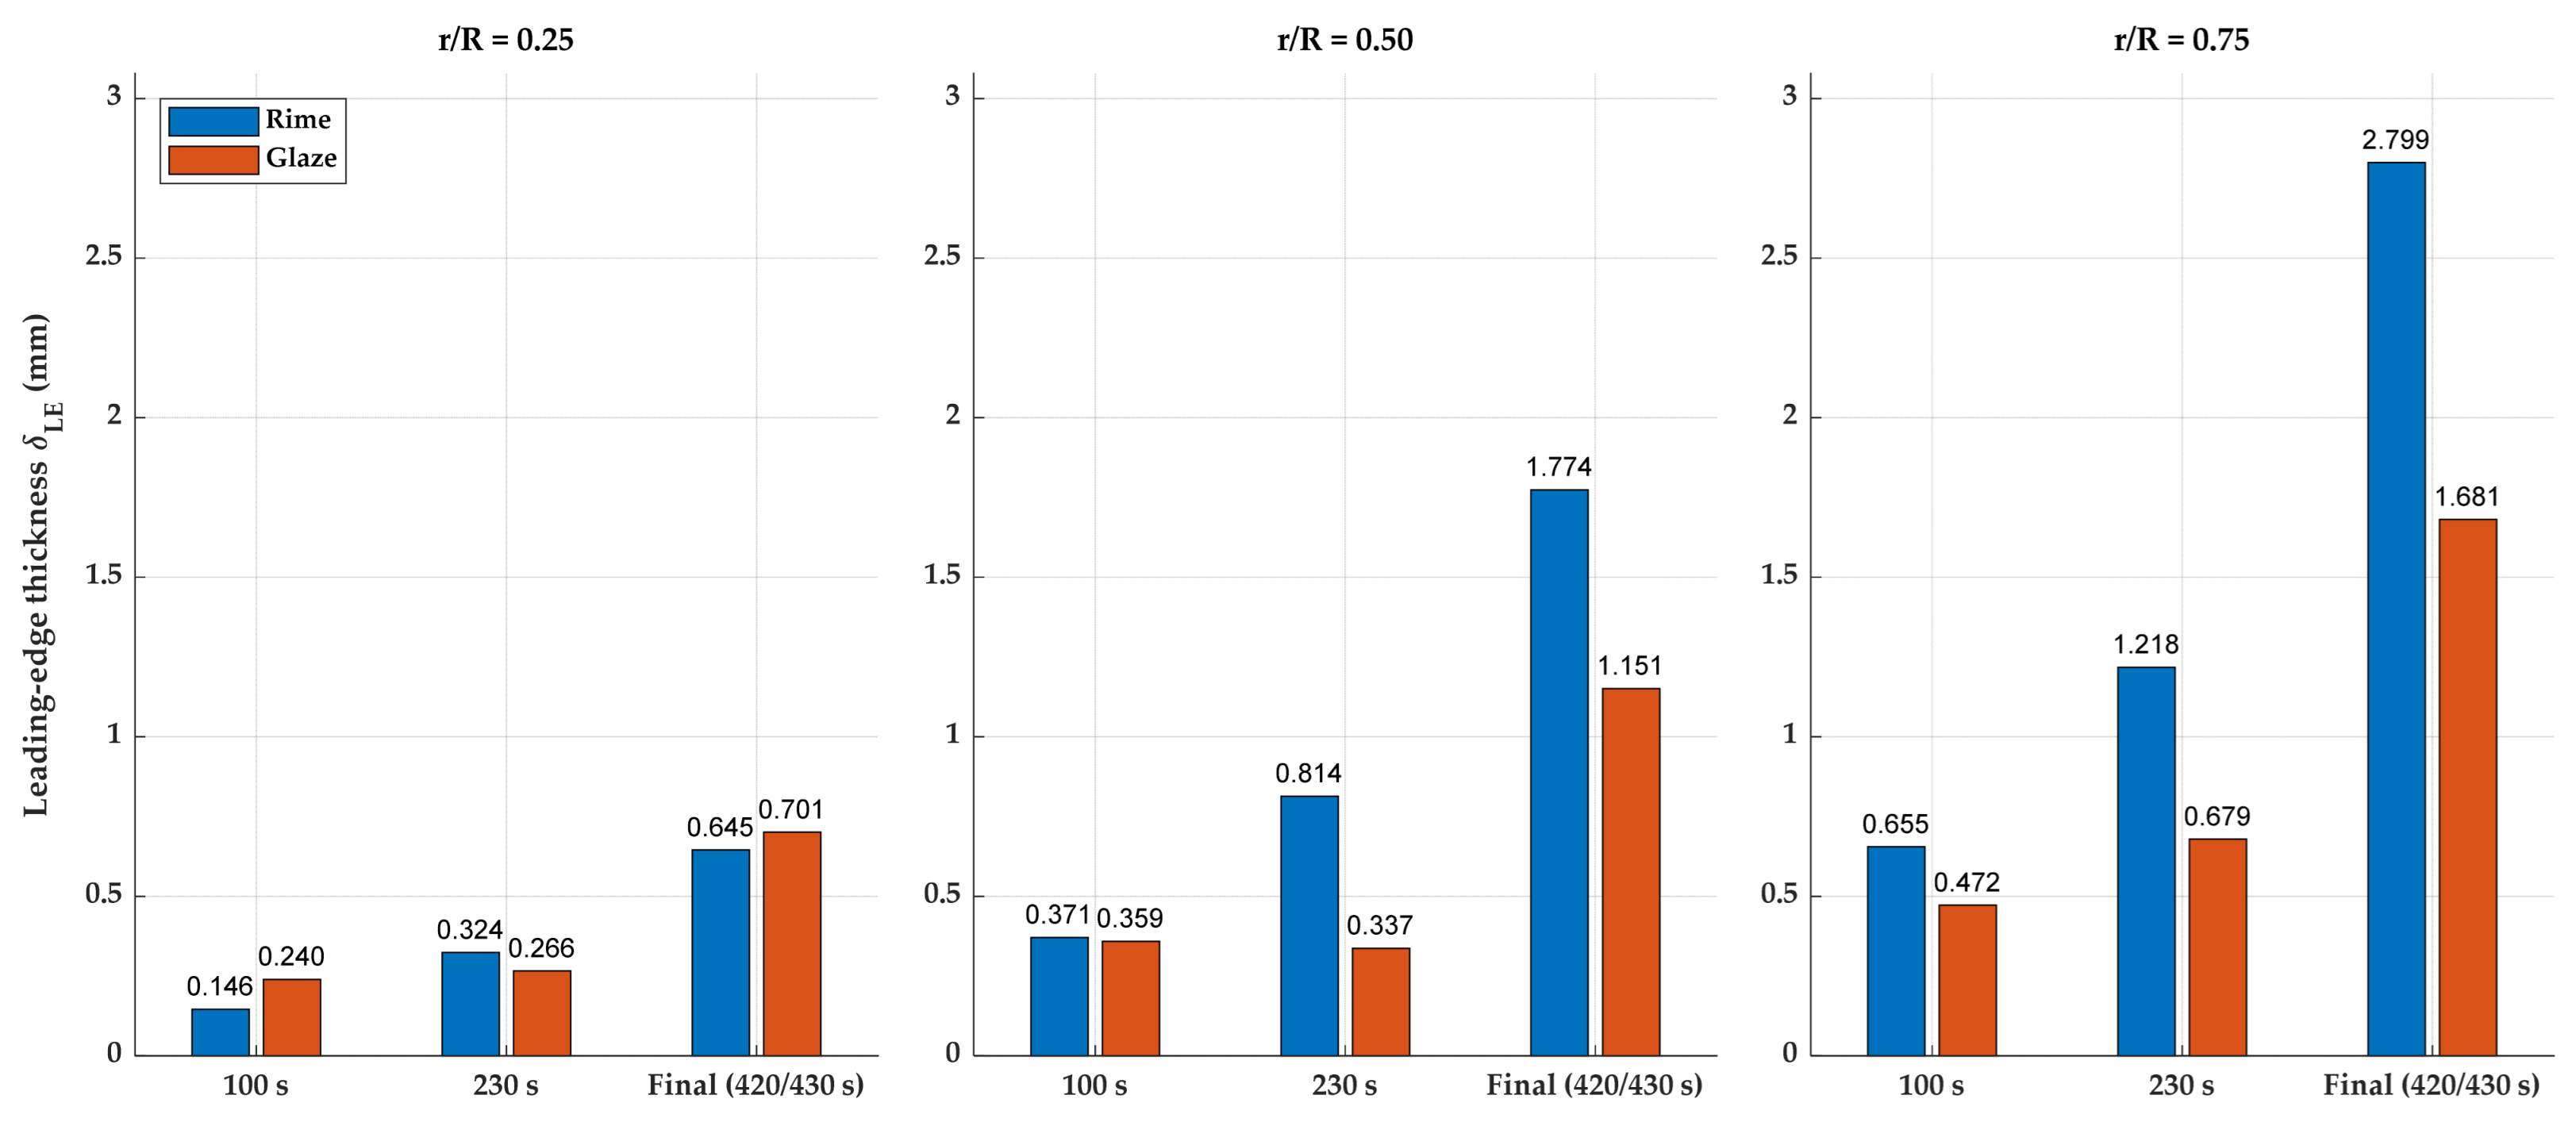
Table 3 quantifies the geometric growth of the leading-edge deposits and shows two robust trends. First, δLE increases monotonically with time for both regimes. Second, a persistent spanwise gradient is observed at each time, with larger thickness toward the tip (0.75R > 0.50R > 0.25R), consistent with the increase in local relative velocity with radius. The thickness values in Table 3 were extracted from the time-stamped photographs shown in Figure 5a–c (rime) and Figure 6a–c (glaze). At late times, the rime case develops a thicker tip-cap, whereas glaze remains thinner but more distributed spanwise. These values are calibrated estimates derived from still images and they capture the magnitude and spanwise trends of the accretion.
Figure 7 compiles these measurements for the CW blades at three spanwise stations. The charts reaffirm two robust patterns visible in the photographs: ice thickness grows with time in both regimes and increases toward the tip. Although the glaze case forms thinner leading-edge deposits, it spreads more chordwise and develops a rough, serrated morphology with intermittent shedding. This geometry and unsteadiness impose a larger aerodynamic penalty than peak thickness alone would suggest, consistent with the higher control effort and power demand observed in the time histories. For this reason, rather than reducing the phenomenon to a single ‘ice mass’ value, time- and span-resolved metrics capturing the spatial distribution and evolution of the accretion were emphasized.
In the context of Table 3 and Figure 5 and Figure 6, instead, the reporting of a single ‘ice mass’ number for each run was deliberately avoided. For rotating, quadcopter configurations, intermittent shedding, re-freezing, and water redistribution introduce large and poorly quantifiable biases in post-run gravimetric measurements. Moreover, rime and glaze exhibit substantially different effective densities so translating volume to mass requires assumptions that can dominate the uncertainty. To avoid overstating precision, time-resolved geometric proxies (δLE) and the non-dimensional accumulation metric Ac were used, which together capture both the delivered water load and the morphological growth that drives aerodynamic penalties. In future work, an inline collection/weighing manifold and multi-view photogrammetry will be added to bound the mass within calibrated uncertainty limits.

3.4. Attitude Response Under Icing (Pitch/Roll Angles)

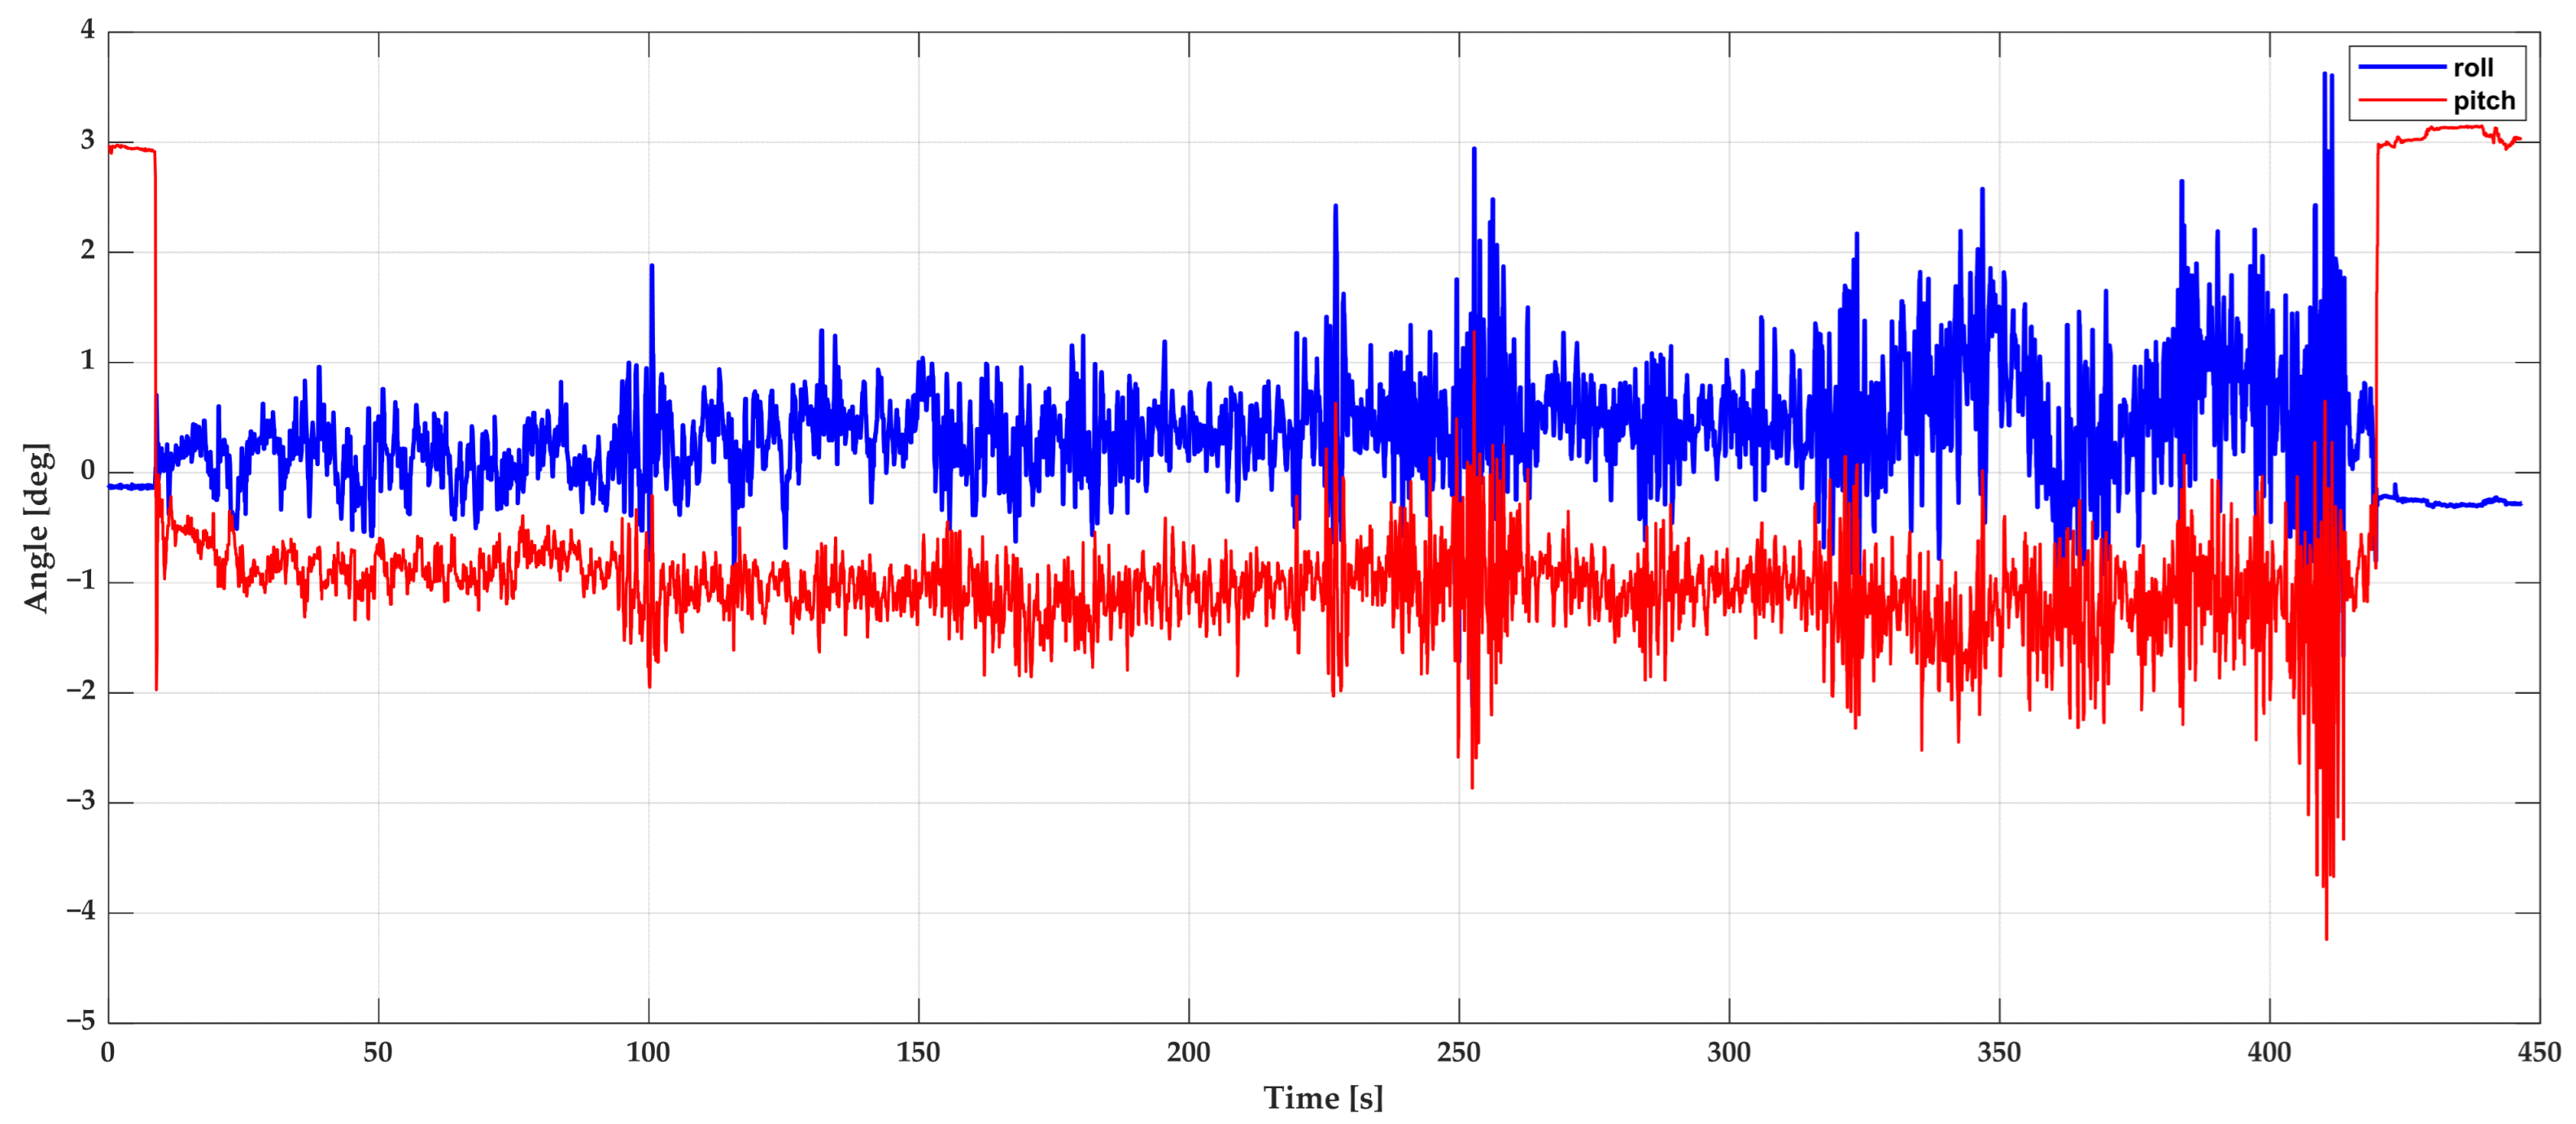
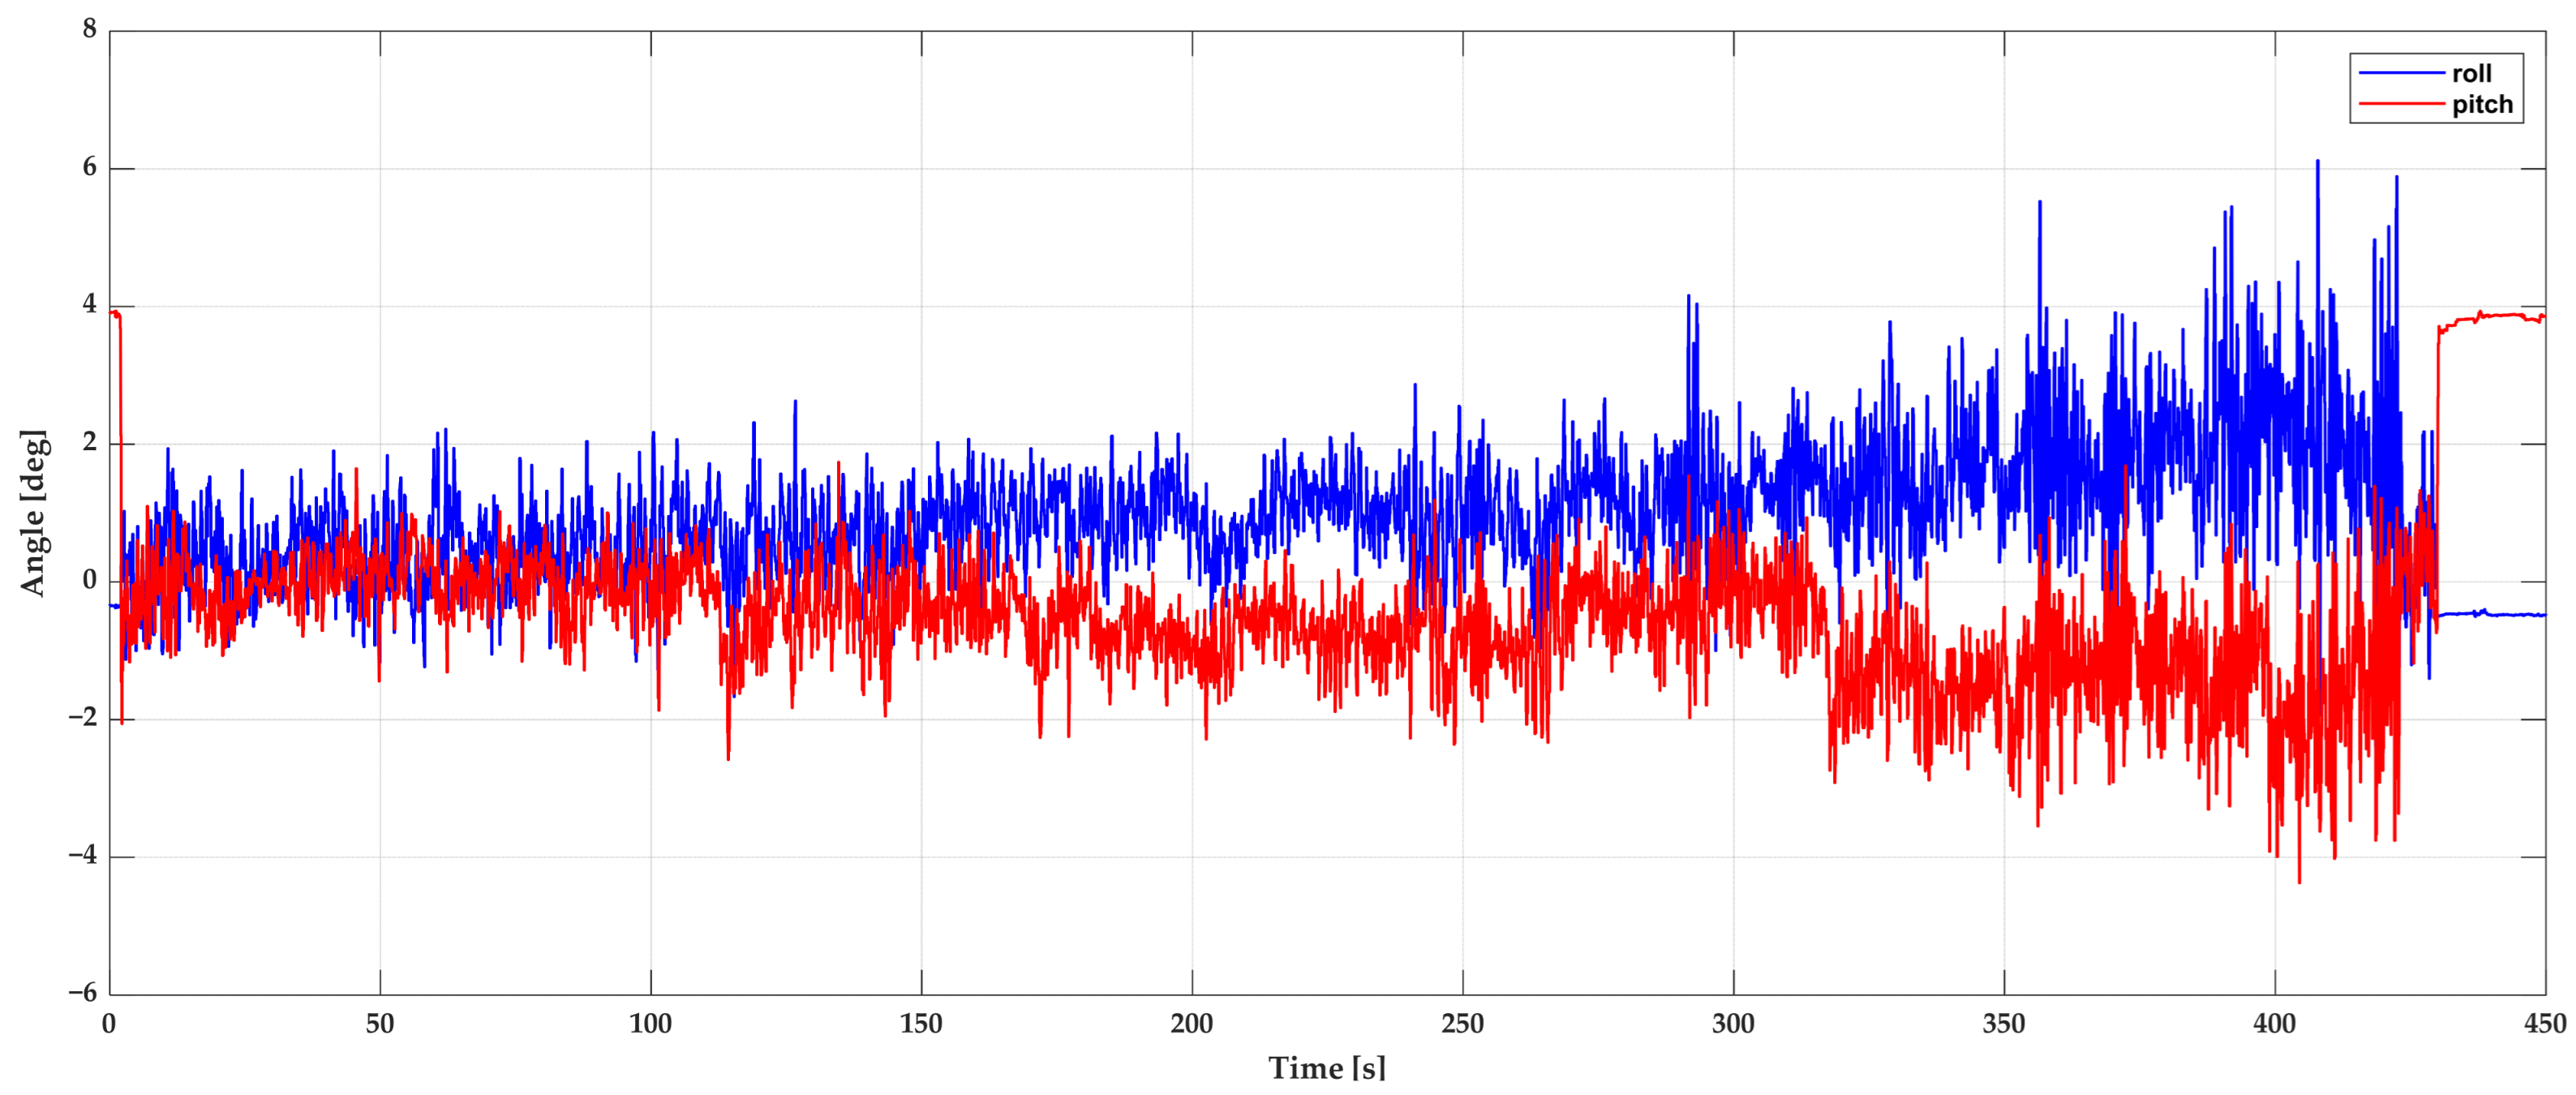
During hover with the downward Vision Positioning System (VPS) enabled, the quadcopter exhibited motions in pitch and roll to hold position against the uniform 5 m/s chamber flow and water spray. Figure 8 and Figure 9 present time histories of the attitude angles (pitch and roll, degrees) for the rime and glaze runs. A small, non-zero mean angle is expected under such conditions, because a slight tilt creates the horizontal thrust required to balance the aerodynamic load. Faster fluctuations around this mean reflect continuous closed-loop corrections by the flight controller.
In the rime ice conditions, pitch and roll remained mostly within approximately ±3°. In the glaze run, angles occasionally reached ~5–6° with greater variability. This increase was consistent with the higher and more dynamic loading characteristic of glaze ice accretion. Angles were reported rather than angular rates because they more directly indicated the thrust-vectoring required to maintain hover, whereas rate traces were noisier and did not alter the interpretation.

3.5. Impact of Rime Icing Condition on UAV Performance

Rime ice forms when the local surface heat balance favors freeze-on-contact of impinging supercooled droplets. Under our rime setting (T ≈ −10 °C, LWC ≈ 0.5 g/m3) the droplets solidified at impact, preventing coalescence or runback. This process results in a rough, opaque ice accretion that covers the propeller and body, negatively affecting UAV performance. This icing condition disrupts the aerodynamics of the quadcopter, limiting its ability to take off, climb and manoeuvre. The increased drag force and reduced lift caused by rime ice can significantly shorten UAV range and mission duration. Therefore, understanding the difficulties caused by rime ice conditions and taking preventive measures are critical for both operational efficiency and flight safety. Additionally, icing significantly increases power consumption in quadcopters [38]. Quadcopter systems typically aim to maintain a constant RPM. However, due to the increased load caused by ice accumulation, the control system compensates by supplying additional power to the motors, resulting in a higher current draw from the battery.
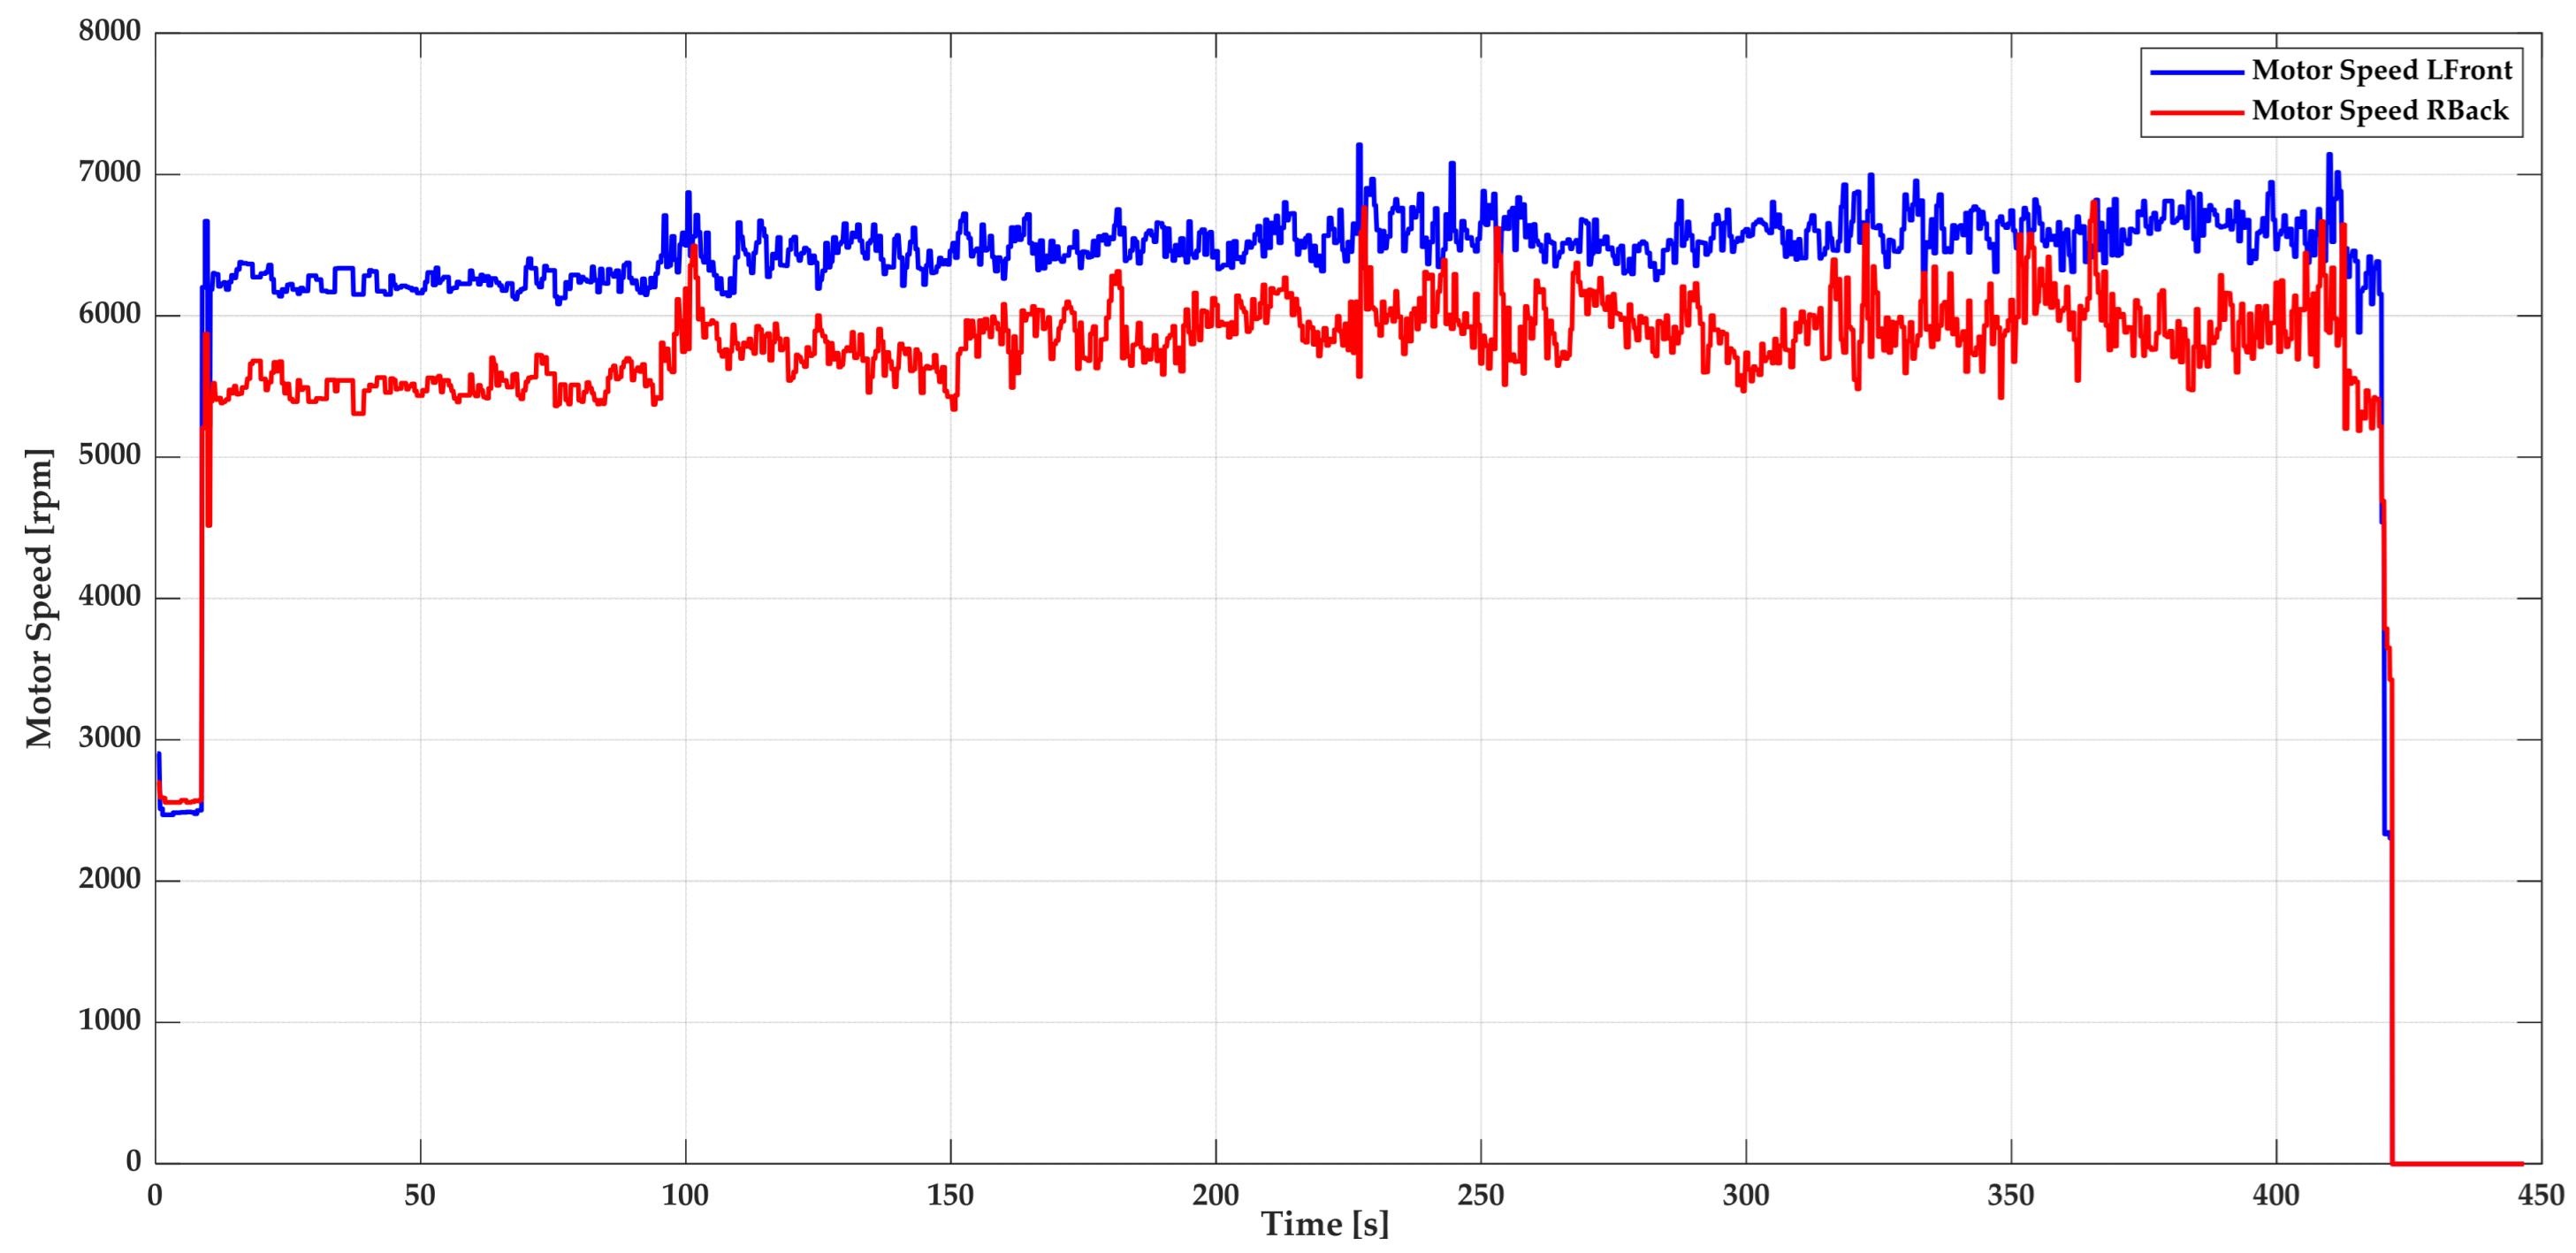
In the study, the flight data of the quadcopter under different icing conditions were obtained and analysed through CsvView software. Figure 10 illustrates the motor speed graph of the DJI Mavic Air 2 operating under rime ice conditions. At t ≈ 100 s, the image-based leading-edge ice thickness at the tip (r/R = 0.75) was ≈0.655 mm (Table 3). During the first 100 s, this thin, conformal rime cap effectively increased the sectional chord while largely preserving the aerodynamic line, which is consistent with the near-constant RPM in Figure 10 and the low-amplitude current oscillations. Despite the increased weight from ice accretion, the motor’s rotational speed remained relatively stable due to the favourable aerodynamic profile created by the initial thin ice layer. However, at ≈100 s, ice accumulation reached a critical aerodynamic threshold, triggering a sudden controller response marked by a pronounced spike in motor current and fluctuations in rotor speed. Following this event, the formation of icicles beneath the propeller blade surfaces significantly disrupted airflow uniformity. These icicle structures caused periodic aerodynamic disturbances, forcing the flight controller into frequent, small adjustments. Consequently, motor speed exhibited continuous ripple-like oscillations and increased slightly above the initial steady-state RPM to compensate for the reduced aerodynamic efficiency caused by the icicle-induced disturbances. This persistent instability illustrates the complex dynamic interaction between evolving ice shapes, specifically the formation of under-blade icicles, and the quadcopter’s real-time flight control responses.
Brushless Direct Current Motors (BLDC) do not inherently maintain constant power; instead, the flight controller and Electronic Speed Controller (ESC) attempt to maintain a target rotor speed (RPM).
When battery voltage sag occurs, the ESC compensates by increasing the Pulse Width Modulation (PWM) duty-cycle so that the motor can draw higher current to reach the commanded RPM. As a result, electrical power (P = V × I) rises and falls according to the instantaneous load, the available battery voltage, and the controller’s limits. During icing tests, ice accretion increased aerodynamic torque, the ESC responded with higher duty-cycle and current draw, and the motor power therefore fluctuated rather than remaining steady.
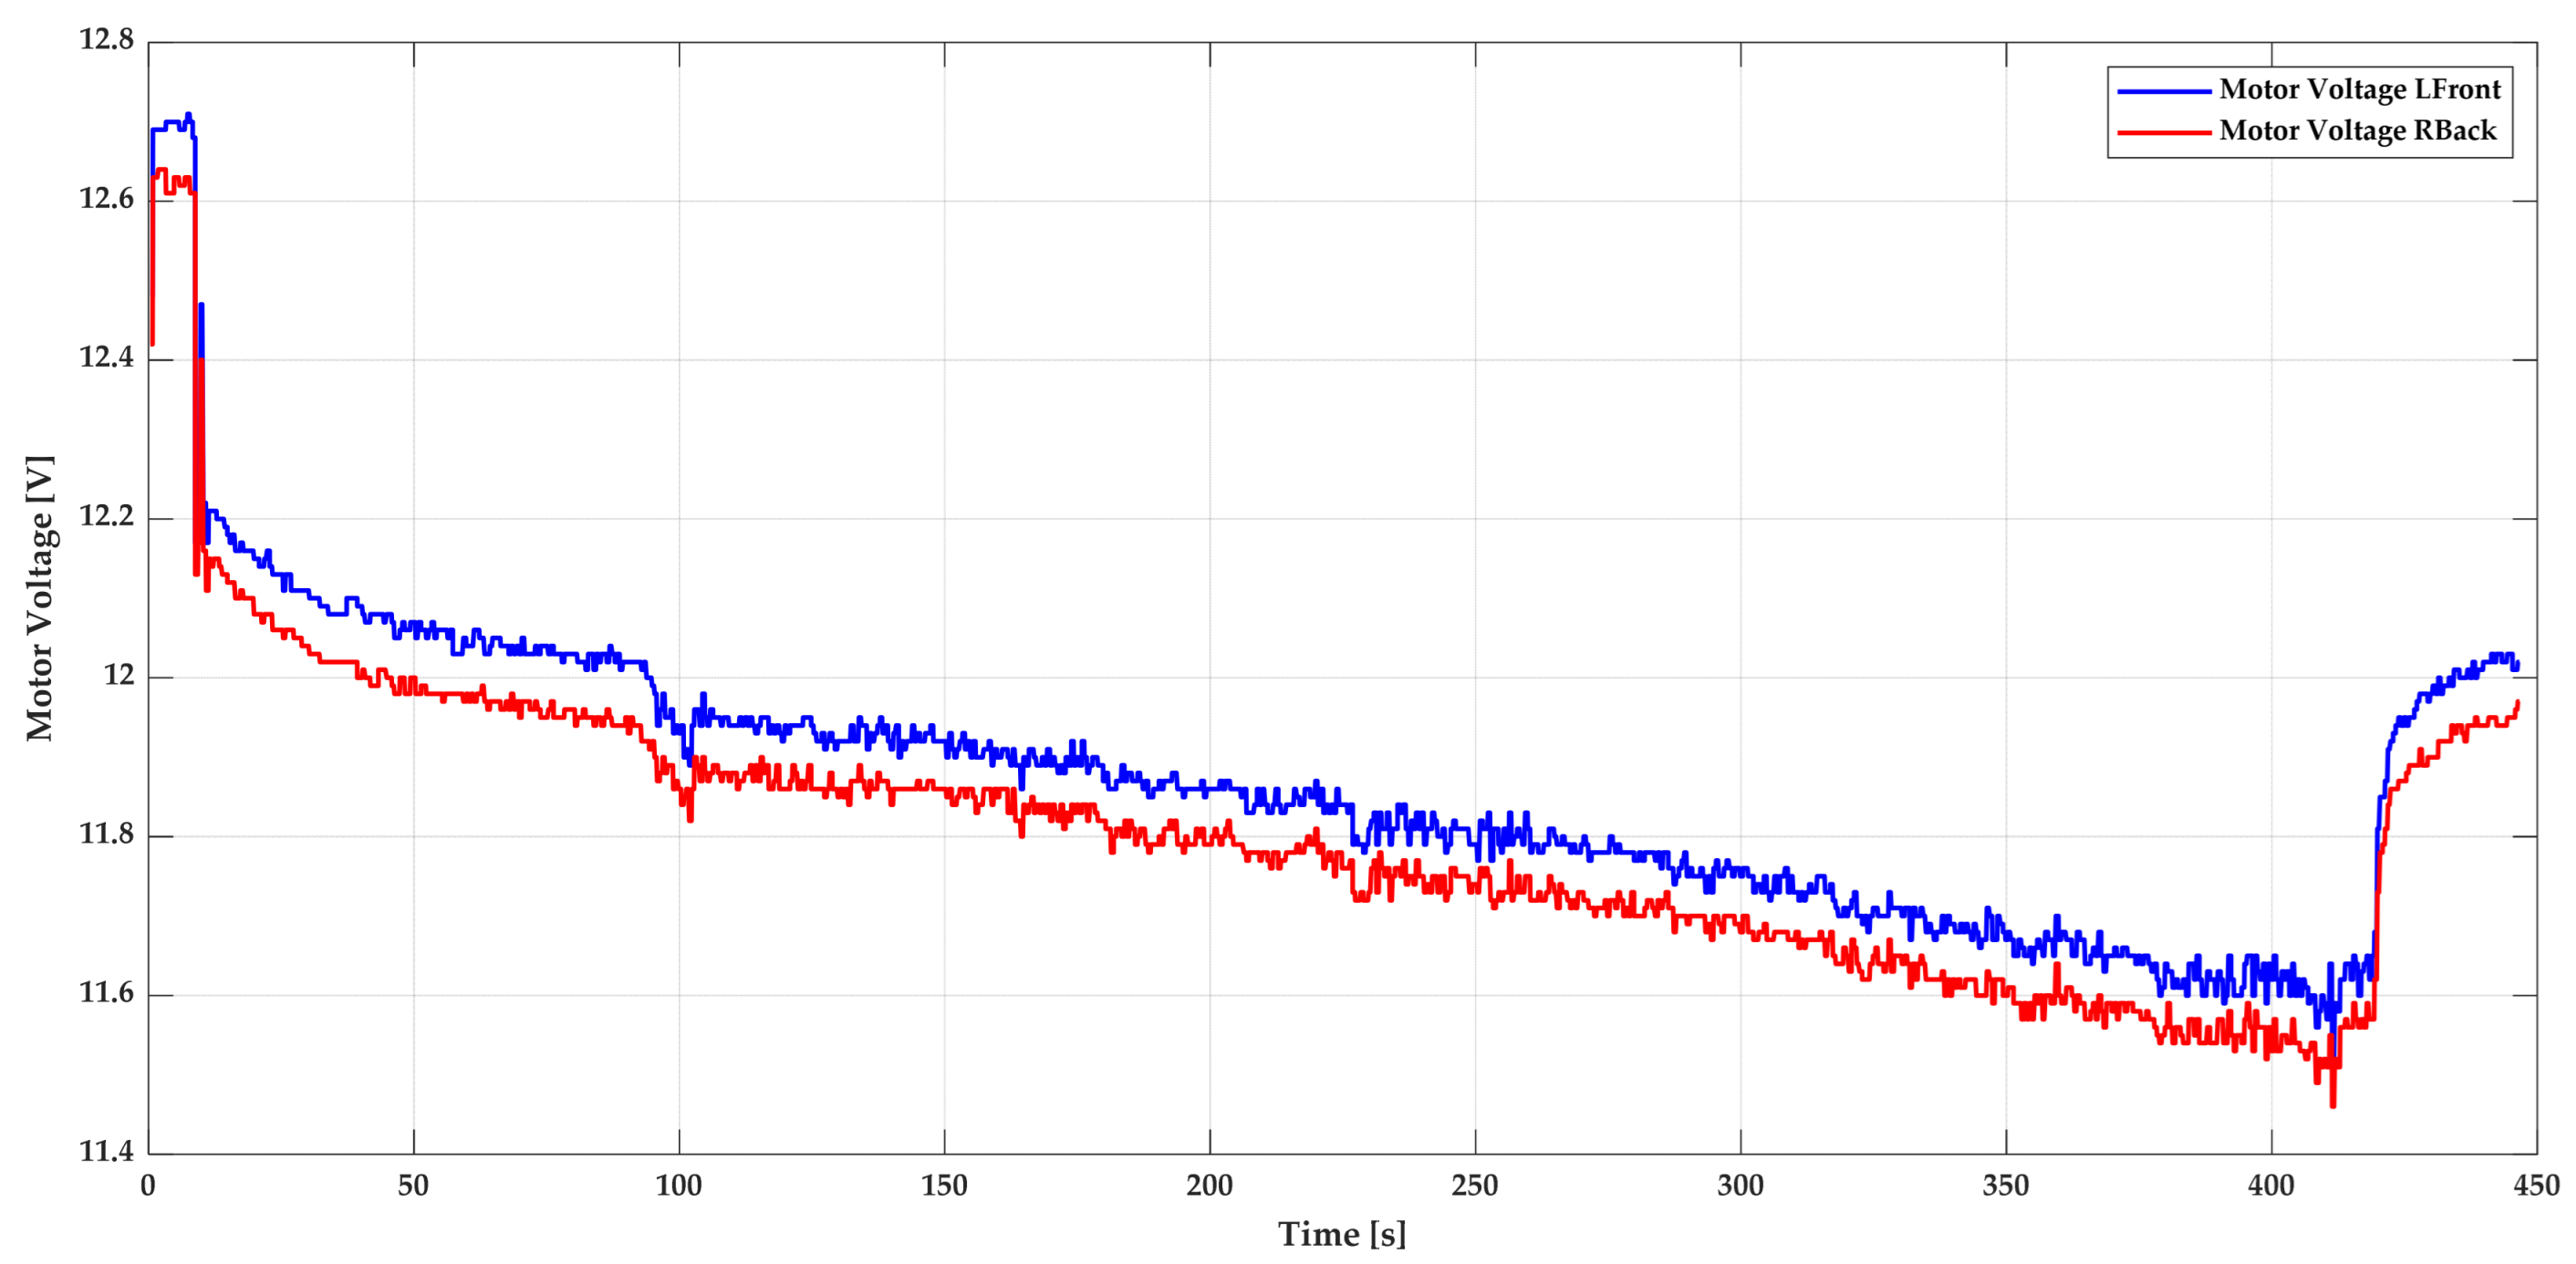
Figure 11 illustrates the voltage values of the DJI Mavic Air 2 operating under rime ice conditions. After takeoff, the terminal voltage values of the CW rotating motors were 12.17 V for the front-left motor and 12.13 V for the rear-right motor. Throughout the flight, the voltage values exhibited a rapid continuous decrease. Just before landing, the terminal voltages measured 11.58 V for the front-left motor and 11.51 V for the rear-right motor.
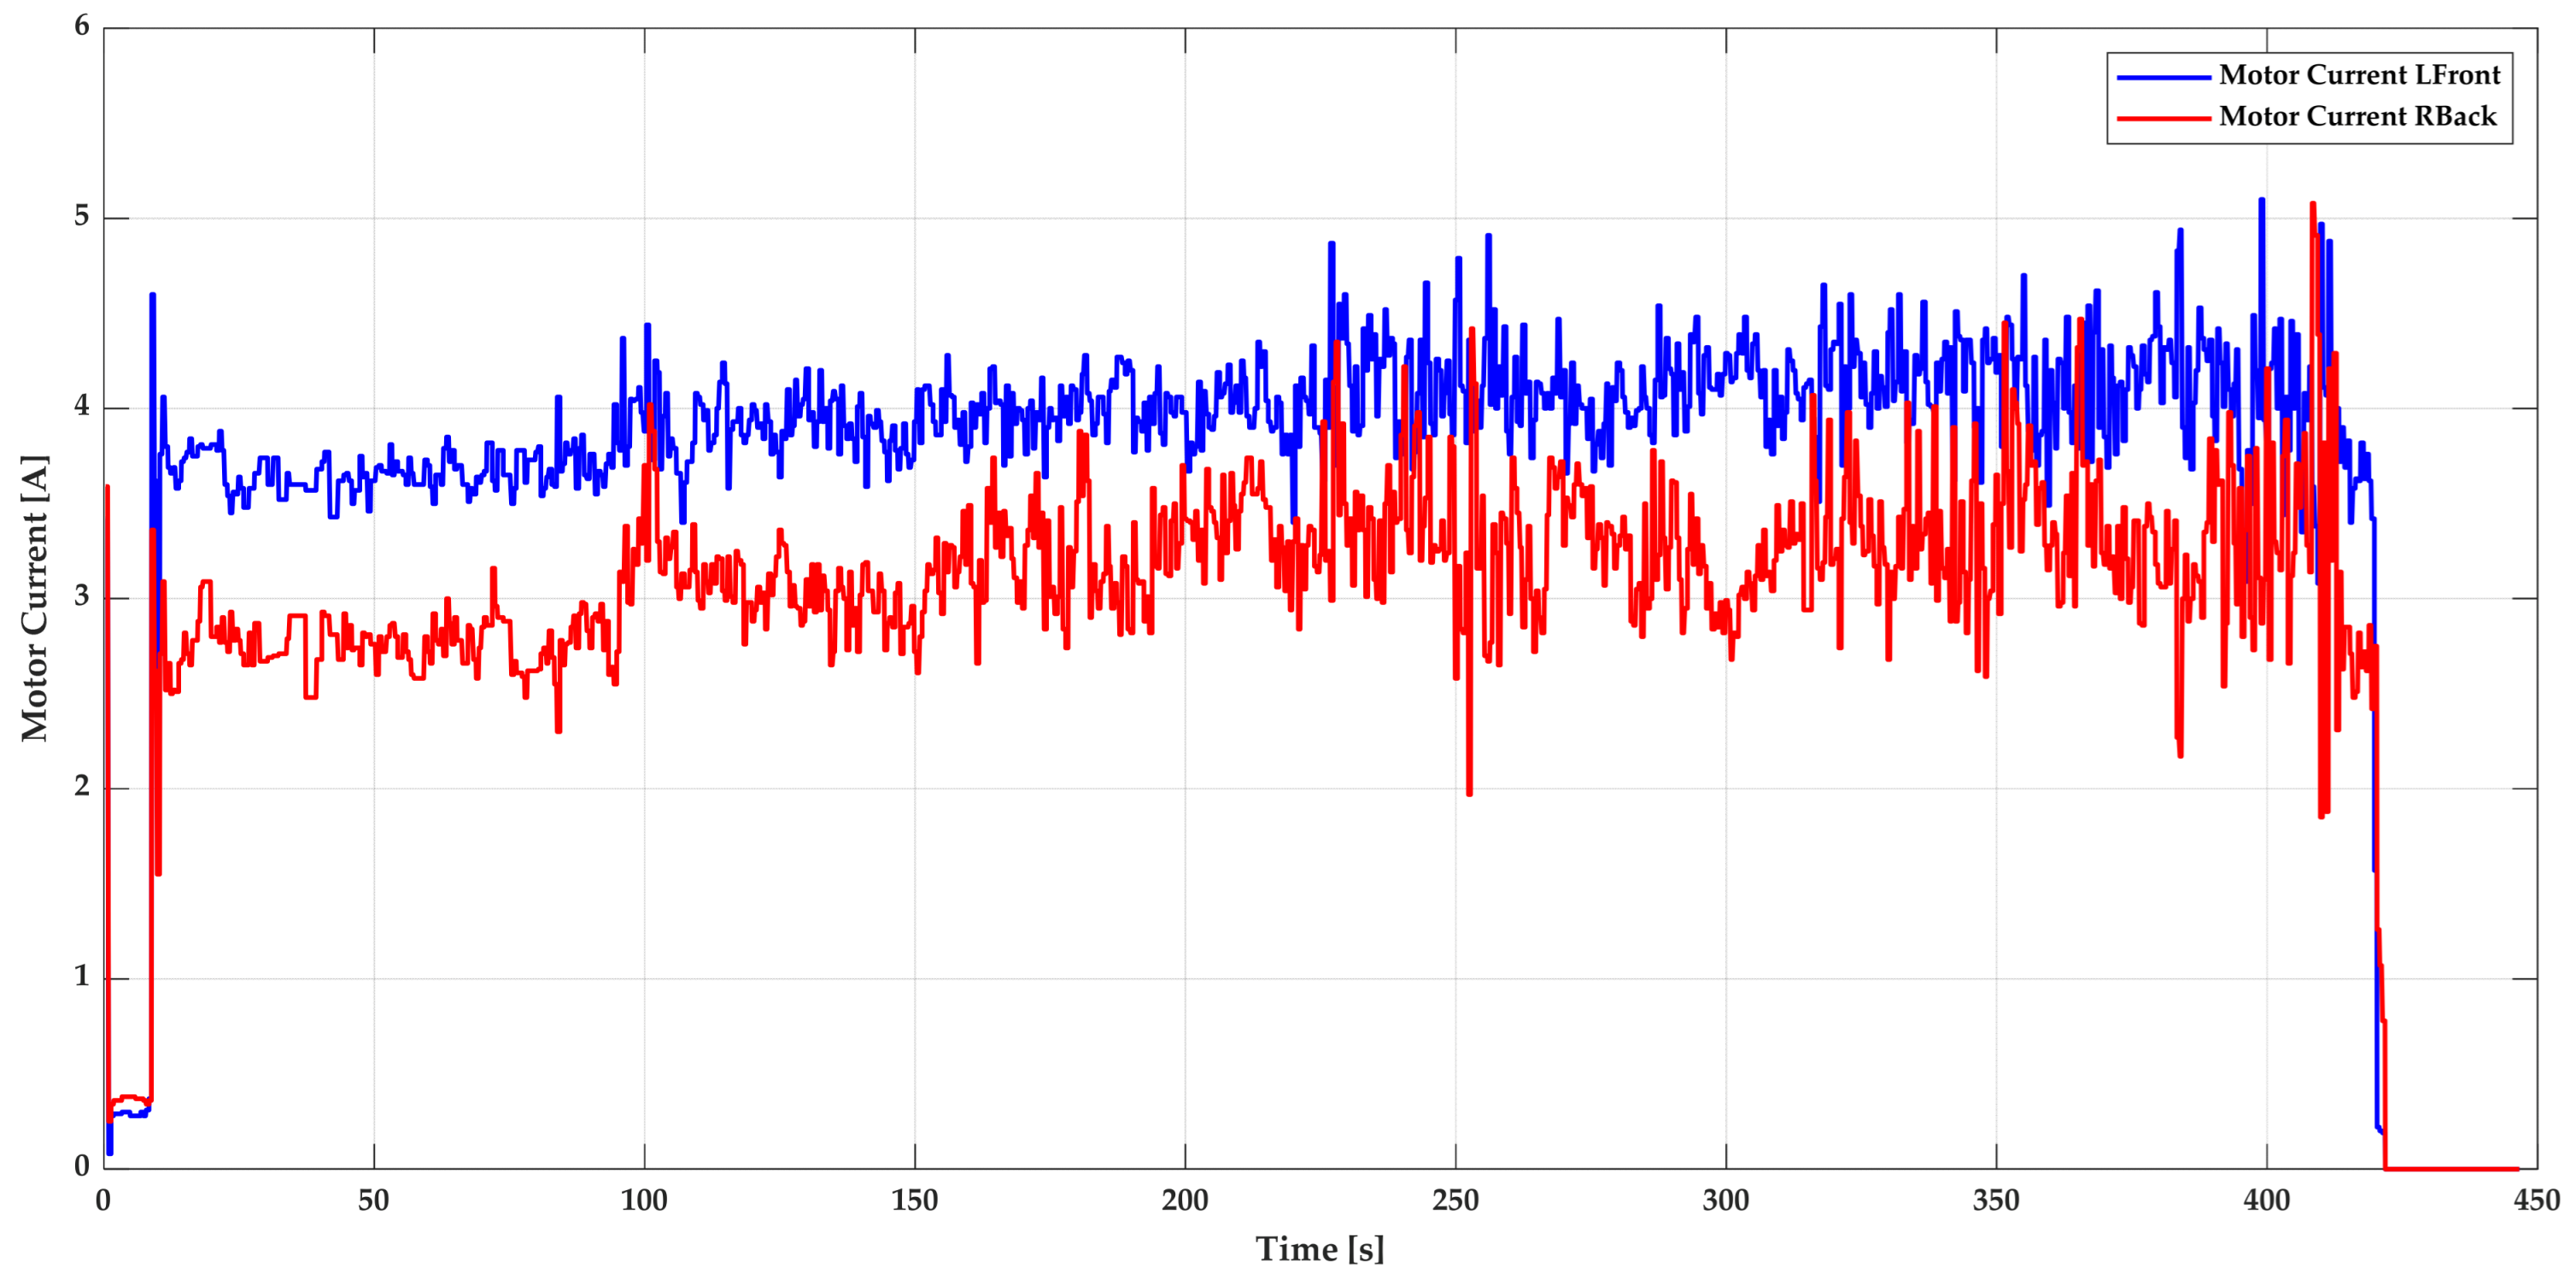
Figure 12 shows the current graphs of the quadcopter’s CW rotating motors. The current values initially (between 0 and 100 s) exhibited a relatively stable oscillation. After 100 s, a significant upward trend was observed in both currents due to ice accumulation, which increased the total mass of the rotating propeller and disrupted its aerodynamic structure. Particularly during the first 100 s, the accumulated ice spread uniformly along the propeller blades’ leading edge and airfoil profile, increasing the blades’ effective chord length. This increase can enable the propeller to generate more efficient thrust under certain speed and load conditions, resulting in a minimal decrease in the current drawn by the motor. However, after 100 s, as the rime ice layers thickened, flow characteristics began to deteriorate, and asymmetric icicles formed on the pressure side of the propeller became prominent, especially after 230 s, leading to aerodynamic instability. By t ≈ 230 s, the tip thickness had approximately doubled relative to 100 s, reaching ≈1.218 mm at r/R = 0.75 (Table 3). The associated roughness growth and pressure-side icicle formation plausibly advanced boundary-layer transition and increased profile drag, explaining the monotonic rise and ripple in motor current in Figure 12 together with the slight RPM increase observed in Figure 10. Consequently, the torque required by the propeller fluctuated abruptly, causing variations in the current drawn by the motor. These fluctuations reflect sudden load changes in the flow field around the propeller due to increased ice mass and aerodynamic inefficiency.
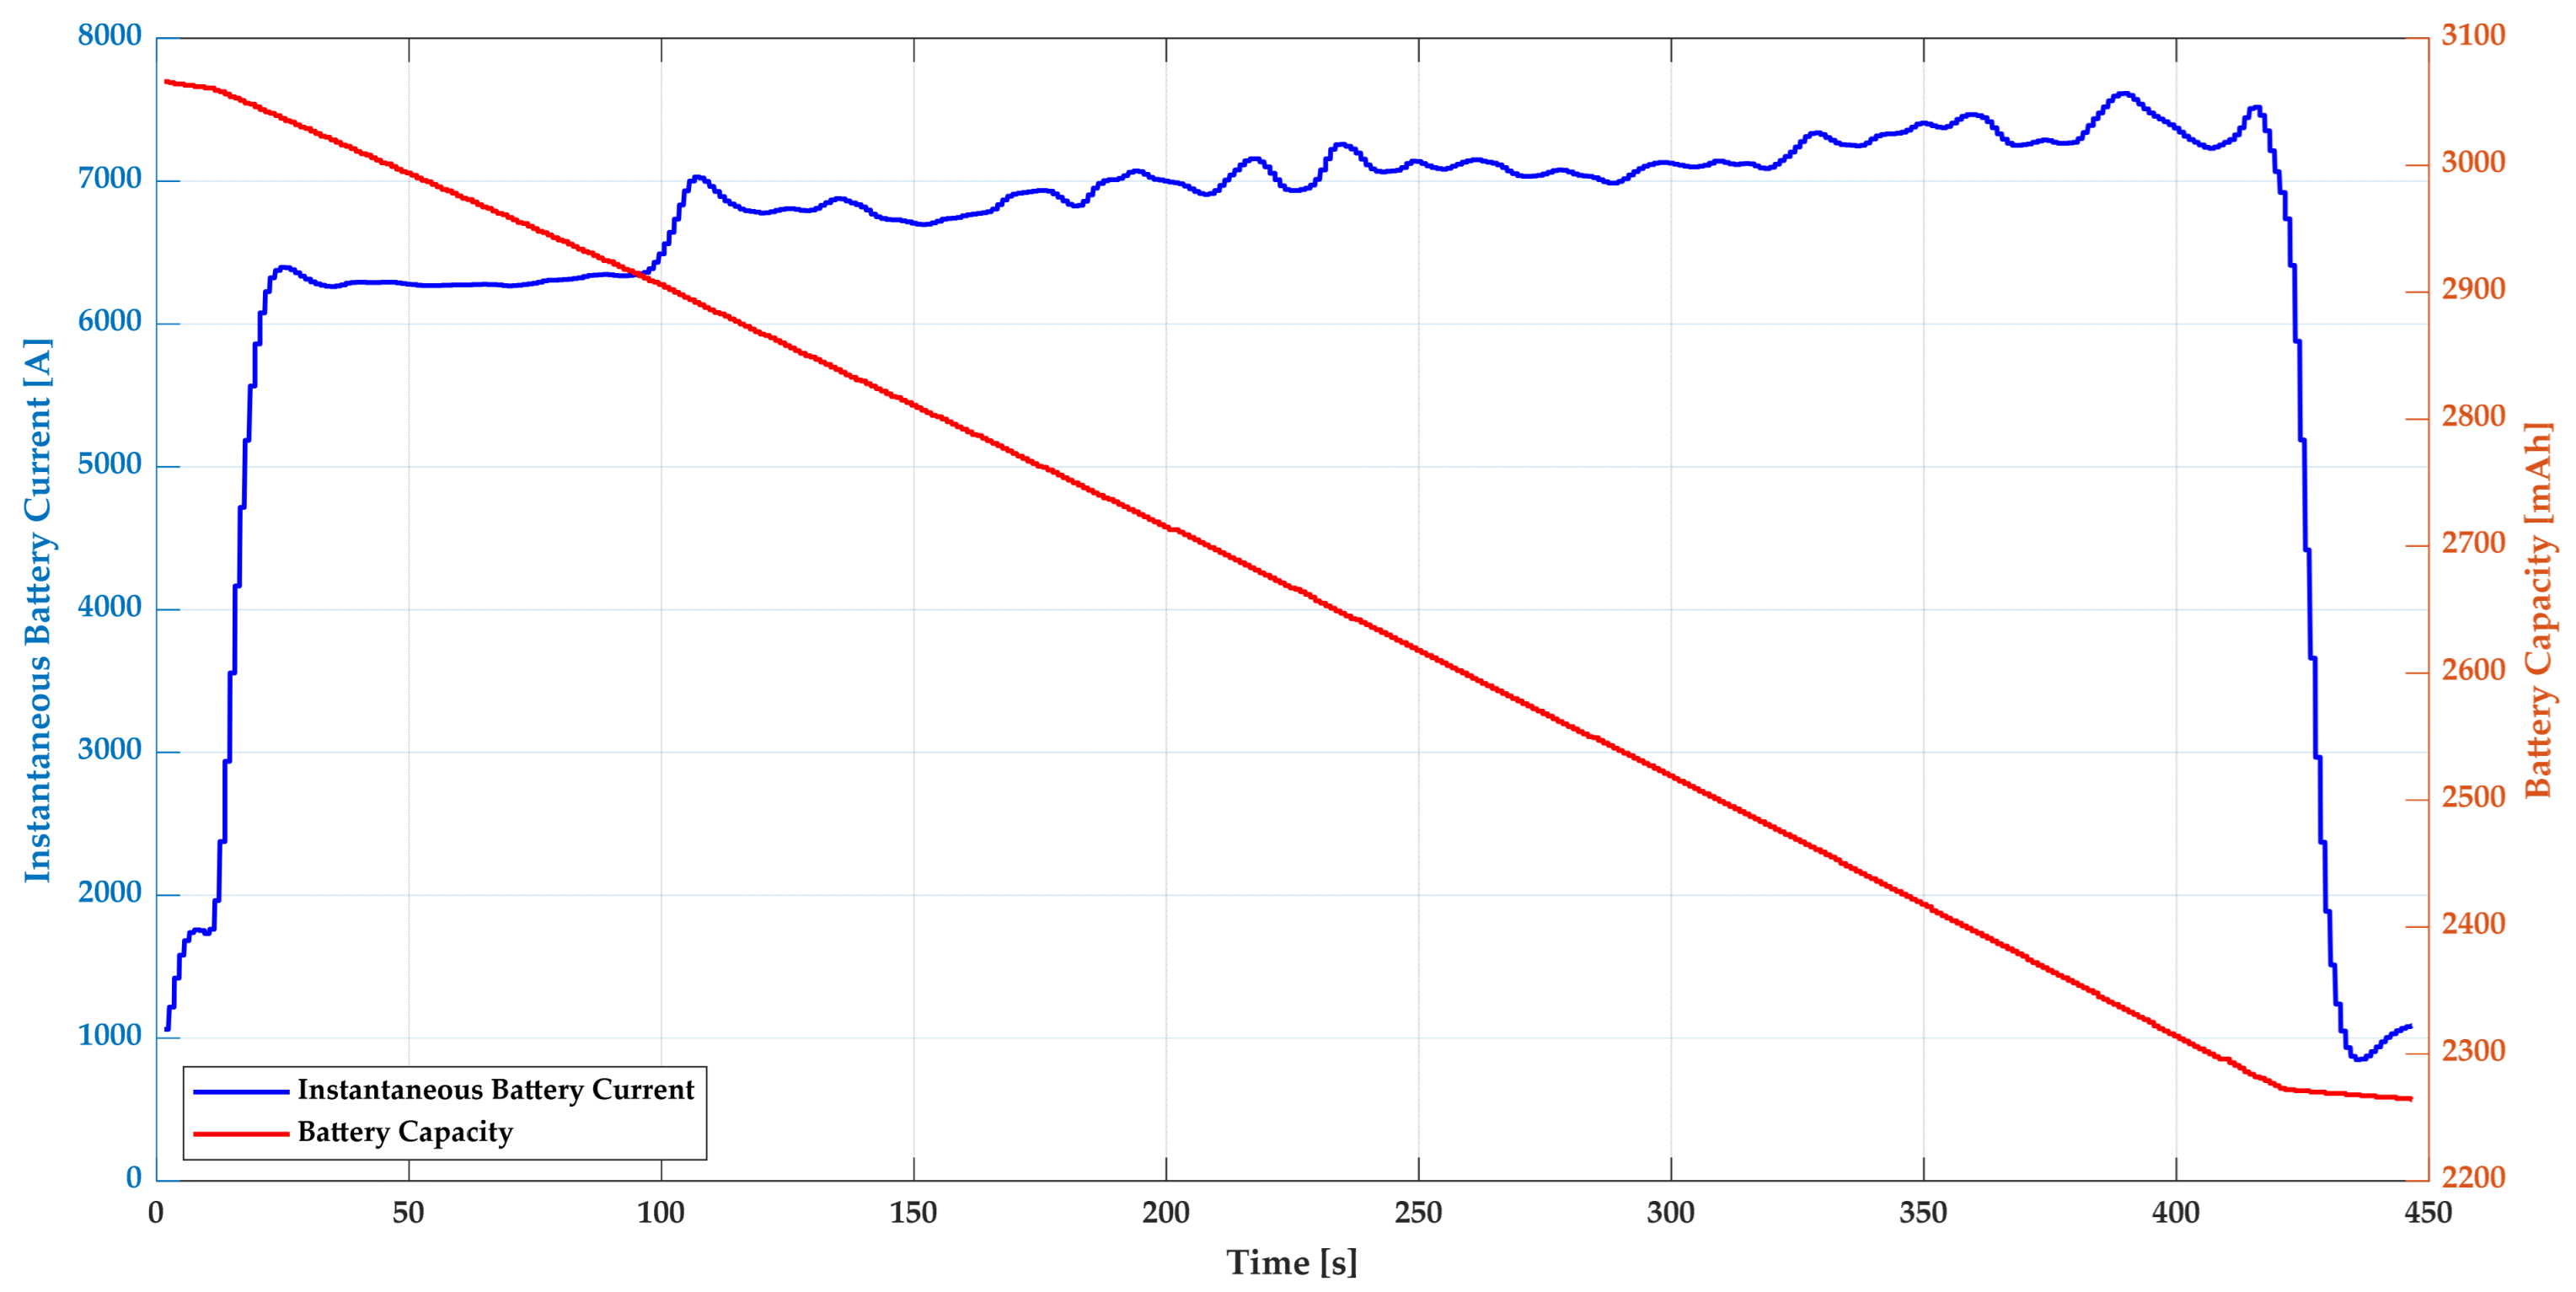
Figure 13 provides a detailed illustration of how the instantaneous current drawn from the battery and battery capacity of the Mavic Air 2 quadcopter changed over time. Initially, it remained relatively stable at a low value; however, due to the impact of icing conditions, the load on the quadcopter increased, leading to a rise in power consumption by the motors. Consequently, it was clearly observed that the instantaneous current drawn from the battery value gradually increased over time.
On the other hand, a significant decrease in battery capacity was observed. Initially calculated to be approximately 3066 mAh, the capacity followed a consistent downward trend and declined to around 2272 mAh. Capacity loss of 794 mAh was calculated. These findings are significant as they demonstrate that the quadcopter consumes more energy under adverse external conditions such as icing, which in turn can lead to a faster-than-expected reduction in its operational duration.
Although a sharp spike in motor current is clearly observed at approximately 100 s due to the sudden aerodynamic load from initial ice accretion (Figure 10), the battery capacity consumption (Figure 13) does not exhibit an instantaneous or sharp decrease at this specific instant. This apparent discrepancy arises from the fundamental nature of battery capacity measurement: the displayed capacity (in mAh) represents the time-integrated (cumulative) current draw, rather than instantaneous current values. Short-duration current surges, even if substantial, contribute minimally to the cumulative battery discharge curve, thus appearing smoothed out when viewed as capacity reduction over time.
In practical terms, a sudden increase in current (such as the spike at 100 s) primarily influences instantaneous battery voltage rather than immediately reducing measurable capacity. Numerous studies on battery behaviour under transient loads confirm that instantaneous current spikes cause temporary voltage dips, but the measurable capacity usage (integration of current over time) remains largely unaffected on a short time scale. For example, Savoye et al. clearly showed that short-term transient current peaks have negligible impact on the cumulative battery discharge curve, and only sustained elevated current levels noticeably accelerate total capacity consumption [39].

3.6. Impact of Glaze Icing Condition on UAV Performance

Glaze ice forms when the local surface heat balance leaves a finite liquid fraction on impact (−5 °C, 1.5 g/m3 LWC). It significantly affects the aerodynamic performance of UAVs. This type of icing forms a thin but dense layer of ice on the UAV’s body and propellers, disrupting airflow and reducing lift capability. Consequently, it leads to undesirable flight performance, battery efficiency, and controllability outcomes. Additionally, certain sensors and propulsion systems are also at risk of freezing, posing further challenges to data accuracy and mission continuity. Therefore, developing preventive strategies against glaze ice formation and accurately analysing existing icing conditions are critical for ensuring safe and efficient flights [36].
Figure 14 illustrates the motor speed graph of the DJI Mavic Air 2 flying under glaze ice conditions. In this icing scenario, it was observed that motor speeds were higher and more variable compared to rime ice conditions—red and green lines exhibited broader oscillations in the range of approximately 6000–8000 RPM. This phenomenon arose from the aerodynamic effects caused by the irregular and rough ice structure formed by glaze ice on the propellers. At t ≈ 100 s, the image-based leading-edge ice thickness at the tip (r/R = 0.75) was ≈ 0.472 mm (Table 3), indicating a thin but dense glaze layer with early runback. Even at this early stage, the irregular tip morphology perturbed the local flow, which is consistent with the broader 6000–8000 RPM oscillation envelope observed in Figure 14 compared with the rime case. Specifically, the needle-like structures form at the propeller tips due to partially frozen water masses flowing over the propellers, leading to increased power consumption and speed variations in the motors.
Figure 15 illustrates the motor voltage graph of the DJI Mavic Air 2 flying under glaze ice conditions. After takeoff, the terminal voltage values of the motors rotating in the CW direction were 12.29 V and 12.25 V for the front-left motor and the rear-right motor, respectively. During the flight, the voltage values decreased. Just before the quadcopter landed, the terminal voltage values of the motors were 11.48 V and 11.41 V for the front-left and rear-right motors, respectively.
Figure 16 illustrates the motor current graph of the DJI Mavic Air 2 flying under glaze ice conditions. Under glaze ice conditions, due to the higher ambient temperature and the incomplete freezing of water, the liquid-phase ice mass remaining on the propeller surface continued to accumulate rapidly, starting from 100 s. During this process, as a result of the rotational motion of the propeller and aerodynamic forces, these semi-melted ice masses were transported from the root region of the propeller towards the blade tip and began to detach and shed from the propeller.
These detached fragments caused significant fluctuations in motor current after 100 s, particularly from 230 s onward, as they continuously altered the mass distribution of the propeller. By t ≈ 230 s, the tip thickness at r/R = 0.75 had increased to ≈0.679 mm (Table 3). The combined effect of roughness growth and intermittent runback produced repeated shedding events, generating large torque transients and the pronounced current fluctuations in Figure 16 together with short-lived RPM surges. The unbalanced ice load on the propeller led to sudden rises and drops in current values, thereby increasing power consumption.
Figure 17 provides a detailed representation of how the instantaneous current drawn from the battery and battery capacity of the Mavic Air 2 quadcopter changed over time. The increase in the instantaneous current drawn from the battery values was directly associated with the ice-shedding phenomenon occurring on the propellers, significantly impacting the system’s performance. Ice shedding disrupted the aerodynamic structure of the propellers, causing the motors to consume more power and consequently draw higher instantaneous current from the battery. This process led to sudden and frequent fluctuations in instantaneous battery current values, thereby reducing the system’s overall efficiency and potentially shortening the battery’s lifespan.
The noticeable decrease in battery capacity was reflected in a steady decline from an initial value of approximately 3158 mAh to around 2206 mAh and battery experienced a significant capacity loss of 952 mAh. Such a rapid and substantial decrease in capacity indicates a considerable drop in the battery’s performance and lifespan, representing a critical factor that could directly affect the device’s operational duration and efficiency.
The intrinsic morphological complexity of glaze ice—together with its more severe aerodynamic disruption and the dynamic instabilities caused by unpredictable ice-shedding events, makes glaze icing the more critical challenge for overall flight performance and safety.

3.7. Comparison of Quadcopter Performance Under Rime Ice and Glaze Ice Conditions

Significant differences were observed in the graphs when comparing the motor speeds of the quadcopter rotating in the CW direction under rime ice and glaze ice conditions, as shown in Figure 10 and Figure 14. In Figure 10, under rime ice conditions, motor speeds remained at lower levels (approximately 6400–7100 rpm for the front-left motor and around 5400–6300 rpm for the rear-right motor). In contrast, in Figure 14, motor speeds were higher under glaze ice conditions, ranging approximately between 7000–8200 rpm for the front-left motor and 6300–7100 rpm for the rear-right motor. The higher motor speeds under glaze ice conditions were attributed to the denser nature of this type of ice and its tendency to generate greater resistance on aerodynamic surfaces, necessitating increased power output from the motors. During ice-shedding events, motors may increase or decrease their speeds abruptly to adapt to sudden changes, which explains the irregular fluctuations observed in Figure 14.
Under rime ice conditions, abnormal mass distribution on the propeller is less pronounced, minimising off-center weight. As a result, vibration levels on the propeller generally remain lower, allowing the motor to maintain a more stable speed without being subjected to sudden high loads. Consequently, excessive imbalances on the propeller surface do not occur. These factors contribute to maintaining lower motor speeds and manageable vibration levels.
The experimental data revealed distinct electrical characteristics under different icing conditions. During rime ice accretion (Figure 11), voltage measurements showed drops of 0.59 V in the front-left motor and 0.62 V in the rear-right motor. These losses intensified under glaze ice conditions (Figure 15), with voltage reductions reaching 0.81 V and 0.84 V for the respective motors. The analysis revealed that motor current exhibited markedly higher amplitude oscillations under glaze ice conditions (Figure 12) than under rime ice conditions (Figure 16), with this effect being particularly pronounced during the initial takeoff phase. This increased current variability suggests motors actively compensate for ice-induced aerodynamic penalties by drawing additional power to maintain required thrust levels.
The extent of battery capacity loss at low temperatures varies depending on the type of ice formed and how the motors cope with icing conditions. An analysis of Figure 13 and Figure 17 revealed that at −10 °C and LWC 0.5 g/m3, a battery capacity drop from 3066 mAh to 2272 mAh (a loss of 794 mAh) occurred. At −5 °C and LWC 1.5 g/m3, however, the battery capacity decreased from 3158 mAh to 2206 mAh (a loss of 952 mAh), indicating a larger reduction. This suggests that at −5 °C, glaze ice creates a more complex and aerodynamically unfavourable structure on propeller surfaces compared to rime ice at −10 °C. Consequently, motors consumed more power, current levels rose to higher values, and battery performance deteriorated more rapidly.
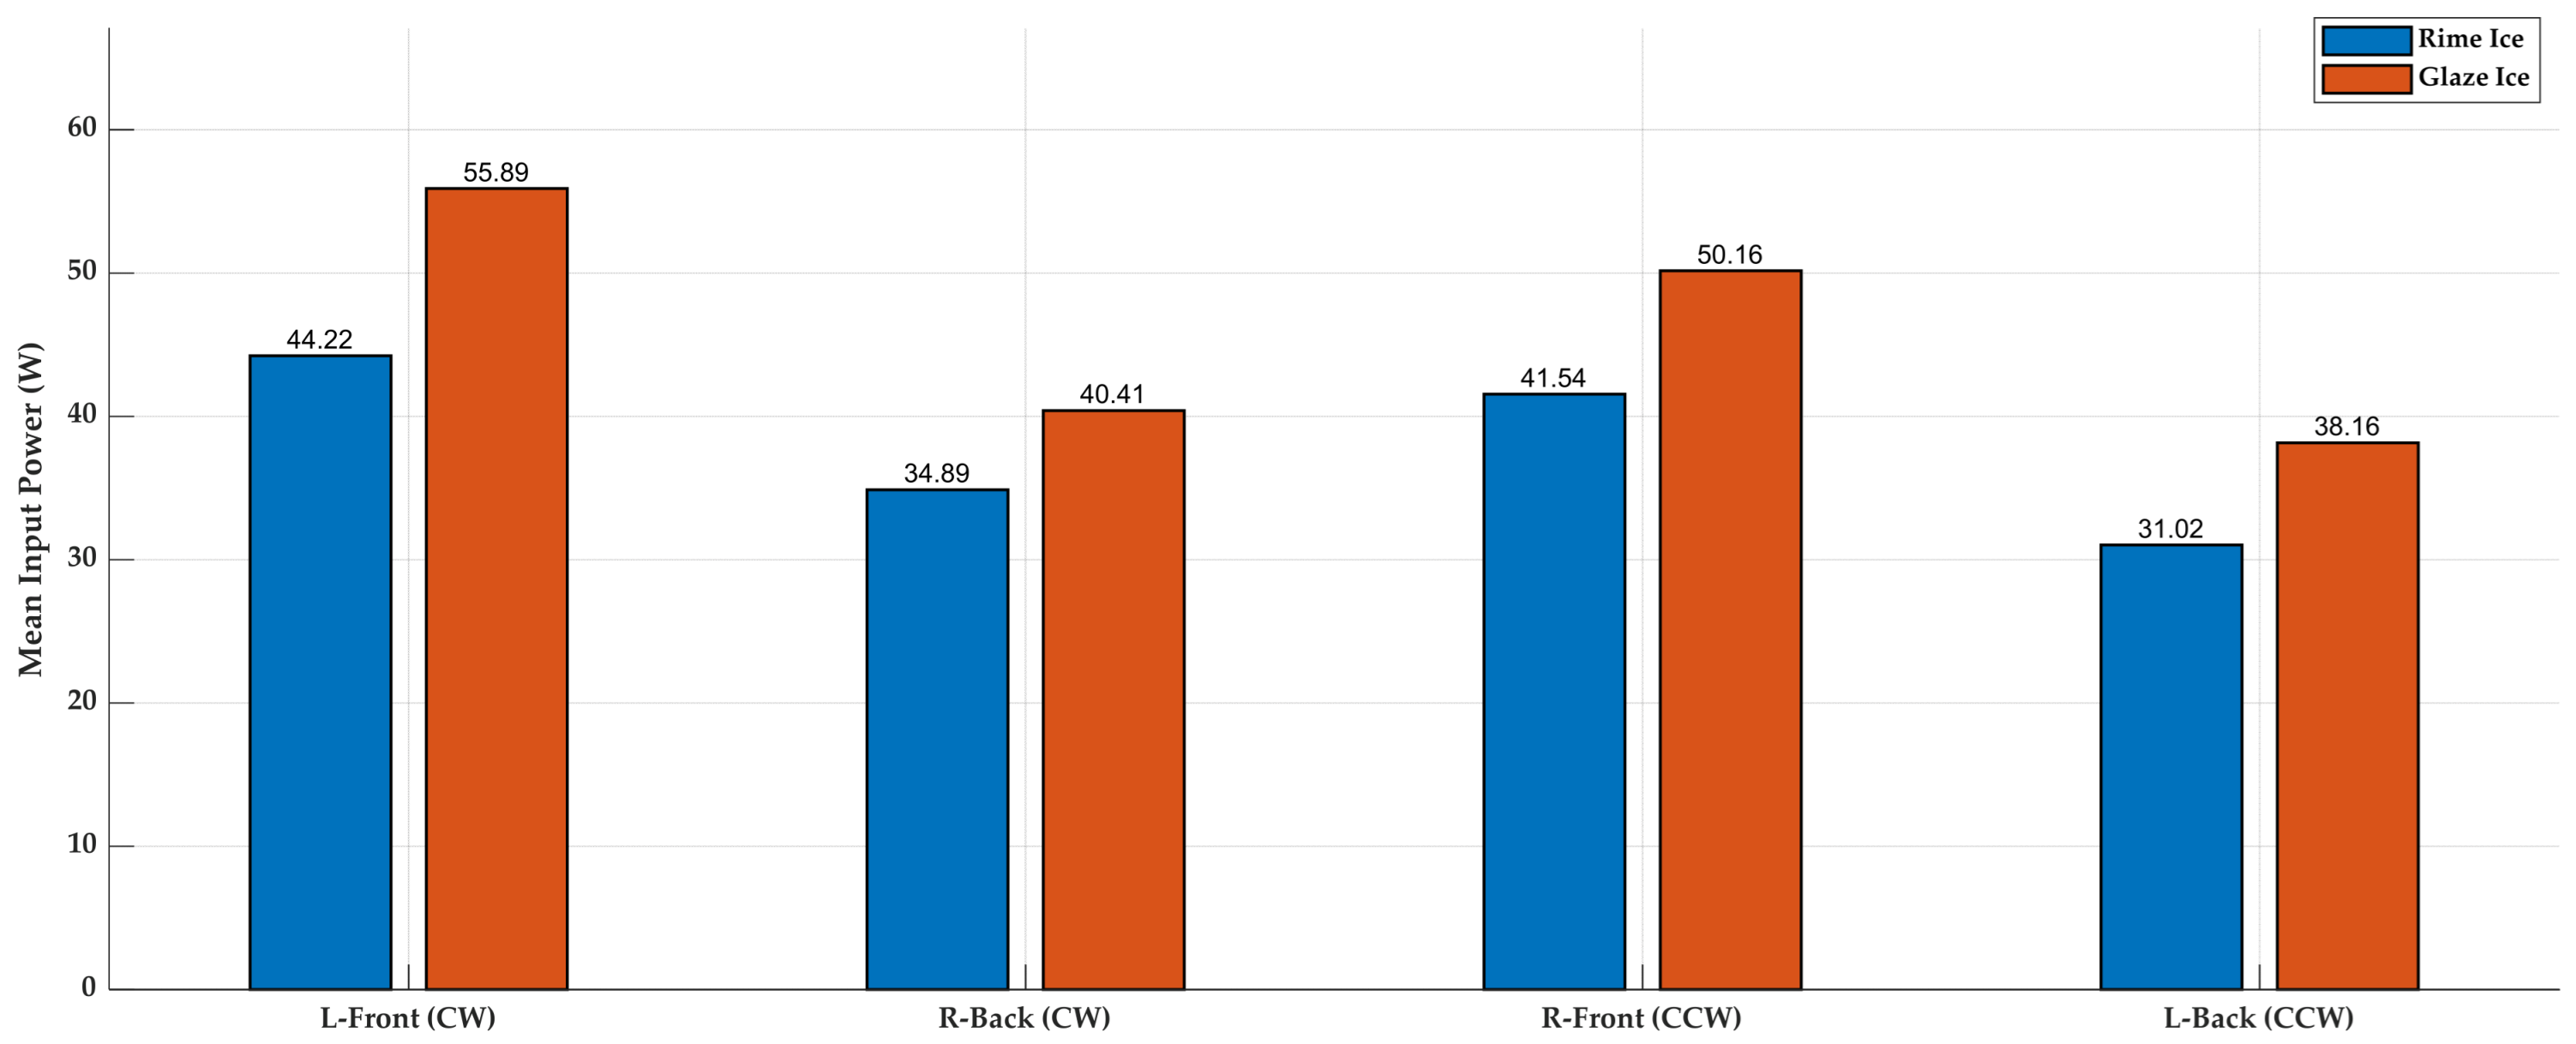
Figure 18 and Figure 19 illustrate the input power values of motors rotating CW under rime ice and glaze ice conditions. The motor power graphs for both icing conditions closely resemble the motor speed graphs in form, as the power input to the motor naturally increases with rising motor speed. As shown in Figure 18, under rime ice conditions, the motor input power initially exhibited short-term fluctuations but stabilised relatively over time, remaining within a certain range. The front-left motor’s input power was higher than the rear-right motor, although the power fluctuations were largely maintained at a controllable level. In contrast, as depicted in Figure 19, the motor input power reached higher levels under glaze ice conditions, showed an increasing trend over time, and experienced significant fluctuations in power consumption due to irregular ice accretion. Quantitatively, averaged over the icing interval, the electrical input power under glaze was higher than under rime by 26.4% for the front-left motor (55.89 vs. 44.22 W) and by 15.8% for the rear-right motor (40.41 vs. 34.89 W). Notably, sudden surges in the power of the front-left motor were observed, while fluctuations in the rear-right motor’s input power also increased, clearly demonstrating the adverse effects of glaze ice conditions on motor performance. By the end of the ~430 s exposure, the accumulated ice reached several millimeters (rime tip ≈ 2.799 mm; glaze tip ≈ 1.681 mm; see Table 3), and this heavy, tip-biased accretion caused severe performance degradation—loss of stability and elevated power demand.
Despite differences in ice types, the required power input increased due to ice accretion on the propeller blades. In propellers operating under glaze ice conditions, higher power consumption was observed compared to rime ice conditions due to aerodynamic losses caused by irregular and complex ice structures.
Bars compared rime and glaze for each rotor; labels indicated the means. Under the forward-spray configuration, the CW rotors (Lfront, Rback) experienced the highest droplet impingement and therefore drew more power than the CCW pair in both regimes. Glaze ice produced a larger penalty than rime ice for all rotors. The power demand did not remain constant; it fluctuated over a wide range as the flight controller applied continuous yaw/pitch/roll corrections to maintain stability. Despite this dynamic behavior, the Lfront motor maintained a consistently higher power baseline than the Rback.
To capture the vehicle-level impact, a holistic analysis was performed rather than focusing solely on the CW motors. Accordingly, the power data of the CCW motors were also included. Comparing the mean power of all four motors in this bar chart (see also Figure 20) revealed the full picture of the asymmetric load distribution caused by icing. Because the controller continually redistributed thrust, per-motor power did not map one-to-one to local accretion; therefore, pair-averaged (CW vs. CCW) and total power were used as the most faithful indicators of the icing penalty. Image-based thickness series were acquired for the CW blades; for the CCW blades, power data were reported to make the CW–CCW asymmetry explicit. These additions do not alter the manuscript’s main conclusions, which are based on the CW measurements.
Motor-level changes in power and current for the rime–glaze comparison are summarized in Table 4. The experimental results indicate that, under glaze conditions, the power consumption of the Lfront motor increased by 26.4% (44.22 → 55.89 W), whereas that of the Rback motor increased by 15.8% (34.89 → 40.41 W). At the vehicle level, the battery capacity loss was 794 mAh under rime and 952 mAh under glaze.
All quantities are time-averaged; because start and end values differ and the time histories exhibit pronounced oscillations and spikes, instantaneous end-point differences need not coincide exactly with the mean-based Δ values. Nevertheless, the table confirms the glaze > rime trend at the motor level and is consistent with the vehicle-level capacity consumption (Figure 21).
Figure 21 illustrates the normalized discharge profiles of the battery capacity under glaze ice (−5 °C) and rime ice (−10 °C) conditions. To facilitate a direct comparison between the two scenarios, the state of charge (SOC) was scaled such that both curves start from 100%. This approach eliminates the graphical overlap issue that may arise from different initial battery levels and enables a clearer interpretation of how each icing type affects energy consumption dynamics over time. As the experiment progressed, the SOC curve for glaze ice began to exhibit a steeper decline relative to rime ice. The more pronounced drop during the mid to late stages of flight suggests that glaze ice, despite its milder start, eventually leads to greater aerodynamic imbalance and drag due to the irregular growth of asymmetric ice formations. These formations increase torque demand on the motors, which in turn elevates current draw and accelerates battery depletion. The battery under glaze ice conditions dropped to 69.85%, while the battery subjected to rime ice retained 74.10% of its initial capacity.
These findings emphasize that not only the presence of ice but also the specific type of ice formation has a significant impact on UAV energy efficiency. Incorporating ice-type awareness into real-time flight management systems could improve endurance estimation, especially for missions in cold and humid environments. The contrasting energy consumption behaviors observed here demonstrate the importance of considering ice morphology in UAV performance modeling and control strategies.
To enable a consistent comparison between the rime and glaze icing scenarios, the battery capacity data were normalized and expressed in terms of State of Charge (SOC, %), allowing for a clear interpretation of battery depletion trends despite differing initial values. However, electrical parameters such as current, voltage, and power have been presented in their actual physical units (A, V, W), following standard practices in UAV icing studies. Maintaining these parameters in their original form preserves the physical interpretability of transient electrical responses. Normalizing such variables could obscure the dynamic impacts of ice accretion on motor performance, especially under varying aerodynamic loads and control inputs. Therefore, to retain engineering relevance and ensure transparency in performance degradation analysis, only SOC was normalized in the comparative plots.

4. Conclusions

This study examined in detail the effects of icing on a full-vehicle multirotor UAV propellers on motor input power requirements and flight performance. Experimental studies were conducted under two icing scenarios—rime ice and glaze ice—analysing motor power consumption, speed variations, battery capacity loss, and overall flight dynamics in both conditions. Under rime ice conditions, supercooled water droplets instantly froze, forming an opaque, homogeneous ice layer on the propeller surface. During the initial 100 s, the motor’s speed remained nearly unchanged owing to the increase in the propeller blade’s chord length. This situation counterbalanced the ice accumulation, maintaining stable rotational performance. However, as time progressed, the accumulated ice increased along with the formation of asymmetric icicles, requiring the motor to generate higher torque and increasing power input demands. Slight RPM fluctuations were observed, but motor stability was partially maintained. Under glaze ice conditions, compared to rime ice conditions, higher temperatures and LWC caused droplets to spread across the propeller surface before freezing, resulting in irregular ice formations. From the initial moment of the experiment, these structures exhibited unfavourable aerodynamics, with complex ice accumulations at propeller edges. This led to abrupt motor speed fluctuations and higher power consumption.
The non-dimensional accumulation parameter Ac (approximately a 3:1 ratio) confirmed that the glaze runs received roughly triple the delivered liquid water relative to rime. Nevertheless, the performance gap cannot be attributed to water loading alone; the dominant discriminator is the ensuing ice morphology, with LWC acting mainly as a scaling factor for accumulated mass. Asymmetric impingement in the forward-spray configuration further led to clockwise–counter-clockwise load imbalance; the flight controller continuously redistributed thrust to preserve attitude. Hence, pair-averaged (CW vs. CCW) and total-power measures were adopted as faithful indicators of the icing penalty, while motor-by-motor comparisons were interpreted in the context of this active redistribution.
At the system level, the flight controller maintained stable hover despite significant accretion. This apparent robustness was achieved by commanding higher torque, which raised current draw and deepened voltage sag—particularly under glaze—so endurance deteriorated faster even when attitude remained stable. This finding emphasizes that icing in multirotors can degrade performance stealthily through elevated electrical demand before overt loss of controllability is observed.
Comparative analyses revealed that both ice types increased energy use, but glaze ice caused more pronounced power requirements due to irregular ice shedding, forcing motors to draw higher currents. Quantitatively, the mean input power under glaze was higher by 26.4% for the front-left motor and by 15.8% for the rear-right motor. Battery capacity loss reached 794 mAh under rime ice and 952 mAh under glaze ice conditions, indicating greater resistance from glaze ice. Motor voltage declined in both cases, with sharper drops under glaze ice. Current surges and fluctuations were more pronounced under glaze ice conditions due to needle-like irregular ice formations. Rime ice maintained predictable propeller dynamics, while glaze ice’s rough structures disrupted balance. Tests used a DJI Mavic Air 2 with original configurations to simulate real-flight conditions. These findings provide critical data for understanding UAV performance losses in icing environments and inform future anti/de-icing technology development.
In summary, these results establish that glaze ice imposes larger and faster-growing energetic penalties than rime ice under otherwise comparable conditions, primarily because of the morphology of the accreted ice rather than water loading alone; the consolidated, time-averaged metrics (V, I, P), together with the vehicle-level capacity loss, provide a compact, reproducible basis for benchmarking icing susceptibility and guiding mitigation strategies. These conclusions should be interpreted in light of the experimental scope and limitations outlined below.
These results were obtained in a controlled cold room with a uniform crossflow and a forward-spray configuration, and under flight condition (hover at 1 m). Aerodynamic penalties were inferred from electrical telemetry (V, I, P and capacity loss) rather than direct force/torque sensing; ice mass was quantified geometrically from images rather than gravimetrically; and in situ droplet sizing/temperature within the rotor plane were not instrumented. Accordingly, quantitative magnitudes should be interpreted within these boundary conditions, whereas the qualitative ranking (glaze > rime) and the morphology-based mechanism are expected to generalize. Future work will incorporate direct force/torque sensing, gravimetric ice capture, and in situ cloud characterization to validate and extend these findings.
Despite these limitations, this study makes a substantial contribution to icing-mitigation strategies by providing a unique, high-fidelity dataset on a complete, unmodified commercial UAV—bridging the gap between isolated component tests and field trials. The findings supply critical data for understanding UAV performance losses in icing environments and establish a foundation for future anti-/de-icing technology development. In particular, the clear demonstration of the severe performance degradation caused by glaze icing indicates that operational risks under such conditions must be reassessed and highlights an urgent need for ice-aware, intelligent detection and control systems.

Author Contributions

Conceptualization, H.E. and A.D.; methodology, A.D.; validation, H.E. and A.D.; investigation, H.E. and A.D.; resources, A.D.; data curation, H.E. and A.D.; writing—original draft preparation, H.E. and A.D.; writing—review and editing, A.D.; visualization, A.D.; supervision, H.E. All authors have read and agreed to the published version of the manuscript.

Funding

This research received no external funding.

Data Availability Statement

Data set may be shared with qualified academic researchers for collaborative purposes, subject to approval by the corresponding author and compliance with institutional data sharing agreements.

Conflicts of Interest

The authors declare no conflicts of interest.

Abbreviations

The following abbreviations are used in this manuscript:
UAVUnmanned Aerial Vehicle
LWCLiquid Water Content
MVDMedian Volume Diameter
RPMRevolution per Minute
DIPDigital Image Projection
IMUInertial Measurement Unit
GPSGlobal Positioning System
GNSSGlobal Navigation Satellite System
APASAdvanced Pilot Assistance System
VPSVision Positioning System
CWClockwise
CCWCounterclockwise
PWMPulse Width Modulation
ESCElectronic Speed Controller
BLDCBrushless Direct Current Motor
SOCState of Charge

References

  1. Han, N.; Hu, H.; Hu, H. An experimental investigation on the dynamic ice accretion process over the blade surface of a rotating UAV propeller. In Proceedings of the AIAA Scitech 2022 Forum, San Diego, CA, USA, 3–7 January 2022. [Google Scholar]
  2. González-Jorge, H.; Martínez-Sánchez, J.; Bueno, M.; Arias, P. Unmanned aerial systems for civil applications: A review. Drones 2017, 1, 2. [Google Scholar] [CrossRef]
  3. Gao, M.; Hugenholtz, C.H.; Fox, T.A.; Kucharczyk, M.; Barchyn, T.E.; Nesbit, P.R. Weather constraints on global drone flyability. Sci. Rep. 2021, 11, 12092. [Google Scholar] [CrossRef] [PubMed]
  4. Shakhatreh, H.; Sawalmeh, A.H.; Al-Fuqaha, A.; Dou, Z.; Almaita, E.; Khalil, I.; Othman, N.S.; Khreishah, A.; Guizani, M. Unmanned aerial vehicles (UAVs): A survey on civil applications and key research challenges. IEEE Access 2019, 7, 48572–48634. [Google Scholar] [CrossRef]
  5. Müller, N.C.; Hann, R. UAV Icing: 3D Simulations of Propeller Icing Effects and Anti-Icing Heat Loads; SAE Technical Paper 2023-01-1383; SAE International: Warrendale, PA, USA, 2023. [Google Scholar]
  6. Szilder, K.; Yuan, W. In-flight icing on unmanned aerial vehicle and its aerodynamic penalties. Prog. Flight Phys. 2017, 9, 173–188. [Google Scholar]
  7. Müller, N.C.; Løw-Hansen, B.; Borup, K.T.; Hann, R. UAV icing: Development of an ice protection system for the propeller of a small UAV. Cold Reg. Sci. and Technol. 2023, 213, 103938. [Google Scholar] [CrossRef]
  8. Manaf, M.; Dhulipalla, A.; Sista, H.; Khawaja, H.; Virk, M.; Hu, H. An experimental investigation of transient ice accretion process on a high-lift airfoil model for UAV applications. Exp. Therm. Fluid Sci. 2025, 171, 111612. [Google Scholar] [CrossRef]
  9. Liu, Y.; Li, L.; Ning, Z.; Tian, W.; Hu, H. Experimental investigation on the dynamic icing process over a rotating propeller model. J. Propuls. Power 2018, 34, 933–946. [Google Scholar] [CrossRef]
  10. Liu, Y.; Li, L.; Li, H.; Hu, H. An experimental study of surface wettability effects on dynamic ice accretion process over a UAS propeller model. Aerosp. Sci. Technol. 2018, 73, 164–172. [Google Scholar] [CrossRef]
  11. Han, N.; Hu, H.; Hu, H. An experimental investigation to assess the effectiveness of various anti-icing coatings for UAV propeller icing mitigation. In Proceedings of the AIAA Aviation 2022 Forum, Chicago, IL, USA, 27 June–1 July 2022. [Google Scholar]
  12. Dhulipalla, A.; Han, N.; Hu, H.; Hu, H. A Comparative Study to Characterize the Effects of Adverse Weathers on the Flight Performance of an Unmanned-Aerial-System. In Proceedings of the AIAA Aviation 2022 Forum, Chicago, IL, USA, 27 June–1 July 2022. [Google Scholar]
  13. Dhulipalla, A.; Han, N.; Hu, H.; Hu, H. An experimental study to characterize the effects of ice accretion on the performance of a UAV propeller. In Proceedings of the AIAA Aviation 2023 Forum, San Diego, CA, USA, 12–16 June 2023. [Google Scholar]
  14. Miller, A.J.; Fuchs, C.; Omanovic, N.; Ramelli, F.; Seifert, P.; Spirig, R.; Zhang, H.; Fons, E.; Lohmann, U.; Henneberger, J. Multirotor UAV icing correlated to liquid water content measurements in natural supercooled clouds. Cold Reg. Sci. Technol. 2024, 225, 104262. [Google Scholar] [CrossRef]
  15. Harvey, D.; Villeneuve, E.; Béland, M.; Lapalme, M. Wind tunnel investigation of the icing of a drone rotor in forward flight. Drones 2024, 8, 380. [Google Scholar] [CrossRef]
  16. Suurnäkki, P.; Tiihonen, M.; Jokela, T. UAV icing: Low Reynolds number drone propeller performance during dynamic icing process. In Proceedings of the AIAA Aviation 2021 Forum, Virtual Event, USA, 2–6 August 2021. [Google Scholar]
  17. Kozomara, D.; Neubauer, T.; Puffing, R.; Bednar, I.; Breitfuss, W. Experimental investigation on the effects of icing on multicopter UAS operation. In Proceedings of the AIAA Aviation 2021 Forum, Virtual Event, USA, 2–6 August 2021. [Google Scholar]
  18. Kozomara, D.; Neubauer, T.; Puffing, R. Experimental investigation of a quadcopter UAS with a fluid-based de-icing system in Appendix C icing conditions. In Proceedings of the AIAA Aviation Forum and Ascent 2024 Forum, Las Vegas, NV, USA, 29 July–2 August 2024. [Google Scholar]
  19. Neubauer, T.; Oztekin, E.S. Characterization of propeller icing from 3D laser scan data. In Proceedings of the AIAA Aviation Forum and Ascent 2024 Forum, Las Vegas, NV, USA, 29 July–2 August 2024. [Google Scholar]
  20. Müller, N.C.; Hann, R. UAV Icing: A Performance model for a UAV propeller in icing conditions. In Proceedings of the AIAA Aviation 2022 Forum, Chicago, IL, USA, 27 June–1 July 2022. [Google Scholar]
  21. Samad, A.; Dhulipalla, A.; Hu, H. A hybrid anti-/de-icing strategy for UAV propeller icing protection. In Proceedings of the AIAA Aviation Forum and Ascent 2024 Forum, Las Vegas, NV, USA, 29 July–2 August 2024. [Google Scholar]
  22. Tu, J.; Tian, W.; Wang, X.; Tian, L. Experimental study on the effects of substrate hydro-/icephobicity on ice mitigation and ice shedding during the dynamic icing process over the rotating propeller of an unmanned-aerial-vehicle. Aerosp. Sci. Technol. 2024, 155, 109610. [Google Scholar] [CrossRef]
  23. Rotondo, D.; Cristofaro, A.; Johansen, T.A.; Nejjari, F.; Puig, V. Diagnosis of icing and actuator faults in UAVs using LPV unknown input observers. J. Intell. Robot. Syst. 2018, 91, 651–665. [Google Scholar] [CrossRef]
  24. López-Estrada, F.R.; Theilliol, D.; Astorga-Zaragoza, C.M.; Ponsart, J.C.; Valencia-Palomo, G.; Camas-Anzueto, J. Fault diagnosis observer for descriptor Takagi–Sugeno systems. Neurocomputing 2019, 331, 10–17. [Google Scholar] [CrossRef]
  25. DJI Mavic Air 2 User Manual v1.4: Technical Specifications; SZ DJI Technology Co., Ltd.: Shenzhen, China, 2020; Available online: https://dl.djicdn.com/downloads/Mavic_Air_2/Mavic_Air_2_User_Manual_v1.4_en.pdf (accessed on 21 October 2025).
  26. Frey, M.; Müller, N.C.; Wallisch, J.; Hann, R. UAV Icing: Experimental investigation and numerical CHT simulations of a propeller ice protection system. In Proceedings of the AIAA Scitech 2024 Forum, Orlando, FL, USA, 8–12 January 2024. [Google Scholar]
  27. Karpen, N.; Diebald, S.; Dezitter, F.; Bonaccurso, E. Propeller-integrated airfoil heater system for small multirotor drones in icing environments: Anti-icing feasibility study. Cold Reg. Sci. Technol. 2022, 201, 103616. [Google Scholar] [CrossRef]
  28. Løw-Hansen, B.; Müller, N.; Coates, E.; Johansen, T.; Borup, K.T. Identification of an Electric UAV Propulsion System in Icing Conditions; SAE Technical Paper 2023-01-1378; SAE International: Warrendale, PA, USA, 2023. [Google Scholar]
  29. Hunt, B.; Rawlins, C.; Hill, B. An analysis of blade deicing techniques for Multi-Rotor UAV propellers. In Proceedings of the IEEE Aerospace Conference, Big Sky, MT, USA, 6–13 March 2021. [Google Scholar]
  30. Muhammed, M.; Virk, M.S. Ice accretion on rotary-wing unmanned aerial vehicles—A review study. Aerospace 2023, 10, 261. [Google Scholar] [CrossRef]
  31. Hann, R.; Müller, N.C.; Wallisch, J. UAV icing: Impact testing of ice fragments on a propeller. In Proceedings of the AIAA Aviation Forum and Ascent 2024 Forum, Las Vegas, NV, USA, 29 July–2 August 2024. [Google Scholar]
  32. Incropera, F.P.; DeWitt, D.P.; Bergman, T.L.; Lavine, A.S. Fundamentals of Heat and Mass Transfer, 6th ed.; John Wiley & Sons: Hoboken, NJ, USA, 2007. [Google Scholar]
  33. Anderson, D.N.; Tsao, J.-C. Overview of Icing Physics Relevant to Scaling. In Proceedings of the FAA In-Flight Icing/Ground De-Icing International Conference, Chicago, IL, USA, 16–20 June 2003. [Google Scholar]
  34. Veerakumar, R.; Tian, L.; Hu, H.; Liu, Y.; Hu, H. An experimental study of dynamic icing process on an Aluminum-Conductor-Steel-Reinforced power cable with twisted outer strands. Exp. Therm. Fluid Sci. 2022, 142, 110823. [Google Scholar] [CrossRef]
  35. Palacios, J.L.; Han, Y.; Brouwers, E.W.; Smith, E.C. Icing environment rotor test stand liquid water content measurement procedures and ice shape correlation. J. Am. Helicopter Soc. 2012, 57, 29–40. [Google Scholar] [CrossRef]
  36. Samad, A.; Dhulipalla, A.; Hu, H. Comparative Study of Various Strategies for Multirotor UAV Propeller Icing Mitigation. AIAA J. 2025, 63, 2892–2907. [Google Scholar] [CrossRef]
  37. Samad, A.; Dhulipalla, A.; Bowers, K.; Rodriguez, J.; Hu, H. An Experimental Investigation of the Dynamic Icing Process on a Multirotor UAV Rotor in Forward Flight. In Proceedings of the AIAA Scitech 2024 Forum, Orlando, FL, USA, 8–12 January 2024. [Google Scholar]
  38. Bragg, M.B.; Broeren, A.P.; Blumenthal, L.A. Iced-airfoil aerodynamics. Prog. Aerosp. Sci. 2005, 41, 323–362. [Google Scholar] [CrossRef]
  39. Savoye, F.; Venet, P.; Millet, M.; Groot, J. Impact of Periodic Current Pulses on Li-Ion Battery Performance. IEEE Trans. Ind. Electron. 2012, 59, 3481–3488. [Google Scholar] [CrossRef]
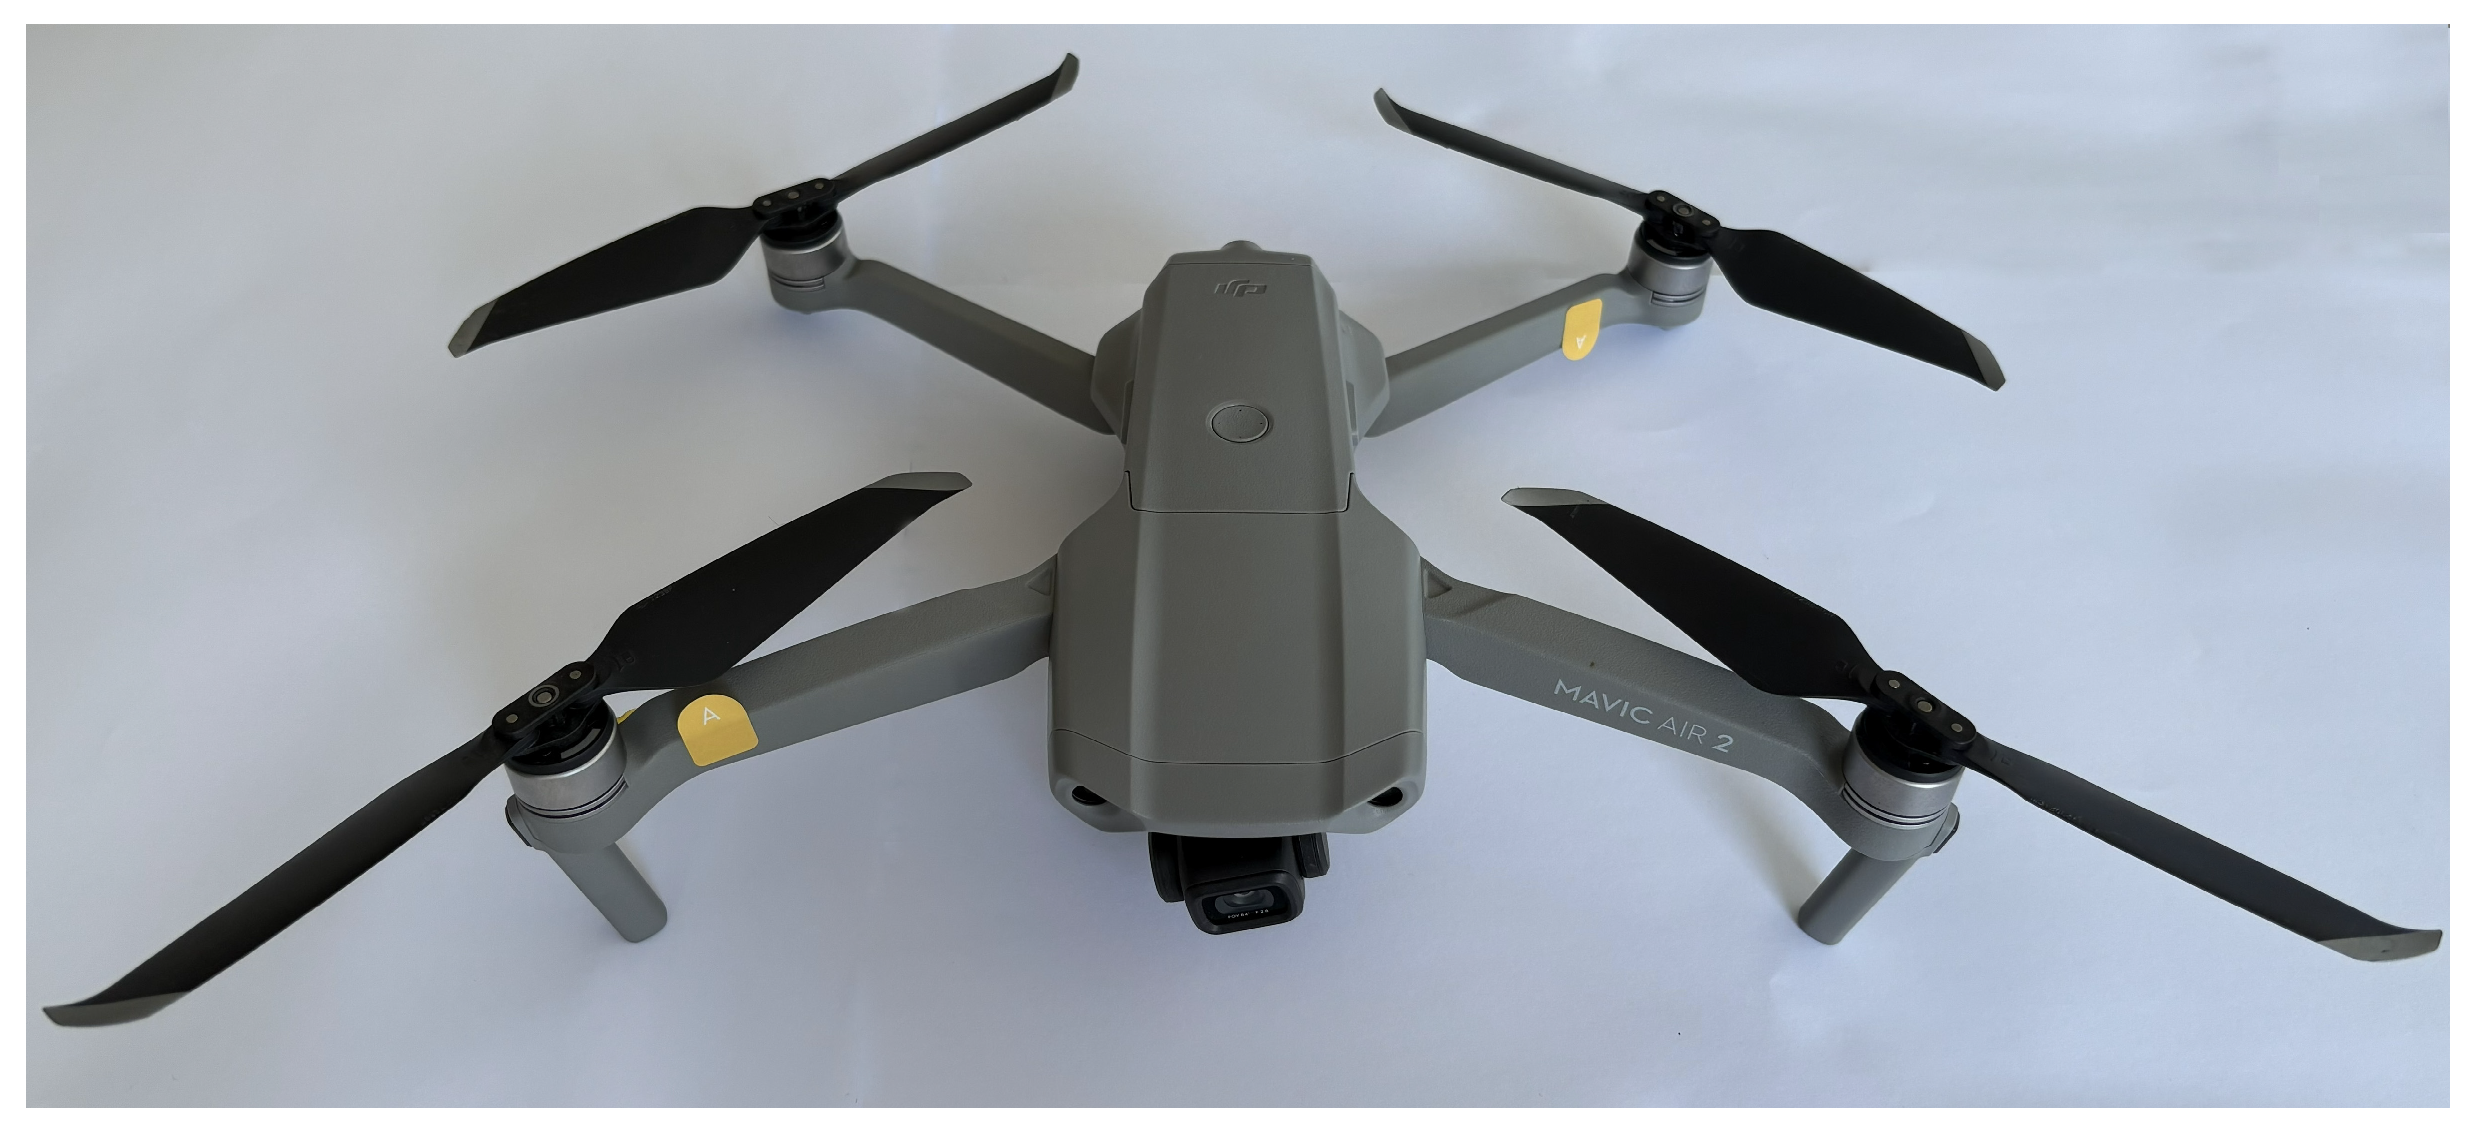
Figure 1. DJI Mavic Air 2.
Drones 09 00729 g001
Figure 2. 7238F propeller.
Drones 09 00729 g002
Figure 3. Experiment setup of ice accretion investigation.
Drones 09 00729 g003
Figure 4. Schematic illustration of the experimental spray configuration and the resulting impingement asymmetry on a quadcopter.
Drones 09 00729 g004
Figure 5. (a) Ice formation on the suction side of the leading edge at 100 s (rime ice case). (b) 230 s (rime ice case). (c) Ice formation on the suction side of the leading edge at 420 s (rime ice case). (d) Ice formation on the pressure side of the leading edge at 428 s (rime ice case).
Drones 09 00729 g005
Figure 6. (a) Ice formation on the suction side of the leading edge at 100 s (glaze ice case). (b) Ice formation on the suction side of the leading edge at 230 s (glaze ice case). (c) Ice formation on the suction side of the leading edge at 430 s (glaze ice case). (d) Ice formation on the pressure side of the leading edge at 435 s (glaze ice case).
Drones 09 00729 g006
Figure 7. CW blades—image-based leading-edge ice thickness at three spanwise locations (r/R = 0.25, 0.50, 0.75) for rime and glaze.
Drones 09 00729 g007
Figure 8. Pitch (red) and roll (blue) angles during the rime ice conditions.
Drones 09 00729 g008
Figure 9. Pitch (red) and roll (blue) angles during the glaze ice conditions.
Drones 09 00729 g009
Figure 10. Motor speed values for rime ice condition.
Drones 09 00729 g010
Figure 11. Motor voltage values for rime ice condition.
Drones 09 00729 g011
Figure 12. Motor current values for rime ice condition.
Drones 09 00729 g012
Figure 13. Instantaneous battery current and battery capacity values for rime ice condition.
Drones 09 00729 g013
Figure 14. Motor speed values for glaze ice condition.
Drones 09 00729 g014
Figure 15. Motor voltage values for glaze ice condition.
Drones 09 00729 g015
Figure 16. Motor current values for glaze ice condition.
Drones 09 00729 g016
Figure 17. Instantaneous battery current and battery capacity values for glaze ice condition.
Drones 09 00729 g017
Figure 18. Motor input power values for rime ice condition.
Drones 09 00729 g018
Figure 19. Motor input power values for glaze ice condition.
Drones 09 00729 g019
Figure 20. Per-rotor mean electrical input power during rime and glaze icing.
Drones 09 00729 g020
Figure 21. Normalized battery discharge under icing conditions.
Drones 09 00729 g021
Table 1. Technical specifications of DJI Mavic Air 2 [25].
ParameterValue
Dimensions (Folded)180 × 97 × 84 mm
Dimensions (Unfolded)183 × 253 × 77 mm
Weight570 g
Max. speed19 m/s (S Mode), 12 m/s (N Mode), 5 m/s (T Mode)
Max. flight time34 min
Operating Temperature−10° to 40 °C (14° to 104°F)
GNSSGPS + GLONASS
Max. Transmission Distance10 km (FCC), 6 km (CE/SRRC/MIC)
Battery Capacity3500 mAh
Battery Voltage11.55 V
Max. Charging Power38 W
Remote Controller Battery5200 mAh
Intelligent Flight FeaturesActive Track 3.0, Spotlight 2.0, Point of Interest 3.0
Table 2. Test conditions.
Air Velocity (m/s)LWC (g/m3)Temperature (°C)Ice Type
50.5−10Rime
51.5−5Glaze
Table 3. Image-based leading-edge ice thickness vs. time and span.
ConditionTime [s]δLE @ r/R = 0.75 mm (75%)δLE @ r/R = 0.50 mm (50%)δLE @ r/R = 0.25 mm (25%)
Rime1000.6550.3710.146
Rime2301.2180.8140.324
Rime4202.7991.7740.645
Glaze1000.4720.3590.240
Glaze2300.6790.3370.266
Glaze4301.6811.1510.701
Table 4. Rime vs. Glaze: Motor-Level Electrical Metrics.
MotorVmean (Rime) [V]Imean (Rime) [A]Pmean
(Rime) [W]
Vmean (Glaze) [V]Imean (Glaze) [A]Pmean (Glaze) [W]ΔP [W]
Lfront11.8553.729844.2211.8724.707655.89+11.67
Rback11.7882.959934.8911.8023.424440.41+5.52
Disclaimer/Publisher’s Note: The statements, opinions and data contained in all publications are solely those of the individual author(s) and contributor(s) and not of MDPI and/or the editor(s). MDPI and/or the editor(s) disclaim responsibility for any injury to people or property resulting from any ideas, methods, instructions or products referred to in the content.