Article

Loop Shaping-Based Attitude Controller Design and Flight Validation for a Fixed-Wing UAV

Department of Aeronautics and Astronautics, National Cheng Kung University, Tainan 70101, Taiwan
*
Author to whom correspondence should be addressed.
Drones 2025, 9(10), 697; https://doi.org/10.3390/drones9100697
Submission received: 6 September 2025 / Revised: 3 October 2025 / Accepted: 9 October 2025 / Published: 11 October 2025
(This article belongs to the Section Drone Design and Development)

Abstract

This study presents a loop-shaping methodology for the attitude control of a fixed-wing unmanned aerial vehicle (UAV). The proposed controller design focuses on achieving desired frequency–domain characteristics—such as specified phase and gain margins—to ensure stability and robustness. Unlike many existing approaches that rely on oversimplified plant models or involve mathematically intensive robust-control formulations, this work develops controllers directly from a high-fidelity six-degree-of-freedom UAV model that captures realistic aerodynamic and actuator dynamics. The loop-shaping procedure translates multi-objective requirements into a transparent, step-by-step workflow by progressively shaping the plant’s open-loop frequency response to match a target transfer function. This provides an intuitive, visual design process that reduces reliance on empirical PID tuning and makes the method accessible for both hobby-scale UAV applications and commercial platforms. The proposed loop-shaping procedure is demonstrated on the pitch inner rate loop of a fixed-wing UAV, with controllers discretized and validated in nonlinear simulations as well as real flight tests. Experimental results show that the method achieves the intended bandwidth and stability margins on the desired design target closely.

1. Introduction

1.1. Background and Motivation

Fixed-wing unmanned aerial vehicles (UAVs) have become increasingly prominent in applications such as surveillance, mapping, and logistics, where stable and responsive attitude control is essential for mission success. The design of attitude controllers for such platforms requires careful trade-offs between stability, robustness, and performance across a range of operating conditions. While proportional–integral–derivative (PID) controllers are widely used in practice due to their simplicity and ease of implementation, their tuning is often empirical, and achieving multiple frequency–domain and performance targets simultaneously can be challenging. Loop shaping, by contrast, provides an intuitive and systematic framework for shaping the open-loop frequency response to balance performance and robustness, and has been applied in various aerospace control systems, including vertical take-off and landing (VTOL) aircraft, missiles, and autonomous fixed-wing aircraft.

1.2. Related Work

Attitude controller design for fixed-wing UAVs has been studied extensively using both classical and modern control techniques. Conventional PID controllers remain the most widely deployed solution in practice [1], due to their straightforward implementation and compatibility with commercial flight control systems such as PX4 [2]. Several studies have explored systematic PID tuning methods, including frequencies [3,4,5]. While effective for basic stabilization tasks, these approaches often struggle to guarantee consistent robustness across diverse flight regimes.
More advanced methodologies, such as H control, LQG/LQR, and model predictive control, provide strong theoretical guarantees and have been demonstrated in aerospace applications [6,7,8,9,10,11,12]. However, their implementation complexity, requirement for accurate modeling, and computational overhead limit their adoption in small-scale UAV platforms. An alternative is a loop-shaping design, which has been successfully applied to aircraft flight control and missile autopilots [13,14,15,16]. Loop shaping provides an intuitive way to directly enforce desired frequency–domain characteristics [17,18], but its application to small UAV attitude control remains relatively underexplored. In particular, prior work has seldom compared loop-shaping controllers against both systematically tuned PID designs and widely adopted PX4 default controllers on the same platform, leaving a gap in the literature regarding practical performance trade-offs.
Compared to advanced robust control techniques such as H∞ and MPC, loop shaping occupies an intermediate position: it provides a systematic frequency–domain methodology with embedded stability margins, while maintaining the low computational requirements necessary for small UAV autopilot implementation. Unlike PID tuning, which is often empirical, loop shaping directly links design specifications to closed-loop behavior in a transparent manner. For these reasons, loop shaping represents a practical alternative for UAVs with limited onboard resources, bridging the gap between conventional PID approaches and more computationally intensive robust control frameworks.

1.3. Contributions

While prior studies on fixed-wing UAV attitude control have demonstrated the use of classical PID tuning, H control, and adaptive methods, they often rely on simplified plant models, focus narrowly on theoretical stability margins, or involve design processes that are mathematically demanding and not easily transferable to practical platforms. In contrast, this work introduces a loop-shaping–based design that addresses these gaps through the following contributions:
1.
High-fidelity modeling for controller synthesis. A controller design workflow is established directly on linearized models extracted from a high-fidelity six-degree-of-freedom (6-DoF) UAV dynamic model. This ensures that the controller accounts for realistic vehicle dynamics, actuator limits, and aerodynamic characteristics derived from AVL analysis, bridging the gap between theoretical methods and practical UAV implementations.
2.
Simplified systematic design methodology. The loop-shaping framework simplifies the otherwise complex task of satisfying multiple frequency–domain objectives. By progressively shaping the plant dynamics to match a visualized target transfer function, the approach translates multi-objective requirements—stability margins, bandwidth, and disturbance rejection—into a transparent graphical procedure. This reduces reliance on empirical PID tuning while avoiding the mathematical intractability of advanced robust-control methods.
3.
Visual and intuitive design process. The proposed method provides a graphical and step-by-step representation of the controller synthesis process. This makes the design workflow more accessible to practitioners, including those working with hobby-scale UAVs or commercial platforms, where intuitive and reproducible methods are preferable to black-box optimization or trial-and-error tuning.
4.
Feasibility demonstration on a real platform. The designed loop-shaping controllers are implemented on a Skysurfer 1400 fixed-wing UAV (X-UAV, Xi’an, China). Verification through both high-fidelity nonlinear simulations and flight experiments demonstrates that the proposed approach yields stable and robust closed-loop performance, confirming its applicability beyond simulation environments.
To reduce the length of the article, only the pitch axis is redesigned in detail to streamline exposition; the workflow is axis-agnostic and directly extensible to roll dynamics.

2. Controller Design Methodology

This chapter introduces the overall structure of the proposed attitude control system and the design methodology applied to the pitch axis. The control architecture follows a cascaded two-loop configuration, consisting of an outer attitude loop and an inner angular-rate loop, as illustrated in Figure 1.
The outer loop regulates the pitch attitude ( θ ) by generating pitch-rate commands ( q s p ) for the inner loop. It is implemented as a single proportional controller, tuned such that the closed-loop bandwidth remains a fraction of the inner loop bandwidth. This ensures adequate loop separation and stability without adding unnecessary complexity to the outer-loop dynamics.
The inner loop stabilizes the body pitch rate ( q ) through elevator deflections. In this work, the pitch-rate controller is designed using the proposed loop-shaping methodology to satisfy specified frequency–domain requirements, including target phase margin, gain margin, and bandwidth.
For completeness, the roll and yaw control axes are not redesigned in this study. Instead, they retain the default PX4 configurations, which provide baseline stability while allowing the focus of this work to remain on the pitch-axis controller design and validation.
Figure 1. Block diagram of the cascaded attitude control system.
Drones 09 00697 g001

2.1. UAV Dynamic Model

The controller design is based on linearized models derived from the full six-degree-of-freedom (6-DoF) UAV dynamics. The nonlinear rigid-body equations of motion were formulated following standard flight dynamics references [19,20], incorporating aerodynamic forces and moments, propulsion effects, and inertial coupling. The aerodynamic force and moment coefficients were obtained using the Athena Vortex Lattice (AVL) method [21], which provided the necessary stability derivatives for the roll and pitch axes.
For the purposes of controller synthesis, the nonlinear model was linearized at the steady-level flight trim condition. The resulting linearized dynamics were reduced to single-input-single-output (SISO) transfer function representations between control surface deflections (aileron and elevator) and the corresponding body angular rates (roll rate p , pitch rate q ). These transfer functions form the basis of the loop-shaping design, enabling frequency–domain analysis using Bode plots and pole–zero placement. The yaw channel was excluded from this process and retained the default PX4 controller configuration. Final validation was conducted using the complete nonlinear 6-DoF simulation model to ensure that the linear-model-based design translates effectively to the full system dynamics.
For a practical fixed-wing UAV, a first-order actuator dynamics model was included, represented as
G a c t s = 20 s + 20 .
The final design model for the pitch rate loop was constructed as the product of the linearized UAV transfer functions and the actuator dynamics. The linearized models were obtained using the MATLAB (R2025a) Control System Toolbox, where the full nonlinear 6-DoF UAV simulation model was trimmed at a steady level-flight condition corresponding to an airspeed of approximately 15   m / s . These transfer functions are summarized in Table 1, where the first row indicates the corresponding dynamic channel (pitch), and the second row lists the respective transfer function representations derived from the high-fidelity 6-DoF model. To account for actuator effects, each dynamic model was subsequently multiplied by the actuator transfer function G a c t ( s ) . The resulting combined transfer functions served as the effective plant models for the loop-shaping controller design.
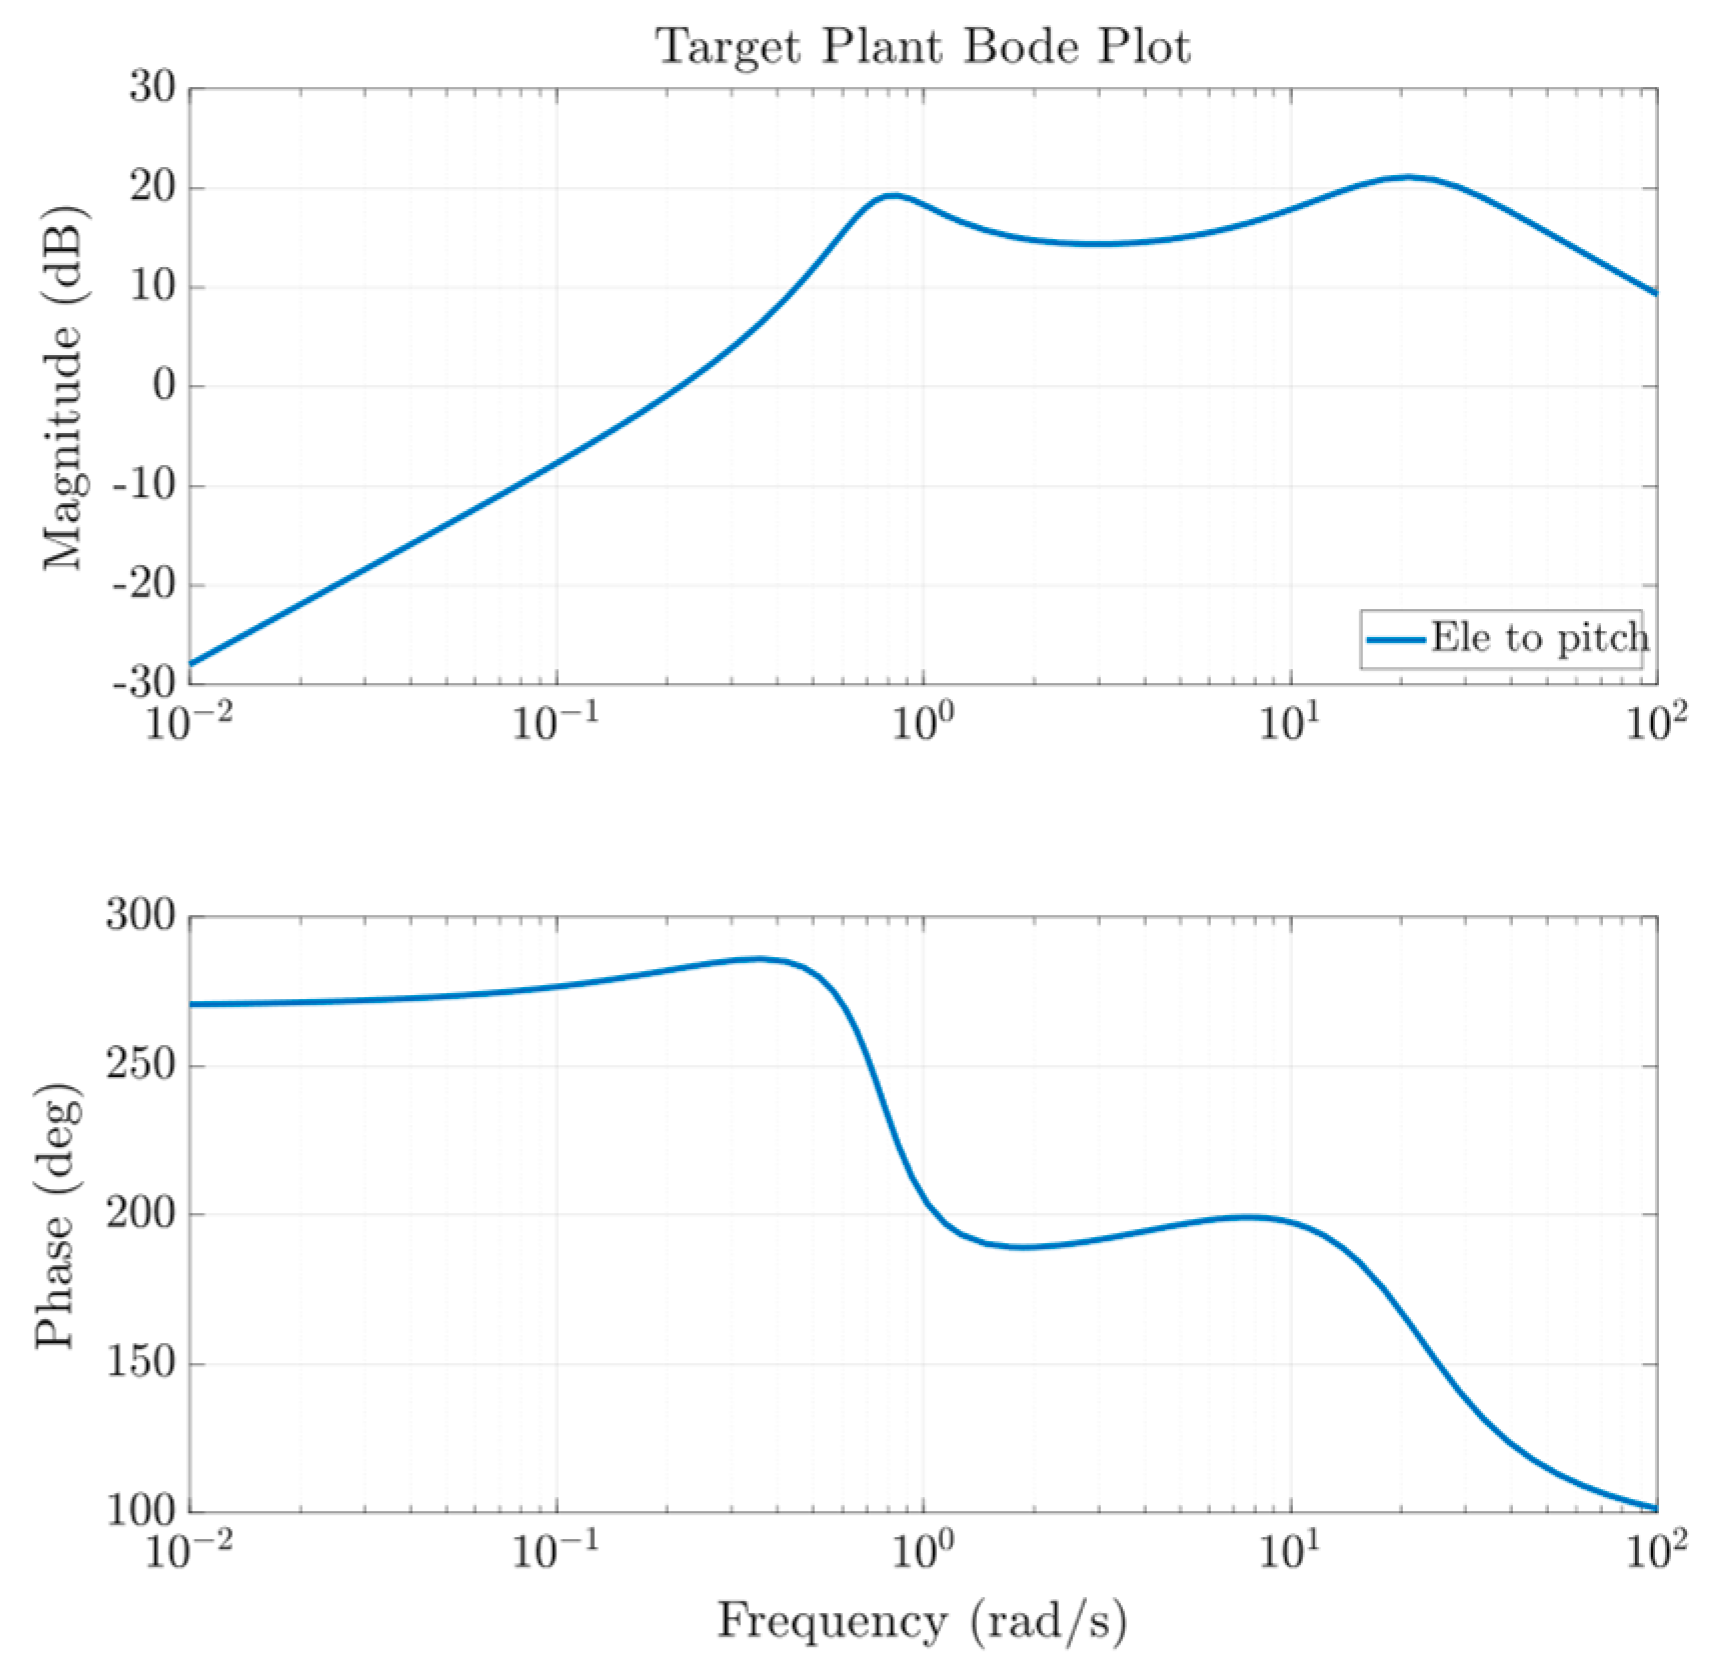
For clarity, Figure 2 illustrates the open-loop Bode plot of the pitch rate channel, respectively, after incorporating the actuator model. This figure highlights the baseline frequency–domain characteristics of each axis, which were used as the starting point for the sequential pole-zero placement and compensator synthesis in the loop-shaping procedure.
Figure 2. Open-loop Bode plot of the pitch channels.
Drones 09 00697 g002

2.2. Loop-Shaping Controller Design Procedure

The proposed loop shaping methodology is applied to inner angular rate loops for the pitch ( q ) channel. The loop is designed independently using its respective linearized dynamic model obtained from the full six-degree-of-freedom (6-DoF) UAV equations of motion, formulated according to standard rigid-body flight dynamics [19,20]. The aerodynamic force and moment coefficients required for these models were generated using the Athena Vortex Lattice (AVL) method [21].
The design process follows a structured sequence. First, the target open-loop function (TOF) is defined based on target bandwidth, stability margin and disturbance-rejection requirements. Next, the inner-loop controller is synthesized by progressively shaping the plant dynamics to match the TOF, following the steps of root cancelation, mid-frequency phase alignment, and high-frequency roll-off. Finally, the outer-loop controllers are tuned by adjusting proportional gains to satisfy the desired bandwidth separation between the inner and outer loops. The overall workflow of this design sequence is summarized in Figure 3.
The design was performed on transfer-function representations of the linearized models, extracted at the trim condition and augmented with a first-order actuator dynamics model. As a final step, the controller was discretized and validated on the complete nonlinear 6-DoF UAV simulation. This comparison between the linear design environment and nonlinear validation ensures that the frequency–domain objectives translate into consistent time–domain performance under realistic flight conditions.
Figure 3. Flowchart of the loop-shaping controller design procedure.
Drones 09 00697 g003

2.3. Design Objectives

The primary objective of the controller design is to achieve stable and well-damped angular rate responses in the pitch ( q ) axis, while maintaining robustness against model uncertainties and external disturbances. To this end, three frequency–domain specifications are adopted as the main design targets:
  • Inner-loop closed-loop bandwidth.
The desired crossover frequency for the pitch rate loop is set at approximately 8   r a d / s . This provides sufficiently fast angular rate responses while remaining within the bandwidth limits of the actuator and sensor dynamics.
2.
Outer-loop close-loop bandwidth.
The pitch attitude loops employ simple proportional controllers with a target bandwidth of approximately 2   r a d / s . According to conventional flight control design practice, the bandwidth of the inner rate loops should be about three to five times higher than that of the outer loops [20,22,23,24]. This ensures adequate loop separation and prevents dynamic coupling between the cascaded loops.
3.
Phase and gain margins.
A minimum phase margin of 70 ° and a gain margin exceeding 6   d B are specified. These values provide adequate robustness to modeling errors and parameter uncertainties, and are consistent with flying-quality guidelines for small UAVs [20,25,26].
4.
Disturbance rejection.
At low frequency, the loop must provide high gain to suppress steady-state disturbances such as gusts and trim errors. Conversely, high-frequency gain is required to decay rapidly ( 60   d B / d e c ) to attenuate sensor noise and unmodeled high-frequency dynamics.
The specification is deliberately conservative because this study reports a first deployment of the workflow on a real platform; focusing on a single axis reduces implementation risk while preserving generality. And by adopting cautious bandwidth and stability-margin targets, the design ensures robust flight stability during early testing, thereby reducing implementation risks while still providing sufficient performance for practical evaluation.

2.4. Construct Target Open-Loop Transfer Function

The design objective is expressed through a target open-loop transfer function, denoted L t a r g e t ( s ) , which specifies the desired crossover frequency, disturbance-rejection capability, and high-frequency roll-off. The controller is then synthesized to shape the actual plant dynamics so that the resulting open-loop transfer function approximates L t a r g e t ( s ) .
In general, each design element can be represented in the form of the following transfer functions.
G p s = 10 α / 20   s β p + 1     a n d     G z s = 10 α / 20   s β z + 1 ,
where the numerator and denominator terms correspond to controller zeros and poles, respectively. The parameter α specifies the associated gain adjustment in decibels, while β z and β p denote the break frequencies of the zero and pole, respectively. A single first-order pole is obtained when only the denominator is present, whereas a single zero is represented by omitting the denominator. By combining such elements in sequence, the target open-loop transfer function can be flexibly shaped to meet multiple objectives, including bandwidth, phase margin, and disturbance rejection.
The crossover frequency ( ω c ) is selected based on the desired closed-loop bandwidth. In well-damped systems, the gain crossover frequency is closely related to the closed-loop bandwidth. To impose this behavior, a first-order lag was introduced with a pole at β p = 0.8   r a d / s :
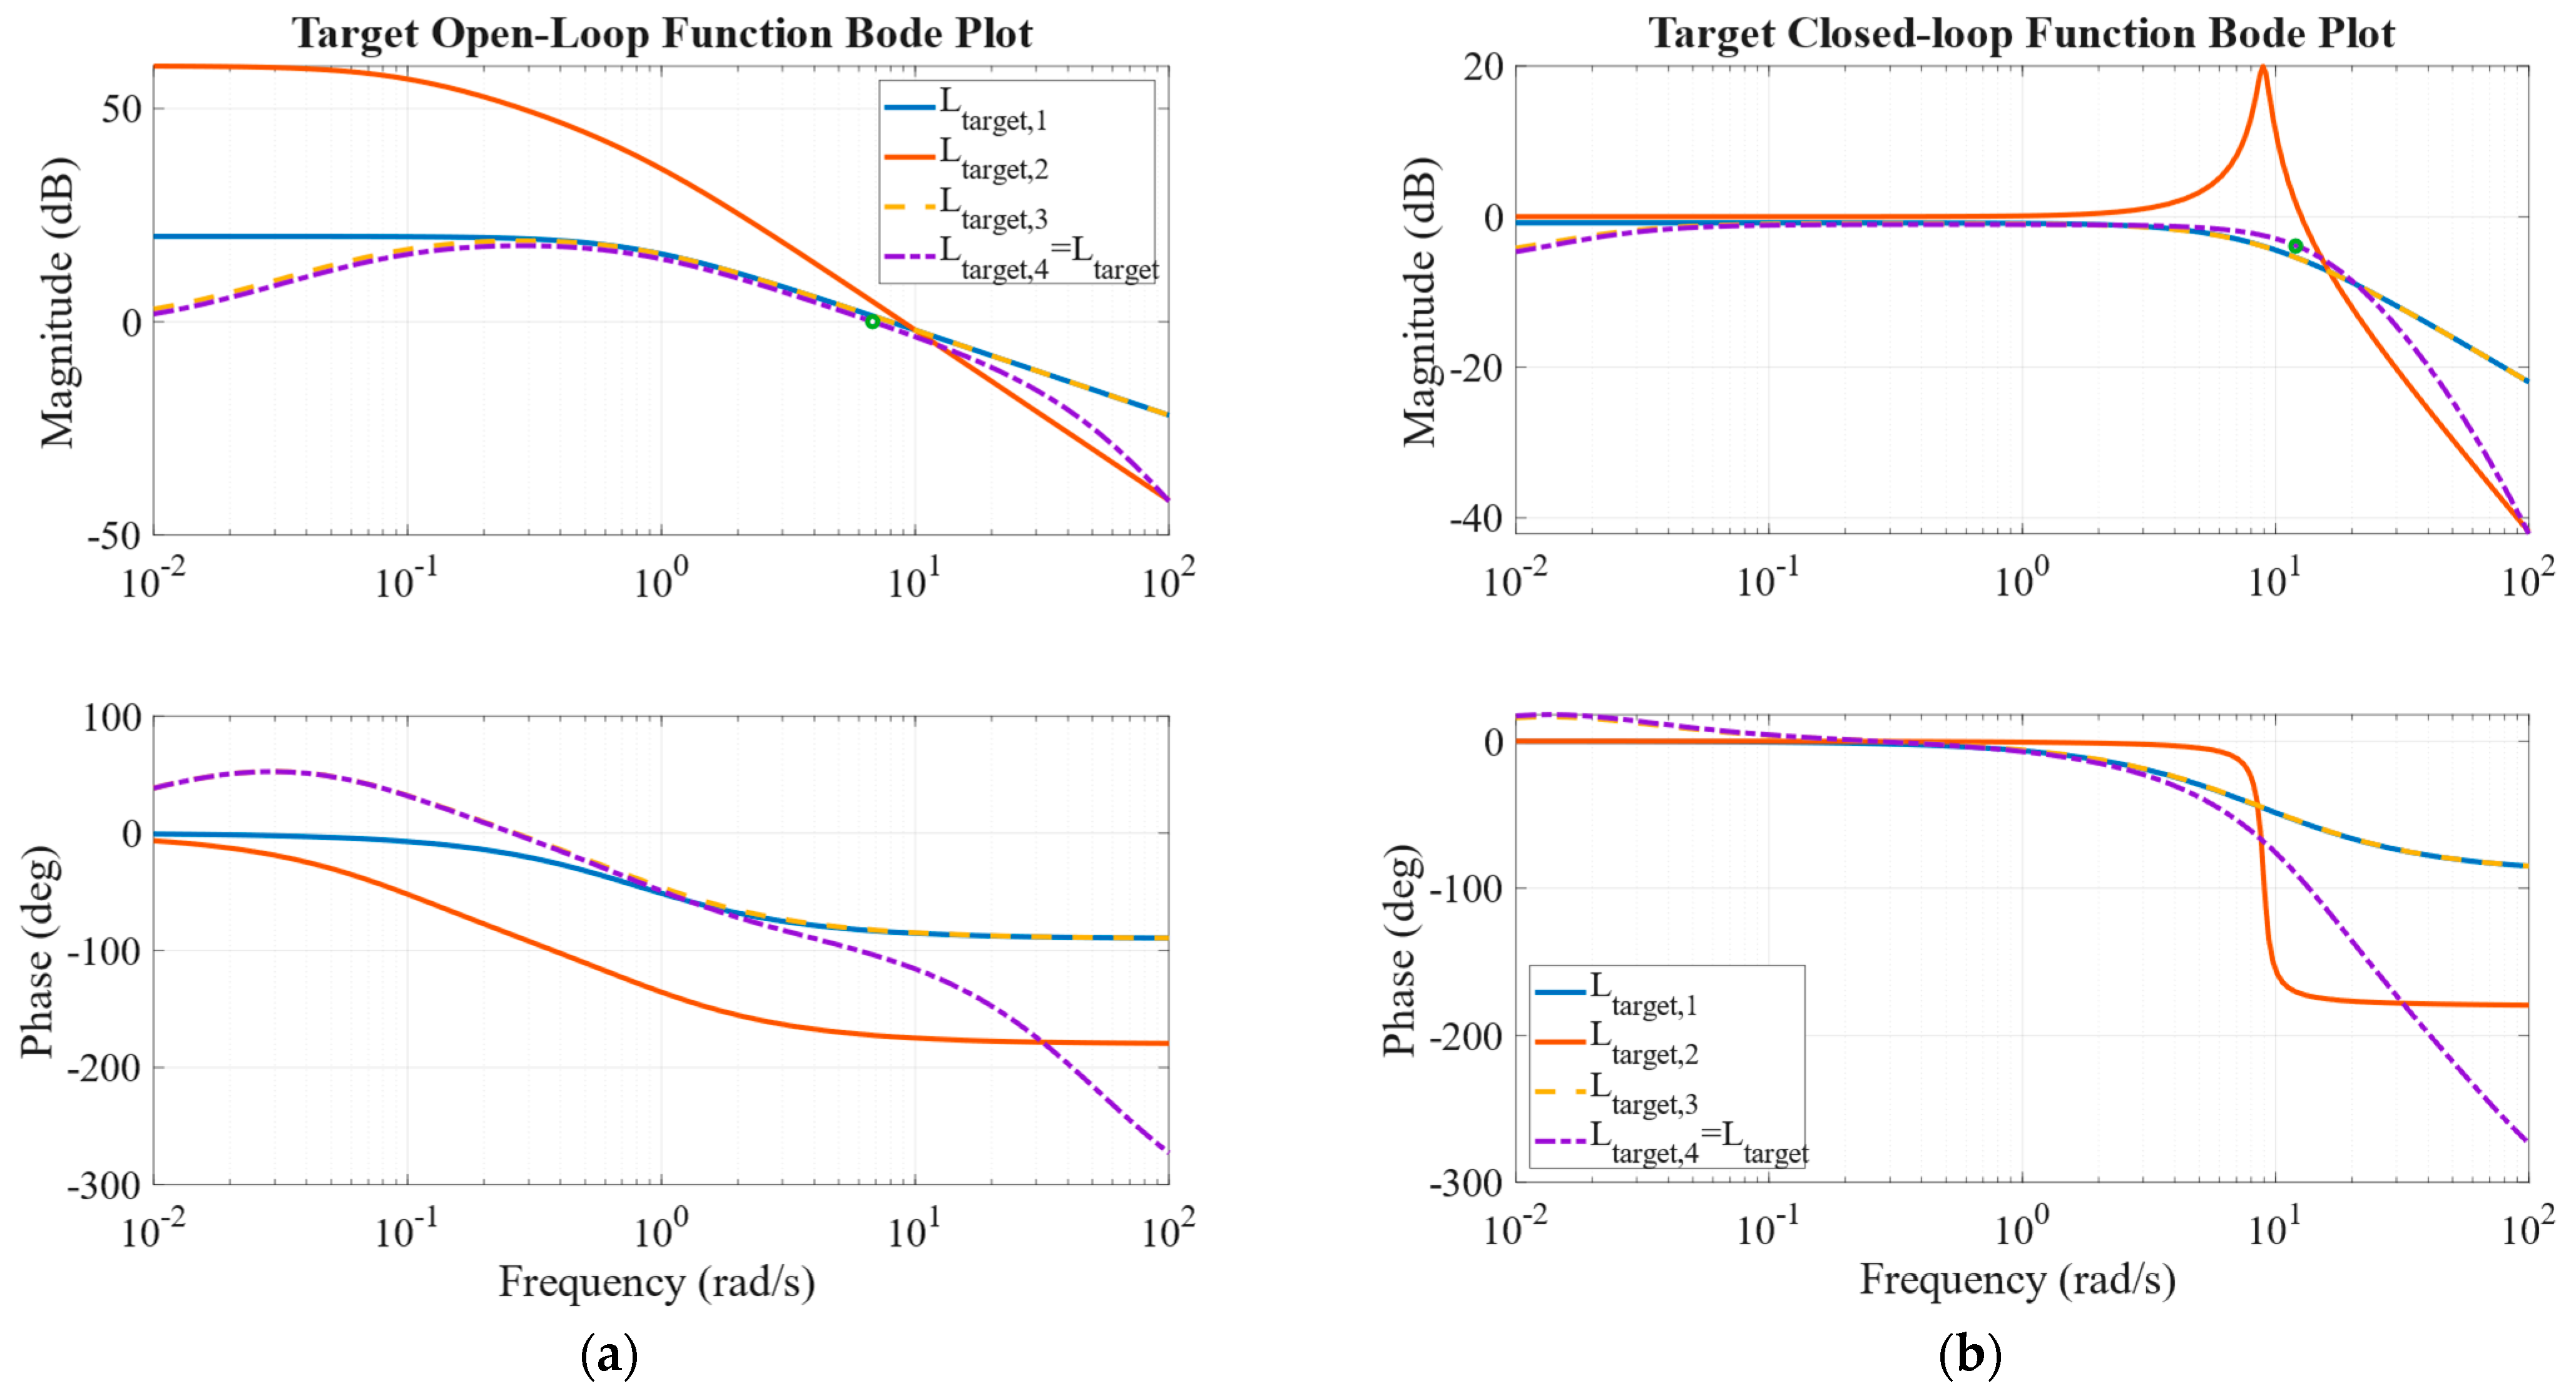
L t a r g e t , 1 ( s ) = 10 20 / 20 ( s 0.8 + 1 )
The gain α = 20 compensates for the magnitude drop at the intended crossover frequency caused by the lag pole.
To improve low-frequency performance and reduce steady-state error, a second low-frequency pole is added at β p = 0.1   r a d / s :
L t a r g e t , 2 ( s ) = 10 20 / 20 · 10 40 / 20 ( s 0.8 + 1 ) ( s 0.1 + 1 )
The additional gain α = 40 flattens the magnitude curve at low frequencies, increasing DC gain for better disturbance rejection.
We still need to achieve the required phase margin ( > 70 ° ) , a zero is placed at β z = 0.01   r a d / s . The final target transfer function becomes:
L t a r g e t , 3 s = 10 20 + 40 60 20 s 0.01 + 1 s 0.8 + 1 s 0.1 + 1
The gain factor α = 60 was selected to normalize the magnitude such that the crossover frequency settled at approximately 8   r a d / s .
To suppress sensor noise and attenuate unmodeled dynamics, a third-order pole cluster was introduced at approximately 55   r a d / s . This frequency corresponds to roughly seven times the crossover frequency ( ω c = 8   r a d / s ), which ensures that the roll-off is sufficiently separated from the control bandwidth to avoid degrading stability margins, while remaining low enough to provide effective attenuation of high-frequency disturbances. This placement follows common control design practices, where roll-off dynamics are typically placed at 5–10 times the crossover frequency to balance robustness and noise rejection [27]. The resulting target open-loop function is
L t a r g e t , 4 s = L t a r g e t ( s ) = 10 1.5 20   s 0.01 + 1 s 0.8 + 1 s 0.1 + 1 s 55 + 1 3
This placement enforces an asymptotic slope of 60   d B / d e c in the high-frequency region, while preserving the desired phase characteristics within the bandwidth of interest. To finalize the design, a scalar gain of α = 1.15   d B was applied so that the open-loop magnitude intersected the 0   d B axis at the intended crossover frequency of 7   r a d / s . The resulting closed-loop response exhibited an effective bandwidth of approximately 12   r a d / s , aligning with the design objective of achieving a fast yet practically realizable angular rate response.
The final target open-loop transfer function L t a r g e t ( s ) thus incorporates (i) a specified crossover near 8   r a d / s , (ii) enhanced low-frequency gain for disturbance rejection, (iii) sufficient phase margin, and (iv) high-frequency roll-off for noise attenuation. The corresponding closed-loop system exhibits an effective bandwidth of approximately 12   r a d / s . This frequency–domain profile serves as the reference model that the actual plant dynamics are shaped to approximate during controller synthesis.
The target open-loop transfer function (TOF) was shaped by sequentially introducing poles and zeros, with the detailed placements summarized in Table 2. First, a lag pole was introduced at low frequency to help establish the desired bandwidth, since the crossover frequency typically lies close to the closed-loop bandwidth, and to suppress steady-state drift while retaining integral-like behavior. A second low-frequency pole was then placed to improve robustness against actuator dynamics and constant biases. A zero was added near the crossover frequency to provide phase lead and increase stability margin. At high frequency, a third-order roll-off was applied to attenuate sensor noise and prevent excitation of unmodeled dynamics. Finally, the overall loop gain was adjusted to achieve the target bandwidth while maintaining sufficient gain and phase margins. This step-by-step shaping procedure ensures that the TOF construction directly reflects the intended design objectives.
To aid interpretation, Figure 4a illustrates the open-loop Bode plots after each construction step, showing the progressive shaping of the magnitude and phase response toward the final target. The corresponding closed-loop responses are shown in Figure 4b, confirming that the final design achieves the intended bandwidth and stability margins.
Figure 4. Frequency response characteristics of the target function: (a) sequential construction of the target open-loop transfer function L t a r g e t ( s ) , the green dot indicate the crossover frequency of the corresponding open-loop response. (b) closed-loop Bode plots corresponding to the constructed target transfer functions.
Drones 09 00697 g004

2.5. Loop Shaping Controller Design Methodology

The loop-shaping design procedure aims to adjust the open-loop frequency response of the aircraft dynamics such that it conforms to a predefined target transfer function, thereby ensuring that the prescribed design objectives are satisfied. The design process is carried out in a structured sequence of steps, as outlined below. For clarity of presentation, the detailed step-by-step design is illustrated using the pitch channel as a representative example.
We consider the longitudinal inner-loop plant P p i t c h ( s )
P p i t c h s = G p i t c h s G a c t s = 2.0082 × 10 3 s 7 + 6.118 e 04 s 6 + 6.386 e 05 s 5 + 5.043 e 06 s 4 + 2.237 e 07 s 3 + 8.125 e 06 s 2 1.227 e 06 s + 3.848 e 10 s 9 + 69.73 s 8 + 2232 s 7 + 4.101 e 04 s 6 + 4.336 e 05 s 5 + 2.859 e 06 s 4 + 1.419 e 07 s 3 + 6.031 e 06 s 2 + 6.821 e 06 s 8.788 e 05
where the open-loop poles p p , i and zeros z p , i are shown in Table 3.
  • Cancelation of selected resonant poles.
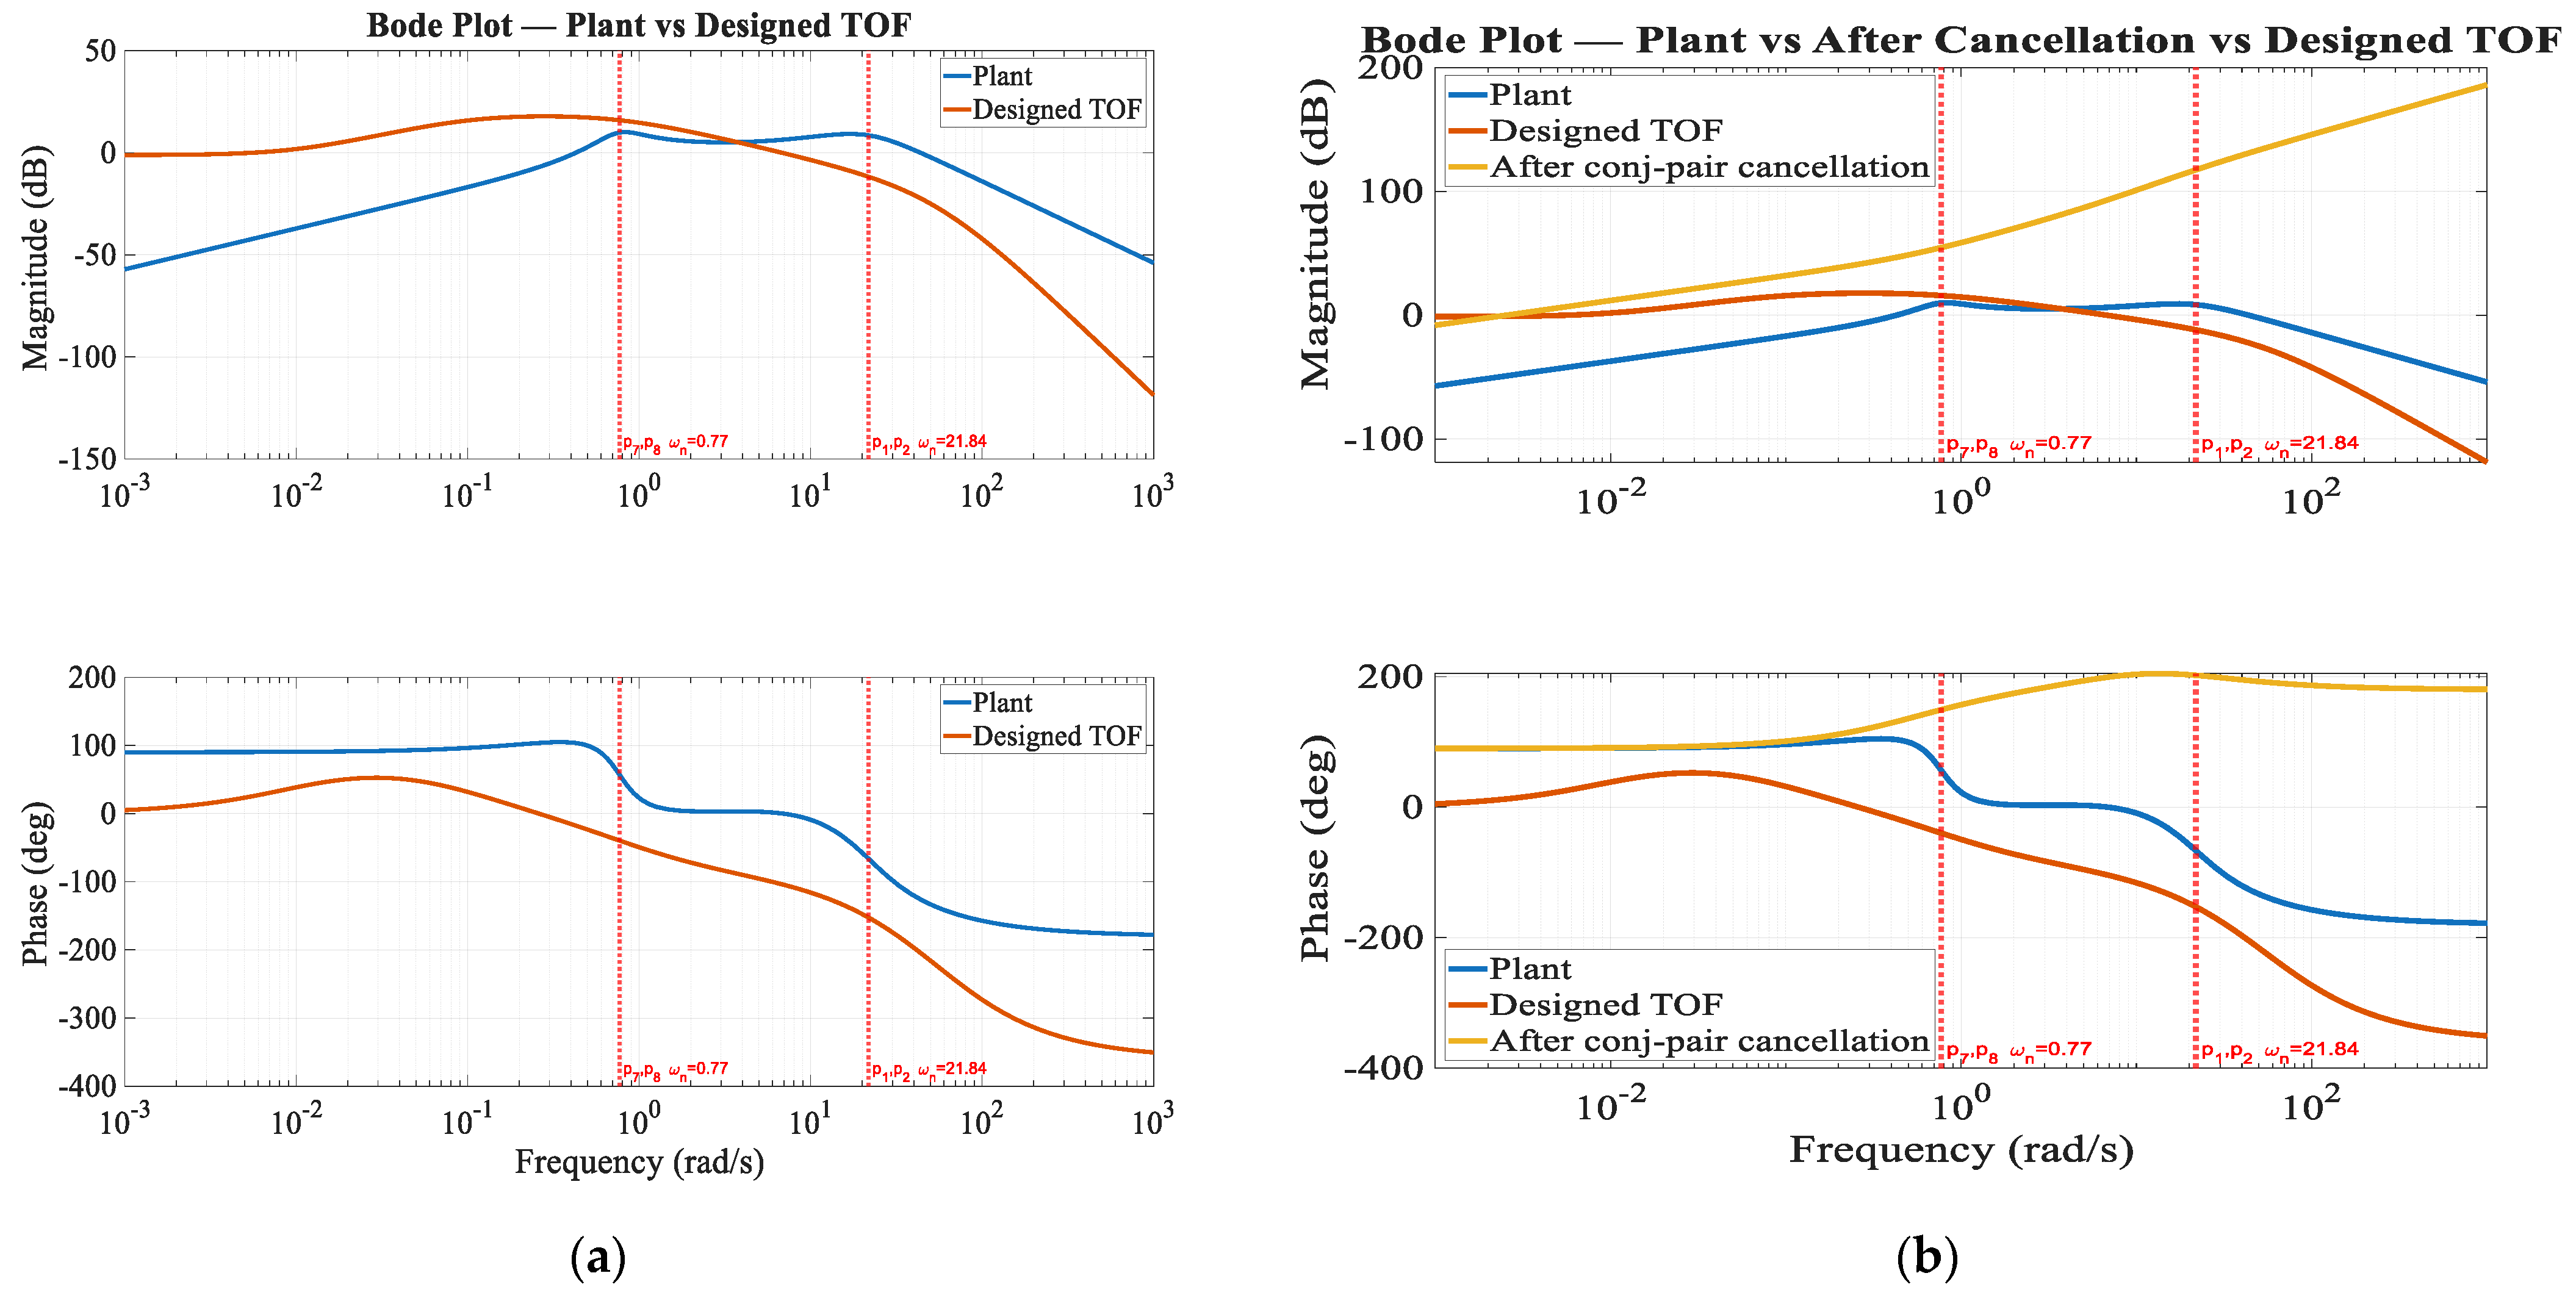
To initiate the controller synthesis, the first step is to eliminate the pronounced phase distortions caused by the dominant complex conjugate poles of the plant. As illustrated in Figure A1a, located in Stepwise Bode Plots of the Pitch Rate Loop-Shaping Design Procedure Section in Appendix A, the Bode plots of the original plant and the target closed-loop guideline (TOF) are compared. Two prominent resonant regions can be identified: the low-frequency pair ( p p , 7 ,   p p , 8 ) at a natural frequency of approximately 0.77   r a d / s , and the high-frequency pair ( p p , 1 , p p , 2 ) located at about 21.8   r a d / s . These poles introduce sharp phase variations in the open-loop response, which hinder the attainment of the desired phase margin. To mitigate this effect, conjugate zeros were introduced at the same locations, forming the cancelation polynomial
C p , z 1 s = ( s p p , 1 ) ( s p p , 2 ) ( s p p , 7 ) ( s p p , 8 )
This cancelation provides a smoother baseline upon which subsequent shaping actions can be performed, thereby aligning the system response with the target TOF specification. The resulting compensated response is shown in Figure A1b, located in Stepwise Bode Plots of the Pitch Rate Loop-Shaping Design Procedure Section in Appendix A, where the mid- and high-frequency phase distortions are significantly reduced, allowing the Bode plot to more closely follow the target guideline.
Remark 1.
The choice of which poles to cancel in this study was based on graphical considerations—specifically, the locations where cancelation yielded the most effective shaping of the Bode plot. This selection is not unique; alternative choices may also be valid depending on design priorities and implementation constraints.
2.
Low-frequency phase correction.
After canceling the dominant conjugate poles in Step 1, the next objective is to align the open-loop phase response with the target TOF over a wide frequency range. This is achieved by progressively introducing poles and zeros from low to high frequency.
In the low-frequency region, a discrepancy of approximately 90 ° was observed. To address this, a pure pole was introduced in the controller, represented by
C p , p 1 s = 1 s .
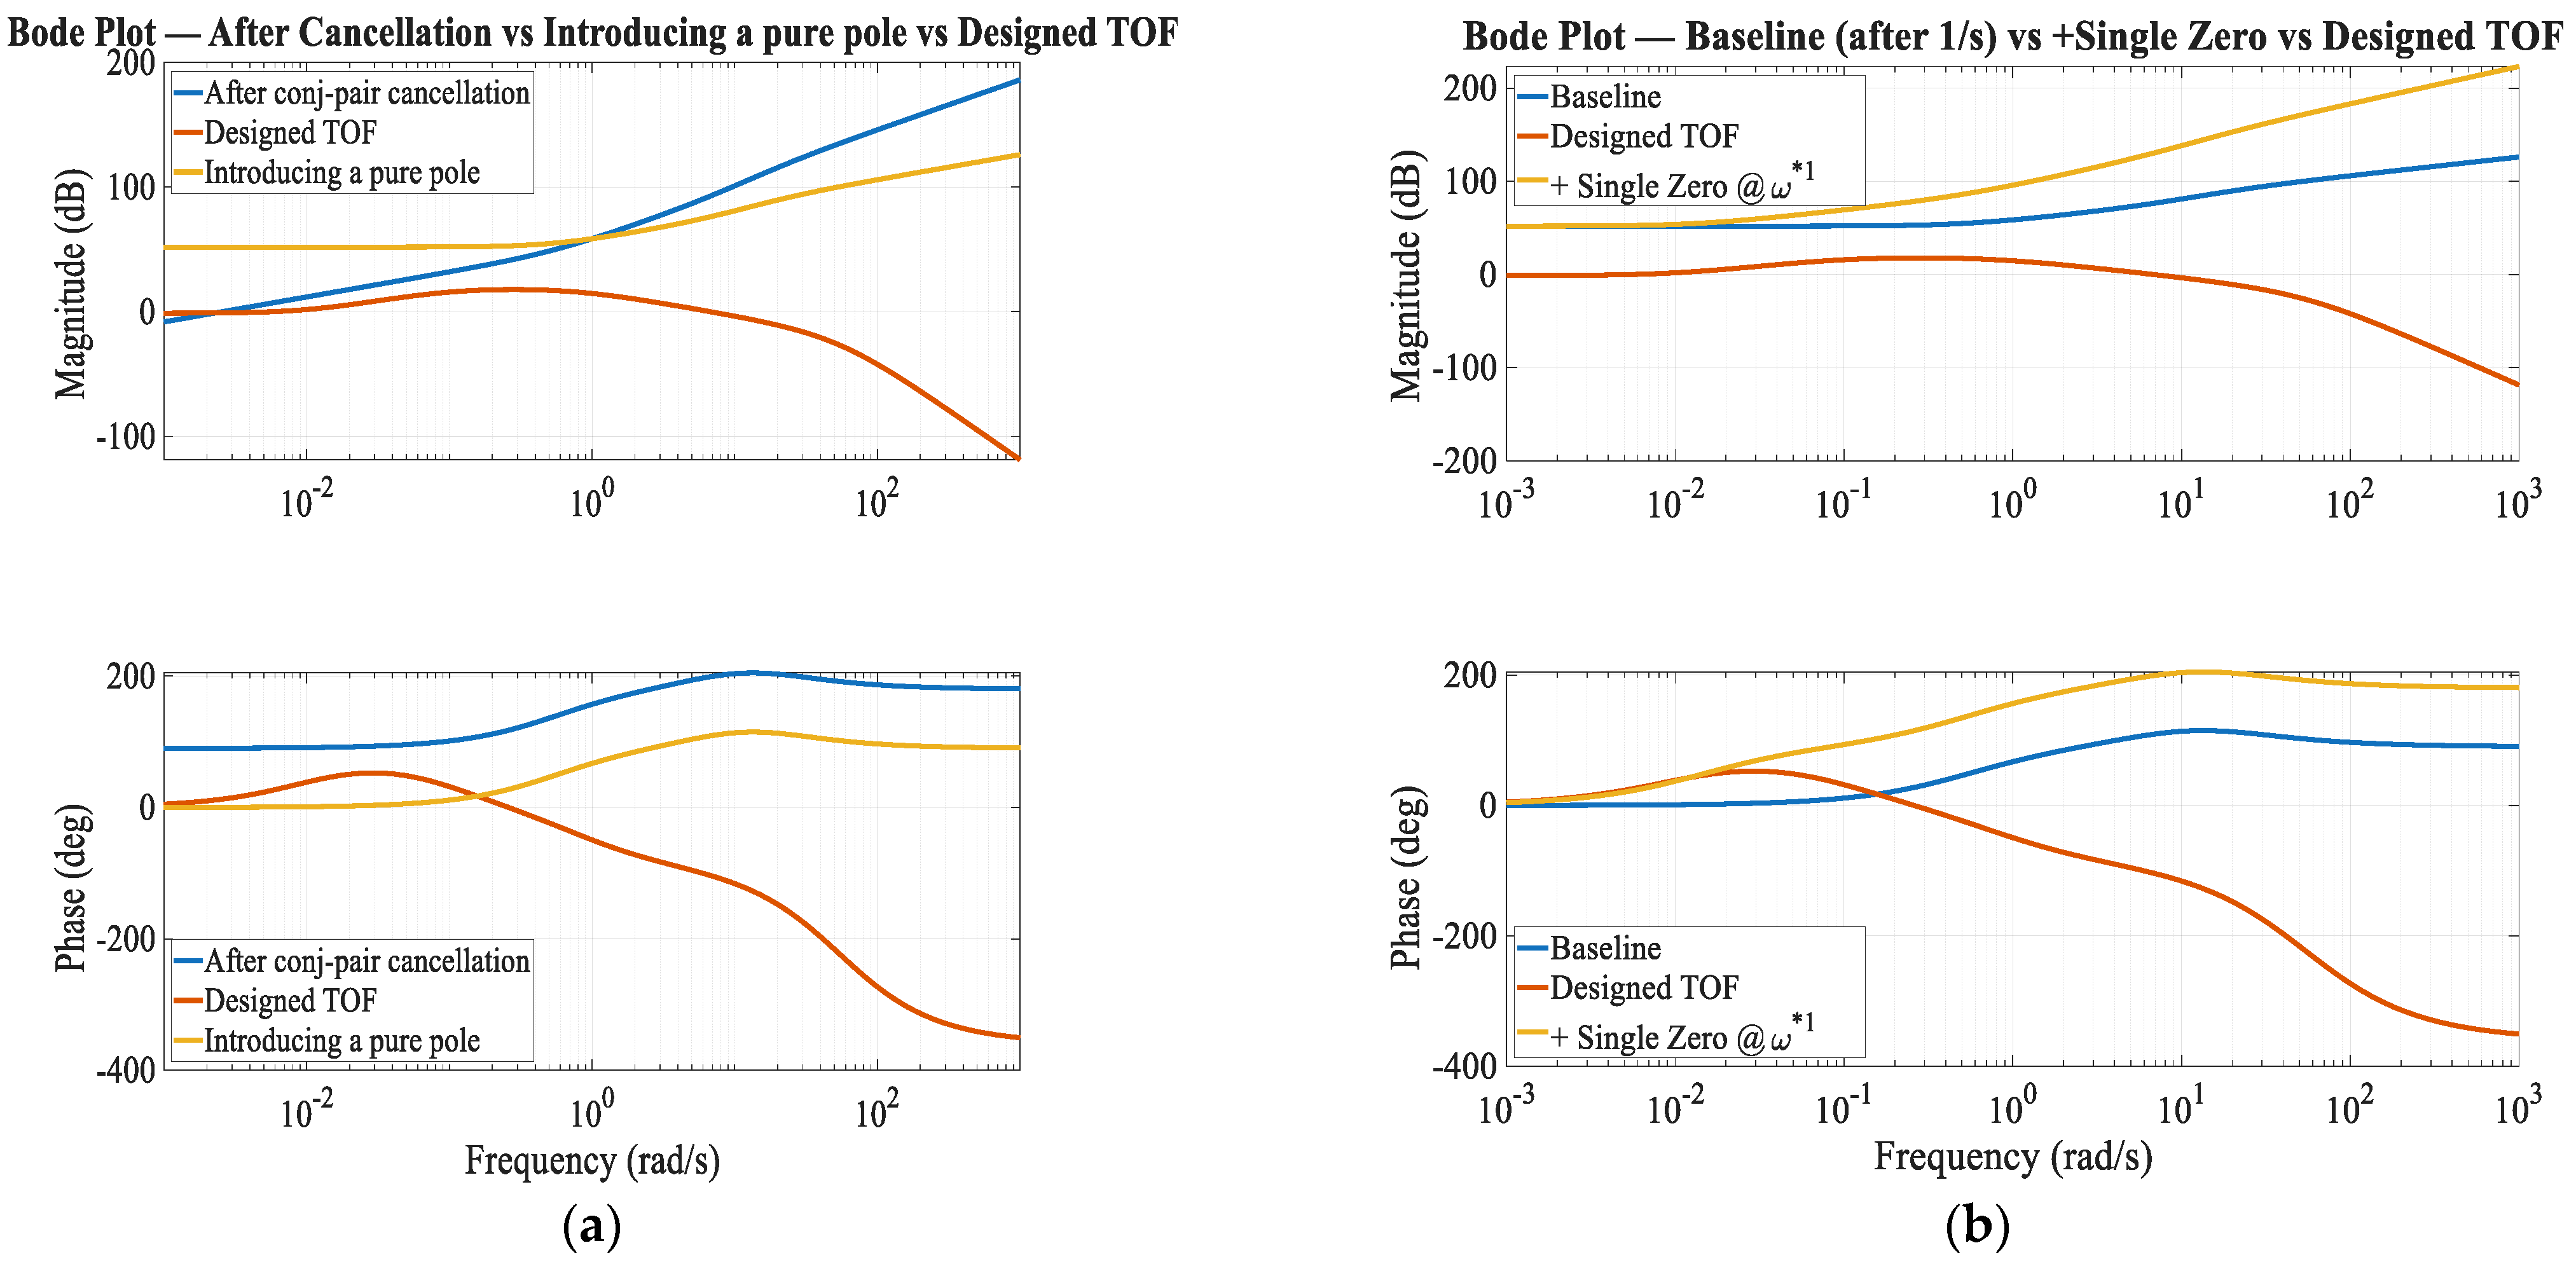
This pole provides a continuous phase lag starting from the lowest frequencies, thereby reducing the excessive phase lead of the original system. By attenuating the low-frequency gain while shaping the phase trajectory downward, the pure pole not only enhances the fidelity of the phase alignment with the target function but also improves robustness by mitigating potential amplification of low-frequency disturbances. As shown in Figure A2, the Bode plot confirms that the insertion of 1 / s effectively reduces the low-frequency phase offset, establishing a more suitable foundation for subsequent zero-pole placements at higher frequencies.
3.
Mid-frequency shaping
Following the insertion of the pure pole to correct the low-frequency offset, a residual phase deficit of approximately 45.44 ° was observed at ω 1 = 0.013998   r a d / s . Since the phase error is not constant across the band but accompanied by an insufficient magnitude slope, a single controller zero is introduced to raise the local slope and supply the required phase:
C p , z 3 s = s ω z + 1 ,     ω z = ω 1 t a n ( ϕ a d d ) 0.01378   r a d / s ,     ϕ a d d = 45.4438 ° .
This placement aligns the phase at ω without imposing a platform-like phase plateau, and simultaneously transitions the magnitude slope towards + 20   d B / d e c in the surrounding decade. As shown in Figure A2, the open-loop Bode after adding C p , z 3 ( s ) conforms closely to the target TOF around ω 1 .
To further align the phase response, a single pole is introduced to lower the local slope and supply the required negative phase at ω 2 = 0.0661   r a d / s . Using the first-order phase relation 1 / ( 1 + j ω / ω p ) = tan 1 ( ω / ω p ) , the pole is placed at ω p = 0.0716   r a d / s such that C p j ω 2 42.71 ° . This placement simultaneously yields a moderate magnitude attenuation of 2.68   d B at ω 2 , which helps suppress high-frequency components (See Figure A3 for the after overlay)
Between the previously placed zero and pole, the phase error remains nearly constant. At ω 3 = 0.013998   r a d / s , the deficit is + 9.4637 ° ; hence, a lead compensator is introduced to provide a platform-like phase lift around ω 3 with minimal side effects:
C p , L 1 s = 1 + s / ω z 1 + s / ω p ,     α = 1 sin ϕ a d d 1 + sin ϕ a d d ,     ω z = ω 3 α ,     ω p = ω 3 α .
with ϕ a d d = 9.4637 ° gives α 0.718 , ω z 0.0119   r a d / s , and ω p 0.0165   r a d / s .
This placement delivers + 9.46 ° at ω 3 while altering the magnitude only mildly, which is subsequently absorbed by the final gain normalization. As shown in Figure A3, the compensated loop aligns closely with the target phase over the crossover neighborhood without disturbing the low- or high-frequency shaping established in earlier steps.
By iteratively adding zero, pole, and Lead/Lag compensators in increasing frequency order, the open-loop response is shaped to closely track the TOF across the entire design band, while ensuring smooth accumulation of phase correction and avoiding over-adjustment in previously matched regions.
4.
High-frequency roll-off.
After the mid-frequency adjustments (omitted here for brevity), the design proceeds to the high-frequency region where the target TOF exhibits a steep magnitude roll-off. To replicate this decay trend and suppress high-frequency noise, higher-order poles are introduced.
For example, a second-order pole is placed at frequency ω p :
C s = 1 s ω p + 1 2 ,
Or equivalently, a third-order pole at ω p :
C s = 1 s ω p + 1 3 .
These higher-order poles steepen the slope of the magnitude response while introducing the necessary phase lag to align with the TOF. The break frequency ω p or ω p is selected to coincide with the onset of rapid decay in the target TOF.
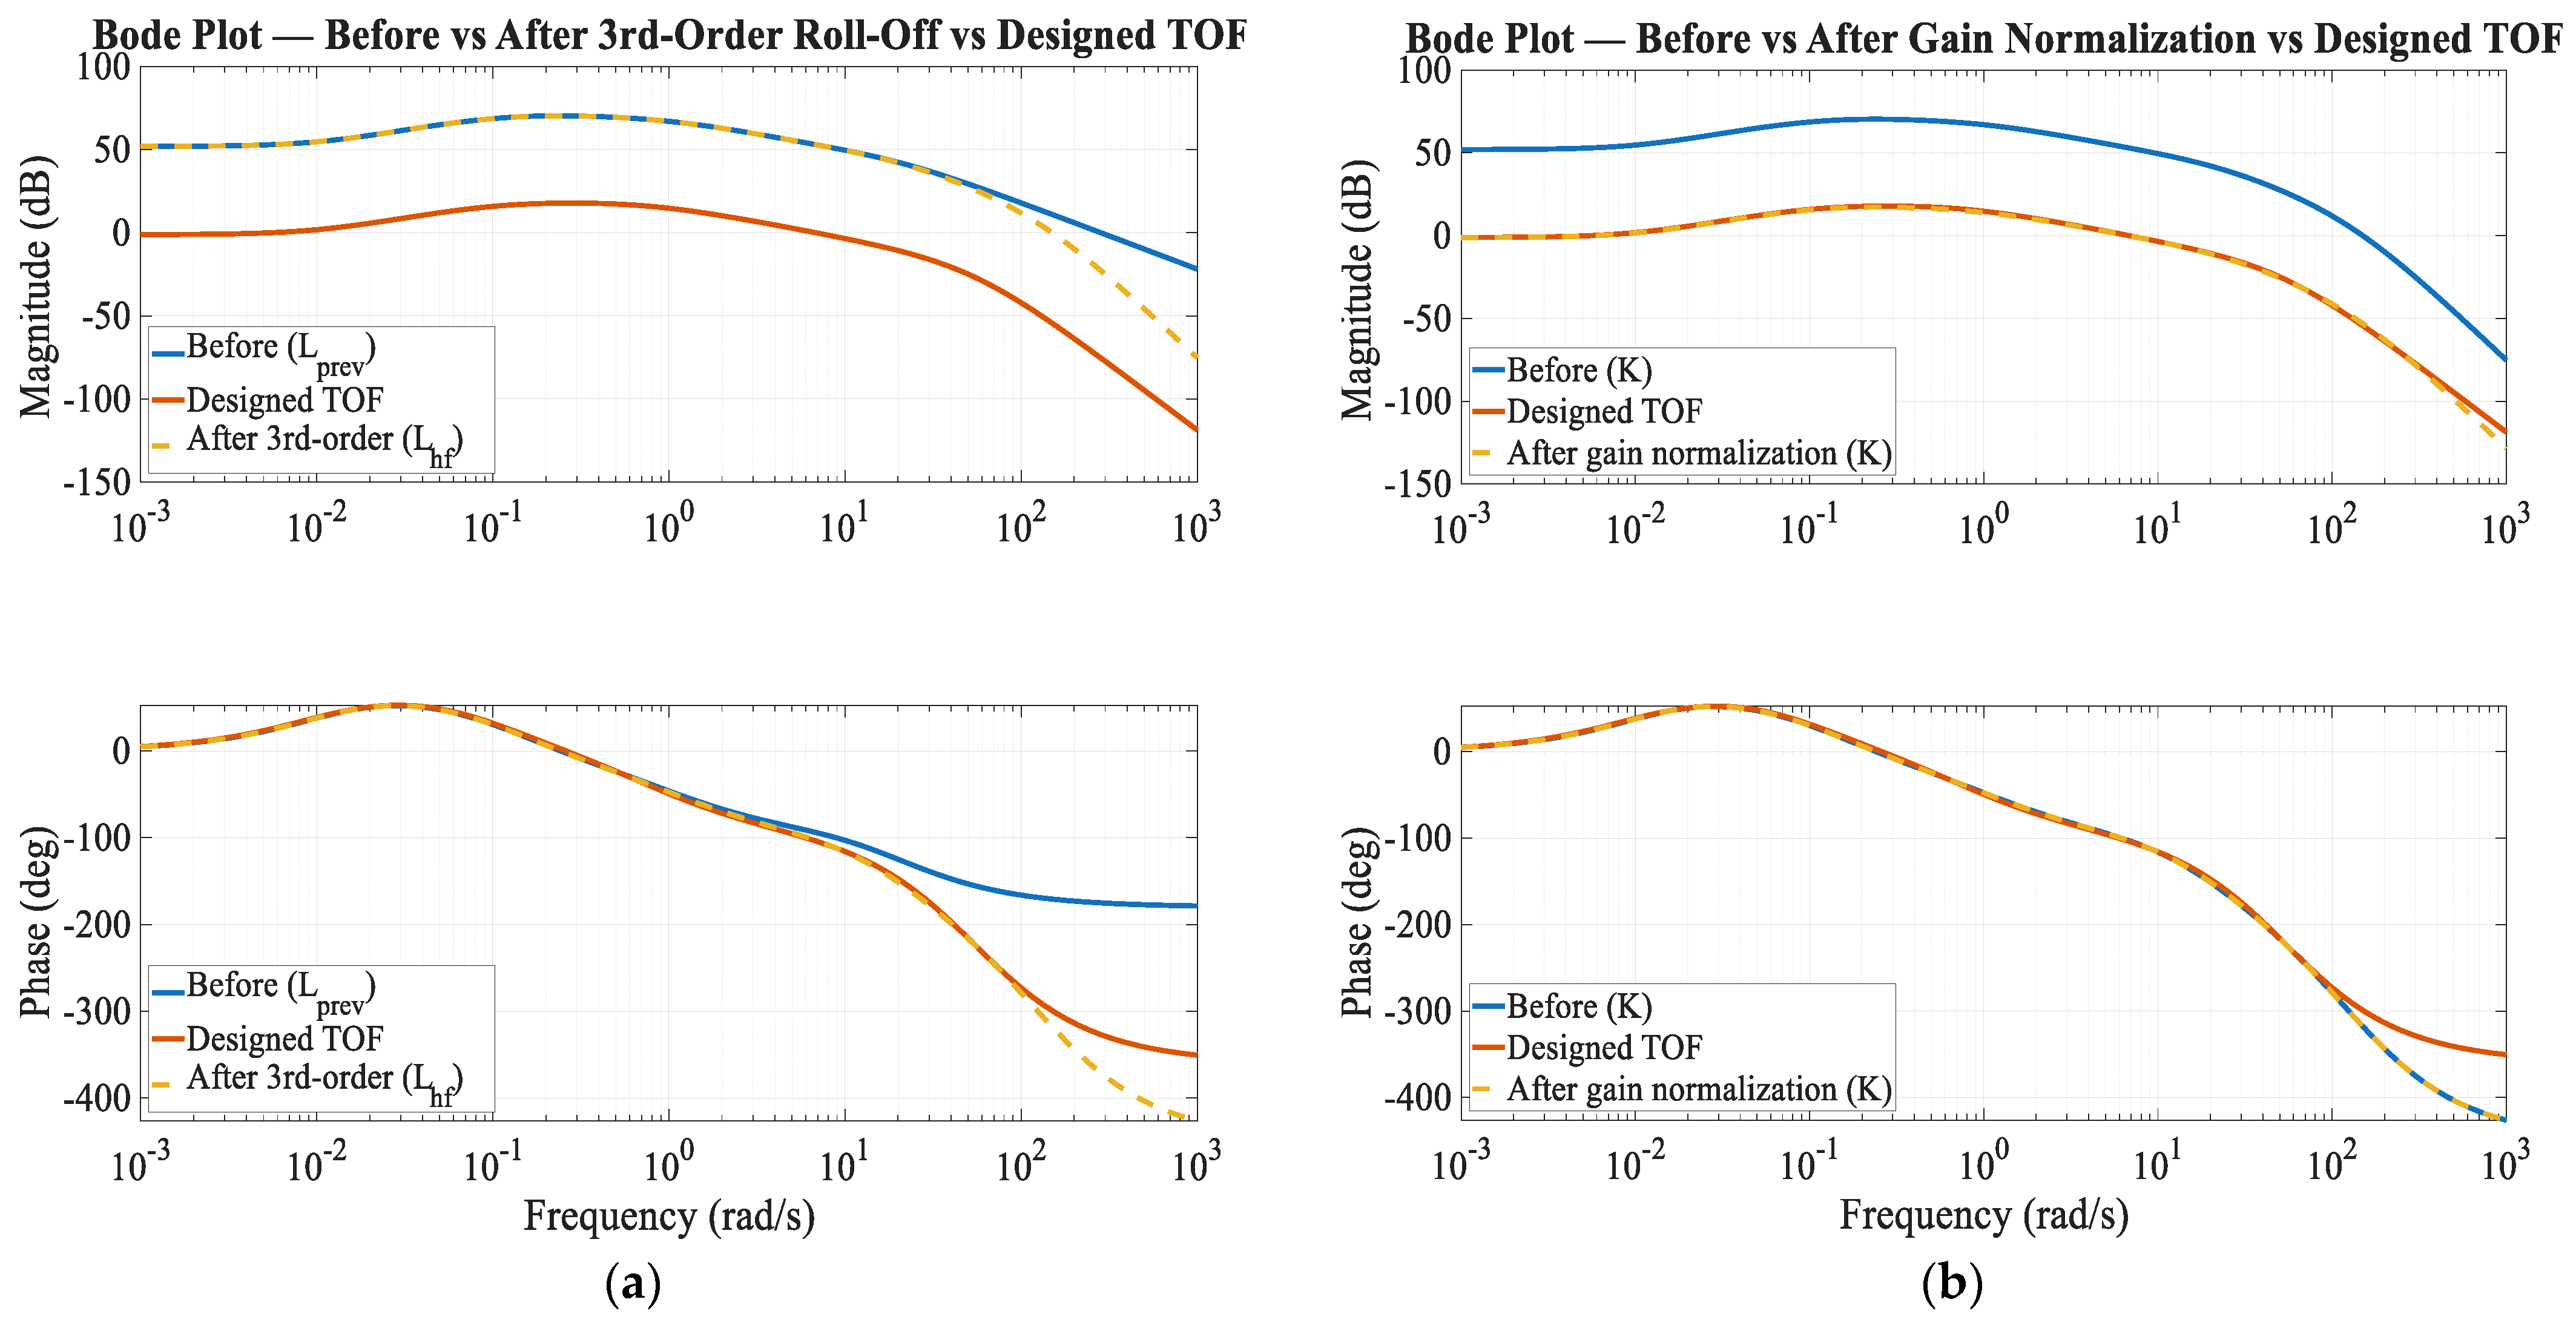
The target TOF specifies a rapid decay to suppress unmodeled dynamics and sensor noise in the high-frequency region, with an asymptotic slope of 60   d B / d e c and a corresponding phase lag approaching 270 ° . To reproduce this behavior within the loop-shaping framework, a third-order real pole cluster was introduced.
Unlike simply adopting the TOF pole location, the design in this study employs a phase requirement back-solve method. Specifically, the compensator break frequency ω p , H F is determined such that the pole cluster contributions require additional phase lag at the designated frequency ω 4 . At ω 4 = 61.167   r a d / s , the open-loop response exhibited a phase discrepancy of approximately 75.464 ° , which was selected as the design target.
From the third-order pole phase relation,
C p , p 6 j ω 4 = 3   tan 1 ω 4 ω p , H F ,
The break frequency is back-solved as
ω p , H F = ω 4 tan ( ϕ a d d / 3 ) = 61.157 t a n ( 75.464 ° / 3 ) 130.254   r a d / s .
This approach guarantees that the phase alignment is enforced directly at the critical frequency of interest, while still preserving the robustness benefits of a third-order asymptotic decay. The resulting compensated loop matches the TOF in both slope and phase trend in the high-frequency band, as shown in Figure A4.
5.
Gain normalization.
A final scalar gain is applied to align the open-loop magnitude with the unity condition at the target crossover. Specifically, a proportional factor of K = 10 53.19 / 20   ( 53.19   d B ) is introduced after the high-frequency third-order roll-off. This adjustment vertically shifts the open-loop magnitude curve so that it intersects the 0   d B line at the chosen crossover frequency, without altering the phase-shaping or slope characteristics already achieved through pole–zero placement.
The final controller C p i t c h ( s ) :
C p i t c h s = 48.67   s 9   +   1795   s 8   +   3.684 e 04   s 7   +   2.471 e 05   s 6 +   2.282 e 05   s 5   +   1.911 e 05   s 4   +   6.323 e 04   s 3 +   5339   s 2   +   107.4   s   +   0.6245 0.0002486   s 12   +   0.1026   s 11   +   14.83   s 10   +   841.7   s 9 +   1.382 e 04   s 8   +   7.463 e 04   s 7 +   1.138 e 05   s 6   +   6.836 e 04   s 5   +   1.785 e 04   s 4   +   2021   s 3   +   89.39   s 2   +   s
where consists of a structured combination of pole-zero elements and a scalar gain, synthesized through the loop-shaping procedure. The design process began with cancelation of dominant plant poles to reduce phase distortion, followed by sequential pole and zero placements from low to mid frequency to align the open-loop response with the target transfer function. Lead–lag compensators were introduced in frequency regions where nearly constant phase deficits were identified, and a third-order high-frequency pole cluster was employed to enforce the desired 60   d B / d e c roll-off. Finally, a scalar gain normalization was applied to ensure that the open-loop crossover frequency was located at approximately 7   r a d / s , yielding a closed-loop bandwidth of about 12   r a d / s . A summary of all compensator pole and zero placements, together with the corresponding gain values used in the loop-shaping design, is provided in Table 4.
The synthesis was focused on the frequency range of interest for aircraft dynamics, approximately 10 2 ~ 10 2   r a d / s , which encompasses the dominant rigid-body modes of fixed-wing aircraft. Within this band, the controller was shaped to satisfy bandwidth, robustness margin, and disturbance-rejection requirements. Beyond 10 2   r a d / s , precise alignment with the target profile was not pursued, as this region is dominated by actuator and sensor dynamics as well as unmodeled high-frequency effects. Instead, the third-order roll-off ensures sufficient attenuation to suppress noise and avoid undesired high-frequency amplification.
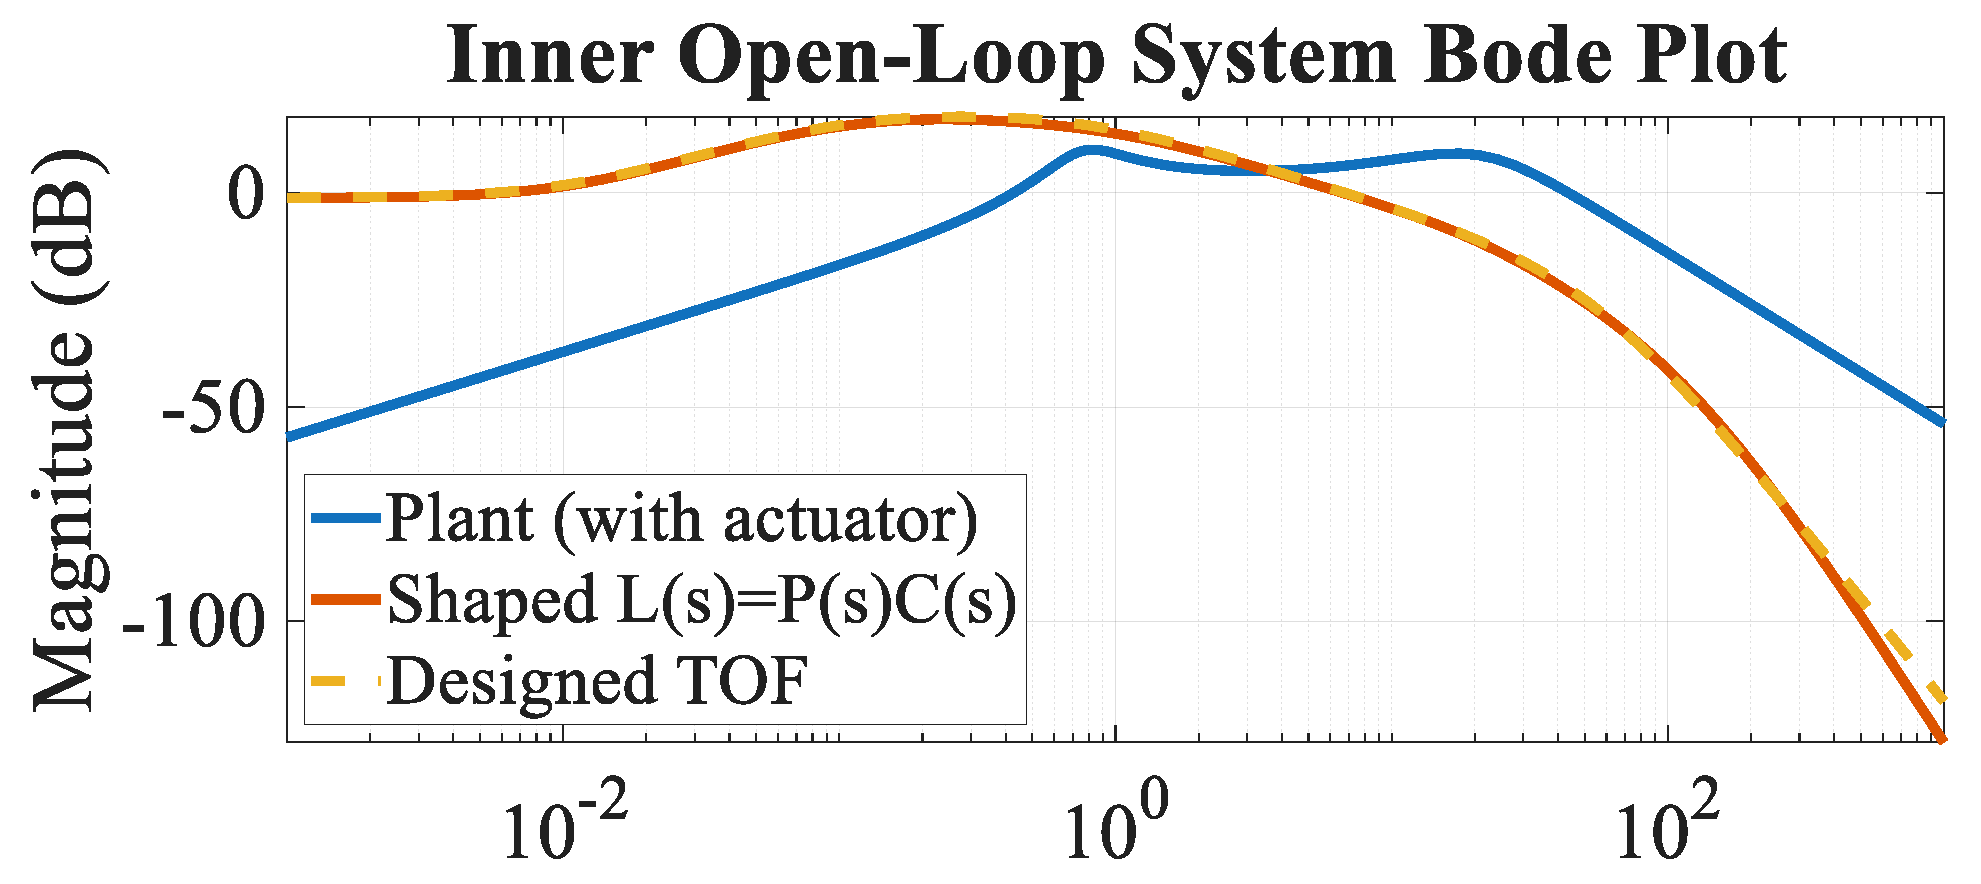
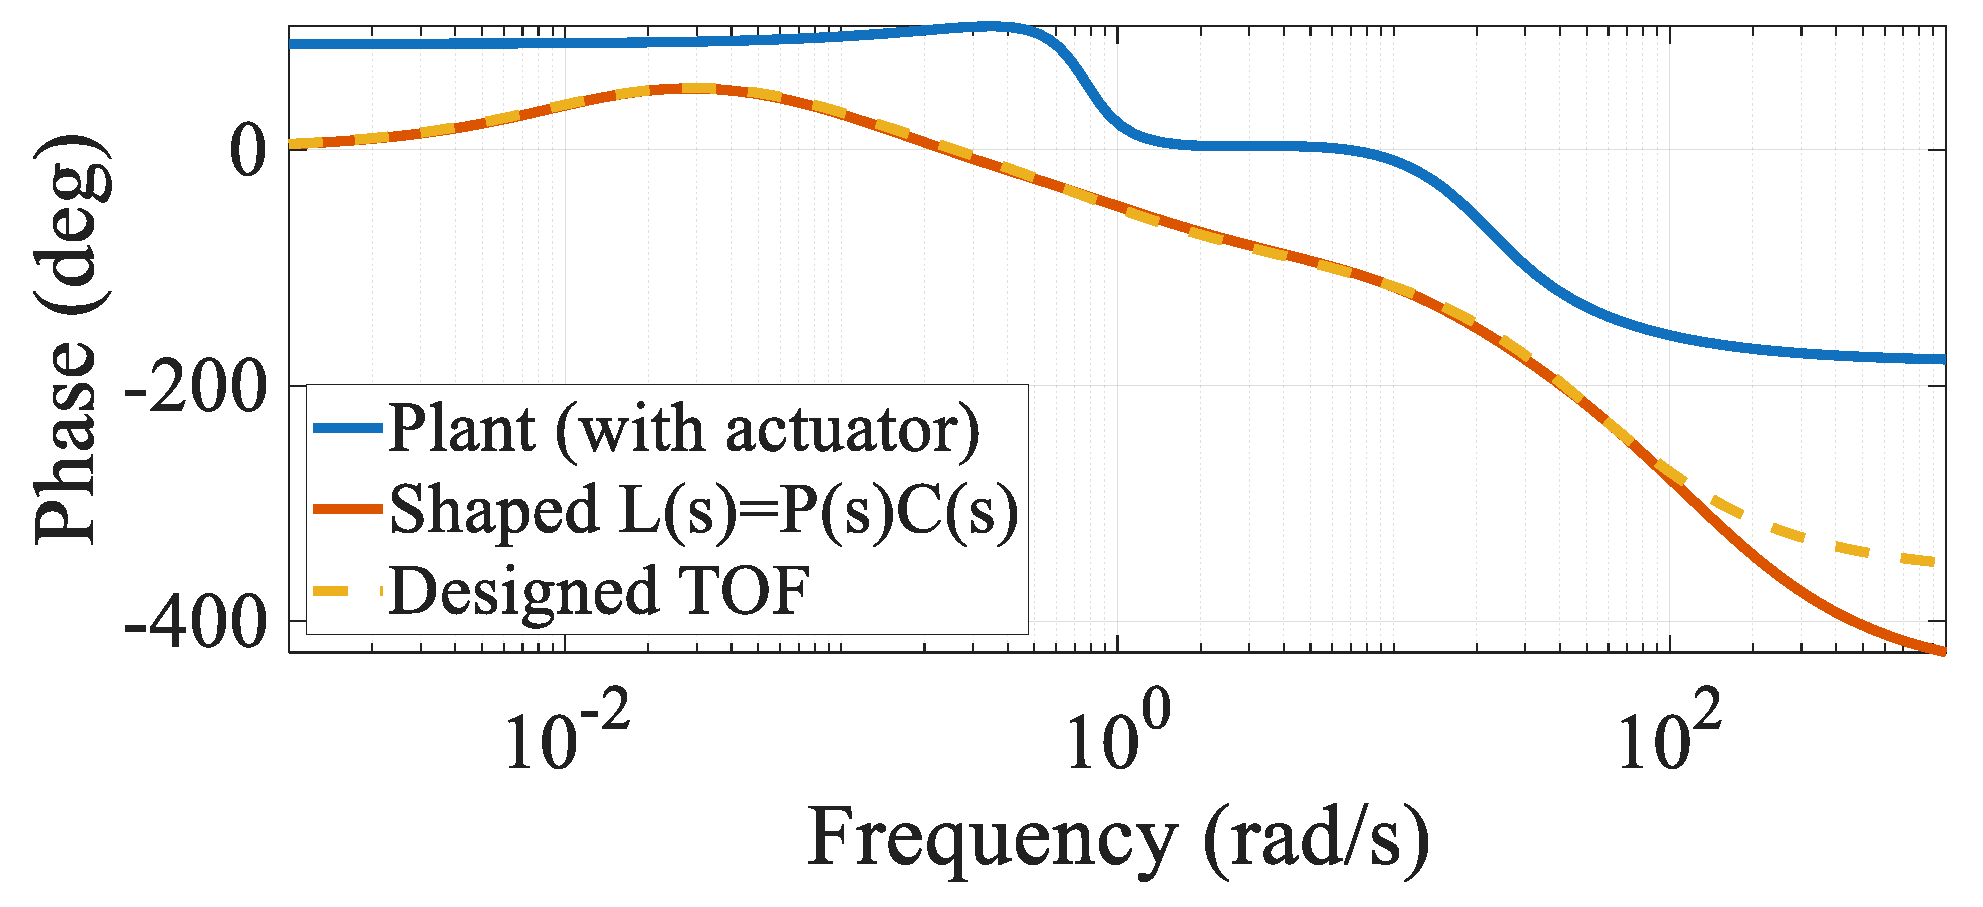
To further validate the effectiveness of the controller, closed-loop step responses of the pitch angular rate loops are presented in Figure 5, demonstrating that the frequency–domain design translates into satisfactory time–domain performance with fast rise, limited overshoot, and well-damped behavior.
Figure 5. Open-loop Bode plots comparing the actuator-augmented plant P p i t c h ( s ) , the shaped loop L p i t c h ( s ) = P p i t c h s C p i t c h ( s ) , and the target open-loop function L t a r g e t ( s ) .
Drones 09 00697 g005aDrones 09 00697 g005b

2.6. Outer-Loop Proportional Gain Design

The outer-loop attitude controllers are implemented as simple proportional (P) gains that map the pitch attitude errors (   θ s p θ ) to the corresponding angular rate commands ( q s p ) for the inner loops. Unlike the inner-loop synthesis, no additional pole-zero shaping was applied in the outer loops, since their primary role is to regulate the attitude with sufficient separation from the inner-loop bandwidth.
The proportional gains were selected based on the bandwidth separation criterion commonly adopted in flight control design, which prescribes that the inner angular-rate loop bandwidth should be approximately three to five times larger than the outer attitude-loop bandwidth [20,22]. With the inner-loop closed-loop bandwidth measured at approximately 12   r a d / s , the target outer-loop bandwidth was chosen as 2   r a d / s .
The final proportional gain for pitch outer loop was set to
K P = 10 5 / 20 ,
which yielded a closed-loop attitude bandwidth of approximately 2   r a d / s . This choice ensured that the attitude loops are well separated from the faster rate loops, while maintaining stable and well-damped dynamics.
The frequency- and time-domain characteristics of the designed attitude control loops are illustrated in Figure 6 and Figure 7, respectively. Figure 6 shows the closed-loop Bode diagrams of the roll and pitch attitude channels, while Figure 7 presents the corresponding step responses demonstrating the achieved transient performance.
The roll and yaw channel was retained from the default PX4 configuration. The resulting outer-loop design thus provides adequate attitude tracking while preserving robustness through hierarchical loop separation.
Figure 6. Closed-loop Bode plots of the pitch attitude loops with the proportional controller. The orange dot indicates the closed-loop crossover frequency.
Drones 09 00697 g006
Figure 7. Closed-loop step responses of pitch attitude loops with the proportional outer-loop controller.
Drones 09 00697 g007

3. Performance Verification

The verification stage bridges the gap between frequency–domain controller design and practical implementation by confirming that the intended closed-loop dynamics are preserved across different representations of the system. The procedure consists of three main steps.
First, the continuous-time pitch controller designed in Section 2 is discretized using the bilinear (Tustin) transform with a sampling frequency of 250 Hz. The frequency- and time–domain responses of the continuous- and discrete-time controllers are compared on the linearized plant model to ensure that the discretization process does not significantly distort the target dynamics.
Second, the equivalence between linear and nonlinear models is examined. The discretized controller is applied to both the linearized transfer-function model and the full nonlinear six-degree-of-freedom UAV simulation model. Step responses in the pitch attitude are compared to verify that the controller achieves consistent time–domain performance in both representations. Key metrics include rise time, overshoot, and steady-state error, which directly reflect controllability and responsiveness.
Finally, the controller is validated through flight testing to confirm feasibility in real-world operation. The goal of this stage is not to claim absolute performance superiority, but rather to demonstrate that the proposed loop-shaping controller can be implemented reliably within the PX4 autopilot framework and maintain stable behavior under realistic flight conditions.
This procedure establishes confidence that the proposed design is not only stable in theory but also feasible in practice, with consistent dynamics across continuous and discrete domains, linear and nonlinear models, and ultimately in real flight. To further reduce implementation risk, the verification objectives are deliberately conservative, reflecting the fact that this study represents an initial deployment of the methodology on a fixed-wing UAV platform.

3.1. Controller Discretization

For practical implementation, only the loop-shaping controllers required explicit discretization, since the numerical PID and PX4 default controllers were implemented using standard discrete PID blocks available in the PX4 firmware and MATLAB/Simulink (R2025a).
The loop-shaping controllers derived in Section 2 are of relatively high order, containing multiple pole-zero elements. Direct discretization of the complete transfer function was found to introduce numerical distortion due to limit floating-point precision, particularly in high-order denominators. To mitigate this issue, the controller was decomposed into a set of second- or third-order transfer-function factors. Each factor was discretized individually using MATLAB’s function “c2d” with Tustin (bilinear) method:
C d z = c 2 d C s , T s , t u s t i n ,
where the sampling frequency was set to f s = 250   H z   ( T s = 0.004   s ) . the discretized factors were then recombined through multiplication to reconstruct the overall controller in the z -domain.
To minimize numerical error, MATLAB was configured to retain maximum available numerical precision when computing the coefficients of each discretized transfer function. This ensured that the resulting digital implementation faithfully reproduced the intended continuous-time frequency response across the UAV’s relevant operating band ( 10 2 ~ 10 2   r a d / s ).
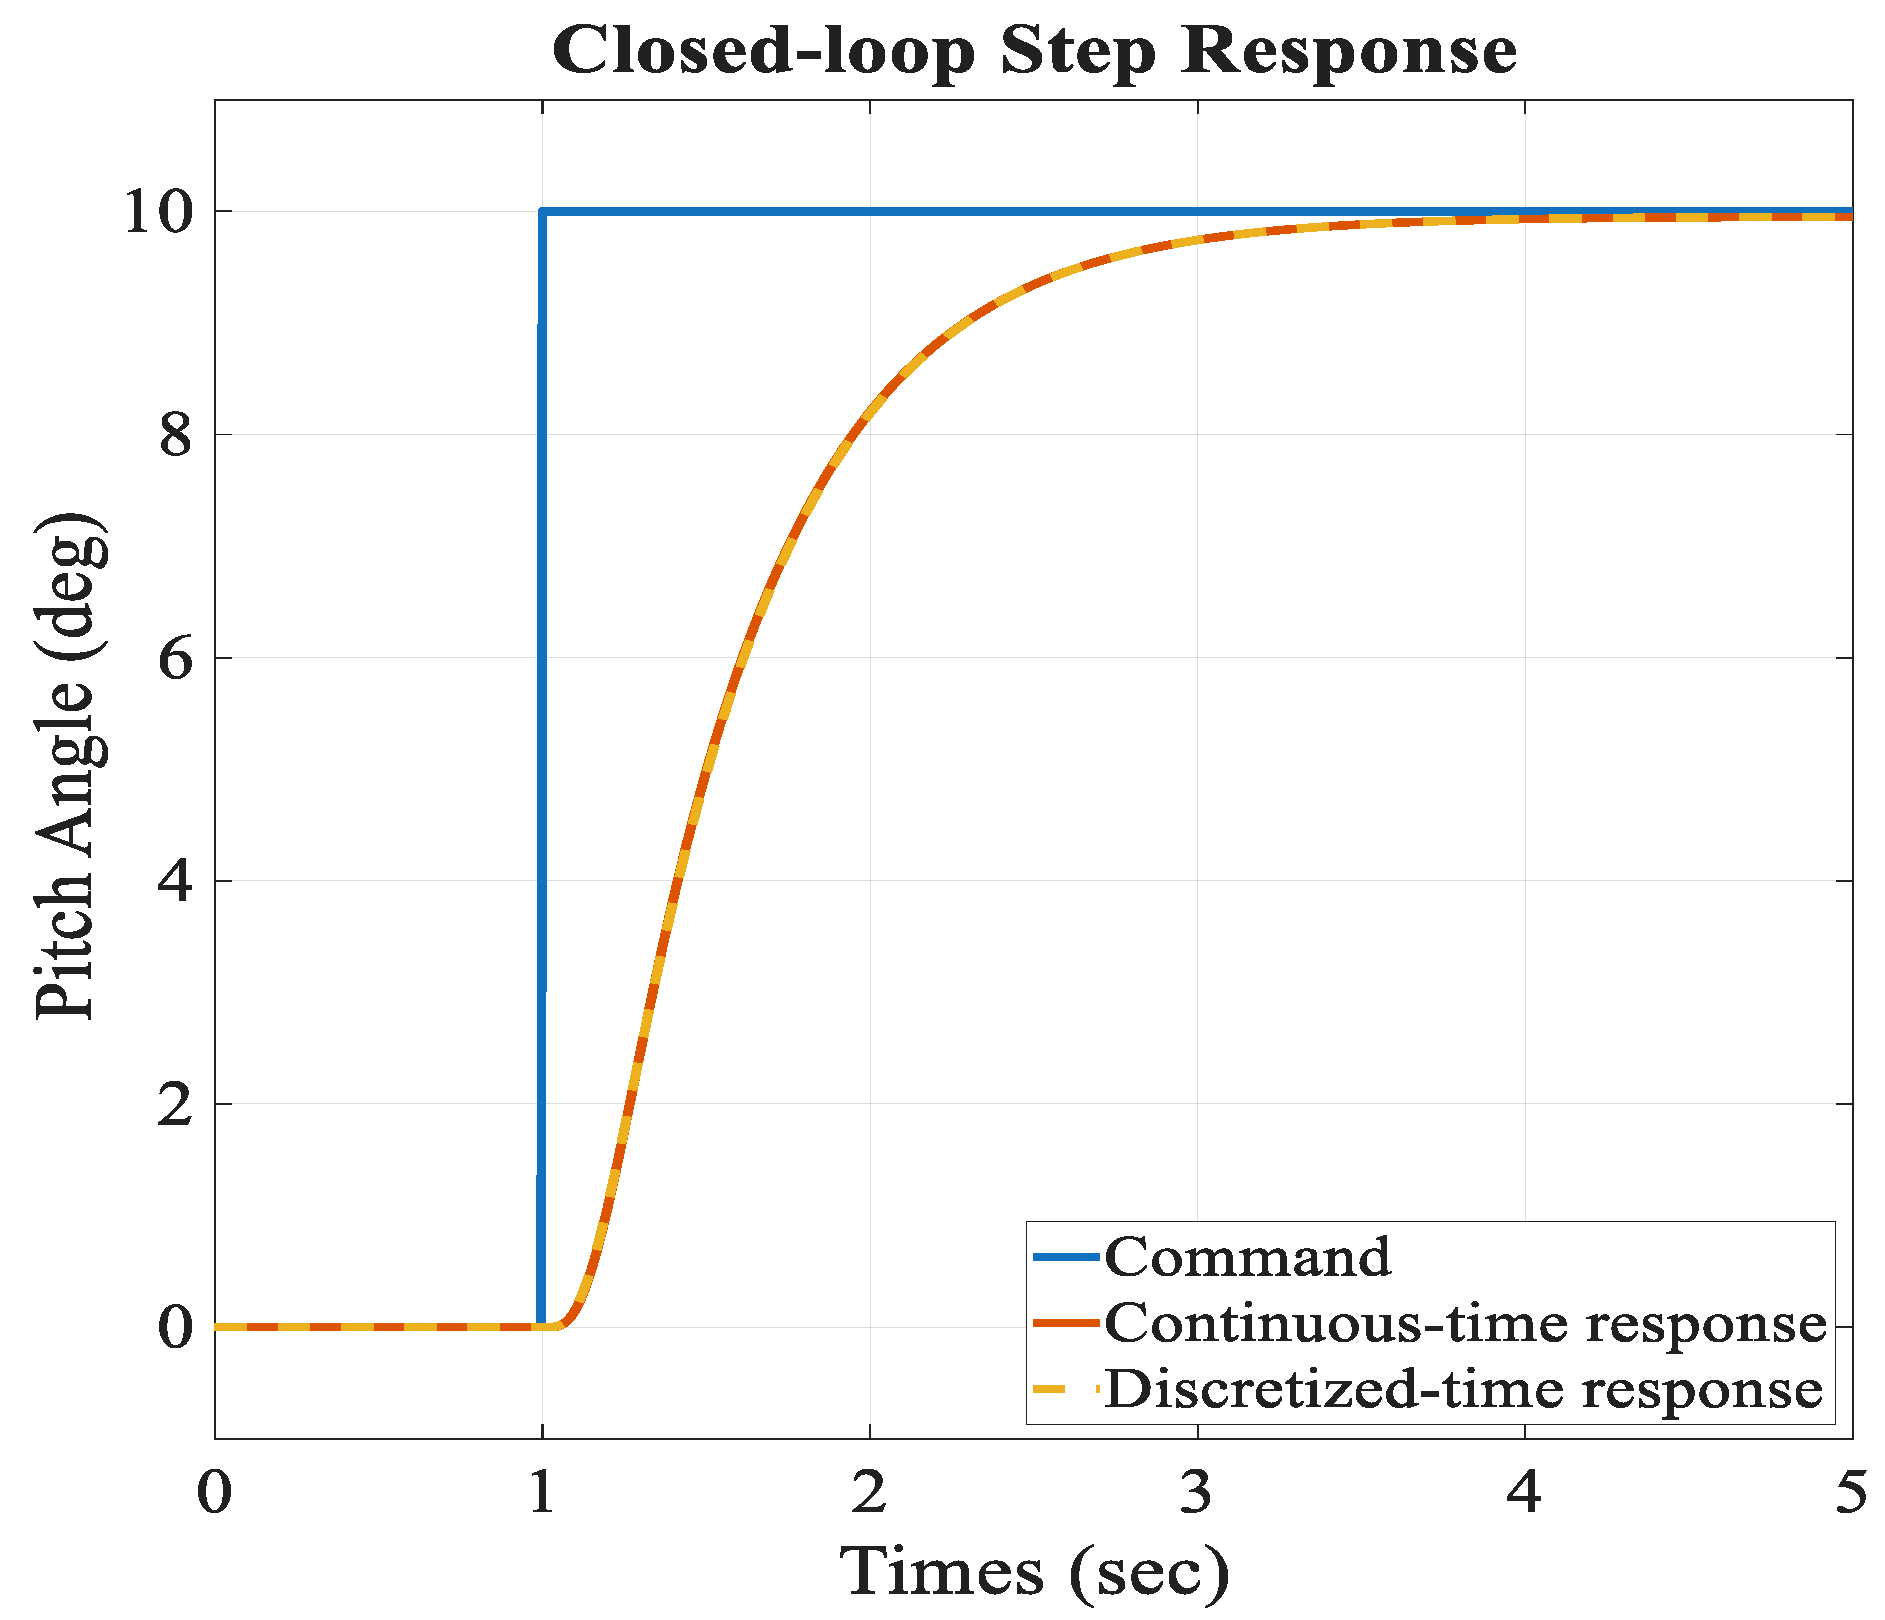
Validation was performed by applying both the continuous-time and discretized loop-shaping controllers to the linearized plant model. The step-response simulations, as illustrated in Figure 8, showed that the continuous-time (orange solid) and discretized-time (yellow dashed) responses are nearly identical in rise time, overshoot, and settling behavior, confirming that the discretization process preserves the intended time–domain dynamics within the aircraft’s operating band.
Figure 8. Closed-loop step responses on the linearized plant comparing the continuous-time loop-shaping controller and its discretized implementation ( T s = 0.004   s , Tustin).
Drones 09 00697 g008

3.2. Linear vs. Nonlinear Validation

After discretization, we evaluated the equivalence of controller performance between the linearized and nonlinear models using the loop-shaping controller. This controller has the most intricate structure among the three considered; therefore, validating its behavior across different model representations is essential to ensure the soundness of the design.
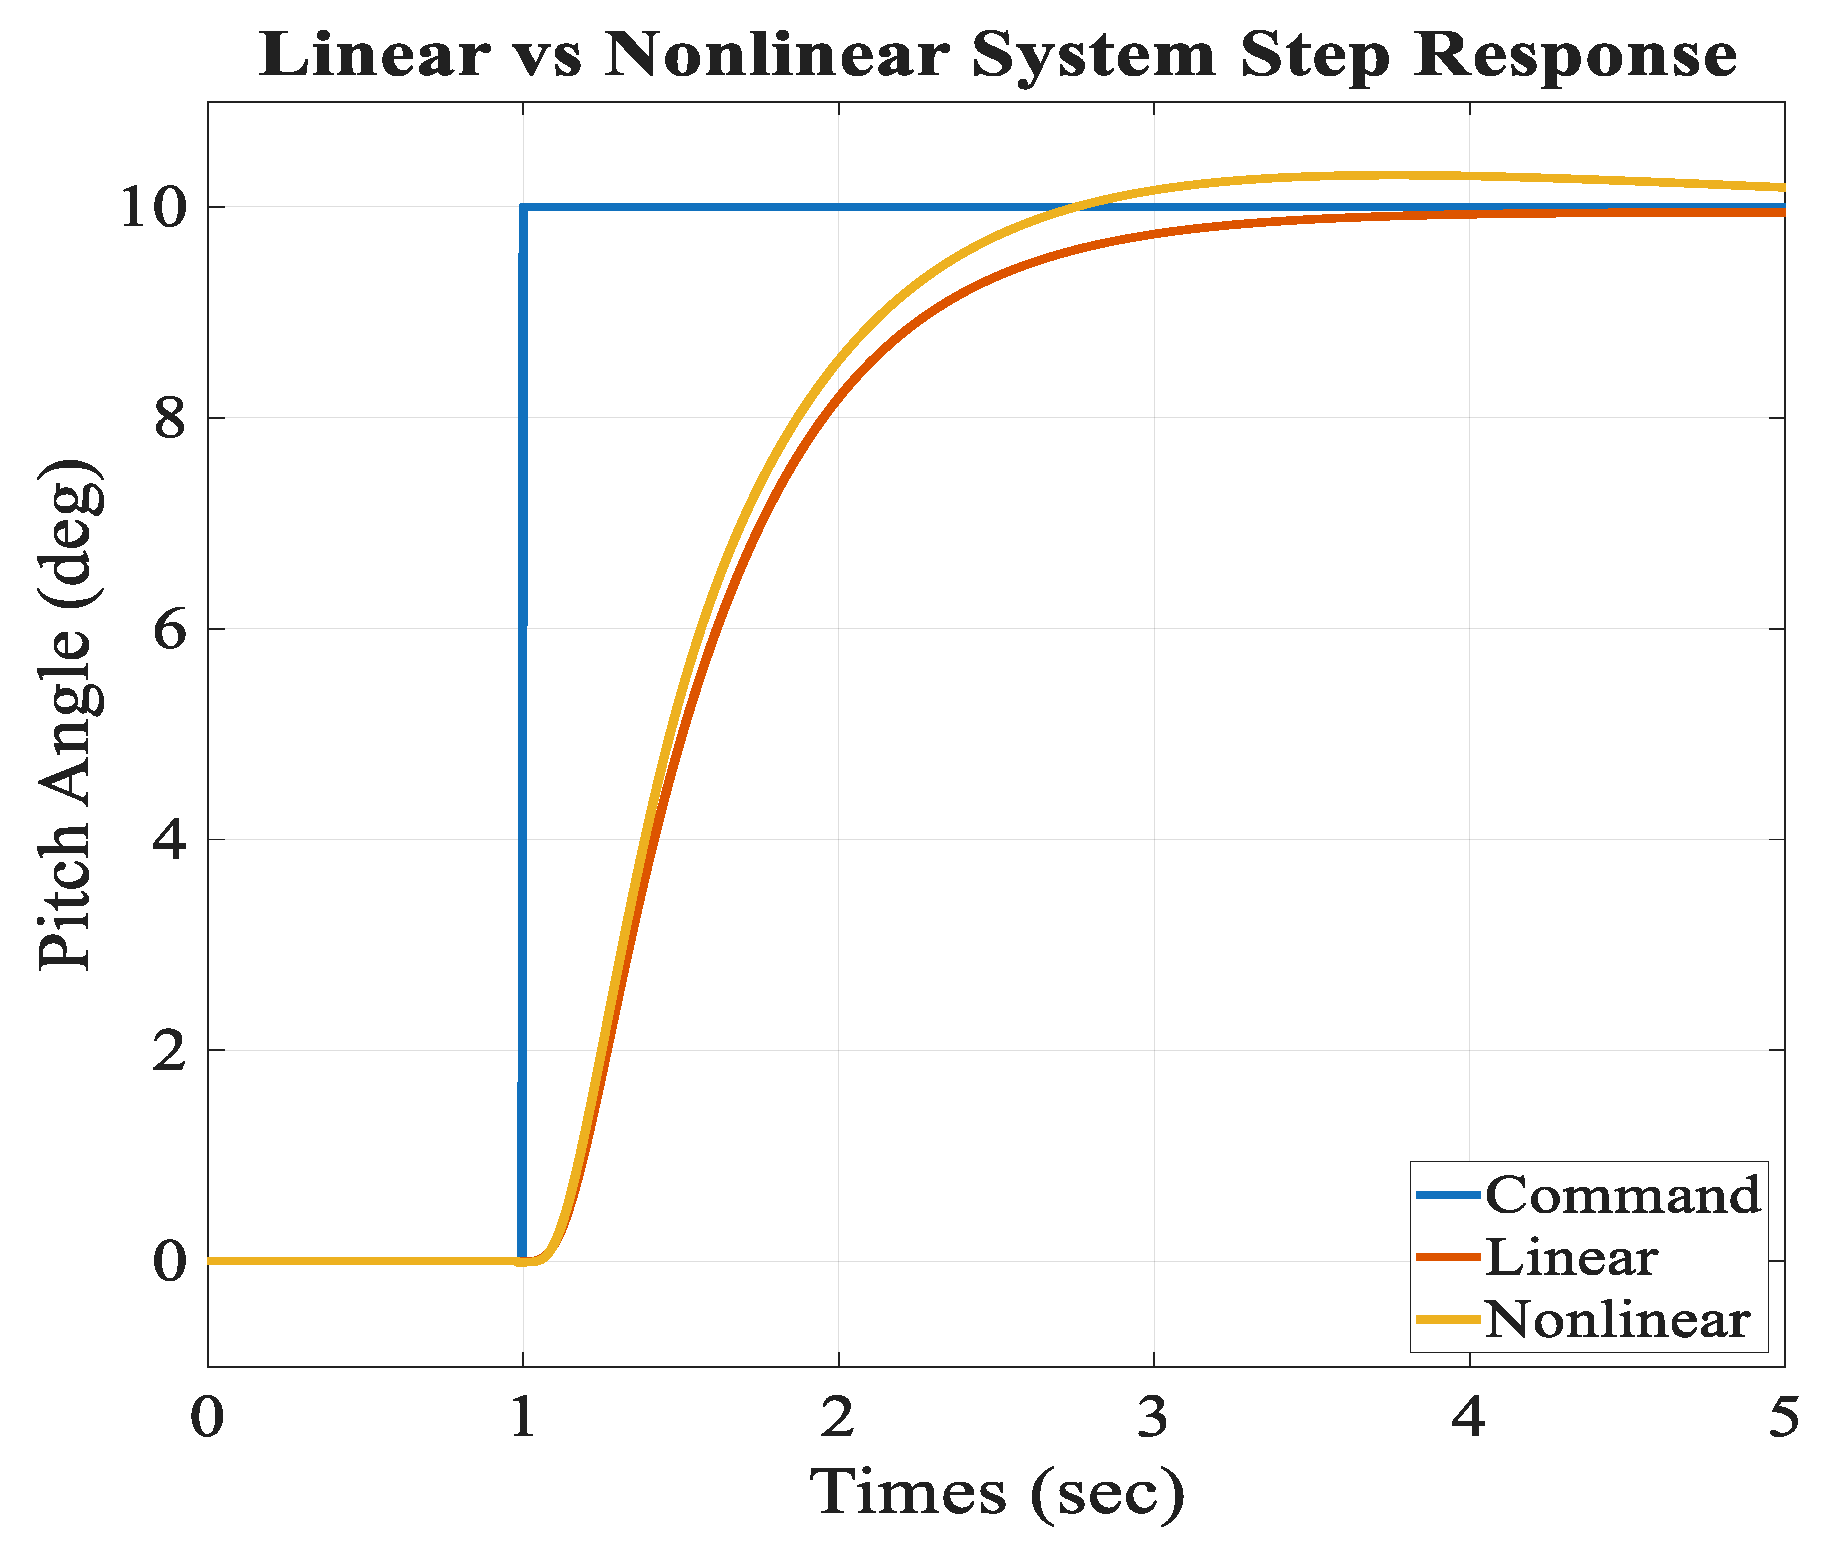
The discretized loop-shaping controller was implemented in both the linearized transfer-function model and the nonlinear six-degree-of-freedom UAV simulation. Attitude step responses were compared, with the linear model serving as the baseline prediction and the nonlinear simulation providing a higher-fidelity representation of the aircraft dynamics. As shown in Figure 9, the two responses closely match in rise time and steady-state tracking, and no oscillations are observed in the nonlinear simulation.
These results indicate that the linearized model offers a reliable foundation for controller synthesis even after discrete-time implementation. The close agreement suggests that the discretization preserved the intended loop-shaping characteristics (e.g., gain/phase margins), and that higher-order dynamics not captured by the reduced model do not materially affect the closed-loop tracking performance under these operating conditions.
Figure 9. Closed-loop attitude step responses comparing the linearized and nonlinear UAV models under the loop-shaping controller.
Drones 09 00697 g009

3.3. Comparison with PX4 Default Controller

To provide a reference baseline, the proposed loop-shaping pitch controller was compared against the PX4 default attitude controller. The default parameters consist of an outer-loop proportional gain and an inner-loop proportional–integral (PI) controller for the pitch rate, which are summarized in Table 5.
Since the design methodology in this work is frequency–domain oriented, the primary performance indicators are the stability margins and closed-loop bandwidth. These quantities are compared in Table 6 for both controllers. The loop-shaping design achieves the intended stability margins and bandwidth, whereas the PX4 default tuning provides only limited frequency–domain guarantees.
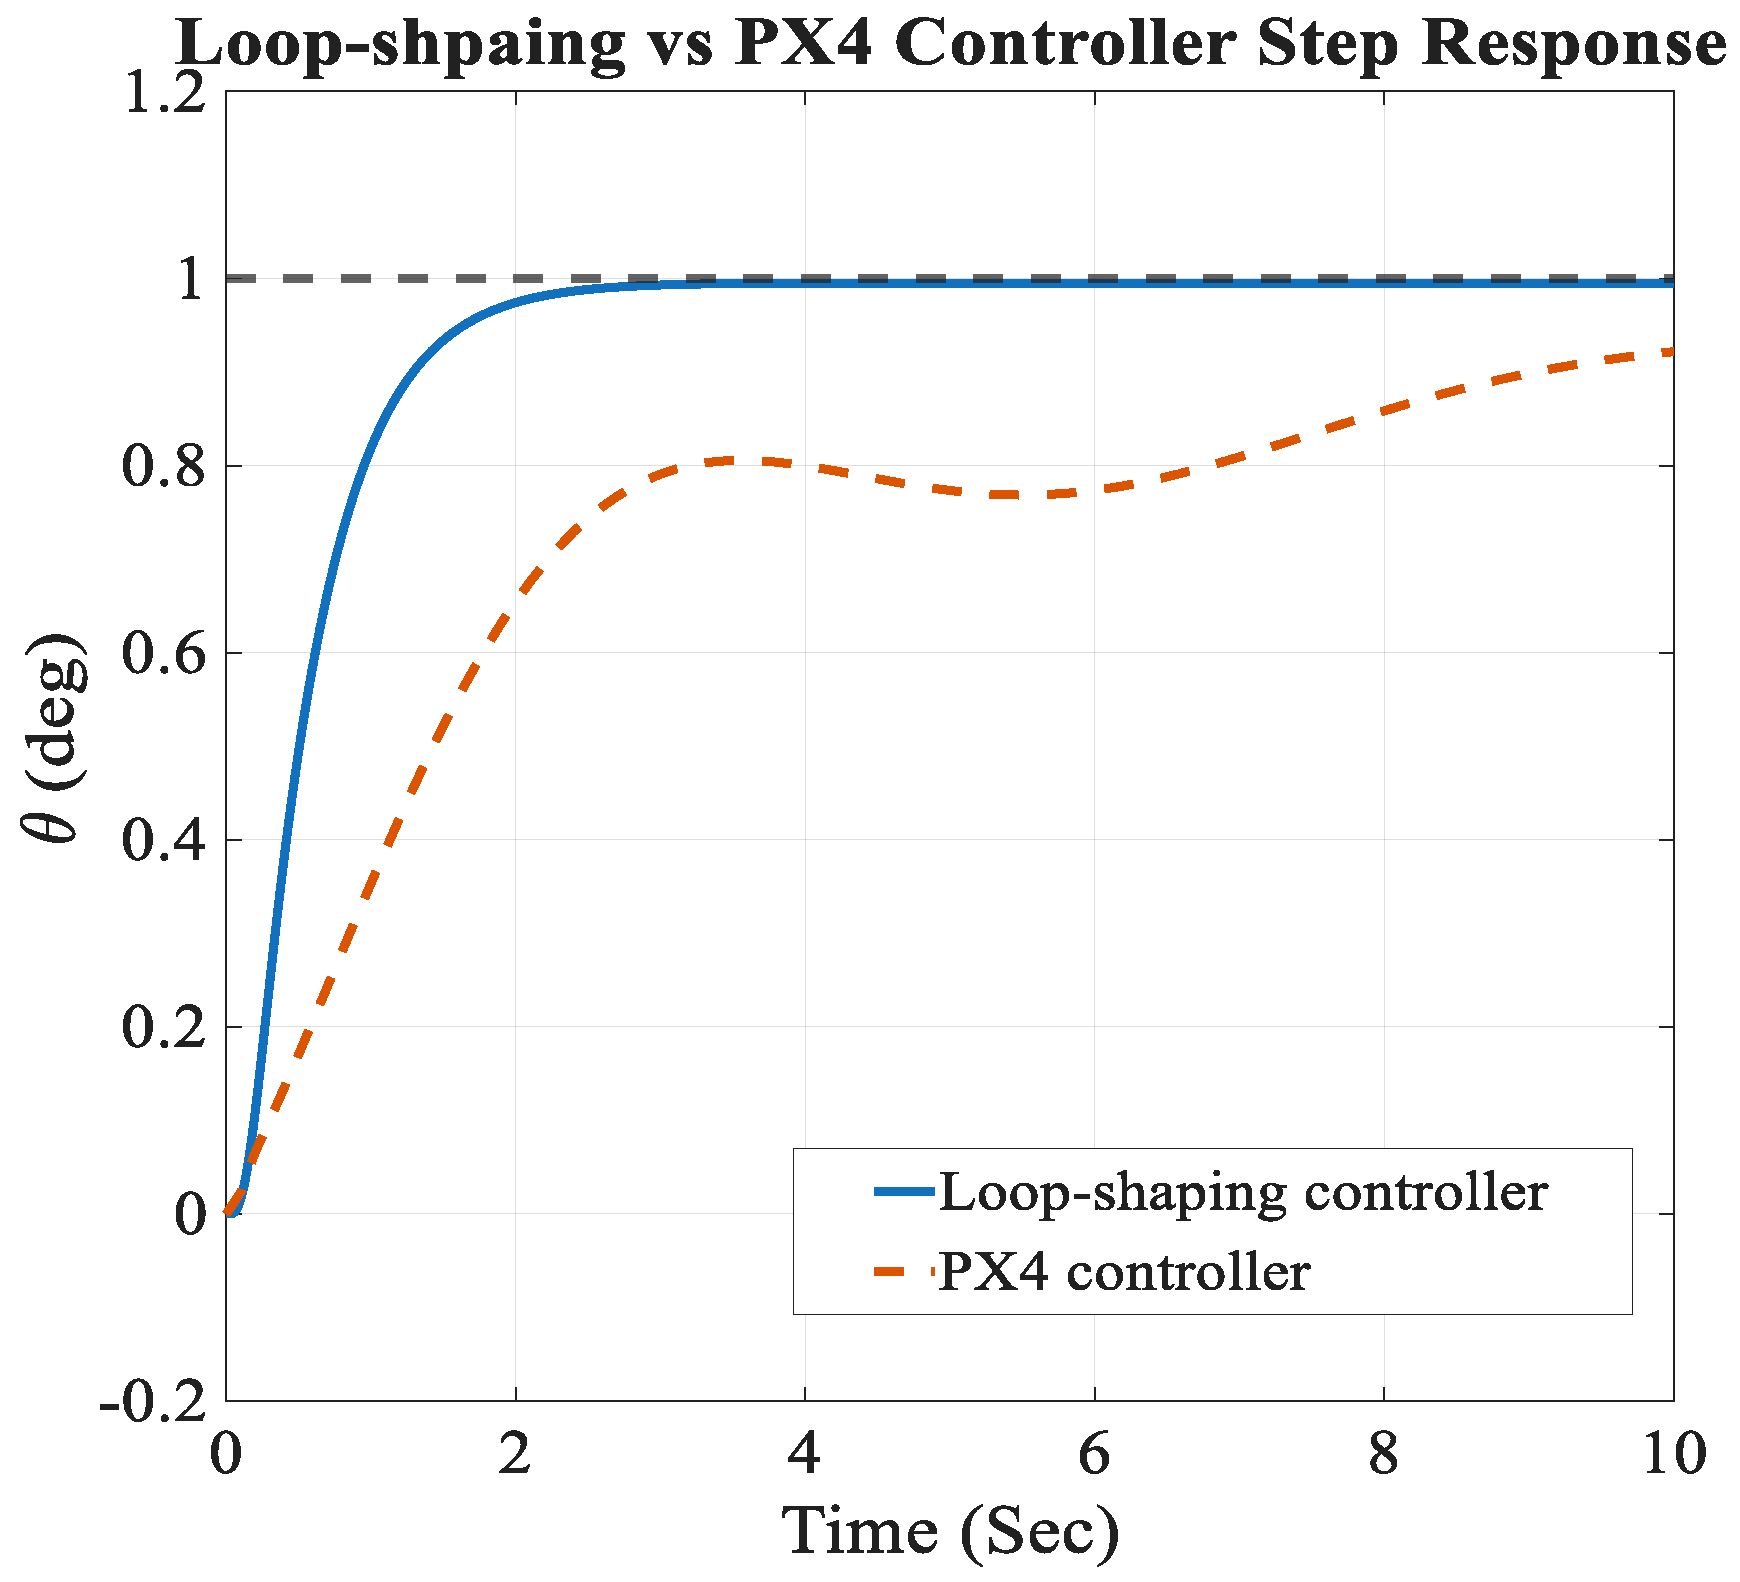
In addition to frequency–domain characteristics, the time–domain behavior was also evaluated. Step response simulations under identical conditions were conducted for both controllers, with the results shown in Figure 10. The quantitative measures of overshoot, rise time, settling time, and steady-state error are summarized in Table 7. The loop-shaping controller demonstrates faster convergence and reduced overshoot, while the PX4 default controller exhibits slower dynamics and larger steady-state error.
These results confirm that the proposed methodology not only provides transparent frequency–domain guarantees but also yields improved transient performance compared to baseline tuning.
Figure 10. Pitch step response comparison between PX4 default controller and proposed loop-shaping controller.
Drones 09 00697 g010

4. Controller Comparison and Flight Test Validation

4.1. Flight Test Platform and Setup

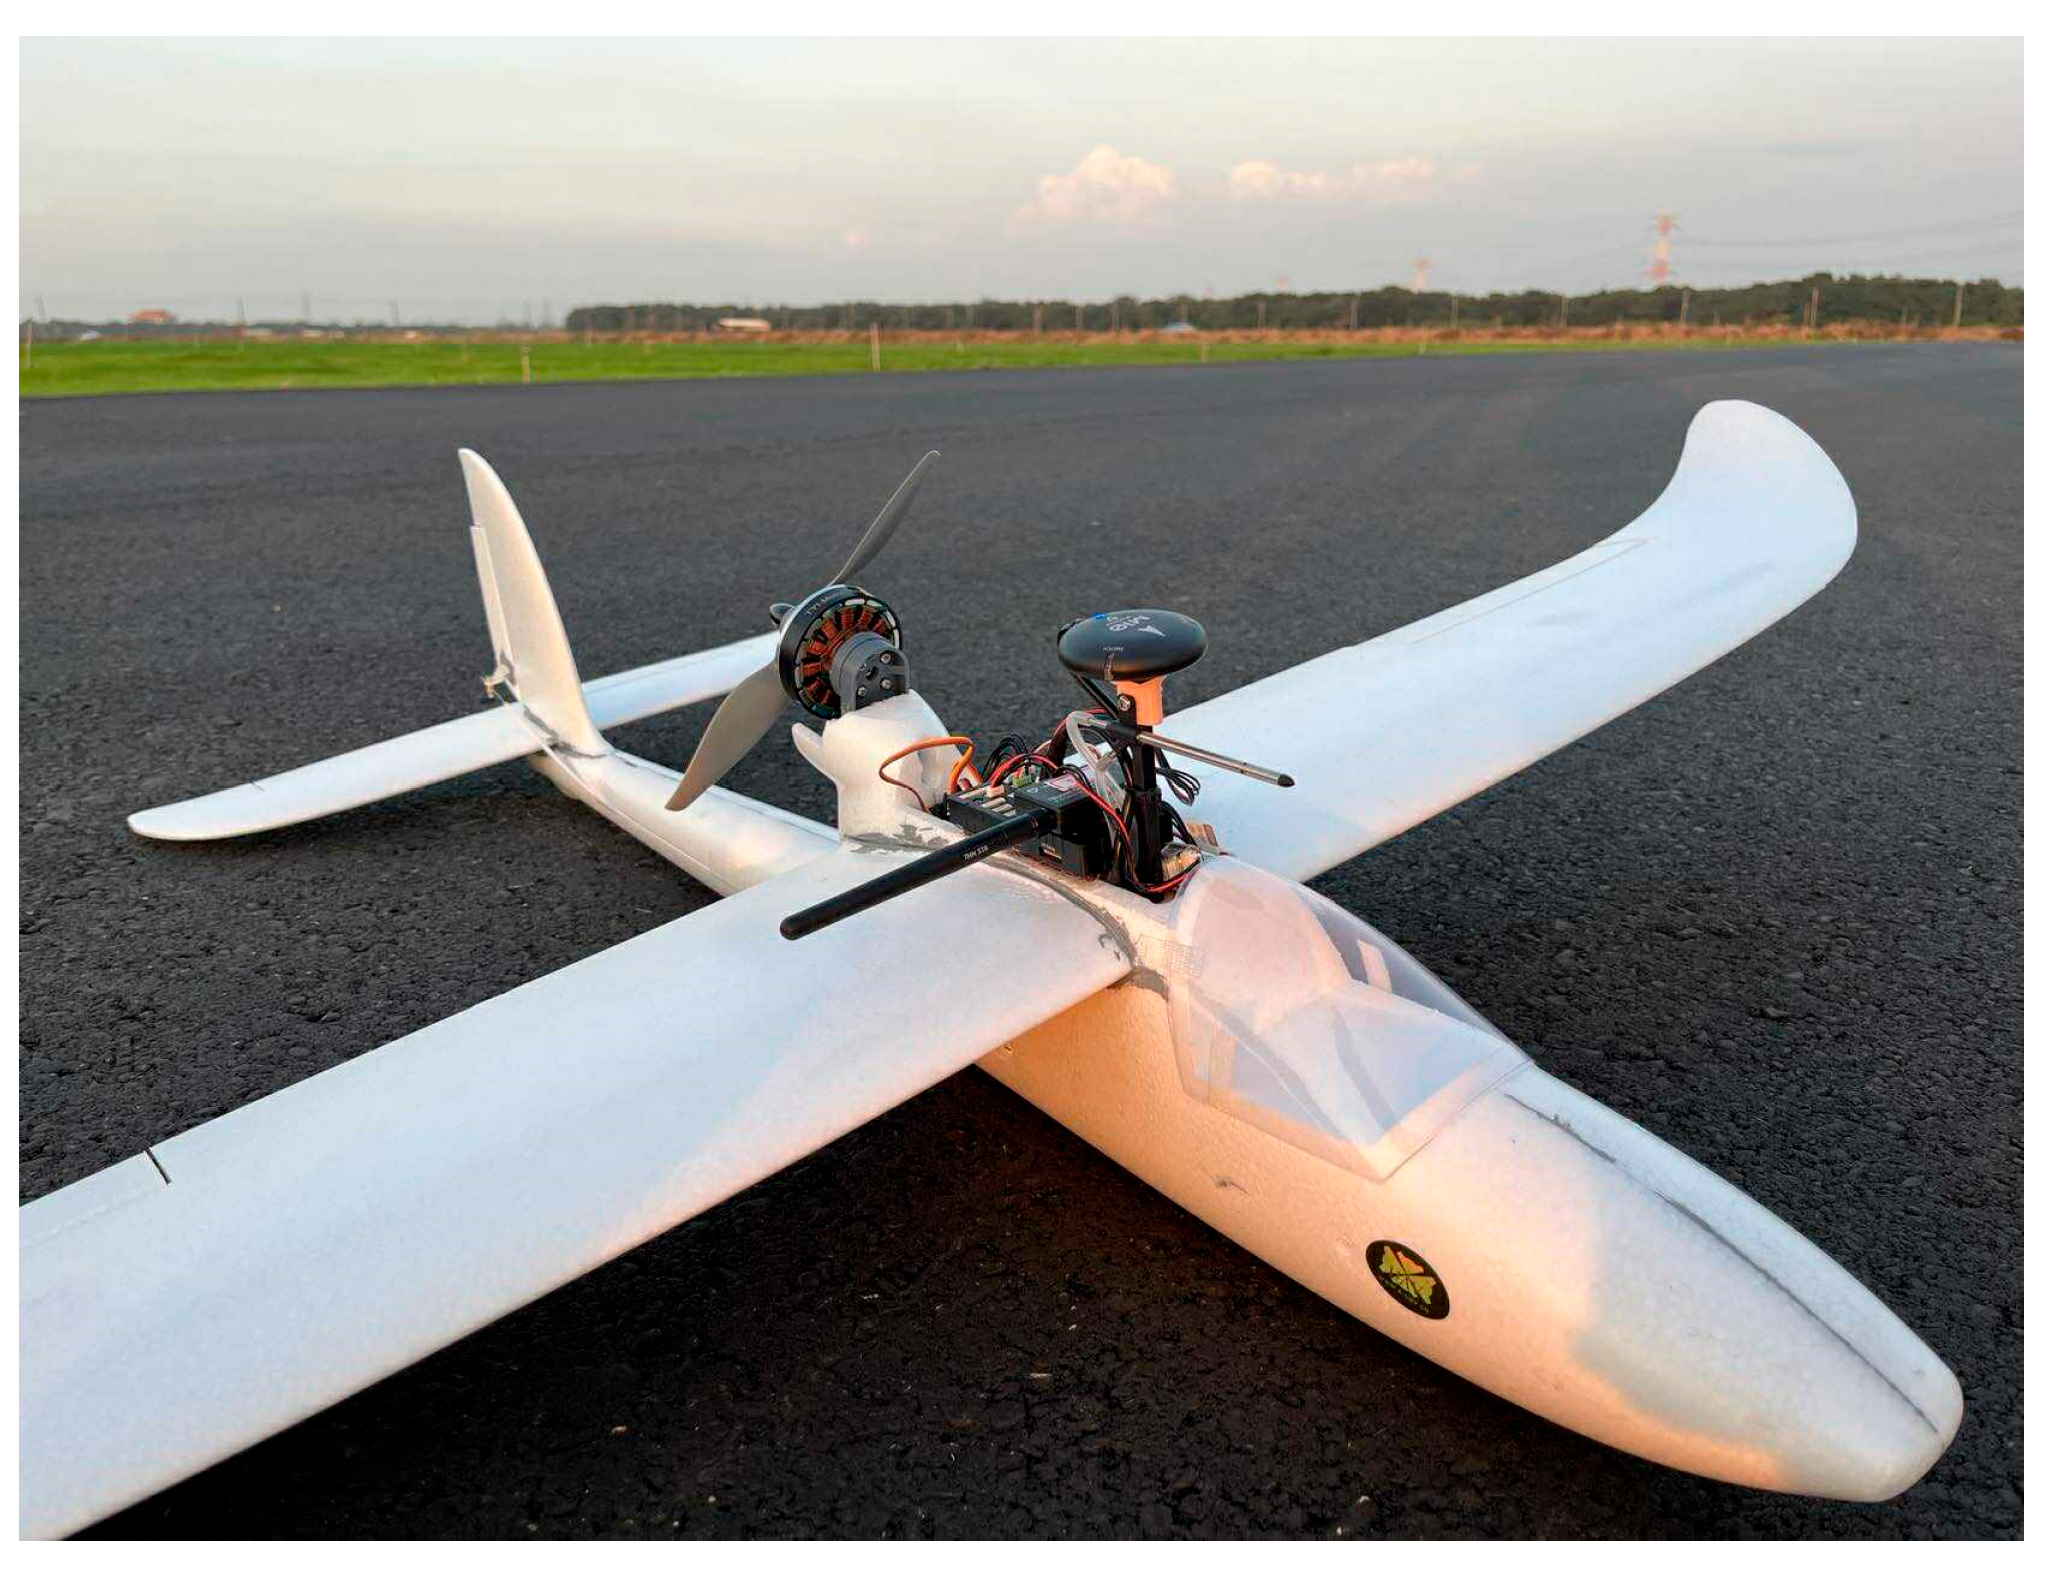
The flight tests were carried out on a Sky Surfer 1400 fixed-wing UAV (X-UAV, Xi’an, China), which has been widely used as a testbed for control research due to its moderate size and stable aerodynamic characteristics. The aircraft has a wingspan of 1.4 m and a conventional tail configuration. Propulsion is provided by an electric pusher motor with a two-blade propeller, and control inputs are achieved through ailerons, elevator, and rudder.
The main geometric specifications of the platform have been reported in [25], and are not repeated here for brevity. For the flight tests in this study, the vehicle was trimmed at V t r i m = 15   m / s ,     h t r i m = 50   m , with an angle of attack of approximately 3 ° . These conditions served as the operating point for linearization and subsequent control design.
The onboard flight control system consisted of a Pixhawk flight controller running PX4 firmware, operating at a control update rate of 250 Hz. The proposed loop-shaping controller was implemented in discrete form using the Tustin method (as detailed in Section 3.2). Sensor feedback included a MEMS-based IMU (gyroscope and accelerometer) and a GPS module, providing the necessary attitude and navigation data.
Flight data were logged using PX4’s onboard ulog logging functionality at 250 Hz. Post-processing and analysis were conducted in MATLAB, where both time–domain responses and frequency–domain metrics were extracted for comparison with simulation results.
Ground testing was performed prior to flight experiments to verify actuator responses, control signal integrity, and safety mechanisms. Each flight was conducted under calm weather conditions at an open test field to minimize environmental disturbances and ensure repeatability of the test scenarios. An overview of the experimental platform is shown in Figure 11.

4.2. Test Scenarios

To evaluate the controllers in real flight, a sequence of pitch step commands was applied to examine both transient and steady-state performance. This test was selected because it provides a direct and repeatable way to verify attitude-tracking behavior while also stressing the closed-loop system across a range of input amplitudes.
In this scenario, a series of alternating positive and negative step inputs in pitch attitude was commanded. This maneuver allows evaluation of the controller’s ability to track rapid changes in reference attitude, while highlighting dynamic properties such as rise time, overshoot, settling time, and steady-state error. Compared with single isolated steps, the continuous sequence of alternating commands places additional demands on the control system by forcing it to repeatedly reverse its response direction within short time intervals.
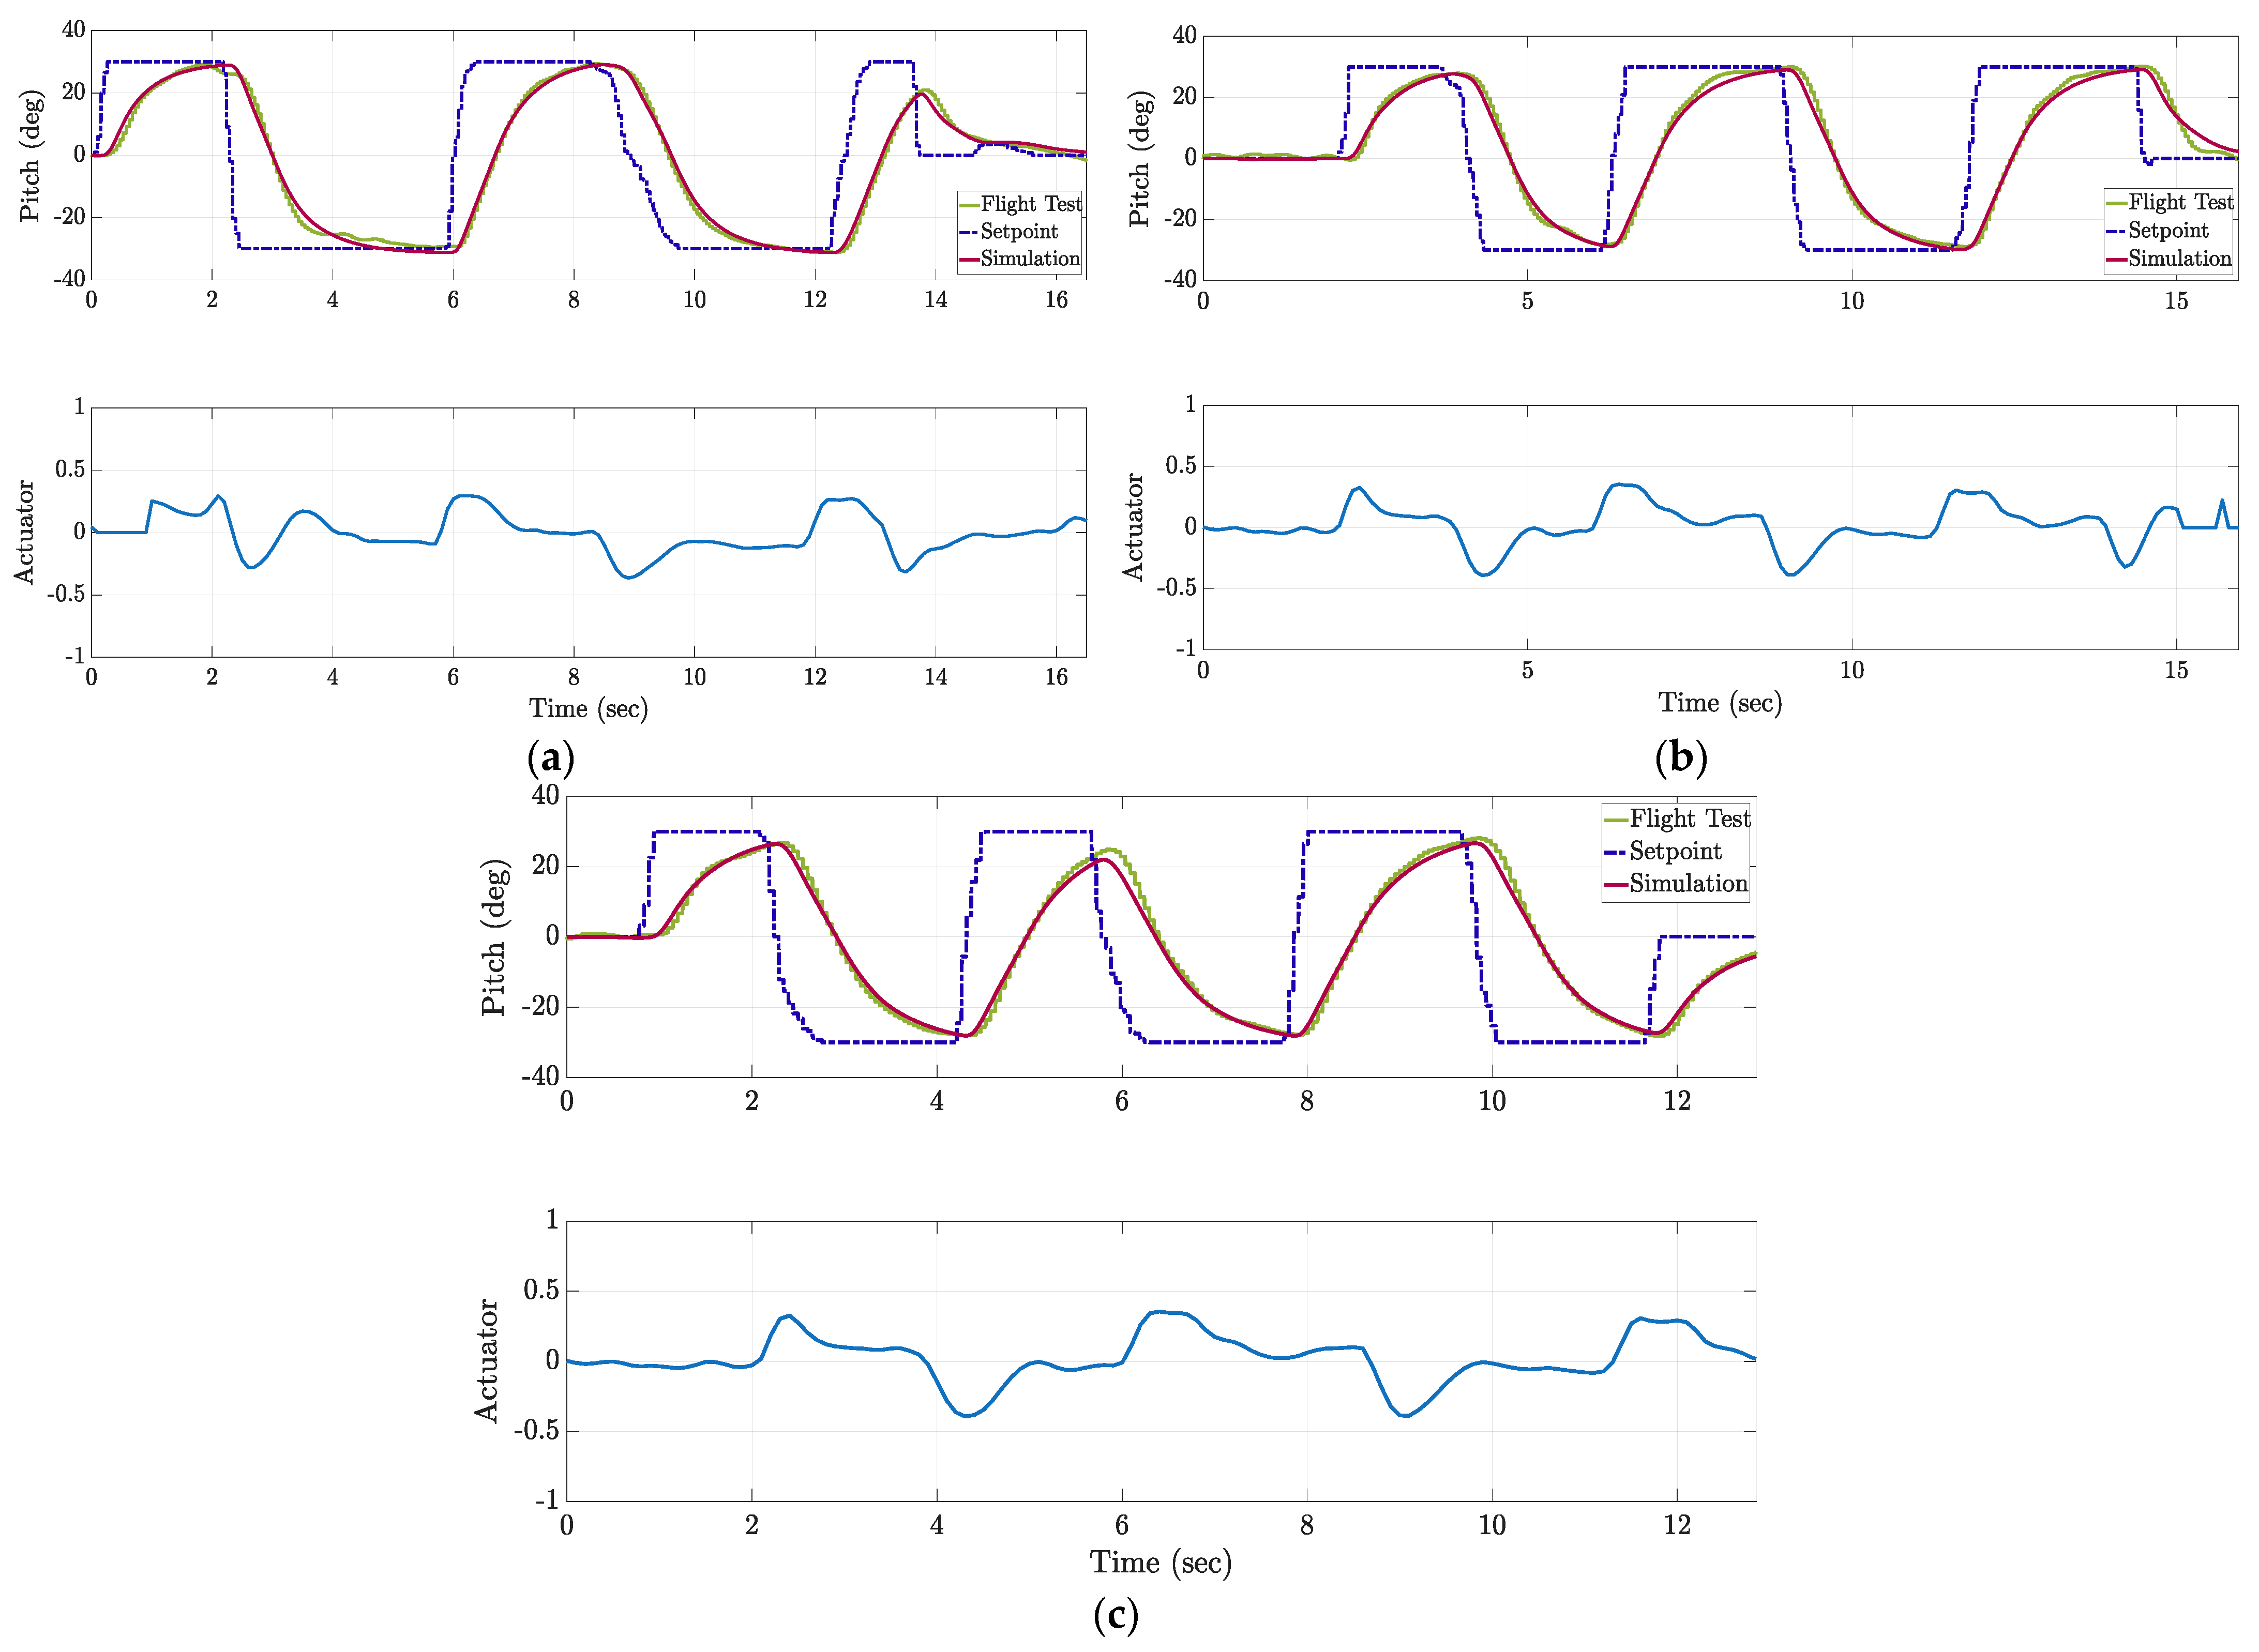
As shown in Figure 12, both the simulation and the flight test results exhibit close agreement in terms of transient response and steady-state tracking. Minor discrepancies appear primarily during rapid reversals, where unmodeled dynamics and actuator nonlinearities are more influential. The lower subplot illustrates the corresponding actuator deflections, which remain well within their operational limits, indicating that the control allocation is effective and no saturation is encountered during the maneuver.
All tests were conducted within the safe operating envelope of the airframe, with command amplitudes chosen to balance excitation of the system dynamics against safety considerations. This test scenario provides a concise yet stringent benchmark for validating controller performance in both simulation and real flight.
Figure 11. The Sky Surfer 1400 fixed-wing UAV (X-UAV, Xi’an, China) used as the experimental platform [28].
Drones 09 00697 g011

4.3. Simulation vs. Flight Test Results

The flight tests were conducted primarily to verify the feasibility of implementing the designed controller on the physical UAV platform, rather than to demonstrate absolute performance superiority. Simulations provide detailed insight into closed-loop dynamics under controlled conditions. Real-world flights, in contrast, confirm that the discretized controllers can operate reliably within hardware, environmental, and operational constraints.
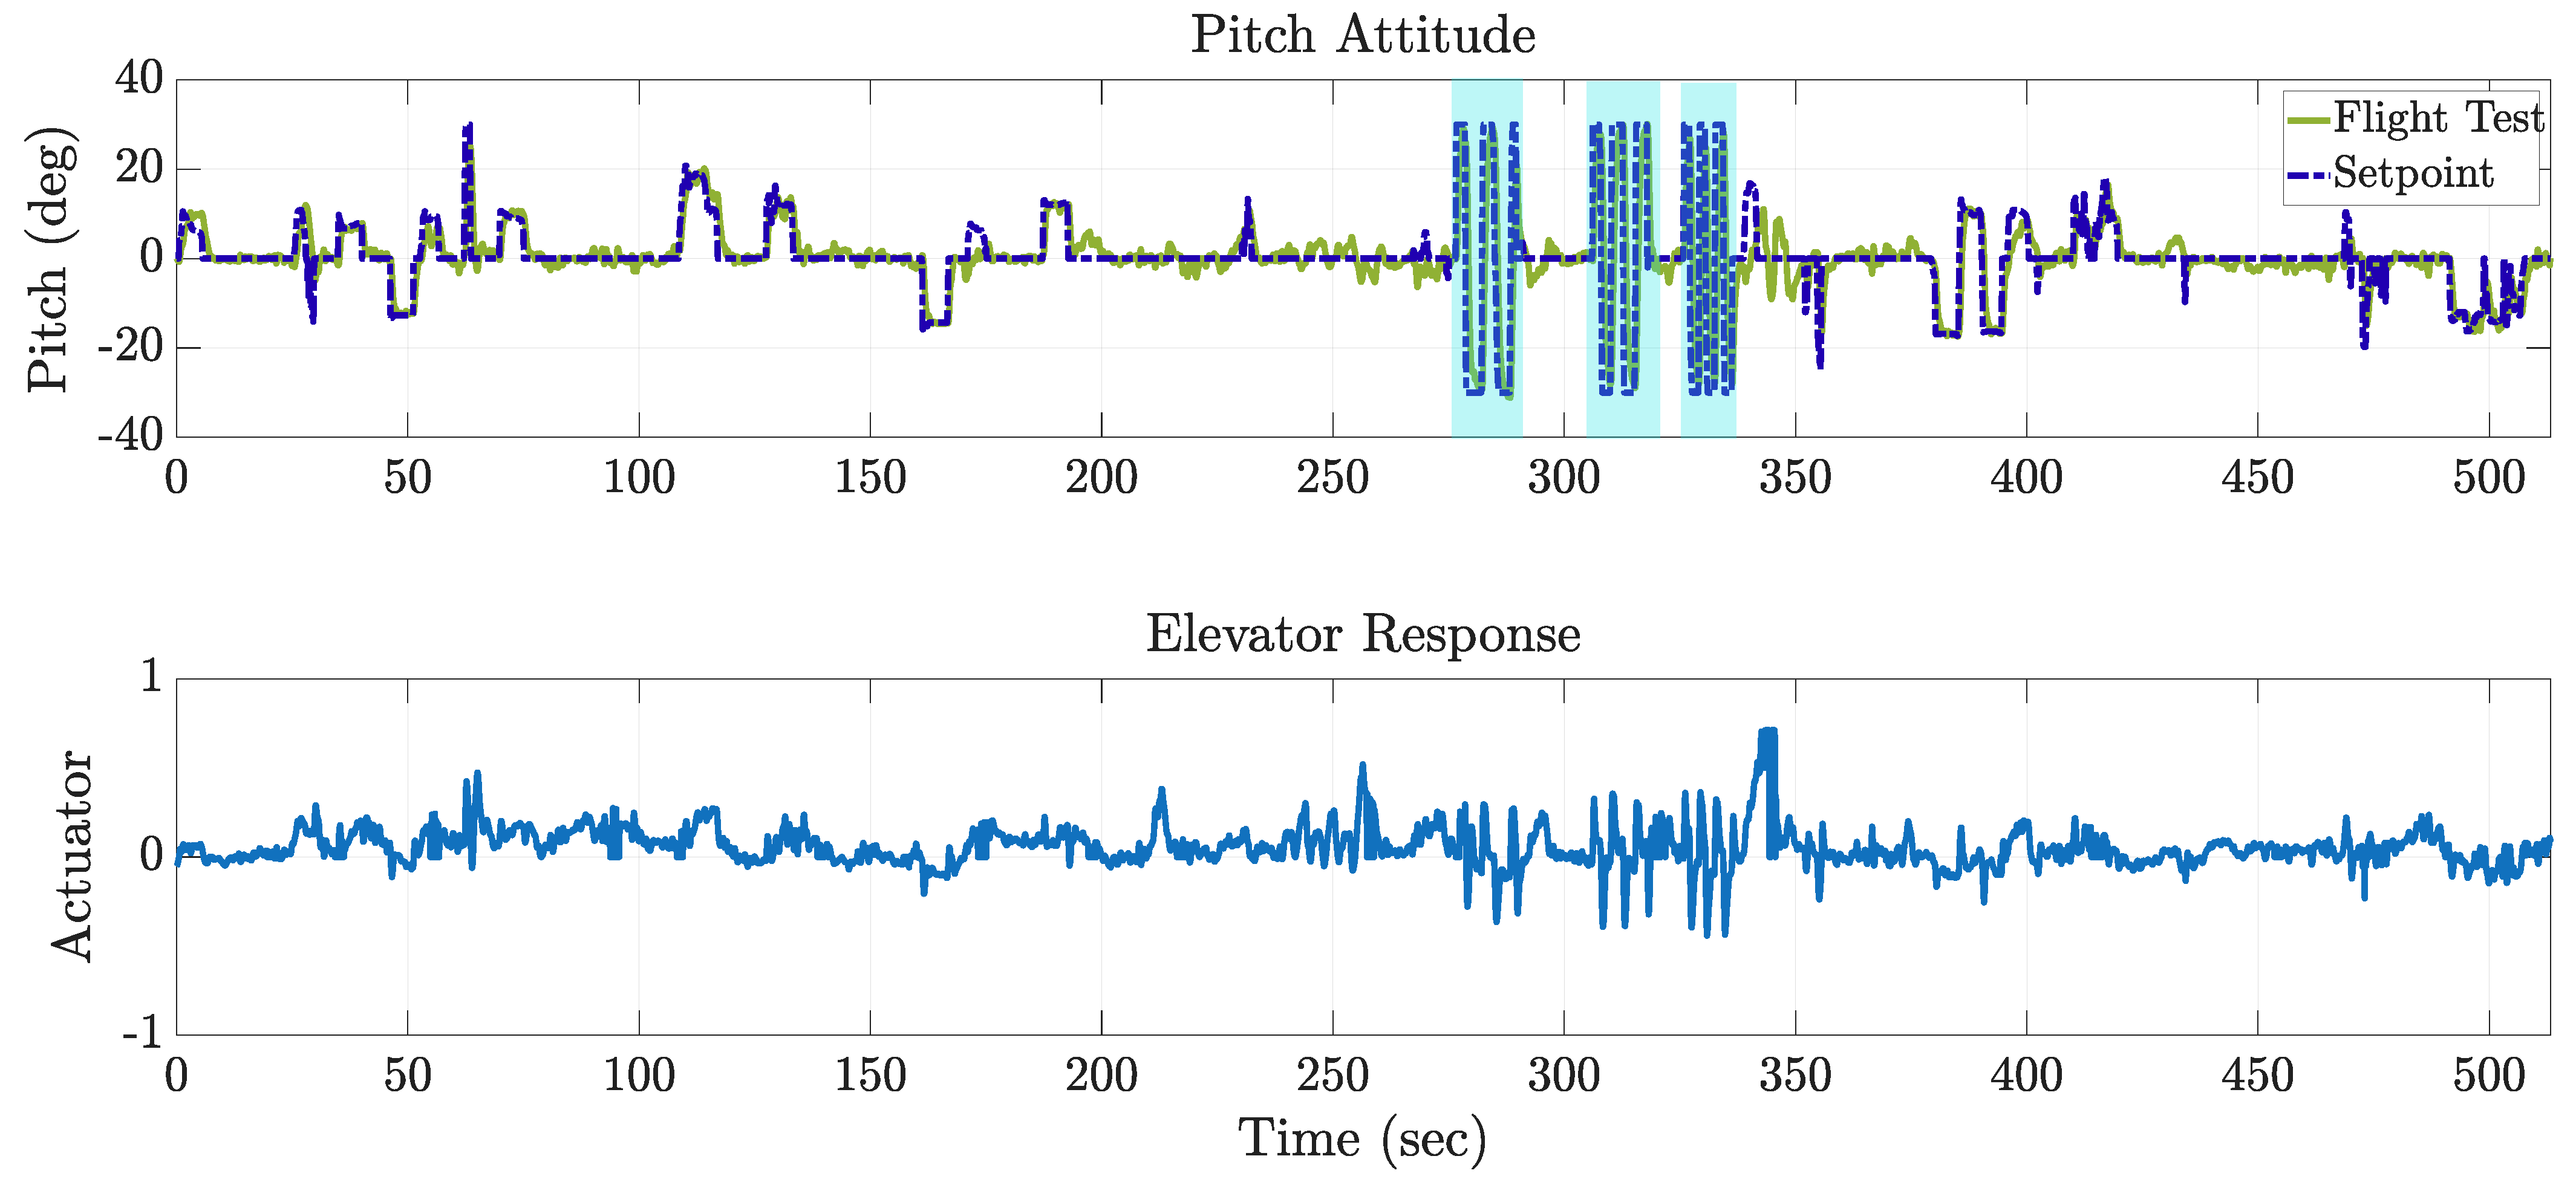
To better illustrate the actual flight scenarios, Figure 13 presents the time history of the pitch attitude during a representative flight test. This figure provides a clear overview of the executed test maneuvers and complements the scenario descriptions, offering a direct connection between the commanded pitch inputs and the corresponding vehicle response. In addition, Figure 13 also highlights three representative time segments that were extracted from the overall flight test data. These segments correspond to distinct pitch maneuvers and are subsequently presented in detail in the following figures.
For the test scenario described in Section 4.2, both simulation and flight test results were recorded for the pitch attitude channel. A representative example is shown in Figure 13, where a sequence of alternating pitch step commands is applied. The results demonstrate that the overall tracking trends observed in simulation are reproducible in flight. Minor differences are primarily attributable to environmental disturbances (e.g., wind gusts) and sensor noise not represented in the simulation.
Despite these differences, the proposed loop-shaping controller consistently maintained stable closed-loop behavior during flight. This confirms that the controller is not only theoretically valid in the design domain but also practically feasible when deployed on a real UAV platform.
To quantitatively evaluate the agreement between simulation and flight validation, Table 8 summarizes the performance metrics of pitch step responses. Both simulation and flight test results are included for overshoot, rise time, settling time, and steady-state error. The results show that the loop-shaping controller maintains consistent behavior across simulation and real flight, with small discrepancies attributable to environmental disturbances and sensor noise.
Figure 12. Pitch attitude step-response validation under repeated test sequences. (a) Test sequence 1. (b) Test sequence 2. (c) Test sequence 3.
Drones 09 00697 g012
Figure 13. Pitch attitude time history during a representative flight test, showing consecutive pitch step inputs and the corresponding responses.
Drones 09 00697 g013

5. Conclusions

5.1. Summary of Findings

This work presented the design and verification of an attitude controller for a fixed-wing UAV, emphasizing the application of loop-shaping methodology to the inner angular-rate loop. A systematic process was established to construct target transfer functions that satisfy phase margin, gain margin, and bandwidth requirements, and to synthesize controllers through sequential pole–zero placement and compensator tuning.
The designed loop-shaping controller was discretized and implemented on a fixed-wing UAV platform. Verification involved frequency- and time–domain analyses, comparison between continuous- and discrete-time implementations, and validation across both linearized and nonlinear models. Flight tests further confirmed the feasibility of deploying the proposed controller within the PX4 autopilot framework.
The main findings can be summarized as follows:
  • The loop-shaping approach is feasible for small UAV applications, preserving the intended frequency–domain characteristics after discretization.
  • Linear and nonlinear simulations show consistent closed-loop behavior in terms of rise time, settling time, and steady-state accuracy.
  • The method offers a structured workflow that directly links design objectives to closed-loop dynamics, providing advantages over conventional PID tuning commonly adopted in UAV autopilots.

5.2. Practical Implications for UAV Control Design

The results highlight the practical value of loop shaping as an alternative to empirical PID tuning for UAV attitude control. PID controllers remain widely used because of their simplicity and ease of implementation. However, their tuning is often empirical and may not guarantee compliance with multiple frequency–domain requirements. By contrast, loop shaping provides a structured and transparent workflow in which stability margins, bandwidth, and disturbance-rejection objectives are explicitly embedded in the design.
For UAV practitioners, this approach offers several advantages. First, it reduces reliance on ad hoc tuning by providing an intuitive yet systematic design process. Second, the controllers can be implemented in discrete form within widely used autopilot frameworks such as PX4, ensuring compatibility with existing hardware and software infrastructure. Third, by shaping the open-loop dynamics directly, the method enables traceability of performance outcomes back to specific design objectives, which is valuable for certification and reproducibility.
Overall, the study demonstrates that loop shaping is both theoretically rigorous and practically deployable for small fixed-wing UAVs. It effectively bridges the gap between frequency–domain design principles and real-world implementation, enhancing the reliability of UAV control system development.

5.3. Future Research Directions

Future research could also integrate loop-shaping objectives with established handling-quality standards. For example, short-period damping ratio and natural frequency requirements defined in MIL-F-8785C for fixed-wing aircraft, or bandwidth and phase delay guidelines from ADS-33E for rotorcraft, could be embedded directly into the target transfer function design. This would enable the loop-shaping process to simultaneously address stability margins and handling-quality requirements, ensuring that the resulting controllers are not only robust but also compliant with widely accepted flying-quality standards. In the current approach, handling qualities are verified as a post-design step. Future research could instead formulate closed-loop guidelines that inherently satisfy requirements such as short-period damping, natural frequency, and phase/gain margins. This would yield controllers that are simultaneously optimized for robustness and compliance with pilot-oriented performance standards.
In addition, the present study focused on pitch-rate dynamics. Future efforts may generalize the method to the full three-axis attitude system. A broader flight-test campaign under varying flight conditions would also provide valuable validation of the robustness and scalability of the proposed approach.

Supplementary Materials

The following supporting information can be downloaded at: https://www.mdpi.com/article/10.3390/drones9100697/s1, Video S1: fixed-wing flight experimental validation.

Author Contributions

Conceptualization, N.-W.Z. and C.-C.P.; methodology, N.-W.Z. and C.-C.P.; software, N.-W.Z.; validation, N.-W.Z. and C.-C.P.; formal analysis, N.-W.Z.; investigation, N.-W.Z.; resources, C.-C.P.; data curation, N.-W.Z.; writing—original draft preparation, N.-W.Z.; writing—review and editing, N.-W.Z. and C.-C.P.; visualization, N.-W.Z.; supervision, C.-C.P.; project administration, C.-C.P.; funding acquisition, C.-C.P. All authors have read and agreed to the published version of the manuscript.

Funding

This work was supported by the National Science and Technology Council (NSTC) under Grant No. NSTC 111-2923-E-006-004-MY3, 112-2221-E-006-104 -MY3 and 113-2218-E-006 -021.

Data Availability Statement

The data presented in this study are available on request from the corresponding author.

Conflicts of Interest

The authors declare no conflicts of interest.

Abbreviations

TOFTarget Open-loop Function

Appendix A

This appendix and Supplementary Materials complement the controller design and validation results presented in the main text. It includes detailed loop-shaping design steps and Supplementary Materials for reproducibility.

Stepwise Bode Plots of the Pitch Rate Loop-Shaping Design Procedure

Figure A1. Bode plots of the longitudinal plant and the target open-loop guideline. (a) Plant (blue) vs. target guideline (red). (b) Plant (blue), plant after conjugate-pair cancelation (yellow), and target guideline (red).
Drones 09 00697 g0a1
Figure A2. Stepwise loop-shaping in the low-frequency region. (a) Comparison after conjugate-pair cancelation and insertion of a pure pole 1 / s . (b) Effect of adding a single zero at ω z 0.01378   r a d / s .
Drones 09 00697 g0a2
Figure A3. Stepwise loop-shaping in the mid-frequency region. (a) Effect of inserting a pole for phase shaping. (b) Effect of a lead compensator correcting the nearly constant phase gap.
Drones 09 00697 g0a3
Figure A4. Stepwise loop-shaping in the high-frequency region. (a) Comparison before and after adding the third-order roll-off cluster. (b) Final compensated system vs. target open-loop function.
Drones 09 00697 g0a4

References

  1. Ho, W.K.; Hang, C.C.; Cao, L.S. Tuning of PID controllers based on gain and phase margin specifications. Automatica 1995, 31, 497–502. [Google Scholar] [CrossRef]
  2. PX4 Autopilot User Guide. Available online: https://docs.px4.io (accessed on 3 October 2025).
  3. Bouabdallah, S.; Murrieri, P.; Siegwart, R. Design and control of an indoor micro quadrotor. In Proceedings of the IEEE International Conference on Robotics and Automation, 2004. Proceedings. ICRA’04. 2004, New Orleans, LA, USA, 26 April–1 May 2004; pp. 4393–4398. [Google Scholar]
  4. Wang, Z.; Yuan, Q.; Zhu, Y.; Hu, Y.; Chen, H.; Xie, X.; Gu, W. Fast and Intelligent Proportional–Integral–Derivative (PID) Attitude Control of Quadrotor and Dual-Rotor Coaxial Unmanned Aerial Vehicles (UAVs) Based on All-True Composite Motion. Drones 2024, 8, 747. [Google Scholar] [CrossRef]
  5. Bolandi, H.; Rezaei, M.; Mohsenipour, R.; Nemati, H.; Smailzadeh, S.M. Attitude control of a quadrotor with optimized PID controller. Intell. Control. Autom. 2013, 4, 342–349. [Google Scholar] [CrossRef]
  6. Doyle, J.; Glover, K.; Khargonekar, P.; Francis, B. State-space solutions to standard H2 and H control problems. In Proceedings of the 1988 American Control Conference, Atlanta, GA, USA, 15–17 June 1988; pp. 1691–1696. [Google Scholar]
  7. Kouvaritakis, B.; Cannon, M. Model predictive control. Switz. Springer Int. Publ. 2016, 38, 7. [Google Scholar]
  8. Garcia, C.E.; Prett, D.M.; Morari, M. Model predictive control: Theory and practice—A survey. Automatica 1989, 25, 335–348. [Google Scholar] [CrossRef]
  9. Morari, M.; Lee, J.H. Model predictive control: Past, present and future. Comput. Chem. Eng. 1999, 23, 667–682. [Google Scholar] [CrossRef]
  10. Schwenzer, M.; Ay, M.; Bergs, T.; Abel, D. Review on model predictive control: An engineering perspective. Int. J. Adv. Manuf. Technol. 2021, 117, 1327–1349. [Google Scholar] [CrossRef]
  11. Latif, Z.; Shahzad, A.; Bhatti, A.I.; Whidborne, J.F.; Samar, R. Autonomous landing of an UAV using H based model predictive control. Drones 2022, 6, 416. [Google Scholar] [CrossRef]
  12. Hui, N.; Guo, Y.; Han, X.; Wu, B. Robust H-Infinity Dual Cascade MPC-Based Attitude Control Study of a Quadcopter UAV. Actuators 2024, 13, 392. [Google Scholar] [CrossRef]
  13. Houpis, C.H.; Rasmussen, S.J.; Garcia-Sanz, M. Quantitative Feedback Theory: Fundamentals and Applications; CRC Press: Boca Raton, FL, USA, 1999. [Google Scholar]
  14. Akyurek, S.; Kaynak, U.; Kasnakoglu, C. Altitude control for small fixed-wing aircraft using H loop-shaping method. IFAC-PapersOnLine 2016, 49, 111–116. [Google Scholar] [CrossRef]
  15. Akyurek, S.; Ozden, G.S.; Kurkcu, B.; Kaynak, U.; Kasnakoglu, C. Design of a flight stabilizer for fixed-wing aircrafts using H loop shaping method. In Proceedings of the 2015 9th International Conference on Electrical and Electronics Engineering (ELECO), Bursa, Turkey, 26–28 November 2015; pp. 790–795. [Google Scholar]
  16. Horla, D.; Giernacki, W.; Cieślak, J.; Campoy, P. Altitude measurement-based optimization of the landing process of UAVs. Sensors 2021, 21, 1151. [Google Scholar] [CrossRef] [PubMed]
  17. Kopsakis, G. Feedback Control Systems Loop Shaping Design with Practical Considerations; 2007. Available online: https://ntrs.nasa.gov/citations/20070034948 (accessed on 3 October 2025).
  18. Azar, A.T.; Serrano, F.E.; Kamal, N.A. Robust H Loop Shaping Controller Synthesis for SISO Systems by Complex Modular Functions. Math. Comput. Appl. 2021, 26, 21. [Google Scholar] [CrossRef]
  19. Etkin, B.; Reid, L.D. Dynamics of Flight: Stability and Control; John Wiley & Sons: Hoboken, NJ, USA, 1995. [Google Scholar]
  20. Stevens, B.L.; Lewis, F.L.; Johnson, E.N. Aircraft Control and Simulation: Dynamics, Controls Design, and Autonomous Systems; John Wiley & Sons: Hoboken, NJ, USA, 2015. [Google Scholar]
  21. Drela, M.; Youngren, H. Athena Vortex Lattice (AVL). Available online: https://web.mit.edu/drela/Public/web/avl/ (accessed on 3 October 2025).
  22. McLean, S.R. The stability of ripples and dunes. Earth-Sci. Rev. 1990, 29, 131–144. [Google Scholar] [CrossRef]
  23. Hess, R.A. Robust flight control design to minimize aircraft loss-of-control incidents. Aerospace 2014, 1, 1–17. [Google Scholar] [CrossRef]
  24. Ahmed, Z.; Xiong, X. Adaptive impedance control of multirotor UAV for accurate and robust path following. Machines 2024, 12, 868. [Google Scholar] [CrossRef]
  25. United States Department of Defense. MIL-F-8785C: Flying Qualities of Piloted Airplanes. 1980. Available online: https://apps.dtic.mil/sti/tr/pdf/ADA119421.pdf (accessed on 3 October 2025).
  26. United States Department of Defense. MIL-STD-1797A: Flying Qualities of Piloted Aircraft. 1990. Available online: https://cafe.foundation/v2/pdf_tech/Flying.Qualities/PAV.FlyQual.Mil1797A.pdf (accessed on 3 October 2025).
  27. Ogata, K. Modern Control Engineering; Prentice Hall: Hoboken, NJ, USA, 2010. [Google Scholar]
  28. Shen, T.-J.; Chen, C.-L. Model-in-the-Loop Design and Flight Test Validation of Flight Control Laws for a Small Fixed-Wing UAV. Drones 2025, 9, 624. [Google Scholar] [CrossRef]
Table 1. Linearized pitch transfer functions at the trim condition.
Channel Linearized   Plant   G ( s ) (From 6-DoF at Trim)
Pitch ( δ e q ) G p i t c h s = 100.4 s 7 + 3059   s 6 + 3.193 e 04   s 5 + 2.522 e 05   s 4 + 1.119 e 06   s 3 + 4.063 e 05   s 2 6.134 e 04   s + 1.924 e 11 s 8 + 49.73 s 7 + 1237 s 6 + 1.627 e 04 s 5 + 1.082 e 05 s 4 + 6.95 e 05 s 3 + 2.844 e 05 s 2 + 3.4323 e 05 s 4.394 e 04
Table 2. Construction steps of the target open-loop transfer function L t a r a g e t ( s ) , including pole/zero placement, frequency location, and design purpose.
StepElement AddedFrequency Location (rad/s)Purpose
1First-order lag pole + gain β p = 0.8 ,     α = 20 Define crossover near 8 r a d / s ; compensate magnitude slope
2Additional low-frequency pole + gain β p = 0.1 ,     α = 40 Increase DC gain for disturbance rejection; flatten low-frequency response
3Zero + gain β z = 0.01 ,     α = 60 Provide phase lead; achieve phase margin > 70°;
4Third-order roll-off poles β p = 55 ,     α = 1.15 Suppress sensor noise; bandwidth 12 rad/s
Table 3. Open poles and zeros of target longitudinal plant P p i t c h ( s ) with natural frequency and damping.
Pole/ZeroValues ω n ( r a d / s ) ζ ( D a m p i n g   R a t i o )
Pole   p p , 1 0.2343 + 0.7327 j 0.7692 0.3046
Pole   p p , 2 0.2343 0.7327 j 0.7692 0.3046
Pole   p p , 3 1.7208 + 8.2628 j 8.4401 0.2039
Pole   p p , 4 1.7208 8.2628 j 8.4401 0.2039
Pole   p p , 5 19.0821 19.0821 -
Pole   p p , 6 20.0000 20.0000 -
Pole   p p , 7 13.3899 + 17.2503 j 21.8372 0.6132
Pole   p p , 8 13.3899 17.2503 j 21.8372 0.6132
Pole   p p , 9 0.1142 0.1142 -
Zero   z p , 1 0.5258 0.5258 -
Zero   z p , 2 7.4613 7.4613 -
Zero   z p , 3 1.7207 + 8.2629 j 8.4401 0.2039
Zero   z p , 4 1.7207 8.2629 j 8.4401 0.2039
Zero   z p , 5 19.1482 19.1482 -
Zero   z p , 6 0.0000 0.0000 -
Zero   z p , 7 0.1142 0.1142 -
Table 4. Summary of designed controller elements.
LabelTransfer Function Break   Frequency   ( r a d / s ) Role/Purpose
C p , z 1 ( 1 s / p p , 1 ) ( 1 s / p p , 2 ) 0.7692 Cancel dominant complex conjugate poles
C p , z 2 ( 1 s / p p , 7 ) ( 1 s / p p , 8 ) 21.8372 Cancel dominant complex conjugate poles
C p , z 3 ( 1 s / ω z ) ω z = 0.0138 Low-frequency zero for phase lift
C p , p 1 1 / s -Integrator, ensures infinite DC gain
C p , p 2 1 / ( 1 s / ω p ) ω p = 0.0716 Pole for low-frequency shaping
C p , p 3 1 / ( 1 s / ω p ) ω p = 0.2638 Provide 49.8 °   lag   at   ω = 0.312   r a d / s
C p , p 4 1 / ( 1 s / ω p ) ω p = 0.9744 Provide 43.6 °   lag   at   ω = 0.928   r a d / s
C p , L 1 ( 1 s / ω z ) / ( 1 s / ω p ) ω z / ω p = 0.0120 / 0.0165 Lead: + 9.5 ° correction at low freq
C p , L 2 ( 1 s / ω z ) / ( 1 s / ω p ) ω z / ω p = 0.0870 / 0.1280 Lead: + 11 ° correction at mid-low freq
C p , L 3 ( 1 s / ω z ) / ( 1 s / ω p ) ω z / ω p = 0.3480 / 0.5210 Lead: + 13.5 °   phase   boost   at   0.426   r a d / s
C p , p 5 1 / ( 1 s / ω p ) ω p = 6.7200 Provide 44.8 °   lag   at   ω = 6.83   r a d / s
C p , L 4 ( 1 s / ω z ) / ( 1 s / ω p ) ω z / ω p = 9.1700 / 13.4100 Lead: + 10.8 °   phase   boost   at   11.1   r a d / s
C p , p 6 1 / 1 s / ω p 3     ω p = 130.2540 3rd-order roll-off ( 60   d B / d e c ) ,   75.5 °   at   61.2   r a d / s
G p 10 ^ ( 53.1 / 20 ) - Final   gain   normalization   ( 48.79   d B )
Table 5. PX4 default pitch controller parameters.
Controller Loop K P K I
Outer loop (attitude) 2 -
Inner loop (rate) 0.07 0.15
Table 6. Frequency–domain characteristics.
Controller Loop Phase   Margin   ( ° ) Gain Margin (dB)Bandwidth (rad/s)
PX4 default controller 141.1 Inf1.19
Loop-shaping controller 80 17 13.15
Table 7. Time–domain step response metrics.
Controller Loop Overshoot   ( % ) Rise Time (s)Settling Time (s)Steady-State Error (°)
Loop-shaping controller 1.1 2.147 0.005
PX4 default controller 8.8 0.089
Table 8. Quantitative performance metrics of pitch step responses (simulation vs. flight test).
MetricSimulationFlight TestNotes
Overshoot (%)--Negligible in both cases
Rise time (s) 1.100 1.354 Comparable between simulation and flight test
Settling time (s) 2.147 1.900 Slightly faster in flight due to real-world damping effects
Steady-state error (deg) 0.005 0.060 Minimal steady-state error in both cases
Disclaimer/Publisher’s Note: The statements, opinions and data contained in all publications are solely those of the individual author(s) and contributor(s) and not of MDPI and/or the editor(s). MDPI and/or the editor(s) disclaim responsibility for any injury to people or property resulting from any ideas, methods, instructions or products referred to in the content.