Article

Initial Weight Modeling and Parameter Optimization for Collectible Rotor Hybrid Aircraft in Conceptual Design Stage

1
School of Aeronautic Science and Engineering, Beihang University, Beijing 100191, China
2
Hangzhou International Innovation Institute, Beihang University, Hangzhou 311115, China
*
Author to whom correspondence should be addressed.
Drones 2025, 9(10), 690; https://doi.org/10.3390/drones9100690
Submission received: 2 June 2025 / Revised: 18 September 2025 / Accepted: 27 September 2025 / Published: 7 October 2025

Abstract

Highlights

What are the main findings?
  • We developed a weight modeling and parameter optimization method for collectible rotor hybrid aircraft (CRHA), combining a modular empty-weight model, mission-segment fuel model, and a GA + SQP hybrid optimizer to solve MTOW.
  • A global sensitivity study shows wing loading, power loading, and disk loading drive of over 90% of MTOW variation.
What is the implication of the main finding?
  • This study provides a rapid selection of key design parameters and estimation of MTOW for CRHA in the early design stage, and it offers a reference or starting point for subsequent layout selection and dimensional design.
  • Practical guideline: Locking wing loading, power loading, and disk loading globally, then fine-tuning rotor solidity and aspect ratio, is an efficient parameter selection scheme in conceptual sizing for CRHA.

Abstract

A collectible rotor hybrid aircraft (CRHA) represents a novel type of vertical takeoff and landing (VTOL) unmanned aircraft configuration, combining the typical rotor and transmission systems of helicopters with the wing and propulsion systems of fixed-wing aircraft. Its weight estimation and parameter design during the conceptual design stage cannot directly use existing rotorcraft or fixed-wing methods. This paper presents a rapid key design parameter sizing and maximum takeoff weight (MTOW) estimation approach tailored to CRHA, explicitly scoped to the 5–8-metric-ton (t) MTOW class. Component weight models are first formulated as explicit functions of key design parameters—including rotor disk loading, power loading, and wing loading. Segment-specific fuel weight fractions for VTOL and transition flight are then updated from power calculations, yielding a complete mission fuel model for this weight class. A hybrid optimization framework that minimizes MTOW is constructed by treating the key design parameters as design variables and combining a genetic algorithm (GA) with sequential quadratic programming (SQP). The empty-weight model, fuel-weight model, and optimization framework are validated against compound-helicopter, tilt-rotor, and twin-turboprop benchmarks, and parameter sensitivities are evaluated locally and globally. Results show prediction errors of roughly 10% for empty weight, fuel weight, and MTOW. Sensitivity analysis indicates that at the baseline design point, wing loading exerts the greatest influence on MTOW, followed by power loading and disk loading.

1. Introduction

With the surge in civil aviation transport demand and military requirements for rapid response and quick deployment to target areas, rotorcraft/fixed-wing compound aircraft configurations have consistently drawn the attention of aviation design researchers due to their combination of VTOL flexibility and high-speed forward flight capability. In diverse operational scenarios such as Urban Air Mobility (UAM) transport, high-efficiency emergency supply delivery to remote areas and disaster sites, and large-area, long-endurance battlefield reconnaissance and surveillance, this class of aircraft is experiencing accelerated development and increasingly widespread application owing to its distinctive maneuverability, demonstrating significant growth potential and promising market prospects [1].
Existing rotorcraft/fixed-wing VTOL aircraft can generally be categorized as tilt-based or compound-based. Tilt-based designs utilize propeller tilt for transitioning between VTOL and forward flight; this category includes tiltrotors [2,3], tiltwings [4], and tilt-ducted fans [5]. Compound-based designs feature distinct propulsion systems dedicated separately to VTOL lift and forward thrust; this category encompasses compound helicopters and multi-copter/fixed-wing hybrids (e.g., Eurocopter X3 [6] and eVTOL [7,8,9]). A common limitation of tilt-based configurations is their relatively small rotor disk area, resulting in high disk loading, which hinders their ability to achieve high VTOL/hover efficiency comparable to dedicated helicopters. Conversely, a common limitation of compound-based designs is the persistence of the rotor(s) during cruise, making it fundamentally difficult to achieve significant increases in cruise speed and fully exploit the high cruise efficiency inherent to fixed wings.
Consequently, the CRHA configuration emerges as a promising solution designed to maximize both rotor and fixed-wing efficiencies. In this design, the rotor extends during vertical takeoff/landing or hover phases, operating in a helicopter mode. Conversely, the rotor retracts during cruise flight, transforming the aircraft into a true fixed-wing configuration. Concepts exemplifying this approach include the Boeing-DARPA Disc-Wing/Fixed-Wing design [10], Stroub’s M-85 concept [11], the Modus morphing disc-rotor VTOL UAV [12], and a collectible-rotor compound demonstrator [13]. Both designs incorporate fixed wings, with their rotors housed within dorsal fairings (disks mounted atop the fuselage), and both utilize jet engines for propulsion.
The CRHA possesses a highly unconventional mission profile, characterized by distinct flight phases: a pure helicopter mode for VTOL, a transition segment involving simultaneous operation of both rotor and fixed-wing systems, and a pure fixed-wing mode encompassing climb, descent, and cruise segments. Furthermore, it integrates critical components typical of both helicopter and fixed-wing aircraft configurations: the rotor system and drive train of a helicopter, combined with the wings, empennage, and propulsion system of a fixed-wing vehicle. This distinctive hybrid flight regime and inherently complex system architecture present unique challenges during the conceptual design phase. Specifically, the established weight estimation methodologies and selection processes for key design parameters used for conventional rotorcraft or fixed-wing aircraft cannot be directly applied to the CRHA configuration.
For conventional fixed wing aircraft and helicopters, the methods of MTOW estimation and parameter sizing at the conceptual design stage are well established, such as traditional empirical parametric methods [14] and multi-objective optimization methods [15,16], as well as the Flight Optimization System method developed by the NASA Langley Research Center [17] and the machine learning-based aircraft sizing method proposed by Vegh et al. at Stanford University [18].
For VTOL aircraft, research has focused primarily on compound helicopters, tilt-rotor aircraft, and multi-rotor compound wing aircraft. Research in this area has focused primarily on compound helicopters, tilt-rotor aircraft, and multi-rotor compound wing aircraft. For compound helicopters, Tanabe et al. outlined an iterative design strategy. Initially, using empirical data on the empty and total weights of a helicopter, an estimate of the total weight was derived. This included the weights of the additional wings, engine, and propeller to determine the overall weight of the compound helicopter. This weight estimation subsequently informed the design and selection of parameters for the main rotor [19]. Yeo proposed a methodology for the selection of the general parameters of a composite helicopter and conceptual design through the utilization of fitting functions. These functions were based on comprehensive data from extant research projects on compound helicopters conducted by NASA and the US Army, including but not limited to MTOW, cruising speed, disk loading, wing loading, and other parameters, where the fixed-wing drag and propeller hub drag used in the performance estimation were derived on the basis of historical data fitting [20]. The aforementioned methods are applicable in the context of existing primary alignment aircraft. Russell and Johnson developed three conceptual designs for a helicopter, compound helicopter, and tilt-rotor aircraft that were all required to meet the same performance specifications and design requirements, where the wing and tail rotor design was to be a direct reference to a similar layout as the Cheyenne helicopter, while the wing and rotor design of the tilt-rotor mechanism was based on the Large Civil Tilt-Rotor (LCTR2) layout [21]. The described methodology is analogous to the concept derived from existing methods.
For tilt-rotor aircraft, Kamal and Serrano developed a conceptual design for a tilt-rotor unmanned aerial vehicle, selecting key design parameters such as disk loading and wing loading based on the performance requirements of fixed-wing and rotor-wing aircraft, respectively [22]. Cetinsoy et al. designed a small tilt-wing vehicle, with the key design parameters simply calculated from the mission requirements. These were then used to derive the wing aero foil shape and planform geometry [23]. Zeng et al. undertook the conceptual design of a small electric tilt-rotor vehicle, identifying some parameters for consideration, including wingspan, mean chord length, taper ratio, fuselage width, fuselage height, rotor arm length, flight speed, etc. Furthermore, some constraints were constructed, including those pertaining to fuselage length, fuselage area, rotor arm length, and minimum speed. These constraints were established with the objective of maximizing the range and hovering time, and the quadratic sequence planning method was employed for parameter optimization [24]. This method is applicable in instances where a preliminary aerodynamic scheme has already been established. Pedro et al. studied the design and performance quantification of four VTOL architectures for a canard-type aircraft. The aerodynamic modeling was conducted using the lift line method with several parameters, including the wing area, wing aspect ratio, and wing taper ratio [25]. This method is also suitable for cases where a preliminary aerodynamic layout is available. To design a small electric multi-rotor composite wing aircraft (quadrotor + fixed-wing), Tyan et al. proposed a preliminary sizing integrated methodology [26]. This approach defined the performance requirements as a set of functional relationships, derived empirical equations based on available data, and mainly considered VTOL and cruise mission. This approach essentially follows the traditional design iteration idea of determining the general parameters for the helicopter and fixed-wing modes.
In summary, although some integrated VTOL/fixed-wing sizing frameworks exist for compound, tilt-rotor, and eVTOL aircraft—typically based on available data, predefined layouts, or established empirical formulas—a conceptual-sizing methodology for CRHA has yet to be developed. Moreover, for an unconventional configuration like CRHA with a non-standard mission profile, the selection of key design parameters and the estimation of MTOW during the early design phase, prior to layout and sizing, represent one of the foremost challenges that designers need to address. However, existing methods lack an integrated approach that directly couples key design parameters with MTOW. Therefore, for CRHA, it is essential to develop an MTOW estimation model that comprehensively accounts for all three flight modes—helicopter, transition, and fixed-wing—while directly coupling key design parameters with MTOW. Such a model would enable rapid preliminary selection of key design parameters and initial estimation of MTOW.
This paper proposes a rapid conceptual design methodology for parameter sizing and gross weight estimation for CRHA (as illustrated in Figure 1). First, component-based weight estimation models incorporating key design parameters (e.g., disk loading, power loading, wing loading) are established. Second, for building a full-profile fuel weight model, power-based fuel weight fraction calculations govern rotor-dependent phases (VTOL and transition), whereas fuel consumption during fixed-wing segments (climb, cruise, descent) adapts conventional fixed-wing fuel fractions by incorporating the aerodynamic impact of the retracted rotor housing. Third, integrating these weight models with specified mission payload mass, the framework establishes the minimization of MTOW as the primary objective. Seven key design parameters are used as design variables—three sizing parameters (wing loading, rotor disk loading, and power loading), one wing geometric parameter (aspect ratio), and three rotor-system parameters (number of rotor blades, rotor solidity, and tip speed). Optimization is executed via a hybrid strategy coupling GA for global exploration with SQP for local refinement. Finally, the validity of the empty weight model, fuel burn model, and integrated optimization logic was verified, supplemented by parametric sensitivity studies to assess key influences. The framework presented in this paper is designed to provide a methodology for sizing optimization and gross weight estimation during the conceptual design phase of CRHA configurations.

2. Design Requirements and Weight Modeling

2.1. Design Requirements

Prior to the overall design and parameter optimization of a CRHA, it is essential first to clarify the intended application scenario, the detailed and mission requirements that act as external inputs to the conceptual sizing and optimization. On this basis, concrete design requirements—including payload, cruise speed, design range, and cruise altitude—are specified to provide clear boundary conditions and design references for subsequent weight modeling and optimization analyses.
(1) Mission-scenario description
Distinct from conventional single-rotor helicopters or fixed-wing airplanes, a CRHA combines VTOL with high-speed, long-range cruise, well suited to time-critical, medium- to-long-distance cargo operations.
(2) Reference types and target numbers
The performance targets proposed for the CRHA were benchmarked against the characteristic capability envelopes of current 5–8 t class high-speed turboprops, tilt-rotor unmanned aerial vehicles, and conventional helicopters. For example, the 6.8 t Beechcraft King Air 350i can maintain cruise speeds above 310 kt (≈160 m/s) and ranges beyond 3000 km [27]. Traditional helicopters such as the AW139 offer excellent VTOL capability, yet their range and speed cannot satisfy a long-range and high-speed cruise requirement [28]. The MQ-9 Reaper unmanned aircraft, with a gross weight of roughly 5 t, delivers nearly 2 t of payload over about 1850 km, but its cruise speed of 80–90 m/s falls short of the present target [29]. In comparison, a twin-turboprop aircraft better matches the characteristics of the present study; therefore, the design requirements adopt the Beechcraft King Air 350i as the reference aircraft, with the values listed in the Table 1 below.
The design requirements established in this subsection serve as explicit input conditions for the subsequent weight-model development and optimization study, ensuring that the final design meets the flight-performance requirements of the defined mission profile.

2.2. Weight Modeling

Aircraft weight estimation is a critical task during the conceptual design phase and one of the first issues that must be clarified in overall configuration work. In this section, drawing on classical fixed-wing weight-prediction methods, the MTOW is decomposed into three constituent parts: empty weight, fuel weight, and payload weight [14], as follows:
W 0 = W e + W f u e l + W p a y l o a d
For each component, this study starts from widely recognized and authoritative conceptual-design models, then tailors these classical formulations to the specific configuration features and mission profile of the CRHA. The result is an initial weight estimation model that aligns with the aircraft’s actual design requirements.

2.2.1. Empty Weight Modeling

The empty weight of an aircraft comprises the airframe structure, propulsion system, onboard systems, and installed equipment. For the CRHA addressed in this study, the empty-weight encompasses the fixed-wing elements—wing, fuselage, tail surfaces, and landing gear—the helicopter-type rotor system, the disk-shaped fairing used to collect rotors, as well as the shared powerplant and onboard equipment that serve both wing-borne and rotor-borne flight.
W e = W l o a d + W u n l o a d
  • Load-Bearing Component Weights
In traditional fixed-wing aircraft and helicopter designs, weight estimation of load-bearing components is typically conducted via regression methods based on extensive datasets from mature aircraft types. Due to their single-source lift generation, the aerodynamic component weights of fixed-wing aircraft or helicopters typically exhibit strong correlations with MTOW. In contrast, the lift-generating components of the CRHA examined in this study include both wings and rotors. During short takeoff and landing, transition flight, and low-speed forward flight, lift is shared among wings, rotors, and tail surfaces, making their aerodynamic load-carrying capability closely related to their exposed areas. Therefore, wing, tail, and fuselage masses are estimated using area-based relations with class-dependent coefficients:
W W = ρ W f e x p o S W W H T = ρ H T S H T W V T = ρ V T S V T W f u s = ρ f u s S w e t
where ρ i denotes the ratio of component weight to reference area, with values provided in Table 2; f e x p o is the exposed area factor, defined as the ratio of the wing’s exposed projected area to its reference area—assuming the fuselage covers approximately 10% of the wing area, an exposed area factor of 0.9 is adopted; S W is the wing reference area; S H T and S V T are the exposed tail areas; and S w e t is the fuselage wetted area [14].
The above areas can be expressed by MTOW W 0 , wing loading w L , and aspect ratio A as follows:
S W = W 0 w L S H T = V H T k l t A S W S V T = V V T k l t A S W S w e t = k w e t S W
Expressing the above reference areas in terms of total weight W 0 , wing loading w L , aspect ratio A, and empirical coefficients, the weight of each component can be estimated as follows:
W w i n g = ρ W f e x p o W 0 w L W t a i l = ρ t a i l c H T k l t A + c V T k l t W 0 w L W f u s e = ρ f u s e k w e t W 0 w L
Here, ρ i denotes the ratio of component weight to reference area, with values provided in Table 2. f e x p o is the exposed area factor, defined as the ratio of the wing’s exposed projected area to its reference area; assuming the fuselage covers approximately 10% of the wing area, an exposed area factor of 0.9 is adopted. V H T and V V T represent horizontal and vertical tail volume coefficients, respectively. For a typical twin turboprop aircraft, these coefficients are taken as 0.9 (horizontal tail) and 0.08 (vertical tail). k l t is the tail arm ratio, defined as the ratio of tail arm length to fuselage length. For aircraft with wing-mounted engines, the tail arm typically accounts for 50–55% of fuselage length; thus, a value of 0.5 is used here. k w e t is the fuselage wetted-area factor, defined as the ratio of the fuselage wetted area to the wing reference area, taken here as 1.9 [14].
The weights of the rotor, hub, and rotor drive system are estimated based on the AFDD00/NDARC power-law relationships derived in NASA/TP–2015-218751 (Johnson), which compiles statistics from numerous helicopter types [30]. Additionally, a rotor-folding factor is introduced to account for the collapsible rotors specific to the CRHA. After converting to SI units and introducing the design variables disk loading D L = W 0 π R r 2 , rotor solidity σ = N b l a d e c R r π R r 2 , and power loading P L = W 0 P e n g (where R is rotor radius, c is blade chord and Peng is engine power), the respective component weights are given as follows:
W b l a d e = 0.347 f f o l d N b l a d e 0.238 W 0 D L 1.258 σ 0.77291 V t i p 0.87562 W h u b = 0.0726 N b l a d e 0.0813 W 0 D L 1.3945 σ 0.7958 V t i p 0.9632 W t r a n = 54.6684 W 0 1.1848 P L 0.78137 Ω e n g 0.09899 V t i p 0.80686 D L 0.40343
Here, f f o l d denotes the rotor-folding factor. The CRHA employs an automatic rotor-folding mechanism; thus, f f o l d is set as 1.28 [30]. Ω e n g denotes the engine rotational speed in rpm, and for the present 5–8 t MTOW class, it is set to 25,000 rpm. This value is not a universal standard but lies squarely inside the observed 21,000–30,000 rpm band for representative engines in this power class: the Safran RTM322 family is certificated with an output-shaft speed of 21,675 rpm (OEI 21,154 rpm) in the EASA type-certificate data sheet; the newer Safran ANETO-1K datasheet lists 20,900 rpm for the power-output shaft; and the GE CT7-8 installation limitations map Np = 105% to 21,945 rpm. At the upper end, P&WC PT6C-67A specifies 30,000 rpm output speed (other 67-series variants use 21,000 rpm) [31,32,33,34,35]. Accordingly, selecting 25,000 rpm provides a reasonable mid-band design point for gearbox ratio studies and component sizing, while we emphasize it as a working assumption to be refined once the engine candidate is fixed.
2.
Non-Load-Bearing Component Weights
For components that do not primarily bear aerodynamic loads—such as landing gear, propulsion systems, and onboard equipment—their weights depend primarily on overall load demands and installed power. Such component weights are estimated as a percentage of the total aircraft weight.
W L G = λ L G W 0 W i n s t , e n g = λ i n s t W e n g W e n g = W 0 g χ e n g P L W e l s e = λ e l s e W 0
where λ i denotes the ratio of component weight to reference weight, and χ e n g (unit kW/kg) is the specific power of the turboshaft/turboprop engine. The above coefficients have values provided in Table 3 according to refs. [14,36].
The relationship between engine weight and rated power is given by:
W e n g = P e n g g χ e n g = W 0 g χ e n g P L
where “All-else empty” denotes the mass of onboard systems and fixed installations not accounted for by the structural groups, landing gear, or installed engines; it aggregates avionics, electrical, hydraulics/flight-controls, fuel-system hardware, ECS/anti-ice, communications, and other fixed equipment [14].
3.
Adjustments for Unmanned Platforms
Unmanned aircraft differ significantly from manned aircraft in several key areas, requiring adjustments to the baseline weight-estimation coefficients:
  • (1)
    Lower Maneuver Load Factor:
Unmanned platforms typically have a lower maneuvering load factor n u a v 2.5 , which reduces loads on primary load-bearing structures. The resulting adjusted surface-area density for load-bearing components is obtained by multiplying the original density by an overload correction factor f n = n u a v / n r e f . Compared to a typical manned transport aircraft (e.g., FAR-25 category) with a reference load factor n r e f 3.8 , the overload correction factor is thus taken as 0.81 [37].
  • (2)
    Use of Advanced Composite Materials:
UAVs extensively utilize fully composite structures, whereas manned aircraft frequently rely heavily on metallic materials. Consequently, the weight of load-bearing structural components in UAVs is further reduced. The surface-area density must therefore be multiplied by a material correction factor f m a t . For carbon-fiber composites, this factor is typically 0.85 [38].
  • (3)
    Reduced Landing Gear Weight:
UAV landing gear systems, due to the absence of high-speed taxi requirements and reduced impact-energy absorption constraints, weigh significantly less than their manned counterparts. Statistical data indicates that landing gear weights for UAVs are approximately 60% of those for similarly sized manned aircraft [39]. Hence, a landing gear correction factor f L G = 0.6 is adopted.
  • (4)
    Other Structural Adjustments:
UAVs omit cockpits and pressurization systems but incorporate additional UAV-specific avionics and systems. Thus, cockpit f c o c k p i t and UAV-system f U A S correction factors are required in other components. Typical cockpit and pressurization-system weights are about 0.07 W0, while UAV-specific systems weigh approximately 0.03 W0. Accordingly, correction factors f c o c k p i t = 0.07 and f U A S = 0.03 are used [39,40].
The resulting UAV-adjusted component weights are summarized in the following Table 4:

2.2.2. Fuel Weight Modeling

Fuel Weight Fraction for VTOL Aircraft
The estimation of fuel weight is based on the fuel weight fraction of each flight segment. With reference to a typical mission of a VTOL aircraft, the flight profile of a CRHA can be represented as illustrated in Figure 2. The flight segments of a traditional fixed-wing aircraft include warm-up, takeoff, climb, cruise, and descent for landing. Compared with traditional fixed-wing aircraft, the warm-up and takeoff segments of VTOL aircraft are modified to include a vertical takeoff segment, which is consistent with the characteristics of a helicopter. Additionally, a vertical landing segment, which is also characteristic of a helicopter, is incorporated into the descent segment for landing. The mission segments are numbered, with 0 indicating the start of the mission, 1 indicating the completion of the vertical takeoff segment, 2 indicating the completion of the climb, 3 indicating the completion of the cruise segment, 4 indicating the completion of the descent segment, and 5 indicating the landing of the aircraft.
For segment i, the fuel weight fraction can be expressed as W i / W i 1 , where W i is the aircraft weight at the end of segment i and where W 0 is the MTOW. The consumed fuel fraction can be expressed as the product of the fuel weight fraction for each segment; therefore, the consumed fuel weight of the flight profile can be expressed as follows:
W f u e l = W 0 1 W 1 W 0 W 2 W 1 W 3 W 2 W 4 W 3 W 5 W 4
Empirical fuel-weight fractions for fixed-wing aircraft and helicopters/rotorcraft in each flight segment are summarized in Table 5. The fixed-wing aircraft weight fractions are primarily drawn from Aircraft Design (Raymer) [14], while helicopter values originate from the U.S. Army helicopter handbook [41]. The cruise-segment fuel consumption for fixed-wing aircraft is estimated via the Breguet equation, whereas helicopter cruise-segment fuel consumption is computed based on power consumption. According to the flight modes of the CRHA, the warm-up, vertical takeoff, and landing segments utilize helicopter mode, whereas climb, cruise, and descent segments are conducted in fixed-wing mode. Therefore, initial empirical fuel-weight fractions for the CRHA are selected based on these flight modes (Table 5).
For the fuel weight fraction of the cruise and additional flight at a fixed speed phase, the following formula can be derived on the basis of the Breguet formula [14]:
W 3 W 2 = e c p V g ( L / D ) c r u i s e η p R V + t a d d
where c p is the engine-Specific Fuel Consumption (SFC); V is the cruise speed; η p is the propeller efficiency, (L/D)cruise is the lift-to-drag ratio in the cruise segment; g is the gravitational acceleration; R is the range of the cruise segment; and t a d d is the additional flight time. According to Aircraft Design (Raymer), the cruise lift-to-drag ratio is approximately 86.6% of the maximum lift-to-drag ratio [14], i.e., (L/D)cruise = 0.866(L/D)max. The maximum lift-to-drag ratio can be expressed as the inverse of the drag divided by the weight [14]:
L D m a x = 1 q d y n C D 0 w L + w L q d y n π A e
where q d y n is dynamic pressure, and e is the Oswald efficiency factor estimated upon actual aircraft (take straight-wing aircraft, for example):
e = 1.78 1 0.045 A 0.68 0.64
q d y n = 1 2 ρ V 2
Thus, the overall flight profile fuel consumption is as follows:
W x = W 0 1 0.9814 e C p V g ( L / D ) max η p R V + t a d d
We assume that the ratio of reserve fuel and retained fuel to the total fuel for the entire flight mission is η F . Typically, it can be taken as 6% [14], so the total fuel fraction can be estimated as follows:
W f u e l = 1 + η F W x
The fuel weight of the aircraft can therefore be expressed as follows:
W f u e l = 1 + η F W 0 1 0.9814 e C p V g ( L / D ) max η p R V + t a d d
Although mature empirical fuel-weight fractions exist for fixed-wing aircraft and helicopters across various flight segments, the CRHA studied here sequentially transitions between helicopter mode, fixed-wing mode, and two mode-transition segments during its mission profile. Its aerodynamic characteristics, thrust demands, and specific fuel consumption thus vary significantly across different flight segments.
Directly concatenating existing fixed-wing and helicopter fuel fraction values leads to several issues in fuel estimation for the entire mission profile:
  • Fuel consumption during VTOL segment in helicopter mode would be overestimated due to the significantly reduced climb/descent altitude;
  • Fuel consumption during transition segment would be entirely neglected;
  • Fuel consumption in climb, cruise, and descent segments in fixed-wing mode would be inaccurately estimated (either underestimated or overestimated) due to additional drag induced by the disk.
These inaccuracies propagate cumulatively along the weight recursion chain, ultimately causing distorted predictions of total fuel weight. Therefore, this section first refines the flight profile. In contrast to the simplified mission profile, the revised version explicitly incorporates transition flight segment (see Figure 3). After mission start, the aircraft first ascends vertically in helicopter mode to hover altitude, transitions to fixed-wing flight mode during horizontal acceleration, then performs climb, cruise, and descent segments in fixed-wing mode. After descending back to hover altitude, it decelerates horizontally, transitions to helicopter mode, and finally lands vertically.
Helicopter Mode Corrections
In the overall flight profile, the helicopter mode comprises vertical landing and landing segments. The initially selected fuel weight fraction of 0.985 for the vertical landing segment first appeared in Aircraft Design (Raymer) [14], where it represents the climb-and-acceleration segment of fixed-wing aircraft immediately after takeoff, typically lasting around 45–60 s. In contrast, classical rotorcraft/helicopter textbooks (e.g., Prouty [42,43], Johnson [44], and Leishman [45]) and the NDARC methodology [30] generally estimate vertical takeoff and climb fuel consumption through integration of power over time, rather than employing a fixed empirical coefficient. Nevertheless, in the absence of comprehensive statistical databases, several VTOL and HSVTOL studies [46] still adopt 0.985 as a quick-estimation factor for climb in helicopter or STOVL mission profiles.
The vertical takeoff and landing of a CRHA differ significantly from the climb and descent of fixed-wing aircraft. Although both must overcome gravity, the CRHA also needs to overcome rotor-induced drag during vertical flight, whereas fixed-wing aircraft primarily accelerate or decelerate horizontally during climb and landing segments. The composition of power consumption thus differs considerably between these two flight types. Consequently, fixed-wing climb/descent fuel fractions cannot simply replace those specifically calculated for CRHA’s vertical takeoff and landing segments.
  • Vertical Takeoff segment
Based on the vertical landing flight profile, the power required during landing can be decomposed into hover-induced power Phover and additional low-speed vertical takeoff power Prise. Adopting Leishman’s hover-power approximation [45] along with the low-speed vertical takeoff incremental power formulation proposed by Chopra and Datta [47], the total landing power can be expressed as follows:
P h o v e r = T 3 / 2 η r 2 ρ A r P r i s e = W 0 V C 2 η r
where T is rotor thrust, VC is climb speed, η r is rotor efficiency, ρ is air density, and A r is rotor disk aera.
The power required during the takeoff segment, denoted as P1, is defined as follows (where the subscript i indicates the flight segment number):
Pi: power required during segment i
Wi−1: aircraft weight at the start of segment i
mi−1: aircraft mass at the start of segment i
Wi: aircraft weight at the end of segment i
mi: aircraft mass at the end of segment i
mfi: fuel mass consumed during segment i
fi: fuel fraction during segment i
ti: time duration of segment i
P 1 = P h o v e r + P r i s e η r = T 3 / 2 2 ρ A r + W 0 V C 2 η r
where η r denotes the efficiency of the main rotor.
Unlike fixed-wing aircraft, which typically have higher safe level-flight altitudes, helicopters generally hover safely at lower altitudes—typically between 400 ft and 700 ft (120 m–210 m) [48], requiring about 20–30 s of flight time. For the CRHA, the hover altitude hhover is preliminarily assumed to be 150 m, consistent with standard helicopter hover safety altitudes. Given this relatively small climb height, it can be reasonably assumed that air density remains constant during this short-duration segment. Moreover, aircraft weight can be considered constant due to the brief duration, and with a slow vertical takeoff rate, thrust approximately equals aircraft weight. Hence, the required power for this segment can be simplified as follows:
P 1 = W 0 η r D L 2 ρ + V C 2
The instantaneous fuel mass flow rate during vertical landing m ˙ f 1 can be expressed as the product of SFC c p and the required power. For this short-duration segment, the PSFC is also assumed to remain constant. Since SFC is typically given in units of kg/kWh, appropriate unit conversions are required when performing calculations in the SI unit system.
Thus, the fuel flow rate is as follows:
m ˙ f 1 = c p P 1 1000 × 3600 = c p 1000 × 3600 W 0 η r D L 2 ρ + V C 2
The fuel mass consumed m f 1 during this segment is thus given as follows:
m f 1 = m ˙ f 1 t 1 = c p 1000 × 3600 W 0 η r D L 2 ρ + V C 2 h h o v e r V C
Therefore, the fuel fraction consumed during the vertical takeoff segment f1 can be expressed as follows:
f 1 = m f 1 g W 0 = W 0 W 1 W 0 = c p 1000 × 3600 D L 2 ρ + V C 2 h h o v e r g V C η r
As evident from the expression for the vertical landing fuel fraction, during the conceptual design stage, if the disk loading is kept constant when varying the weight or rotor diameter, the fuel fraction for this segment remains unchanged, thus simplifying iterative calculations. Furthermore, reducing disk loading (i.e., increasing the rotor disk area) can effectively lower fuel consumption.
The fuel-weight fraction of vertical takeoff segment W i / W i 1 can thus be expressed as follows:
W 1 W 0 = 1 f 1 = 1 c p 1000 × 3600 D L 2 ρ + V C 2 h h o v e r g V C η r
From the above expression, it can be seen that the fuel-weight fraction W 1 / W 0 for the vertical takeoff segment depends on the SFC c p , disk loading D L , vertical takeoff speed VC, and hover altitude hhover.
2.
Vertical Landing Segment
The primary difference between the descent and takeoff segments is that, during landing, the aircraft must overcome gravity, whereas during descent, gravity acts in the direction of motion, offsetting part of the power the aircraft needs to supply. This difference can be explicitly represented as follows:
P 7 = W 6 η r D L 2 ρ - V D 2
where VD is the vertical landing speed, oriented opposite to the landing velocity.
Thus, the fuel-weight fraction f7 consumed during the vertical landing segment can be expressed as follows:
f 7 = m f 7 g W 6 = W 6 - W 7 W 6 = c p 1000 × 3600 D L 2 ρ - V D 2 h h o v e r g V D η r
Similar to the takeoff segment, it can be observed from the vertical descent fuel-fraction expression that during the conceptual design stage, if the disk loading is kept constant while varying the aircraft weight or rotor diameter, the fuel fraction for the vertical landing segment remains unchanged, simplifying iterative calculations. Additionally, reducing disk loading (increasing rotor disk area) can likewise lower fuel consumption during the landing segment.
The fuel-weight fraction of vertical landing segment W i / W i 1 can thus be expressed as follows:
W 7 W 6 = 1 f 7 = 1 c p 1000 × 3600 D L 2 ρ - V D 2 h h o v e r g V D η r
From the above expression, it can be seen that the fuel weight fraction W 1 / W 0 for the vertical landing segment depends on the SFC c p , disk loading D L , vertical landing speed VD, and hover altitude hhover.
Transition Flight Mode Corrections
The transition flight segments primarily facilitate the shift between helicopter and fixed-wing flight modes. The complete mission profile (Figure 3) includes two such transitions: vertical-to-horizontal transition in segment 2 and horizontal-to-vertical transition in segment 6. During transition, both rotors and wings simultaneously serve as primary aerodynamic components, with the rotors positioned above the wings. In this configuration, the CRHA closely resembles a compound helicopter such as the Eurocopter X3 [49] or the AH-56 Cheyenne [50], as illustrated in Figure 4.
  • Vertical-to-Horizontal Transition Segment
Segment 2, the vertical-to-horizontal transition, accelerates the aircraft from hover to the minimum forward-flight speed required to sustain fixed-wing mode. During the transition, the rotor and wing share the lifting task. Accordingly, the required power is modelled as the sum of two contributions: (i) the energy-rate power P E , accounting for climb/descent and acceleration/deceleration; (ii) the state-sustaining baseline power P b a s e , representing the quasi-steady power required to maintain the instantaneous forward-flight state. As the segment of transition keeps the same height, the energy-rate reduces to the dynamic-energy term only.
  • (1)
    Energy-Rate Power
Since no mature CRHA platform or established flight manual currently exists, this study references transition parameters from proven tilt-rotor aircraft such as the XV-15. The XV-15 specifies two tilt-rate settings: 7.5°/s (completion in approximately 12.5 s) and 1.5°/s (completion in approximately 63 s) [53]. Considering common flight-test operational practices of about 2–5°/s, an engineering window of roughly 20–40 s for a full 95° tilt maneuver is typical. This time frame has also been adopted by NASA in conceptual designs such as TR-36 and LCTR2 [54,55]. Unlike tilt-rotor aircraft, the CRHA’s acceleration power during transition is primarily provided by propellers. Before fully stowing the rotors, both the rotor and the forward-propulsion propellers operate simultaneously, restricting the propellers from reaching their maximum thrust. This limitation consequently increases the CRHA’s transition-segment duration. Therefore, the upper bound of the above engineering window of 40 s is selected as the transition time t t r a n .
When transitioning from helicopter-mode hover to the minimum level-flight condition in fixed-wing mode, the minimum forward-flight speed is assumed to be V f i x e d , min . Thus, the kinetic energy increment during the transition segment can be expressed as follows:
Δ E = 1 2 m 1 V f i x e d , min 2
Therefore, the required acceleration power during the transition can be approximated as:
P E = Δ E η p t t r a n
where η p denotes the propeller efficiency and ttran is the duration of the transition segment. Clearly, acceleration power is closely related to the final speed at the end of the transition segment and the transition duration.
  • (2)
    State-Sustaining Baseline Power
State-sustaining baseline power, including the rotor power P r o t (keeping rotor rotating and remain rotor lift share) and the drag power D V η p (overcoming airframe drag), and can also be evaluated via the effective lift-to-drag ratio (according to Russell and Johnson [56]) as is expressed as follows:
P b a s e = P r o t + D V η p = W 1 V L / D e
where V is the forward flight speed and L / D e is the effective lift-to-drag ratio.
For a large-wing compound near the best-range speed, a literature-based reference of L / D e = 7.8 is adopted [56].
In summary, the total power consumption during the vertical-to-horizontal transition segment (Segment 2) can be expressed as follows:
P 2 = P E + P b a s e = = m 1 V f i x e d , min 2 2 η p t t r a n + W 1 V L / D e
The fuel mass for energy-rate m E consumed due to acceleration can thus be expressed as follows:
m E = c p 1000 × 3600 Δ E η p t t r a n t t r a n = c p 1000 × 3600 m 1 V f i x e d , min 2 2 η p
Similar to the vertical landing segment, the engine operates at a relatively high power output during acceleration. Therefore, the engine’s SFC c p for this segment remains consistent with that of the vertical landing segment.
The fuel mass for state-sustaining m b a s e consumed due to drag power can be expressed as follows (assuming a linear acceleration from 0 to V f i x e d , min over t 2 ):
m b a s e = c p 1000 × 3600 W 1 V t L / D e d t = c p 1000 × 3600 W 1 V f i x e d , min 2 L / D e t t r a n
Combining these two fuel mass components, the total fuel mass consumed during this segment can be expressed as follows:
m 2 = c p 1000 × 3600 m 1 V f i x e d , min 2 2 η p + W 1 V f i x e d , min 2 L / D e t t r a n
Therefore, the fuel-weight fraction f2 consumed during the vertical-to-horizontal transition segment can be expressed as follows:
f 2 = m 2 g W 1 = W 1 - W 2 W 1 = c p 1000 × 3600 V f i x e d , min 2 2 η p + V f i x e d , min g 2 L / D e t t r a n
The fuel fraction for this segment W i / W i 1 can thus be expressed as follows:
W 2 W 1 = 1 - f 2 = 1 - c p 1000 × 3600 V f i x e d , min 2 2 η p + V f i x e d , min g 2 L / D e t t r a n
From the above expression, it can be observed that the fuel fraction W 2 / W 1 for the vertical-to-horizontal transition segment is related to the PSFC c p , minimum level-flight speed Vfixed,min, propeller efficiency η p , and transition duration ttran.
2.
Horizontal-to-Vertical Transition Segment
This segment differs from the vertical-to-horizontal transition segment primarily in the direction of propeller thrust. The power model mirrors the vertical-to-horizontal case: the state-sustaining baseline power remains the same, while the energy-rate term changes sign because this is a deceleration phase.
W 6 W 5 = 1 - f 6 = 1 - c p 1000 × 3600 V f i x e d , min 2 2 η p + V f i x e d , min g 2 L / D e t t r a n
Fixed-Wing Flight Mode Corrections
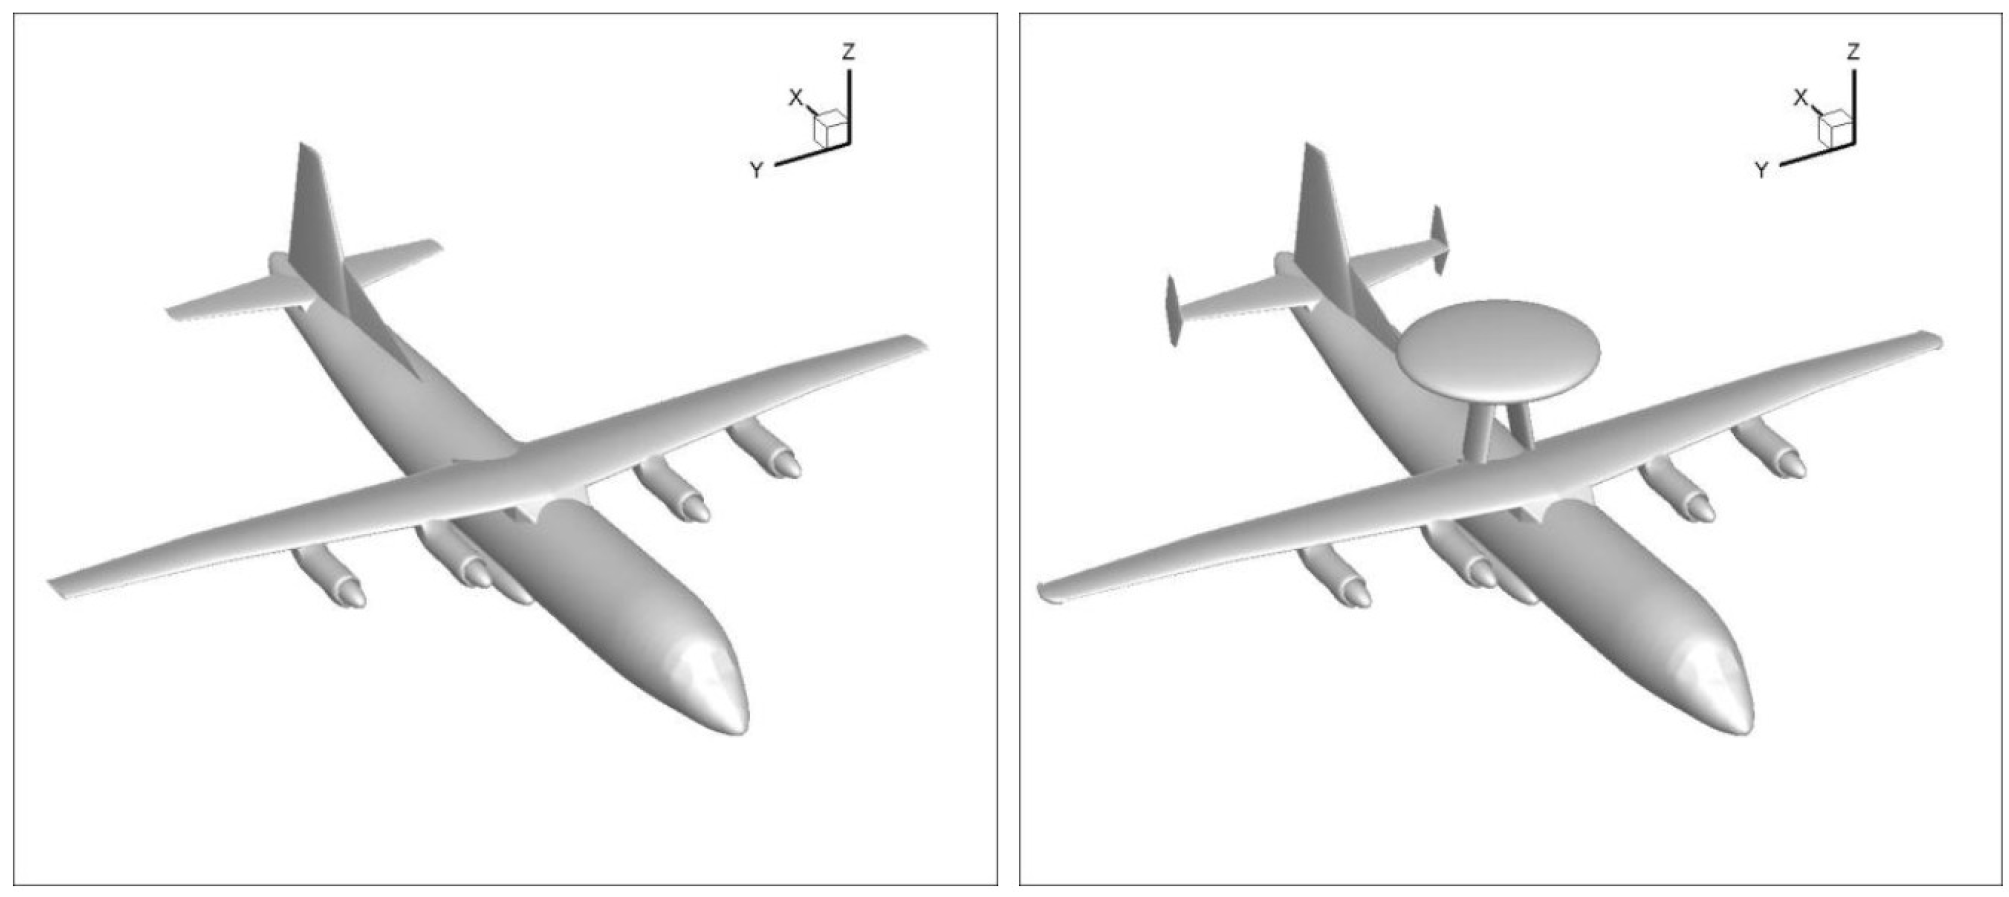
In fixed-wing flight mode, the CRHA’s aerodynamic configuration closely resembles that of an Airborne Warning and Control System (AWACS) aircraft equipped with a dorsal-mounted radar disk, such as the Grumman E-2 Hawkeye [57] and the Boeing E-3 Sentry [58], as illustrated in Figure 5. Therefore, corrections for the fixed-wing flight segments are based on performance data from these types of aircraft.
The Grumman E-2 Hawkeye was developed by modifying the Grumman C-2 through the addition of a dorsal-mounted radar disk measuring 24 ft (7.4 m) in diameter. After modification, the E-2 has an endurance of approximately 1605 nmi, with its maximum fuel capacity increased by 17% and maximum takeoff weight increased by 12% compared to the original C-2. For the same mission range, the E-2 requires about 6% more fuel than the C-2, while its lift-to-drag ratio (L/D) is reduced by roughly 7–8% relative to the C-2 [57]. Similarly, the Boeing E-3 Sentry employs a flight platform closely resembling the Boeing 707-320B. The typical range of the 707-320B is approximately 5750 nmi, while the E-3 also achieves a range exceeding 5000 nmi. Although both aircraft have comparable maximum fuel capacities, the E-3 experiences increased empty weight and drag, necessitating additional fuel for the same range. Analysis based on the Breguet equation suggests the E-3’s lift-to-drag ratio is approximately 7% lower than that of the 707-320B [58,61]. Furthermore, an earlier preliminary analysis by Michael J. Wagner of the U.S. Naval Postgraduate School for an AEW conceptual aircraft, concluded that the clean AWACS configuration yielded a maximum lift-to-drag ratio of about 16, approximately 7% lower than the typical cruise lift-to-drag ratio (17–18) of similarly sized turboprop aircraft without radar disks [62].
Zakria G. Toor et al. [63]., in their 2020 study, employed CFD to analyze the aerodynamic performance of an aircraft equipped with AWACS equipment against its baseline configuration (Figure 6). Their results explicitly indicated a 5–10% lower lift-to-drag ratio across the full angle-of-attack range for the AWACS-equipped variant compared to the baseline model. Additionally, the study noted that although the addition of the dorsal radar disk slightly increases the lift coefficient, the drag coefficient rises even more significantly.
From the analysis above, it can be concluded that adding a dorsal radar disk reduces the aircraft’s lift-to-drag ratio by approximately 7% relative to the baseline aircraft. This occurs because, although the modified aircraft experiences slight increases in both lift and drag coefficients, the lift-coefficient increase is relatively minor, whereas the drag coefficient increases significantly. Therefore, it can be reasonably approximated that the lift coefficient remains essentially unchanged, while the drag coefficient increases by around 7%.
Since the CRHA studied in this paper shares a highly similar fixed-wing configuration with AWACS aircraft, the conclusions from the above-mentioned studies can be directly applied: the lift-to-drag ratio of CRHA in fixed-wing mode decreases by approximately 7% compared to conventional configurations, with an unchanged lift coefficient but a 7% increase in the drag coefficient. Based on this conclusion, corrections for the climb, cruise, and descent segments of the CRHA’s fixed-wing flight mode are made accordingly.
  • Climb Segment
The power consumption during the climb segment primarily consists of three components: potential-energy power, acceleration power, and drag power. According to Raymer’s empirical distribution in aircraft design, these components account for approximately 35%, 30%, and 35%, respectively, of the total climb-segment power consumption. The previously determined increase in drag coefficient affects only the drag-power portion.
Thus, the climb-segment fuel-weight fraction for a fixed-wing aircraft f3,fixed can be expressed as follows:
f 3 , f i x e d = 1 - W 3 W 2 = 1 0.985 = 0.015
After applying the additional disk-induced drag correction, the CRHA climb-segment fuel-weight fraction f3 can be expressed as follows:
f 3 = 0.35 + 0.30 + 0.35 1 + 0.07 f 3 , f i x e d = 1.0245 f 3 , f i x e d = 0.01537
The corrected fuel fraction remains nearly identical to the original value. This outcome arises because the power required to overcome drag accounts for only a minor portion of total climb-segment power; hence, a 7% increase in drag coefficient has a negligible effect on overall climb power. Thus, the climb segment does not require correction, and Raymer’s original fuel fraction can continue to be used directly W 3 / W 2 = 0.985 .
2.
Cruise Segment
The Breguet range equation, commonly employed for fixed-wing aircraft cruise segments, remains valid for the CRHA cruise segment, requiring only an adjustment to account for the 7% reduction in the lift-to-drag ratio. The corrected fuel-weight fraction for the cruise segment can therefore still be expressed as follows:
W 4 W 3 = e C p V g ( L / D ) c r u i s e η p R V + t a d d
Thus, the cruise-segment lift-to-drag ratio must be corrected based on the original estimation formula as follows:
L D c r u i s e = 0.866 L D m a x = 0.866 q d y n C D 0 w L + w L q d y n π A e 93 %
3.
Descent Segment
During the descent segment, the reduction in gravitational potential energy offsets the power required to overcome aerodynamic drag. The engines typically operate near idle with throttles at minimum positions, and thus the additional 7% drag introduced by the radar disk is primarily compensated by a slight increase in the descent rate rather than significantly higher engine fuel consumption. According to experimental measurements by Enis T. Turgut et al., such an increase in drag raises power demands by less than 2%, which can be considered negligible [64]. Therefore, no additional correction to the descent-segment fuel fraction is necessary, and Raymer’s original recommended fuel fraction W 5 / W 4 = 0.995 can continue to be used directly.
According to the power-budget analysis summarized by Seddon and Newman in Basic Helicopter Aerodynamics (Seddon and Newman), about 80% of total power in a single-rotor helicopter during hover and low-speed forward flight is dedicated to generating lift via the main rotor [65]. Thus, rotor efficiency η r can initially be approximated as 0.8.
Regarding propeller efficiency, Aircraft Design (Raymer) suggests a typical value of 0.8 for preliminary conceptual design [14]. Under similar manufacturing processes and thrust classes, helicopter or rotorcraft SFC values at high power levels and low altitudes are typically 0.05–0.10 kg/kWh higher than those of fixed-wing aircraft in cruise mode.
Therefore, for the CRHA in helicopter and transition flight modes, c p , h = 0.4   kg / kWh . This value, corresponding to helicopter-mode takeoff and hover conditions, is conservative yet realistic based on existing literature [66,67]. In fixed-wing mode, c p , h = 0.3   kg / kWh . This choice positions the CRHA within the mid-range of modern turboprop cruise efficiencies [68].
Integrating all of the above corrections, the final comparison between the corrected fuel-weight fractions and the initial (baseline) fuel-weight fractions is summarized in the following Table 6.
The ratio of reserve and trapped fuel to the total mission fuel η F is taken as 0.06 according to Aircraft Design (Raymer) [14]. Thus, the total fuel consumption for the entire flight mission profile is expressed as follows:
W f u e l = 1 + η F W 0 1 W i W i 1

2.2.3. Payload Weight Modeling

Mission payload, as part of the performance requirements, is treated as a constant value W p a y l o a d = c o n s t .

3. Weight Estimation and Initial Parameter Sizing

Based on the previously established weight models, this section formulates conceptual sizing as a constrained optimization problem. The MTOW is the quantity to be minimized and is determined implicitly through mass build-up and performance constraints.

3.1. Design Variables

The design vector includes seven independent variables for CRHA—three sizing parameters (wing loading w L , rotor disk loading D L , and power loading P L ), one wing geometric parameter (aspect ratio A), and three rotor-system parameters (number of rotor blades N b l a d e , rotor solidity σ , and tip speed v t i p ):
x = w L , A , N b l a d e , D L , P L , σ , v t i p
Here, w L = W 0 / S W , D L = W 0 / A r , P L = W 0 / P e n g .
Accordingly, this section summarizes and classifies all parameters involved in the weight models into three categories: aircraft type-related parameters, performance indicator parameters, and design variables, as shown in Table 7.
(1) Aircraft type-related parameters
The aircraft type-related parameters primarily reflect the fundamental characteristics of the designed configuration, aerodynamic layout, and propulsion system. This category encompasses empirical constants, structural form factors, and engine performance indices, which are mainly determined by the selected airframe configuration and engine type. For a given design task, these parameters are typically assigned fixed values based on engineering experience or reference aircraft data, ensuring the applicability and physical consistency of the weight models throughout the optimization process.
The aircraft studied herein is categorized as a twin-turboprop configuration, with corresponding helicopter-mode propulsion provided by turboshaft engines. Helicopters typically have relatively low safe hover altitudes, ranging from approximately 400 ft to 700 ft (120–210 m) [48], with hover durations of about 20–30 s. For this CRHA design, the hover altitude hhover is preliminarily set to 150 m. The maximum vertical ascent speed is taken as 10 m/s, while the descent speed is lower, set at 5 m/s.
The minimum level-flight speed for twin-turboprop aircraft typically ranges from about 130 to 150 kt (66–77 m/s) [69]; here, a representative value of 70 m/s is selected. Additionally, the zero-lift drag coefficient C D 0 is approximately 0.02 for a clean propeller aircraft and 0.03 for a dirty, fixed-gear propeller aircraft [14]; here, 0.02 is selected based on the type of research aircraft.
Engine PSFC is taken as 0.4 kg/kWh for helicopter and transition-flight modes and 0.3 kg/kWh for the fixed-wing cruise mode. Finally, the duration of the transition segments is set to 40 s, referencing typical tilt-rotor aircraft values. The specific values of these parameters used in this study are listed in Table 8.
(2) Performance indicator parameters
The performance indicator parameters V c r u i s e , R c r u i s e , h c r u i s e , t a d d , W p a y l o a d are primarily determined by the mission requirements and operational scenarios of the aircraft, encompassing variables such as cruise speed, flight altitude, mission duration, range, and payload capacity. These parameters directly reflect the performance standards that the aircraft must achieve for specific tasks, independent of the particular type or structural dimensions of the airframe. Performance indicators are typically specified by the design requirements or customer needs and serve as external inputs to the optimization model, exerting a significant influence on the overall design outcomes.
(3) Design variables
The design variables are directly related to the overall characteristics of the aircraft being developed. Each parameter has a significant impact on the dimensions and weight of the aircraft and must be determined at the outset of the preliminary design process.
Aspect ratio (A): Represents the ratio of the wing span to the chord, primarily influencing lift and aerodynamic efficiency in fixed-wing flight mode.
Power loading ( P L ): The weight supported per unit power, reflecting takeoff and hovering performance in helicopter mode as well as climb and acceleration capabilities in fixed-wing mode.
Wing loading ( w L ): The weight supported per unit wing area, mainly affecting takeoff and landing performance in fixed-wing mode.
Number of rotor blades ( N b l a d e ): Influences the structure and strength of the rotor system.
Disk loading ( D L ): The weight supported per unit rotor disk area, affecting the load-carrying capacity in helicopter mode.
Rotor solidity ( σ ): The ratio of total blade area to rotor disk area, determining the rotor’s ability to generate thrust.
Tip speed ( V t i p ): The linear velocity at the rotor blade tip, which affects the thrust in helicopter mode and constrains the maximum forward speed during transition flight.
These design variables comprehensively characterize the structural, aerodynamic, and propulsion features of CRHA at the conceptual design stage. They play a critical role in determining the maximum takeoff weight and performance indices and are highly adjustable and feasible in engineering practice. The optimization bounds for these variables are mainly based on empirical values from similar aircraft under specified performance requirements.

3.2. Optimization Problem Objective

The overall optimization model aims to minimize the MTOW by coupling subsystem weights, performance parameters, and design variables in a closed-loop formulation. The optimization problem is as follows:
min x J x = W 0 x
where MTOW W 0 is obtained implicitly by the mass build-up and performance feasibility.

3.3. Constraints

This section enforces feasibility during sizing/initial optimization via four groups of constraints: (i) mass build-up closure; (ii) fixed-wing mode: cruise power, climb gradient, stall speed; (iii) helicopter mode: vertical-climb power, hover power, rotor thrust-coefficient bounds; (iv) transition flight: transition power and tip-Mach.

3.3.1. Mass Build-Up

According to Section 2.2, MTOW includes empty weight, fuel weight, and payload (empty weight and fuel weight implicit MTOW closure):
W 0 = W e m p t y x , W 0 + W f u e l x , W 0 + W p a y l o a d
where x = w L , A , N b l a d e , D L , P L , σ , v t i p .
Equation (44) closes the weight recursion using the empty-weight and fuel-weight models established earlier. W 0 is solved implicitly at each iterate of the optimizer. In the weight model, subsystem weights can be expressed as follows:
W e m p t y = f W 0 , w L , A , N b l a d e , D L , P L , σ , V t i p W f u e l = f W 0 , c p , h , c p , f , D L , V C , V D , h h o v e r , t t r a n , V f i x e d , min , V , R , h c r u i s e , t a d d , w L , A , C D 0 W p a y l o a d = c o n s t

3.3.2. Fixed-Wing Mode

(1) Cruise power constraint
At the cruise segment, the shaft power required equals the propulsive power to overcome aerodynamic drag. The cruise power cannot exceed the maximum continuous power of the engine:
P c r u i s e = D c r u i s e V η p η c r u i s e m a x P e n g
where η c r u i s e denotes the cruise power fraction (according to FAA training guidance, preliminary sizing typically assumes that cruise uses about 65–75% of the engine’s power [70], so the upper limit of the cruise power fraction is set at 75%), and the cruise drag is modelled with a parabolic polar C D = C D 0 + C L 2 π A e together with the lift–weight equilibrium L = W, giving the following:
D c r u i s e = q d y n S W C D 0 + W 0 2 π A e q d y n S W
Combining the above with the definitions of power loading P L = W 0 P e n g and wing loading w L = W 0 S W , this constraint is equal to:
V P L η p q d y n C D 0 w L + w L π A e q d y n η c r u i s e m a x
(2) Climb-gradient constraint
The required climb power can be decomposed into level-flight power plus the rate of potential energy increase:
P c l i m b = D c l i m b V c l i m b + W 0 V V C η p η c l i m b m a x P e n g
where η c l i m b is the climb power fraction. Similar to cruise, the climb power must be below the engine’s maximum continuous power; accordingly, the climb power fraction is taken the same upper bound as cruise, η c l i m b m a x = 75 % . Vertical speed relates to the climb angle (small-angle) as follows:
V V C = V c l i m b sin γ V c l i m b γ
For turboprop aircraft with MTOW between 5–8 t, the near-ground rate of climb typically ranges from 1500 to 1700 ft/min (e.g., DHC-6-400: 1600 ft/min [71]; Do-228: 1570 ft/min [72]; L-410 NG: 1673 ft/min [73]). Taking V V C = 1700   f t / m i n and using the initial speed in the climb segment V f i x e d , m i n , the climb angle is 0.123 rad ≈ 7 degree (small-angle).
Using the parabolic drag polar together with the lift–weight equilibrium, the climb-power constraint can be written as follows:
V c l i m b P L η p q d y n C D 0 w L + w L π A e q d y n + γ η c l i m b m a x
As the actual climb speed may vary but shall not be lower than the terminal speed of the transition segment, a conservative form is as follows:
V f i x e d , m i n P L η p q d y n C D 0 w L + w L π A e q d y n + γ η c l i m b m a x
(3) Stall-speed constraint
In the fixed-wing flight segment, the minimum admissible speed is taken as the terminal speed of the transition segment. The stall speed must not exceed this minimum:
V f i x e d , m i n V s t a l l = 2 W 0 ρ S W C L , m a x = 2 w L ρ C L , m a x
The maximum lift coefficient C L , m a x is taken from typical ranges by aircraft class. According to Airplane Design (Roskam), twin-propeller transports commonly have C L , m a x 1.4,2.0 . Considering that a configuration featuring a disk can yield a slightly higher achievable lift coefficient than a conventional layout [63], a higher value of C L , m a x = 1.8 is taken.

3.3.3. Helicopter Mode

(1)Vertical takeoff power constraint
The time of helicopter mode segments is short; therefore, the available shaft power is limited by the engine power rather than the maximum continuous power. The required power in vertical takeoff (Equation (20)) shall not exceed the engine power:
P 1 = W 0 η r D L 2 ρ + V C 2 P e n g = W 0 P L 1 η r D L 2 ρ + V C 2 1 P L
Hover and vertical landing power are not greater than the vertical takeoff requirement under the same conditions; therefore, no separate constraints are imposed for those cases.
(2) Thrust-coefficient constraint
According to Basic Helicopter Aerodynamics (Seddon and Newman) [65], the rotor thrust coefficient based on tip-speed dynamic pressure is as follows:
C T = W 0 1 2 ρ V t i p 2 A r = 2 D L ρ V t i p 2
For characterizing the rotor operating point, the blade-loading coefficient C T / σ is more commonly used than C T itself. The rotor thrust is therefore bounded via blade-loading within a typical range of 0.10–0.20 [65].
C T / σ m i n 2 D L ρ V t i p 2 σ C T / σ m a x

3.3.4. Transition Mode

(1) Transition flight power constraint
Similar to helicopter mode, the time of transition mode segments are also short; therefore, the maximum power limit of the engine is used, rather than the maximum continuous power. The required power in the vertical-to-horizontal transition segment (Equation (31)) shall not exceed this limit.
P 2 = m 1 V f i x e d , min 2 2 η p t 2 + W 1 V f i x e d , min 2 L / D e P e n g W 0 V f i x e d , min 2 η p t 2 g + W 0 V f i x e d , min 2 L / D e W 0 P L V f i x e d , min 2 η p t 2 g + V f i x e d , min 2 L / D e 1 P L
(2) Tip-Mach constraint
Since no specific conversion-flight strategy is prescribed, an engineering bound is imposed by linearly superposing the rotor tip speed and the maximum forward speed at the end of conversion. The advancing-side tip Mach number is limited to 0.85:
V t i p + V f i x e d , m i n 0.85 a c
where a c is the local speed of sound.

3.3.5. Feasible Domains of Design Variables

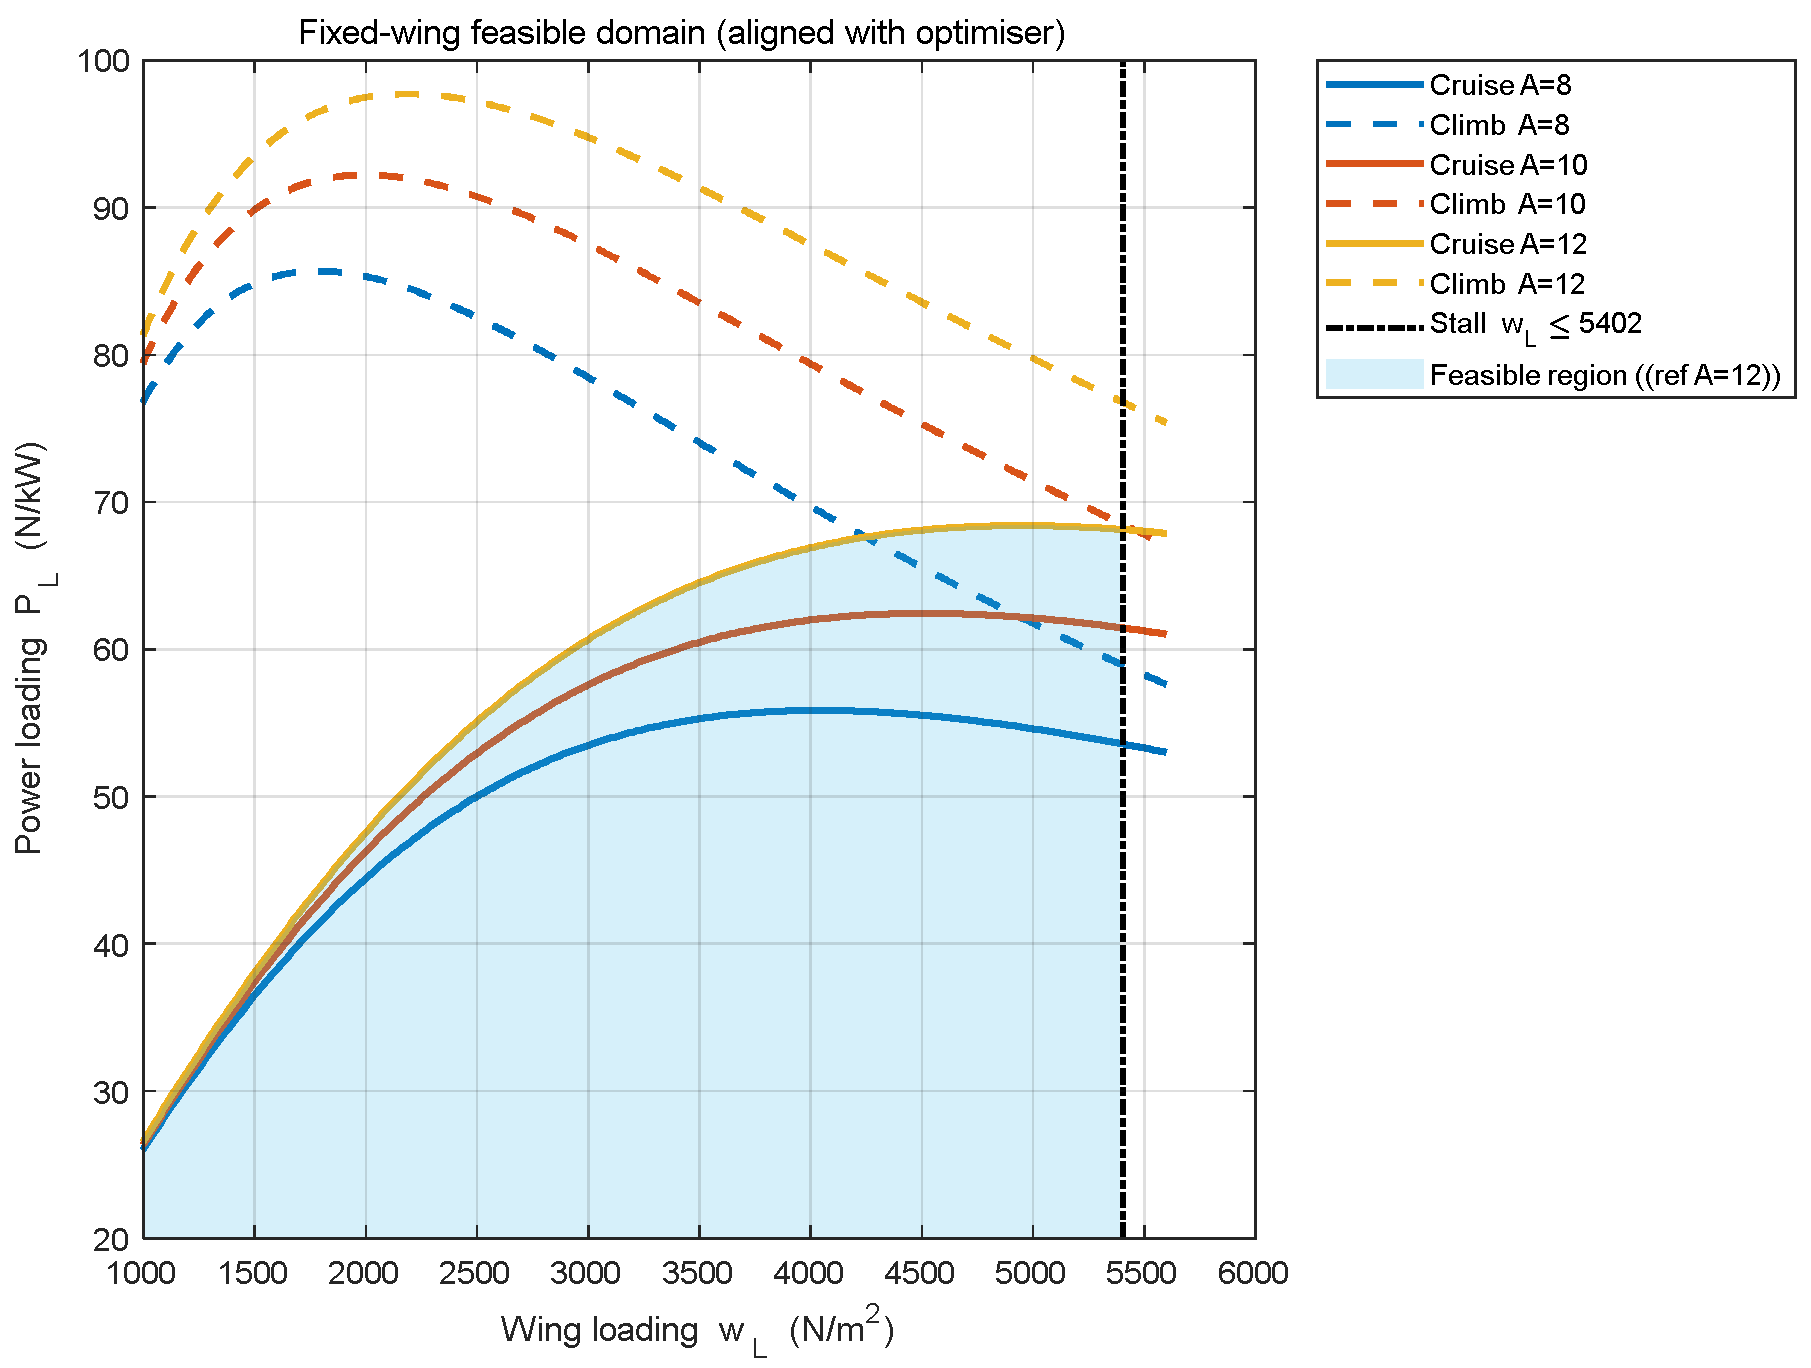
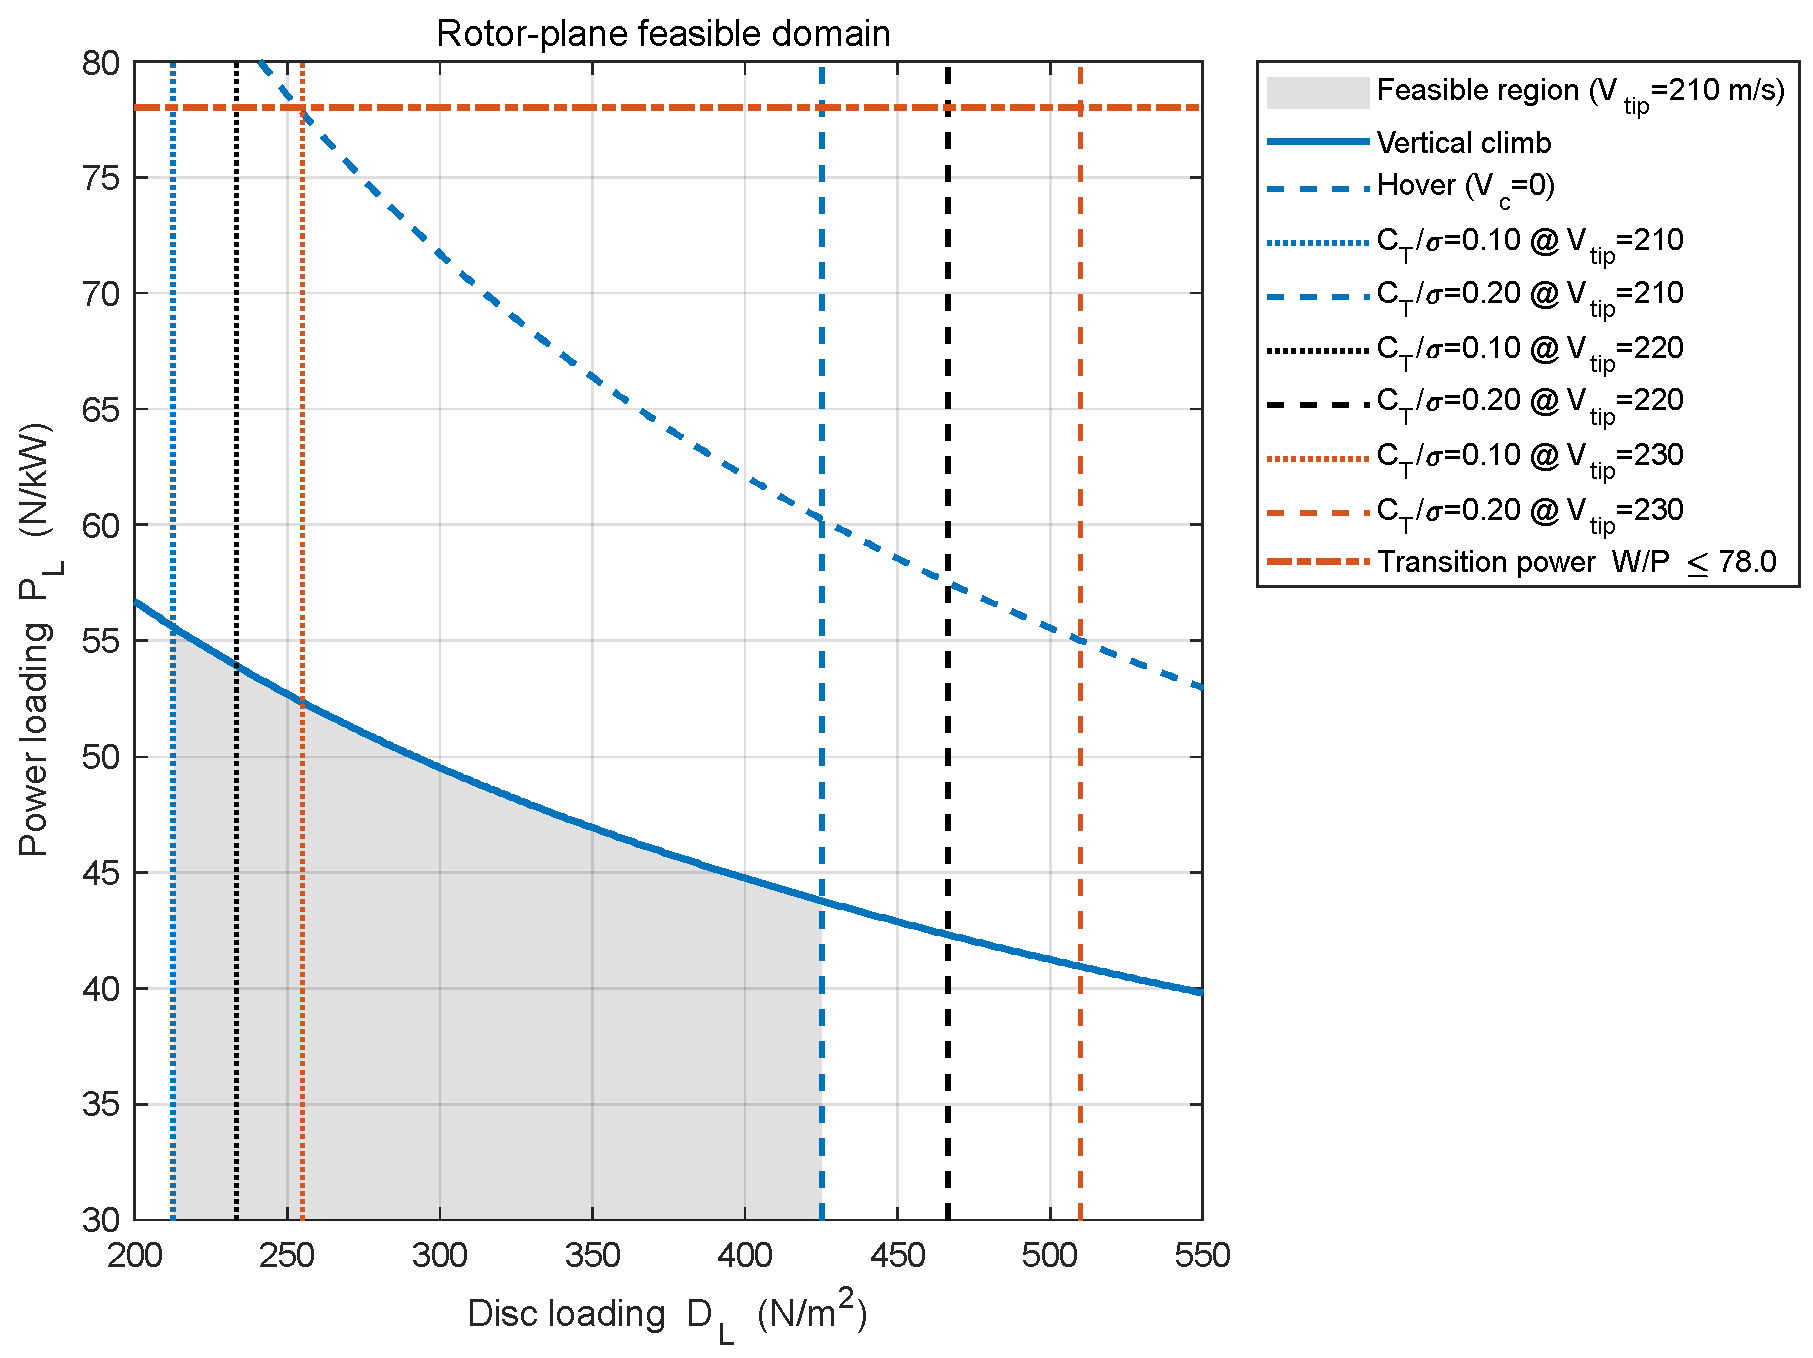
To visualize the coupling among design variables, this section maps the constraints of the above three modes of fixed wing, helicopter, and transition into two design spaces: w L P L (Figure 7) and D L P L (Figure 8).
In Figure 7, the cruise-power and climb-gradient constraints generate three upper boundary lines for aspect ratio A = 8,10,12 , and the feasible region is below them. The stall constraint adds a vertical line of w L 1 2 ρ C L , m a x V f i x e d , m i n 2 , the left of which is feasible. In the wing loading-power loading matrix, the blue shaded area is the feasible area.
In Figure 8, the vertical takeoff power constraint, together with the hover power, generates two upper-bound curves; the region below each curve is feasible. For each tip speed ( V t i p = 210,220,230 ), the maximum and minimum blade-loading parameters C T / σ yield a pair of boundaries that are vertical to the disk loading axis; feasibility lies between the two lines. The transition-power constraint appears as a horizontal line (perpendicular to the power loading axis), with feasibility below it. In the disk loading-power loading matrix, the grey shaded area is the feasible area.

3.4. Optimization Method

The optimization problem in this study involves 7 design variables and 13 external input parameters (8 flight-type-related parameters and 5 performance metric parameters), resulting in a highly nonlinear model that is prone to multiple local optima. To obtain a reliable global optimum, a hybrid global–local optimization strategy is adopted. In particular, one design variable (number of rotor blades) is integer-valued and is handled via a minimal enumeration strategy. First, for each enumerated blade count, the GA performs a global search over the continuous design subspace to avoid being trapped in local minima. Subsequently, SQP is applied with N b l a d e held fixed to refine the GA solution, thereby accelerating convergence and reducing computational cost. Across the enumerated subproblems, the feasible solution with the smallest W 0 is selected. Table 9 presents the selected optimization algorithm parameters, and Figure 9 illustrates the overall structural framework of the conceptual parameter optimization method employed in this study. The GA provides good global exploration capability, robustness, and randomness, whereas the SQP algorithm offers rapid convergence. This hybrid optimization strategy combines the advantages of global search and efficient local convergence and has been widely used in aerospace parameter design, effectively improving the reliability and engineering applicability of the model solution.

4. Method Validation

Currently, due to the absence of mature CRHA aircraft or established methods for the conceptual design of CRHA parameters, conventional validation approaches such as direct comparison with historical aircraft or existing methods are not feasible. Therefore, this chapter begins by validating each subsystem model individually, demonstrating the accuracy and engineering applicability of the empty-weight model, fuel-weight model, and MTOW model. Subsequently, a physical boundary-validation approach is employed, comparing the optimized CRHA results with established weight boundaries from two mature aircraft classes—single-rotor helicopters and twin-turboprop fixed-wing aircraft—of similar scale. The reasonableness of the resulting CRHA weight range serves as evidence for the validity of the proposed optimization method.

4.1. Subsystem Model Validation

The weight-estimation model includes empty weight, fuel weight, and payload weight. The empty-weight and fuel-weight models were developed by adapting existing methods specifically for the CRHA configuration, while the payload model directly reflects mission-performance requirements. Therefore, this subsection first separately validates the empty-weight and fuel-weight models and subsequently validates the MTOW estimation.

4.1.1. Empty-Weight Model Validation

The structural layout of the CRHA closely resembles that of compound helicopters, consisting of main rotors, wings, fuselage, propulsion systems, and transmission systems. An existing established method for weight estimation of compound helicopter configurations is the NDARC method. However, in the NDARC methodology, fuel-weight estimation is derived based on the mission profile specific to compound helicopters, which significantly differs from the CRHA mission profile. Consequently, the NDARC fuel-weight estimation model is not applicable for validation in this study; only the empty-weight component can serve as a reference.
This study validates the CRHA empty-weight model by using example parameters from the literature [74]. The corresponding parameters and results are summarized in Table 10 below.
As shown in the table, the empty-weight estimate obtained using the proposed CRHA model differs by approximately 5.5% from the NDARC compound-helicopter weight model. This result indicates that the empty-weight model developed in this study is applicable at the conceptual-design stage for estimating the empty weight of compound helicopters.
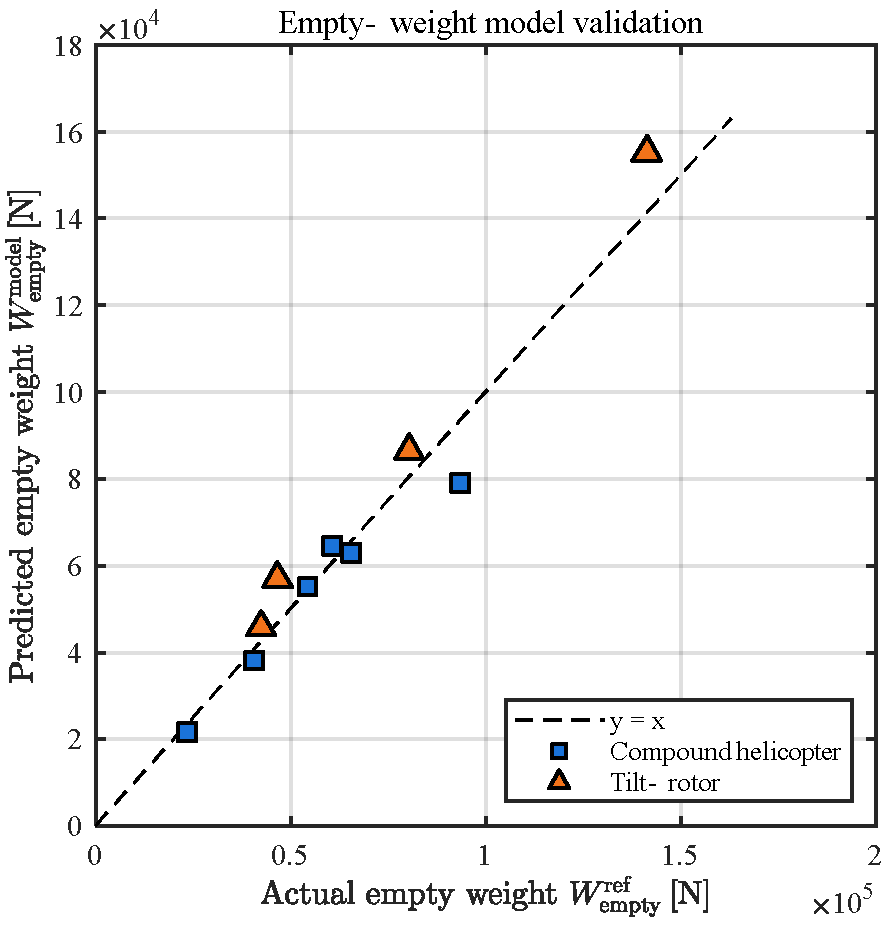
Due to the scarcity of mature compound-helicopter platforms available for comparison, additional tilt-rotor aircraft data was collected to further validate the engineering applicability of the proposed empty-weight model. Although tilt-rotor aircraft are structurally less similar to the CRHA than compound helicopters, they share several common weight components, including rotors, wings, fuselage, propulsion, and transmission systems. A total of ten aircraft data points were collected from Wikipedia and official websites for empty-weight model validation. The validation results are illustrated in Figure 10 below (the underlying data are provided in Appendix A).
For the sample of 10 compound helicopters and tilt-rotor aircraft, the proposed weight model exhibited an average deviation of 0.932%, with a standard deviation of 10.9%, indicating moderate dispersion among different aircraft configurations. Additionally, the root mean square error (RMSE) was calculated as 10.4%, falling within the acceptable 10% range commonly adopted in conceptual design. Thus, it can be concluded that the developed empty-weight model is suitable not only for compound helicopter configurations but also for tilt-rotor aircraft, strongly suggesting its applicability to the CRHA configuration as well.

4.1.2. Fuel-Weight Model Validation

Fuel weight is primarily determined by the mission profile and flight-performance requirements. Although no mature CRHA aircraft currently exist, its mission profile closely resembles that of tilt-rotor aircraft, characterized by VTOL combined with high-speed, long-range cruise. Therefore, validation of the CRHA fuel-weight model preferentially draws upon tilt-rotor aircraft data. The XV-15 tilt-rotor aircraft is selected as the comparative benchmark [75], with validation results summarized in Table 11.
The results indicate that the proposed fuel-weight model yields an error of approximately 6.0% compared to the actual fuel weight of the XV-15, which is relatively small. Therefore, the fuel-weight model can be considered suitable for tilt-rotor aircraft with mission profiles similar to the CRHA.
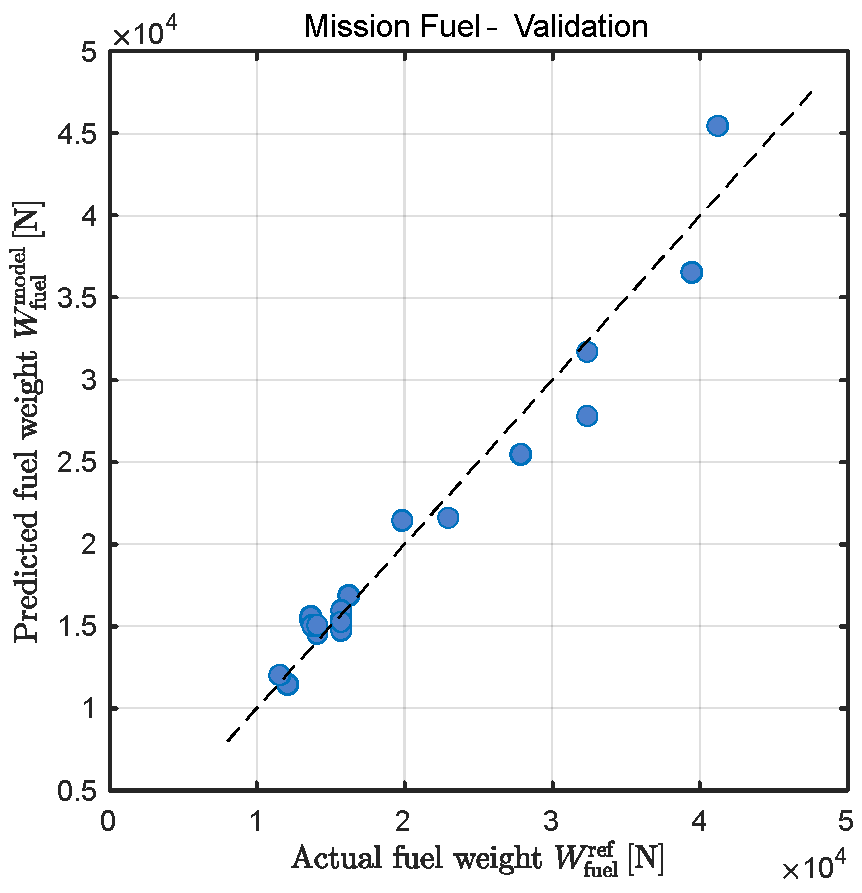
Given the scarcity of publicly available tilt-rotor fuel-weight data, and since the fixed-wing flight mode accounts for the majority of the CRHA mission profile, further validation was performed using fixed-wing aircraft with similar flight-performance requirements. The CRHA’s fixed-wing flight mode closely resembles that of twin-turboprop transport aircraft. Thus, a total of 20 data points for twin-turboprop transport aircraft were collected to validate the fuel-weight model. The validation results are presented in Figure 11 below (the underlying data are provided in Appendix A).
For the set of 20 twin-turboprop transport aircraft, the proposed model exhibits an average deviation of 1.34% and a standard deviation of 7.67%, indicating a moderate dispersion among different aircraft models. The root mean square error (RMSE) is 8.13%, comfortably within the 10% range acceptable for conceptual design. Therefore, it can be concluded that the fuel-weight model is highly applicable for high-speed, long-range twin-turboprop transport aircraft profiles and is consequently suitable for the CRHA configuration, which predominantly operates in twin-turboprop flight mode.

4.1.3. Maximum Takeoff Weight Model Validation

Based on the validation results of the empty-weight and fuel-weight models, it is evident that the CRHA empty-weight model is suitable for compound helicopters and tilt-rotor aircraft, while the fuel-weight model is applicable to tilt-rotor aircraft and twin-turboprop transport aircraft. Integrating these results, the integrated weight-estimation model is assessed for internal consistency on a tilt-rotor archetype, reflecting the mission commonality with the target CRHA configuration. Therefore, tilt-rotor aircraft are selected as the validation benchmark for the CRHA MTOW model.
Still using the XV-15 as the reference aircraft, partial parameters remain consistent with those listed previously in Table 11, with additional parameters and optimal results as follows in Table 12:
As shown in the table above, when input design variables match those of the XV-15, the optimized CRHA MTOW differs from the XV-15 by about 6%. Thus, the CRHA MTOW model is demonstrated to yield rational and engineering-accurate results.
The present optimization and validation are explicitly scoped to 5–8-tone MTOW concepts, and within this scope, the optimization framework is validated by physical boundary checks against mature single-rotor helicopters and twin-turboprop transports of comparable scale, which serve as engineering reasonableness references.

4.2. Validation of the Optimization Method

4.2.1. Design Variable Ranges and Optimization Results

Based on the design targets outlined previously, the CRHA examined in this study features a MTOW between 5 and 8 tones. Due to the absence of mature CRHA platforms and established comparative optimization methods, validation of the overall optimization framework must rely on alternative approaches. Therefore, this study employs existing helicopters and twin-turboprop transport aircraft within a similar MTOW range as reference cases, investigating their typical design-variable ranges. To ensure that the design space used in the global sensitivity analysis adequately encompasses the realistic distribution of current 5–8 t aircraft and allows some margin for future development, public technical data was gathered for 20 production aircraft—including 10 single-rotor helicopters and 10 twin-turboprop transport airplanes (original data can be found in Appendix A).
For each aircraft type, design parameters such as disk loading, power loading, wing loading, aspect ratio, rotor solidity, and tip speed were recalculated consistently under the assumptions of g = 9.8 m/s2 and 1 shp = 0.7457 kW. The resulting design variable ranges are summarized as follows in Table 13:
Based on the design variable ranges outlined above, the optimized performance parameters, MTOW, and empty weight are determined as follows in Table 14:

4.2.2. Rationality Analysis of Result

  • Analysis of Design Variable Values
From the optimized design-variable values it can be seen that: the rotor tip speed is 218.76 m/s, and in the transition mode the maximum tip-Mach condition reaches its limit, V t i p + V f i x e d , m i n 0.85 a c , indicating that tip speed is constrained by the tip-Mach limit. The disk loading is 462.28 N/m² and the rotor solidity is 0.08, for which the blade-loading coefficient is about 0.2, close to its upper bound, indicating that disk loading is constrained by the blade-loading limit. The power loading is 42.47 N/kW; at this value the vertical takeoff power in helicopter mode is near its upper bound, indicating that power loading is constrained by the rotor-power boundary.
These results show that the design constraints are dominated by the helicopter mode. In this mode, the engine must produce sufficient lift through the rotor to support the aircraft’s weight, while the blade-loading and tip-Mach limits constrain the feasible values of rotor radius, solidity, and tip speed. As a result, power loading is pushed to its limit. In contrast, during fixed-wing flight, the propeller only needs to overcome aerodynamic drag—which is significantly lower than the weight—making the fixed-wing constraints much easier to satisfy.
2.
Analysis of Weight Breakdown
Comparing the optimized final results with the weight data of the reference aircraft—B300 King Air 350i and AW139—selected based on similar design requirements, yields the outcomes presented in the following Table 15.
The comparison shows that the empty-weight fraction of the CRHA is 68.38%, close to the B300’s 66.02% and higher than the AW139’s 56.59%. In terms of weight fractions, the CRHA’s empty-weight fraction is higher than both a same-class turboprop and a helicopter because the CRHA carries both most fixed-wing components and the helicopter rotor and transmission, which raises empty weight. Since more of the CRHA’s components are similar to that of a fixed-wing aircraft, its empty-weight fraction is closer to the B300. The fuel fraction of the CRHA is 21.59%, lower than the B300’s 23.96% and higher than the AW139’s 19.60%. This is because the CRHA’s design uses high wing loading and high aspect ratio, giving better cruise efficiency than the B300; at the same time, its required range is larger than that of the helicopter, so the fuel fraction lies between the two.
Under the same cruise conditions and same payload, the CRHA’s MTOW is 66.92 kN, near the B300’s 67.03 kN. The CRHA’s empty weight is slightly higher than the B300’s, mainly due to the additional rotor system and transmission are equal to the changes of UAV-system. The CRHA’s fuel weight is slightly lower than the B300’s because the broader design space (higher wing loading and higher aspect ratio) improves cruise efficiency and reduces fuel use. In summary, the optimized MTOW and the resulting weight breakdown are physically reasonable engineering-wise.

5. Sensitivity Analysis

Sensitivity analysis quantifies the degree to which design variables affect subsystem weights and the overall MTOW. In this section, both local sensitivity analysis and Sobol-type global sensitivity analysis [76] are employed to evaluate the impacts of design variables on system weights.
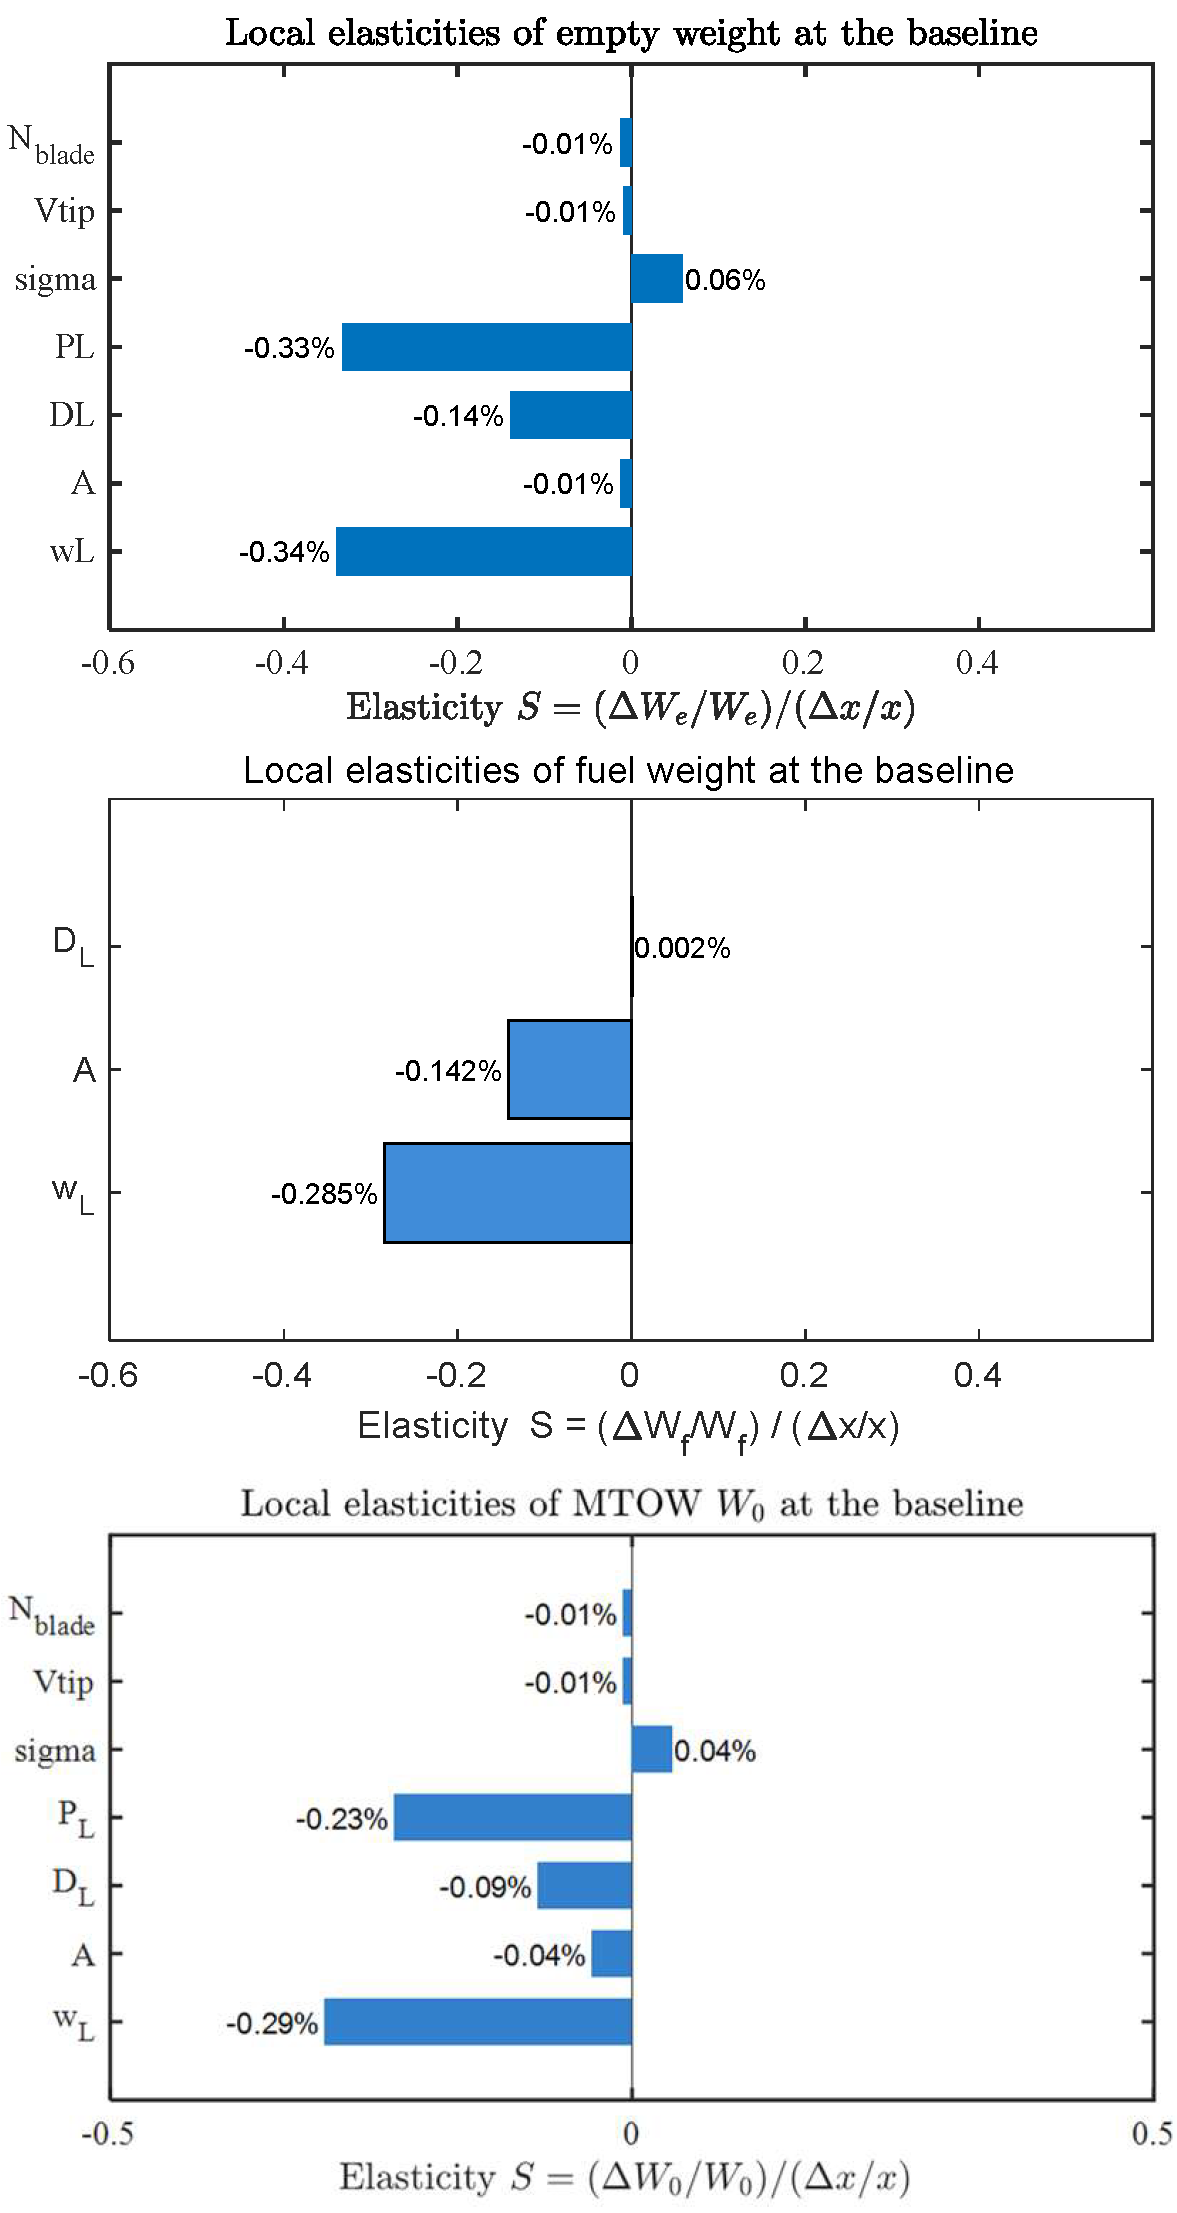
As the empty-weight and fuel-weight sub-models are explicit with respect to the design variables and, at the baseline, are independent of the optimization loop, we evaluate dimensionless, gradient-based local elasticities at the validated design point to verify signs and magnitudes. Conversely, MTOW is obtained implicitly by solving an optimization problem over the design space; hence, pointwise gradients alone may be misleading. We therefore treat local MTOW sensitivities as diagnostic (design-point) information while using Sobol first-order and total-effect indices over the admissible bounds to rank drivers and capture interactions.

5.1. Local Sensitivity Analysis of the System Weight Model

In this section, a local sensitivity analysis of the system weight is conducted using the design point identified during the optimization validation described in Section 4.1 as the baseline. The analysis aims to quantify the relative influence of each design variable on empty weight, fuel weight, and MTOW in the immediate neighborhood of the design point. The elasticity metric is defined as
S Y , x = Y / Y x / x = x Y Y x
and is evaluated via central finite differences with ±1% perturbations of each continuous variable about the baseline (provided in Table 16). In the empty-weight analysis, W 0 is held constant to avoid artificial feedback through model terms that scale with gross weight. Integer variables (number of blades) are treated by ±1-blade finite differences and are not mixed with continuous-variable elasticities in the same plot.
MTOW is obtained implicitly from the closure
F = W e + W f u l e + W p a y l o a d W 0 = 0
Therefore, its pointwise derivatives follow the implicit-function relation
W 0 x i = F / x i F / W 0 S W 0 , x i = x i W 0 W 0 x i
Figure 12 illustrates the local sensitivity of empty weight, fuel weight, and MTOW to each design variable.
The local elasticities at the baseline design point show that wing loading, power loading and disk loading exert the largest effects on operating empty weight. Wing loading appears negative (−0.34% per 1%) because higher wing loading reduces wing area and the structural mass of the wing/tail group. Power loading is negative (−0.33% per 1%) since higher power loading (more weight per unit installed power) implies lower rated power and reduced engine/installation mass. Increasing disk loading reduces rotor diameter and associated blade and hub masses, yielding a negative elasticity (−0.14% per 1%). Rotor solidity is positive (0.21% per 1%), as larger total blade area increases blade mass. Aspect ratio, solidity, tip speed and blade number have a small effect (less than 0.05% per 1%) because their structural contribution is largely captured indirectly through wing loading and disk loading instead of these four parameters.
The fuel-weight elasticities are dominated by wing loading and aspect ratio. Wing loading is strongly negative (−0.285% per 1%) because, in cruise-dominated missions, parasite drag prevails; increasing wing loading reduces wing area and drag, improving range fuel economy. Aspect ratio is also negative (−0.142% per 1%) via reduced induced drag; its smaller magnitude reflects the minor share of induced drag in the selected cruise condition. Disk loading shows a near-zero, slightly positive elasticity (0.002% per 1%) since its influence is concentrated in hover/transition segments, which occupy a small fraction of the overall mission energy budget.
The MTOW elasticities are consistent with a weighted combination of the empty-weight and fuel-weight effects at the baseline. Wing loading remains the single most influential driver (−0.29% per 1%), reflecting its sizeable empty-weight and fuel weight. Wing loading is similarly important and negative (−0.23% per 1%) owing to the sizeable empty weight leverage coupled. Disk loading is negative(-0.09% per 1%) through its empty-weight channels. Aspect ratio, solidity, tip speed and blades number are small influence(less than 0.05% per 1%). The local ordering at the baseline is therefore physically well-founded.

5.2. Global Sensitivity Analysis of MTOW

Global sensitivity analysis evaluates how variations in the input design variables across the entire design space affect the output parameter (MTOW). It not only assesses the effect of individual variables on the output but also captures interaction effects between variables.
In global sensitivity analysis, the first-order sensitivity index S 1 i (effect of single variable changes) and the total-effect sensitivity index S T i (considering both direct and interaction effects) can be defined as follows:
S 1 i = V a r E Y X i V a r Y S T i = 1 V a r E Y X i V a r Y
where:
Y represents the output (MTOW in this study);
Xi denotes the i-th design variable;
Xi indicates all design variables except Xi;
E(YXi) is the conditional expectation of output Y given Xi;
Var(∼) denotes the variance operator.
The difference between the total-effect index and the first-order index reflects the interactions between the variables.
Here, the first-order sensitivity index S 1 i quantifies the contribution of the individual variable alone to the variance of the output, whereas the total-effect sensitivity index S T i captures the cumulative impact of the variable itself along with its interactions with other variables. The difference between these two indices represents the degree of interaction between the variable of interest and the other variables. The ranges of the design variables match those described previously in Section 4.2.
The results of the global sensitivity analysis are summarized in Table 17 below:
According to the Sobol sensitivity analysis results, wing loading is the dominant driver of MTOW (S1 = 0.5996, ST = 0.6387), followed by power loading (S1 = 0.3378, ST = 0.3799) and dick loading (S1 = 0.0143, ST = 0.0153). Aspect ratio and rotor solidity contribute modestly (S1 = 0.0015 and 0.0012), whereas tip speed and blade number are negligible. Comparing first-order and total-effect sensitivity indices reveals that the difference between their sums across all design variables is only approximately 10%, and the sum of first-order indices is 0.95. This indicates weak interactions among the design variables within the considered global design space. The ordering is consistent with the local sensitivity: variables with both sizeable gradients and wide ranges (wing and power loading) dominate, while those with large local gradients but narrow admissible ranges (e.g., solidity, tip speed) contribute little to global variance.
Combined with the results of local sensitivity and global sensitivity analysis, a CRHA fast parameter-selection scheme can be obtained. Bracket wing loading globally is first, since it shows the highest global sensitivity and a large local gradient at the design point. Next, we define the feasible region for wing loading, disk loading, and power loading according to the constraints, as disk loading and power loading rank immediately after wing loading in global sensitivity and also exhibit strong local gradients. Finally, we fine-tune rotor solidity and aspect ratio, as the admissible range is narrow but local gradient at the design point is high. Tip speed and blades number have minor influence and can be fixed at nominal values in conceptual sizing.
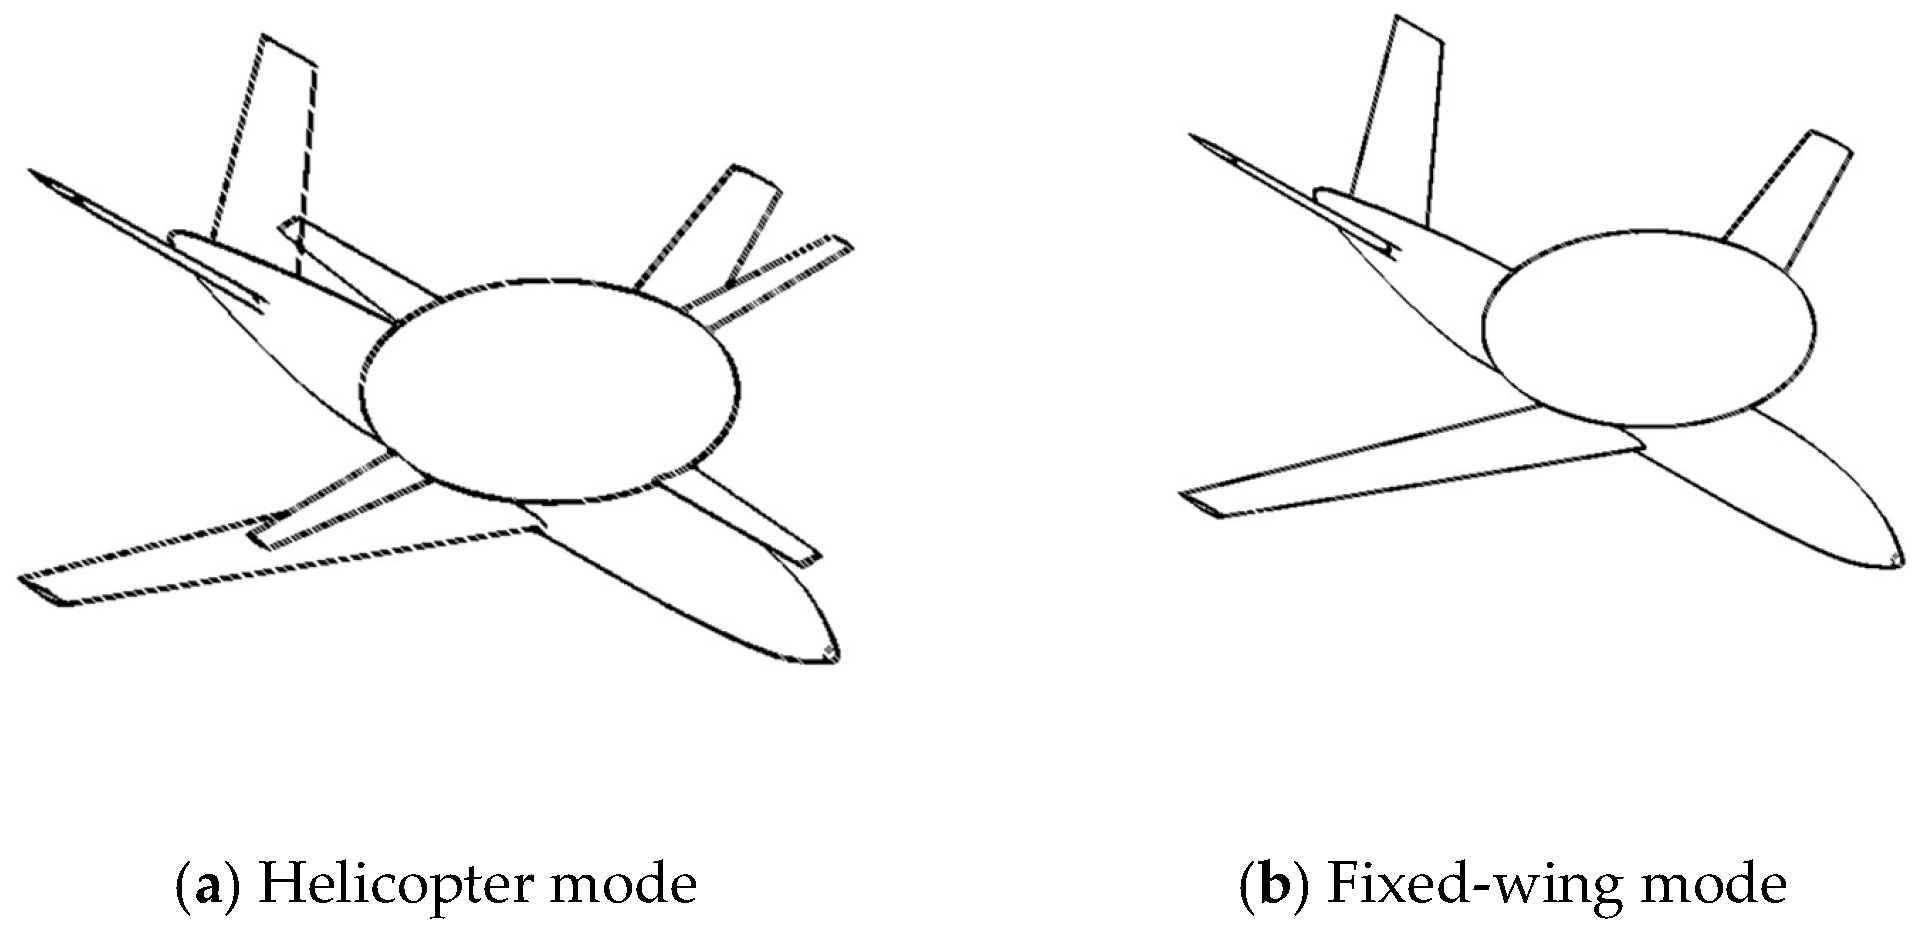
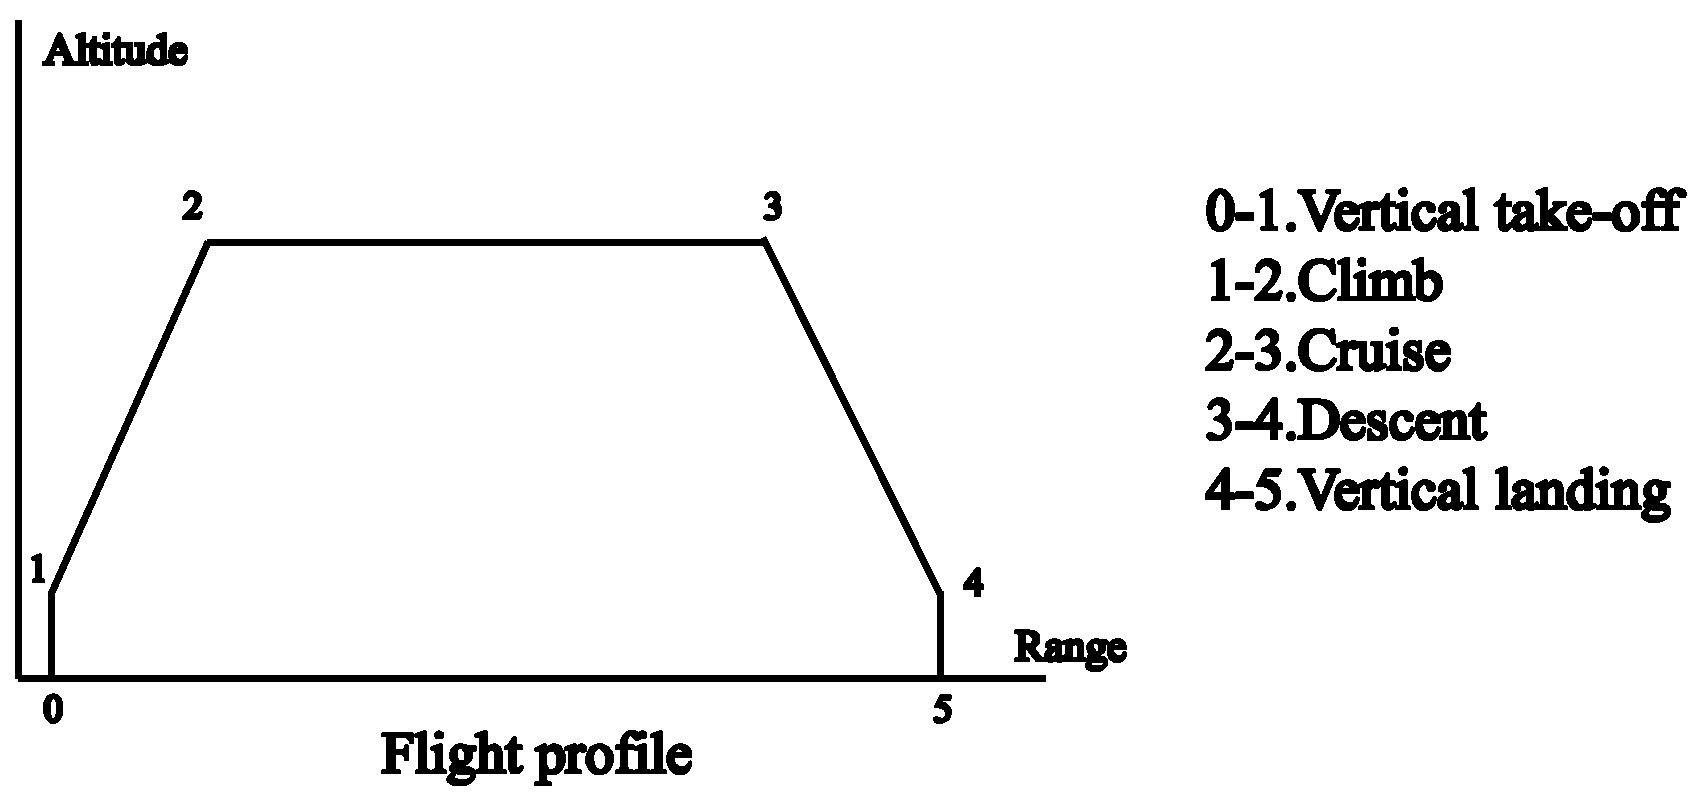
6. Conclusions

This paper established an MTOW optimization model for CRHA by directly coupling key design parameters with mission-segment-based fuel weight and component-based empty weight. A hybrid “global GA search + local SQP” strategy was adopted, forming a methodology for selecting key design parameters and estimating MTOW during the early design stage of CRHA. The rationality of the empty weight model, fuel weight model, and optimization framework was validated through comparison with aircraft that have similarities in partial mission segments and component composition. Furthermore, both local sensitivity at the optimal design point and global sensitivity across the design variable space were quantitatively assessed for seven key design parameters.
The main conclusions of this study are as follows:
  • Due to similarities in certain mission segments and component composition, the proposed empty-weight model is applicable not only to the target CRHA configuration studied in this work but also to compound helicopters and tilt-rotor aircraft. Similarly, the fuel-weight model can be extended to twin-turboprop fixed-wing aircraft and tilt-rotors, in addition to CRHA. Furthermore, the MTOW model is also suitable for tilt-rotor aircraft.
  • Local sensitivity analysis at the design point indicates that the design variables with the greatest impact on empty weight are wing loading and power loading, while those with the most significant influence on fuel weight are wing loading and aspect ratio. The greatest impact variables on MTOW are wing loading, power loading and disk loading.
  • Global sensitivity analysis demonstrates that wing loading exerts the greatest influence on MTOW, followed by power loading and disk loading, together accounting for over 90% of total MTOW variance. Additionally, interactions among design variables are weak.
  • Both local and global sensitivity analyses indicate that an efficient parameter-selection scheme in conceptual sizing for CRHA is to first globally position wing loading, followed by disk loading and power loading, and then fine-tune the rotor solidity and aspect ratio. Tip speed and blade number can be fixed at nominal values in conceptual sizing.
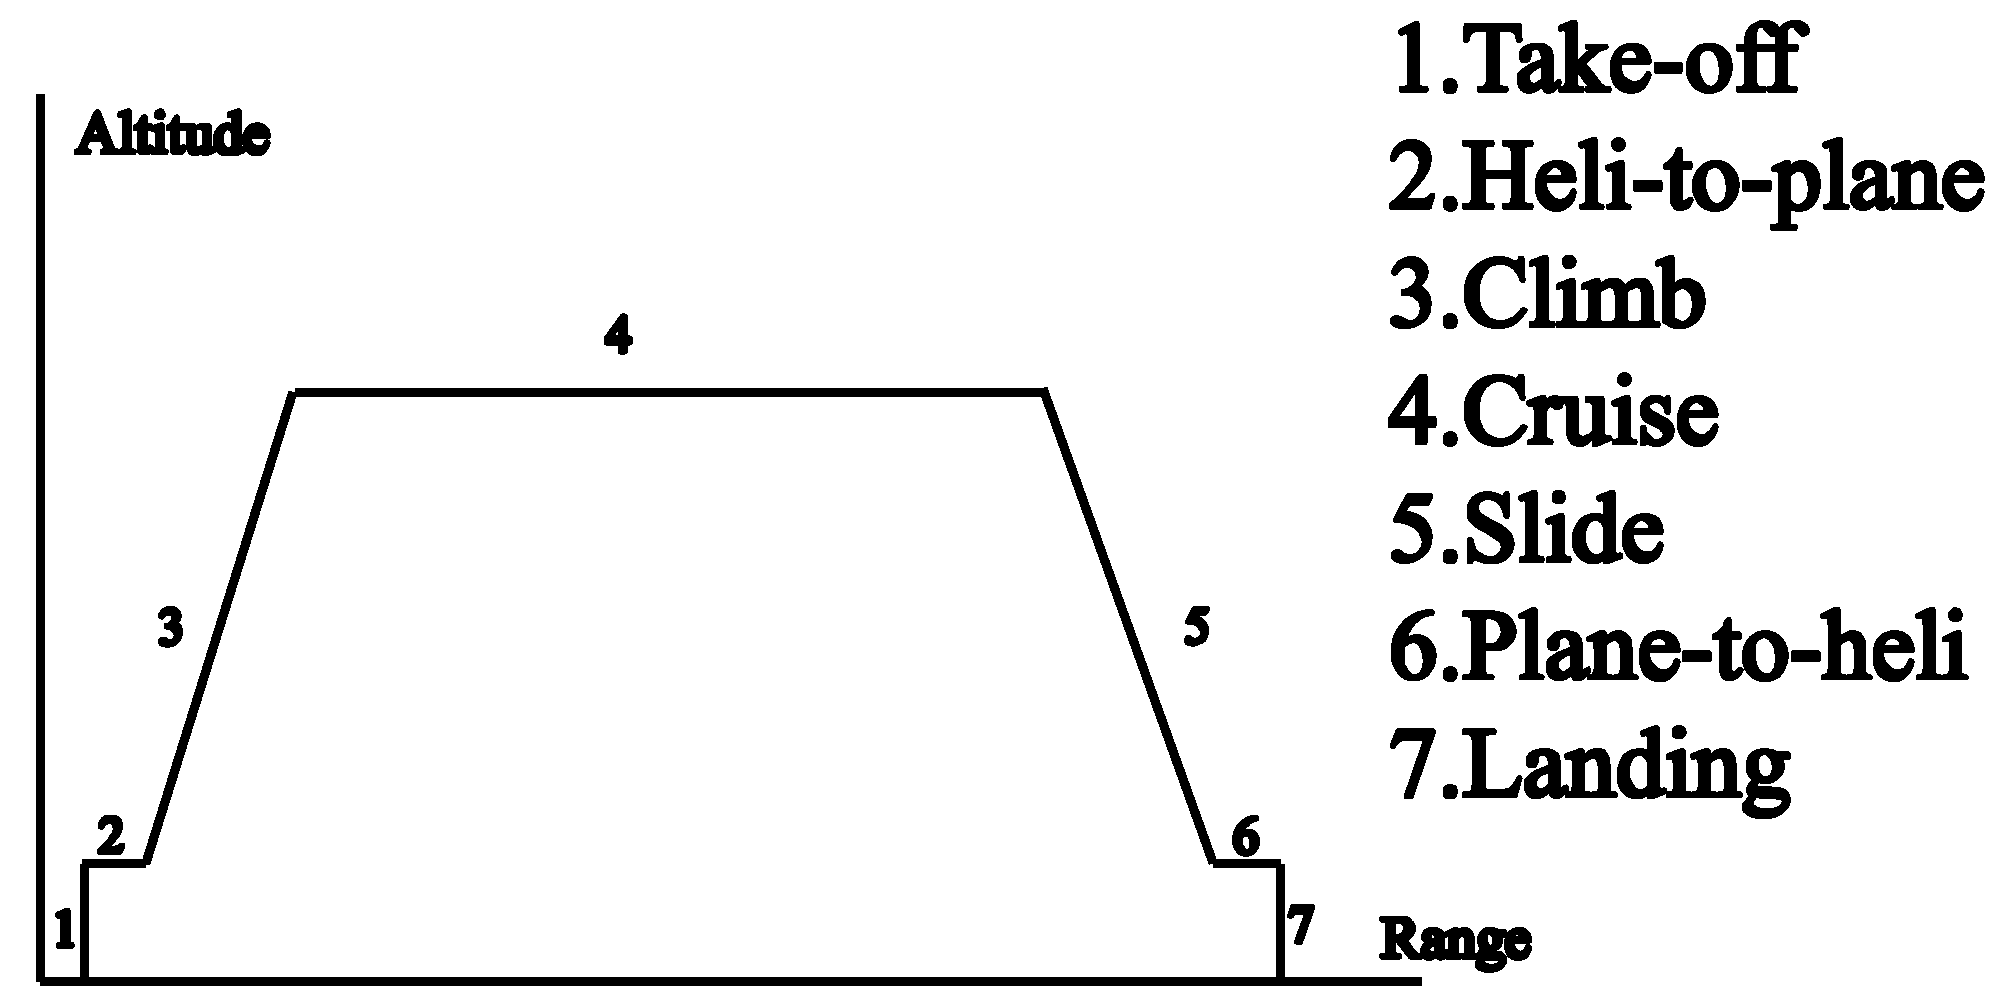
Limitations and scope.
The present sizing framework uses class-based parameters and literature-calibrated surrogates rather than fully resolved aero-structural models; quantitative validity is therefore confined to wing-supported compound rotorcraft in the 5–8 t MTOW class. Key simplifications are: (i) empty and fuel-weight estimates follow component build-up with coefficients taken from transport/tilt-rotor sources rather than physics-derived structural models; (ii) transition segments are evaluated by quasi-steady energy accounting using a single-point effective L/D baseline and constant propulsor efficiency/SFC; (iii) rotor–wing aerodynamic interference, control-law scheduling, and structural/thermal margins are not modelled explicitly. The method is intended for conceptual-design screening and initial weight/mission estimates. Future refinement requires configuration-specific CFD/FEA and dynamic simulations to characterize rotor–wing interactions and to calibrate CL and CD, as well as weight-model coefficients.

Author Contributions

Conceptualization, M.Y., Z.W., and D.Y.; methodology, M.Y. and D.Y.; software, M.Y. and J.C.; validation, J.C. and R.D.; resources, R.D.; data curation, M.Y.; writing—original draft preparation, M.Y.; writing—review and editing, Z.W. and D.Y. All authors have read and agreed to the published version of the manuscript.

Funding

This study was supported by the National Key Research and Development Program of China (2023YFB3905701).

Data Availability Statement

The original contributions presented in this study are included in the article. Further inquiries can be directed to the corresponding author.

Conflicts of Interest

The authors declare no conflicts of interest.

Nomenclature

Aaspect ratio
a c local speed of sound
A r rotor disk area
cblade chord
C D 0 zero-lift drag coefficient
c p engine-specific fuel consumption
c p , h SFC in helicopter and transition flight modes
c p , f SFC in fixed-wing mode
D c r u i s e drag in cruise segment
D L disk loading
eOswald efficiency factor
f c o c k p i t cockpit correction factor
f e x p o exposed area factor
f f o l d rotor-folding factor
f i fuel fraction during segment i
f L G fuel fraction during segment i
f m a t material correction factor
f n overload correction factor
f U A S UAV system correction factor
h h o v e r hover altitude
ggravitational acceleration
k l t tail arm ratio
k w e t fuselage wetted-area factor
L/Dlift-to-drag ratio
m b a s e fuel mass for state-sustaining
m E fuel mass for energy rate
m f i fuel mass consumed during segment i
m i - 1 aircraft mass at the start of segment i
N b l a d e number of blades
n r e f reference load factor
n u a v maneuvering load factor
P b a s e state-sustaining baseline power
P c r u i s e power in cruise segment
P E energy-rate power
P e n g engine power
P h o v e r hover-induced power
P i power required during segment i
P L power loading
P r i s e vertical takeoff power
P r o t rotor power
q d y n dynamic pressure
R range of cruise
R r rotor radius
S Y , x local elasticity of Y with respect to x
S 1 i effect of single variable changes
S H T horizontal tail exposed areas
S T i considering both direct and interaction effects
S V T vertical tail exposed areas
S W wing reference area
S w e t fuselage wetted area
Trotor thrust
t a d d additional flight time
t i time duration of segment i
Vcruise speed
V C vertical takeoff speed
V c l i m b climb speed
V D vertical landing speed
V f i x e d , min minimum forward-flight speed
V H T horizontal tail volume coefficient
V s t a l l stall speed
V t i p tip speed
V V C vertical climb speed in climb segment
V V T vertical tail volume coefficient
W 0 maximum takeoff weight
W e empty weight
W e l s e all-else weight
W e n g engine weight
W f u e l fuel weight
W f u s fuselage weight
W H T horizontal tail weight
W h u b hub weight
W i aircraft weight at the end of segment i
W i n s t , e n g installed engine weight
w L wing loading
W L G landing gear weight
W l o a d load-bearing component weight
W p a y l o a d payload weight
W t r a n transmission system weight
W u n l o a d non-load-bearing component weight
W V T vertical tail weight
W W wing weight
W x consumed fuel weight of the overall flight profile
Abbreviations
CRHAcollectible rotor hybrid aircraft
GAgenetic algorithm
MTOWmaximum takeoff weight
NDARCNASA Design and Analysis of Rotorcraft
SFCspecific fuel consumption
SQPsequential quadratic programming
UAVunmanned aerial vehicle
VTOLvertical takeoff and landing
Subscripts
maxmaximum value
minminimum value
Greek symbols
χ e n g specific power of the turboshaft/turboprop engine
γ climb angle
η c r u i s e cruise power fraction
η F ratio of reserve fuel and retained fuel
η p propeller efficiency
η r rotor efficiency
λ e l s e ratio of all-else weight to reference weight
λ i n s t ratio of installed engine weight to reference weight
λ L G ratio of landing gear weight to reference weight
ρ air density
ρ f u s ratio of fuselage weight to reference area
ρ H T ratio of horizontal tail weight to reference area
ρ V T ratio of vertical tail weight to reference area
ρ W ratio of wing weight to reference area
σ rotor solidity
Ω e n g engine rotational speed

Appendix A. Validation Datasets

Data provenance and standardization. Unless otherwise marked, Appendix A entries are sourced from Jane’s All the World’s Aircraft (2023/24) [77]. For legacy prototypes or when a specific field is missing in JAWA, we use FAA/EASA TCDS portals [78,79] or NASA authoritative monographs [53] as second sources. Each dataset row includes a Source code and a JAWA entry or TCDS ID, ensuring one-by-one traceability without proliferating citations. SI normalization assumes g = 9.80 m/s2, 1 shp = 0.7457 kW, and Jet-A density is 0.80 kg/L (used only when converting volumetric fuel capacities).
Table A1. Empty weight validation.
AircraftW0 (N)Wempty_Actual (N)Wempty_Model (N)Error_%
AH5681,40054,40058,4727.49
X49A97,30060,76062,2992.53
S72116,50093,440103,04010.27
S9748,90040,60038,547−5.06
X226,70023,56026,22111.30
Ka-50105,80075,50068,812−8.86
V22B269,000141,400147,2304.12
V280137,00080,40093,25615.99
AW60974,50046,68052,71512.93
XV1557,80042,50042,8090.73
Table A2. Fuel weight validation.
AircraftW0 (N)Wfuel_Actual (N)Wfuel_Model (N)Error_%
KingAirB20055,56616,19916,861.924.09
TwinOtter40055,56612,05411,443.96−5.06
CASA21279,38014,06314,574.923.64
Skyvan363,70013,62215,339.2012.61
DHC6-40055,56611,51512,012.074.32
M28Skytruck73,50015,68014,734.59−6.03
C212-20075,46014,06314,560.323.54
Skyvan-365,66013,62215,577.4714.36
EMB-110P157,82013,72015,029.679.55
C40886,24015,68015,531.01−0.95
L410NG68,60022,93221,584.58−5.88
Do328137,10232,34027,782.90−14.09
EMB120112,70015,68015,953.921.75
Saab340B128,91927,83225,460.68−8.52
B1900D76,087.219,815.621,428.258.14
M2879,38015,68015,257.75−2.69
C212-40079,38014,06315,043.356.97
F27-500193,775.432,34031,688.92−2.01
Westwind11,66041,16045,449.9010.42
Dash8-100147,00039,39636,523.32−7.29

References

  1. Wang, S.; Pereira, L.T.L.; Ragni, D. Design Exploration of UAM Vehicles. Aerosp. Sci. Technol. 2025, 160, 110058. [Google Scholar] [CrossRef]
  2. Dunford, P.J.; Marr, R.L. V-22 flight test update. Aeronaut. J. 1997, 101, 245–254. [Google Scholar] [CrossRef]
  3. McVeigh, M.A.; Liu, J.; O’Toole, S.J.; Woods, S. V-22 Osprey aerodynamic development—A progress review. Aeronaut. J. 1997, 101, 231–244. [Google Scholar] [CrossRef]
  4. Whiteside, A.; Pollard, B. Conceptual Design of a Tiltduct Reference Vehicle for Urban Air Mobility; National Aeronautics and Space Administration (NASA): Washington, DC, USA, 2021.
  5. Doff-Sotta, M.; Cannon, M.; Bacic, M. Fast Optimal Trajectory Generation for a Tiltwing VTOL Aircraft with Application to Urban Air Mobility. In Proceedings of the 2022 American Control Conference (ACC), Atlanta, GA, USA, 8–10 June 2022; IEEE: Atlanta, GA, USA, 2022; pp. 4036–4041. [Google Scholar]
  6. Lefevre, L.; Nowinski, V.; Delva, J.; Dazin, A. Experimental velocity fields evaluation of the rotor/propeller interactions for high-speed helicopters with different propeller positions. Exp. Fluids 2022, 63, 1–10. [Google Scholar] [CrossRef]
  7. Palaia, G.; Abu Salem, K.; Cipolla, V.; Binante, V.; Zanetti, D. A Conceptual Design Methodology for e-VTOL Aircraft for Urban Air Mobility. Appl. Sci. 2021, 11, 10815. [Google Scholar] [CrossRef]
  8. Zhang, J.; Liu, Y.; Zheng, Y. Overall eVTOL aircraft design for urban air mobility. Green Energy Intell. Transp. 2024, 3, 100150. [Google Scholar] [CrossRef]
  9. Ugwueze, O.; Statheros, T.; Horri, N.; Bromfield, M.A.; Simo, J. An Efficient and Robust Sizing Method for eVTOL Aircraft Configurations in Conceptual Design. Aerospace 2023, 10, 311. [Google Scholar] [CrossRef]
  10. Warwick, G. Boeing Model to Test Darpa’s High-Speed DiscRotor Concept; Aviation Week Intelligence Network: New York City, NY, USA, 2010. [Google Scholar]
  11. Stroub, R.H. Introduction of the M-85 High-Speed Rotorcraft Concept. NASA Technical Memorandum 102871; Ames Research Center: Moffett Field, CA, USA, 1991.
  12. Black, F.; Wei, W.; Cohen, K.; Britt, T. Proof of Concept Studies of the Morphing Modus VTOL UAV. In AIAA Infotech@Aerospace 2011; American Institute of Aeronautics and Astronautics (AIAA): St. Louis, MO, USA, 2011. [Google Scholar]
  13. Cui, Y.; Yan, D.; Wan, Z.; Wang, Y.; Zhang, X.; Guo, Q.; Teng, H.; Liu, Y.; Yang, M. Design and Realization of New Conceptual Collectible Rotor for Compound Aircraft. Trans. Jpn. Soc. Aeronaut. Space Sci. 2021, 64, 112–122. [Google Scholar] [CrossRef]
  14. Raymer, D.P. Aircraft Design: A Conceptual Approach; American Institute of Aeronautics and Astronautics, Inc.: Reston, VA, USA, 1991. [Google Scholar]
  15. Baklacioglu, T. Fuel flow-rate modelling of transport aircraft for the climb flight using genetic algorithms. Aeronaut. J. 2016, 119, 173–183. [Google Scholar] [CrossRef]
  16. Cai, Y.; Rajaram, D.; Mavris, D.N. Simultaneous aircraft sizing and multi-objective optimization considering off-design mission performance during early design. Aerosp. Sci. Technol. 2022, 126, 107662. [Google Scholar] [CrossRef]
  17. Horvath, B.L.; Wells, D.P. Comparison of aircraft conceptual design weight estimation methods to the flight optimization system. In Proceedings of the 2018 AIAA Aerospace Sciences Meeting, Kissimmee, FL, USA, 8–12 January 2018; AIAA Science and Technology Forum and Exposition. American Institute of Aeronautics and Astronautics: Kissimmee, FL, USA, 2019. [Google Scholar]
  18. Vegh, J.M.; MacDonald, T.; Munguıa, B. Determining Aircraft Sizing Parameters through Machine Learning; Aerospace Design Lab: Palo Alto, CA, USA, 2016. [Google Scholar]
  19. Tanabe, Y.; Aoyama, T.; Kobiki, N.; Sugiura, M. A conceptual study of high speed rotorcraft. In Proceedings of the 40th European Rotorcraft Forum, Southampton, UK, 2–4 September 2014. [Google Scholar]
  20. Yeo, H. Design and aeromechanics investigation of compound helicopters. Aerosp. Sci. Technol. 2019, 88, 158–173. [Google Scholar] [CrossRef]
  21. Russell, C.; Johnson, W. Conceptual Design and Performance Analysis for a Large Civil Compound Helicopter. In Proceedings of the AHS Future Vertical Lift Aircraft Design Conference, San Francisco, CA, USA, 18–20 January 2012. [Google Scholar]
  22. Kamal, A.M.; Serrano, A.R. Design methodology for hybrid (VTOL + Fixed Wing) unmanned aerial vehicles. Aeronaut. Aerosp. Open Access J. 2018, 2, 165–176. [Google Scholar] [CrossRef]
  23. Cetinsoy, E.; Dikyar, S.; Hancer, C.; Oner, K.T.; Sirimoglu, E.; Unel, M.; Aksit, M.F. Design and construction of a novel quad tilt-wing UAV. Mechatronics 2012, 22, 723–745. [Google Scholar] [CrossRef]
  24. Zeng, C.; Abnous, R.; Gabani, K.; Chowdhury, S.; Maldonado, V. A new tilt-arm transitioning unmanned aerial vehicle: Introduction and conceptual design. Aerosp. Sci. Technol. 2020, 99, 105755. [Google Scholar] [CrossRef]
  25. Pedro, S.; Tomás, D.; Vale, J.L.D.; Suleman, A. Design and performance quantification of vtol systems for a canard aircraft. Aeronaut. J. 2021, 125, 1768–1791. [Google Scholar] [CrossRef]
  26. Tyan, M.; Nguyen, N.V.; Kim, S.; Lee, J. Comprehensive preliminary sizing/resizing method for a fixed wing—VTOL electric UAV. Aerosp. Sci. Technol. 2017, 71, 30–41. [Google Scholar] [CrossRef]
  27. Tanner, M.N. Performance flight test of a B300 King Air fitted with Blackhawk XP67A engines. J. Aircraft 2023, 60, 765–777. [Google Scholar]
  28. Celi, R. Operational performance assessment of the AW139 in offshore transport. Aeronaut. J. 2024, 128, 1514–1537. [Google Scholar]
  29. Weibel, D.; Huber, P. Flight-envelope expansion and endurance analysis of the MQ-9A. J. Aerosp. Eng. 2024, 37, 4023086. [Google Scholar]
  30. Johnson, W. NDARC-NASA Design and Analysis of Rotorcraft; NASA TP 2015-218751; NASA Technical Publication: Washington, DC, USA, 2015.
  31. Safran, H.E. ANETO-1K (Product Brochure); Safran Helicopter Engines: Bordes, France, 2025. [Google Scholar]
  32. Pratt, W.C. PT6C Engine; Pratt & Whitney: East Hartford, CT, USA, 2025. [Google Scholar]
  33. European Union Aviation Safety Agency. Type-Certificate Data Sheet No. E.009: RTM 322 and ANETO-1 Series Engines; European Union Aviation Safety Agency: Cologne, Germany, 2024. [Google Scholar]
  34. European Union Aviation Safety Agency. Type-Certificate Data Sheet No. EASA.IM.R.001: Sikorsky S-92A; European Union Aviation Safety Agency: Cologne, Germany, 2021. [Google Scholar]
  35. European Aviation Safety Agency. Type-Certificate Data Sheet No. IM.E.232: LHTEC CTS800 Series Engines (Variant CTS800-4N); European Aviation Safety Agency: Cologne, Germany, 2008. [Google Scholar]
  36. Leishman, J.G. Introduction to Aerospace Flight Vehicles; Embry-Riddle Aeronautical University: Daytona Beach, FL, USA, 2025. [Google Scholar]
  37. Roskam, J. Airplane Design Part I: Preliminary Sizing of Airplanes. DARcorporation: Lawrence, KS, USA, 1985. [Google Scholar]
  38. Torenbeek, E. Advanced Aircraft Design: Conceptual Design, Analysis and Optimization of Subsonic Civil Airplanes. John Wiley & Sons: Chichester, UK, 2013. [Google Scholar]
  39. United States Department of Defense. Unmanned Aircraft Systems Roadmap 2005–2030; Department of Defense: Washington, DC, USA, 2005.
  40. Gudmundsson, S. General Aviation Aircraft Design: Applied Methods and Procedures; Butterworth-Heinemann: Oxford, UK, 2014. [Google Scholar]
  41. S. Army Materiel Command. Engineering Design Handbook—Helicopter Engineering, Part 1: Preliminary Design; Department of the Army: Washington, DC, USA, 1974.
  42. Prouty, R.W. Helicopter Aerodynamics. Volume I; Lulu Press: Morrisville, NC, USA, 2009; Volume 1. [Google Scholar]
  43. Prouty, R.W. Helicopter Aerodynamics. Volume II; Lulu Press: Morrisville, NC, USA, 2009; Volume 2. [Google Scholar]
  44. Johnson, W. Helicopter Theory; Dover Publications: Mineola, NY, USA, 1994. [Google Scholar]
  45. Leishman, J.G. Principles of Helicopter Aerodynamics; Cambridge University Press: Cambridge, UK, 2006. [Google Scholar]
  46. Yang, X.; Collins, K.B.; Mello, A.W., Jr. Mission-Specific Preliminary Design and Weight Optimization for High-Speed Vertical Takeoff and Landing (HSVTOL) Aircraft. In Proceedings of the 2024 AIAA SciTech Forum; American Institute of Aeronautics and Astronautics: Orlando, FL, USA, 2024. [Google Scholar]
  47. Chopra, I.; Datta, A. Helicopter Dynamics: ENAE 633 Course Notes; Alfred Gessow Rotorcraft Center, Department of Aerospace Engineering, University of Maryland: College Park, MD, USA, 2011. [Google Scholar]
  48. Federal, A.A. Helicopter Flying Handbook. U.S. Department of Transportation: Washington, DC, USA, 2023.
  49. Hönicke, M.; Schüller, J.; Et, A. Compound Helicopter X3 in High-Speed Flight: Correlation of Simulation and Flight Test. In Proceedings of the AIAA AVIATION Forum, Dallas, TX, USA, 17–21 June 2019. [Google Scholar]
  50. Pfau, N. AH-56 Cheyenne still an aircraft ‘way ahead of its time’. In Army.mil News; U.S. Department of the Army: Fort Novosel, AL, USA, 2018. [Google Scholar]
  51. Airbus, H. Airbus Helicopters’ Racer is off to a flying start. In Press Release; Airbus: Toulouse, France, 2024. [Google Scholar]
  52. NASA, A.R.C.; Lee, J. Lockheed AH-56 Helicopter; Cheyenne, 40 x 80 ft (ARC-1969-AC-42561-1).jpg; Wikimedia Commons (Wikimedia Foundation): San Francisco, CA, USA, 1969. [Google Scholar]
  53. Maisel, M.D.; Giulianetti, D.J.; Dugan, D.C. The History of the XV-15 Tilt Rotor Research Aircraft: From Concept to Flight; NASA History Division: Washington, DC, USA, 2000; pp. 835–836. [Google Scholar]
  54. Johnson, W.; Et, A. Short-Haul Civil Tilt-Rotor TR-36 Conceptual Design Report; NASA Ames Research Center: Moffett Field, CA, USA, 1994.
  55. Acree, C.W., Jr.; Yeo, H.; Sinsay, J.D. Large Civil Tilt-Rotor (LCTR2) Technology Baseline; NASA Ames Research Center: Moffett Field, CA, USA, 2004.
  56. Russell, C.; Johnson, W. Exploration of Configuration Options for a Large Civil Compound Helicopter. In Proceedings of the American Helicopter Society 69th Annual Forum, Phoenix, Arizona, 21–23 May 2013; AHS International: Phoenix, AZ, USA, 2013. [Google Scholar]
  57. United, S.N. E-2 Hawkeye Airborne Command and Control Aircraft; U.S. Department of the Navy: Washington, DC, USA, 2021.
  58. United, S.A.F. E-3 Sentry (AWACS) Fact Sheet; U.S. Department of the Air Force: Washington, DC, USA, 2024.
  59. Northrop, G. E-2D Advanced Hawkeye. Available online: https://www.northropgrumman.com/what-we-do/aircraft/e-2d-advanced-hawkeye (accessed on 7 September 2025).
  60. NATO—Supreme Headquarters Allied Powers Europe. NATO AWACS Continues Serving as Eye in the Sky [Image; Photo ID 7936987]. NATO/USAF. Available online: https://www.dvidshub.net/image/7936985/nato-awacs-continues-serving-eye-sky?utm_source (accessed on 2 October 2025).
  61. GlobalAir. Boeing 707-320B—Specifications, Performance and Range; GlobalAir Aviation Marketplace: Louisville, KY, USA, 2025. [Google Scholar]
  62. Wagner, M.J. AEW Aircraft Design; Naval Postgraduate School: Monterey, CA, USA, 1992. [Google Scholar]
  63. Toor, Z.G.; Masud, J.; Khan, T.I.; Mufti, B.; Khan, O. Comparative Analysis of Aerodynamic Characteristics of a Transport Aircraft and its AWACS Variant. In Proceedings of the AIAA SciTech 2020 Forum, American Institute of Aeronautics and Astronautics, Orlando, FL, USA, 6–10 January 2020. [Google Scholar]
  64. Turgut, E.T.; Rosen, M.A. Relationship between fuel consumption and altitude for commercial aircraft during descent: Preliminary assessment with a genetic algorithm. Aerosp. Sci. Technol. 2012, 17, 65–73. [Google Scholar] [CrossRef]
  65. Seddon, J.; Newman, S. Basic Helicopter Aerodynamics; John Wiley & Sons, Ltd.: Hoboken, NJ, USA, 2011. [Google Scholar]
  66. Varga, B. Power Sources of Military Helicopters. Acad. Appl. Res. Mil. Public Manag. Sci. 2018, 17, 139–168. [Google Scholar] [CrossRef]
  67. Antas, S. The Aero-Thermodynamic Aspects of the Methods for Design Modifications of Turboprop and Turboshaft Engines. Arch. Mech. Eng. 2000, 47, 225–239. [Google Scholar]
  68. Aviation, S.C. Are Turboprops More Efficient Than Piston Engines (Thrust per Fuel Consumption)? 2015. Available online: https://aviation.stackexchange.com (accessed on 7 September 2025).
  69. Air Accidents Investigation Branch. AAIB Bulletin 6/2010: Incident—DHC-8-402 Dash 8 Q400, G-JEDM (EW/C2009/03/03) Near Southampton, 3 March 2009; Air Accidents Investigation Branch, UK Department for Transport: Farnborough, UK, 2010.
  70. Teledyne, C.; AVCO, L. Engine Operation for Pilots (P-8740-13). In FAASafety.gov Learning Center Library; FAA Safety Team (FAASTeam): Houston, TX, USA, 1978. [Google Scholar]
  71. Viking Air Limited. Twin Otter Series 400 Multi-Page Brochure; Viking Air Limited: Sidney, Australia, 2015. [Google Scholar]
  72. General Atomics AeroTec Systems GmbH. Do228 NXT—Technical Data; General Atomics AeroTec Systems GmbH: Munich, Germany, 2025. [Google Scholar]
  73. Aircraft Industries. L 410 NG—Catalog (Performance); Aircraft Industries: Kunovice, Czech Republic, 2025. [Google Scholar]
  74. Silva, C.; Yeo, H.; Johnson, W. Design of a Slowed-Rotor Compound Helicopter for Future Joint Service Missions. In Proceedings of the American Helicopter Society Aeromechanics Specialists’ Conference, San Francisco, CA, USA, 20–22 January 2010; pp. 1–16. [Google Scholar]
  75. Wikipedia Contributors. Bell XV-15. Wikipedia, The Free Encyclopedia. Available online: https://en.wikipedia.org/wiki/Bell_XV-15 (accessed on 2 October 2025).
  76. Saltelli, A.; Annoni, P. Sensitivity Analysis; Springer: Berlin/Heidelberg, Germany, 2011; pp. 1298–1301. [Google Scholar]
  77. Jane’s Information Group. Janes All the World’s Aircraft: Development & Production 2023/2024; Jane’s Information Group: Croydon, UK, 2023. [Google Scholar]
  78. Federal Aviation Administration. Dynamic Regulatory System (DRS): Type Certificate Data Sheets; Federal Aviation Administration: Washington, DC, USA, 2025.
  79. European Advertising Standards Alliance. Type Certificates (TCDS) Portal; EASA: Brussels, Belgium, 2025. [Google Scholar]
Figure 1. Conceptual CRHA scheme.
Drones 09 00690 g001
Figure 2. Flight profile and segments.
Drones 09 00690 g002
Figure 3. Revised mission flight profile.
Drones 09 00690 g003
Figure 4. CRHA vs. X-3 and AH-56 [51,52].
Drones 09 00690 g004
Figure 5. CRHA vs. E-2 and E-3 [59,60].
Drones 09 00690 g005
Figure 6. Isometric view of baseline aircraft (left) and its AWACS based variant (right).
Drones 09 00690 g006
Figure 7. Wing loading–power loading matrix.
Drones 09 00690 g007
Figure 8. Disk loading–power loading matrix.
Drones 09 00690 g008
Figure 9. Framework of parameter optimization method.
Drones 09 00690 g009
Figure 10. Empty weight model validation.
Drones 09 00690 g010
Figure 11. Fuel weight model validation.
Drones 09 00690 g011
Figure 12. Local sensitivity of empty weight, fuel weight, and MTOW.
Drones 09 00690 g012
Table 1. Design requirements and values.
Design RequirementsValues
Payload weight6712 N
Cruise speed160 m/s
Range2843 km
Cruising altitude7925 m
VTOL capabilityYES
Table 2. Weight to area ratios.
ComponentsWeight to Area (N/m2)Multiplier
Wing480Sexposed planform
Horizontal tail265Sexposed planform
Vertical tail265Sexposed planform
Fuselage235Swetted area
Values are transcribed from Aircraft Design (Raymer) [14], Table 15.2. Original units kg/m2 were converted to N/m2 using g = 9.8 m/s2.
Table 3. Non-loading component weight ratio.
ComponentsWeight Coefficient SymbolValue
Landing gear λ L G 0.043
engine χ e n g 1.75
Installed engine λ i n s t 1.3
All-else empty λ e l s e 0.17
Table 4. UAV adjustment factors.
ComponentEstimation FormulaUAV Adjustment Factors
Wing W w = ρ W f e x p o f n f m a t W 0 w L Overload   factor   f n
Material   factor   f m a t
Tail W H T + W V T = ρ t a i l f n c H T k l t A + c V T k l t W 0 w L Overload   factor   f n
Fuselage W f u s = ρ f u s e k w e t f n W 0 w L Overload   factor   f n
Rotor blades W b l a d e = 0.3502 f f o l d f n f m a t N b l a d e 0.238 W 0 D L 1.258 σ 0.77291 V t i p 0.87562 Material   factor   f m a t
Hub W h u b = 0.0726 N b l a d e 0.0813 W 0 D L 1.3945 σ 0.7958 V t i p 0.9632 No adjustment
Transmission W t r a n = 54.6684 W 0 1.1848 P L 0.78137 Ω e n g 0.09899 V t i p 0.80686 D L 0.40343 No adjustment
Landing gear W L G = 0.0258 W 0 Landing   gear   factor   f L G
Propulsion system W i n s t , e n g = 7.28 W 0 P L No adjustment
Other weights W e l s e = 0.13 W 0 Cockpit   factor   f c o c k p i t
UAV   system   factor   f U A S
Table 5. Empirical fuel weight fractions.
Mission SegmentModeFixed-WingHelicopter/RotorcraftCRHA
Vertical takeoffrotor0.9850.985
Climbwing0.9850.960.985
CruisewingBreguetPower-basedBreguet
Descentwing0.9950.9950.995
Vertical landingrotor0.9850.985
Table 6. Corrected weight fraction for each segment.
SegmentPre-Weight FractionCorrected Weight Fraction
Warm-up/taxi0.990.99
Vertical takeoff0.985 1 c p , h 2.88 × 10 6 D L 2 ρ + V C 2 h h o v e r g V C
Vertical-to-horizontal0 1 - c p 3.6 × 10 6 V f i x e d , min 2 2 η p + V f i x e d , min g 2 L / D e t t r a n
Climb0.9850.985
CruiseBreguet EquationCorrected Breguet Equation
Slide0.9950.995
Horizontal-to-vertical0 1 - c p 3.6 × 10 6 V f i x e d , min 2 2 η p + V f i x e d , min g 2 L / D e t t r a n
Vertical landing0.985 1 c p , h 2.88 × 10 6 D L 2 ρ - V D 2 h h o v e r g V D
Table 7. Parameter categories.
CategorizationParameters
Aircraft type parameters V C , V D , h h o v e r , V f i e d , min , c p , h , c p , f , C D 0 , t t r a n
Performance indicator parameters V , R , h c r u i s e , t a d d , W p a y l o a d
Design variables W 0 , w L , A , N b l a d e , D L , P L , σ , v t i p
Table 8. Aircraft type-related parameters and values.
ParameterValueParameterValue
h h o v e r 150 m/s c p , h 0.4 kg/kWh
V C 10 m/s c p , f 0.3 kg/kWh
V D 5 m/s C D 0 0.02
V f i x e d , min 70 m/s η r 0.8
t t r a n 40 s η p 0.8
Table 9. Optimization method operation.
MethodParametersSet
GAPopulationSize160
MaxGenerations120
Crossover probability0.9
Mutation probability1/7
Elitism (elite fraction)5%
fmincon (SQP)AlgorithmLine-search SQP
MaxIterations200
Max function evaluations5000
StepTolerance1 × 10−7
OptimalityTolerance1 × 10−7
Table 10. Empty weight model of NDARC-compound helicopter vs. CRHA.
ParameterNDARC-Compound HelicopterEmpty Weight Model-CRHA
MTOW (N)188,190188,190
Wing loading (N/m2)81828182
Aspect ratio11.911.9
Number of blades55
Disk loading (N/m2)574574
Power loading (N/kW)8484
Rotor solidity0.1140.114
Tip speed (m/s)221221
Empty weight (N)96,53986,886
Table 11. Parameters of XV-15 vs. fuel weight model-CRHA.
ParameterXV-15 ActualFuel Weight Model-CRHA
MTOW (N)57,79157,791
Wing loading (N/m2)36813681
Aspect ratio6.126.12
Disk loading (N/m2)637637
Zero lift drag coefficient0.010.01
Cruise speed (m/s)103103
Cruise range (km)824824
Cruise altitude (m)60966096
Fuel weight (N)6791.47198.6
Table 12. Parameters for XV-15.
ParameterXV-15 ActualMTOW Model-CRHA
Wing loading (N/m2)36813681
Aspect ratio6.126.12
Number of blades3 × 26
Disk loading (N/m2)637637
Power loading (N/kW)2525
Rotor solidity0.0890.089
Tip speed (m/s)235235
MTOW (N)57,790.661,389.6
Table 13. Design variable ranges.
ParameterRange
Wing loading (N/m2)1500–3500
Aspect ratio8–13
Number of blades4–6
Disk loading (N/m2)350–500
Power loading (N/kW)20–60
Rotor solidity0.08–0.10
Tip speed (m/s)210–230
Table 14. Optimized performance parameters, MTOW, and empty weight for CRHA.
ParameterValue
Wing loading (N/m2)3500
Aspect ratio13
Number of blades6
Disk loading (N/m2)500
Power loading (N/kW)41.26
Rotor solidity0.08
Tip speed (m/s)218.76
MTOW (N)66,918
Empty weight (N)45,756
Fuel weight (N)14,450
Table 15. Weight of B300 King Air 350i, AW139, and CRHA.
ModelB300 King Air 350iAW139CRHA
MTOW67,03262,72066,918
Empty weight44,25735,49645,756
Empty weight ratio66.02%56.59%68.38%
Fuel weight (N)16,06312,29514,450
Fuel weight ratio23.96%19.60%21.59%
Table 16. Design point.
Design VariablesValue
MTOW (N)66,918
Wing loading (N/m2)3500
Aspect ratio13
Number of blades6
Disk loading (N/m2)462.28
Power loading (N/kW)42.47
Rotor solidity0.08
Tip speed (m/s)218.76
Table 17. Global sensitivity of MTOW.
Design VariablesFirst-Order S1iTotal STi
Wing loading (N/m2)0.59960.6387
Aspect ratio0.00150.0015
Number of blades0.00010.0004
Disk loading (N/m2)0.01430.0153
Power loading (N/kW)0.33780.3799
Rotor solidity0.00120.0012
Tip speed (m/s)0.00010.0001
Disclaimer/Publisher’s Note: The statements, opinions and data contained in all publications are solely those of the individual author(s) and contributor(s) and not of MDPI and/or the editor(s). MDPI and/or the editor(s) disclaim responsibility for any injury to people or property resulting from any ideas, methods, instructions or products referred to in the content.