Article

Pillar-Bin: A 3D Object Detection Algorithm for Communication-Denied UGVs

1
College of Mechanical and Energy Engineering, Beijing University of Technology, Beijing 100124, China
2
Beijing Key Laboratory of Design and Intelligent Machining Technology for High Precision Machine Tools, Beijing 100124, China
3
Beijing-Dublin International College, Beijing University of Technology, Beijing 100124, China
*
Author to whom correspondence should be addressed.
Drones 2025, 9(10), 686; https://doi.org/10.3390/drones9100686
Submission received: 11 August 2025 / Revised: 24 September 2025 / Accepted: 29 September 2025 / Published: 3 October 2025

Abstract

Highlights

What are the main findings?
  • This study proposed a Pillar-Bin 3D object detection algorithm based on interval discretization strategy (Bin).
  • Based on the Pillar-Bin algorithm, we developed a pose extraction scheme for preceding vehicles in leader-follower unmanned ground vehicle (UGV) formations, effectively addressing the challenge of pose acquisition in complex environments.
What is the implication of the main finding?
  • Experiments on the KITTI dataset demonstrated that the Pillar-Bin algorithm maintained superior detection accuracy while ensuring high real-time performance. Furthermore, real-vehicle test data confirmed that the pose data output by the proposed extraction scheme exhibited high accuracy and reliability, showcasing the algorithm’s significant engineering application value.
  • The Pillar-Bin algorithm and its matching pose extraction scheme effectively address the technical bottleneck of leader UGV pose perception in communication-denied scenarios. With strict control of X/Y-axis positioning errors (<5 cm) and heading angle errors (<5°), it provides stable perception support for the continuous operation of leader-follower UGV formations, and can serve as a reference for subsequent research on sensor-based communication-free multi-vehicle coordination.

Abstract

Addressing the challenge of acquiring high-precision leader Unmanned Ground Vehicle (UGV) pose information in real time for communication-denied leader–follower formations, this study proposed Pillar-Bin, a 3D object detection algorithm based on the PointPillars framework. Pillar-Bin introduced an Interval Discretization Strategy (Bin) within the detection head, mapping critical target parameters (dimensions, center, heading angle) to predefined intervals for joint classification-residual regression optimization. This effectively suppresses environmental noise and enhances localization accuracy. Simulation results on the KITTI dataset demonstrate that the Pillar-Bin algorithm significantly outperforms PointPillars in detection accuracy. In the 3D detection mode, the mean Average Precision (mAP) increased by 2.95%, while in the bird’s eye view (BEV) detection mode, mAP was improved by 0.94%. With a processing rate of 48 frames per second (FPS), the proposed algorithm effectively enhanced detection accuracy while maintaining the high real-time performance of the baseline method. To evaluate Pillar-Bin’s real-vehicle performance, a leader UGV pose extraction scheme was designed. Real-vehicle experiments show absolute X/Y positioning errors below 5 cm and heading angle errors under 5° in Cartesian coordinates, with the pose extraction processing speed reaching 46 FPS. The proposed Pillar-Bin algorithm and its pose extraction scheme provide efficient and accurate leader pose information for formation control, demonstrating practical engineering utility.

1. Introduction

Currently, compared to single-vehicle systems, distributed formation control for multi-vehicle coordination has become a research hotspot owing to its significant advantages in operational efficiency and system flexibility [1]. Mobile vehicles are extensively deployed in complex operational scenarios including search and rescue missions [2], multi-vehicle collaborative systems [3], and intelligent transportation systems [4]. Current research in formation control has matured and can be categorized into four primary strategies: leader–follower approaches [5,6,7,8], behavior-based methods [9], model predictive control (MPC) [10], and virtual structure techniques [11]. Among these, the leader–follower strategy was widely adopted for its simple control structure and strong scalability. In leader–follower formations of Unmanned Ground Vehicles (UGVs), conventional methods heavily rely on real-time inter-vehicle communication to exchange leader UGV pose information (position and heading angle) [12] for motion coordination. However, in specific scenarios such as electromagnetically silent environments or military-restricted zones, conventional communication becomes infeasible, driving research toward sensor-based communication-free coordination methods. These approaches depend solely on onboard sensors for environmental perception to acquire leader UGV pose data. Existing communication-free methods primarily utilize visual sensors or LiDAR (Light Detection and Ranging) for perception [13]. While vision-based approaches provide rich texture and color information, their performance is significantly degraded by variable illumination, target occlusion, and limited field of view, resulting in low pose estimation accuracy in complex environments [14]. In contrast, multi-beam LiDAR solutions offer superior target identification and environmental interference discrimination owing to their high ranging accuracy and strong anti-interference capabilities [15]. Consequently, LiDAR-based leader UGV pose perception demonstrates enhanced accuracy and stability under communication constraints. Nevertheless, the massive scale, sparsity, and unstructured nature of LiDAR-generated 3D point clouds poses substantial challenges for point cloud processing algorithms.
With the rapid advancement of deep learning, 3D object detection technology has gained significant attention [16]. This technology aims to detect object category, position, and pose from 3D point cloud data, serving as the core component for LiDAR-based leader UGV pose acquisition. Numerous LiDAR-based 3D object detection algorithms have emerged in recent years, with current mainstream approaches falling into two primary categories. Raw point cloud processing methods (e.g., PointRCNN [17], PointRGCN [18], PointNet [19], PointNet++ [20], PointR-CNN [21]) focus on directly extracting geometric features from raw 3D point clouds for object detection and Region of Interest (ROI) classification tasks. However, due to the inherent high density and redundancy of point cloud data, such methods typically suffer from high computational complexity, resulting in low model training and inference efficiency that struggles to meet real-time demands. Alternatively, voxelization-based improved algorithms represent a distinct approach. VoxelNet [22], as a foundational work in this direction, pioneered end-to-end 3D object detection via uniform 3D grid partitioning and voxel feature encoding. Nevertheless, its use of dense 3D convolutional networks failed to adequately account for the sparse nature of point clouds, leading to significantly constrained computational efficiency. SECOND [23], proposed by Yan et al. from Chongqing University, offered a crucial improvement by introducing 3D sparse convolution and 3D submanifold operators, employing sparse convolution to replace standard 3D convolution, thereby enhancing training speed and detection performance. Although voxelization algorithms improve processing efficiency through spatial discretization, they remain limited by the inherent computational burden of 3D convolutions. While real-time performance improved, it still fell short of stringent application standards. Differing from voxel-based representations, PointPillars [24] employed a pillar-based representation. By partitioning point cloud space into vertical columns and encoding them into a pseudo-image, which utilizes 2D Convolutional Neural Networks (CNNs) for feature extraction and detection, effectively circumventing 3D convolution operations. This approach substantially reduced computational load and enhances processing efficiency, with detection speeds surpassing contemporary mainstream methods, providing a potential solution for real-time communication-free formation control. However, the algorithm’s continuous parameter regression strategy in its detection head exhibits sensitivity to environmental noise, and computational redundancy from large-scale spatial searches constrains detection accuracy.
CenterPoint [25] discarded the traditional anchor mechanism, transforming 3D object detection and tracking into a unified keypoint (i.e., the object center point) estimation problem. This algorithm achieved integrated high-performance detection and tracking through center point prediction, representing an advanced, high-precision solution. However, due to its two-stage architecture and relatively high computational complexity, the model exhibited significant limitations in latency and computational overhead, making it difficult to operate efficiently on UGVs with stringent real-time requirements. PV-RCNN [26] (Point-Voxel Feature Set Abstraction) integrated the dual advantages of the high accuracy of point-based methods and the high computational efficiency of voxel-based methods, encoding multi-scale scene voxel features into a set of keypoints. To address the severe class imbalance between foreground vehicles and background point clouds, Wu et al. [27] proposed PVRCNN++, which further enhanced detection performance by introducing a semantic point-voxel feature interaction mechanism. MPVConv (Multi Point-Voxel Convolution) [28] employed a 3D convolutional neural network architecture, strengthening the information correlation and nonlinear representation capability between point features and voxel features. PVC-SSD (Point-Voxel Dual-Channel) [29] proposed an anchor-free detection framework that employed a dual-channel structure to perform fused encoding of point and voxel features, achieving unified modeling of local fine-grained features and global contextual information. Methods based on the fusion of point clouds and voxels demonstrated powerful perception capabilities in complex scenarios, effectively balancing computational efficiency and detection accuracy. However, these methods still face challenges such as difficulty in optimizing voxelization parameters and inefficient feature transmission mechanisms between point clouds and voxels, which limit their further application in dynamic environments.
To achieve real-time, high-precision leader UGV pose acquisition in leader–follower UGV formation control, this study employs PointPillars—renowned for its excellent real-time performance—as the foundational framework. Addressing this algorithm’s detection accuracy limitations, we propose an enhancement: optimizing the detection head via a Bin-based interval discretization strategy [30]. This strategy partitions the continuous parameter space of critical target attributes (dimensions, position coordinates, and heading angle) into predefined discrete intervals. Building on this improvement, the Pillar-Bin 3D object detection algorithm was proposed. Comparative evaluations on the standard KITTI dataset demonstrate that Pillar-Bin significantly enhanced target detection accuracy while effectively preserving the original algorithm’s high real-time efficiency. To thoroughly validate Pillar-Bin’s practical utility, a pose extraction scheme was designed based on this algorithm. Real-vehicle test results confirm that this scheme provides a practical solution for follower vehicles to acquire leader vehicle pose information accurately and in real time within leader–follower UGV formations.

2. Materials and Methods

2.1. Pillar-Bin Algorithm Architecture

Figure 1 shows the overall architecture of the Pillar-Bin algorithm, comprising three core components: Feature Extraction, which uniformly partitions raw point cloud data into equally sized pillars within 3D space and extracts intra-pillar features to generate a pseudo-image; the Backbone Network, performing multi-level downsampling and upsampling fusion on the pseudo-image to produce multi-scale features; and the Bin-Based Detection Head, responsible for object detection and 3D bounding box regression.

2.1.1. Pillar Feature Net

Initially, the point cloud’s bird’s-eye view (BEV) was partitioned into an H × W grid of uniformly spaced cells. Each cell corresponds to a vertical pillar along the Z-axis, with a fixed horizontal cross-section of 0.16 m × 0.16 m and no vertical subdivision. Points within each pillar are encoded into a 9-dimensional feature vector comprising:
  • (x, y, z, r): Spatial coordinates and reflectance intensity;
  • (xc, yc, zc): Geometric centroid of pillar points;
  • (xp, yp, zp): Point’s offset relative to pillar center.
Given point cloud sparsity, a significant portion of pillars are empty, and non-empty pillars contain variable point counts. To reduce computational complexity:
  • First item; Pillar count is limited to P = 12,000;
  • Maximum points per pillar capped at n = 100.
Data standardization strategies are applied based on point density per pillar:
  • Zero-padding for pillars with <100 points;
  • Random sampling for pillars with >100 points.
Processed non-empty pillars were stacked, transforming unstructured point clouds into a dense tensor of dimensions (D, P, N). Subsequently, a Multi-Layer Perceptron (MLP) extracts features from the D-dimensional data, compressing dimensionality from D = 9 to C, yielding a (C, P, N) tensor. A max pooling operation was then applied per pillar, reducing the tensor to (C, P) dimensions. Finally, this tensor was reshaped into a (C, H, W) pseudo-image, where H and W denote the pseudo-image height and width, respectively.

2.1.2. Backbone

Within the 2D CNN backbone network, input features undergo progressive downsampling (as illustrated in Figure 1), sequentially generating three multi-scale feature maps: (W/2) × (H/2) × C; (W/4) × (H/4) × 2C; (W/8) × (H/8) × 4C. This process preserves local feature details of point clouds while progressively expanding the receptive field to integrate broader contextual information. Subsequently, upsampling produces features at (W/2) × (H/2) × 2C resolution, enabling denser prediction or segmentation tasks. Finally, feature concatenation fuses same-scale representations into a consolidated (W/2) × (H/2) × 6C feature map.

2.1.3. Bin-Based Detection Head

The detection head in PointPillars employs a continuous parameter regression strategy, which exhibits high sensitivity to noise interference, leading to reduced target localization accuracy. Furthermore, this detection head relies on an exhaustive search mechanism across the entire spatial domain, failing to leverage the regular distribution patterns of target parameters inherent in UGV formation scenarios. This results in computational redundancy, directly compromising detection accuracy and consequently affecting formation control stability. To address these limitations, this study introduces a bin-based interval discretization strategy within the PointPillars framework to optimize the detection head design. This strategy transforms continuous parameter prediction into a joint optimization process comprising:
  • Bin Classification: Assigning target parameters (position, dimensions, orientation) to predefined discrete intervals (bins), using bin centers as initial estimates;
  • Residual Regression: Predicting fine-grained offsets (residuals) relative to bin centers.
The final parameter values were derived by summing bin center values with predicted residuals. By constraining the search space and reducing regression target sensitivity to noise, this approach significantly enhanced detection precision.
The bin method aims to enhance model detection accuracy and efficiency by discretizing continuous parameter spaces. Its core concept involves discretizing the continuous parameter space for target position, dimensions, orientation, etc., transforming traditional regression into a joint optimization of coarse localization via bin classification and fine adjustment through residual correction, specifically as follows: Firstly, the classification layer identifies the optimal discrete interval (bin) for target parameters, using the bin center value as the initial estimate. Subsequently, the regression predicts fine-grained offsets relative to the bin center. Finally, the final parameter value is obtained by summing the bin center value with the predicted residual.
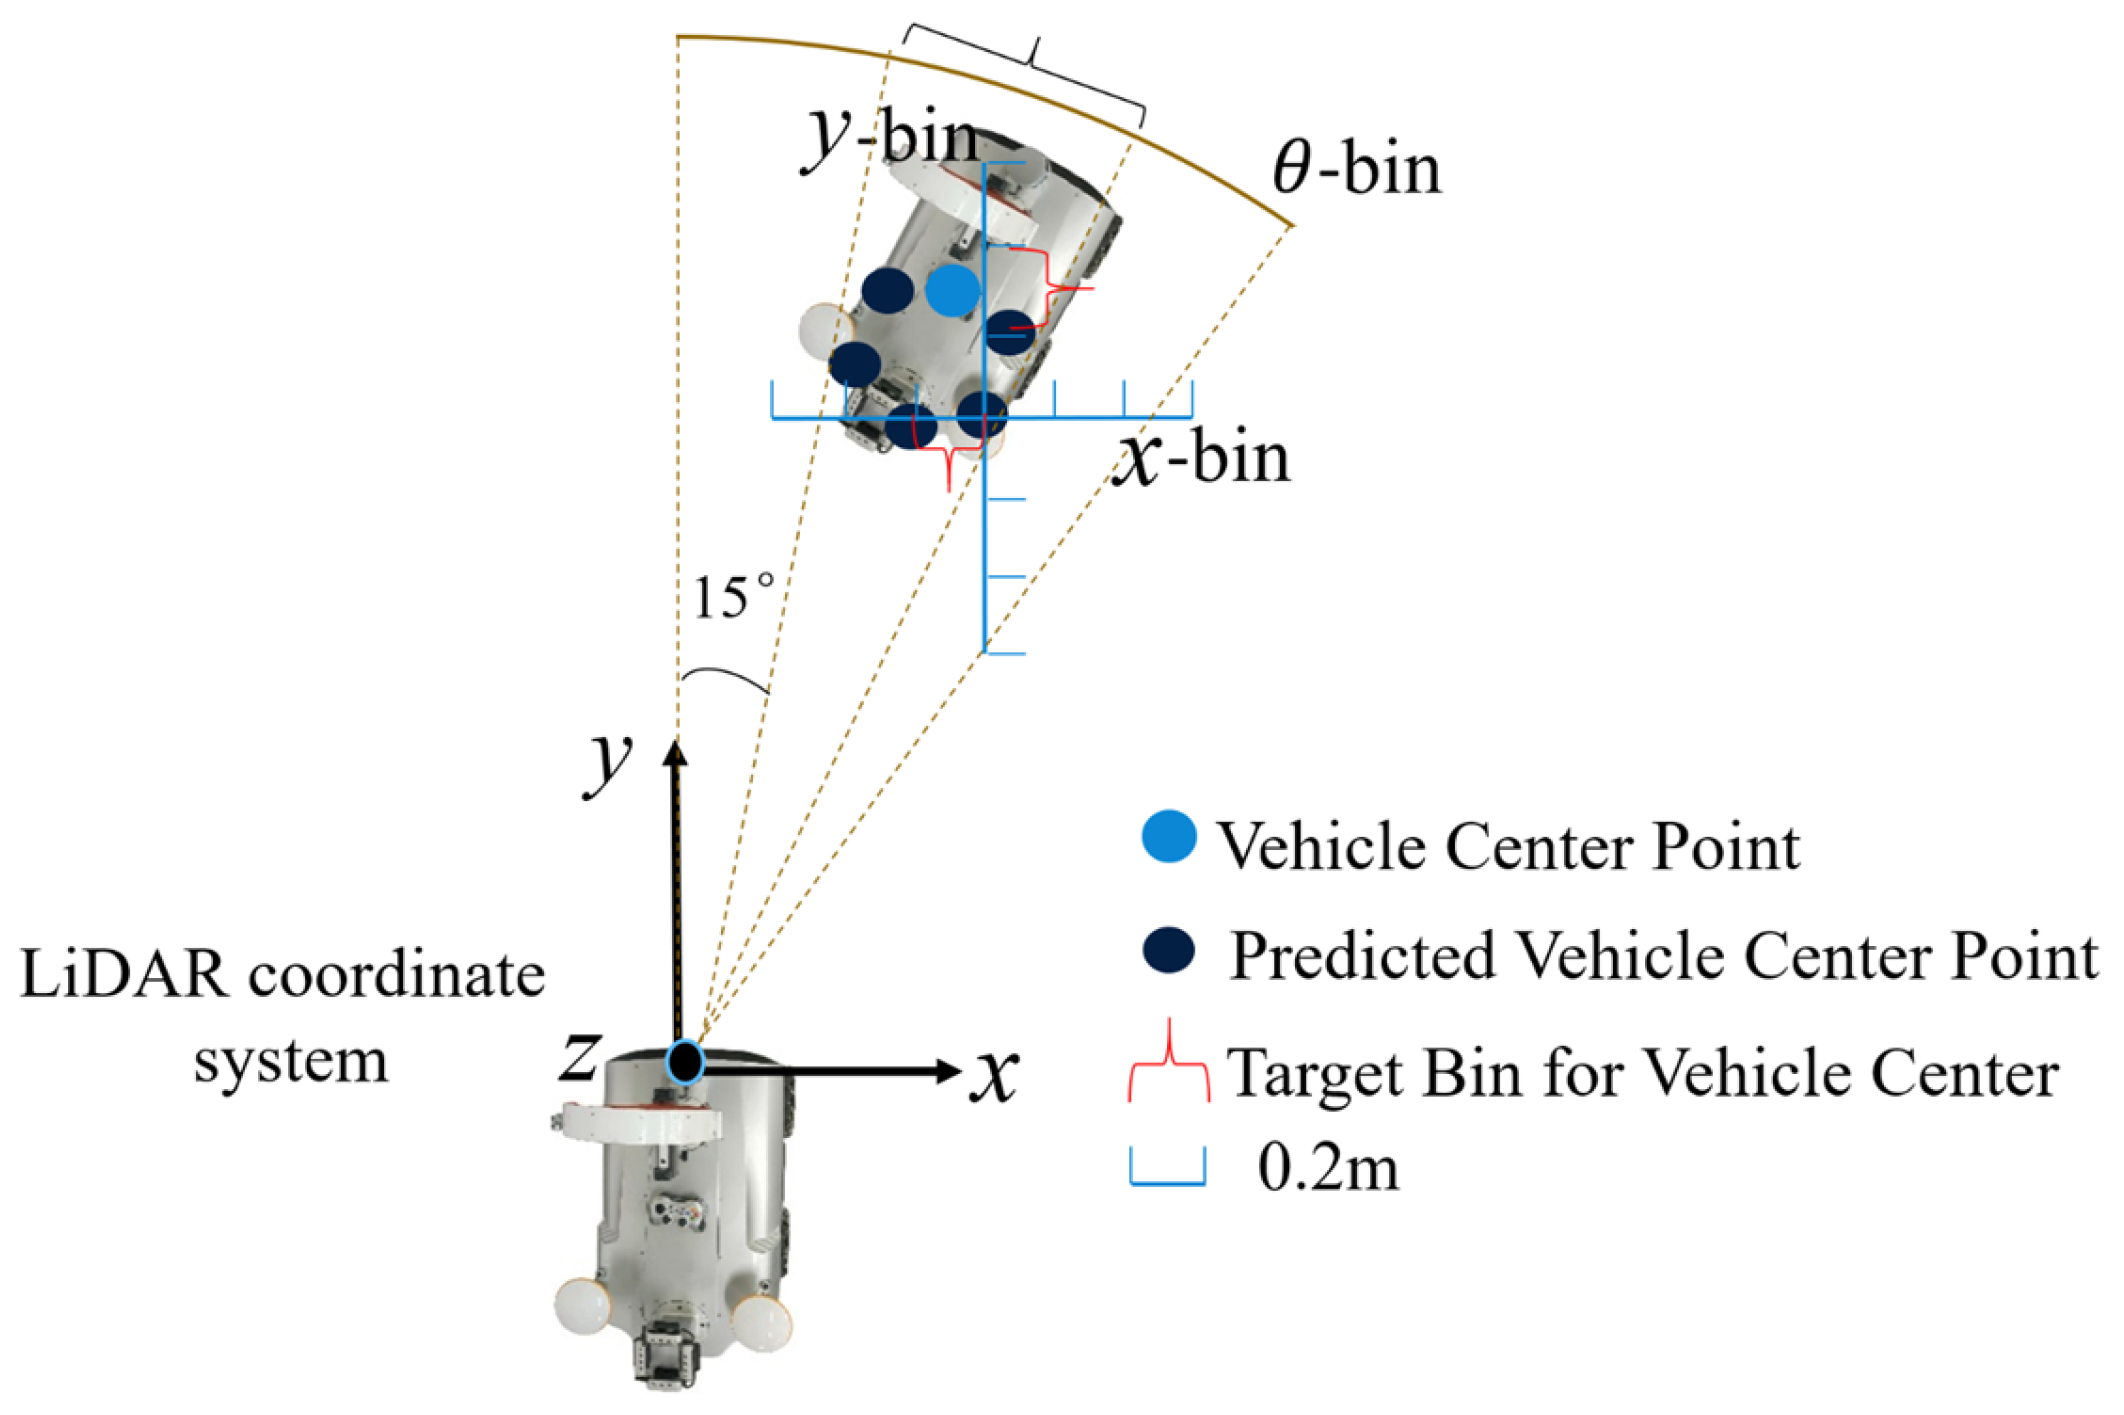
In the LiDAR coordinate system, the detection head output 3D bounding boxes were parameterized as (x, y, z, h, w, l, θ), where (x, y, z) denotes the UGV center position, (h, w, l) represent dimensions, and θ is the BEV orientation angle. Differential prediction strategies were applied according to parameter characteristics. For height z, direct regression was used without discretization due to minimal value variation across targets. For BEV coordinates (x, y) (Figure 2), a constrained search space [−0.6 m, 0.6 m] per axis was uniformly divided into 0.2 m bins, with points falling on the partition boundaries assigned to the region closest to the origin. A lightweight convolutional layer generated a 2D heatmap indicating spatial probability distribution, where the highest-probability bin center provided the initial estimate, and final coordinates were refined through regressed residual offsets—significantly enhancing planar localization efficiency and accuracy through probability-guided constrained search. Orientation angle θ prediction addressed 360° periodicity by discretizing the angular dimension into 24 bins (15° intervals), starting from the positive x-axis and proceeding in the counterclockwise direction; for points falling on angular partition boundaries, they are assigned to the angular bin whose central direction is closest to the positive x-axis in the counterclockwise sense. Circular convolution kernels were employed to extract rotation-invariant features, where the highest-probability bin center yielded the initial angle estimate, later refined by angular residuals. Regarding dimensions (h, w, l), size templates derived from KITTI dataset cluster centers (sedans, SUVs, trucks) enabled classification-based selection, where the highest-probability template served as the initial estimate and prior size constraints filtered outliers, converting open-space search to template matching.
Residual regression in the detection head assigns each parameter to a set of bins. The coordinate classification head outputs probability distributions over bins for each axial value. Within each bin, the offset relative to the bin center was predicted—transforming continuous regression into bin classification followed by intra-bin offset regression. This approach uniformly applies to orientation and dimension regression. Thus, the predicted value for any target parameter comprises two components:
P = B i n c ( k ) + Δ p
The mathematical formulation is defined as follows: p { x , y , l , h , w , θ } , where k denotes the category index of the parameter’s assigned bin, B i n c ( k ) signifies the center value of bin k, and Δ p corresponds to the predicted residual offset.
To further clarify the core execution flow of the Pillar-Bin detection head and address the need for intuitive algorithmic representation, Algorithm 1 is supplemented below (immediately following the theoretical description of parameter discretization and prior to the loss function derivation). This pseudocode distills the multi-step logic of the detection head—from feature input to final 3D bounding box output—into a concise, step-by-step framework, which compensates for the potential abstraction of textual descriptions and enables readers to quickly grasp the “discretization–classification–regression” joint optimization mechanism of Pillar-Bin.
As shown in Algorithm 1, the detection process starts with feature maps F (output from the backbone network in Section 2.1.2) as input, and iterates over each foreground point p_i in the feature maps to complete parameter estimation. First, in the parameter discretization stage, it defines preconfigured search bins for key parameters (x/y coordinates, yaw angle (θ)) and size templates for dimensions (w/l/h)—consistent with the bin settings specified in the manuscript (e.g., x/y search space [−0.6 m, 0.6 m] with 0.2 m bin width, 24 bins for 360° yaw angle, and size templates clustered from KITTI vehicle data). Second, coarse localization is achieved through bin classification: the optimal bins for x/y (bin_x*, bin_y*) and yaw angle (bin_θ*) are selected by maximizing the corresponding heatmaps (Heatmap_xy, Heatmap_θ), and the optimal size template (template*) is determined via size score ranking. Third, fine regression predicts residual offsets (δ_x, δ_y, δ_θ, δ_w, δ_l, δ_h) for each parameter to correct the coarse estimates from bin centers or templates. Finally, the final 3D bounding box parameters are calculated by fusing bin/template centers with residuals, where the height z is directly regressed without discretization (as noted in Section 2.1.3, this is due to the minimal variation in height across UGV targets). After iterating over all foreground points, non-maximum suppression (NMS) is applied to refine the detection results and output the final 3D bounding boxes.
This pseudocode not only maintains strict consistency with the manuscript’s existing parameter settings and implementation logic but also visually presents the core innovation of Pillar-Bin (i.e., transforming continuous parameter regression into a two-stage optimization of “coarse bin classification + fine residual regression”). It serves as a bridge between theoretical descriptions and engineering implementation, providing intuitive procedural guidance for subsequent algorithm reproduction and practical application.
Algorithm 1: Pillar-Bin Detection Head
1: Input: Feature maps F
2: Output: 3D Bounding Box x ,   y ,   z ,   w ,   l ,   h ,   θ
3: for each foreground point p_i in F do
4:      // 1. Parameter Discretization (Bin Creation)
5:      Define search bins for x, y, θ and size templates for w,l,h.
6:      // 2. Coarse Localization (Bin Classification)
7:      bin_x*, bin_y*= argmax(Heatmap_xy(p_i))
8:      bin_θ* = argmax(Heatmap_θ(p_i))
9:      template*te = argmax(SizeScore(p_i))
10:      // 3. Fine Regression (Residual Offset)
11:      δ_x, δ_y, δ_θ, δ_w, δ_l, δ_h = Regressor(p_i)
12:      // 4. Final Prediction
13:      x, y = CenterOf(bin_x*, bin_y*) + δ_x, δ_y
14:      θ = CenterOf(bin_θ*) + δ_θ
15:      w, l, h = template* + δ_w, δ_l, δ_h
16:      z = DirectRegression(p_i) // No binning for height
17: end for
18: return Refined boxes after NMS.
Following the introduction of the Bin-based interval discretization strategy, the total loss of the algorithm comprises two components: discrete classification loss and residual regression loss [31]. We employ a multi-task weighted loss framework with learnable weighting parameters to dynamically adjust loss weights across subtasks. Given the fixed dimensions of leader–follower UGVs, this work prioritizes loss balancing strategies for the coordinate and orientation regression heads, strategically increasing their task weights while maintaining training stability. The overall loss function is formulated as:
L t = i 1 σ i 2 L i + log σ i 2
where σ i denotes the learnable task weight parameters.
For the loss function of the coordinate branch, the objective is to predict the probability distribution of the target center’s location within its assigned bin. The input consists of the normalized bin probabilities. The ground-truth center label is generated using a Gaussian kernel:
Y coord ( i , j ) = exp ( c x i x gt ) 2 + ( c y j y gt ) 2 2 σ 2
Therefore, the loss function for the coordinate branch is:
L coord - cls = 1 N pos i , j Y coord ( i , j ) 1 P coord ( i , j ) γ log P coord ( i , j )
where γ = 2 , and N p o s denotes the quantity of positive samples.
The coordinate residual regression loss is computed exclusively for positive samples, and its expression is given by:
L coord - reg = 1 N pos pos SmoothL 1 Δ x Δ x gt , Δ y Δ y gt
For the loss function of the orientation branch, the input is P a n g l e R k . To mitigate over-fitting, cross-entropy is employed for label processing:
L angle - cls = k = 1 K Y angle ( k ) log P angle ( k )
In Equation (6) for the orientation branch loss, the label value Y a n g l e is defined as follows: Y a n g l e ( k ) = 0.9 if the true angle belongs to the k-th interval bin (i.e., the actual angle falls within bin k), and Y a n g l e = 0.1 K 1 for all other bins.
For the angle residual regression loss, the angular error is transformed into a sine difference, with the expression given by:
L angle - reg = 1 N pos pos sin θ pred θ gt 2
The expression for the size regression loss is given by:
L size = i { l , w , h } SmoothL 1 s i s ^ i
where s i denotes the predicted dimensions and s ^ i represents the ground-truth dimensions.
Therefore, the total loss function for the Pillar-Bin model follows the structure of Equation (2) and is formulated as:
L = 1 σ 2 L coord + L angle + L size + log σ 2

2.2. Design of Leader UGV Pose Estimation Scheme Using Pillar-Bin Algorithm

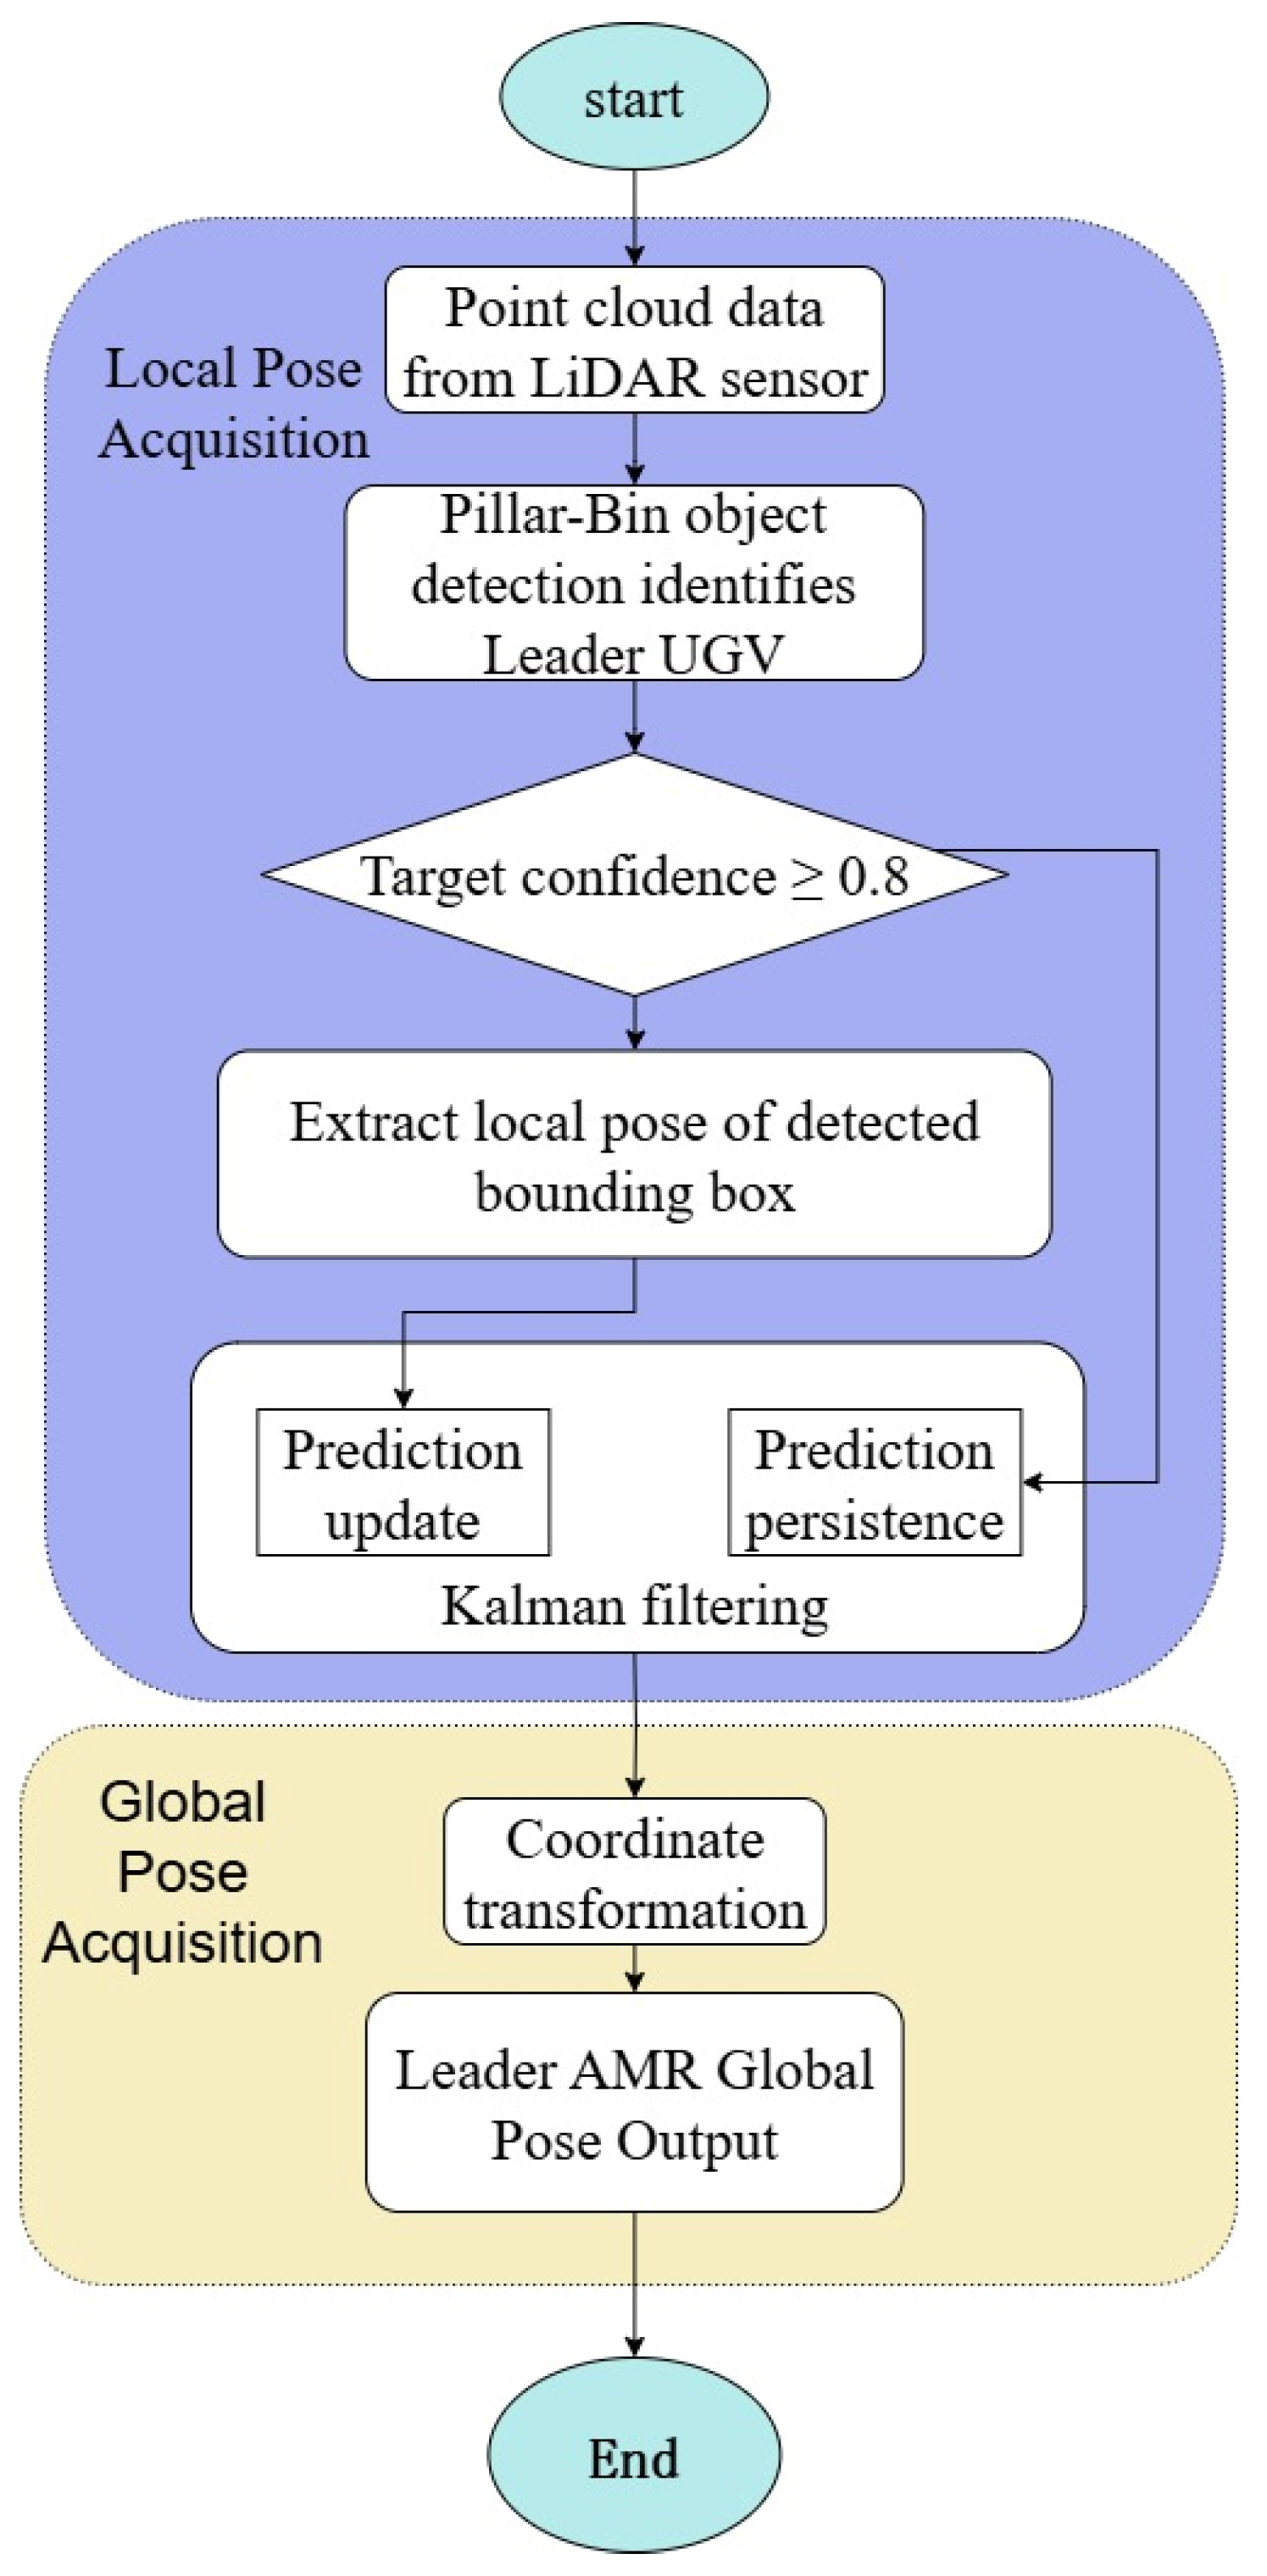
Figure 3 show the pose estimation scheme for the Leader UGV. This solution’s core workflow comprises two critical stages: First, the Pillar-Bin object detection algorithm processes point cloud data acquired in real time by the follower UGV’s onboard LiDAR to identify and extract the Leader UGV’s local pose (i.e., position and orientation) within the follower UGV’s LiDAR coordinate system. Subsequently, to enable unified computation, coordinate transformation was applied to map the acquired local pose onto the global coordinate system defined by the follower UGV, ultimately outputting the estimated pose of the Leader UGV in the global coordinate system.

2.2.1. Local Pose Acquisition

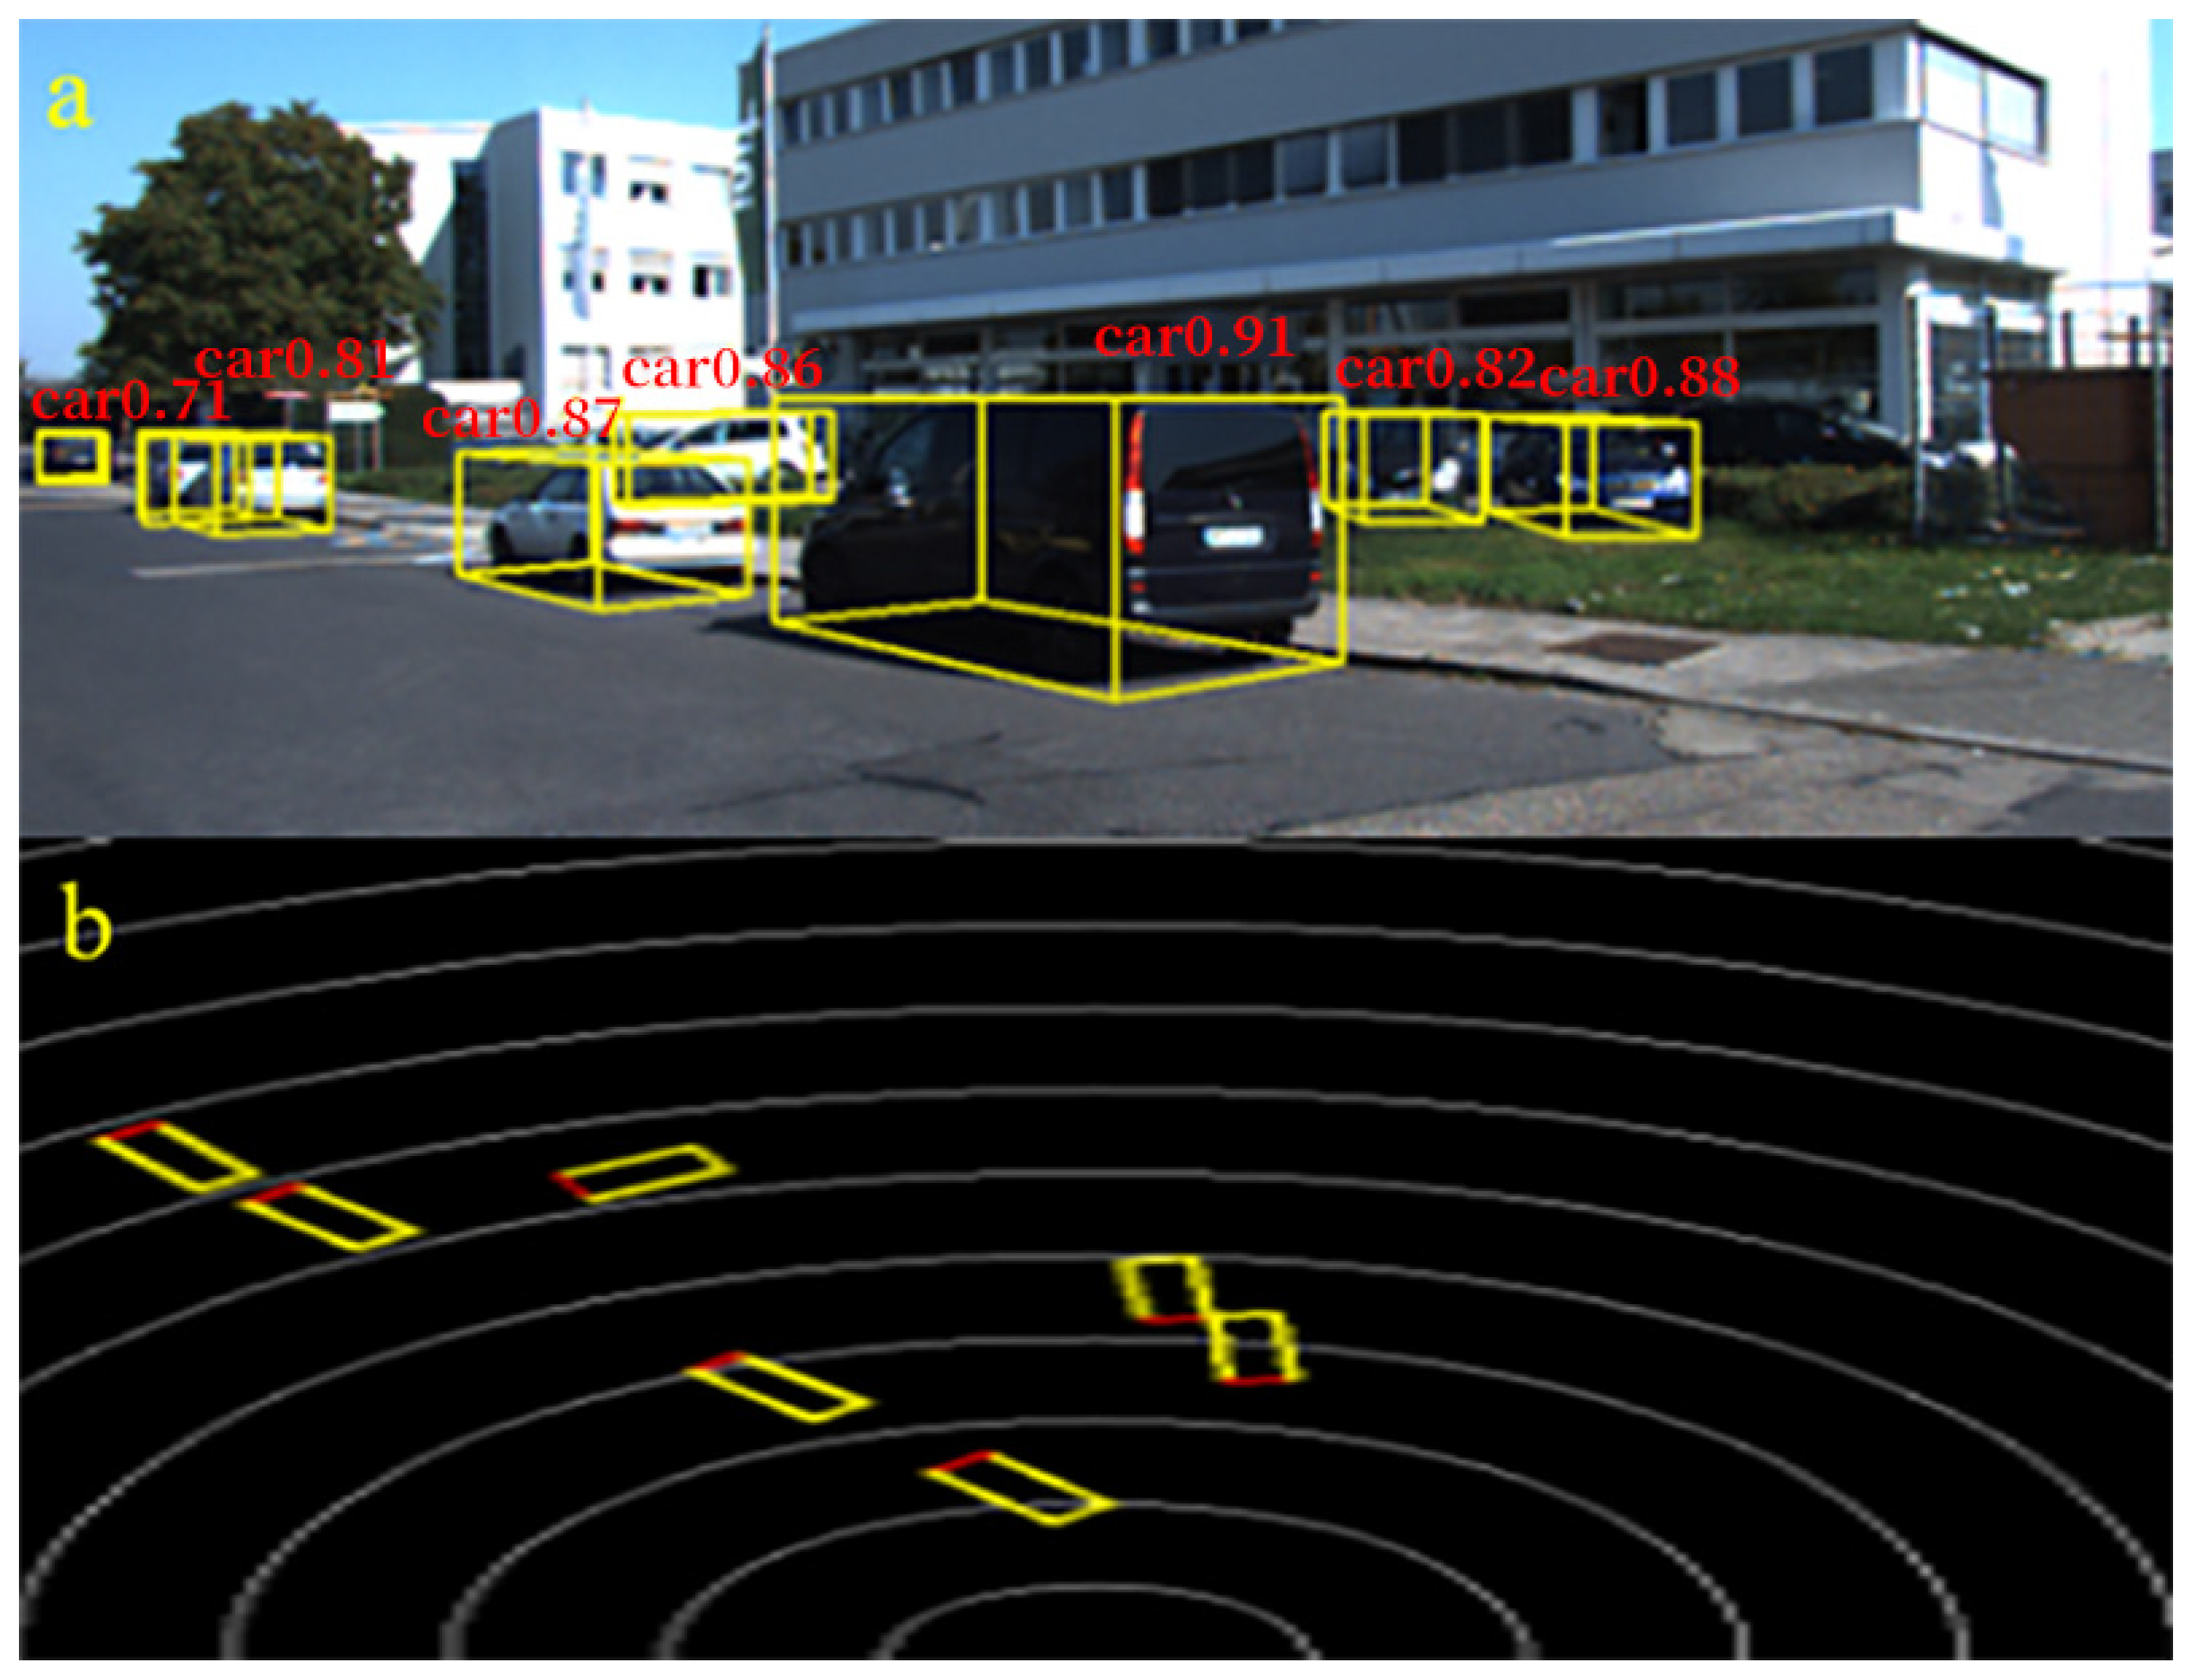
The follower UGV utilizes its onboard LiDAR to perform rotational scanning, acquiring real-time point cloud data of the surrounding environment. This data is fed into the Pillar-Bin object detection algorithm to identify the Leader UGV. During identification, the detection confidence score output by Pillar-Bin serves as a critical reliability metric ranging within [0, 1], where higher values indicate greater model certainty [32]. Analysis of KITTI dataset vehicle detections (Figure 4a) shows valid detection confidence predominantly distributed above 0.8. Consequently, this study established 0.8 as the confidence decision threshold: when confidence ≥ 0.8, the system validates detection and initiates pose extraction with Kalman filter updating; when confidence < 0.8, it switches to prediction persistence mode, forecasting target pose using historical Kalman filter states. This threshold mechanism ensures continuous, stable pose output during transient target loss or occlusion, significantly enhancing state estimation robustness.
In the leader–follower UGV cooperative control system, given that all subsequent experiments employ identical UGV models on horizontal terrain, the relative pose calculation between the Leader and Follower UGVs can be simplified to a 2D planar problem within the BEV perspective. Thus, the pose of the bounding box extracted by the Pillar-Bin algorithm from 3D point cloud data was projected onto this BEV plane (as illustrated by the projection from Figure 4a to Figure 4b). During this projection, the Z-coordinate perpendicular to the ground, along with pitch and roll angles, are constrained to zero. Consequently, the local pose acquisition shown in Figure 3 is represented as ( x p r e , y p r e , θ p r e ) , where x p r e and y p r e denote the position coordinates of the Leader UGV in the follower’s LiDAR coordinate system on the BEV plane, and θ p r e represents the yaw angle around the vertical (Z) axis.

2.2.2. Global Pose Acquisition

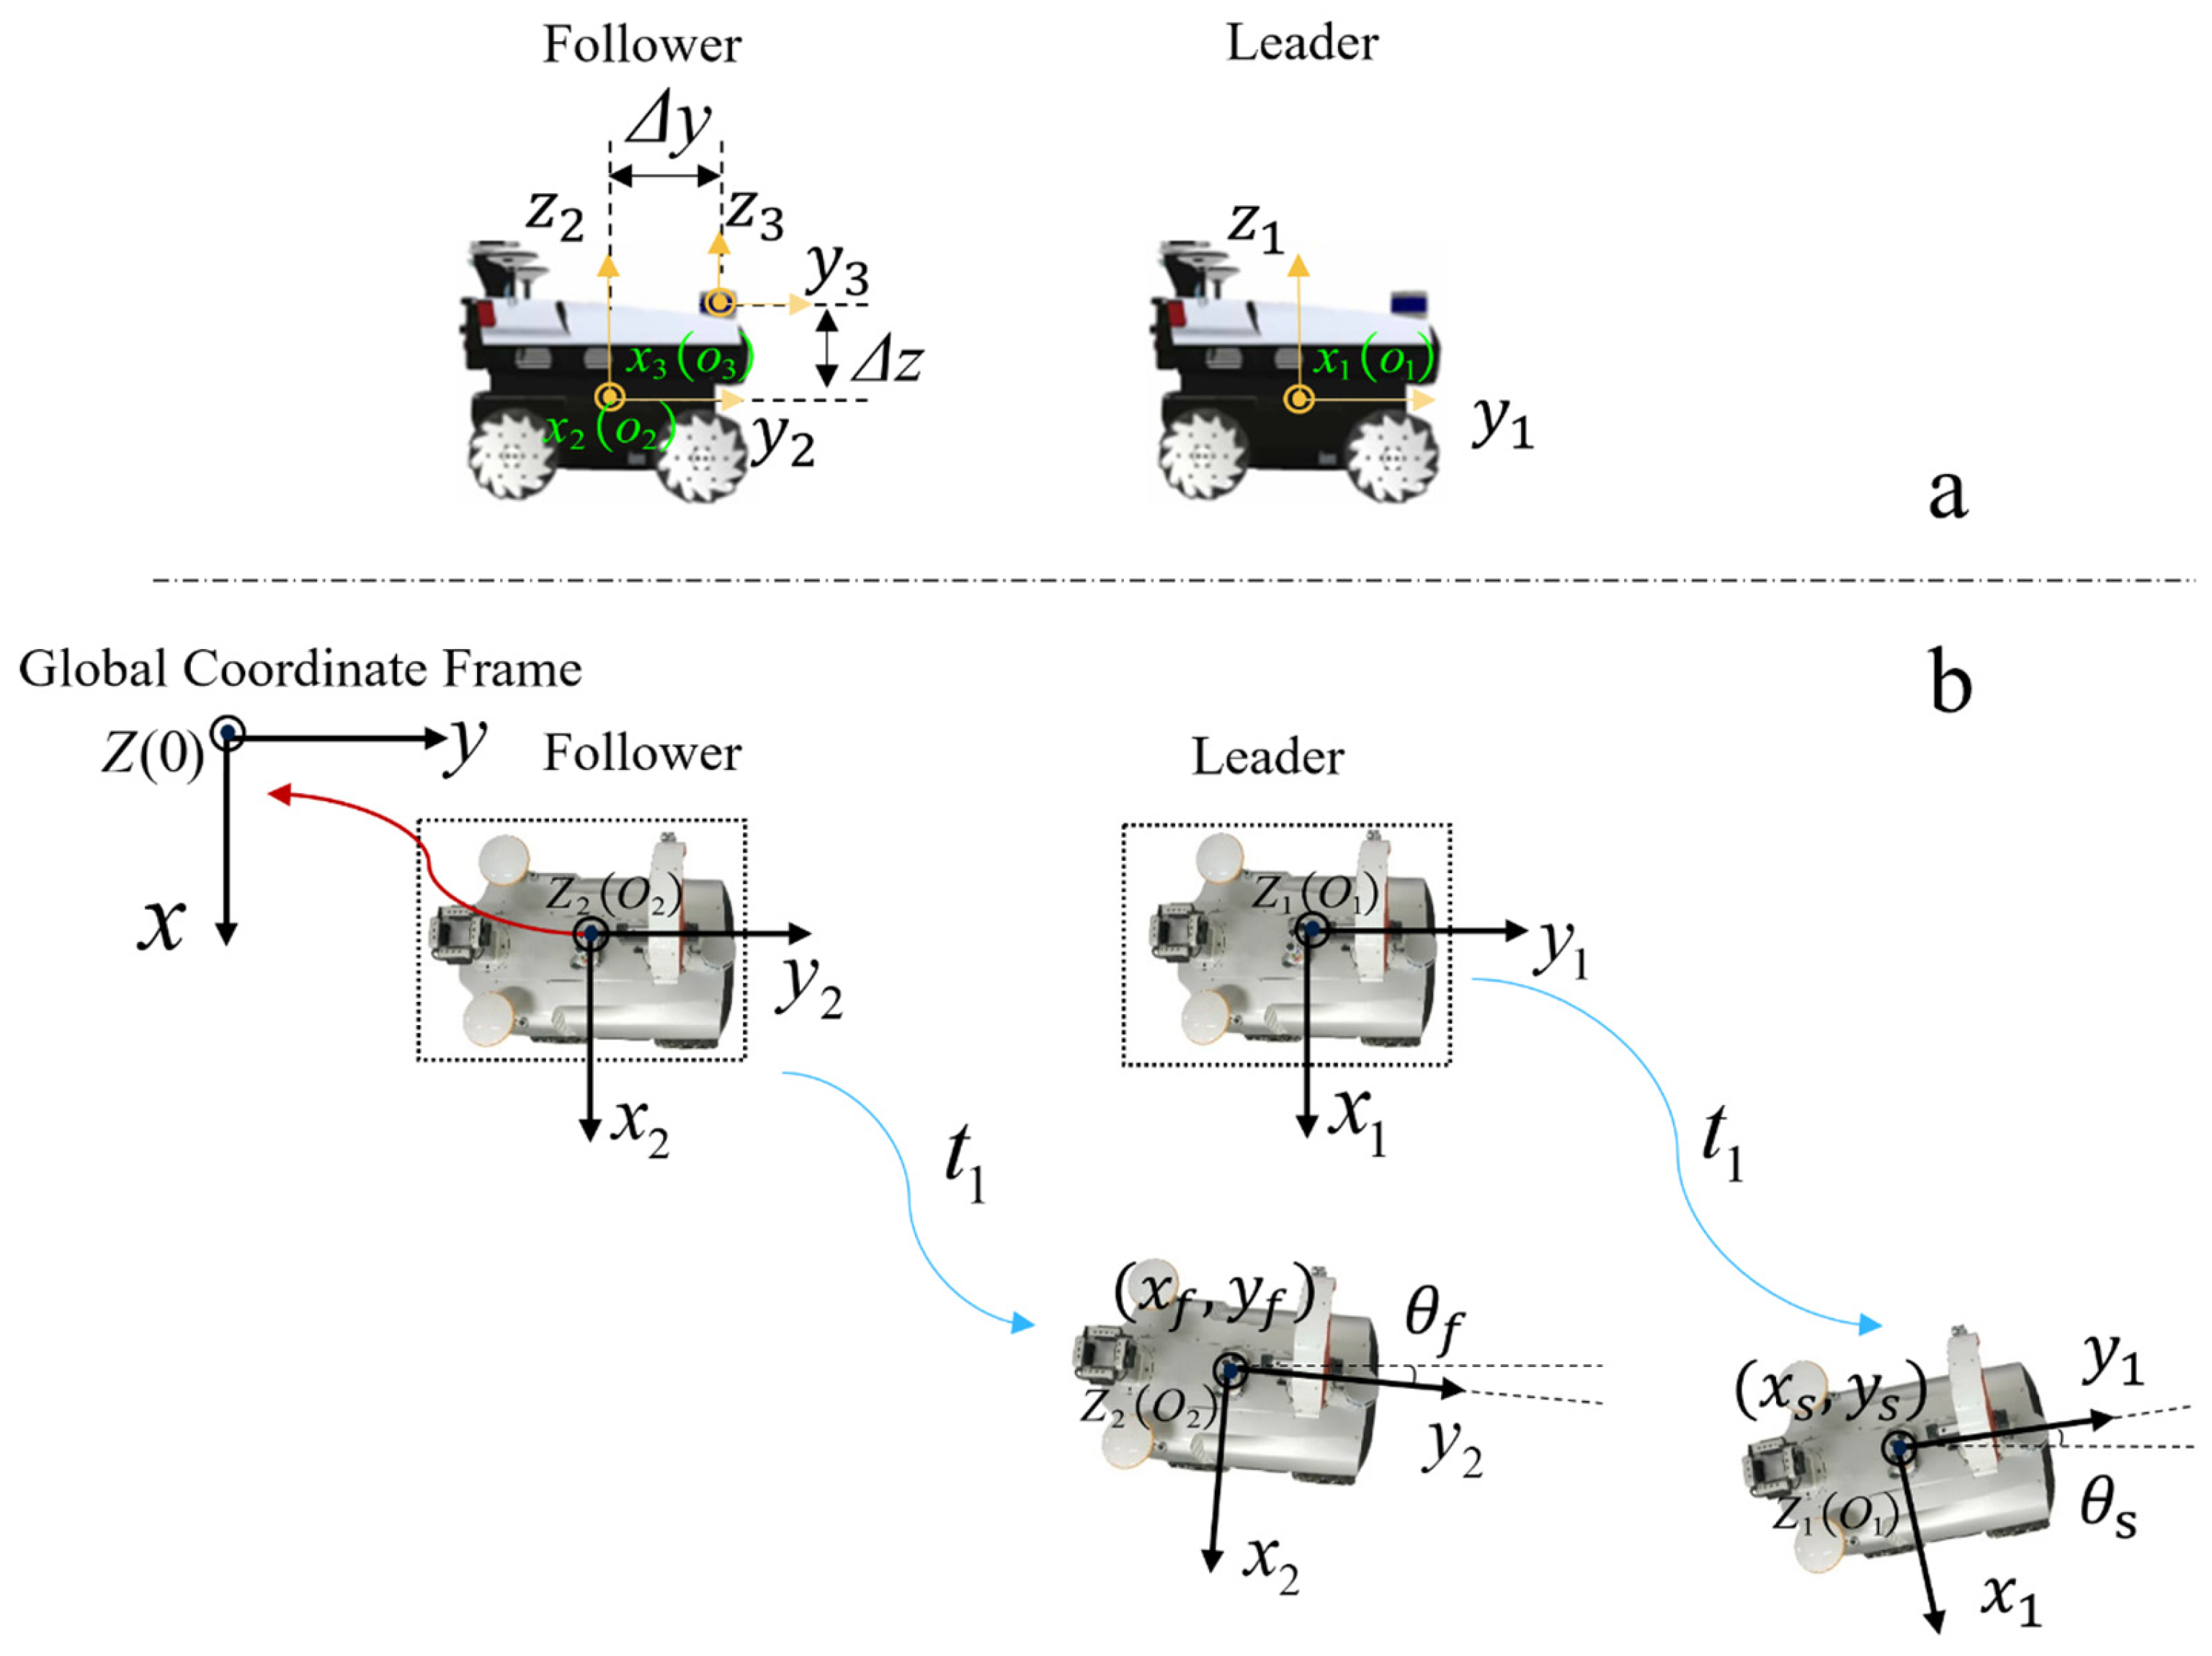
The pose information acquired via the Pillar-Bin algorithm resides in the local coordinate system of the LiDAR sensor. To enable precise calculation of relative distance and heading angle between vehicles required for leader–follower UGV cooperative control, a unified global coordinate reference frame must be established. As illustrated in Figure 5, the system defines the following coordinate systems: the Leader UGV control center coordinate system (origin O1) and the Follower UGV control center coordinate system (origin O2), both with their positive X-axes aligned with the respective vehicle’s forward direction and positive Y-axes following the right-hand rule toward the vehicle’s right side. The LiDAR sensor coordinate system (origin O3, mounted on the follower UGV) adopts identical conventions. The global coordinate system originates at the follower UGV’s control center point O2 at initialization, with its positive X-axis aligned with the follower UGV’s initial forward direction and positive Y-axis following the right-hand rule toward the initial right side. This coordinate system remains fixed after establishment, serving as the reference framework for unifying all UGV pose data. Dashed rectangles in Figure 5b indicate the initial positions of both UGVs. Within the global frame, the follower UGV’s pose at time t is denoted as ( x f , y f , θ f ) , while the leader UGV’s pose is represented as ( x s , y s , θ s ) . Given that the absence of direct communication prevents the follower UGV from acquiring the leader’s global pose ( x s , y s , θ s ) directly, two sequential coordinate transformations convert the locally detected relative pose ( x p r e , y p r e , θ p r e ) of the leader UGV into the global frame, yielding the estimated global pose ( x s e , y s e , θ s e ) of the leader UGV. The computational procedures for these transformations are derived in detail subsequently.
First, the local pose values of the Leader UGV ( x p r e , y p r e , θ p r e ) acquired via the Pillar-Bin algorithm are transformed from the LiDAR sensor’s local coordinate system to the follower UGV’s control center coordinate system. As shown in Figure 5a, the LiDAR sensor was rigidly mounted on the longitudinal symmetry plane of the follower UGV, with its coordinate system (origin O3 in Figure 5) axially aligned with the follower UGV’s control center frame (origin O2 in Figure 5). The two frames exhibited zero offset along the X-axis, a fixed offset Δ y along the Y-axis, and a fixed offset Δ z along the Z-axis. Consequently, the transformation matrix T 1 from the sensor local frame to the UGV control center frame is established as follows:
T 1 = 1 0 0 0 0 1 0 Δ y 0 0 1 Δ z 0 0 0 1
Secondly, using the follower UGV’s pose at time t in the global coordinate system, the Leader UGV’s pose in the body control center frame (origin O2 in Figure 5) was further transformed to the global frame. Thus, the transformation matrix from the body control center frame to the global coordinate system is defined as T 2 :
T 2 = cos θ f sin θ f 0 x f sin θ f cos θ f 0 y f 0 0 1 0 0 0 0 1
Therefore, the transformation matrix T W from the LiDAR coordinate system to the global coordinate system is given by:
T W = T 2 T 1
In summary, denoting the pose of the Leader UGV detected by the LiDAR at time t in its local coordinate system as ( x p r e , y p r e , θ p r e ) , the estimated pose x s e , y s e , θ s e in the global coordinate system is obtained through two sequential transformations:
X s e = x f + x p r e cos θ f y p r e sin θ f Δ y sin θ f Y s e = y f + x p r e sin θ f + y p r e cos θ f + Δ y cos θ f θ s e = mod ( θ p r e + θ f , 2 π )

3. Experiments and Result Analysis

3.1. Validation of the Pillar-Bin Algorithm on the KITTI Dataset

3.1.1. Experimental Dataset

This study employs the KITTI dataset [33], developed by the Karlsruhe Institute of Technology (KIT), Germany, for model training and experimental analysis. For the 3D object detection task, this dataset comprises 7481 training samples and 7518 test samples. The detection task was categorized into three difficulty levels: Easy, Moderate, and Hard. As the difficulty level increases, the occlusion levels and point cloud sparsity also increased.

3.1.2. Experimental Environment and Parameter Settings

Hardware Environment for 3D Object Detection Algorithm Training: The CPU was a 13th Gen Intel® Core™ i7-13700K (Intel, Santa Clara, CA, USA), and the graphics card (GPU) used was an NVIDIA GeForce RTX 4090 with 24 GB of VRAM (NVIDIA, Santa Clara, CA, USA). The software environment is detailed in Table 1. For training Pillar-Bin on the KITTI dataset, the maximum number of epochs was set to 120 for all experiments to ensure variable consistency. The initial learning rate was set to 2 × 10⁻⁴ with a weight decay of 0.01.

3.1.3. Experimental Results and Analysis of Object Detection Algorithms

This study evaluates object detection algorithm performance using Average Precision (AP) at specific Intersection over Union (IoU) thresholds. We conducted comparative experiments on four algorithms—VoxelNet, SECOND, PointPillars, PV-RCNN++, CenterPoint, SeSame [34] and our proposed Pillar-Bin—for car detection in both 3D detection and BEV modes. Table 2 and Table 3 show the results, where mAP (mean Average Precision) represents the average accuracy across all three difficulty levels.
Table 2 and Table 3 show that the proposed Pillar-Bin algorithm demonstrated consistent improvements over the baseline PointPillars method in 3D detection mode. For vehicle detection, it achieved absolute AP (Average Precision) gains of 3.86%, 3.20%, and 1.79% at Easy, Moderate, and Hard difficulty levels, respectively, elevating the mAP (mean Average Precision) from 76.01 to 78.96 (Δ + 2.95 points). In BEV mode, Pillar-Bin maintained superior performance with AP improvements of 1.19%, 0.99%, and 0.63% across difficulty levels, boosting mAP from 85.65 to 86.59 (Δ + 0.94 points). These results confirm Pillar-Bin’s significant accuracy advantage over competing methods.
Table 4 presents the GPU memory usage and inference speed analysis conducted on the KITTI dataset. As a baseline model, PointPillars exhibits optimal real-time performance, delivering the highest frame rate alongside minimal GPU memory consumption. While Pillar-Bin exhibits higher GPU memory consumption owing to increased model parameters from enhanced classification heads, its computational efficiency remains competitive. The algorithm incurred only a 4 FPS (Frames Per Second) reduction compared to PointPillars, attributable to multi-branch computation overhead. Pillar-Bin achieves better real-time efficiency than other algorithms, second only to PointPillars. Crucially, Pillar-Bin maintains 20+ FPS processing speed (per-frame latency < 50 ms), satisfying the real-time requirement for perception-decision-control loops in dynamic scenarios. This demonstrates successful co-optimization of detection accuracy and computational efficiency through the novel structured detection head design.
To clearly compare the performance of each algorithm, we plotted accuracy–latency curves, as shown in Figure 6. The horizontal axis represents the Average Precision (AP) values under moderate difficulty conditions from Table 2 and Table 3, while the vertical axis corresponds to the frames per second (FPS) data from Table 4. The results demonstrate that although the Pillar-Bin algorithm does not achieve the highest values in individual metrics, it is positioned in the upper-right region of the graph, indicating an optimal balance between accuracy and real-time performance. This validates that the algorithm exhibits the best overall performance.

3.1.4. Ablations and Trade-Offs

The performance of the proposed Pillar-Bin algorithm was evaluated by calculating the recall rate of 3D bounding boxes under different numbers of proposals and various 3D IoU thresholds. As quantitatively shown in Table 5, our method achieved an excellent recall rate of 98.11% with 300 proposals at an IoU threshold of 0.5. Since the recall rate at the 0.5 threshold is already near saturation, further increasing the number of proposals is of limited significance. In comparison, our method still maintained a competitive recall rate of 83.35% under the stricter IoU threshold of 0.7, indicating high proposal quality. Although there is no strict deterministic relationship between the proposal recall rate and the final 3D object detection performance, proposals accepted under the IoU = 0.5 criterion often contain significant errors in orientation and size estimation, which adversely affects control accuracy. The IoU = 0.7 threshold effectively filters out such imprecise proposals, ensuring that only high-quality estimations with accurate geometric structure proceed to the final output stage, thereby enhancing the system’s reliability in real-world scenarios.
We conducted systematic ablation studies to evaluate the effectiveness of different components in the Pillar-Bin detection head, including bin width, search space, yaw bin division (Bin_Yaw), and size templates. Using PointPillars as the baseline, all experiments were conducted on the KITTI dataset, with evaluation focused on the vehicle category under 3D mode using the average precision at moderate difficulty (APₘ) as the metric. As shown in Table 6, since the search space along the x/y-axis and the bin width settings along the x/y-axis are coupled, we analyzed the effect of one variable while controlling the other. First, with the search space along the x/y-axis fixed, we adjusted the bin width along the x/y-axis. Experimental results indicate that when the bin width is set to 0.2 m, the highest APₘ of 78.12% is achieved. Subsequently, with the bin width fixed at 0.2 m, the search space range was adjusted. Expanding the search space to 0.6 m further improved APₘ to 78.87%. When separately evaluating the impact of yaw bin division, dividing the 360° azimuth into 24 intervals (i.e., 15° per bin) yielded the best performance, with an APₘ of 78.67%. Finally, we combined the optimal settings of each component for validation. Experiments demonstrate that, when all components are set to their optimal parameters, the highest APₘ of 79.48% is achieved, indicating strong synergy among the modules.

3.2. Real-World Vehicle Experiments with Pillar-Bin Algorithm

To validate the effectiveness of the Pillar-Bin-based pose estimation framework proposed in Section 2.2 in real-world vehicular conditions, this study adopted the following systematic verification methodology: Firstly, a comprehensive real-vehicle experimental protocol was designed; secondly, a specialized training dataset was constructed based on experimental data to optimize the parameters of the Pillar-Bin algorithm; finally, quantitative evaluation metrics were employed to systematically analyze pose extraction accuracy. This data-driven verification pipeline provides a holistic assessment of the algorithm’s performance in practical application scenarios.

3.2.1. Real-World Vehicle Experiment Design

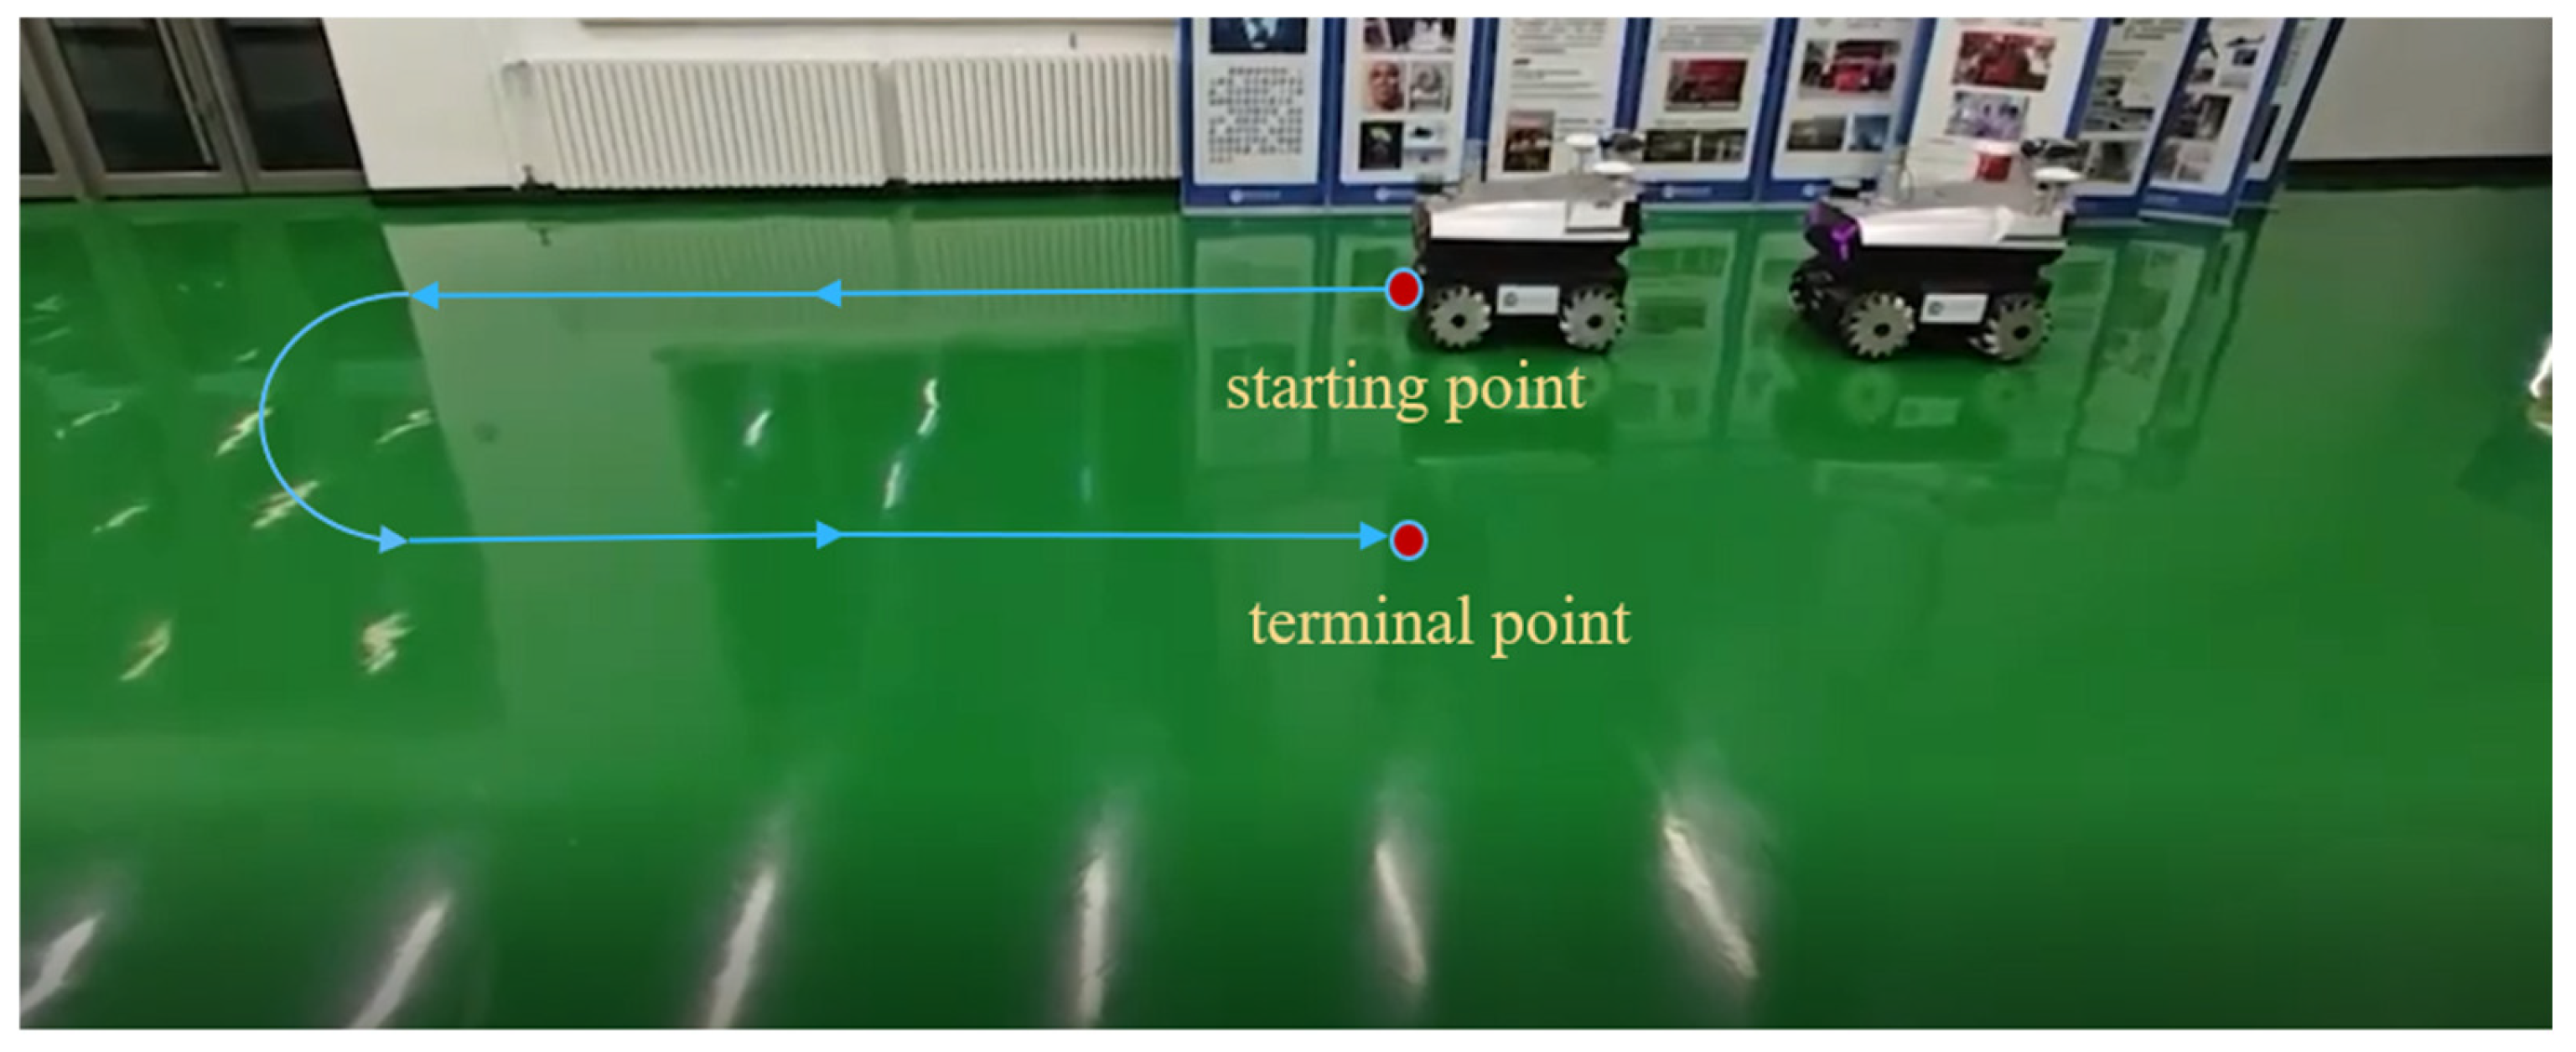
To evaluate the pose estimation accuracy of the Pillar-Bin algorithm for leader Unmanned Ground Vehicles (UGVs), we conducted real-world vehicle experiments. Considering UGVs primarily execute linear and curvilinear motions, the experiment adopted the path configuration illustrated in Figure 7, where the follower UGV remained stationary while continuously acquiring environmental point cloud data via LiDAR, while the leader UGV followed a predefined trajectory comprising a 4-m straight segment, a curved arc segment, and a returning 4-m straight segment. The initial relative pose parameters between the two UGVs were configured with a centerline distance L = 1.5 m and initial relative angle θ = 0°, with constrained maximum velocities of 0.2 m/s (linear) and 0.2 rad/s (angular) for the leader UGV. During testing, we synchronized the leader UGV’s motion control system with the follower UGV’s perception system, recording the leader’s ground-truth pose ( x l , y l , θ l ) in real time using its onboard Inertial Navigation System (INS) while simultaneously collecting the follower’s estimated pose ( x e , y e , θ e ) from the Pillar-Bin model output. Comparative analysis between the ground-truth and algorithm-estimated pose data enabled calculation of X/Y-axis positioning errors and heading angle errors, thereby quantitatively evaluating the pose extraction method’s performance at communication-denied conditions and providing reliable technical support for UGV formation control systems.

3.2.2. Development of Proprietary Dataset for Pillar-Bin Training

To ensure high-quality data acquisition, this study employs the VLP-32C 32-channel LiDAR manufactured by Velodyne as the primary sensor. This device offers high precision and resolution (detailed technical specifications are provided in Table 7), effectively meeting the experimental requirements for both point cloud quality and accuracy.
The experimental platform utilized an omnidirectional UGV equipped with Mecanum wheels to collect data by controlling the leader UGV to execute various predefined motion patterns. In the experimental setup, the follower UGV remained stationary while collecting data through its onboard LiDAR. The leader UGV’s motion parameters were set to a maximum linear velocity of 0.2 m/s and maximum angular velocity of 0.2 rad/s. As shown in Figure 8, based on the straight-line and turning motions in the aforementioned experimental design, we implemented two fundamental motion modes: (a) linear motion (including forward, left-forward and right-forward directions) and (b) curved motion (comprising leftward arcs, rightward arcs, and in-place rotations). Each motion pattern was executed at 60%, 80%, and 100% of the maximum velocity gradient to ensure acquisition of a diversified dataset covering different motion states, thereby providing a comprehensive experimental data foundation for subsequent pose estimation algorithm research.
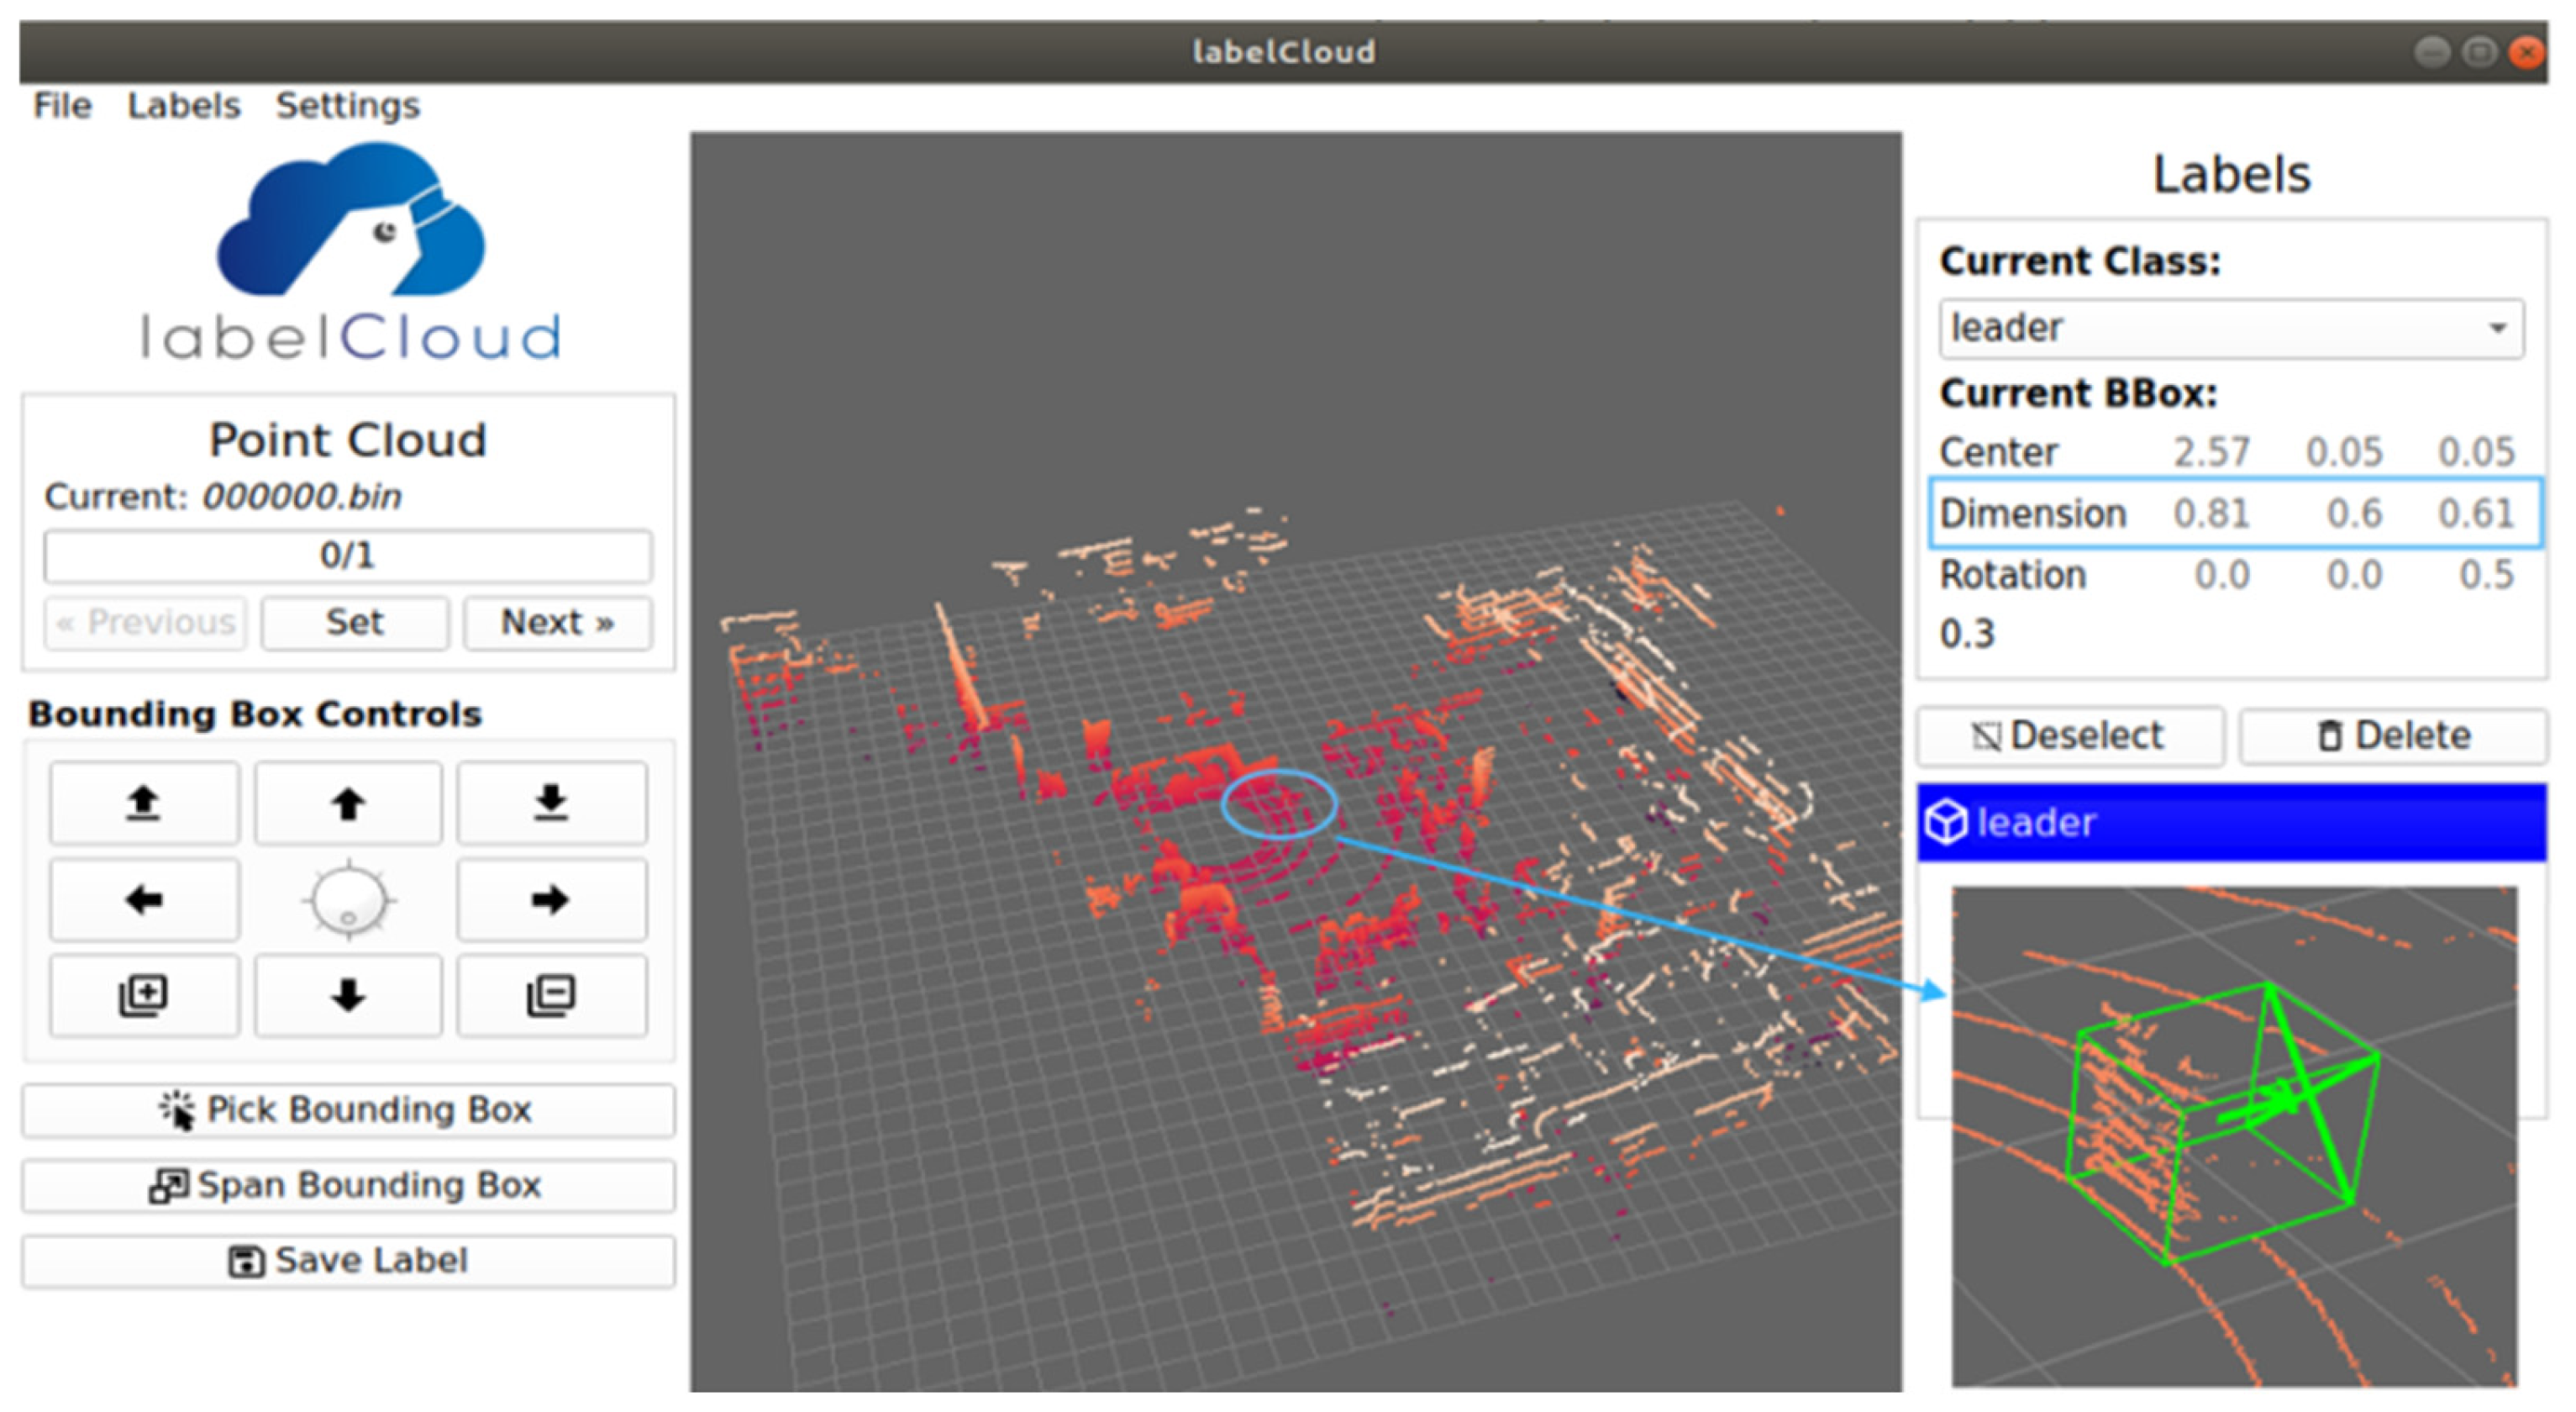
To ensure compatibility with open-source tools and reduce development time, we implemented the following workflow for creating our proprietary dataset: First, the raw LiDAR point cloud data (originally in .pcd format) was converted into KITTI-standard .bin files. We then employed the LabelCloud annotation tool for efficient batch labeling to meet the experiment’s high-throughput data annotation requirements. Considering the experiment’s primary focus on leader UGV detection tasks, we adopted a fixed-size annotation scheme: A predefined annotation template was created based on the physical dimensions of the actual UGVs, and template-based batch annotation was implemented using LabelCloud plugins (specific parameter configurations and annotation results are detailed in Figure 9). This annotation approach provides three key advantages:
  • It significantly improved the dataset annotation consistency by eliminating potential size variations from manual labeling, allowing the Pillar-Bin model to focus on learning critical features without interference from dimensional discrepancies;
  • Combined with the experimental environment’s flat road surface characteristics, it effectively mitigated the localization drift issues;
  • It substantially enhanced the target pose estimation accuracy, providing more reliable data support for subsequent pose estimation research.
Through this processing pipeline, all generated annotation data strictly adheres to KITTI format specifications, resulting in a successfully constructed proprietary dataset that provides high-quality data for algorithm training.
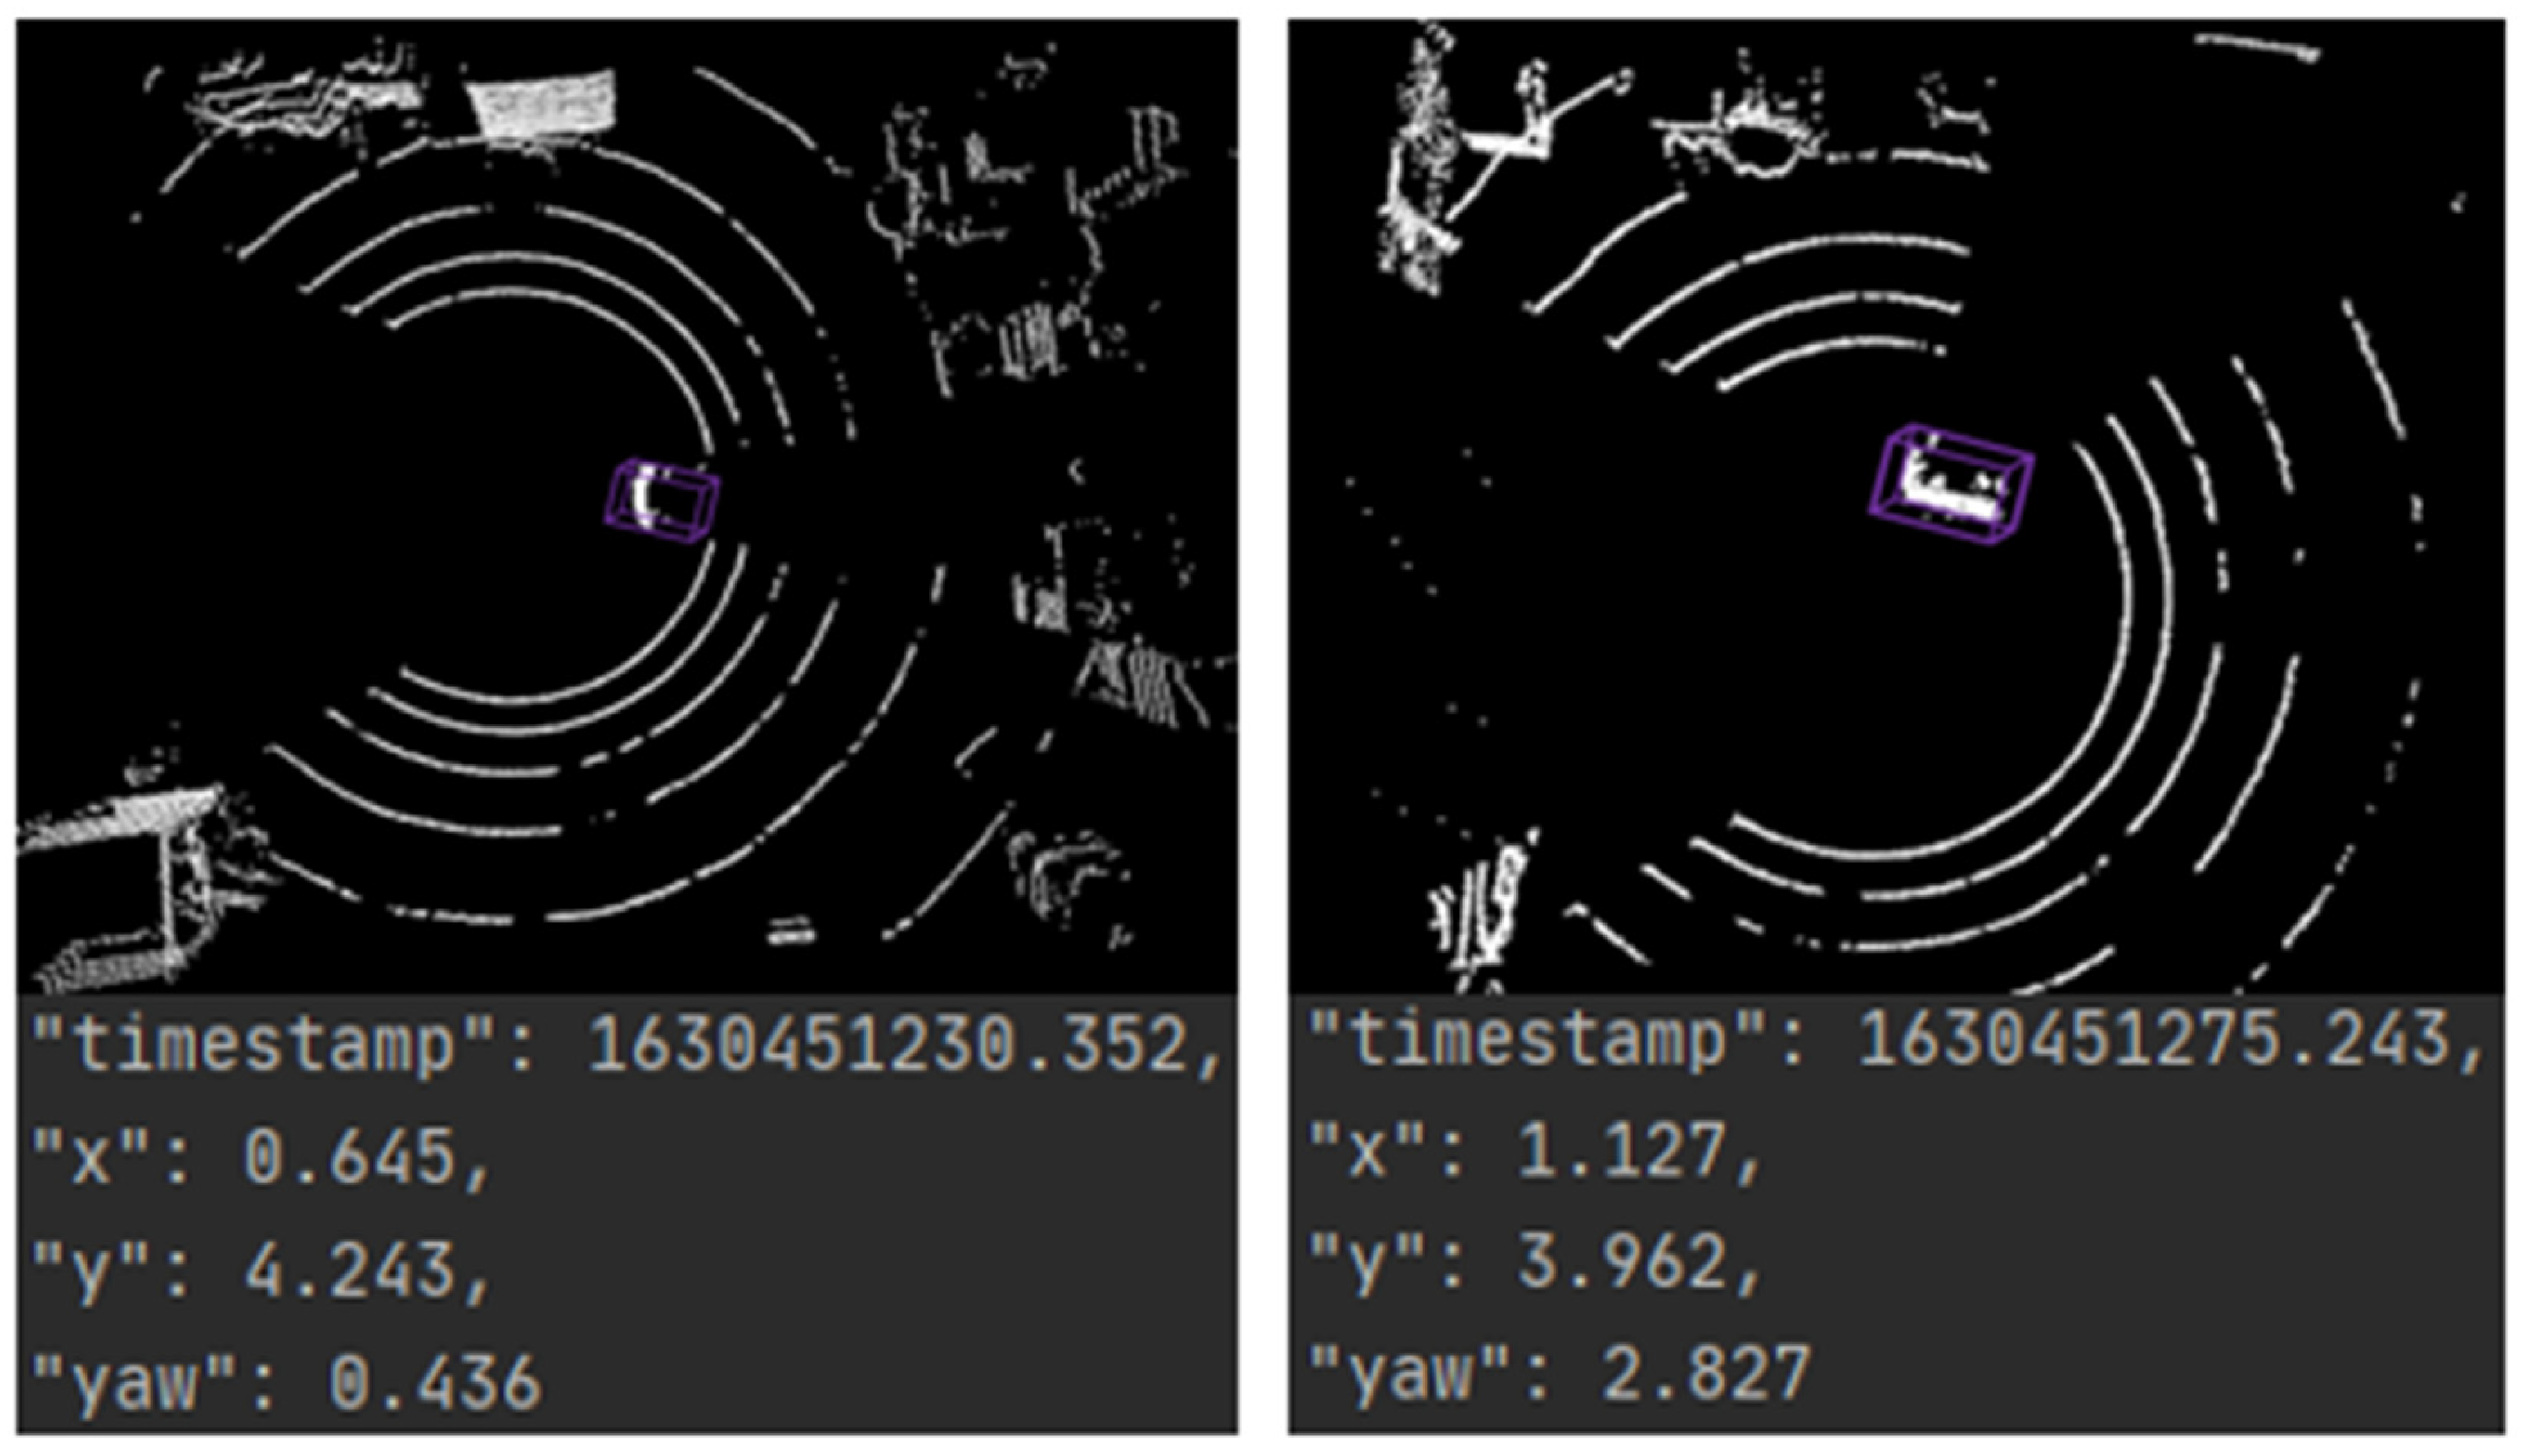
After completing the training of the Pillar-Bin algorithm on the proprietary dataset, partial inference visualization results (Figure 10) demonstrated that the algorithm could efficiently and accurately extract the 3D bounding box of the leader UGV while reliably outputting its geometric state parameters in the LiDAR coordinate system. Specifically, the system recorded detection time stamps, and the model not only precisely acquired the leader UGV’s center coordinates (x, y) but also reliably estimated its yaw angle. These results fully validated the effectiveness of the proposed method in estimating the leader UGV’s pose, laying a solid foundation for subsequent real-vehicle testing.

3.2.3. Vehicle Stability Analysis Under Real-Vehicle Conditions

To validate the capability of the Pillar-Bin algorithm in supporting the stability of Unmanned Ground Vehicle (UGV) formations in real-world scenarios, this subsection conducts targeted testing based on a proprietary real-vehicle dataset. This dataset contains motion data of the leader UGV on both straight (4 m) and curved (arc segment) paths. A sequence of 200 consecutive valid frames (corresponding to the real-vehicle processing speed of 46 FPS, lasting approximately 4.3 s) was selected, covering typical formation motion states such as uniform velocity travel and turning. Using PointPillars as the baseline algorithm, a quantitative analysis of Pillar-Bin’s improvement on formation stability is performed from four key dimensions: pose smoothness, confidence reliability, occlusion robustness, and real-time responsiveness. The experimental hardware remains consistent with Section 3.2.1 (onboard NVIDIA Jetson AGX Orin (NVIDIA, Santa Clara, CA, USA), Velodyne VLP-32C LiDAR (Velodyne LiDAR, San Jose, CA, USA)).
  • Pose Jitter Characteristics: Ensuring Formation Control Smoothness;
Pose jitter directly determines the control accuracy of the follower UGV and the smoothness of formation travel. This experiment employs percentile statistics of inter-frame pose differences, focusing on the “tail error” (95th/99th percentiles, P95/P99) in extreme scenarios to prevent average error from masking critical fluctuations.
Calculation Method: “Inter-frame jitter” is defined as the absolute value of the pose difference of the same leader UGV between two consecutive frames, including:
Position jitter: Δ x   =   x _ t     x _ t 1 ,   Δ y   =   y _ t     y _ t 1 (unit: cm, in the BEV plane);
Heading angle jitter: Δ θ   =   θ _ t     θ _ t 1 (unit: °, yaw angle around the Z-axis).
Experimental Results: As shown in Table 8, the pose jitter of Pillar-Bin is significantly lower than the baseline on both straight and curved paths. Particularly in dynamic turning scenarios, the P99 position jitter is reduced by 44.2%, and the P99 heading angle jitter is reduced by 51.3%, effectively suppressing control oscillations in the follower UGV.
2.
Confidence Calibration and Gating: Ensuring Formation Decision Safety;
The reliability of confidence directly affects whether the follower UGV adjusts control commands based on “trustworthy poses.” This experiment verifies the alignment between Pillar-Bin’s confidence and its actual detection accuracy through Expected Calibration Error (ECE) and confidence threshold sweeping (τ-sweep), preventing formation deviation caused by erroneous poses.
ECE Calculation: The confidence is divided into 10 intervals ([0, 0.1) to [0.9, 1.0]). The weighted deviation between the actual accuracy (acc) in each interval and the midpoint confidence of the interval (weighted by the proportion of samples in the interval) is calculated. A smaller ECE indicates better calibration.
τ-sweep Analysis: To comprehensively analyze the impact of the threshold τ, a τ parameter sweep was conducted. As shown in Table 9, as τ increases from 0.3 to 0.8, and the mAP gradually improves, but the percentage of frames with confidence below τ (i.e., the frequency requiring activation of prediction mode) also increases. When τ = 0.5, the system maintains high accuracy (mAP = 76.8%) while keeping the control interruption frequency at a relatively low level (8.3%), achieving the best balance between accuracy and continuity. Therefore, subsequent analyses all use τ = 0.5.
τ-sweep Test: Using the typical threshold τ = 0.5 (balancing detection accuracy and gating continuity), the mAP (IoU = 0.7), the “percentage of time with confidence < τ” (frequency requiring suspension of control updates), and the false positive rate (FP rate).
As shown in Table 10, the ECE of Pillar-Bin is only 47% of the baseline, indicating that its confidence is highly aligned with the actual accuracy. At τ = 0.5, Pillar-Bin not only maintains a higher mAP but also reduces the FP rate by 60.4%, while the “percentage of time requiring control suspension” is close to the baseline (8.3% vs. 7.8%), achieving a balance between “safe gating” and “formation continuity”.
3.
Re-Locking After Occlusion: Preventing Formation Tracking Interruption;
In real scenarios, the leader UGV is easily occluded by obstacles (e.g., stacks of cardboard boxes, other vehicles). The re-locking speed directly determines whether the formation breaks. This experiment adds controlled occlusion conditions to the real-vehicle scenario to quantify Pillar-Bin’s re-locking performance:
Occlusion Design: A 1.2 m high stack of cardboard boxes was used to occlude 30~50% of the leader UGV’s point cloud. The occlusion duration was 3~5 frames (≈0.065~0.11 s). A total of 15 occlusion segments were tested (covering straight and turning scenarios).
Evaluation Metrics: Average re-locking time (duration from target loss to successful re-matching of the tracking ID), maximum re-locking time, and re-locking success rate.
As shown in Table 11, the experimental results show that the average re-locking time of Pillar-Bin is only 37~38% of the baseline, with a success rate close to 100%. Even in complex scenarios with occlusion during turning, it can quickly restore the pose tracking of the leader UGV, preventing control interruption in the formation due to “target loss.”
4.
End-to-End Latency Breakdown: Meeting Real-Time Formation Control Requirements;
UGV formations require a closed-loop control (perception → decision → execution) latency of <50 ms. This experiment dissects the entire pipeline latency of Pillar-Bin, from LiDAR data input to control command output, through stage-wise timing to verify real-time performance.
Timing Method: GPU time consumption is measured using PyTorch torch.cuda.Event, and CPU time consumption is measured using Python time.perf_counter(). Each stage is timed 100 times, and the average value is taken.
Latency Breakdown: LiDAR I/O (data reading + format conversion), Detector (feature extraction + Bin detection head), Pose Decode (3D bounding box → pose calculation), Controller (pose data transmission to control module).
As shown in Table 12, the end-to-end frame rate of Pillar-Bin is approximately 40.49 FPS, which is only 7.7% lower than the baseline PointPillars (≈43.86 FPS). The core reason for the frame rate decrease is the additional computational overhead introduced by the classification branch in the Bin detection head, which increases the latency in the Detector stage (corresponding to a drop in the Detector stage frame rate from ≈54.05 FPS to ≈49.26 FPS). Despite a slight frame rate loss, the end-to-end frame rate of Pillar-Bin remains well above the real-time threshold typically required for UGV formation closed-loop control (usually ≥25 FPS to ensure control continuity), fully satisfying the real-time perception demand for the leader UGV’s pose during formation motion.
Integrating the metrics from the four dimensions, Pillar-Bin supports UGV formation stability through the following characteristics: the pose jitter P95/P99 is reduced by 45%~57%, minimizing control oscillations in the follower UGV; the ECE is reduced by 53%; the FP rate is reduced by 60%, ensuring that control commands are generated based on reliable poses; the recovery time after occlusion is shortened by over 60%, preventing formation tracking interruptions; the end-to-end latency is <25 ms (Frame rate > 40 FPS), meeting the timing requirements of closed-loop control. The above results demonstrate that Pillar-Bin can provide “high-precision, highly reliable, low-latency” leader pose information for UGV formations under communication-denied conditions, possessing significant practical engineering application value.

3.2.4. Real-Vehicle Experimental Results Analysis

This study conducted a systematic accuracy evaluation of the proposed method by comparative analysis between the ground-truth coordinates of the leader UGV and those obtained through the pose estimation solution presented in Section 2.2. Figure 11 shows that the experimental data comprised two sources: ground-truth coordinate data (blue curve) collected by the vehicle-mounted high-precision inertial navigation system, and pose coordinate data (red curve) calculated through the LiDAR-equipped following vehicle combined with the Pillar-Bin algorithm. The inertial navigation system employs MEMS-based inertial sensors, with the parameters listed in Table 13.
The experimental results demonstrated close alignment between both curves, with only minor fluctuations caused by environmental perception latency, thereby verifying that the proposed Pillar-Bin-based pose estimation solution achieved accurate tracking of the leader UGV’s target position. Further analysis of the temporal error distribution curves in Figure 12 revealed that the coordinate errors in both the X-axis and Y-axis directions were effectively controlled within ±5 cm, which conclusively validated the practical value of this pose estimation approach.
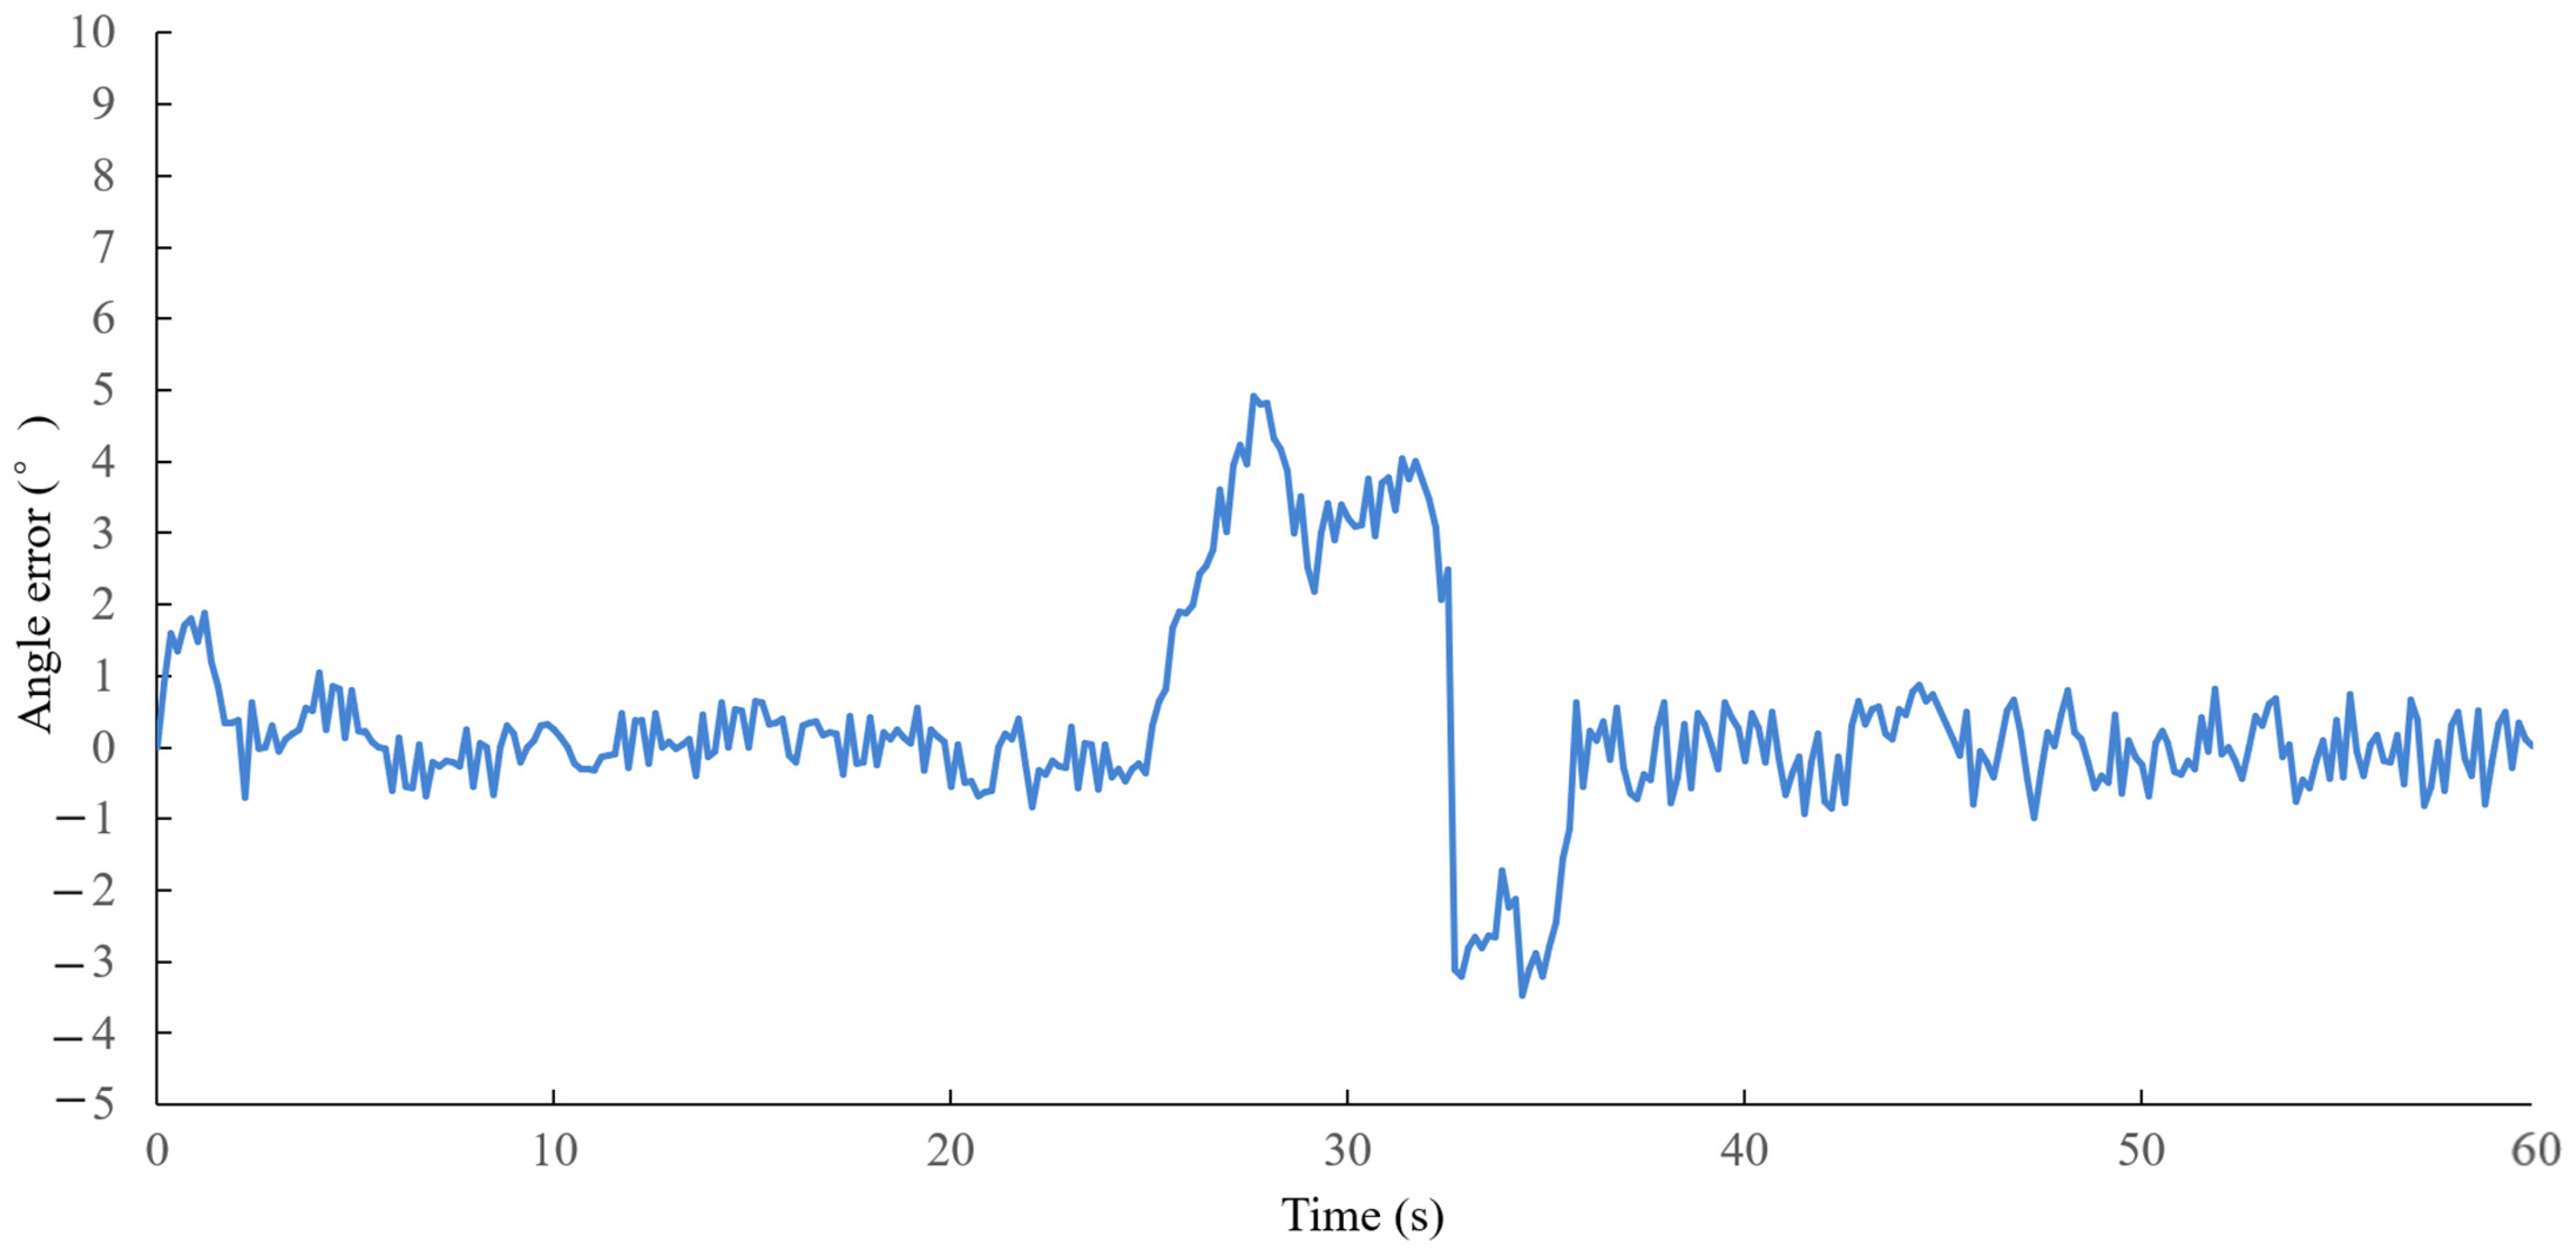
This study systematically validated the yaw angle measurement performance of the proposed pose extraction method by comparing the reference angles measured by the leader UGV’s inertial navigation system with angles extracted by the follower UGV using the Pillar-Bin algorithm. Figure 13 shows, the angle error curve (defined as positive for left deviation and negative for right deviation) exhibited distinct phase characteristics: During the initial activation phase (0–2 s), transient fluctuations with peak-to-peak amplitudes below 2° occurred owing to micro-vibrations during the static-to-dynamic transition. In the straight-line motion phase (2–25 s), angle deviations remained stable within ±0.5°, consistent with sensor noise distribution patterns. When entering curved path negotiation (25–35 s), the system demonstrated a peak instantaneous error of 4.8° during rapid heading changes, which converged to within ±1° within 30 s post-turn. Notably, the solution maintained excellent measurement performance at 46 FPS processing speed, achieving less than 1° error during straight-line operation while strictly limiting peak errors below 5° during turns. These results validated the method’s practical value in dynamic environments, providing autonomous navigation systems with a real-time pose extraction solution that simultaneously achieves high precision (<1° error) and robustness (peak error < 5°).

4. Discussion

The core breakthrough of this study lay in the proposed Pillar-Bin 3D object detection algorithm, which effectively resolved the challenge of real-time, high-precision pose estimation for the leader Unmanned Ground Vehicle (UGV) in leader–follower formation control under communication-denied scenarios. By reconstructing the detection head with an interval discretization strategy, this algorithm significantly mitigated the noise sensitivity inherent in the continuous parameter regression of the PointPillars framework, thereby enhancing detection accuracy. Experimental results (Table 2 and Table 3) demonstrated that this strategy elevated the mean Average Precision (mAP) for vehicle detection by 2.95% in 3D mode and 0.94% in BEV mode on the KITTI dataset, while maintaining real-time processing at 48 FPS. This improvement confirms that the joint optimization mechanism of discretized classification and residual regression effectively suppresses environmental interference and boosts accuracy. Its advantages are shown as follows:
  • Spatial Constraint Effect: Preset discrete intervals (e.g., ±0.6 m along coordinate axes, Figure 2) transform global spatial searches into finite-region matching, substantially reducing computational redundancy;
  • Enhanced Noise Robustness: Using interval centroids as regression benchmarks (Equation (1)) effectively mitigates the impact of local point cloud perturbations on final parameter estimation.
Compared to voxel-based approaches such as VoxelNet and SECOND, the Pillar-Bin algorithm inherits PointPillars’ pseudo-image encoding architecture (Section 2.1), circumventing computational burdens associated with 3D convolutions to improve efficiency. However, while pillar encoding accelerates processing, it may compromise fine-grained geometric details. Future research should explore point-level feature fusion to strengthen scene representation in complex environments.
On-vehicle experiments validate the efficacy of the proposed pose estimation solution: localization errors along the X- and Y-axes remain below 5 cm (Figure 11), heading angle errors are constrained within 5° (Figure 12), and processing at 46 FPS satisfies real-time requirements for closed-loop control. However, in the actual vehicle experiments, the proposed algorithm has not been thoroughly compared with the baseline method PointPillars in terms of system stability. For instance, jitter metrics for position and heading at the 95th and 99th percentiles—which better reflect the smoothness and robustness of the system compared to average error—have not been reported. It should be noted that the current experimental validation was conducted only under conditions involving a single type of Unmanned Ground Vehicle (UGV), flat road surfaces, and low-speed operation. The evaluation does not yet cover adaptability to vehicles with undefined size templates, non-standard vehicle structures, slope conditions, or high-speed sharp-turn scenarios. Furthermore, the latency for the algorithm to reacquire targets in occluded scenarios remains to be quantitatively assessed.
Future research will focus on enhancing the algorithm’s generalization capability and adaptability in complex real-world environments. Specific plans include constructing a diversified dataset encompassing multiple types of UGVs, complex terrains (such as slopes and gravel roads), extreme weather conditions (e.g., rain and strong illumination), and occlusion scenarios, and employing data augmentation techniques (such as simulating point cloud occlusion and noise injection) and transfer learning strategies to improve the model’s ability to recognize unknown vehicle types and irregular structures. These efforts aim to support the effective deployment of the algorithm in a broader range of practical applications.

5. Conclusions

This study proposed a Pillar-Bin 3D object detection algorithm that employed an interval discretization strategy, integrated with a dedicated pose extraction framework, to resolve the critical challenge of follower Unmanned Ground Vehicles (UGVs) perceiving leader UGV poses in communication-denied leader–follower formation control systems. Experimental validation on the public KITTI benchmark demonstrated that, in 3D detection mode, Pillar-Bin significantly outperformed the baseline PointPillars method, elevating vehicle detection Average Precision (AP) by 3.86%, 3.20%, and 1.79% for Easy, Moderate, and Hard difficulty levels, respectively. The mean Average Precision (mAP) simultaneously rose from 76.01% to 78.96%—a 2.95% absolute improvement. Under BEV detection mode, the algorithm achieved AP gains of 1.19%, 0.99%, and 0.63% across difficulty tiers, with mAP increasing from 85.65% to 86.59% (a 0.94% enhancement). These results conclusively validated the algorithm’s detection accuracy superiority. On-vehicle deployment experiments further substantiated the efficacy of the Pillar-Bin pose estimation solution: localization errors along the X- and Y-axes were constrained within 5 cm, heading angle deviations remained below 5°, and real-time processing at 46 FPS satisfied closed-loop control requirements. Collectively, the proposed system delivers high-precision, real-time pose data for UGV formation control without inter-vehicle communication, effectively addressing this pivotal technical challenge.

Author Contributions

Conceptualization, C.K.; methodology, Y.L.; software, Y.L.; validation, C.K., J.C. and S.T.; formal analysis, Y.L. and J.C.; investigation, J.C.; resources, C.K.; data curation, J.C.; writing—original draft preparation, Y.L. and S.T.; writing—review and editing, C.K.; visualization, J.C.; supervision, Y.L.; project administration, Y.L.; funding acquisition, C.K. All authors have read and agreed to the published version of the manuscript.

Funding

This research received no external funding.

Data Availability Statement

The original contributions presented in this study are included in the article. Further inquiries can be directed to the corresponding author.

Conflicts of Interest

The authors declare no conflict of interest.

References

  1. Mesbahi, M.; Egerstedt, M. Graph Theoretic Methods in Multiagent Networks; Princeton University Press: Princeton, NJ, USA, 2010. [Google Scholar]
  2. Zhao, W.; Meng, Q.; Chung, P.W.H. A Heuristic Distributed Task Allocation Method for Multivehicle Multitask Problems and Its Application to Search and Rescue Scenario. IEEE Trans. Cybern. 2015, 46, 902–915. [Google Scholar] [CrossRef] [PubMed]
  3. Nie, Z.; Chen, K.-C.; Jin Kim, K. Social-Learning Coordination of Collaborative Multi-Robot Systems Achieves Resilient Production in a Smart Factory. IEEE Trans. Autom. Sci. Eng. 2025, 22, 6009–6023. [Google Scholar] [CrossRef]
  4. Wang, Y.; de Silva, C.W. Sequential Q-Learning With Kalman Filtering for Multirobot Cooperative Transportation. IEEE-ASME Trans. Mechatron. 2010, 15, 261–268. [Google Scholar] [CrossRef]
  5. Huang, H.J.E. Adaptive Distributed Control for Leader–Follower Formation Based on a Recurrent SAC Algorithm. Electronics 2024, 13, 3513. [Google Scholar] [CrossRef]
  6. Lin, J.; Miao, Z.; Zhong, H.; Peng, W.; Rafael, F. Adaptive Image-Based Leader-Follower Formation Control of Mobile Robots With Visibility Constraints. IEEE Trans. Ind. Electron. 2020, 68, 6010–6019. [Google Scholar] [CrossRef]
  7. Luo, W.; Sun, P.; Zhong, F.; Liu, W.; Zhang, T.; Wang, Y. End-to-End Active Object Tracking and Its Real-World Deployment via Reinforcement Learning. IEEE Trans. Pattern Anal. Mach. Intell. 2020, 42, 1317–1332. [Google Scholar] [CrossRef]
  8. Ramírez-Neria, M.; Luviano-Juárez, A.; Madonski, R.; Ramírez-Juárez, R.; Lozada-Castillo, N.; Gao, Z. Leader-Follower ADRC Strategy for Omnidirectional Mobile Robots without Time-Derivatives in the Tracking Controller. In Proceedings of the American Control Conference (ACC), San Diego, CA, USA, 31 May–2 June 2023; IEEE: Hoboken, NJ, USA, 2023; pp. 405–410. [Google Scholar]
  9. Arrichiello, F.; Chiaverini, S.; Indiveri, G.; Pedone, P. The Null-Space-based Behavioral Control for Mobile Robots with Velocity Actuator Saturations. Int. J. Robot. Res. 2010, 29, 1317–1337. [Google Scholar] [CrossRef]
  10. Xiao, H.; Chen, C.L.P. Incremental Updating Multirobot Formation Using Nonlinear Model Predictive Control Method With General Projection Neural Network. IEEE Trans. Ind. Electron. 2019, 66, 4502–4512. [Google Scholar] [CrossRef]
  11. Rezaee, H.; Abdollahi, F. A Decentralized Cooperative Control Scheme With Obstacle Avoidance for a Team of Mobile Robots. IEEE Trans. Ind. Electron. 2014, 61, 347–354. [Google Scholar] [CrossRef]
  12. Zhao, S.; Zelazo, D. Bearing Rigidity and Almost Global Bearing-Only Formation Stabilization. IEEE Trans. Autom. Control 2016, 61, 1255–1268. [Google Scholar] [CrossRef]
  13. Nie, J.; Zhang, G.; Lu, X.; Wang, H.; Sheng, C.; Sun, L. Obstacle avoidance method based on reinforcement learning dual-layer decision model for AGV with visual perception. Control Eng. Pract. 2024, 153, 106121. [Google Scholar] [CrossRef]
  14. Vora, S.; Lang, A.H.; Helou, B.; Beijbom, O. PointPainting: Sequential Fusion for 3D Object Detection. In Proceedings of the IEEE/CVF Conference on Computer Vision and Pattern Recognition (CVPR), Seattle, WA, USA, 14–19 June 2020; IEEE: Hoboken, NJ, USA, 2020; pp. 4603–4611. [Google Scholar]
  15. Li, S.; Liu, Y.; Gall, J. Rethinking 3-D LiDAR Point Cloud Segmentation. IEEE Trans. Neural Netw. Learn. Syst. 2025, 36, 4079–4090. [Google Scholar] [CrossRef] [PubMed]
  16. Wu, Y.; Wang, Y.; Zhang, S.; Ogai, H. Deep 3D Object Detection Networks Using LiDAR Data: A Review. IEEE Sens. J. 2021, 21, 1152–1171. [Google Scholar] [CrossRef]
  17. Zhou, J.; Tan, X.; Shao, Z.; Ma, L. FVNet: 3D Front-View Proposal Generation for Real-Time Object Detection from Point Clouds. In Proceedings of the 2019 12th International Congress on Image and Signal Processing, BioMedical Engineering and Informatics (CISP-BMEI), Suzhou, China, 19–21 October 2019. [Google Scholar]
  18. Zarzar, J.; Giancola, S.; Ghanem, B. PointRGCN: Graph Convolution Networks for 3D Vehicles Detection Refinement. arXiv 2019, arXiv:1911.12236. [Google Scholar] [CrossRef]
  19. Qi, C.R.; Su, H.; Mo, K.; Guibas, L.J.J.I. PointNet: Deep Learning on Point Sets for 3D Classification and Segmentation. In Proceedings of the IEEE Conference on Computer Vision and Pattern Recognition (CVPR), Honolulu, HI, USA, 21–26 July 2017. [Google Scholar]
  20. Qi, C.R.; Yi, L.; Su, H.; Guibas, L.J. PointNet plus plus: Deep Hierarchical Feature Learning on Point Sets in a Metric Space. In Proceedings of the 31st Annual Conference on Neural Information Processing Systems (NIPS), Long Beach, CA, USA, 4–9 December 2017. [Google Scholar]
  21. Zhou, Q.; Yu, C. Point RCNN: An Angle-Free Framework for Rotated Object Detection. Remote Sens. 2022, 14, 2605. [Google Scholar] [CrossRef]
  22. Zhou, Y.; Tuzel, O. VoxelNet: End-to-End Learning for Point Cloud Based 3D Object Detection. In Proceedings of the 31st IEEE/CVF Conference on Computer Vision and Pattern Recognition (CVPR), Salt Lake City, UT, USA, 18–23 June 2018; IEEE: Hoboken, NJ, USA, 2018; pp. 4490–4499. [Google Scholar]
  23. Yan, Y.; Mao, Y.; Li, B. SECOND: Sparsely Embedded Convolutional Detection. Sensors 2018, 18, 3337. [Google Scholar] [CrossRef]
  24. Lang, A.H.; Vora, S.; Caesar, H.; Zhou, L.; Yang, J.; Beijbom, O.; Soc, I.C. PointPillars: Fast Encoders for Object Detection from Point Clouds. In Proceedings of the IEEE/CVF Conference on Computer Vision and Pattern Recognition (CVPR), Long Beach, CA, USA, 16–20 June 2019; pp. 12689–12697. [Google Scholar]
  25. Yin, T.; Zhou, X.; Krahenbuhl, P. Center-based 3D Object Detection and Tracking. In Proceedings of the IEEE/CVF Conference on Computer Vision and Pattern Recognition (CVPR), Online, 19–25 June 2021; pp. 11779–11788. [Google Scholar]
  26. Shi, S.; Guo, C.; Jiang, L.; Wang, Z.; Li, H.J.I. PV-RCNN: Point-Voxel Feature Set Abstraction for 3D Object Detection. In Proceedings of the IEEE/CVF Conference on Computer Vision and Pattern Recognition (CVPR) 2020, Seattle, WA, USA, 13–19 June 2020. [Google Scholar]
  27. Wu, P.; Gu, L.; Yan, X.; Xie, H.; Wang, F.L.; Cheng, G.; Wei, M. PV-RCNN plus plus: Semantical point-voxel feature interaction for 3D object detection. Vis. Comput. 2023, 39, 2425–2440. [Google Scholar] [CrossRef]
  28. Zhou, W.; Cao, X.; Zhang, X.; Hao, X.; Wang, D.; He, Y. Multi Point-Voxel Convolution (MPVConv) for Deep Learning on Point Clouds. Comput. Graph. 2021, 112, 72–80. [Google Scholar] [CrossRef]
  29. Deng, P.; Zhou, L.; Chen, J. PVC-SSD: Point-Voxel Dual-Channel Fusion With Cascade Point Estimation for Anchor-Free Single-Stage 3-D Object Detection. IEEE Sens. J. 2024, 24, 14894–14904. [Google Scholar] [CrossRef]
  30. Shi, S.; Wang, X.; Li, H. PointRCNN: 3D Object Proposal Generation and Detection from Point Cloud. In Proceedings of the IEEE/CVF Conference on Computer Vision and Pattern Recognition (CVPR), Long Beach, CA, USA, 15–20 June 2019. [Google Scholar]
  31. Liu, H.; Hu, J.; Li, X.; Peng, L. A Multi-Level Eigenvalue Fusion Algorithm for 3D Multi-Object Tracking. In Proceedings of the ASCE International Conference on Transportation and Development (ICTD)—Application of Emerging Technologies, Seattle, WA, USA, 31 May–3 June 2022; pp. 235–245. [Google Scholar]
  32. Liu, J.; Liu, D.; Ji, W.; Cai, C.; Liu, Z. Adaptive multi-object tracking based on sensors fusion with confidence updating. Int. J. Appl. Earth Obs. Geoinf. 2023, 125, 103577. [Google Scholar] [CrossRef]
  33. Geiger, A.; Lenz, P.; Stiller, C.; Urtasun, R. Vision meets robotics: The KITTI dataset. Int. J. Robot. Res. 2013, 32, 1231–1237. [Google Scholar] [CrossRef]
  34. Hayeon, O.; Yang, C.; Huh, K. SeSame: Simple, Easy 3D Object Detection with Point-Wise Semantics. In Proceedings of the Asian Conference on Computer Vision, Hanoi, Vietnam, 8–12 December 2024. [Google Scholar]
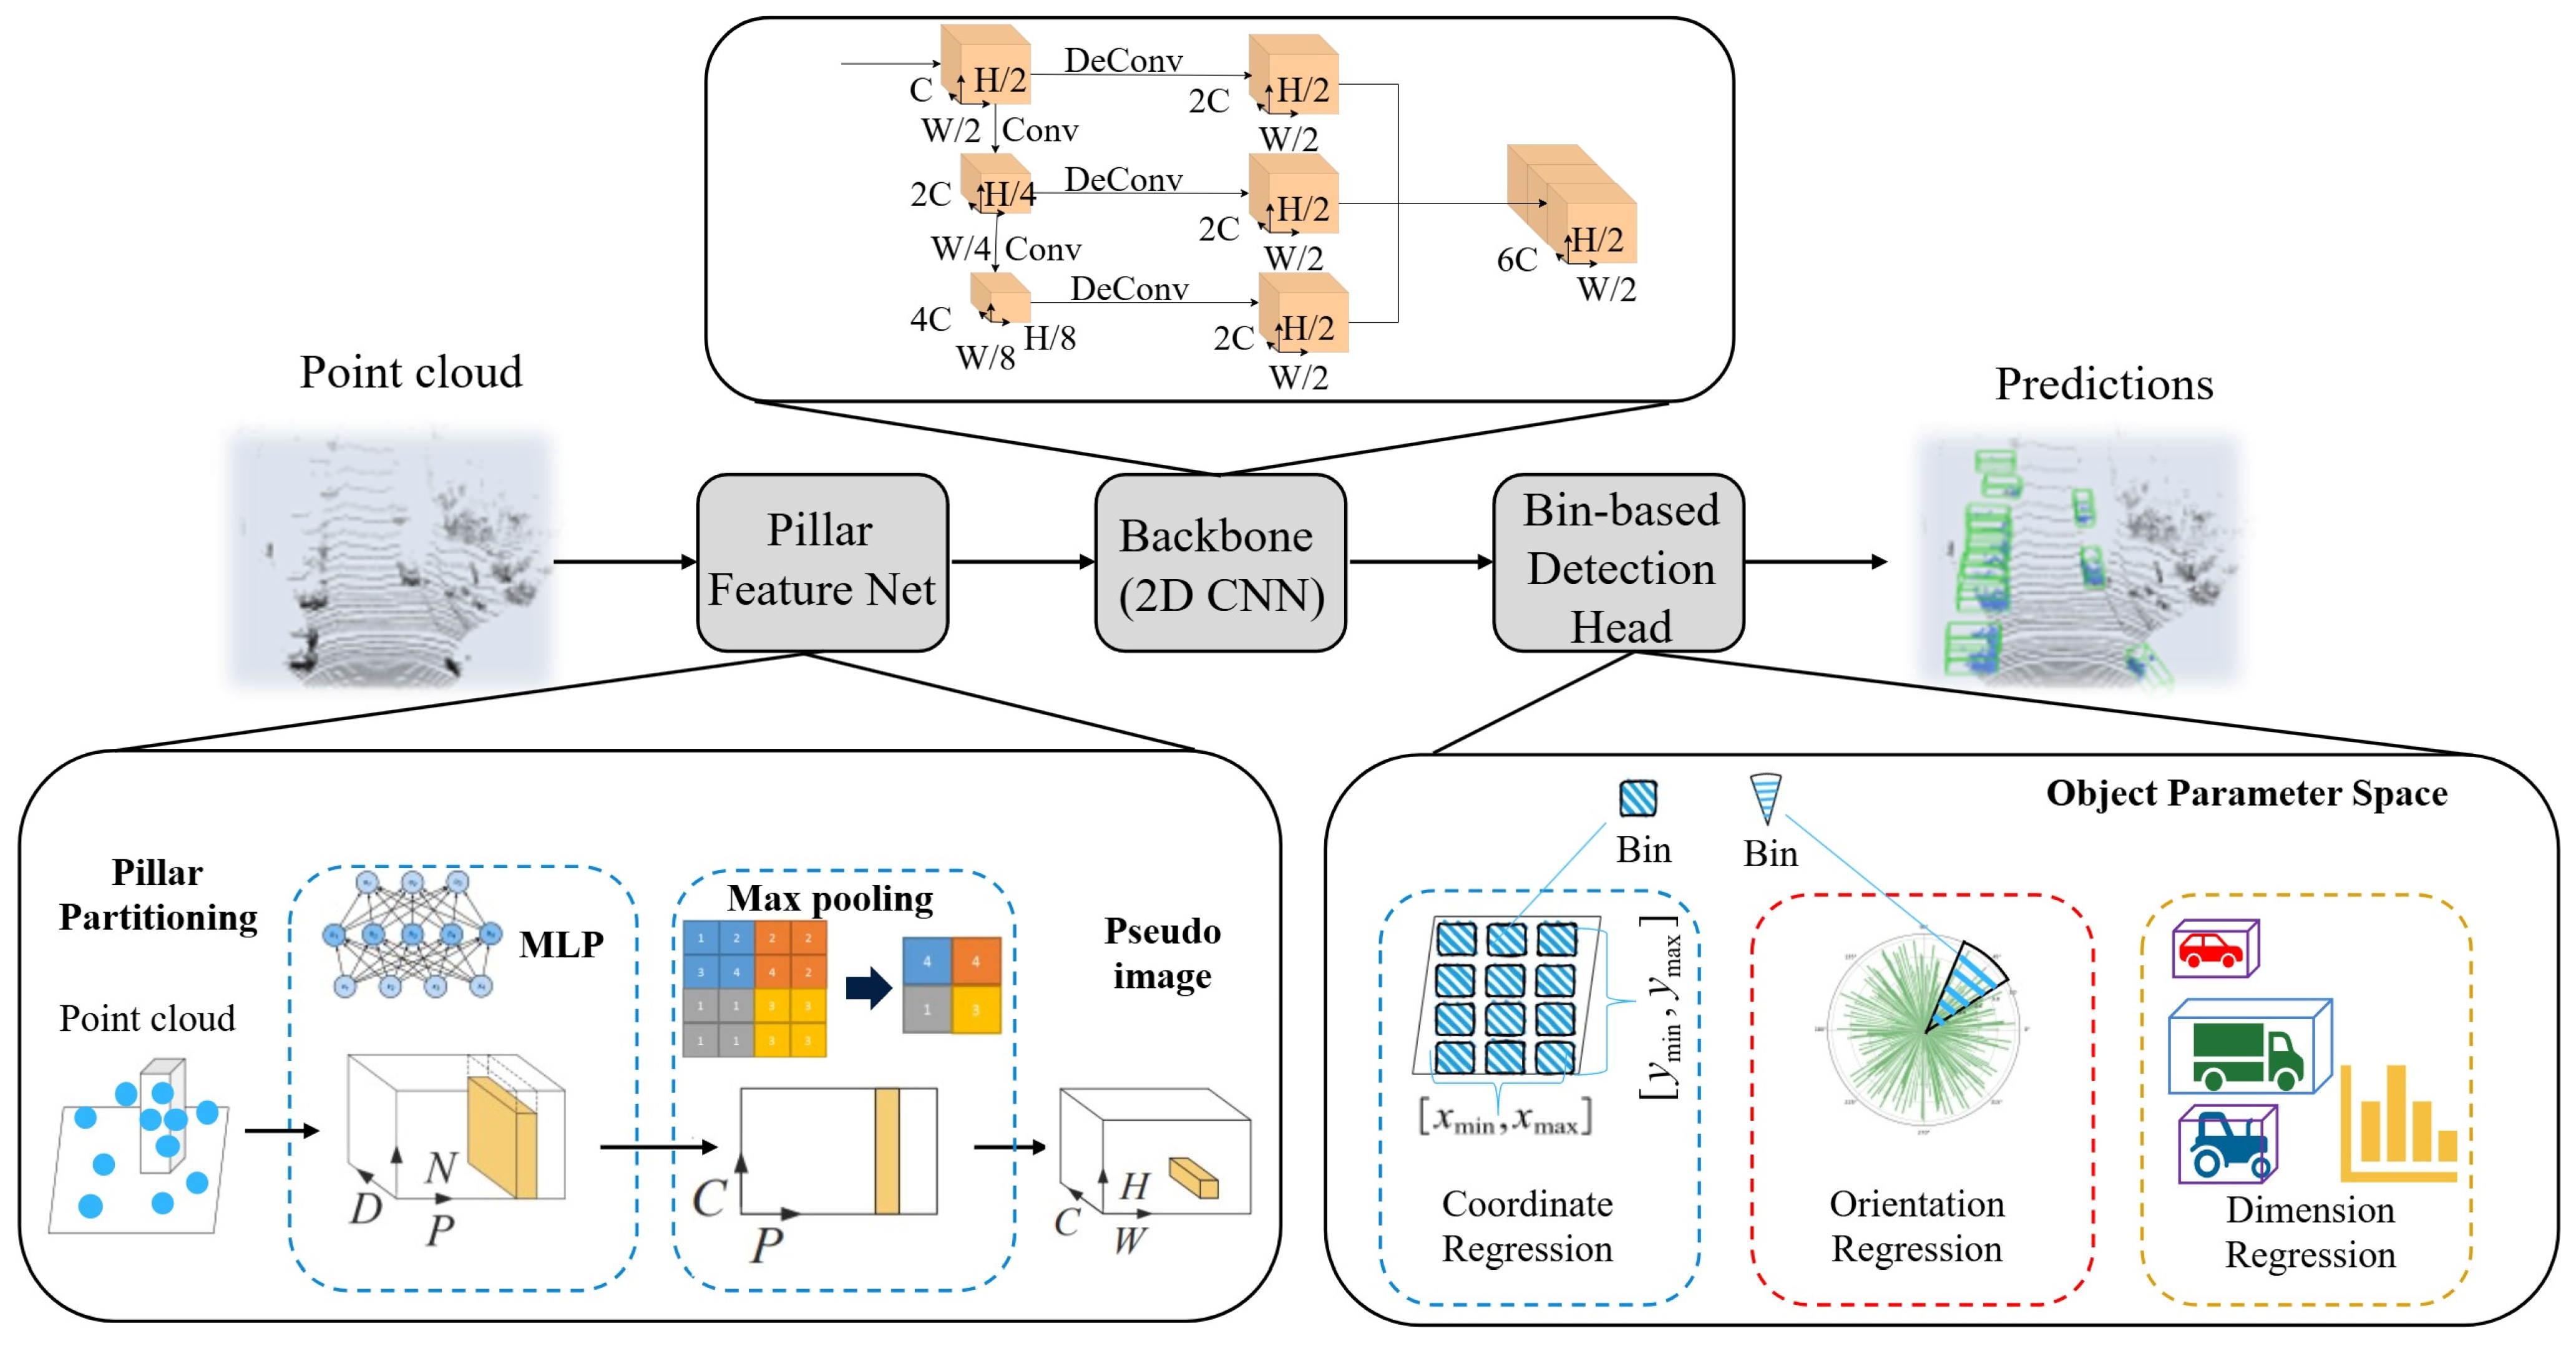
Figure 1. Workflow Architecture Diagram of the Pillar-Bin Algorithm for Processing Point Cloud Data.
Drones 09 00686 g001
Figure 2. Bin-based Localization Schematic. The surrounding region of each foreground point along the X- and Y-axes is divided into discrete bins for target center positioning.
Drones 09 00686 g002
Figure 3. Workflow for Leader UGV Pose Acquisition.
Drones 09 00686 g003
Figure 4. (a) Target detection confidence under 3D perspective; (b) bird’s-eye view perspective.
Drones 09 00686 g004
Figure 5. Schematic of relative positioning between Leader and Follower UGVs. (a) Local coordinate system transformation, (b) Global coordinate system transformation.
Drones 09 00686 g005
Figure 6. Accuracy–Latency Curves of Algorithms. (a) Algorithm in 3D Mode, (b) Algorithm in BEV Mode.
Drones 09 00686 g006
Figure 7. Schematic Diagram of Path Planning for Actual Vehicle Experiments.
Drones 09 00686 g007
Figure 8. Experimental Path Design for Real-Vehicle Tests. (a) Straight-line motion for UGV; (b) curvilinear motion for UGV.
Drones 09 00686 g008
Figure 9. LabelCloud Plugin for Batch Annotation of Vehicle Objects.
Drones 09 00686 g009
Figure 10. Demonstration of Vehicle Recognition and Pose Estimation Output from Partial Point Cloud Data.
Drones 09 00686 g010
Figure 11. Comparison Between Ground-Truth Coordinates of Leader UGV (Blue Line) and Pose-Estimated Coordinates (Red Line).
Drones 09 00686 g011
Figure 12. Coordinate Error Analysis: (a) Temporal error distribution of x-coordinate; (b) Temporal error distribution of y-coordinate.
Drones 09 00686 g012
Figure 13. Angle Error Curves of Leader and Follower UGVs.
Drones 09 00686 g013
Table 1. Software Environment.
Software NameSoftware Version
Linux Operating SystemUbuntu 20.04LTS
ROSNoetic
PyTorch1.7.0
Python3.7
cuda12.2
OpenCV3.4.2
Table 2. Performance Comparison of Different Algorithms in 3D Mode (IoU Threshold = 0.7) (%).
AlgorithmsEasyModerateHardmAP
VoxelNet77.5666.1557.2566.99
SECOND82.1573.6468.4374.74
PointPillars82.6576.2869.1076.01
PV-RCNN++86.3580.6269.6778.88
CenterPoint85.3777.3668.3477.02
SeSame84.7577.3669.5177.21
Pillar-Bin86.5179.4870.8978.96
Table 3. Performance Comparison of Different Algorithms in BEV (IoU Threshold = 0.7) (%).
AlgorithmsEasyModerateHardmAP
VoxelNet87.8977.1476.2480.42
SECOND88.2179.5877.3781.72
PointPillars88.4585.3683.1585.65
PV-RCNN++90.3585.3182.6786.11
CenterPoint89.7884.6183.2185.86
SeSame88.3582.3281.6884.12
Pillar-Bin89.6486.3583.7886.59
Table 4. Comparison of GPU Memory Usage and Inference Speed on the KITTI Dataset Before and After Optimization.
AlgorithmsGPU Memory/MBInference Speed/FPS
VoxelNet794518
SECOND686122
PointPillars374652
PV-RCNN++10,83712.5
CenterPoint875915
SeSame703421
Pillar-Bin402748
Table 5. Proposal recall rates for the car class under moderate difficulty on the validation set, evaluated with varying numbers of RoIs and 3D IoU thresholds.
RoIsRecall (IOU = 0.5)Recall (IOU = 0.7)
1086.3529.14
2090.2132.58
5092.4540.36
10095.7540.31
20096.3874.61
30098.0378.32
50098.1183.35
Table 6. Performance of different components in the pillar-Bin detection head. APₘ denotes the average precision under moderate difficulty with an IoU threshold of 0.7 on the KITTI dataset.
Bin_Width (m)Search Space (m)Bin_Yaw (°)Size TemplatesAPM (%)
0.10.20.40.40.60.81101530
77.38
78.12
77.56
78.12
78.87
78.26
78.02
78.38
78.67
76.11
78.17
79.14
78.45
78.86
79.48
Table 7. Parameters of the LiDAR VLP-32C.
ParameterSpecification
Laser channels32-beam
Detection range100 m
Range accuracy±3 cm
Horizontal FOV360° (continuous rotating scan)
Vertical FOV+10° to −30°
Angular resolutionHorizontal: 0.1°~0.4°; Vertical: 1.33°
Scanning frequency5 Hz~20 Hz
Point cloud output~700,000 points/second
Table 8. Comparison of Pose Jitter between Pillar-Bin and PointPillars under Real-Vehicle Scenarios.
Motion ScenarioMetricPointPillarsPillar-BinRelative
Improvement
Straight PathPosition Jitter P95 (cm)6.22.9−53.2%
Position Jitter P99 (cm)7.53.3−56.0%
Heading Angle Jitter P95 (°)1.60.7−56.2%
Heading Angle Jitter P99 (°)2.31.1−52.2%
Curved PathPosition Jitter P95 (cm)10.14.9−51.8%
Position Jitter P99 (cm)12.26.8−44.2%
Heading Angle Jitter P95 (°)3.11.5−51.6%
Heading Angle Jitter P99 (°)7.83.8−51.3%
Table 9. τ-Sweep Analysis (Pillar-Bin).
Threshold τmAP (%)Frames with Confidence < τ (%)FP Rate (%)
0.375.13.53.8
0.576.88.32.1
0.777.215.61.5
0.877.422.11.2
Table 10. Comparison of Confidence Calibration between Pillar-Bin and PointPillars under Real-Vehicle Scenarios (τ = 0.5 (%)).
MetricPointPillarsPillar-Bin
ECE (Vehicle Class)0.170.08
mAP72.576.8
Percentage of Time with Confidence < τ7.88.3
FP Rate5.32.1
Table 11. Comparison of Re-locking Performance between Pillar-Bin and PointPillars under Real-Vehicle Occlusion Scenarios.
Motion ScenarioMetricPointPillarsPillar-BinRelative
Improvement
Straight PathAverage Re-Locking Time (s)0.240.09−62.5%
Maximum Re-Locking Time (s)0.350.15−57.1%
Re-Locking Success Rate (%)86.798.3+13.4%
Curved PathAverage Re-Locking Time (s)0.310.12−61.3%
Maximum Re-Locking Time (s)0.420.22−47.6%
Re-Locking Success Rate (%)80.096.7+20.9%
Table 12. Comparison of End-to-End Frame Rate between Pillar-Bin and PointPillars under Real-Vehicle Scenarios (Unit: FPS).
Processing StagePointPillars (Baseline)Pillar-Bin
LiDAR I/O476.19476.19
Detector54.0549.26
Pose Decode833.33769.23
Controller1000.001000.00
End-to-End Frame Rate43.8640.49
Table 13. MEMS inertial sensor parameters (g: gravity acceleration).
SensorParameterValue
GyroscopeBias Repeatability0.1°/hour
Scale Factor Repeatability<50 × 10−6
Scale Factor Nonlinearity<100 × 10−6
AccelerometerBias Repeatability<3.5 mg
Noise Density25 μg/sqrt(Hz)
Scale Factor Nonlinearity<1000 × 10−6
Disclaimer/Publisher’s Note: The statements, opinions and data contained in all publications are solely those of the individual author(s) and contributor(s) and not of MDPI and/or the editor(s). MDPI and/or the editor(s) disclaim responsibility for any injury to people or property resulting from any ideas, methods, instructions or products referred to in the content.