Article

Assessment of Dataset Scalability for Classification of Black Sigatoka in Banana Crops Using UAV-Based Multispectral Images and Deep Learning Techniques

by
Rafael Linero-Ramos
1,2,
Carlos Parra-Rodríguez
1,
Alexander Espinosa-Valdez
2,
Jorge Gómez-Rojas
2 and
Mario Gongora
3,*
1
Faculty of Engineering, Pontificia Universidad Javeriana, 7th No. 40-62, Building, N° 11, José Gabriel Maldonado, Floor 2, Bogota 110231, Colombia
2
Faculty of Engineering, Universidad del Magdalena, Street 29H3 No. 22-01, Santa Marta 470004, Colombia
3
Faculty of Computing, Engineering and Media, De Montfort University, The Gateway, Leicester LE1 9BH, UK
*
Author to whom correspondence should be addressed.
Drones 2024, 8(9), 503; https://doi.org/10.3390/drones8090503
Submission received: 26 July 2024 / Revised: 10 September 2024 / Accepted: 13 September 2024 / Published: 19 September 2024
(This article belongs to the Section Drones in Agriculture and Forestry)

Abstract

:
This paper presents an evaluation of different convolutional neural network (CNN) architectures using false-colour images obtained by multispectral sensors on drones for the detection of Black Sigatoka in banana crops. The objective is to use drones to improve the accuracy and efficiency of Black Sigatoka detection to reduce its impact on banana production and improve the sustainable management of banana crops, one of the most produced, traded, and important fruits for food security consumed worldwide. This study aims to improve the precision and accuracy in analysing the images and detecting the presence of the disease using deep learning algorithms. Moreover, we are using drones, multispectral images, and different CNNs, supported by transfer learning, to enhance and scale up the current approach using RGB images obtained by conventional cameras and even smartphone cameras, available in open datasets. The innovation of this study, compared to existing technologies for disease detection in crops, lies in the advantages offered by using drones for image acquisition of crops, in this case, constructing and testing our own datasets, which allows us to save time and resources in the identification of crop diseases in a highly scalable manner. The CNNs used are a type of artificial neural network widely utilised for machine training; they contain several specialised layers interconnected with each other in which the initial layers can detect lines and curves, and gradually become specialised until reaching deeper layers that recognise complex shapes. We use multispectral sensors to create false-colour images around the red colour spectra to distinguish infected leaves. Relevant results of this study include the construction of a dataset with 505 original drone images. By subdividing and converting them into false-colour images using the UAV’s multispectral sensors, we obtained 2706 objects of diseased leaves, 3102 objects of healthy leaves, and an additional 1192 objects of non-leaves to train classification algorithms. Additionally, 3640 labels of Black Sigatoka were generated by phytopathology experts, ideal for training algorithms to detect this disease in banana crops. In classification, we achieved a performance of 86.5% using false-colour images with red, red edge, and near-infrared composition through MobileNetV2 for three classes (healthy leaves, diseased leaves, and non-leaf extras). We obtained better results in identifying Black Sigatoka disease in banana crops using the classification approach with MobileNetV2 as well as our own datasets.

1. Introduction

In order to achieve good agricultural practices and reach sustainable production, banana crop managers around the world need to consider different factors such as economic profitability, environmental impact, and food security [1]. However, to achieve this, there are many environmental and social challenges related to managing environmental variables such as climate change, pests and diseases, intensive agrochemical production, rising production costs, and decreasing producer prices [2].
Organisations and global programmes, such as the Food and Agriculture Organization (FAO) and World Food Programme (WFP), have proposed guidelines committed to Sustainable Development Goal 2: “End hunger, achieve food security and improved nutrition and promote sustainable agriculture” [3]. These guidelines are related to promoting planetary health diets, growing globally crucial fruits and vegetables as a significant food source, investing in science and technology for small and medium-sized farmers, and investing in climate-smart agriculture [4].
Banana is an important fruit globally and a significant food source in many countries due to its high nutritional value, along with cereals, sugar, cocoa, and coffee, representing approximately 16% of the world’s fruit production [5,6]. However, the regions where bananas are grown, which are usually tropical and subtropical, are prone to the proliferation of pests and viruses that affect their production [7].
The global tendency for monoculture and the use of a single banana variety (Cavendish) for international trade have generated a genetic vulnerability to different types of biotic and abiotic diseases [8]. Among these diseases, Black Sigatoka stands out as one of the most aggressive and destructive banana infections [9]; it decreases the production of chlorophyll and the photosynthetic capacities of the plant due to changes in the structure of the leaves.
To combat Black Sigatoka, in many crops, up to 50 aerial fumigation cycles are carried out annually, which represents between 15% and 27% of annual production costs [10]. In addition, workers are employed to perform manual labour and visual inspection tasks, which depend on the subjectivity of the person to estimate the evolution of the disease [5,11]. This is costly due to the large size of the plantation areas, significantly increasing costs, and reducing margins for farmers [12]. For these reasons, it is necessary to research the detection of crop diseases using drones, artificial intelligence, and deep learning, as it is urgent to help producers improve food production by detecting diseases in a scalable manner, thus preventing unsustainable spraying and economic losses.
Currently, in 2024, work is being conducted on the integration of new information technologies to enhance agriculture [13,14], creating tools for plant diagnosis through automatic image analysis and machine learning [15]. These types of applications and new integrations are enhanced in combination with unmanned aerial vehicles (UAV) to determine the presence of Black Sigatoka in large areas in less time [16], but collecting labelled datasets for machine learning remains a significant challenge.
Advances in UAVs have allowed capturing images and videos in high resolution almost in real time [17], and they are also used as sensor platforms to monitor crops in a relatively cost-effective way [18]. In agriculture, the use of these devices allows monitoring of individuals and their health status [19], facilitating the monitoring of large areas in less time for diseases related to foliar infections.
Different types of algorithms have been implemented in the detection of foliar diseases in bananas [20], generally differentiated between classification and detection algorithms using machine learning and deep learning, such as convolutional neural networks (CNNs) with accuracies between 90.8% and 99.4%. These algorithms have allowed the detection of Black Sigatoka at different scales through the visible spectrum [21]. In addition, machine learning algorithms combined with information from various types of sensors in agriculture, such as multispectral sensors, have been implemented to improve detection performance [22].
CNNs are a type of artificial neural network used widely for machine training, where artificial neurons are intended to be given the capability that neurons in the primary visual cortex have [21]. CNNs contain several specialised layers interconnected with each other, in which the initial layers can detect lines and curves, and gradually become specialised until reaching deeper layers that recognise complex shapes [19].
Of the common architectures in precision agriculture applications, VGG19 is a convolutional neural network of the VGG16 family, created by developers at the Visual Geometry Group (VGG) at the University of Oxford. It has a total of 19 layers; 16 are convolutional, and 3 are fully connected layers. VGG proposed filters with small sizes instead of large filters [20].
On the other hand, for detection models, there are architectures such as YOLO, which is a state-of-the-art computer vision model built by Ultralytics, a model containing out-of-the-box support for object detection, classification, and segmentation tasks, accessible through the Python package as well as a command line interface [20]. Faster Regression-CNN (F-RCNN) is an object detection framework using Roboflow [21] that utilises a two-stage deep learning object detector: first, it identifies regions of interest and then passes these regions to a convolutional neural network. The outputted feature maps are passed to a support vector machine (SVM) for classification. The regression between predicted bounding boxes and ground truth bounding boxes is computed. Single Shot Detector (SSD) is an object detection model with multiple layers and millions of parameters. It provides real-time inference under constrained computing resources in devices like smartphones [22].
For the classification and detection of diseases in crops using deep learning techniques, the use of multispectral sensors has allowed the description of these types of diseases through their spectra. To demonstrate this, spectra related to the red band (650–673 nm) up to the near-infrared band (800–880 nm) are enough to fully determine the variation in chlorophyll in the leaves [23].
When there are changes in the chlorophyll of plants, as occurs during an infection or disease, the reflectance of light on the surface of the leaves can also change. When plants are healthy, chlorophyll mainly absorbs light in the visible spectrum region, especially in the blue and red wavelengths, while reflecting green light, giving the leaves their characteristic colour [23]. However, when there are changes in the quantity or quality of chlorophyll, as occurs during a disease, the reflectance of light can be affected. For example, a decrease in chlorophyll concentration may result in less light absorption in the red wavelengths, which could lead to an increase in reflectance in these areas of the spectrum.
Therefore, by measuring the reflectance of light at different wavelengths, especially in regions where chlorophyll has high absorption, it is possible to detect changes in the health of plants and distinguish between healthy and diseased leaves [24]. This spectral analysis can be carried out using remote sensing techniques, such as images obtained by drones [25], and provides valuable information for early detection and monitoring of diseases in agricultural crops.
Although the use of multispectral images obtained by remote sensing is usually implemented by calculating vegetation indices to determine the state of the plants [24], there are methodologies to highlight characteristics only using the thresholds captured by the different spectra [26]. Also called false-colour images, these use three-channel images in the same scene, in which they take their different spectra to highlight the natural characteristics of the materials [27].
Currently, multiple studies address the classification and detection of diseases in crops, specifically in banana plantations, by evaluating different models and techniques that use artificial intelligence, obtaining good results. However, a technological gap still exists associated with the methods of image acquisition for these crops because, according to published scientific articles, the best results are regularly obtained by acquiring images with conventional RGB cameras or even with smartphones. This involves significant resources and human effort to cover large areas of farmland and rugged, hard-to-navigate terrain. This study addresses this gap by acquiring images of real crops in banana production environments using drones to create our own datasets, which allows us to save time and resources in the identification of crop diseases in a scalable manner.
This study aims to evaluate the use of false-colour images created from multispectral images taken with UAVs. This evaluation is carried out through classification and detection algorithms to find Black Sigatoka in productive banana crops, using different convolutional neural network (CNN) architectures.
To achieve this general objective, specific objectives have been set, guided by a methodology based on documenting, designing, implementing, and evaluating. These objectives are:
To document the state of the art of disease classification in crops using UAV-based multispectral images and machine learning techniques.
To design a methodology for the implementation of classification and detection algorithms that detect Black Sigatoka in banana crops, carrying out their validation in these, to evaluate the quality of crops from Magdalena Department (see Figure 1).
To create an image dataset of banana crops infected with Black Sigatoka using drones, to evaluate different convolutional neural network (CNN) architectures for the classification and detection of this disease in the crops.
To implement classification and detection algorithms to find Black Sigatoka in productive banana crops, using different convolutional neural network (CNN) architectures adjusted to our image datasets with transfer learning, and to evaluate the algorithms designed and implemented in banana crops from Magdalena Department in Colombia.
This paper is composed of five sections: Section 1, this introduction, documents the state of the art on the classification and detection of diseases in crops using UAV-based multispectral images and deep learning techniques and outlines the aims of this study. Section 2, Materials and Methods, establishes the processes used in this study, data acquisition with UAV is explained, the construction and labelling of the dataset is explained, and the training protocol and evaluation metrics for the classification and detection models are established. In Section 3, the most relevant results of this research are presented. In Section 4, an academic discussion based on the state of the art and the data from the test results is undertaken. Finally, in Section 5, the most relevant conclusion of this research is presented.

2. Materials and Methods

2.1. Data Acquisition with UAV

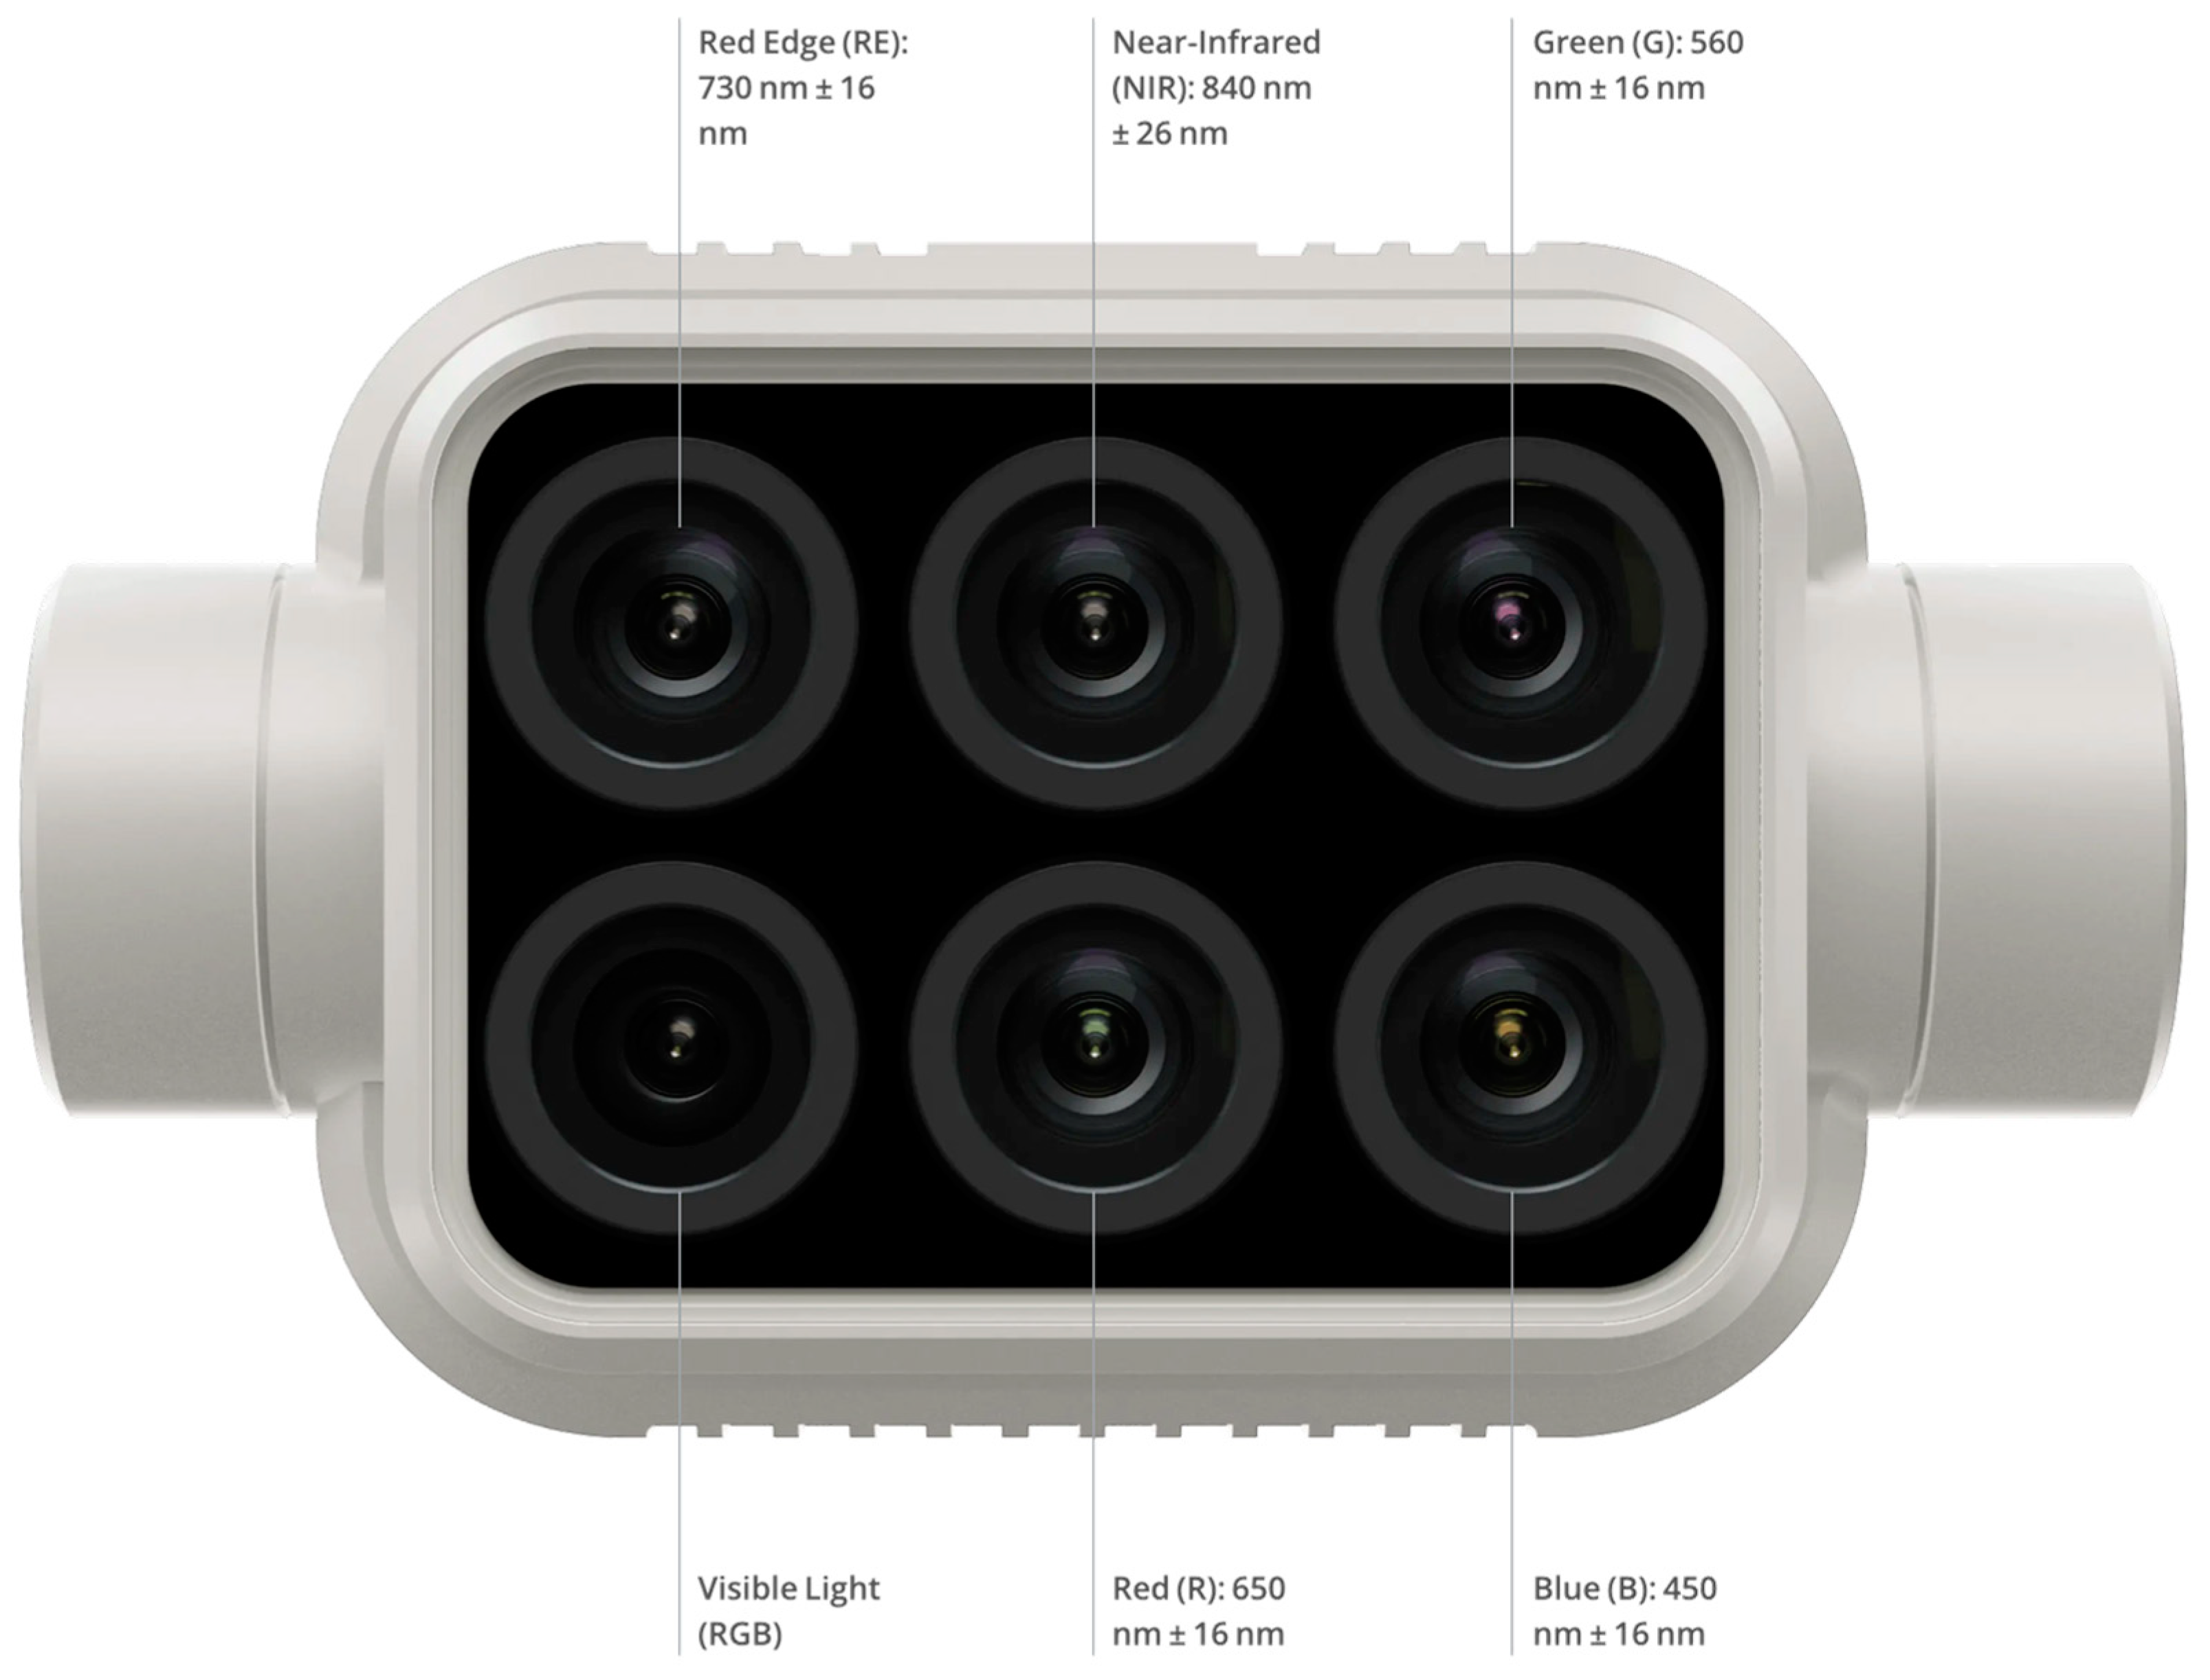
For this study, multispectral images captured by a DJI Phantom 4 drone were used; the drone was equipped with a camera containing six spectral filters, covering the blue (450 ± 16 nm), green (560 nm ± 16 nm), red (650 nm ± 16 nm), red edge (730 nm ± 16 nm), and near-infrared (840 nm ± 26 nm) bands. The images were taken between 9:00 A.M. and 11:00 A.M., on different days, comprising two samples, one at a height of 15 m and another at 25 m above ground level on each farm, collecting a total of 945 images with a 75% overlap. The flights took place at altitudes between 15 and 25 m, at a speed of 7 m/s, achieving an approximate resolution of 1 cm per pixel. The meteorological conditions during the flights included a relative humidity of 67–70% and an average temperature of 31–33 °C. The multispectral camera was calibrated using a radiometric calibration panel before each flight to ensure image consistency. The integrated GNSS RTK system provided centimetre-level positional accuracy, which was crucial for georeferencing the images in areas affected by Black Sigatoka.
Images were captured in five similar banana plantations in Magdalena Department in northern Colombia, specifically in the municipalities of the Zona Bananera and El Retén, with the aim of increasing the number of samples of healthy leaves and diseased leaves for the construction of a new proprietary dataset (see Figure 1).
The plantations are of the Musa acuminata variety (AAA Group, Cavendish sub-group, “Williams” cultivar), with an age between 5 and 8 months, in productive and reproductive stages. However, it is important to clarify that current research, which forms part of our future work, involves capturing images in crops at an earlier growth stage, before 5 months, when the symptoms of the disease are already evident and are even easier to classify due to the minimal growth, as the plants have not yet overlapped.
As it is an endemic disease in the Magdalena Department, at the time of data acquisition, Black Sigatoka infection is occurring in its 6 stages, referring to the foliar impact and the evolution of symptoms that this disease has on the banana plant leaf, based on the stages of Gauhl and Fouré [27], according to information provided by phytopathology experts supporting this study (please refer to the acknowledgement section).
It is important to clarify that this study does not classify the severity of the disease, but rather the presence or absence of it, considering 2706 images of diseased leaves and 3102 images of healthy leaves labelled by the experts mentioned above.
For data acquisition with UAV, the physical distance between the lenses of the different filters on the multispectral Phantom 4 drone generates an optical phenomenon known as disparity; this UAV integrates six 1/2.9″ CMOS sensors, including one RGB sensor for visible light imaging and five monochrome sensors for multispectral imaging, with the positions shown in Figure 2 and detailed in the P4 Multispectral User Manual [25].
The UAV used for data acquisition has a spectral sunlight sensor on top of the aircraft that detects solar irradiance in real time for image compensation, which maximises the accuracy and consistency of data collection at different times of day [25]. This allows for more accurate results in the calculation of vegetation indices and the creation of false-colour images.
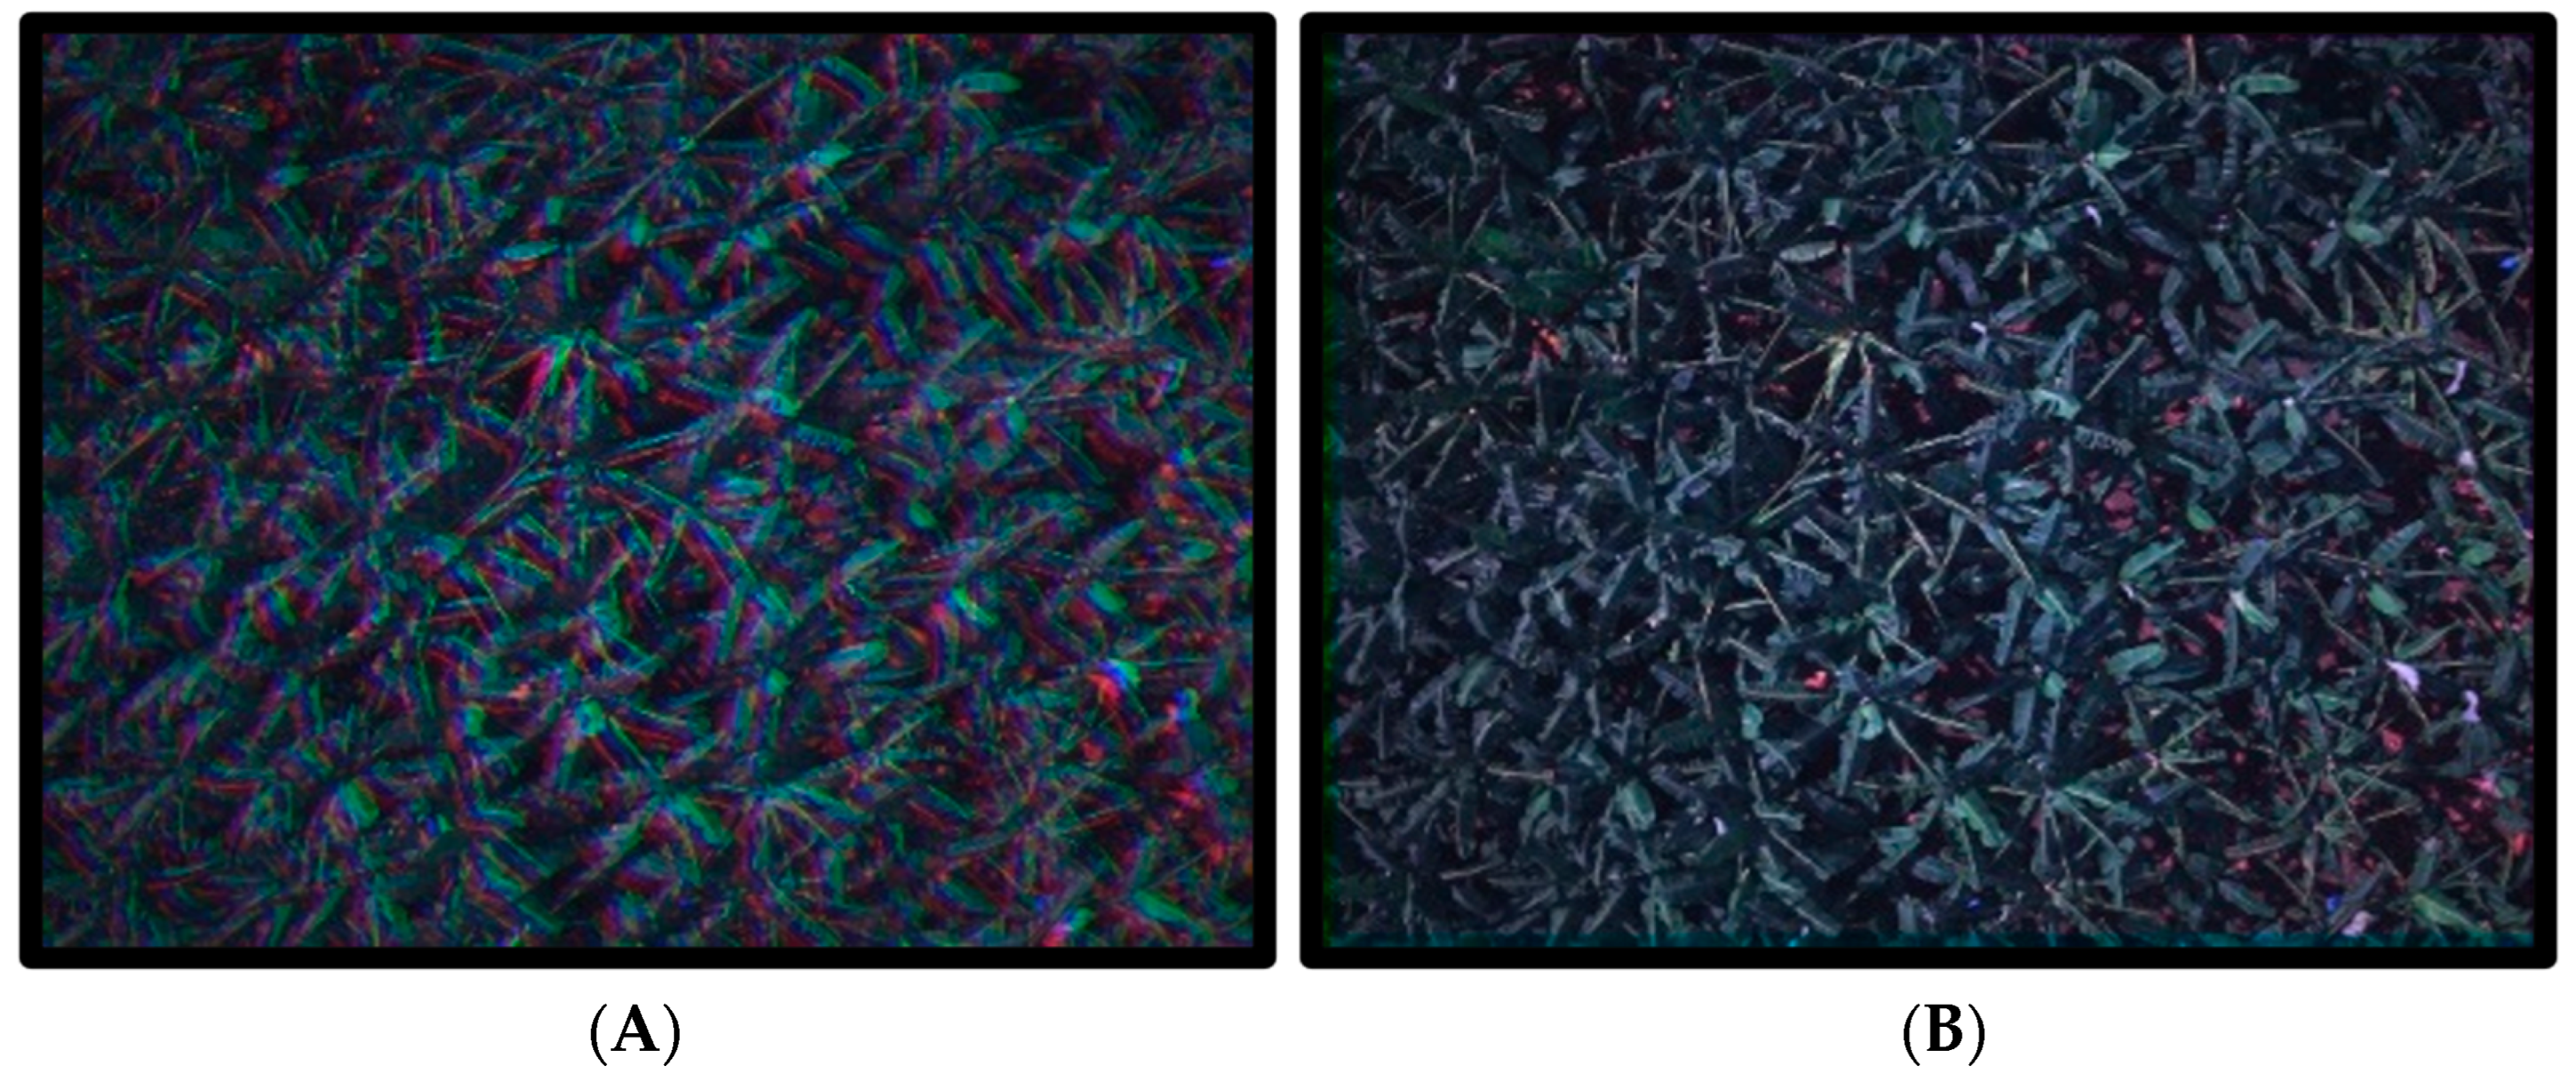
This physical distance between the lenses of the different filters causes each spectral image to contain a displacement (x, y) relative to the others, as observed in Figure 3A. This phenomenon can be corrected by computer vision techniques for the alignment of images based on scale-invariant feature transform (SIFT).
To correct this displacement and obtain an accurate spectral comparison of the leaf area, an algorithm based on SIFT is applied [28]. This algorithm allows for aligning the five spectra of each scene and obtaining correct information from each pixel based on invariant features over time, which allows for obtaining the results shown in Figure 3B.
On the other hand, for obtaining geographical data, a circuit composed of an ESP32 and a NEO 6 GPS was used to map the plantations, accompanied by an expert farmer. The objective was to obtain the coordinates of the infection foci and determine the severity of the disease at each point. This information will be used later as a reference in the labelling process to achieve greater precision.
Based on the positions of 282 points recorded by the GPS and considering that the images provided by the drone are georeferenced, the different infection foci were identified. From these foci, a total of 505 effective images were obtained, each one showing the presence of at least one leaf infected with Sigatoka, at different scales.

2.2. Detection Models Labels

In the development of the detection models for this research, the labelling format based on YOLOv8 was adopted. This format is especially useful for models like YOLO, F-RCNN, and SSD. To carry out this process, the Roboflow platform was used [29], where 3640 Sigatoka labels were created on the 505 images, as shown in the corresponding figure. An example of this can be seen in Figure 4.
The result is a plain text file per image, which indicates the different classes and positioning of each label in the scene and has the following characteristics:
  • One row per label.
  • Each row contains 4 data points: the centre of the X-axis, the centre of the Y-axis, height, and width of detection.
  • All the data corresponding to coordinates must be normalised relative to the maximum width and height of the image.

2.3. Classification Models Labels

Unlike detection, classification only requires a dataset based on objects [30]. Therefore, a division into sections of 160X130 pixels was implemented for the selected 505 images to obtain samples of objects such as diseased leaves, healthy leaves, and others that contain objects different from leaves. This allows obtaining a dataset based on 3 classes: 2706 objects of diseased leaves, 3102 objects of healthy leaves, and 1192 objects of non-leaves.
For the training of classification models, labels were created using false-colour images, following the guidelines of studies such as [23], which demonstrate that spectra related to the red band (650–673 nm) to the near-infrared band (800–880 nm) can fully determine chlorophyll variation in leaves and thereby detect diseases.
For this process, it is not necessary to perform conversions; simply select the matrices of the spectra captured by the UAV used, considering the spectra capable of fully determining chlorophyll variation in the leaves, to form new false-colour images of 3-channel matrices.
This methodology establishes new criteria for visual photo interpretation by replacing one or several channels in an image with the thresholds obtained from the multispectral camera [31], in this case: red (650 nm ± 16 nm), red edge (730 nm ± 16 nm), and near-infrared (840 nm ± 26 nm), thereby increasing the amount of data in the training. Furthermore, it does not require high computational resources to generate images in the colour space with higher quality than those captured in the visible spectrum [26]. The procedure is illustrated in Figure 5.
Since the creation of these images does not affect the positioning of the objects, it is only necessary to use one set of labels for each methodology. This allows using the labels made in the visible spectrum as a base.

2.4. Evaluation of the Classification and Detection Models

Machine learning models are evaluated and adjusted using evaluation metrics [13]. For classification models, a basic metric used is the confusion matrix, which consists of the relationship between the actual or true labels in the rows and those predicted by the model in the columns, as shown in the corresponding intersections in Table 1.
From the data in Table 1, different metrics can be generated for model evaluation, such as those shown in Table 2.

2.5. Training Protocol

The following architectures in precision agriculture applications were selected: EfficientNet, VGG, and MobileNet, due to their applications in foliar disease classification. These systems were trained using transfer learning techniques and hyperparameter tuning through iterations until achieving the best training metrics, using our own datasets and open datasets [32,33]. Finally, the best evaluation metrics were obtained to be analysed with respect to the behaviour of the disease.

3. Results

3.1. Dataset Creation

Since the red spectrum reflects the variation of chlorophyll in the plant [23], it was proposed to use near-infrared and red edge as a basis for generating new images, following the methodology described in Section 2.3. Thus, three combinations were obtained in which only the first channel varies between the red, green, and blue spectra, while the second and third channels are maintained with the two red spectra, as detailed in Table 3.
This methodology forms new false-colour images of three-channel matrices, emulating the traditional image formation of a colour composition system based on the addition of the primary colours of light, red, green, and blue (RGB), but with three channels that have scientifically demonstrated the ability to fully determine the variation in chlorophyll caused by diseases in the leaves: red, red edge, and near-infrared [23]; the other spectrum combinations are made for the purpose of data augmentation.
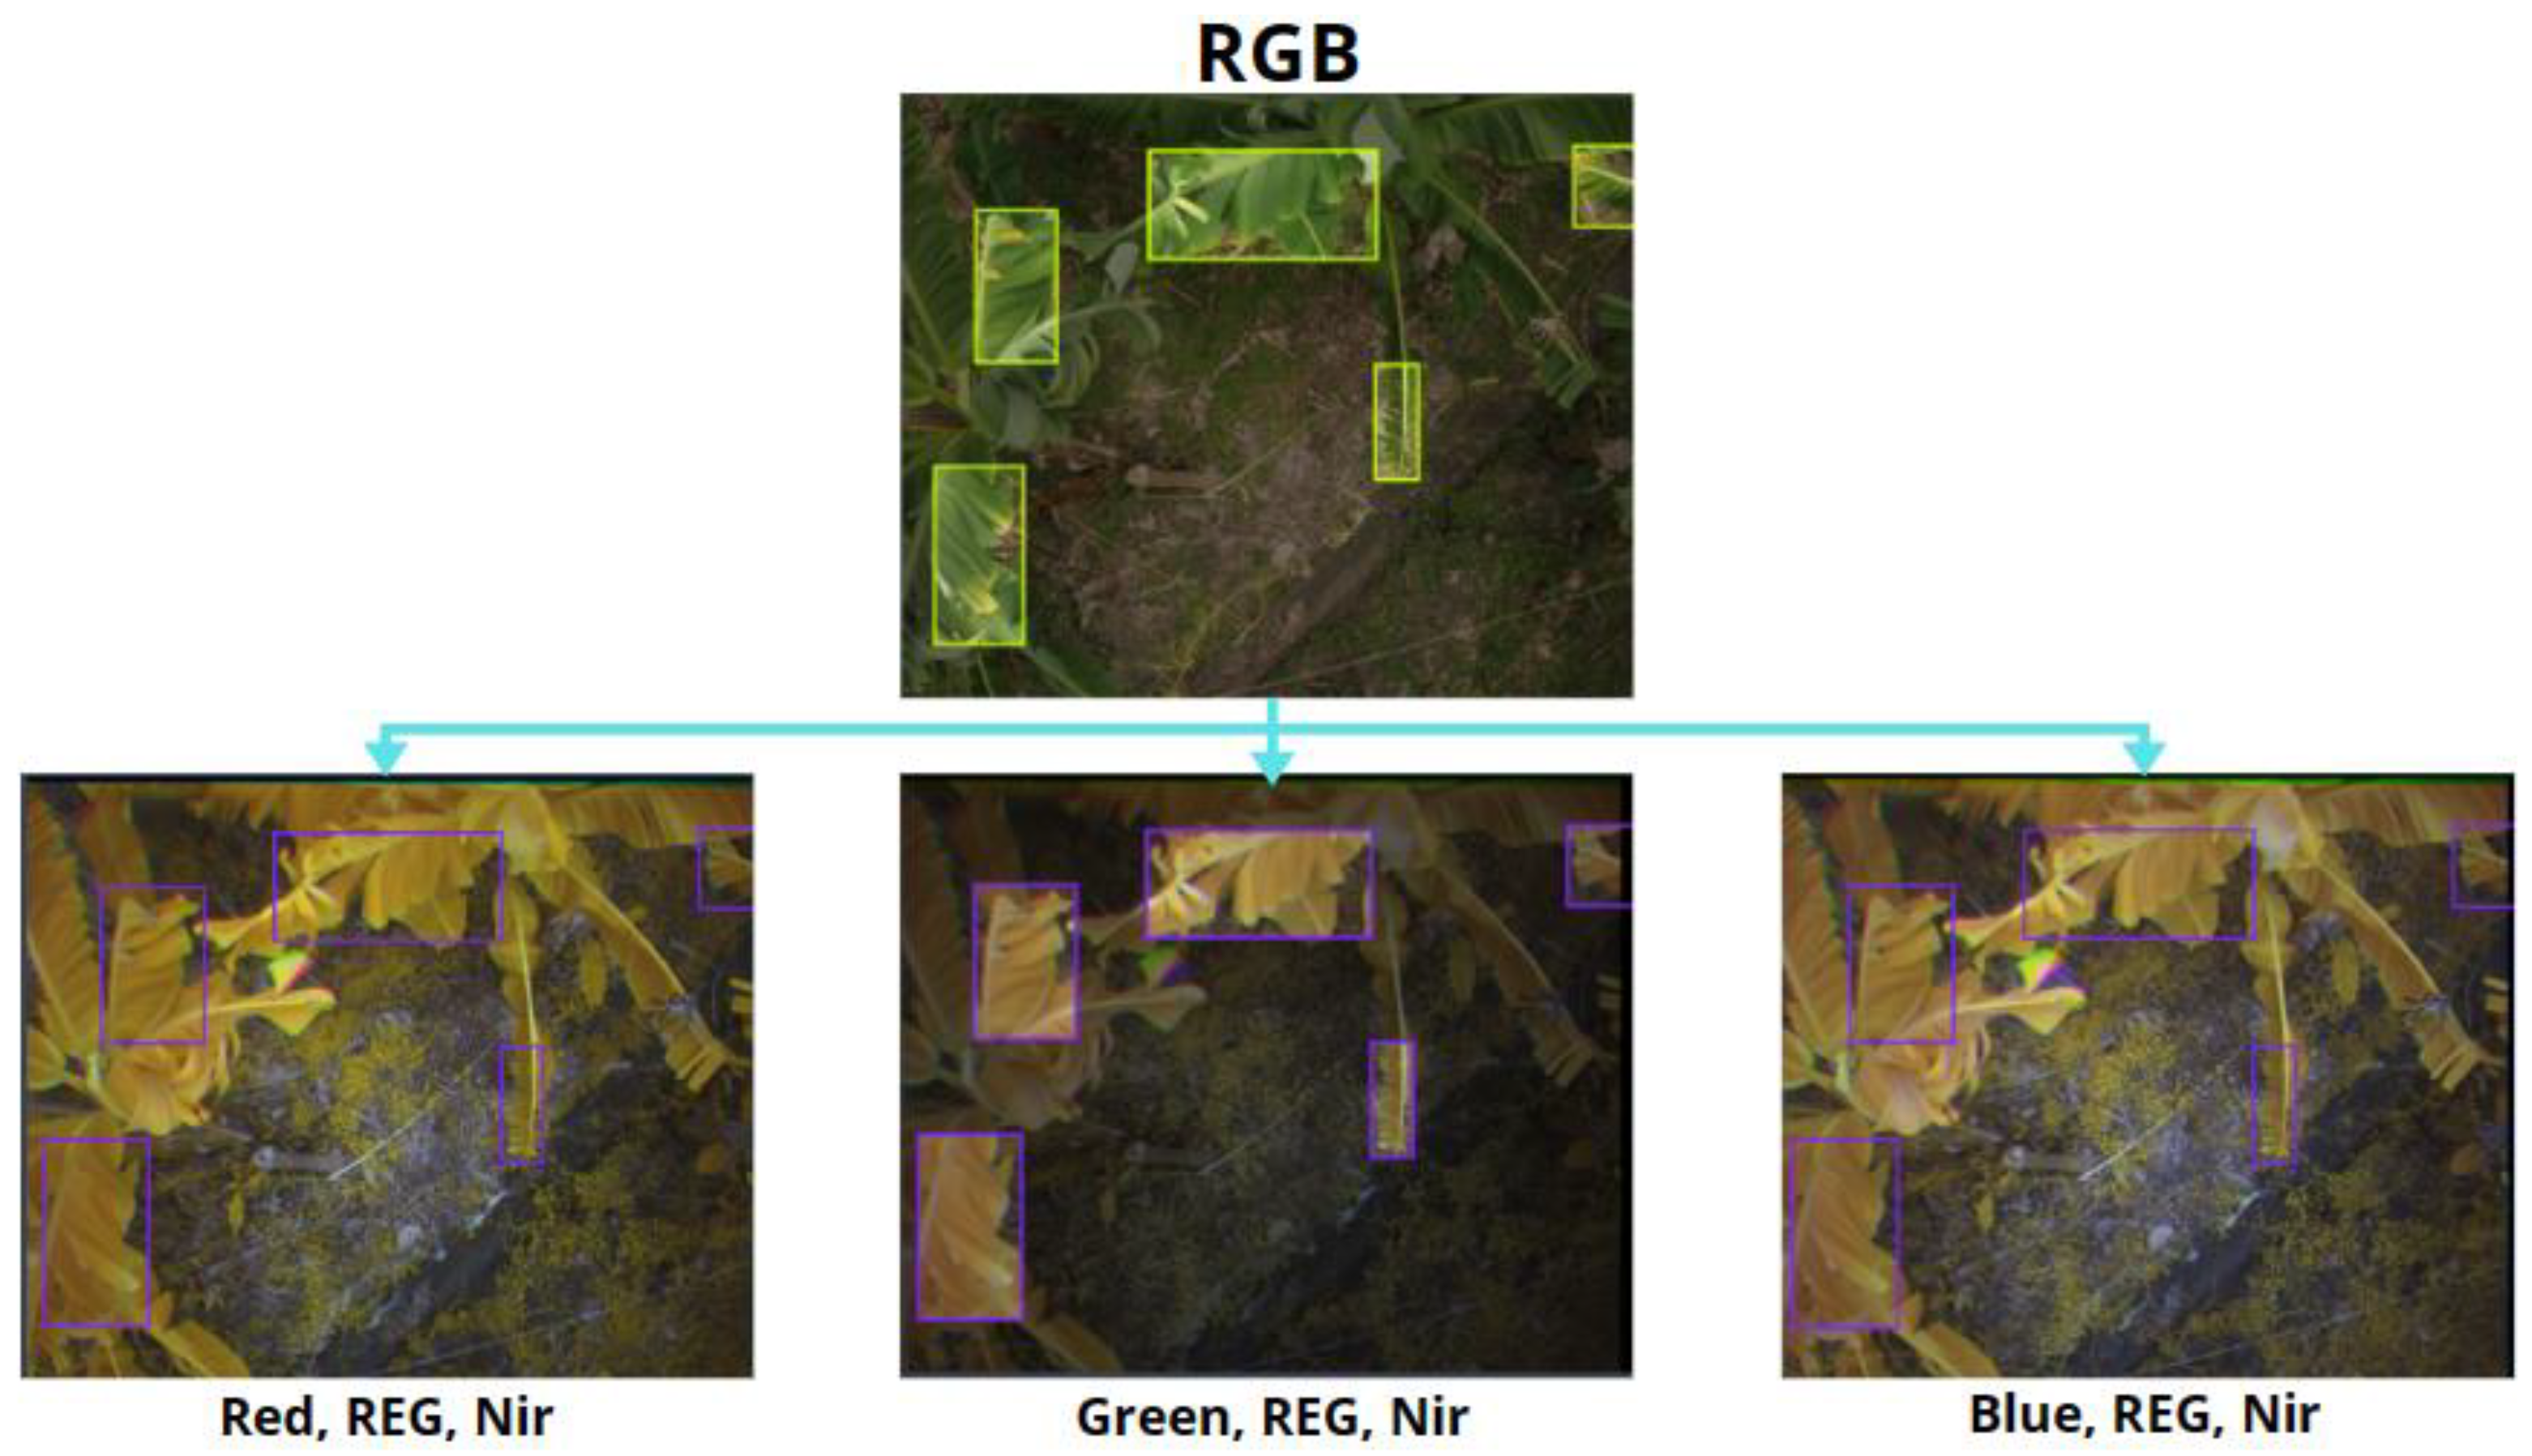
In order to maintain uniformity in the training of various architectures, the images generated using this methodology were created preserving the same properties as visible spectrum images, as illustrated in Figure 6 in the context of detection.
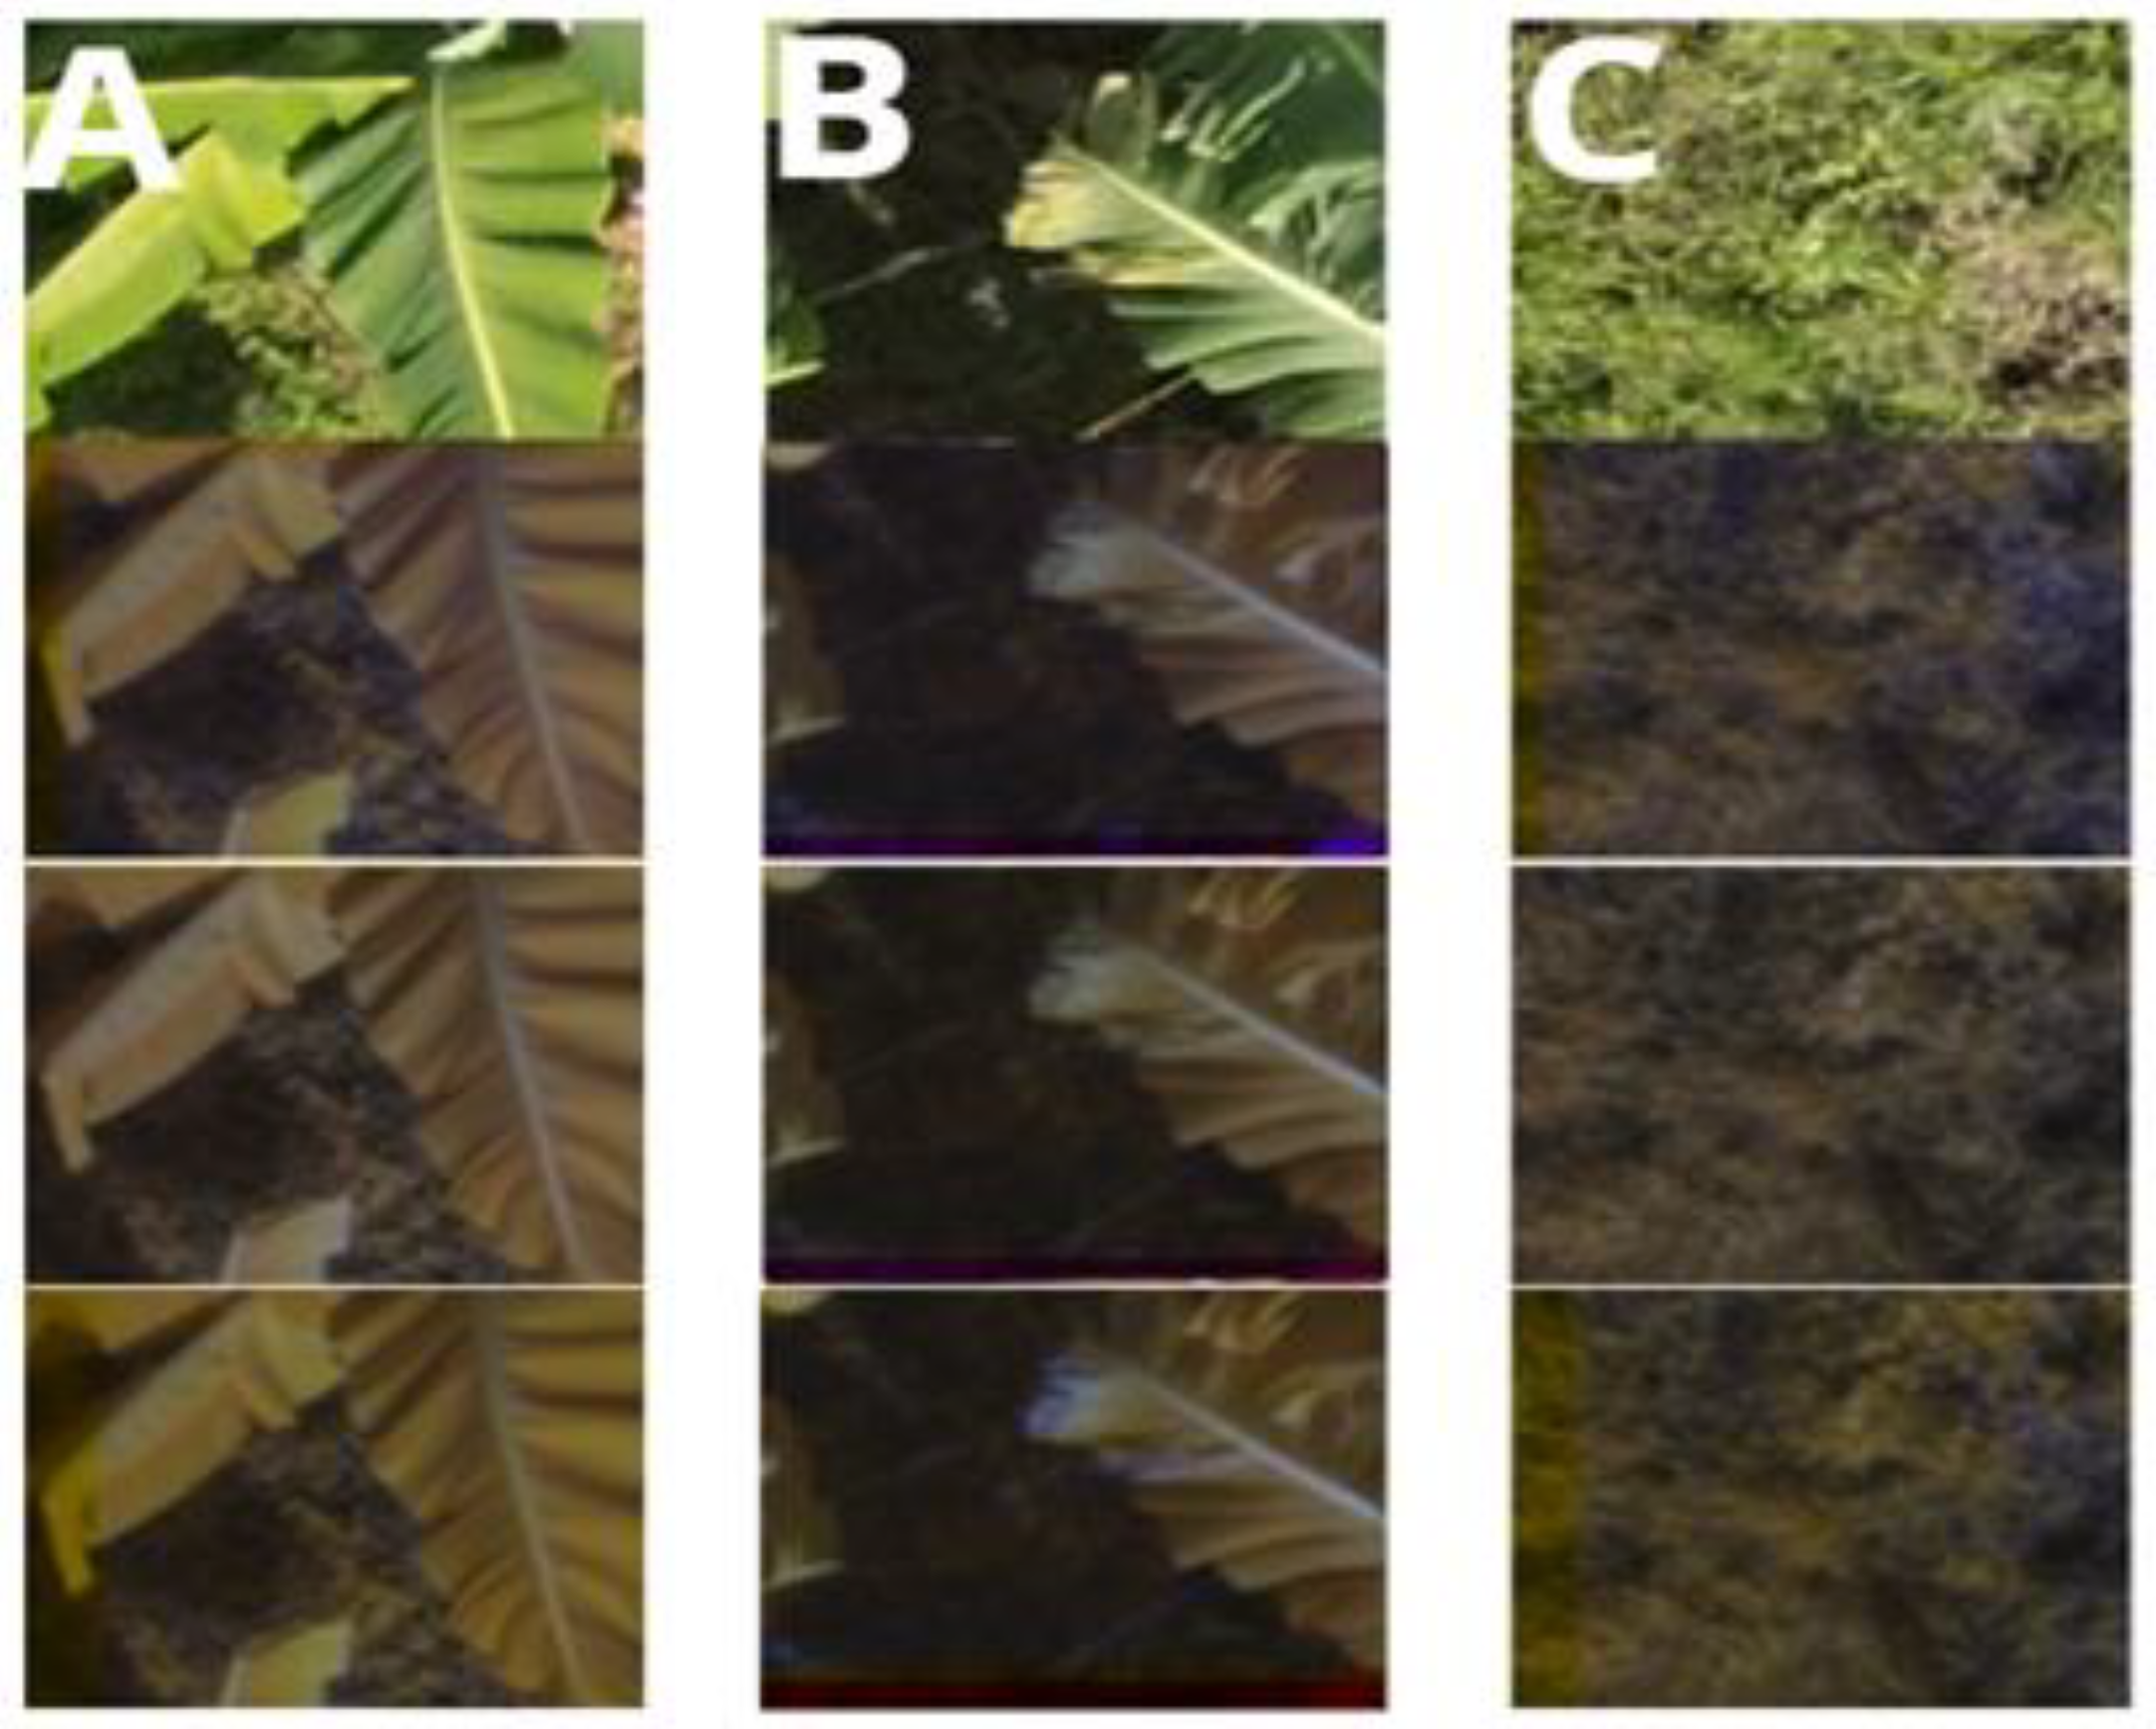
In the case of classification, false-colour images were created with three labels: healthy leaves, diseased leaves, and non-leaf extras. The latter was used to distinguish banana leaves from any other element in the environment, as shown in Figure 7.

3.2. Training Classification Algorithms with Our Own Datasets

For classification, high-performance architectures such as EfficientNetV2B3, VGG19, and MobileNetV2 were used. Data augmentation techniques were applied during training to improve the system’s accuracy without applying data balancing techniques. This was implemented through random zoom (increase or decrease) with a threshold of 20% and random rotation (right or left) with a threshold of 20%.
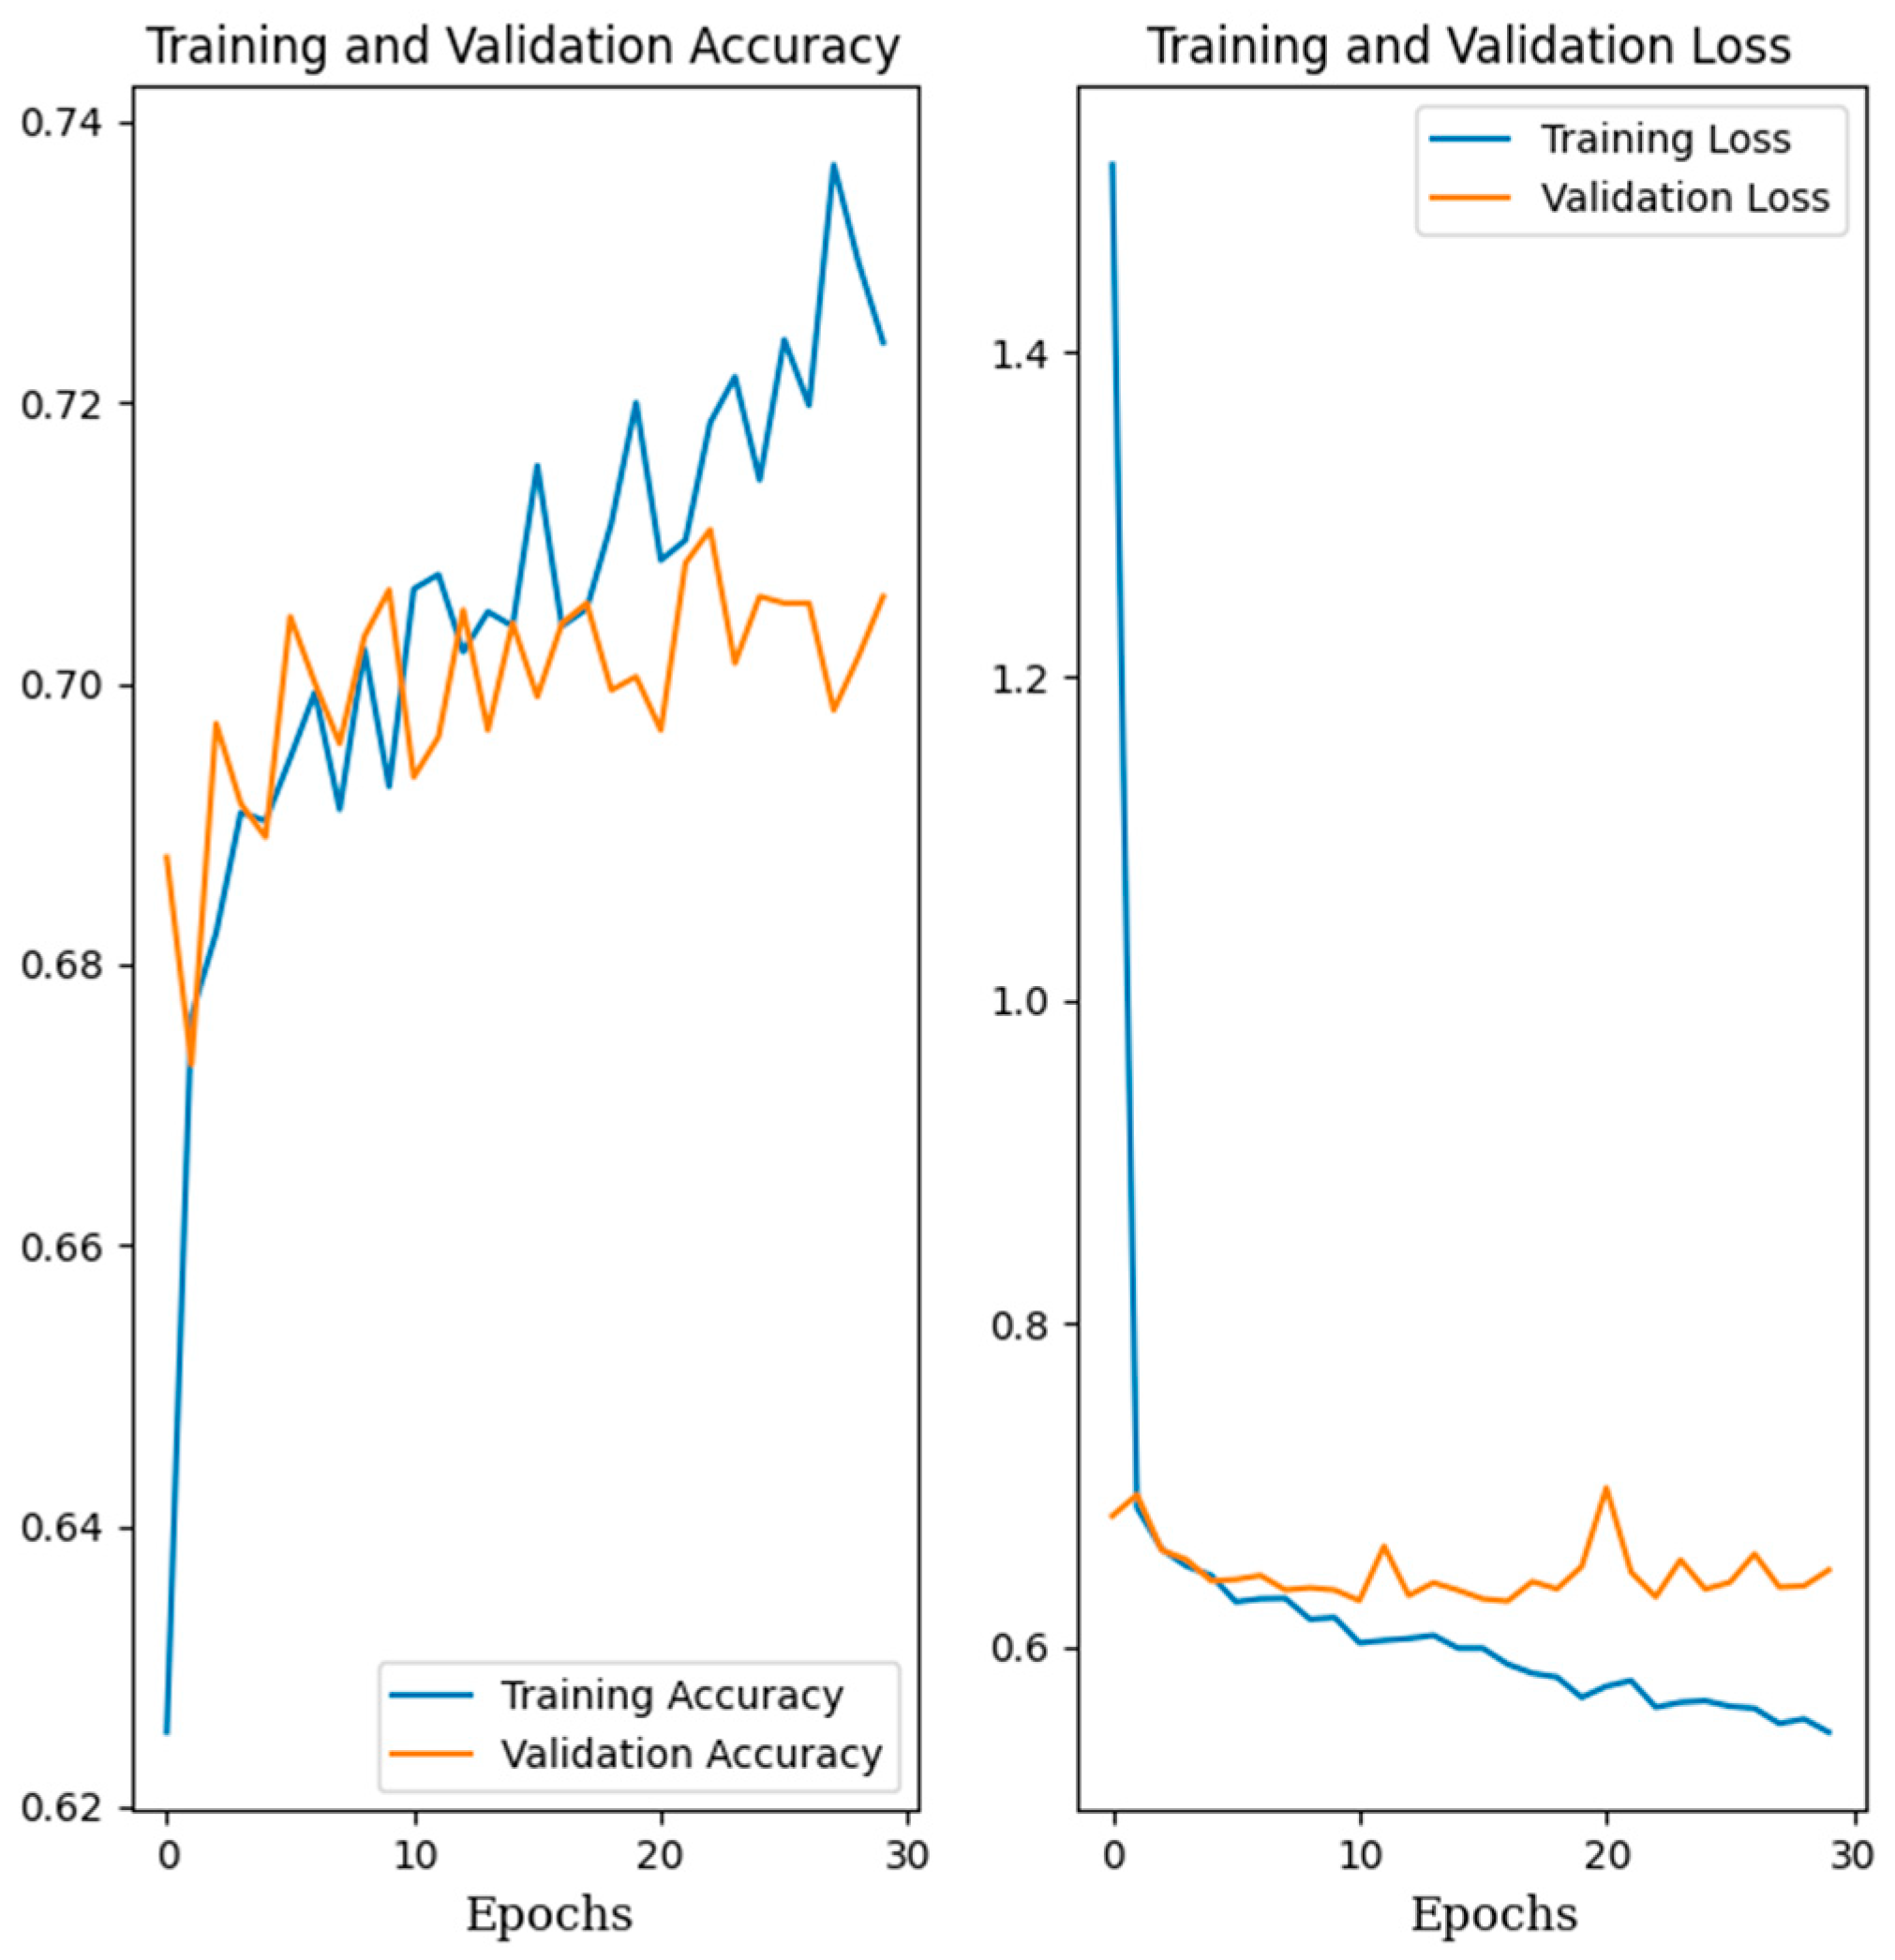
In each dataset, 2120 images with data augmentation techniques were added, resulting in a total of 1890 images of healthy leaves and 1290 images with Sigatoka distributed across 10 batches. The training was conducted iteratively with a learning rate of 0.001 for 45 epochs, and the performance results can be observed in Table 4.
In this evaluation, it is observed that the performances in the validation set are comparable among the different models. However, when analysing the accuracy in Sigatoka classification, it stands out that MobileNetV2 exhibits the best performance when using data in the spectrum combining red, red edge, and near-infrared, obtaining a performance accuracy of 86.5%.
It is important to note that when considering the precision as the percentage of possible successes in the Sigatoka class, the results show higher reliability in disease detection when using false-colour images generated from red spectra (red, red edge, near-infrared). Additionally, the recall indicates a rate of 72% for distinguishing the disease when these spectra are employed, compared to 39% using the visible spectrum (RGB). In Figure 8 and Figure 9, one can see an example of the performance and metrics obtained in a training and validation process using EfficientNetV2B3.
In these results, excellent behaviour of the learning curves can be observed, considering the validation process in relation to the training process. Furthermore, the evaluation metrics for the classification models show good performance regarding the precision of the CNN models in predicting the labelling of images with the presence of diseased leaves, reaching values of up to 86.5%.

3.3. Training Classification Algorithms with Open Datasets

To compare the performance of these classification models in terms of accuracy for classifying diseases such as Black Sigatoka, we evaluated the same models frequently used in foliar disease classification applications: EfficientNetV2B3, VGG19, and MobileNetV2. In this case, using public open datasets from [32,33], we obtained the following results, as shown in Table 5 and Table 6.
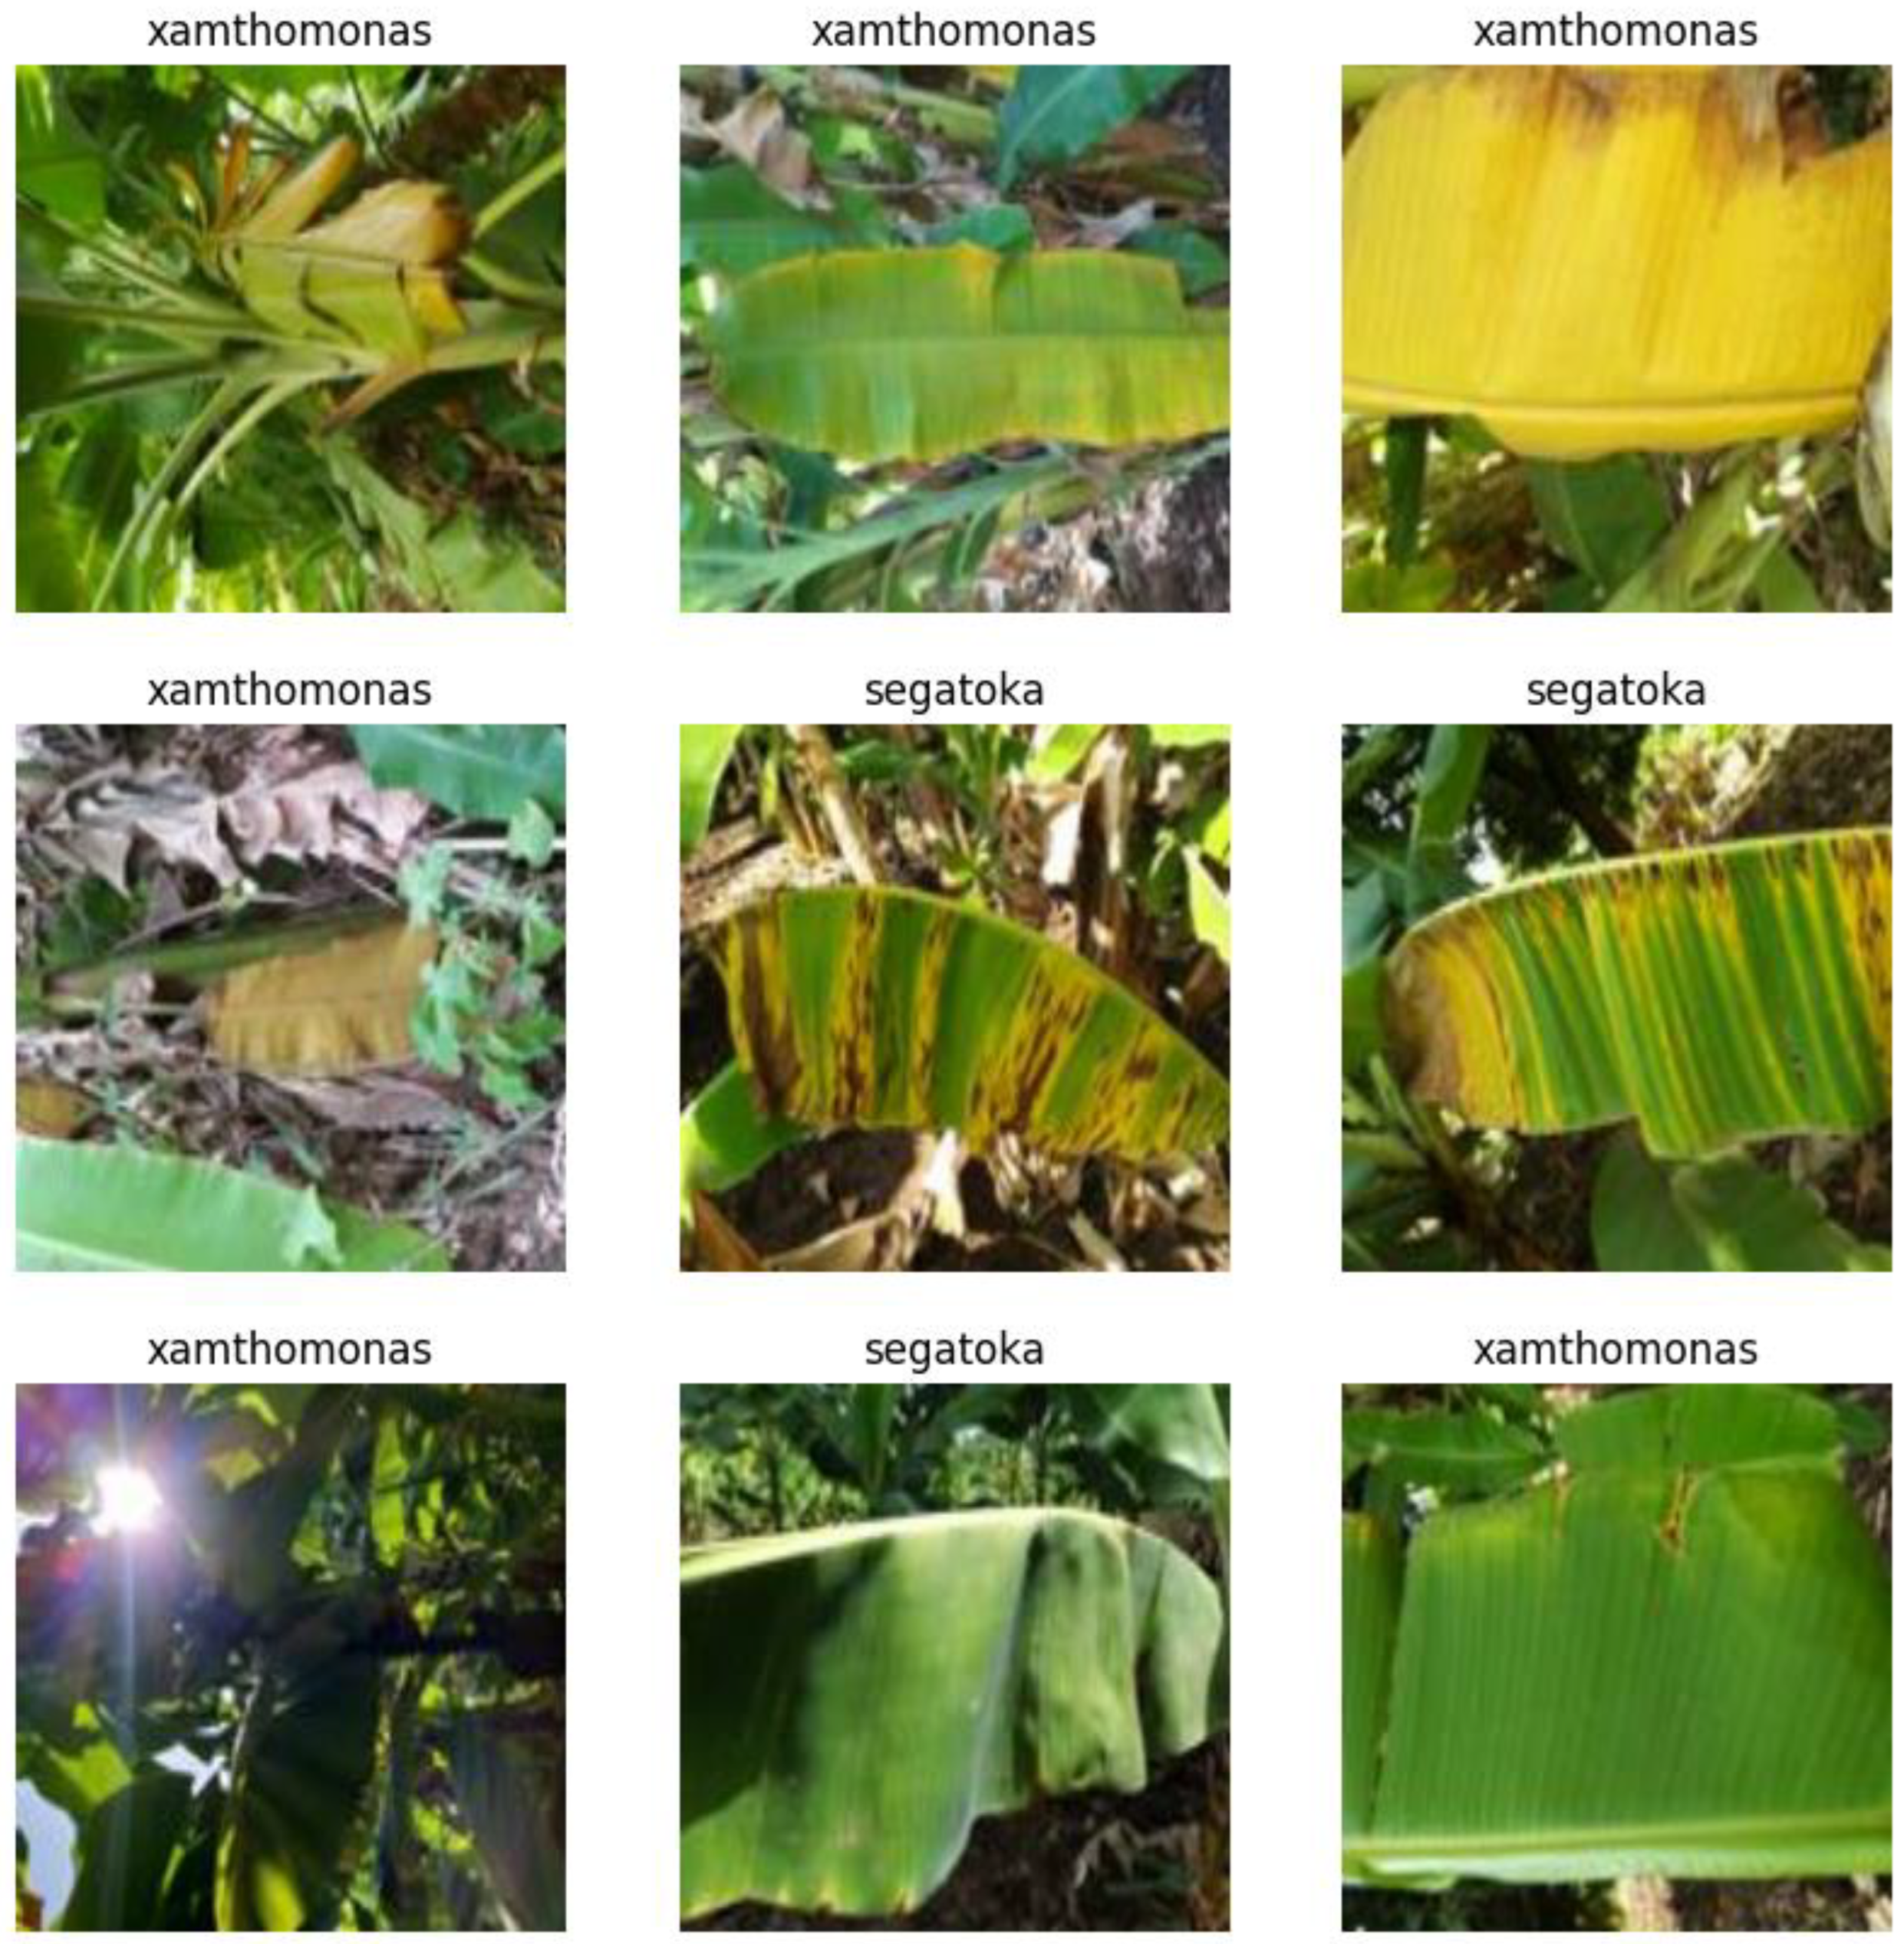
The first open dataset used was from a study where they prepared a banana plant leaf image dataset used for the ‘banana disease detection’ research. It was collected from Southern Nations, Nationalities, and Peoples’ Regional State Arbaminch Zuria Woreda, Lante kebele, Chano kebele, and Gamugofa Zone Mierab Abaya Woreda, Omolante kebele, where banana is widely produced and the infection of Xanthomonas wilt and Sigatoka leaf spot disease is highly observed [32]. The data were collected from four farmers with a one-hectare farm each in three kebeles. During the data collection, the daily collected data were identified as “healthy” or “infected” by both types of diseases. The labelled data from the first plant pathologist was verified and confirmed by the second one to ensure the quality of the collected data. Finally, the collected image was correctly labelled with three classes.
The researcher collected 1288 RGB pictures of banana leaves under three categories: “healthy” banana leaves, “Xanthomonas-infected” leaves, and “Sigatoka-infected” leaves. Some samples of this dataset can be seen in Figure 10.
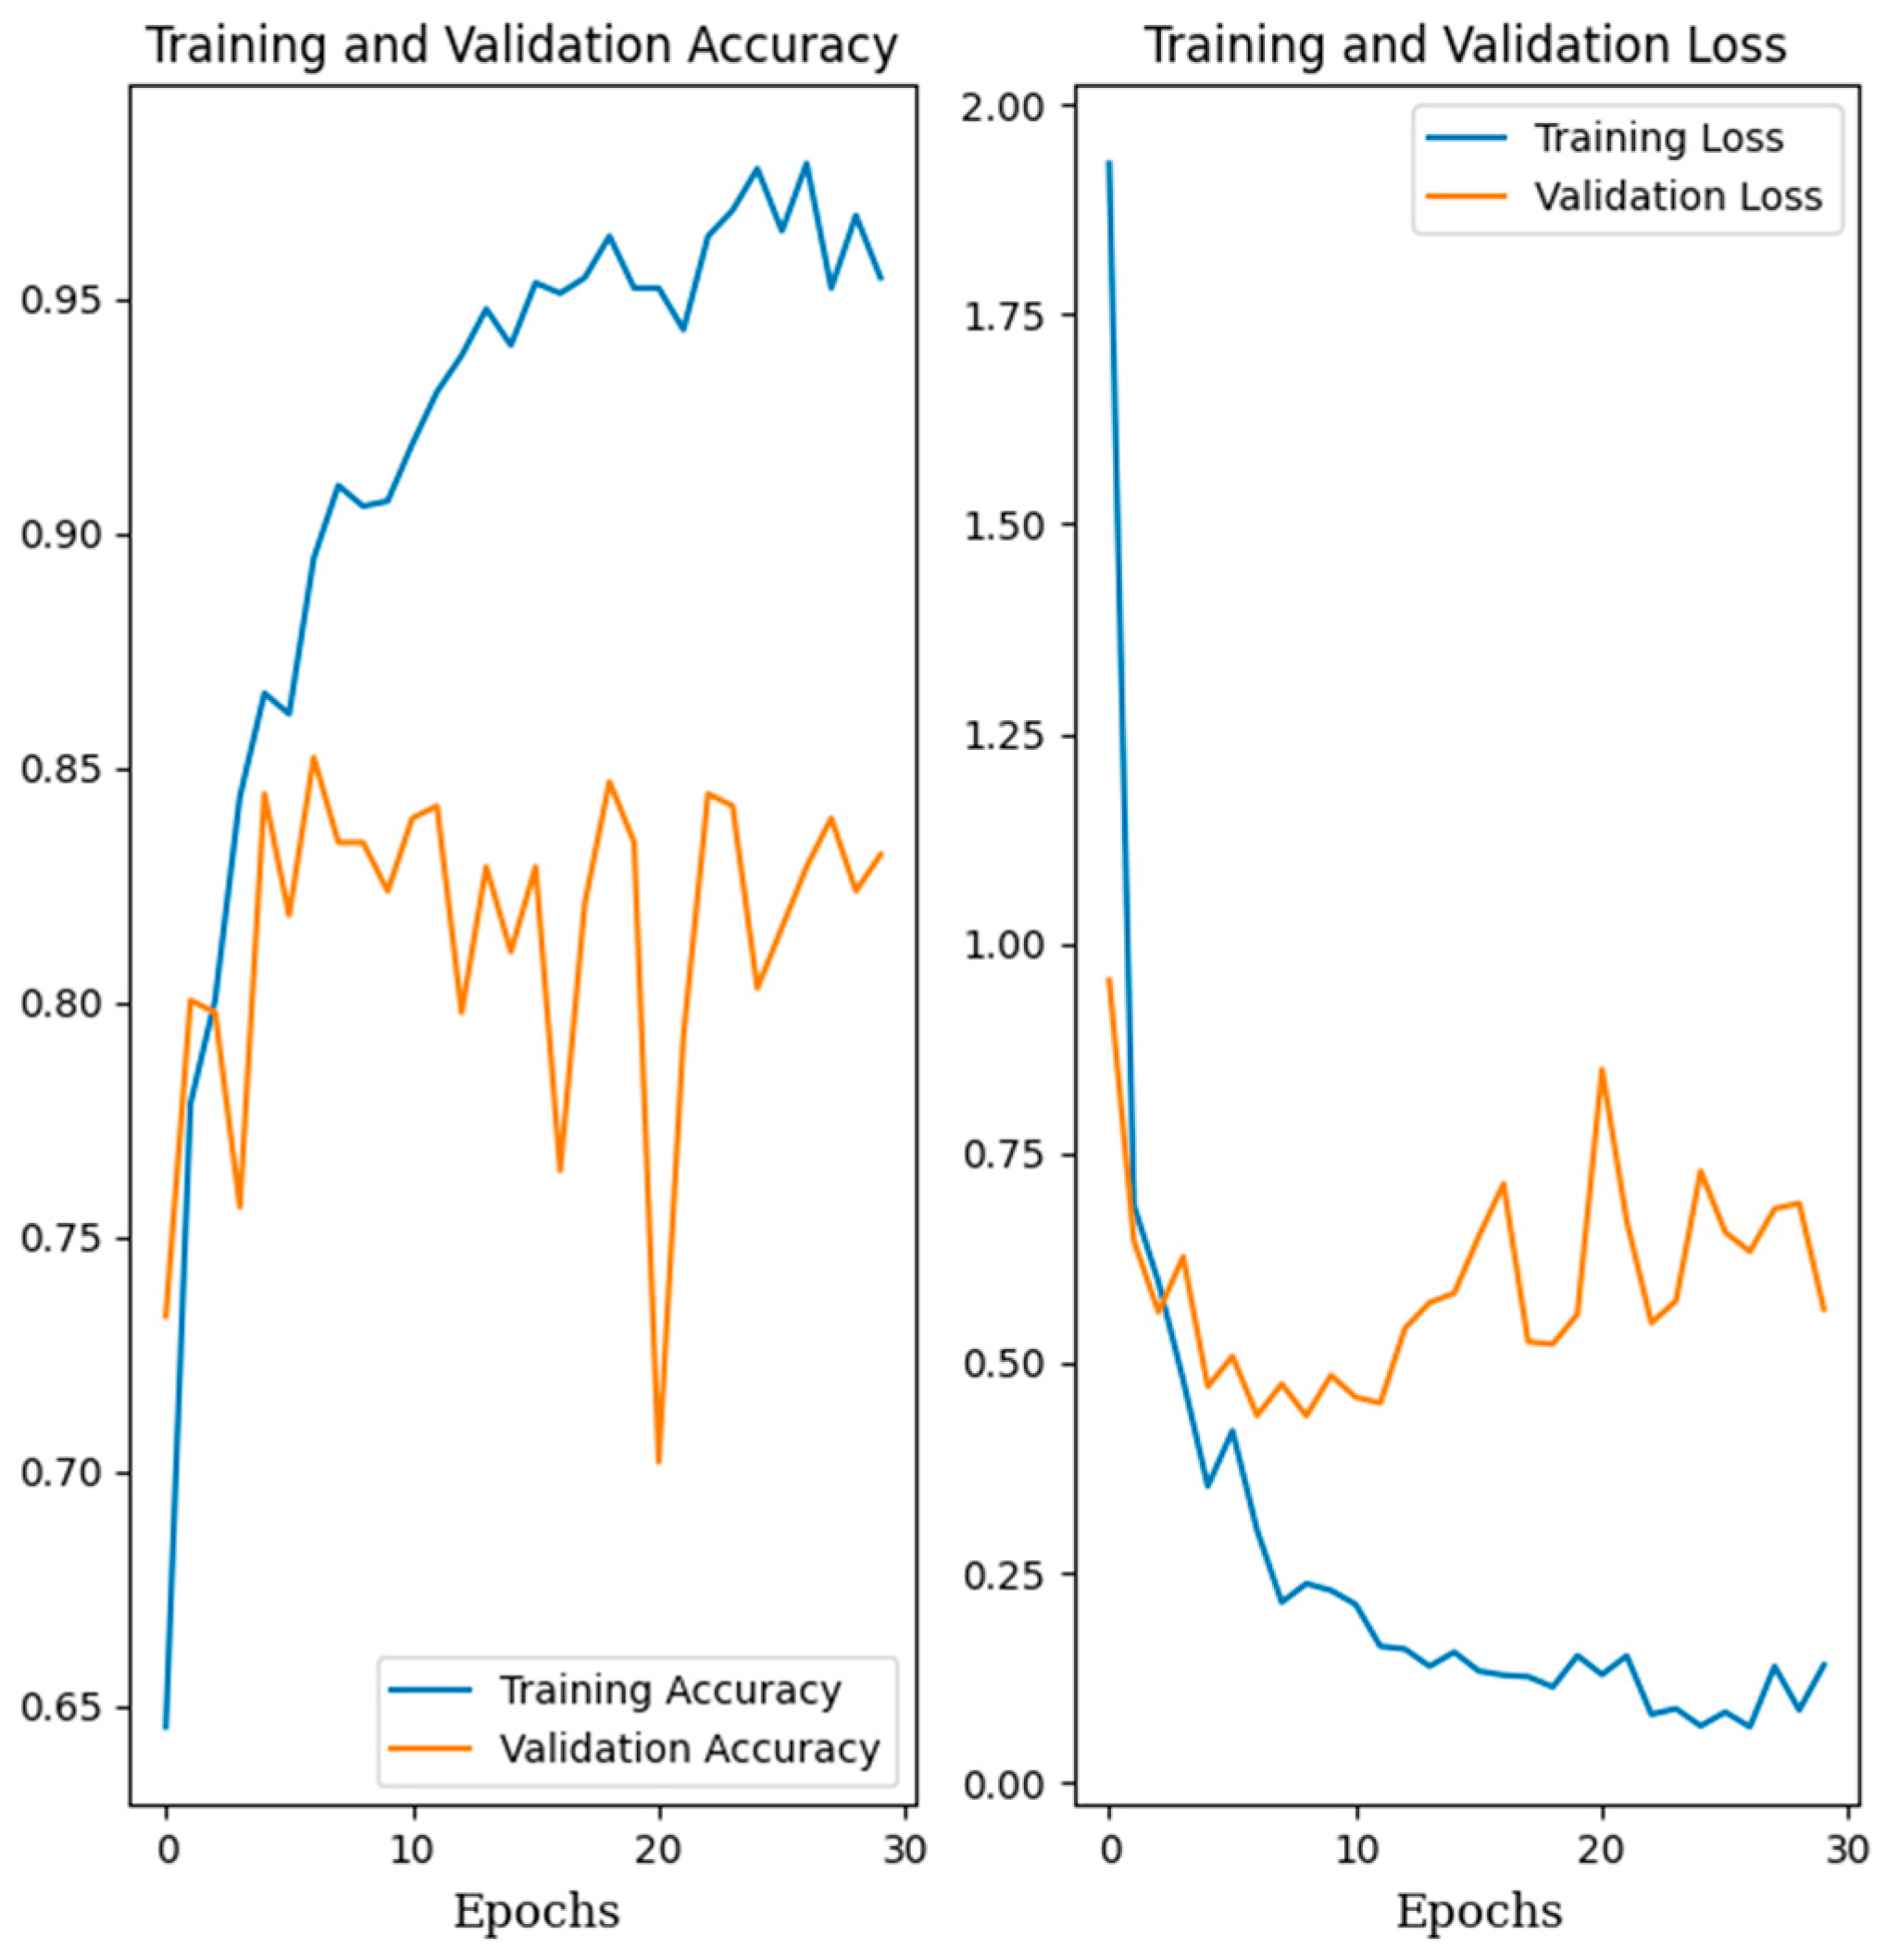
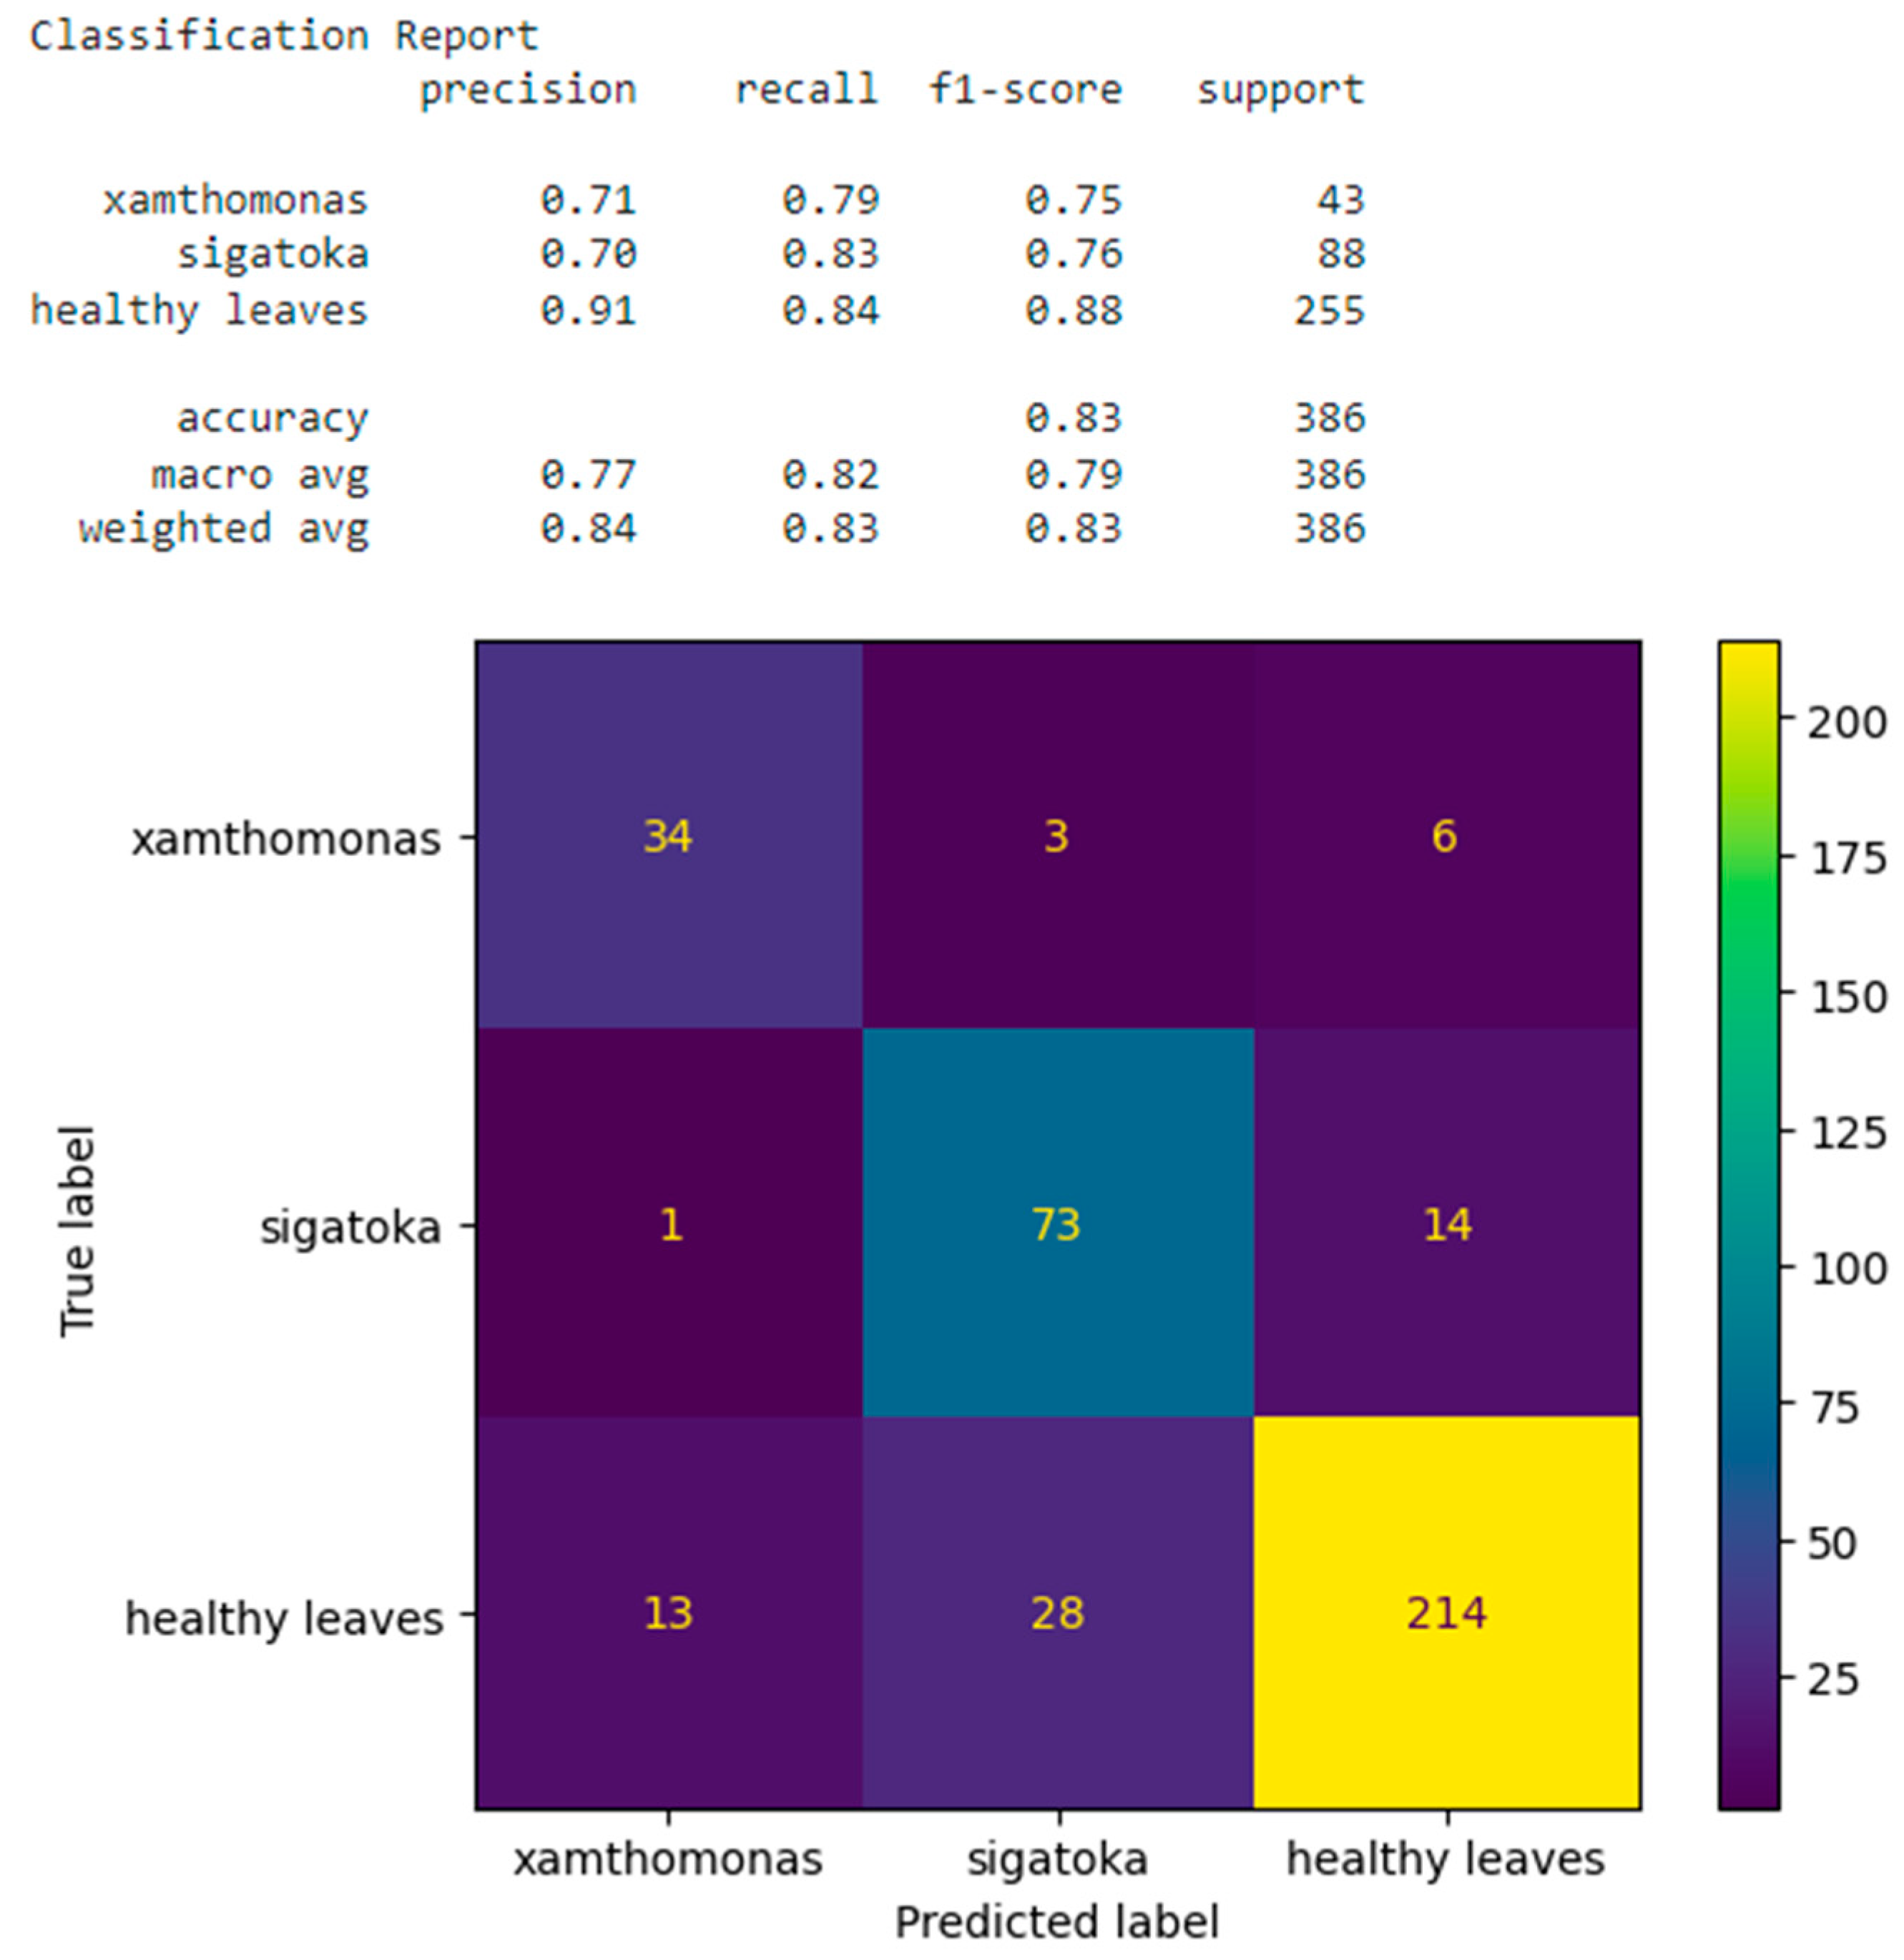
In this test, the performances in the validation set are comparable among the different models. However, when analysing the classification accuracy, it stands out that EfficientNetV2B3 exhibits the best performance, obtaining a validation accuracy of 87.3%. In this work, we can observe that it did not differ significantly from the results of our multispectral datasets, which highlights the importance of our study as it allows us to process, with practically the same accuracy, significantly scaled-up datasets of up to 40 acres per hour. The similar results are due to the fact that this open dataset collects images directly from leaves using RGB cameras by manually surveying the crop, whereas, in our methodology, we collect multispectral images from drones and then perform frame subdivisions to obtain healthy leaves, diseased leaves, and non-leaf extras.
In Figure 11 and Figure 12, it is possible to see an example of the performance and metrics obtained in a training and validation process using EfficientNetV2B3.
The second open dataset [33] was used in a study where they prepared a banana plant leaf image dataset for research from the banana fields of Bangabandhu Sheikh Mujibur Rahman Agricultural University, Bangladesh and adjacent banana fields in June 2021. All the images are captured using a smartphone camera and labelled accordingly by a plant pathologist. The researcher collected 937 RGB pictures of banana leaves under three categories: “healthy” banana leaves, “Sigatoka-infected” leaves, and “bacteria-wilt-infected” leaves, but in this case, the background was removed from the images, which eliminates noise. Samples of this dataset can be seen in Figure 13.
In this evaluation, the performances in the validation set are comparable among the different models. However, when analysing the accuracy in Sigatoka classification, it stands out that EfficientNetV2B3 exhibits the best performance, obtaining a validation accuracy of 96.77%.
In Figure 14 and Figure 15, one can see an example of the performance and metrics obtained in a training and validation process using EfficientNetV2B3.

4. Discussion

In precision agriculture, the use of multispectral sensors to calculate vegetation indices to determine the health status of plants is a common task [34,35]. The use of false-colour images, constructed from multispectral data, allows for varying spectral information through different combinations and transformations in various colour channels. The use of false-colour images also enables the highlighting of spectral-sensitive lesions without directly relying on a vegetation index [36]. This allows for the identification of infection areas based solely on the spectral response of the object.
In this study, we were able to verify the findings of the research by [23,37], which demonstrates that spectra related to the red band (650–673 nm) up to the near-infrared band (800–880 nm) can fully determine the variation in chlorophyll in leaves caused by diseases. In our case, the best results for the classification of Black Sigatoka infection were achieved with the combination of red, red edge, and near-infrared spectra (650 nm, 730 nm, 840 nm) using MobileNetV2 architecture, obtaining a performance accuracy of 86.5%.
The detection of diseases in agricultural crops, such as bananas, has leveraged various deep neural network architectures due to their distinct capabilities. VGG19, for instance, was successfully used in detecting irregularities in tomato leaves because of its simplicity and effectiveness in classification tasks, although its high number of parameters may require more computational resources [38]. On the other hand, MobileNet was chosen to detect diseases in pomegranate leaves due to its lightweight design, allowing implementation on devices with limited resources, although it may not match the accuracy of more complex architectures [39].
EfficientNet, however, offers an optimal balance between accuracy and computational efficiency, enabling its use in diagnosing anomalies in banana leaves, outperforming other architectures in terms of performance and efficiency in agricultural settings [5]. In related studies, architectures such as VGG16, ResNet18, ResNet50, ResNet152, and InceptionV3 have been employed to detect diseases like fusarium wilt and Black Sigatoka in bananas in Tanzania, highlighting the strengths of each model depending on the task complexity and available resources [40]. The choice of VGG, MobileNet, and EfficientNet in this context is based on the need to balance accuracy, efficiency, and implementation capability in different and large-scale agricultural environments.
It is important to highlight that the innovation of this research was not focused on creating new architectures for the classification and detection of diseases in crops, as existing models such as CNNs, F-RCNN, and SSD achieve this objective with good precision, with accuracies between 90.8% and 99.4% according to [20,21,22]. We focused our efforts on addressing current challenges related to determining the presence of diseases in large-scale crops and the collection of labelled datasets by experts for machine learning [16]. We achieved this by using UAVs for data acquisition, creating our own dataset labelled by phytopathology experts, and using transfer learning to retrain existing models like the ones mentioned above.
It is also important to highlight that the implementation of new technologies such as drone image analysis in agriculture allows for almost real-time monitoring, enabling farmers to manage their resources quickly in the face of diseases like Black Sigatoka [37]. The agility provided by drones not only enhances early disease detection but also enables a swift and targeted response, thereby minimizing the impact on production and promoting sustainable agriculture.
In this study, we achieved a performance accuracy of 86.5% based on real banana production scenarios in five productive farms in the Department of Magdalena in Colombia. Therefore, we can affirm that the construction of datasets can continue to be conducted in a scalable manner on other banana farms and even with other tropical crops, to further conduct transfer learning using existing CNN models. At this point, we observe a good generalisation capacity of our study, but we recommend maintaining standardised parameters for image acquisition from drones, such as flight altitude, flight speed, conducting flights on different days but at similar times, and under good environmental conditions, such as sunny and not rainy days.
Improved performance of detection of Black Sigatoka using UAV-based multispectral images and deep learning techniques effectively improves the smart management of banana crops, supporting good agricultural practices and sustainable production. This can be achieved by detecting diseases in these crops and enabling precision agricultural practices such as only spraying in localized areas, a reduction in intensive agrochemical use, and a decrease in production costs.
However, to optimize Black Sigatoka detection in crops, it is important to address some challenges and areas for improvement identified during this study. The alignment of multispectral images, although addressed through the SIFT-based algorithm, may continue to be a critical aspect that requires ongoing attention. Additionally, optimizing data augmentation techniques and the adaptability of algorithms to various agricultural conditions are aspects that could benefit from future research.
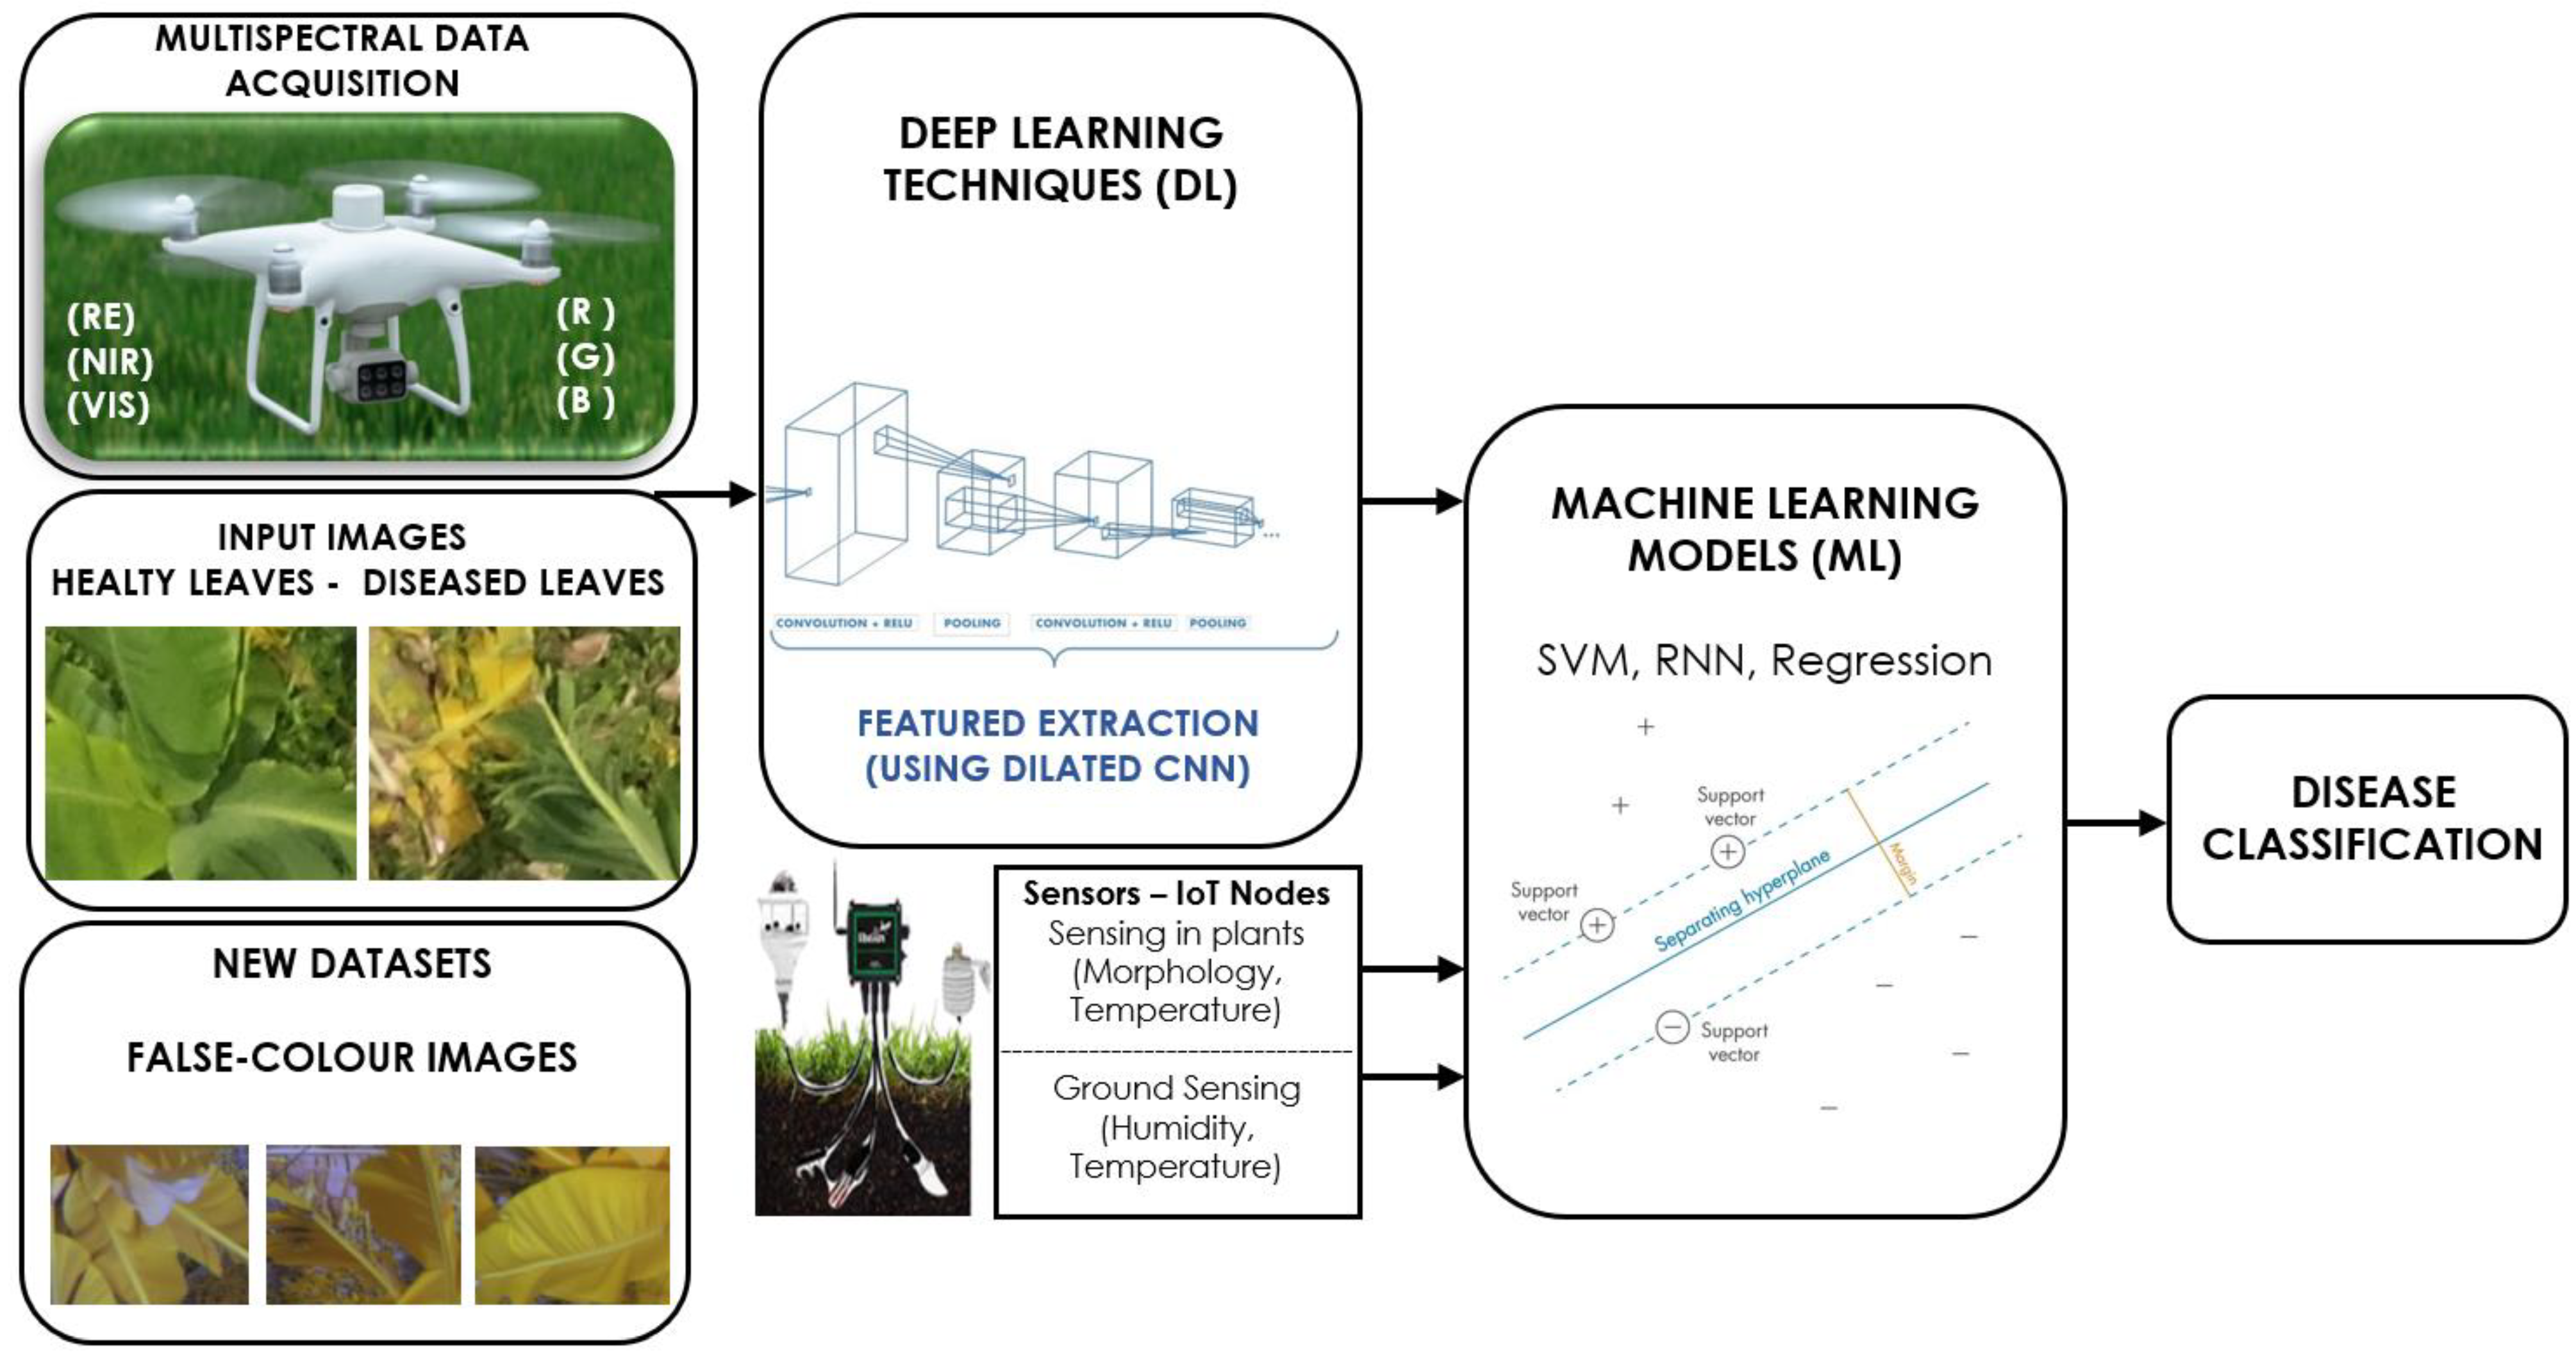
Likewise, a constant area of improvement will be enhancing the accuracy and precision in the detection of diseases in crops by incorporating more complex combinations of the bands captured by our acquisition sensors, planned for our future work. For example, we plan to modify the inputs of the most-used CNN models for crop disease classification to have five-channel inputs, using multiple bands and vegetation indices. Additionally, we have considered incorporating additional input features related to environmental variables such as humidity and temperature from sensors installed in IoT nodes, as shown in Figure 16.
Therefore, we propose that building new hybrid and hierarchical convolutional neural network (CNN) architectures based on current deep learning techniques for classification, as shown in Figure 16, will improve performance in terms of accuracy and precision in the classification of images obtained with current deep learning techniques. Hence, we continue to work in this area of study.

5. Conclusions

In this case study, a new dataset was constructed using RGB and false-colour images that distinguish Black Sigatoka disease in productive banana crops in Magdalena Department, Colombia. The MobileNetV2 architecture demonstrated the best performance, achieving an accuracy of 86.5% and a precision of 75% for the Black Sigatoka class; these results were obtained using false-colour images composed of the red, red edge, and near-infrared spectra of multispectral shots acquired by a drone at heights between 15 and 25 m.
It was observed that EfficientNetV2B3 achieved higher accuracy in the classification of Black Sigatoka using open datasets, with comparable results between these datasets captured only in RGB without image processing and our own multispectral datasets, achieving accuracies of 87.35% and 86.5%, respectively. On the other hand, we observed better performance when evaluating CNNs with an open dataset that applies image processing to its samples from smartphone cameras in banana crops, removing the background to eliminate noise. This involves the consumption of computational resources and time while surveying the banana crops. Therefore, we can conclude that with drones and our own datasets, we have improved performance and accuracy, allowing us to save time and resources in the identification of crop diseases in a scalable manner.

Author Contributions

Conceptualization, writing—review and editing: R.L.-R., C.P.-R. and M.G.; methodology, software, validation, formal analysis, investigation, resources, data curation, and writing—original draft preparation: R.L.-R., A.E.-V. and J.G.-R. All authors have read and agreed to the published version of the manuscript.

Funding

This research was funded by the Pontificia Universidad Javeriana, the Universidad del Magdalena, and MINCIENCIAS Through Colombia’s General Royalties System (SGR) with project number BPIN 2020000100417.

Data Availability Statement

The original contributions presented in the study are included in the article/Section 2, and further inquiries can be directed to the first author.

Acknowledgments

We would like to thank phytopathologist Andrés Quintero Mercado for supporting this study, specifically in the labelling of the datasets to differentiate between healthy leaves and those infected with Black Sigatoka.

Conflicts of Interest

The authors declare no conflicts of interest.

References

  1. FAO. Banana Market Review—Preliminary Results 2023. Rome. Available online: https://www.fao.org/markets-and-trade/commodities/bananas/en (accessed on 30 March 2024).
  2. FAO. FAO Publications Catalogue 2023. Rome. Available online: https://openknowledge.fao.org/handle/20.500.14283/cc7285en (accessed on 30 March 2024).
  3. OECD; FAO. Environmental Sustainability in Agriculture 2023. Rome. Available online: https://openknowledge.fao.org/items/f3c4d1dd-6092-4627-9001-1e1d76f82470 (accessed on 30 March 2024).
  4. Rubhara, T.; Gaffey, J.; Hunt, G.; Murphy, F.; O’Connor, K.; Buckley, E.; Vergara, L.A. A Business Case for Climate Neutrality in Pasture-Based Dairy Production Systems in Ireland: Evidence from Farm Zero C. Sustainability 2024, 16, 1028. [Google Scholar] [CrossRef]
  5. Bhuiyan, M.A.B.; Abdullah, H.M.; Arman, S.E.; Rahman, S.S.; Al Mahmud, K. BananaSqueezeNet: A very fast, lightweight convolutional neural network for the diagnosis of three prominent banana leaf diseases. Smart Agric. Technol. 2023, 4, 100214. [Google Scholar] [CrossRef]
  6. Mohapatra, D.; Mishra, S.; Sutar, N. Banana and its by-product utilisation: An overview. J. Scient. Indust. Res. 2010, 69, 323–329. [Google Scholar]
  7. Asociación de Bananeros de Colombia|Augura (Corporate Authorship). “Coyuntura Bananera 2022”. 2022. Available online: https://augura.com.co/wp-content/uploads/2023/04/Coyuntura-Bananera-2022-2.pdf (accessed on 1 September 2024).
  8. Datta, S.; Jankowicz-Cieslak, J.; Nielen, S.; Ingelbrecht, I.; Till, B.J. Induction and recovery of copy number variation in banana through gamma irradiation and low-coverage whole-genome sequencing. Plant Biotechnol. J. 2018, 16, 1644–1653. [Google Scholar] [CrossRef]
  9. Ugarte Fajardo, J.; Bayona Andrade, O.; Criollo Bonilla, R.; Cevallos-Cevallos, J.; Mariduena-Zavala, M.; Ochoa Donoso, D.; Vicente Villardon, J.L. Early detection of black Sigatoka in banana leaves using hyperspectral images. Appl. Plant Sci. 2020, 8, e11383. [Google Scholar] [CrossRef]
  10. Ebimieowei, E.; Wabiye, Y.-H. Control of black Sigatoka disease: Challenges and prospects. Afr. J. Agric. Res. 2011, 6, 508–514. [Google Scholar]
  11. Escudero, C.A.; Calvo, A.F.; Bejarano, A. Black Sigatoka Classification Using Convolutional Neural Networks. Int. J. Mach. Learn. Comput. 2022, 11, 113–118. [Google Scholar] [CrossRef]
  12. Barrera, J.; Barraza, F.; Campo, R. Efecto del sombrío sobre la sigatoka negra (Mycosphaerella fijiensis Morelet) en cultivo de plátano cv hartón (Musa AAB Simmonds). Rev. UDCA Actual. Divulg. Científica 2016, 19, 317–323. [Google Scholar] [CrossRef]
  13. Hossin, M.; Sulaiman, M.N. A Review on Evaluation Metrics for Data Classification Evaluations. Int. J. Data Min. Knowl. Manag. Process 2015, 5, 1–11. [Google Scholar] [CrossRef]
  14. Xu, S.; Wu, J.; Gu, W. Modeling and Control for Triadic Compound Controlled Flying Saucer. In Proceedings of the 2006 6th World Congress on Intelligent Control and Automation, Dalian, China, 21–23 June 2006; pp. 6293–6297. [Google Scholar] [CrossRef]
  15. Wang, G.; Sun, Y.; Wang, J. Automatic Image-Based Plant Disease Severity Estimation Using Deep Learning. Comput. Intell. Neurosci. 2017, 2017, 2917536. [Google Scholar] [CrossRef]
  16. Calou, V.B.C.; dos Santos Teixeira, A.; Moreira, L.C.J.; Lima, C.S.; de Oliveira, J.B.; de Oliveira, M.R.R. The use of UAVs in monitoring yellow sigatoka in banana. Biosyst. Eng. 2020, 193, 115–125. [Google Scholar] [CrossRef]
  17. Shah, S.A.; Lakho, G.M.; Keerio, H.A.; Sattar, M.N.; Hussain, G.; Mehdi, M.; Vistro, R.B.; Mahmoud, E.A.; Elansary, H.O. Application of Drone Surveillance for Advance Agriculture Monitoring by Android Application Using Convolution Neural Network. Agronomy 2023, 13, 1764. [Google Scholar] [CrossRef]
  18. Maes, W.H.; Steppe, K. Perspectives for Remote Sensing with Unmanned Aerial Vehicles in Precision Agriculture. Trends Plant Sci. 2019, 24, 152–164. [Google Scholar] [CrossRef] [PubMed]
  19. Neupane, B.; Horanont, T.; Hung, N.D. Deep learning based banana plant detection and counting using high-resolution red-green-blue (RGB) images collected from unmanned aerial vehicle (UAV). PLoS ONE 2019, 14, e0223906. [Google Scholar] [CrossRef]
  20. Raja, N.B.; Rajendran, P.S. Comparative Analysis of Banana Leaf Disease Detection and Classification Methods. In Proceedings of the 2022 6th International Conference on Computing Methodologies and Communication (ICCMC), Erode, India, 29–31 March 2022; pp. 1215–1222. [Google Scholar] [CrossRef]
  21. Jha, K.; Doshi, A.; Patel, P.; Shah, M. A comprehensive review on automation in agriculture using artificial intelligence. Artif. Intell. Agric. 2019, 2, 1–12. [Google Scholar] [CrossRef]
  22. Deng, L.; Mao, Z.; Li, X.; Hu, Z.; Duan, F.; Yan, Y. UAV-based multispectral remote sensing for precision agriculture: A comparison between different cameras. ISPRS J. Photogramm. Remote Sens. 2018, 146, 124–136. [Google Scholar] [CrossRef]
  23. Bendini, H.N.; Jacon, A.D.; Moreira Pessôa, A.C.; Pompeu Pavenelli, J.A.; Moraes, W.S.; Ponzoni, F.J.; Fonseca, L.M. Caracterização Espectral de Folhas de Bananeira (Musa spp.) para detecção e diferenciação da Sigatoka Negra e Sigatoka Amarela. In Proceedings of the Anais XVII Simpósio Brasileiro de Sensoriamento Remoto, João Pessoa, PB, Brasil, 25–29 April 2015; pp. 2536–2543. Available online: https://www.researchgate.net/publication/279189023 (accessed on 12 September 2024).
  24. Yeom, J.; Jung, J.; Chang, A.; Ashapure, A.; Maeda, M.; Maeda, A.; Landivar, J. Comparison of Vegetation Indices Derived from UAV Data for Differentiation of Tillage Effects in Agriculture. Remote Sens. 2019, 11, 1548. [Google Scholar] [CrossRef]
  25. DJI. P4 Multispectral User Manual 6 July 2020. Available online: https://www.dji.com/uk/p4-multispectral/downloads (accessed on 25 May 2024).
  26. Tsagaris, V.; Anastassopoulos, V. Multispectral image fusion for improved RGB representation based on perceptual attributes. Int. J. Remote Sens. 2005, 26, 3241–3254. [Google Scholar] [CrossRef]
  27. Espinosa, A.E.; Polo, M.A.P.; Gomez-Rojas, J.; Ramos, R.L. Canopy Extraction in a Banana Crop From UAV Captured Multispectral Images. In Proceedings of the 2022 IEEE 40th Central America and Panama Convention (CONCAPAN), Panama City, Panama, 9–12 November 2022; pp. 1–6. [Google Scholar] [CrossRef]
  28. Li, Q.; Qi, S.; Shen, Y.; Ni, D.; Zhang, H.; Wang, T. Multispectral Image Alignment With Nonlinear Scale-Invariant Keypoint and Enhanced Local Feature Matrix. IEEE Geosci. Remote Sens. Lett. 2015, 12, 1551–1555. [Google Scholar] [CrossRef]
  29. Roboflow Inc. «Roboflow», 7 May 2019. Available online: https://roboflow.com/ (accessed on 12 March 2024).
  30. Hang, J.; Zhang, D.; Chen, P.; Zhang, J.; Wang, B. Classification of Plant Leaf Diseases Based on Improved Convolutional Neural Network. Sensors 2019, 19, 4161. [Google Scholar] [CrossRef]
  31. Universidad Nacional de Quilmes. Introducción a la Teledetección/3. La Herramienta de la Teledetección: El Análisis Visual y el Procesamiento de Imágenes. Available online: https://static.uvq.edu.ar/mdm/teledeteccion/unidad-3.html (accessed on 26 June 2023).
  32. Yordanos, H. Banana Leaf Disease Images. Mendeley Data 2021. [Google Scholar] [CrossRef]
  33. Arman, E.; Bhuiyan, B.; Abdullahil, M.; Muhammad, H.; Shariful; Chowdhury; Tanha, T.; Arban, M. Banana Leaf Spot Diseases (BananaLSD) Dataset for Classification of Banana Leaf Diseases Using Machine Learning. Mendeley Data 2023. [Google Scholar] [CrossRef]
  34. Radócz, L.; Szabó, A.; Tamás, A.; Illés, Á.; Bojtor, C.; Ragán, P.; Vad, A.; Széles, A.; Harsányi, E.; Radócz, L. Investigation of the Detectability of Corn Smut Fungus (Ustilago maydis DC. Corda) Infection Based on UAV Multispectral Technology. Agronomy 2023, 13, 1499. [Google Scholar] [CrossRef]
  35. Choosumrong, S.; Hataitara, R.; Sujipuli, K.; Weerawatanakorn, M.; Preechaharn, A.; Premjet, D.; Laywisadkul, S.; Raghavan, V.; Panumonwatee, G. Bananas diseases and insect infestations monitoring using multi-spectral camera RTK UAV images. Spat. Inf. Res. 2023, 31, 371–380. [Google Scholar] [CrossRef]
  36. Abdulridha, J.; Batuman, O.; Ampatzidis, Y. UAV-Based Remote Sensing Technique to Detect Citrus Canker Disease Utilizing Hyperspectral Imaging and Machine Learning. Remote Sens. 2019, 11, 1373. [Google Scholar] [CrossRef]
  37. Shahi, T.B.; Xu, C.-Y.; Neupane, A.; Guo, W. Recent Advances in Crop Disease Detection Using UAV and Deep Learning Techniques. Remote Sens. 2023, 15, 2450. [Google Scholar] [CrossRef]
  38. Mkonyi, L.; Rubanga, D.; Richard, M.; Zekeya, N.; Sawahiko, S.; Maiseli, B.; Machuve, D. Early identification of Tuta absoluta in tomato plants using deep learning. Sci. Afr. 2020, 10, e00590. [Google Scholar] [CrossRef]
  39. Nirmal, M.D.; Jadhav, P.P.; Pawar, S. Pomegranate leaf disease detection using supervised and unsupervised algorithm techniques. Cybern. Syst. 2023, 54, 1–12. [Google Scholar] [CrossRef]
  40. Sanga, S.; Mero, V.; Machuve, D.; Mwanganda, D. Mobile-based deep learning models for banana diseases detection. arXiv 2020, arXiv:2004.03718. [Google Scholar] [CrossRef]
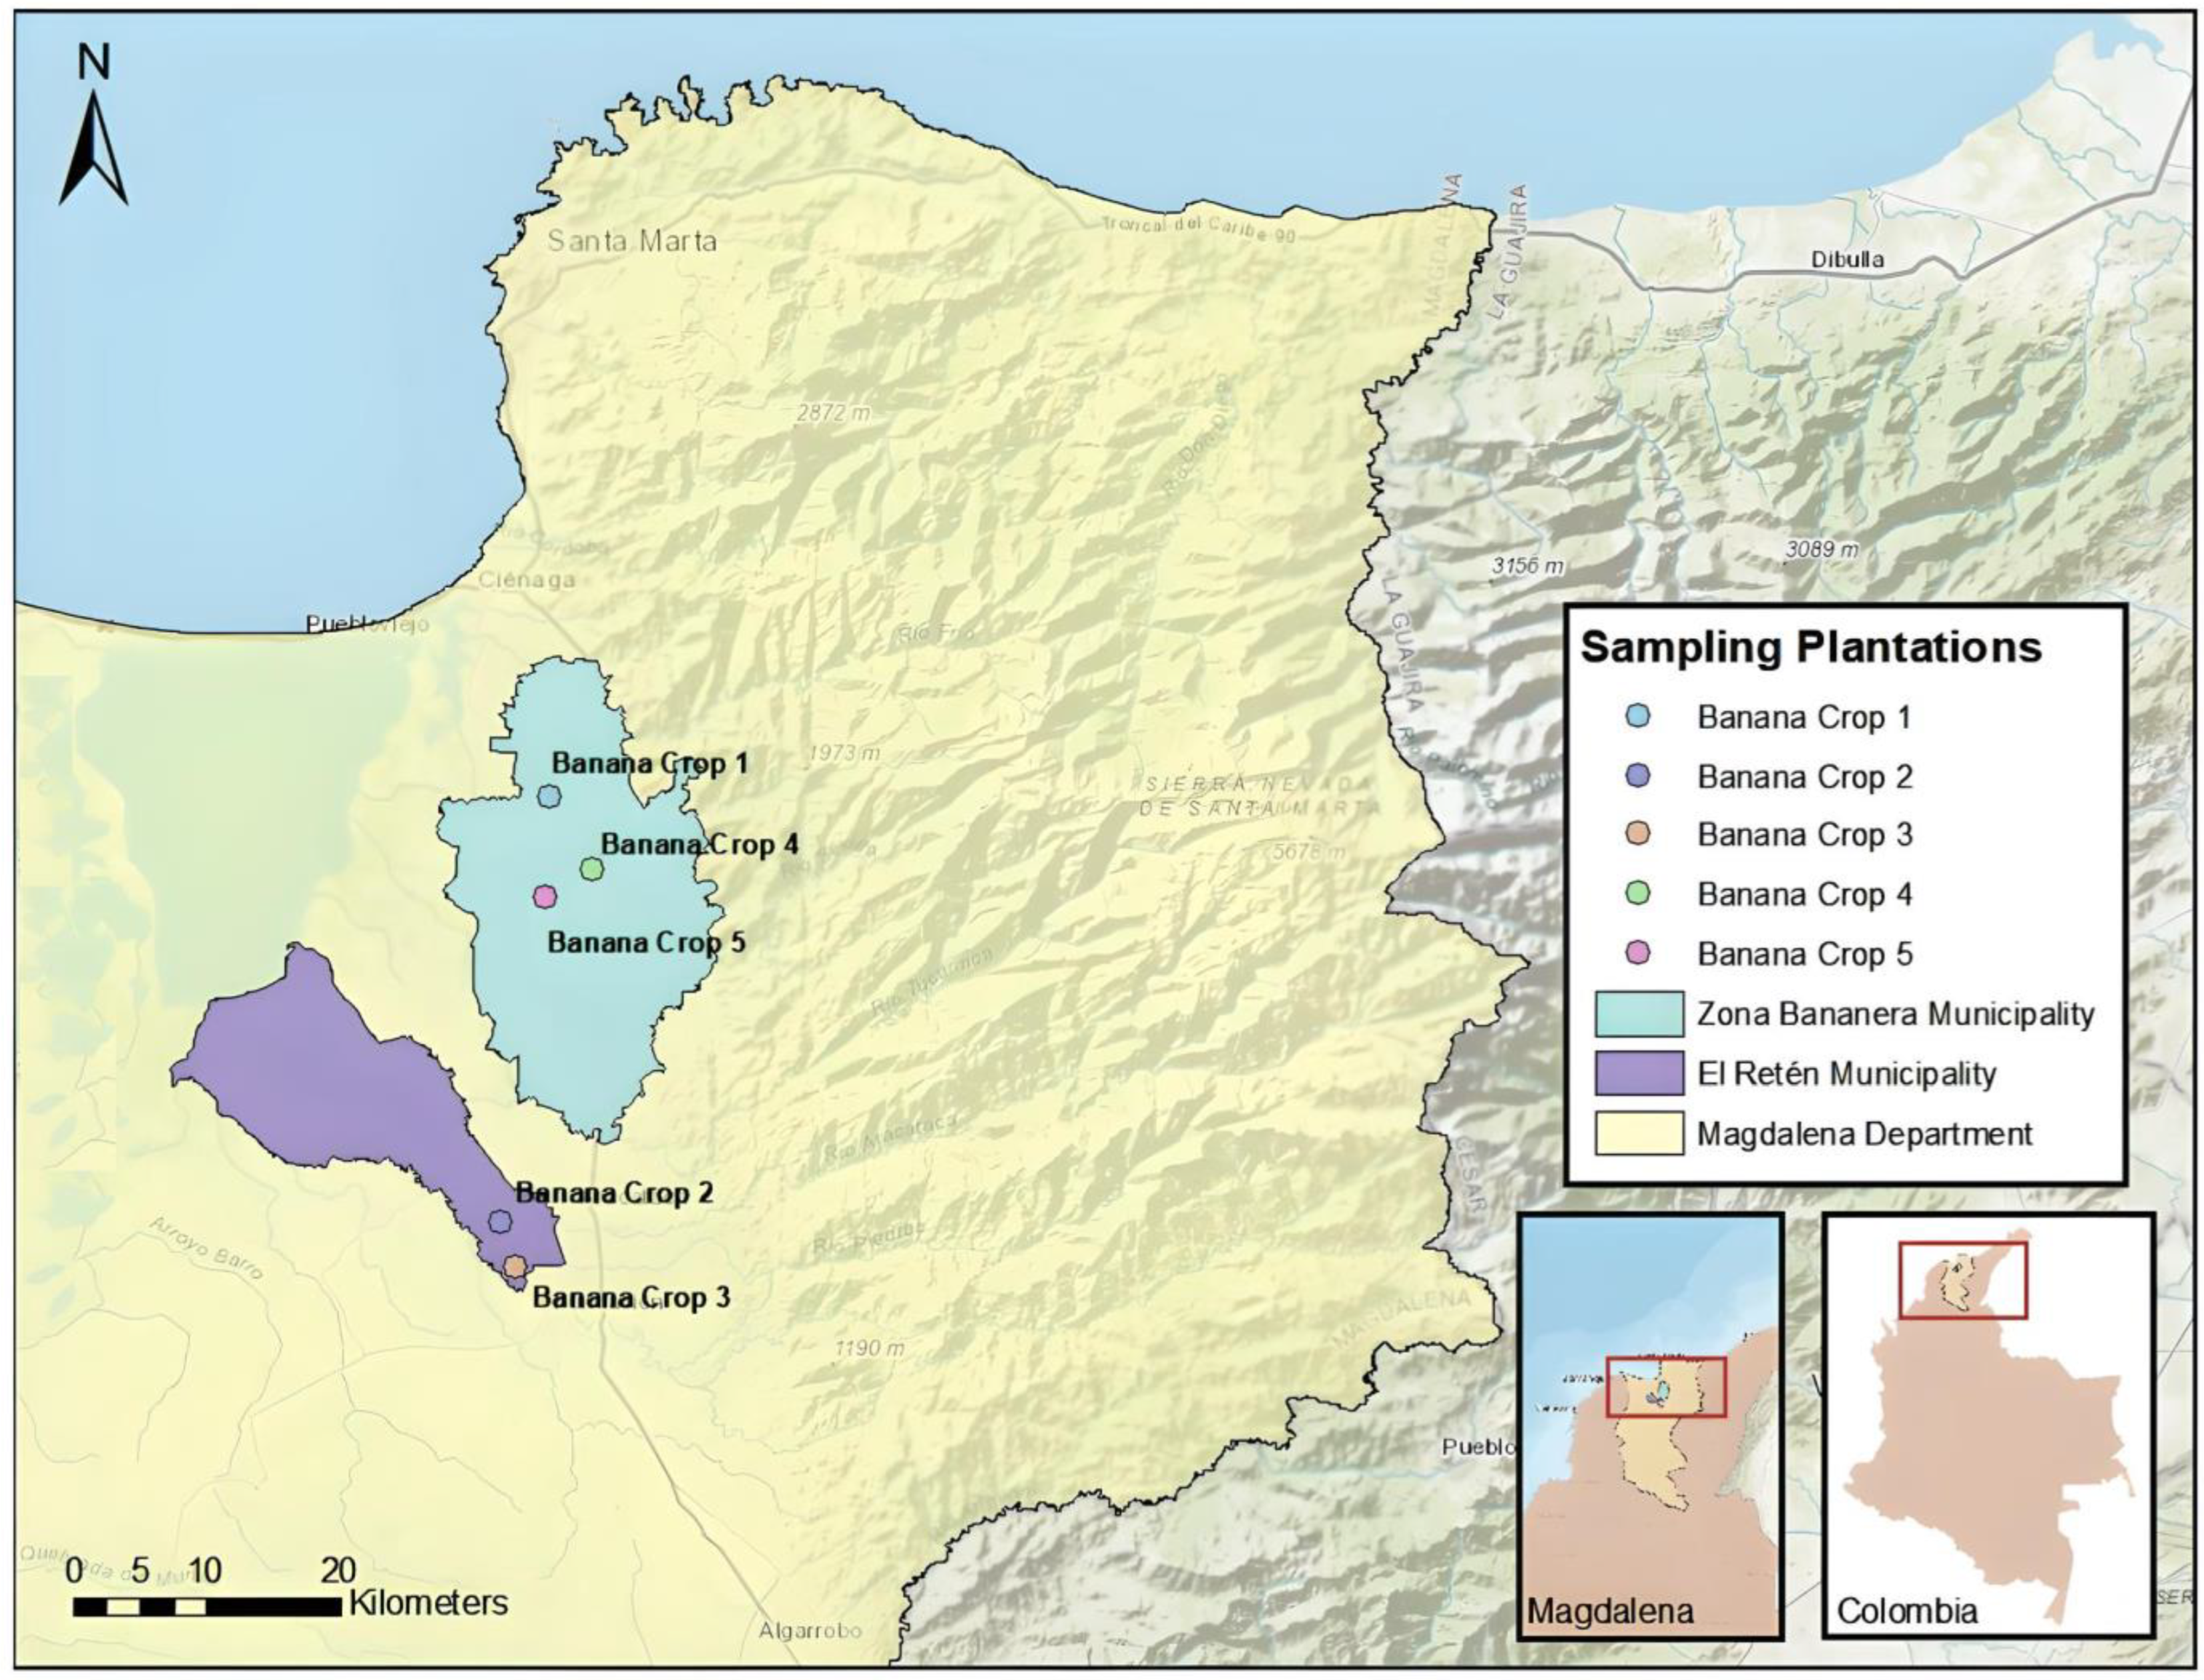
Figure 1. Study area map, showing the location of the five banana plantations in Magdalena Department in Colombia, within the municipalities of Zona Bananera and El Retén where data acquisition with UAV was conducted.
Drones 08 00503 g001
Figure 2. DJI Phantom 4 drone integrates six 1/2.9″ CMOS sensors, including one RGB sensor for visible light imaging and five monochrome sensors for multispectral imaging, covering the blue, green, red, red edge, and near-infrared bands [25].
Drones 08 00503 g002
Figure 3. (A) Before the alignment of images (with disparity and blurred) based on the SIFT algorithm; (B) after the alignment of images based on the SIFT algorithm [27].
Drones 08 00503 g003
Figure 4. Sample labelling on the Roboflow platform, where pixels labelled with 0 correspond to areas affected by Black Sigatoka disease, and the rest of the pixels are labelled with 1 [29].
Drones 08 00503 g004
Figure 5. Spectral fusion for creation of false-colour images from multispectral images.
Drones 08 00503 g005
Figure 6. Creation of false-colour images for detection models using different spectrum combinations (RED, REG, NIR–GREEN, REG, NIR–BLUE, REG, NIR).
Drones 08 00503 g006
Figure 7. Dataset creation for evaluation of the classification models. By subdividing and converting them into false-colour images using the UAV’s multispectral sensors, we obtained 2706 objects of diseased leaves, 3102 objects of healthy leaves, and 1192 extra objects of non-leaves to train classification algorithms. (A) Healthy leaf; (B) diseased leaf; (C) non-leaf extra.
Drones 08 00503 g007
Figure 8. Performance using EfficientNetV2B3: accuracy and loss.
Drones 08 00503 g008
Figure 9. Metrics using EfficientNetV2B3: confusion matrix.
Drones 08 00503 g009
Figure 10. Open dataset including pictures of banana leaves under three categories: “healthy” banana leaves, “Xanthomonas-infected” leaves, and “Sigatoka-infected” leaves.
Drones 08 00503 g010
Figure 11. Performance using EfficientNetV2B3: accuracy and loss.
Drones 08 00503 g011
Figure 12. Metrics using EfficientNetV2B3: confusion matrix.
Drones 08 00503 g012
Figure 13. Open dataset including pictures of banana leaves under three categories: “healthy” banana leaves, “bacteria-wilt-infected” leaves and “Sigatoka-infected” leaves.
Drones 08 00503 g013
Figure 14. Performance using EfficientNetV2B3: accuracy and loss.
Drones 08 00503 g014
Figure 15. Metrics using EfficientNetV2B3: Confusion matrix.
Drones 08 00503 g015
Figure 16. Hybrid convolutional neural network (CNN) architecture based on current deep learning techniques for classification.
Drones 08 00503 g016
Table 1. Representation of confusion matrix in binary classification [13].
Confusion MatrixPredicted Values
Positive PredictionNegative Prediction
Actual ValuesPositive labelTrue positive (TP)False negative (FN)
Negative labelFalse positive (FP)True negative (TN)
Table 2. Metrics for the models’ evaluation, equation, and description of accuracy, precision, recall, and F1-Score [13].
MetricEquationDescription
Accuracy (acc) T P + T N T P + F P + T N + F N Calculates how often predictions equal labels.
Precision (p) T P T P + F P Quantifies the number of positive class predictions that actually belong to the positive class.
Recall (r) T P T P + F N Quantifies the number of true positives and the number of false negatives.
F1-Score (F1) 2 × P r e c i s i o n × R e c a l l P r e c i s i o n + R e c a l l This is the harmonic mean of precision and recall. Its output range is [0, 1]. It works for both multi-class and multi-label classification.
Table 3. Description of false-colour images of 3-channel matrices, emulating the traditional image formation of a colour composition system based on the addition of the primary colours of light, red, green, and blue (RGB), but with 3 channels that have scientifically demonstrated the ability to easily determine the variation in chlorophyll caused by diseases in the leaves.
Colour SpaceSpectrum CombinationWavelengths
1Blue, Red Edge, Near-Infrared450 nm, 730 nm, 840 nm
2Green, Red Edge, Near-Infrared560 nm, 730 nm, 840 nm
3Red, Red Edge, Near-Infrared650 nm, 730 nm, 840 nm
Table 4. Classification training and validation results using CNNs and our own datasets.
ArchitectureSpectrum
Combination
Training
Accuracy
Validation
Accuracy
Precision of Sigatoka ClassRecall of
Sigatoka Class
EfficientNetV2B3RGB0.80900.78330.750.64
EfficientNetV2B3R, REG, NIR0.83060.76480.710.67
EfficientNetV2B3G, REG, NIR0.83040.75620.680.58
EfficientNetV2B3B, REG, NIR0.83370.76330.700.61
VGG19RGB0.80180.77140.680.77
VGG19R, REG, NIR0.80430.75810.690.70
VGG19G, REG, NIR0.80200.74950.740.59
VGG19B, REG, NIR0.82760.74760.670.70
MobileNetV2RGB0.82470.78520.630.39
MobileNetV2R, REG, NIR0.86530.78900.750.72
MobileNetV2G, REG, NIR0.82590.76380.680.72
MobileNetV2B, REG, NIR0.82650.76100.700.65
Table 5. Classification training and validation results using CNNs and open datasets [32].
ArchitectureSpectrum
Combination
Training
Accuracy
Validation
Accuracy
Precision Of Sigatoka ClassRecall of
Sigatoka Class
EfficientNetV2B3RGB0.95790.87330.850.86
VGG19RGB0.95460.83940.700.83
MobileNetV2RGB0.90920.77200.790.61
Table 6. Classification training and validation results using CNNs and open datasets [33].
ArchitectureSpectrum
Combination
Training
Accuracy
Validation
Accuracy
Precision of Sigatoka ClassRecall of
Sigatoka Class
EfficientNetV2B3RGB0.99640.96770.970.98
VGG19RGB0.98860.96770.970.98
MobileNetV2RGB0.97250.83870.900.91
Disclaimer/Publisher’s Note: The statements, opinions and data contained in all publications are solely those of the individual author(s) and contributor(s) and not of MDPI and/or the editor(s). MDPI and/or the editor(s) disclaim responsibility for any injury to people or property resulting from any ideas, methods, instructions or products referred to in the content.