Abstract
This paper presents a methodology for generating virtual ground control points (VGCPs) using a binocular camera mounted on a drone. We compare the measurements of the binocular and monocular cameras between the classical method and the proposed one. This work aims to decrease human processing times while maintaining a reduced root mean square error (RMSE) for 3D reconstruction. Additionally, we propose utilizing COLMAP to enhance reconstruction accuracy by solely utilizing a sparse point cloud. The results demonstrate that implementing COLMAP for pre-processing reduces the RMSE by up to 16.9% in most cases. We prove that VGCPs further reduce the RMSE by up to 61.08%.
1. Introduction
Digital elevation models (DEMs) can be generated through two methods [1]: (a) direct methods, which require specialized instruments such as total stations and are typically undertaken by surveyors, and (b) indirect methods, which utilize modern digital technologies like terrestrial laser sensors, drones, unmanned aerial vehicles, airplanes, and satellites [2,3,4]. Although drones have become increasingly popular due to their accessibility and versatility, elevation models obtained from drones may not consistently achieve satisfactory levels of precision. Various techniques may be employed to enhance the accuracy of the measurements, including the utilization of ground control points (GCPs) or the integration of additional sensors, such as real-time kinematic (RTK) sensors.
A GCP is a mark on the ground for which the global position is known with centimeter-level accuracy. There are two types of GCPs: standardized and non-standardized. The former use contrasting colors against the ground, such as a grid with two black and two white squares interspersed [5], or in some cases, different QR patterns for each GCP [6], which can be detected by specialized software. Non-standardized GCPs can be generated using other types of markings, such as fences or traffic signs. The traditional approach to detecting these points is manual, whereby a user searches for the central point of the GCP in the photograph and marks it, then searches for the same point in all the photographs in which it appears, repeating this process for all the GCPs. While this process is acceptable in terms of time for small reconstructions, it becomes tedious and prone to human errors due to fatigue in larger projects that have many GCPs and thousands of images. There are automatic approaches for standardized GCPs since they have less complexity when searching for patterns [5,6,7], because there is already something predetermined to search for. Nevertheless, there are also automatic approaches for non-standardized GCPs, which have the advantage of requiring less logistics since static objects within the same area can serve as GCPs. For instance, Ref. [8] employed an edge detection approach to extract a coastline and identified GCPs by line matching. In [9,10], template matching was used to perform an automated search for light poles and use them as GCPs. In [11], a four-step process was employed to retrieve the position of a point of interest in all images in which it appears to apply it to traffic signs such as crosswalks. Moreover, Ref. [12] utilized the Harris algorithm, a general purpose corner detector, to automate the detection process, enabling arbitrary bright, isolated objects to be marked as GCPs.
Different positioning techniques have been sought to increase accuracy by dispensing with GCPs or reducing their use to a minimum. Some examples are real-time kinematics (RTK) and post-processing kinematics (PPK), which use information obtained from fixed stations and satellites to determine the real-time position of a drone with a minimal margin of error. However, according to [13], the improvement between using the RTK technique versus using GCPs is minimal and requires more expensive equipment, so GCPs still play a valuable role.
In the state of the art, alternatives to replace RTK sensors have been proposed, as described in the work of [14,15]. In some works, the camera position is retrieved at different times, considering the sampled plot’s dimensions, particularly the distance between furrows. [16] propose using three drones together to improve the accuracy of a lead drone by triangulation between the lead drone, a satellite, and the other two drones. Another area of research focuses on enhancing photogrammetry algorithms, particularly those related to feature point detection, description, and matching. Refs. [17,18,19,20] present examples of novel algorithms that make use of convolutional neural networks (CNNs) to detect and describe these invariant local features. Ref. [18] proposes the detection of key points in a format similar to [21] but in a shorter time, at the cost of reducing the number of detected points. In the field of feature-matching algorithms, there has also been a large number of recent contributions [22,23,24,25]. SuperGlue [23] is remarkable for making more consistent feature correspondences, taking into account the geometric transformations of the 3D world. In addition, this algorithm works with SuperPoint [23] to achieve a data association system with low error, albeit with a limited number of detected points.
In this paper, we propose the integration of different libraries, techniques, and a drone for DEM creation, including (a) the OpenDroneMap (ODM) system [26] (which includes OpenSFM and work with the monocular cameras for generating the point cloud), (b) the creation of virtual ground control points (VGCPs) employing a binocular camera, and (c) the utilization of the mid-range-cost DJI MAVIC PRO Platinum drone [27]. This combination of resources aims to generate DEMs with a relative mean squared error (RMSE) of less than 10 cm at a 100 m altitude. This value meets the guidelines set by [28,29]. This proposal proposes a novel type of non-standardized automated GCP that will reduce the time required for human processing and the reliance on conventional GCPs that typically necessitate professional GPS equipment. The study proposes using a binocular camera with GCPs to acquire position information through the drone’s onboard GPS, which can reduce the dependency on external devices. In addition, pre-processing with COLMAP was tested.
2. Materials and Methods
Figure 1 displays the photogrammetric methodology utilized in this study. The blue-bordered figures represent the proposed phases related to creating and managing VGCPs.
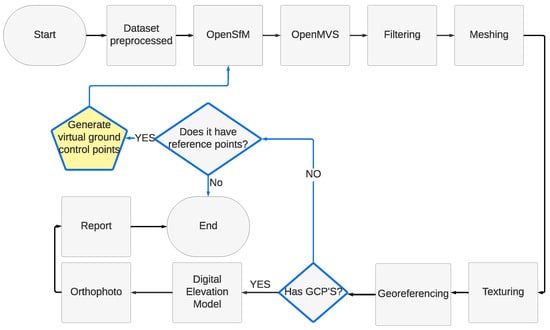
Figure 1.
Methodology of a typical photogrammetry process with the proposed phases highlighted with blue borders.
Our methodology is as follows:
- The process starts with an image database from which a sparse point cloud is generated using OpenSFM [30].
- From this sparse cloud, a dense cloud is computed by the OpenMVS library [31,32].
- Outliers are removed using a middle-pass filter.
- The point cloud is converted into a mesh.
- The resulting mesh is textured using the Poisson tool [33] to make the reconstruction more realistic.
- A georeferencing process is performed in global coordinates according to the EPSG:4326 WGS 84 [34] standard (in degrees).
- The reconstruction is checked for GCPs. If GCPs are present, a digital elevation model is generated, an orthophoto of the reconstruction is created, and a quality report is produced (classic process). On the other hand, if the reconstruction does not have GCPs, the distance between some points of the image is checked to map them inside the image (with the binocular camera) and thus generate VGCPs using the method proposed in the following section.
- Once the VGCPs are obtained, the process is repeated for the subsequent reconstruction.
2.1. Pre-Processing with COLMAP Library
Figure 2 shows the pre-processing adopted using COLMAP and the Libimage-exiftool-perl library [35], which allows modifying and adding the EXIF parameters of the image for the monocular dataset. The binocular point cloud is generated directly from the two input images, requiring no additional processing. The steps are as follows:
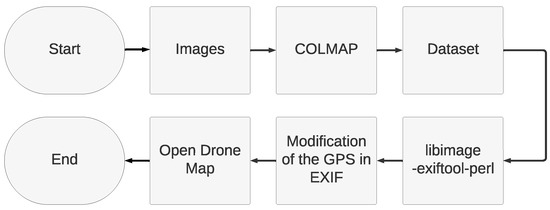
Figure 2.
Image pre-processing using COLMAP.
- The process starts with an image database from which a sparse point cloud is generated using an incremental reconstruction technique with the COLMAP library.
- A database is created with the information of all points of the point cloud and the information of the cameras calculated by COLMAP.
- Using the Libimage-exiftool-perl library [35], the Exchangeable image file format (EXIF) metadata of each image is modified, especially the GPS information of the picture.
2.2. Re-Projections from Point Cloud to Image
To convert point cloud points into image coordinates for a specific image, we carry out the following stages, see Figure 3.
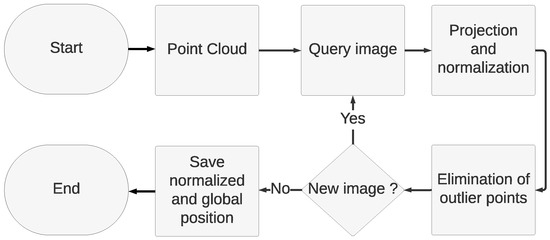
Figure 3.
Process to convert a new point cloud into local and global image coordinates.
- The process starts with either a binocular or monocular point cloud.
- Each point in the cloud is re-projected onto the query image and normalized.
- Any points that are outside the image dimensions are then removed. For instance, one can calculate the precise coordinates of a point for the query image x as 5454 and 8799 during the re-projection process. However, since the image resolution is , any points identified within the query image that fall outside these dimensions will be eliminated.
- The process is repeated for each image of the dataset.
- The output data are stored in a single file per image, with the format consisting of the image name, point number, and local and global coordinates (if monocular). For each binocular image, a file is produced in the following format: local coordinates followed by global coordinates. The different formatting arises because binocular images contain more points than monocular images.
Further details and re-projected point images can be found in Appendix A: Re-projection results.
2.3. Proposed Methodology for the Generation of Virtual Ground Control Points (VGCPs)
Our approach is to generate VGCPs using the distances calculated by the binocular camera and SFM from the same points within the reconstruction in geodetic coordinates:
- An image bank is acquired, both with the binocular and monocular cameras. The monocular acquisition comes from a flight at a higher altitude (50 m, 100 m) of the whole area to be reconstructed, with an overlap of 80% (height and overlap are fixed considering [36,37,38,39,40]). The binocular camera images were acquired during a second flight at a lower altitude (5 m, 10 m). We obtain some central points of the area to be reconstructed, for example, about 4 points for a flat terrain of 20 thousand square meters. Each point is chosen to be 20 m apart, trying to connect the points with several images collected by the cameras. The data of the binocular flight were saved in SVO format, which were decompressed after the flight.
- Apply COLMAP pre-processing (feature extraction, matching, and geometric verification) to the monocular images.
- Generate a sparse reconstruction from a set of monocular images using the OpenSFM module of Web OpenDroneMap.
- Perform a conversion from global coordinates EPSG:4326 WGS 84 [34] (in degrees) to zone coordinates EPSG:32614 WGS 84/UTM zone 14N [41] (in meters). The conversion is performed using the pyproj library [42], a Python interface to PROJ.
- Convert the point cloud to points using the monocular camera image.
- Generation of one point cloud per query image from the binocular camera.
- Convert the point cloud to points via the binocular camera image.
- The correspondences are computed for each pair of images in which a VGCP is to be generated.
- Eliminate from the list of correspondences all those that do not contain a point in the point cloud both binocularly and monocularly, taking into account queryIdx and trainIdx, which are parameters of the correspondence algorithm, as well as the RANSAC matrix.
- Search for an initial point, taking into account the position of the point and the number of images in which the point appears.
- Find the points surrounding the initial point with a radius of 500 pixels.
- For each point, find the difference in the x, y, and z axes between the binocular and monocular coordinates and calculate the average error.
- Correct the distance error by shifting the coordinates of the starting point considering the average error per axis.
- Convert to EPSG:4326 WGS 84 [34] format (global coordinates in degrees).
- Store the information in the following order: (1) the geodetic coordinates of the rectified point, (2) the spatial position of the rectified point in the image, (3) the name of the image within the image database, and (4) the VGCP number it represents, taking into account all images. This storage process is performed for each image containing this reference object and all reference objects.
Figure 4 shows the pre-processing carried out by the monocular camera to generate the re-projections and store them all in a single text file.
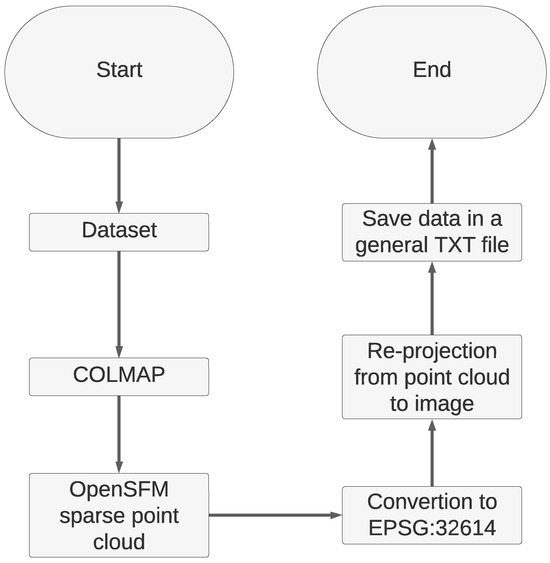
Figure 4.
Flow chart for generating monocular text from sparse point clouds.
Figure 5 shows the process carried out by the binocular camera to generate the re-projections and store them in a text file for each image.
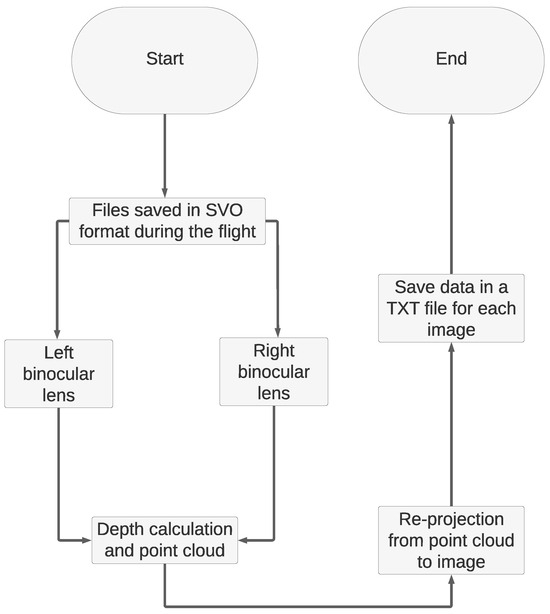
Figure 5.
Flow chart for generating of binocular text from a points clouds.
In summary, generating VGCPs using a binocular and a monocular camera involves the following steps: 1. the generation of a sparse reconstruction of the monocular images; 2. the re-projection of those points inside the original images, with the resulting information saved in a text file; 3. the depth calculation of each pair of binocular images, using stereo techniques (ZED SDK), is saved in a format that includes the coordinates (x, y, z); 4. the search for correspondences between monocular and binocular images, selecting the images with the most significant degree of correspondence; 5. the elimination of points not present in the monocular and binocular point cloud (the disparity-calculated one); 6. the selection of a point found in the center of as many monocular images as possible (using the text file from step 2); 7. correction of the position of the selected point, considering the position of the other points found around it, achieved by measuring the position of the selected point against the other points found around it, using the binocular camera as a reference; and 8. saving the information in GCP format. Figure 6 shows a flowchart with a simplified algorithm to generate correspondences, considering the information generated in the previous stages.
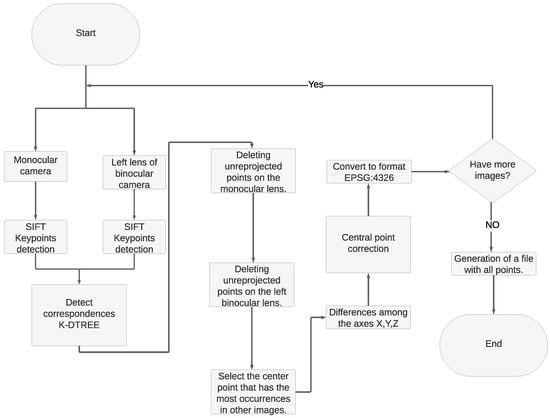
Figure 6.
Flow chart for matching monocular and binocular images.
2.4. Acquisition of Datasets
2.4.1. Monocular Drone
The DJI Mavic Pro Platinum [27] is a monocular drone with a 12.35 M CMOS 1/2.3″ sensor equipped camera that has a focal length of 1/2.3″ and captures images of size 4000 × 3000, including EXIF information. We used it in conjunction with the DroneDeploy mobile application [43]. This software generates flight paths while considering the desired height and image overlap. Figure 7 displays an image of the drone.
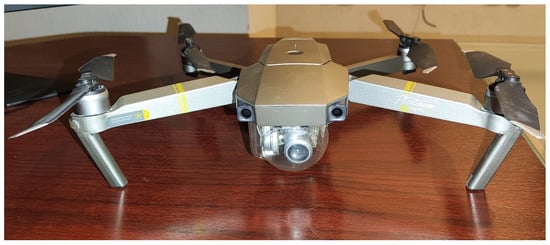
Figure 7.
DJI MAVIC Pro Platinum.
2.4.2. Binocular Drone
We employed two binocular drones, a DJI AGRAS T10 [44] and a DJI Inspire 1 [27]. Both drones were equipped with a binocular camera. The AGRAS T10’s camera was mounted with a mechanical stabilizer at the bottom, at the height of the actuator. The Inspire 1’s camera was located at the height of the ultrasonic sensor. This camera is the ZED 2 [45], providing a 2208 × 1242 resolution per lens in JPG format, with a GSD ranging from 0.5 cm to 1 cm. It is noteworthy that the camera lacks EXIF information. The JETSON NANO [46] is responsible for capturing and storing images in an SVO format from the ZED 2 controller card, which is originally from Stereolabs. The flight plan involves descending gradually from 10 m to 2 m while stopping at 8, 6, and 4 m. Specific points on the plot are targeted during this process.
2.4.3. Monocular Datasets
Two flights were conducted over two plots in Jojutla, a municipality in the Mexican state of Morelos. The heights of each flight were 50 m, 75 m, and 100 m. These heights were chosen based on typical photogrammetry flights of the state of the art, ranging from 50 to 300 m [36,39,47,48]. However, limitations of the DJI MAVIC Pro Platinum drone used for this study restrict it to flying only up to a maximum height of 100 m above ground level [37].
(a) Dataset 1 was acquired on 19 November 2022, between 7:00 and 7:40 a.m. It consisted of 58 photos taken at 100 m, 86 photos taken at 75 m, and 146 photos taken at 50 m; see images for reference in Figure 8.

Figure 8.
Three sample images of dataset 1 captured with the monocular camera.
(b) Dataset 2 was acquired on December 1, 2022, between 4:00 and 4:30 p.m. It consisted of 62 photos taken at 100 m, 81 at 75 m, and 142 photos taken at 50 m; see images for reference in Figure 9.

Figure 9.
Three sample images of dataset 2 gathered with the monocular camera.
2.4.4. Binocular Datasets
(a) Dataset 3 consists of three flights conducted over a plot of land containing two-month-old cane in Tlaltizapán, Morelos, Mexico. The first two flights employed a binocular camera and covered four predetermined locations. The drone started at a height of 10 m and progressively reduced altitude to 2 m before ascending to 10 m and proceeding with the flight. The primary distinction between the initial two flights lies in using a mechanical stabilizer in one of them, while the other did not employ one. Specifically, the first flight had the camera mounted directly onto the chassis. In contrast, the second flight attached the camera to the mechanical stabilizer to test whether the drone’s high frequencies would hurt the stabilizer (refer to Figure 10). The third flight of the monocular drone occurred at an altitude of 100 m and was impeded by a bird attack, preventing it from flying lower. The photographs were captured between 4:00 and 4:40 p.m. on 20 May 2023. The pictures are in JPG format with a resolution of 4000 × 3000 and a GSD of 3 cm. The geolocation of the photographs is available in the EXIF data. There are 46 images for the monocular flight and 2000 images for each binocular flight. The large volume of this collection is because the ZED camera constantly captures pictures, as there is no option to capture them at a specific moment. The main reason for the different format is that the monocular camera has 4 K (4000 × 3000) resolution, and the ZED camera is limited to 2 K (2208 × 1242 per lens). Figure 11 illustrates examples of these images.

Figure 10.
Example of a binocular image from dataset 3.

Figure 11.
Examples of three monocular images from dataset 3.
(b) Dataset 4 consists of three flights conducted over a plot of agave in Zapopan, Jalisco, Mexico. The first two flights utilized a monocular camera and followed a flight path defined by the DroneDeploy application with an 80% overlap. They were conducted at 100 m and 50 m heights, respectively. The third flight was conducted by the binocular drone, which followed a flight path similar to the monocular drone but manually at the height of 10 m, and there are two thousand images, as in Dataset 3 (see Figure 12). This flight was performed to select images with better matches between monocular and binocular in post-processing. The photographs were taken on 1 December 2023, from 1:00 to 1:30 p.m. Four pieces of green cardboard, each measuring 65 cm × 50 cm and featuring a black central point, were distributed within the field. The photographs, which have a resolution of 4000 × 3000 and are in JPG format, have a GSD of 3 cm, and their geolocation is included in the EXIF. A total of 138 images were obtained for the monocular flights. An example can be seen in Figure 13.

Figure 12.
Example of a binocular image from dataset 4.

Figure 13.
Examples of three monocular images from dataset 4.
2.5. Metrics
A photogrammetric system must achieve both relative and absolute accuracy in its reconstruction. This implies consistent re-projection of its points both locally and geographically. Figure 14 illustrates one house with a good relative accuracy, because the dimensions of a house can be measured accurately in an arbitrary coordinate system. However, the absolute accuracy is poor or not known, because the house is not represented in the correct geographical reference coordinate system.

Figure 14.
The relative accuracy is good, but the absolute accuracy is poor.
2.5.1. RMSE
The RMSE (root mean square error) measures the difference between estimates and real values by squaring the differences and calculating their average. Finally, as its name suggests, the square root of the resulting average must be calculated to quantify the error’s magnitude accurately [49,50,51]. The RMSE is a measure of the magnitude of the error. In photogrammetry, the GCPs provide the global position within a few centimeters of error. Some GCPs are used to improve the accuracy of the DEM, while others are used to measure the error. The latter are calculated using SFM, and a comparison is made between the measured value of the GCP on the ground and the calculated value for each axis, using Equation (1):
where n is the number of GCPs evaluated, is the x-axis for the i-th GCP within the DEM, and is the x-axis for the i-th GCP measured by the GNSS.
2.5.2. CE90 and LE90 Metrics
The CE90 and the LE90 metrics are precision indicators. CE90 represents the circular error at the 90th percentile, recording the percentage of measured points with a horizontal error less than the specified CE90 value. On the other hand, LE90 denotes the linear error at the 90th percentile, revealing that a minimum of 90 percent of vertical errors lie within the stated LE90 value. In other words, CE90 and LE90 are equivalent, with CE90 being for the x-axis and LE90 for the y-axis [52] (Equation (2))
where N represents the total measurements.
2.5.3. Development Tools
The following tools were used in the development of the project: A computer with the following components: INTEL I7 8700k, NVIDIA RTX 3060, XPG D40 24 GB RAM 3200 MHz, XPG S40G 512 GB m.2; Docker [53]; OpenCV [54]; ODM [26]; Ubuntu 20.04 [55].
3. Results
Formula (3) was used to calculate the percentage differences and facilitate understanding of the data. A positive result means that the reconstruction’s accuracy increased using the VGCPs.
where AD stands for the average difference, O represents the original value of metrics in the reconstruction without VGCPs, M represents the value of metrics in the reconstruction using VGCPs, and n represents all metrics (absolute RMSE, relative RMSE, CE90, and LE90).
3.1. Results of COLMAP Pre-processing
To determine whether there are disparities in utilizing COLMAP image pre-processing, we produced 12 reconstructions drawn from Dataset 1 and Dataset 2. Six of the reconstructions used pre-processing, while the other six did not. No virtual control points were generated during the tests, as our focus was on examining the effectiveness of the pre-processing. As previously stated, we evaluated the performance of applying or not applying COLMAP for each height (100, 75, and 50 m) in Dataset 1 and Dataset 2, consisting of 269 images. Table 1 and Table 2 presents the results obtained from the above-mentioned experiments in Dataset 1 and Dataset 2 respectively.

Table 1.
Results of COLMAP pre-processing for Dataset 1, where ‘W/o’ means without, ‘W’ mean with, and ‘Diff’ means difference in meters.

Table 2.
Results of COLMAP pre-processing for Dataset 2, where W/o means without, W means with, and Diff means difference in meters.
The use of COLMAP for data pre-processing generally increases accuracy. However, if reconstruction speed takes priority over quality, it is not recommended, as the average increase in accuracy is only 5.96%. Conversely, if processing time is not a concern, pre-processing with COLMAP proves effective.
3.2. Results of Virtual Ground Control Points in Dataset 3
To evaluate the accuracy gained by incorporating the VGCPs in Dataset 3, four reconstructions were generated for each flight: (a) one considering the VGCPs, (b) one without them, (c) one considering the VGCPs but using COLMAP pre-processing, and (d) one without them but using COLMAP pre-processing. To calculate the percentage difference and facilitate the understanding of the data, Equation (3) was used, where a positive result means that the accuracy of the reconstruction increases with the use of the VGCPs.
Table 3 presents the results obtained from the above-mentioned experiments.

Table 3.
Impact of using VGCPs and COLMAP on Dataset 3 in meters.
Table 3 demonstrates that using only VGCPs reduces the RMSE in the test cases by up to 21.9%. However, when COLMAP pre-processing is used for this dataset, the RMSE increases further, resulting in a negative difference of up to 0.55%.
3.3. Analysis of the Creation of Virtual Ground Control Points in Dataset 4
Two reconstructions were generated for each flight to evaluate the accuracy obtained by incorporating the VGCPs in dataset 4: (a) one considering only the VGCPs and (b) one without them. Equation (3) was used, in the same way as in the experiment on Dataset 3, to calculate the percentage difference and facilitate the understanding of the data. Table 4 presents the results obtained from the above-mentioned experiments.

Table 4.
Creation of VGCPs in Dataset 4 at flight heights of 50 and 100 m, where ‘W/o’ means without, ‘W’ means with, and ‘Diff’ means difference in meters.
Table 4 demonstrates that utilizing VGCPs can decrease the RMSE by up to 61.08%
4. Discussion
Comparing the results obtained in this article with those of the state of the art is challenging because each article presents its own dataset. These datasets can vary significantly, as shown in [56], where the authors present a method to enhance the accuracy of maritime reconstructions using both sonar and SFM. In addition, it is essential to note that some articles present reconstructions with different conditions than those used in this study, such as flight heights of up to one thousand meters or the use of high-performance cameras [57,58,59,60]. Therefore, we focused on articles that utilized commercial drones, which are commonly used in typical reconstructions that do not require millimeter-level accuracy. However, they have used RTK or GCPs to improve their reconstruction devices, which are expensive or inaccessible to many people. Table 5 presents the results reported in the literature.

Table 5.
Comparison between the state of the art and our method. Where: The asterisk (*) represents information that the author did not provide.
Table 5 shows that our proposed methodology is among the top three performers despite using fewer GCPs and not utilizing an RTK sensor. This suggests a promising future for this technology. A binocular drone mounted on a commercial drone’s body can significantly improve data acquisition. This approach avoids sudden movements on the ground and makes it easier to plan a flight path. Monocular acquisition requires descending in a straight line to acquire the binocular image, which can hinder the performance of the proposed methodology. The usage of the binocular camera leads to the generation of virtual ground control points, which offer numerous advantages. Firstly, no improvements are needed. Binocular cameras do not require marks to be placed on the ground as is typically needed, resulting in time savings. To ensure accuracy (1–10 cm error), the GPS receiver must remain within 15 min to 48 h per point [65], depending on weather conditions and the desired level of precision. It is unnecessary to manually locate each GCP within all image bank images, as this process is automated. A file is then provided which indicates the photos in which the VGCP is located, along with its coordinates within those images. The drone avoids exposing the user to risk by automatically generating virtual ground control points in difficult-to-access areas like steep slopes or cliffs, eliminating the need for manual placement and the associated process. However, this proposal offers benefits only in terms of relative accuracy, as it employs the distances identified by the binocular camera, which are within the monocular reconstruction, as a size control. In future work, and to reduce the absolute error, it is proposed to include a typical ground control point to triangulate the positions.
5. Conclusions
This paper presents a methodology for generating ground control points virtually, using information from a binocular drone and SFM-generated data from monocular images of a commercial drone. The aim is to reduce the reliance on typical GCPs. We propose a methodology for establishing co-correspondences between two point clouds containing different measurement systems: binocular and monocular. This is achieved using minutiae typical to both point clouds, as shown in Figure 6. Additionally, we propose a pre-processing step using COLMAP to refine the positions calculated by the GPS. The results demonstrate (Table 3 and Table 4) that using COLMAP for pre-processing generally improves accuracy by up to 16%. However, it may have a negative impact in some cases, but only up to 1.5%. Therefore, using COLMAP as a pre-processing step is feasible. Additionally, co-correspondences can generate virtual ground control points (VGCPs) that can be added to reconstructions as typical GCPs, resulting in decreased RMSEs. Additionally, using VGCPs reduces the data acquisition time in the field by eliminating the need to place or globally measure markers physically. It also saves time in the human pre-processing of images by automatically identifying and marking GCPs in all photos, eliminating the need for manual searching and marking.
Author Contributions
Conceptualization, A.V.-D. and A.M.-S.; methodology, A.V.-D. and A.M.-S.; software, A.V.-D. and A.M.-S.; validation, A.V.-D. and A.M.-S.; formal analysis, A.V.-D. and A.M.-S.; investigation, A.V.-D. and A.M.-S.; resources, A.V.-D., A.M.-S., R.P.-E., M.L.-S., J.F.-P. and H.A.-G.; data curation, A.V.-D., A.M.-S., R.P.-E., M.L.-S., J.F.-P. and H.A.-G.; writing—original draft preparation, A.V.-D., A.M.-S., R.P.-E., M.L.-S., J.F.-P. and H.A.-G.; writing—review and editing, A.V.-D. and A.M.-S.; visualization, A.V.-D. and A.M.-S.; supervision, R.P.-E. and J.F.-P.; project administration, A.V.-D., A.M.-S. and H.A.-G. All authors have read and agreed to the published version of the manuscript.
Funding
This research received no external funding.
Data Availability Statement
The datasets utilized in this article can be accessed via the following URL: https://huggingface.co/datasets/Ariel9874/Generation-of-Virtual-Ground-Control-Points-using-a-Binocular-Camera-Datasets.
Acknowledgments
The authors would like to thank the Computer Sciences Department at Tecnologico de Monterrey Guadalajara Campus for their support during the development of this project.
Conflicts of Interest
The authors declare no conflicts of interest.
Appendix A. Re-Projection Results
Figure A1, Figure A2 and Figure A3 show the points of the re-projected point cloud in each image in image bank 1; these points have the same spatial location between images (on the ground). In the areas of overlap, the same characteristics are observed, and it is interesting to note how they transition between images. Areas of overlap permit the system to automatically detect common characteristics (key points) through system analysis, which selects the most optimal characteristics. In contrast, manual methods necessitate that the user propose the points of interest in the images.
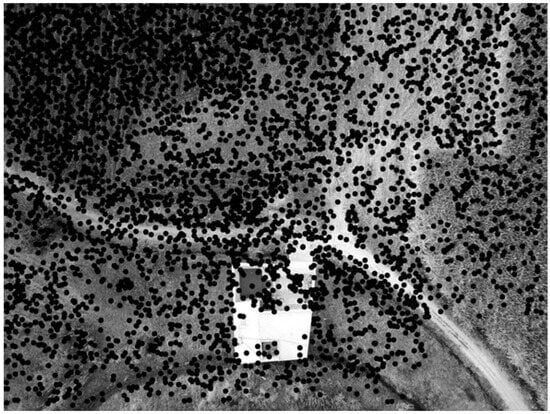
Figure A1.
Example of re-projection 1.
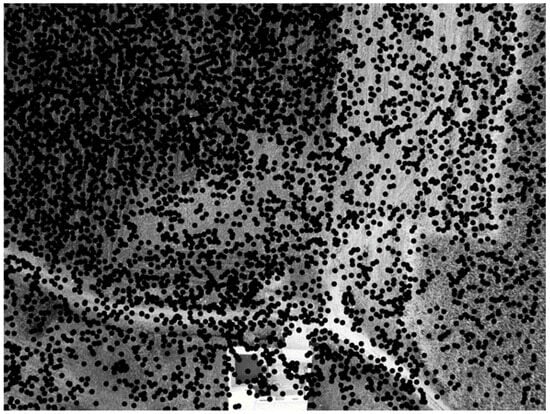
Figure A2.
Example of re-projection 2.
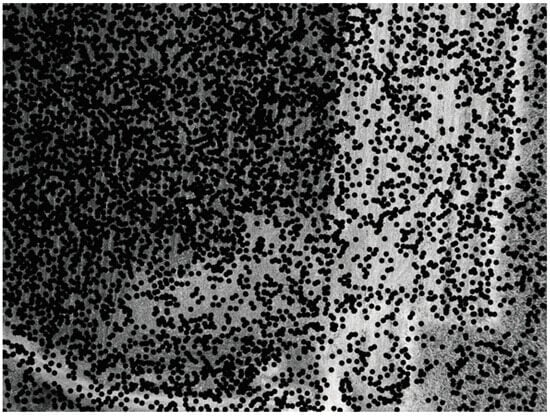
Figure A3.
Example of re-projection 3.
References
- INEGI. Metadatos de: Modelo Digital de Elevación de México; Technical Report; CentroGeo: México, Mexico, 2015. [Google Scholar]
- Guisado-Pintado, E.; Jackson, D.W.; Rogers, D. 3D mapping efficacy of a drone and terrestrial laser scanner over a temperate beach-dune zone. Geomorphology 2019, 328, 157–172. [Google Scholar] [CrossRef]
- James, M.; Robson, S.; D’Oleire-Oltmanns, S.; Niethammer, U. Optimising UAV topographic surveys processed with structure-from-motion: Ground control quality, quantity and bundle adjustment. Geomorphology 2017, 280, 51–66. [Google Scholar] [CrossRef]
- Wierzbicki, D.; Nienaltowski, M. Accuracy Analysis of a 3D Model of Excavation, Created from Images Acquired with an Action Camera from Low Altitudes. ISPRS Int. J. Geo-Inf. 2019, 8, 83. [Google Scholar] [CrossRef]
- Muradás Odriozola, G.; Pauly, K.; Oswald, S.; Raymaekers, D. Automating Ground Control Point Detection in Drone Imagery: From Computer Vision to Deep Learning. Remote Sens. 2024, 16, 794. [Google Scholar] [CrossRef]
- Li, W.; Liu, G.; Zhu, L.; Li, X.; Zhang, Y.; Shan, S. Efficient detection and recognition algorithm of reference points in photogrammetry. In Optics, Photonics and Digital Technologies for Imaging Applications IV; Schelkens, P., Ebrahimi, T., Cristóbal, G., Truchetet, F., Saarikko, P., Eds.; SPIE: Brussels, Belgium, 2016; Volume 9896, p. 989612. [Google Scholar] [CrossRef]
- Jain, A.; Mahajan, M.; Saraf, R. Standardization of the Shape of Ground Control Point (GCP) and the Methodology for Its Detection in Images for UAV-Based Mapping Applications. In Advances in Intelligent Systems and Computing; Springer: Berlin/Heidelberg, Germany, 2020; Volume 943, pp. 459–476. [Google Scholar] [CrossRef]
- Purevdorj, T.; Yokoyama, R. An approach to automatic detection of GCP for AVHRR imagery. J. Jpn. Soc. Photogramm. Remote Sens. 2002, 41, 28–38. [Google Scholar] [CrossRef][Green Version]
- Montazeri, S.; Gisinger, C.; Eineder, M.; Zhu, X.x. Automatic Detection and Positioning of Ground Control Points Using TerraSAR-X Multiaspect Acquisitions. IEEE Trans. Geosci. Remote Sens. 2018, 56, 2613–2632. [Google Scholar] [CrossRef]
- Montazeri, S.; Zhu, X.X.; Balss, U.; Gisinger, C.; Wang, Y.; Eineder, M.; Bamler, R. SAR ground control point identification with the aid of high resolution optical data. In Proceedings of the 2016 IEEE International Geoscience and Remote Sensing Symposium (IGARSS), Beijing, China, 10–15 July 2016; pp. 3205–3208. [Google Scholar] [CrossRef]
- Zhu, Z.; Bao, T.; Hu, Y.; Gong, J. A Novel Method for Fast Positioning of Non-Standardized Ground Control Points in Drone Images. Remote Sens. 2021, 13, 2849. [Google Scholar] [CrossRef]
- Nitti, D.O.; Morea, A.; Nutricato, R.; Chiaradia, M.T.; La Mantia, C.; Agrimano, L.; Samarelli, S. Automatic GCP extraction with high resolution COSMO-SkyMed products. In SAR Image Analysis, Modeling, and Techniques XVI; Notarnicola, C., Paloscia, S., Pierdicca, N., Mitchard, E., Eds.; SPIE: Ciudad de México, Mexico, 2016; Volume 10003, p. 1000302. [Google Scholar] [CrossRef]
- Tomaštík, J.; Mokroš, M.; Surový, P.; Grznárová, A.; Merganič, J. UAV RTK/PPK Method—An Optimal Solution for Mapping Inaccessible Forested Areas? Remote Sens. 2019, 11, 721. [Google Scholar] [CrossRef]
- Feng, A.; Vong, C.N.; Zhou, J.; Conway, L.S.; Zhou, J.; Vories, E.D.; Sudduth, K.A.; Kitchen, N.R. Developing an image processing pipeline to improve the position accuracy of single UAV images. Comput. Electron. Agric. 2023, 206, 107650. [Google Scholar] [CrossRef]
- Feng, A.; Zhou, J.; Vories, E.; Sudduth, K.A. Evaluation of cotton emergence using UAV-based imagery and deep learning. Comput. Electron. Agric. 2020, 177, 105711. [Google Scholar] [CrossRef]
- Wang, R.; Lungu, M.; Zhou, Z.; Zhu, X.; Ding, Y.; Zhao, Q. Least global position information based control of fixed-wing UAVs formation flight: Flight tests and experimental validation. Aerosp. Sci. Technol. 2023, 140, 108473. [Google Scholar] [CrossRef]
- Cieslewski, T.; Derpanis, K.G.; Scaramuzza, D. SIPs: Succinct Interest Points from Unsupervised Inlierness Probability Learning. In Proceedings of the 2019 International Conference on 3D Vision (3DV), Quebec City, QC, Canada, 16–19 September 2019; pp. 604–613. [Google Scholar] [CrossRef]
- DeTone, D.; Malisiewicz, T.; Rabinovich, A. SuperPoint: Self-Supervised Interest Point Detection and Description. In Proceedings of the 2018 IEEE/CVF Conference on Computer Vision and Pattern Recognition Workshops (CVPRW), Salt Lake City, UT, USA, 18–22 June 2018; Volume 2018-June, pp. 337–33712. [Google Scholar] [CrossRef]
- Ono, Y.; Fua, P.; Trulls, E.; Yi, K.M. LF-Net: Learning local features from images. In Proceedings of the Advances in Neural Information Processing Systems, Montréal, QC, Canada, 3–8 December 2018; Volume 2018-December, pp. 6234–6244. [Google Scholar] [CrossRef]
- Yi, K.M.; Trulls, E.; Lepetit, V.; Fua, P. LIFT: Learned Invariant Feature Transform. In Lecture Notes in Computer Science (Including Subseries Lecture Notes in Artificial Intelligence and Lecture Notes in Bioinformatics); Springer: Berlin/Heidelberg, Germany, 2016; Volume 9910 LNCS, pp. 467–483. [Google Scholar] [CrossRef]
- Lowe, D.G. Distinctive image features from scale invariant keypoints. Int. J. Comput. Vis. 2004, 60, 91–110. [Google Scholar] [CrossRef]
- Lindenberger, P.; Sarlin, P.E.; Pollefeys, M. LightGlue: Local Feature Matching at Light Speed. In Proceedings of the ICCV 2023, Paris, France, 1–6 October 2023. [Google Scholar]
- Sarlin, P.E.; DeTone, D.; Malisiewicz, T.; Rabinovich, A. SuperGlue: Learning Feature Matching With Graph Neural Networks. In Proceedings of the 2020 IEEE/CVF Conference on Computer Vision and Pattern Recognition (CVPR), Seattle, WA, USA, 13–19 June 2020; pp. 4937–4946. [Google Scholar] [CrossRef]
- Sun, J.; Shen, Z.; Wang, Y.; Bao, H.; Zhou, X. LoFTR: Detector-Free Local Feature Matching with Transformers. In Proceedings of the IEEE/CVF Conference on Computer Vision and Pattern Recognition, Nashville, TN, USA, 20–25 June 2021. [Google Scholar]
- Wang, Q.; Zhang, J.; Yang, K.; Peng, K.; Stiefelhagen, R. MatchFormer: Interleaving Attention in Transformers for Feature Matching. In Proceedings of the CVPR, Macao, China, 4–8 December 2022. [Google Scholar]
- OpenDroneMap. Open Drone Map. Available online: https://www.opendronemap.org/ (accessed on 8 May 2024).
- DJI. DJI MAVIC PRO PLATINUM. Available online: https://www.dji.com/mx/support/product/mavic-pro-platinum (accessed on 8 May 2024).
- Smith, D.; Heidemann, H.K. New Standard for New Era: Overview of the 2015 ASPRS Positional Accuracy Standards for Digital Geospatial Data. Photogramm. Eng. Remote Sens. 2015, 81, 173–176. [Google Scholar]
- Whitehead, K.; Hugenholtz, C.H. Applying ASPRS Accuracy Standards to Surveys from Small Unmanned Aircraft Systems (UAS). Photogramm. Eng. Remote Sens. 2015, 81, 787–793. [Google Scholar] [CrossRef]
- Adorjan, M. OpenSfM A collaborative Structure-from-Motion System. Ph.D. Thesis, Technische Universität Wien, Wien, Austria, 2016. [Google Scholar]
- Agarwal, S.; Furukawa, Y.; Snavely, N.; Simon, I.; Curless, B.; Seitz, S.M.; Szeliski, R. Building Rome in a day. Commun. ACM 2011, 54, 105–112. [Google Scholar] [CrossRef]
- Meza, J.; Marrugo, A.G.; Sierra, E.; Guerrero, M.; Meneses, J.; Romero, L.A. A Structure-from-Motion Pipeline for Topographic Reconstructions Using Unmanned Aerial Vehicles and Open Source Software. In Communications in Computer and Information Science; Springer: Berlin/Heidelberg, Germany, 2018; Volume 885, pp. 213–225. [Google Scholar] [CrossRef]
- Kazhdan, M.; Bolitho, M.; Hoppe, H. Poisson Surface Reconstruction. In Proceedings of the Fourth Eurographics Symposium on Geometry Processing (SGP’06), Goslar, Germany, 26–28 June 2006; pp. 61–70. [Google Scholar]
- European Petroleum Survey Group. EPSG:4326 WGS 84; Available online: https://epsg.io/4326 (accessed on 8 May 2024).
- Harvey, P. libimage-exiftool-perl. Available online: https://packages.ubuntu.com/search?keywords=libimage-exiftool-perl (accessed on 8 May 2024).
- Chand, S.; Bollard, B. Low altitude spatial assessment and monitoring of intertidal seagrass meadows beyond the visible spectrum using a remotely piloted aircraft system. Estuar. Coast. Shelf Sci. 2021, 255, 107299. [Google Scholar] [CrossRef]
- Iheaturu, C.; Okolie, C.; Ayodele, E.; Egogo-Stanley, A.; Musa, S.; Ifejika Speranza, C. A simplified structure-from-motion photogrammetry approach for urban development analysis. Remote Sens. Appl. Soc. Environ. 2022, 28, 100850. [Google Scholar] [CrossRef]
- Vautherin, J.; Rutishauser, S.; Schneider-Zapp, K.; Choi, H.F.; Chovancova, V.; Glass, A.; Strecha, C. Photogrammetric Accuracy and Modeling of Rolling Shutter Cameras. ISPRS Ann. Photogramm. Remote Sens. Spat. Inf. Sci. 2016, III-3, 139–146. [Google Scholar] [CrossRef]
- Page, M.T.; Perotto-Baldivieso, H.L.; Ortega-S, J.A.; Tanner, E.P.; Angerer, J.P.; Combs, R.C.; Camacho, A.M.; Ramirez, M.; Cavazos, V.; Carroll, H.; et al. Evaluating Mesquite Distribution Using Unpiloted Aerial Vehicles and Satellite Imagery. Rangel. Ecol. Manag. 2022, 83, 91–101. [Google Scholar] [CrossRef]
- Varbla, S.; Ellmann, A.; Puust, R. Centimetre-range deformations of built environment revealed by drone-based photogrammetry. Autom. Constr. 2021, 128, 103787. [Google Scholar] [CrossRef]
- EPSG. EPSG:32614 WGS 84/UTM zone 14N. Available online: https://epsg.io/32614 (accessed on 8 May 2024).
- PROJ. pyproj. Available online: https://pypi.org/project/pyproj/ (accessed on 8 May 2024).
- DroneDeploy. Drones in Agriculture: The Ultimate Guide to Putting Your Drone to Work on the Farm. In DroneDeploy eBook; Tradepub: Campbell, CA, USA, 2018; pp. 1–26. [Google Scholar]
- DJI. DJI Agras T10. Available online: https://www.dji.com/mx/t10 (accessed on 8 May 2024).
- Stereolabs. Zed 2. Available online: https://www.stereolabs.com/products/zed-2 (accessed on 8 May 2024).
- NVIDIA. Jetson Nano. Available online: https://www.nvidia.com/es-la/autonomous-machines/embedded-systems/jetson-nano/product-development/ (accessed on 8 May 2024).
- Bankert, A.R.; Strasser, E.H.; Burch, C.G.; Correll, M.D. An open-source approach to characterizing Chihuahuan Desert vegetation communities using object-based image analysis. J. Arid Environ. 2021, 188, 104383. [Google Scholar] [CrossRef]
- Bossoukpe, M.; Faye, E.; Ndiaye, O.; Diatta, S.; Diatta, O.; Diouf, A.; Dendoncker, M.; Assouma, M.; Taugourdeau, S. Low-cost drones help measure tree characteristics in the Sahelian savanna. J. Arid Environ. 2021, 187, 104449. [Google Scholar] [CrossRef]
- Camarillo-Peñaranda, J.R.; Saavedra-Montes, A.J.; Ramos-Paja, C.A. Recomendaciones para Seleccionar Índices para la Validación de Modelos. Ph.D. Thesis, Universidad Nacional de Colombia, Bogotá, Colombia, 2013. [Google Scholar] [CrossRef]
- Martínez-Carricondo, P.; Agüera-Vega, F.; Carvajal-Ramírez, F.; Mesas-Carrascosa, F.J.; García-Ferrer, A.; Pérez-Porras, F.J. Assessment of UAV-photogrammetric mapping accuracy based on variation of ground control points. Int. J. Appl. Earth Obs. Geoinf. 2018, 72, 1–10. [Google Scholar] [CrossRef]
- Negrón Baez, P.A. Redes Neuronales Sigmoidal Con Algoritmo Lm Para Pronostico De Tendencia Del Precio De Las Acciones Del Ipsa; Technical Report; Pontificia Universidad Católica de Valparaíso: Valparaíso, Chile, 2014. [Google Scholar]
- AMAZON and DIGITALGLOBE. ACCURACY OF WORLDVIEW PRODUCTS. Available online: https://dg-cms-uploads-production.s3.amazonaws.com/uploads/document/file/38/DG_ACCURACY_WP_V3.pdf/ (accessed on 8 May 2024).
- Docker. Docker. Available online: https://www.docker.com/ (accessed on 8 May 2024).
- Kaehler, A.; Bradski, G. OpenCV 3; O’Reilly Media: Sebastopol, CA, USA, 2017; pp. 32–35. [Google Scholar]
- Ubuntu. Ubuntu, 2020. Ubuntu. Available online: https://ubuntu.com/ (accessed on 8 May 2024).
- Specht, M.; Szostak, B.; Lewicka, O.; Stateczny, A.; Specht, C. Method for determining of shallow water depths based on data recorded by UAV/USV vehicles and processed using the SVR algorithm. Measurement 2023, 221, 113437. [Google Scholar] [CrossRef]
- Cledat, E.; Jospin, L.; Cucci, D.; Skaloud, J. Mapping quality prediction for RTK/PPK-equipped micro-drones operating in complex natural environment. ISPRS J. Photogramm. Remote Sens. 2020, 167, 24–38. [Google Scholar] [CrossRef]
- Gao, K.; Aliakbarpour, H.; Fraser, J.; Nouduri, K.; Bunyak, F.; Massaro, R.; Seetharaman, G.; Palaniappan, K. Local Feature Performance Evaluation for Structure-From-Motion and Multi-View Stereo Using Simulated City-Scale Aerial Imagery. IEEE Sens. J. 2021, 21, 11615–11627. [Google Scholar] [CrossRef]
- Jiang, S.; Jiang, C.; Jiang, W. Efficient structure from motion for large-scale UAV images: A review and a comparison of SfM tools. ISPRS J. Photogramm. Remote Sens. 2020, 167, 230–251. [Google Scholar] [CrossRef]
- Liu, X.; Lian, X.; Yang, W.; Wang, F.; Han, Y.; Zhang, Y. Accuracy Assessment of a UAV Direct Georeferencing Method and Impact of the Configuration of Ground Control Points. Drones 2022, 6, 30. [Google Scholar] [CrossRef]
- Techapinyawat, L.; Goulden-Brady, I.; Garcia, H.; Zhang, H. Aerial characterization of surface depressions in urban watersheds. J. Hydrol. 2023, 625, 129954. [Google Scholar] [CrossRef]
- Awasthi, B.; Karki, S.; Regmi, P.; Dhami, D.S.; Thapa, S.; Panday, U.S. Analyzing the Effect of Distribution Pattern and Number of GCPs on Overall Accuracy of UAV Photogrammetric Results. In Lecture Notes in Civil Engineering; Springer: Berlin/Heidelberg, Germany, 2020; Volume 51, pp. 339–354. [Google Scholar] [CrossRef]
- Adar, S.; Sternberg, M.; Argaman, E.; Henkin, Z.; Dovrat, G.; Zaady, E.; Paz-Kagan, T. Testing a novel pasture quality index using remote sensing tools in semiarid and Mediterranean grasslands. Agric. Ecosyst. Environ. 2023, 357, 108674. [Google Scholar] [CrossRef]
- Elkhrachy, I. Accuracy Assessment of Low-Cost Unmanned Aerial Vehicle (UAV) Photogrammetry. Alex. Eng. J. 2021, 60, 5579–5590. [Google Scholar] [CrossRef]
- Gillins, D.T.; Kerr, D.; Weaver, B. Evaluation of the Online Positioning User Service for Processing Static GPS Surveys: OPUS-Projects, OPUS-S, OPUS-Net, and OPUS-RS. J. Surv. Eng. 2019, 145, 05019002. [Google Scholar] [CrossRef]
Disclaimer/Publisher’s Note: The statements, opinions and data contained in all publications are solely those of the individual author(s) and contributor(s) and not of MDPI and/or the editor(s). MDPI and/or the editor(s) disclaim responsibility for any injury to people or property resulting from any ideas, methods, instructions or products referred to in the content. |
© 2024 by the authors. Licensee MDPI, Basel, Switzerland. This article is an open access article distributed under the terms and conditions of the Creative Commons Attribution (CC BY) license (https://creativecommons.org/licenses/by/4.0/).