1. Introduction
The initial human flight dreams originated from the imitation of flying creatures in nature, such as birds and insects. Humans have long had a fascination with the flight of living organisms and have made numerous attempts to replicate it. Extensive research has shown that birds possess exceptional maneuverability and energy efficiency [
1,
2,
3,
4,
5,
6,
7,
8,
9]. Bio-inspired flight vehicles typically operate at Reynolds numbers below 10
5, where fixed-wing and rotary-wing aircraft exhibit lower flight efficiency. In contrast, bio-inspired flight vehicles generate high lift and thrust through wing flapping [
10,
11], offering wide-ranging applications in military and civilian sectors [
12,
13,
14,
15,
16].
In recent years, flapping-wing aircraft have attracted increasing attention and research. Nguyen et al. [
17] designed a tailless flapping wing micro air vehicle (NUS-Roboticbird). Currently, the aircraft weighs 31 g and has a wingspan of 22 cm. It is capable of flying rapidly forward at a speed of approximately 5 m/s and can sustain flight for 3.5 min with a payload of a 4.5 g onboard camera. The flight speed of the RoboBee, a bee-inspired flapping-wing aircraft developed by Harvard University in the United States, is about 1 m/s, while the flight speed of bees in nature is approximately 6 m/s [
18]. The Nano Hummingbird, a hummingbird-inspired flapping-wing aircraft developed by AeroVironment in the United States, has a flight speed of 4.7 m/s, whereas the actual flight speed of hummingbirds is around 8.3 m/s [
19]. The SmartBird, a seagull-inspired flapping-wing aircraft developed by Festo in Germany, achieves a flight speed of 7 m/s, while the real seagull’s flight speed is approximately 14 m/s [
18]. The “Dove”, a pigeon-inspired flapping-wing aircraft developed by Northwestern Polytechnical University in China, has a flight speed of 10 m/s, whereas the actual flight speed of pigeons is around 16 m/s [
18]. The differences in flight speeds between these typical bio-inspired flapping-wing aircraft and real-life organisms are summarized in
Table 1. These bio-inspired flapping-wing aircraft are developed based on the characteristics of organisms in the natural world. However, they share a common characteristic, which is that the flight speed of bio-inspired aircraft differs from that of real organisms.
According to
Table 1, it can be observed that the current flight speeds of flapping-wing aircraft are generally lower than those of birds of similar size. This makes them easily detectable and reduces the inherent bio-inspired camouflage and deception of these aircraft. Additionally, low flight speeds in flapping-wing aircraft can lead to the following drawbacks:
Low mission efficiency: Flapping-wing aircraft typically have lower mission efficiency during low-speed flight. This is because, at low speeds, the distance covered by the aircraft per unit of time is relatively small, resulting in lower mission efficiency.
Weak wind resistance: Flapping-wing aircraft exhibit weaker resistance to wind during low-speed flight. If the flight speed of a flapping-wing aircraft is low and it has a small inertia, it becomes more susceptible to disturbances from gusts or crosswinds in the atmospheric environment. This can cause the aircraft to deviate from its intended trajectory or even disrupt normal flight, limiting the application of flapping-wing aircraft in complex environments and adverse weather conditions.
Therefore, in order to improve the mission efficiency, wind resistance, and bio-inspired camouflage of bio-inspired flapping-wing aircraft, it is important to develop aircraft that can achieve higher speeds or speeds closer to those of real birds.
Currently, in order to improve the speed of bio-inspired flapping wing aircraft, most researchers focus on optimizing the wing design to increase the aircraft’s thrust and, consequently, its flight speed. Li et al. [
20] studied the effect of wing parameters on aerodynamic forces and used an optimized wing design to construct a 30 g flapping wing aircraft, which underwent outdoor flight testing. The aircraft was able to fly for 6.5 min with a payload of 4.5 g. Within a certain range, increasing the flapping frequency will increase the thrust. Shkarayev et al. [
21] investigated the influence of flapping frequency on lift and thrust and found that thrust increases with increasing flapping frequency, while lift shows less significant variation with increasing flapping frequency in the absence of angle of attack. Wu et al. [
22] studied the relationship between passive deformation of flexible wings and generated thrust and found that within a certain range, increasing the flapping frequency leads to nearly linear increase in thrust. The researchers in these studies generally focus on improving the speed and performance of flapping-wing aircraft to achieve more efficient task execution and better biomimetic effects. They explore different design methods, including optimizing wing profiles, increasing flapping frequencies, and enhancing the design of propulsion systems. However, increasing the flapping frequency imposes higher demands on the flapping mechanism. Therefore, this study will focus on investigating methods to improve flight speed by increasing the flapping frequency.
To improve the flight speed of the ornithopter to the level of birds, the first problem to be solved is to ensure that the flapping aircraft’s propulsion system can generate sufficient driving force to obtain the required lift and thrust for fast flight. However, there is currently a lack of systematic research on how to design a flapping propulsion system that possesses rapid forward propulsion capabilities. Moreover, the design improvements need to address issues such as the selection of motors and reducers, as well as the matching of the flapping mechanism with the new motors and reducers.
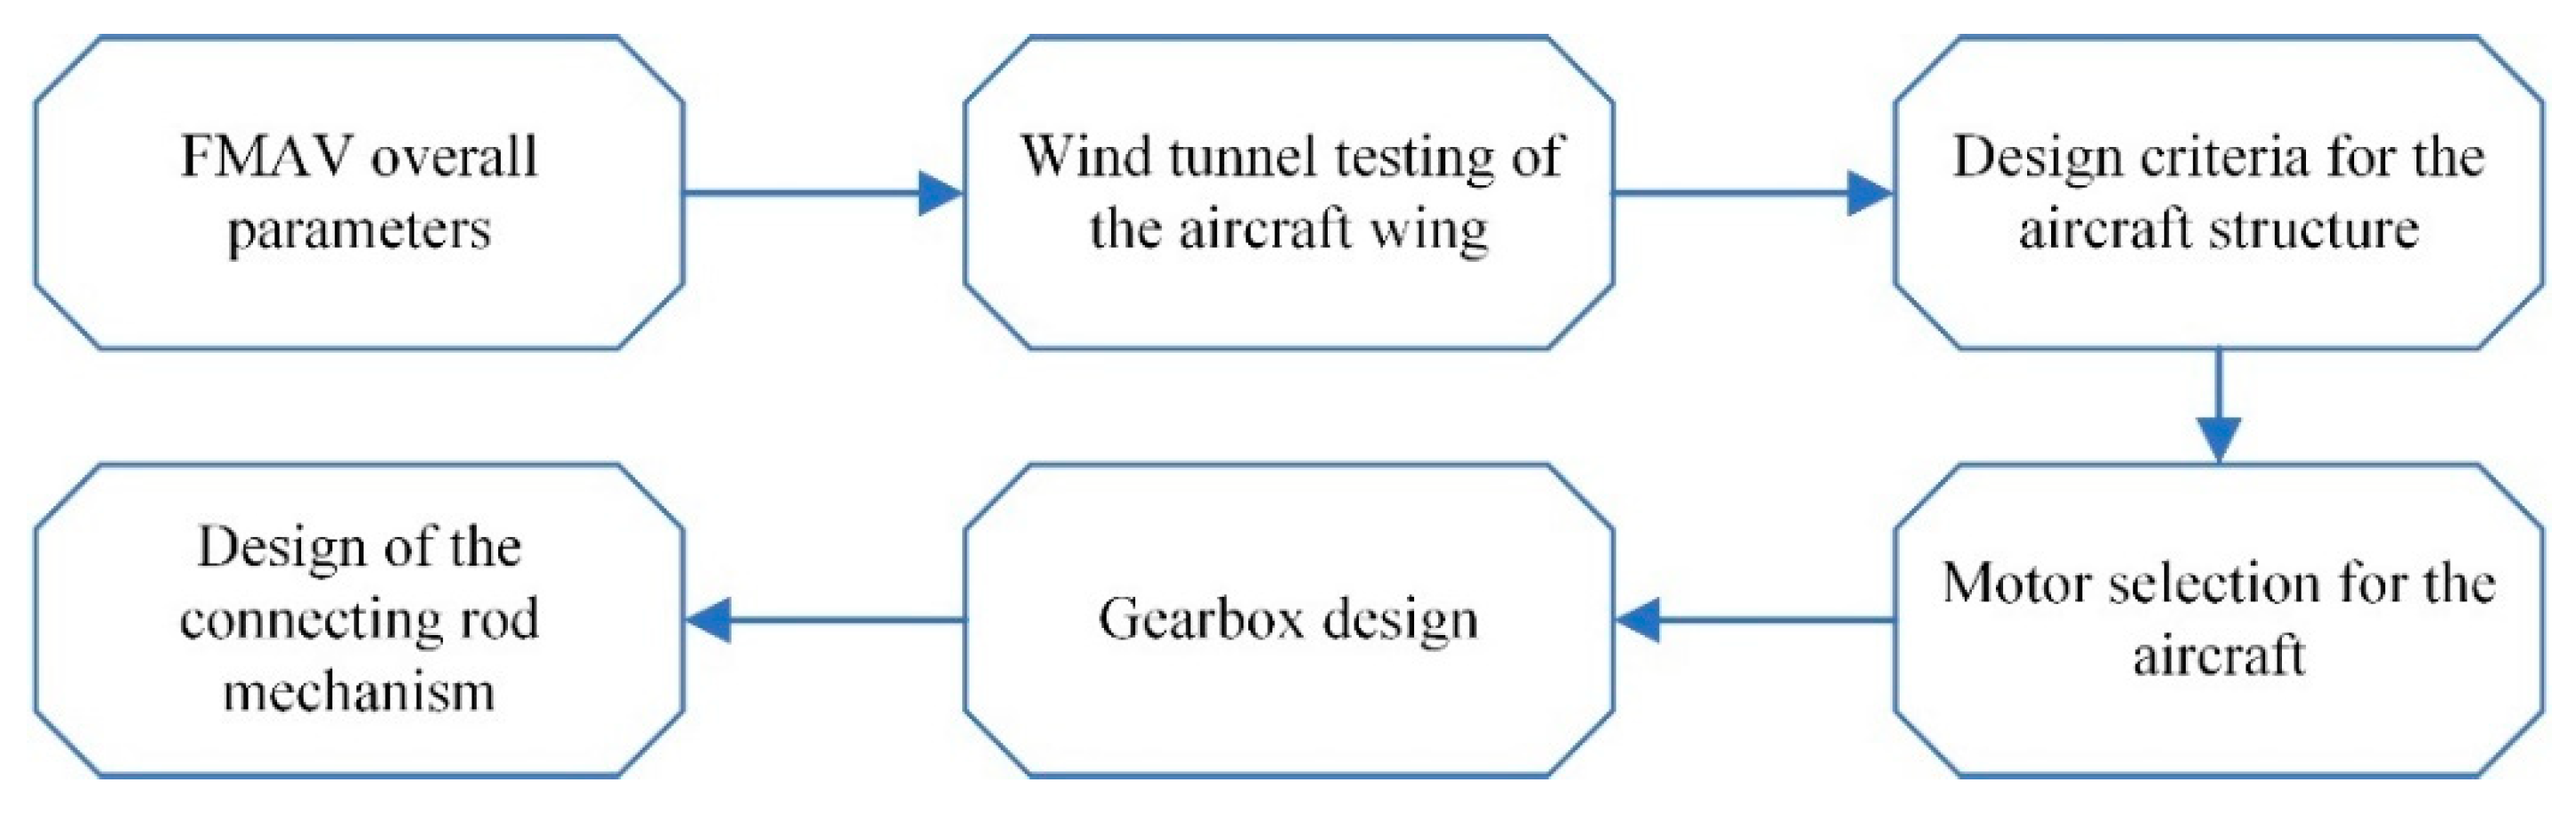
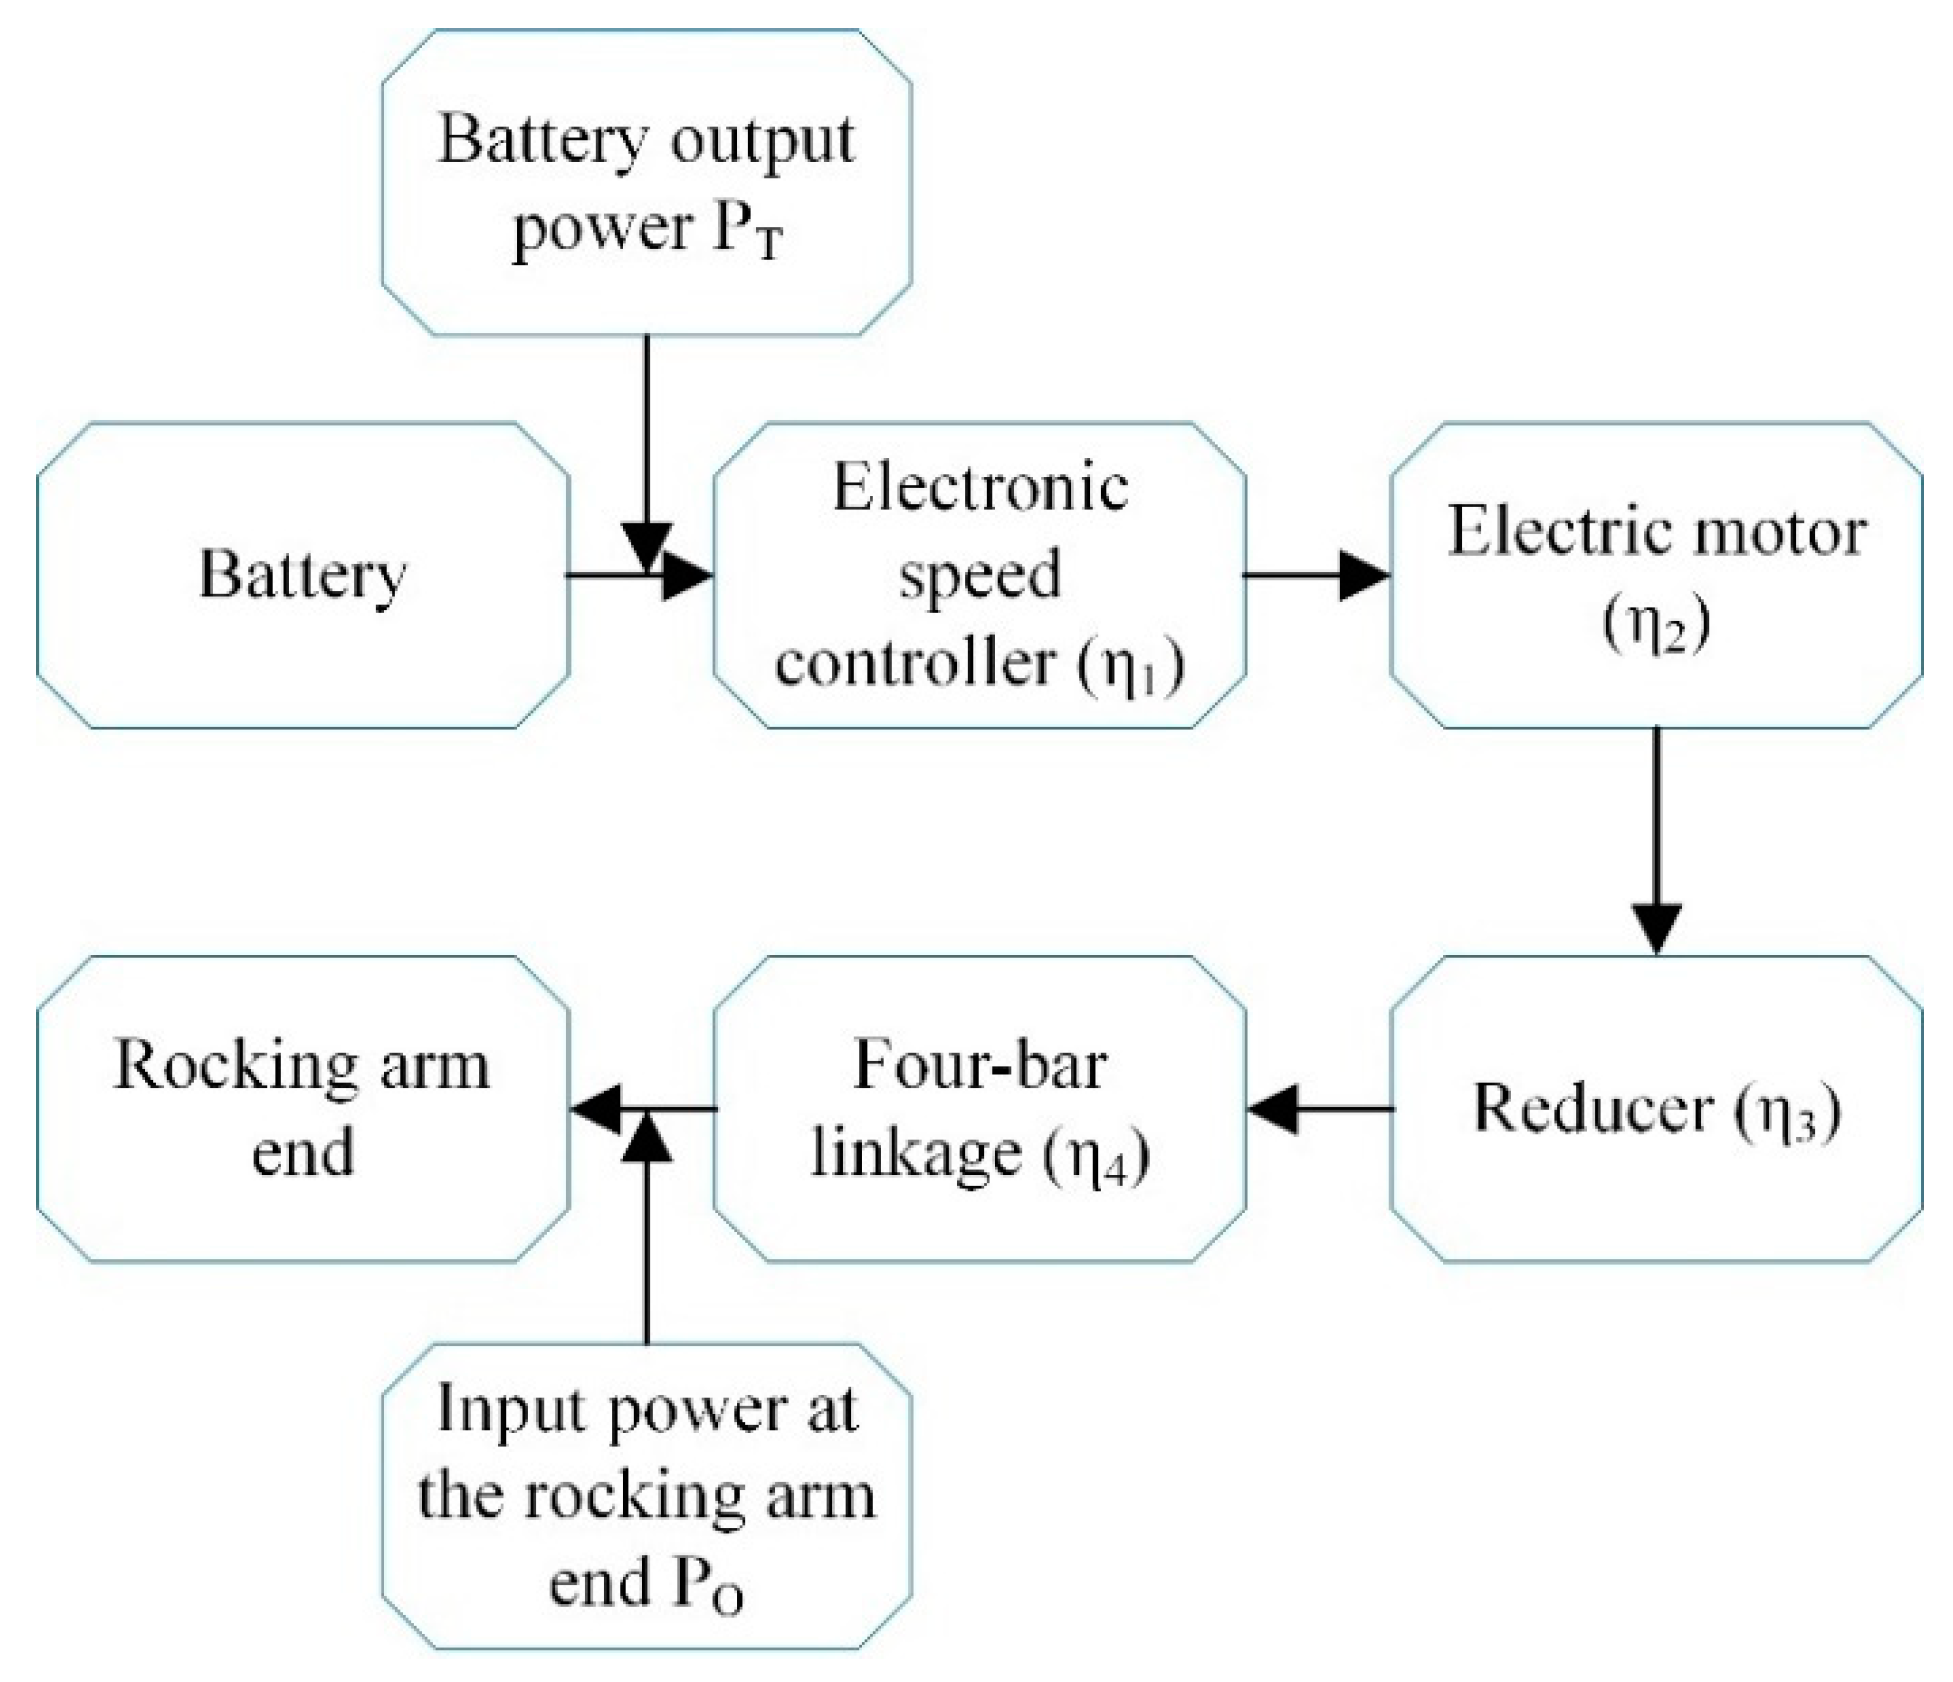
For the same type of mechanism design, in order to meet the requirements for increased speed, a complete drive system needs to be redesigned separately. This will increase the design cost and extend the product development time. Currently, there are not many researchers who have conducted detailed studies on the matching design of various subsystems in the propulsion system. Li et al. [
23] conducted comprehensive research on the design methodology of mechanical transmission flapping mechanisms for conventional motor-driven ornithopters and summarized the general process of mechanical transmission flapping mechanism design, as shown in
Figure 1. Han et al. [
24] introduced the bio-inspired design and manufacturing of small-scale winged micro aerial vehicles. Jones et al. [
25] provided an introduction to the design methods of various subsystems in flapping wing aircraft and successfully designed a flapping wing aircraft weighing as light as 11 g, with a wingspan of 23 cm and a length of 18 cm. This aircraft utilizes a rechargeable battery and can fly for approximately 20 min. Furthermore, it is capable of stable flight at speeds ranging from 2 to 5 m per second. These studies present design methodologies for individual subsystems of flapping-wing aircraft but do not provide detailed discussions on the matching design between these subsystems. Therefore, the main objective of this paper is to propose a set of design methods for improving the propulsion system of flapping aircraft, specifically targeting the need for increased speed. The proposed methods will be validated through wind tunnel experiments and flight tests.
3. Wind Tunnel Experiments the Flight Test Prototype
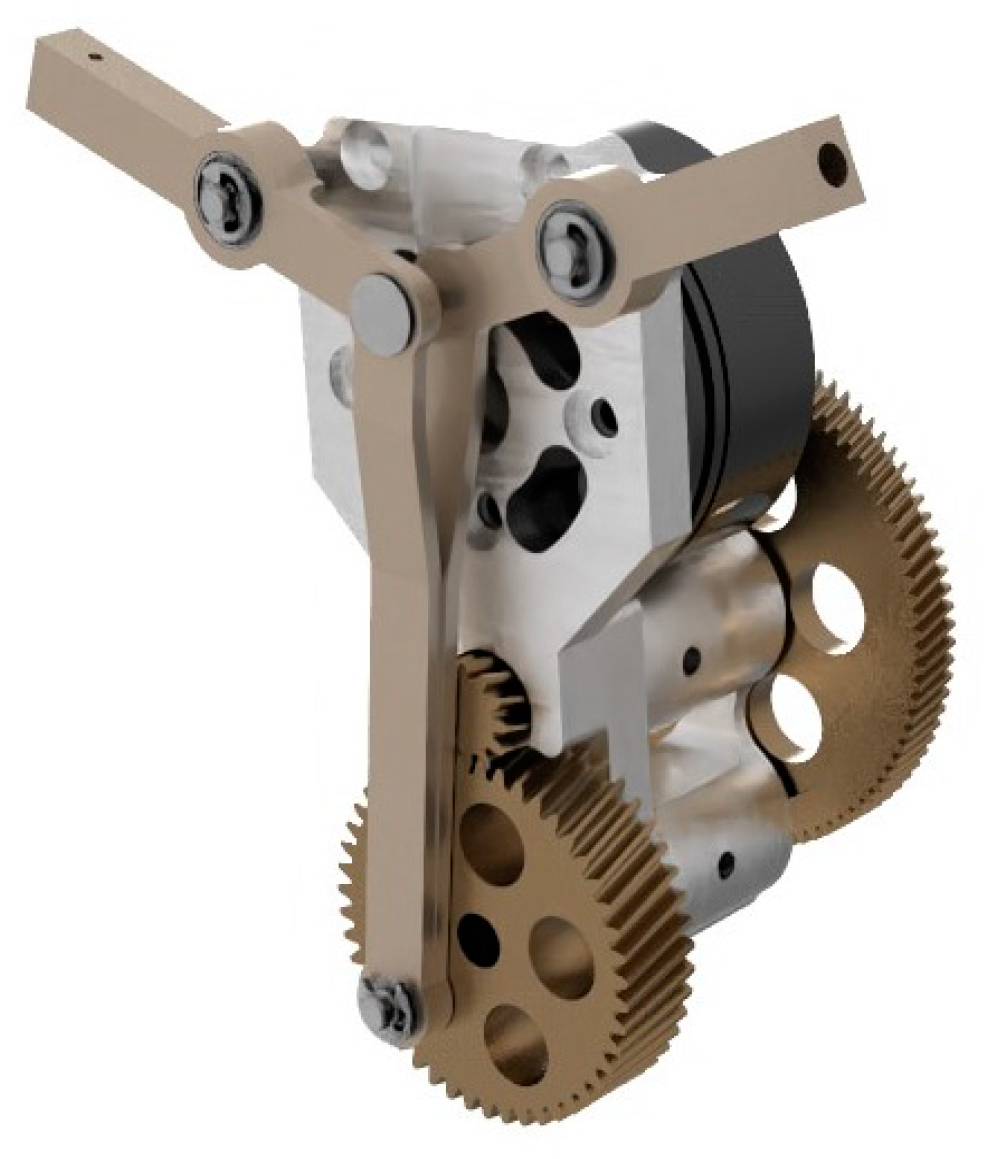
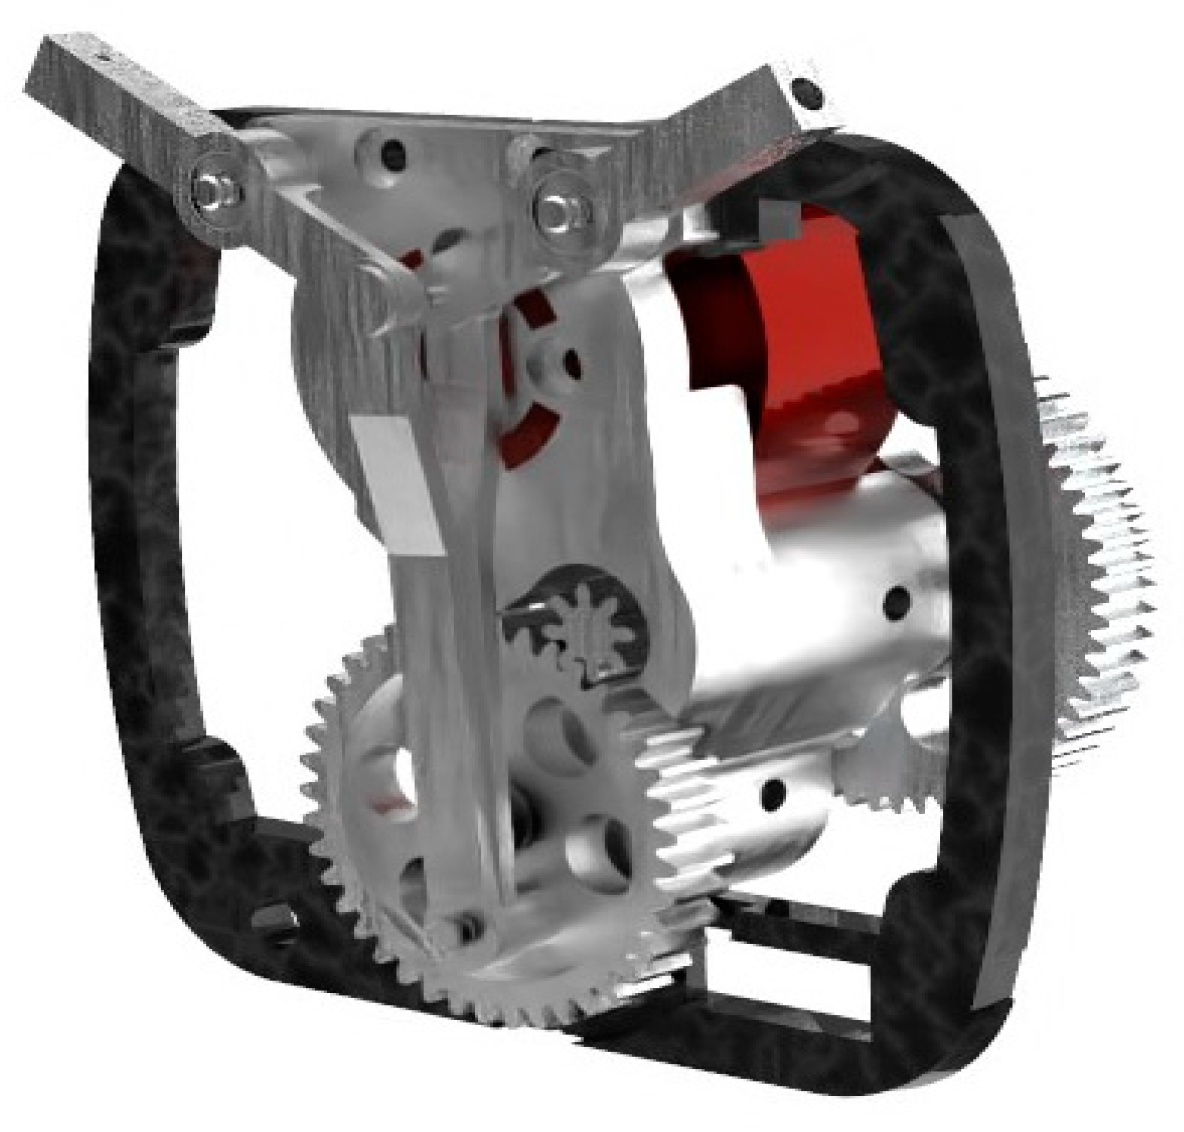
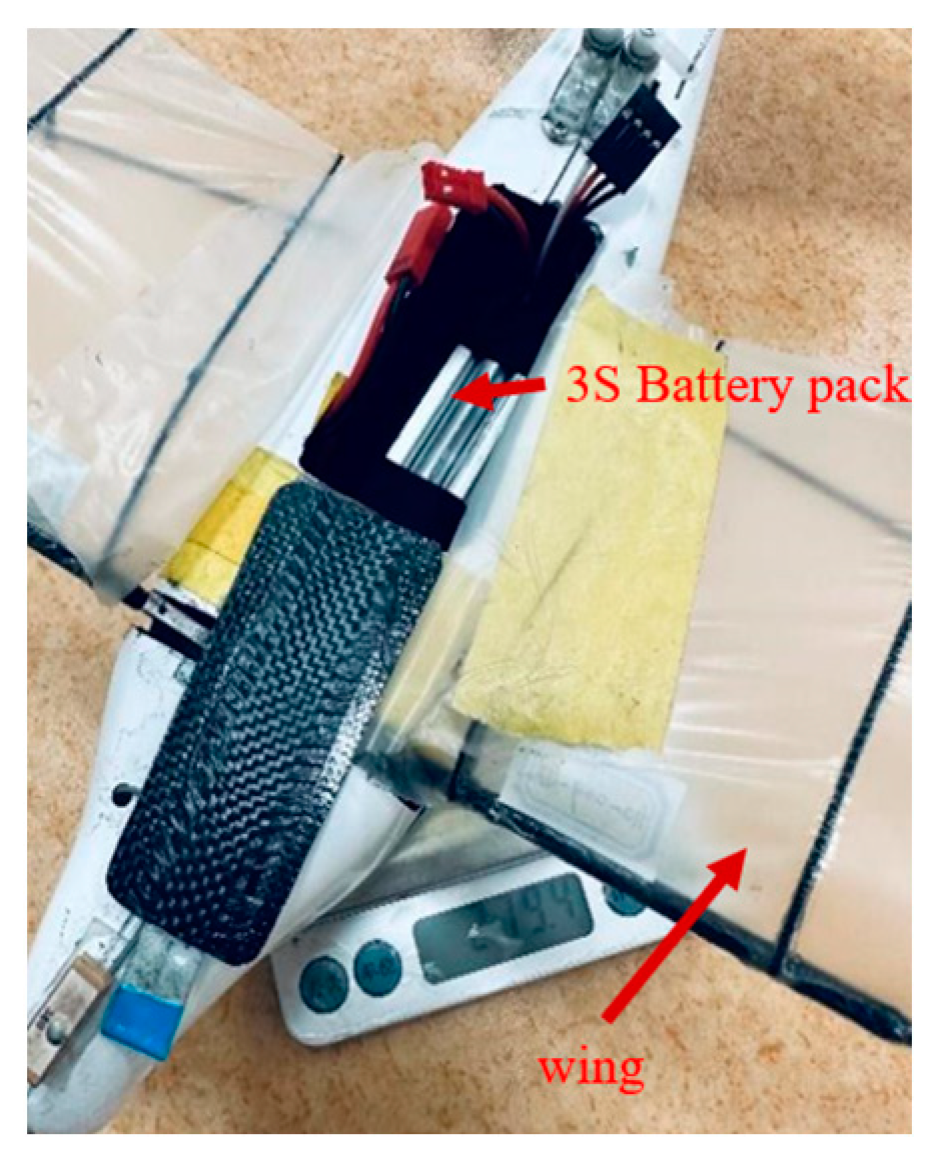
In the second section, the motor and gear ratio were matched and selected, and the new drive system of the flight test prototype is shown in
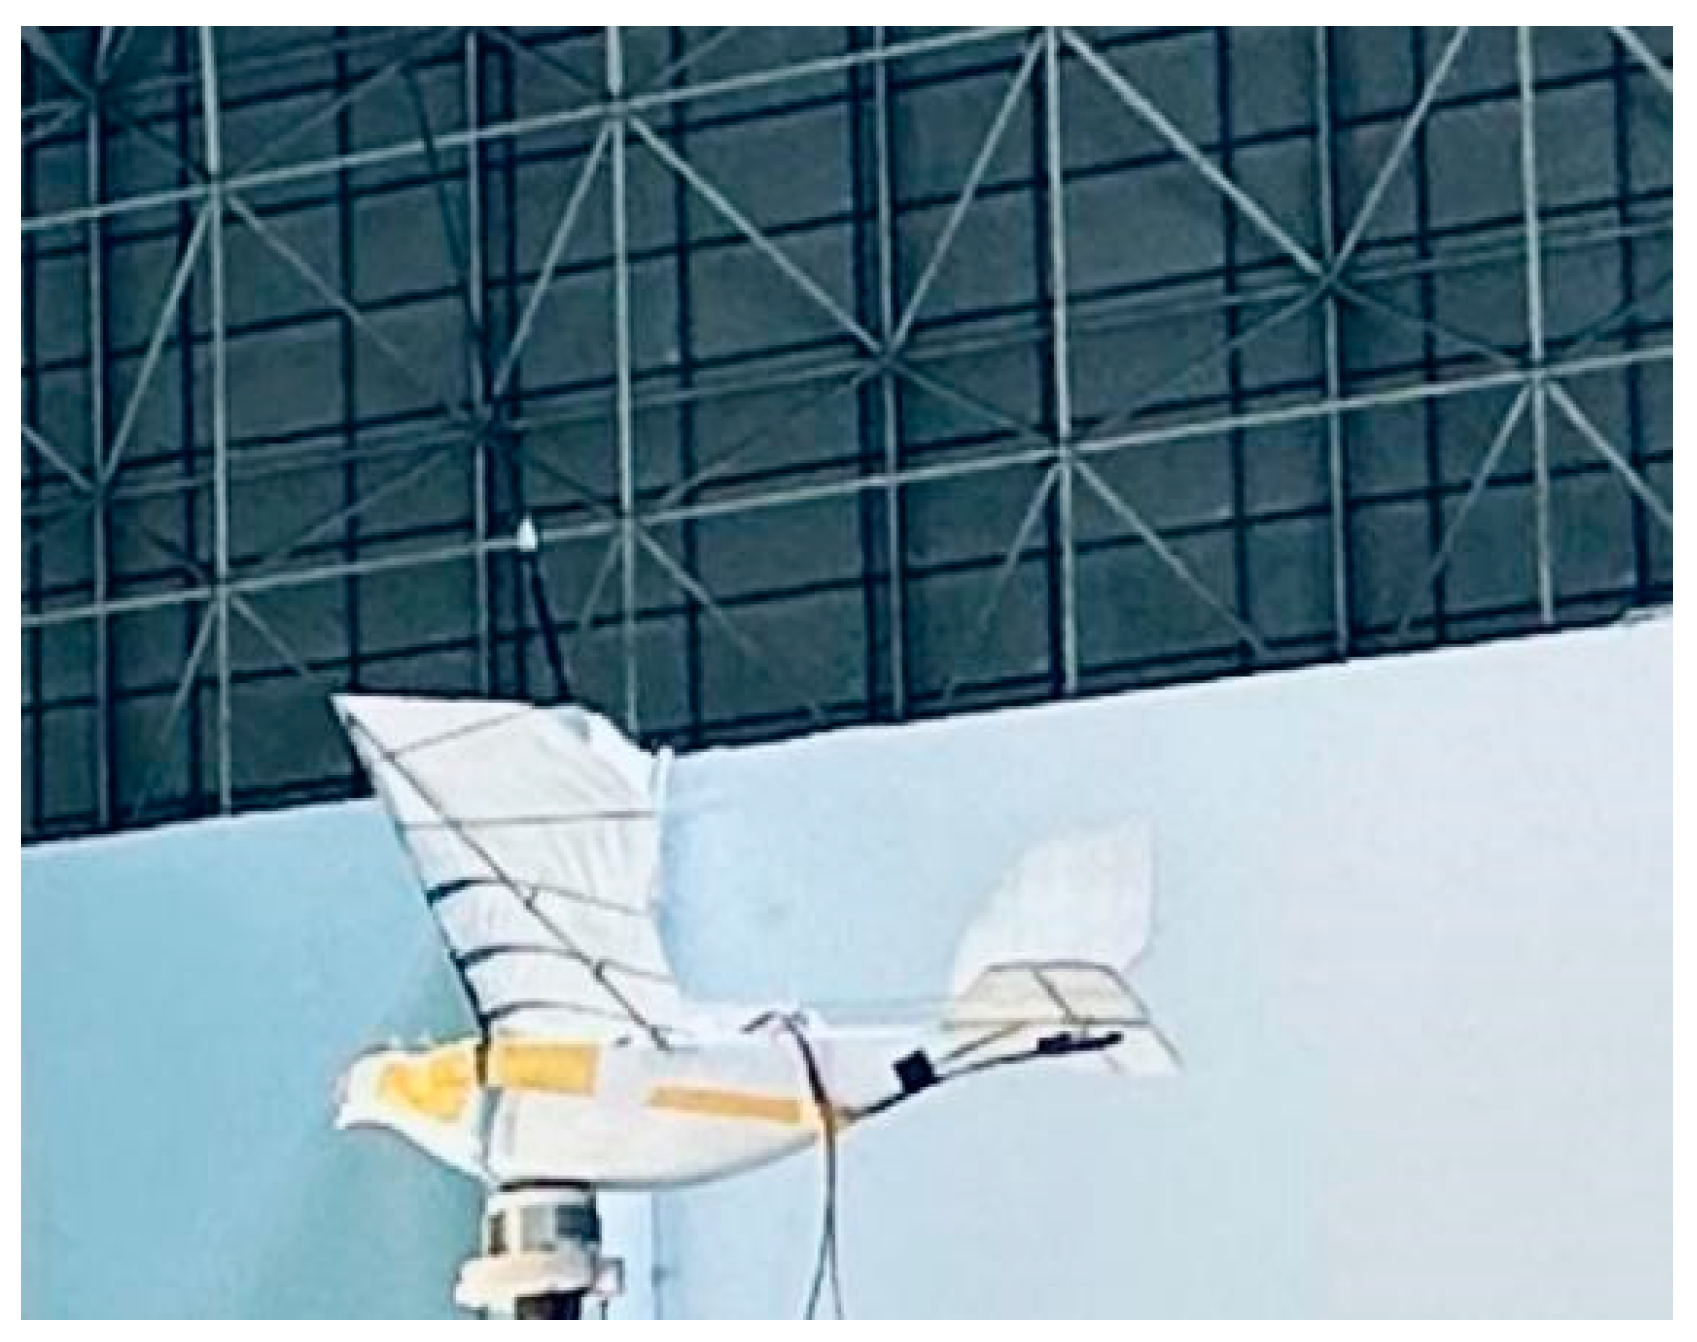
Figure 10. The new drive system is installed on the “Dove” aircraft, with a total weight of 279.4 g, as shown in
Figure 11.
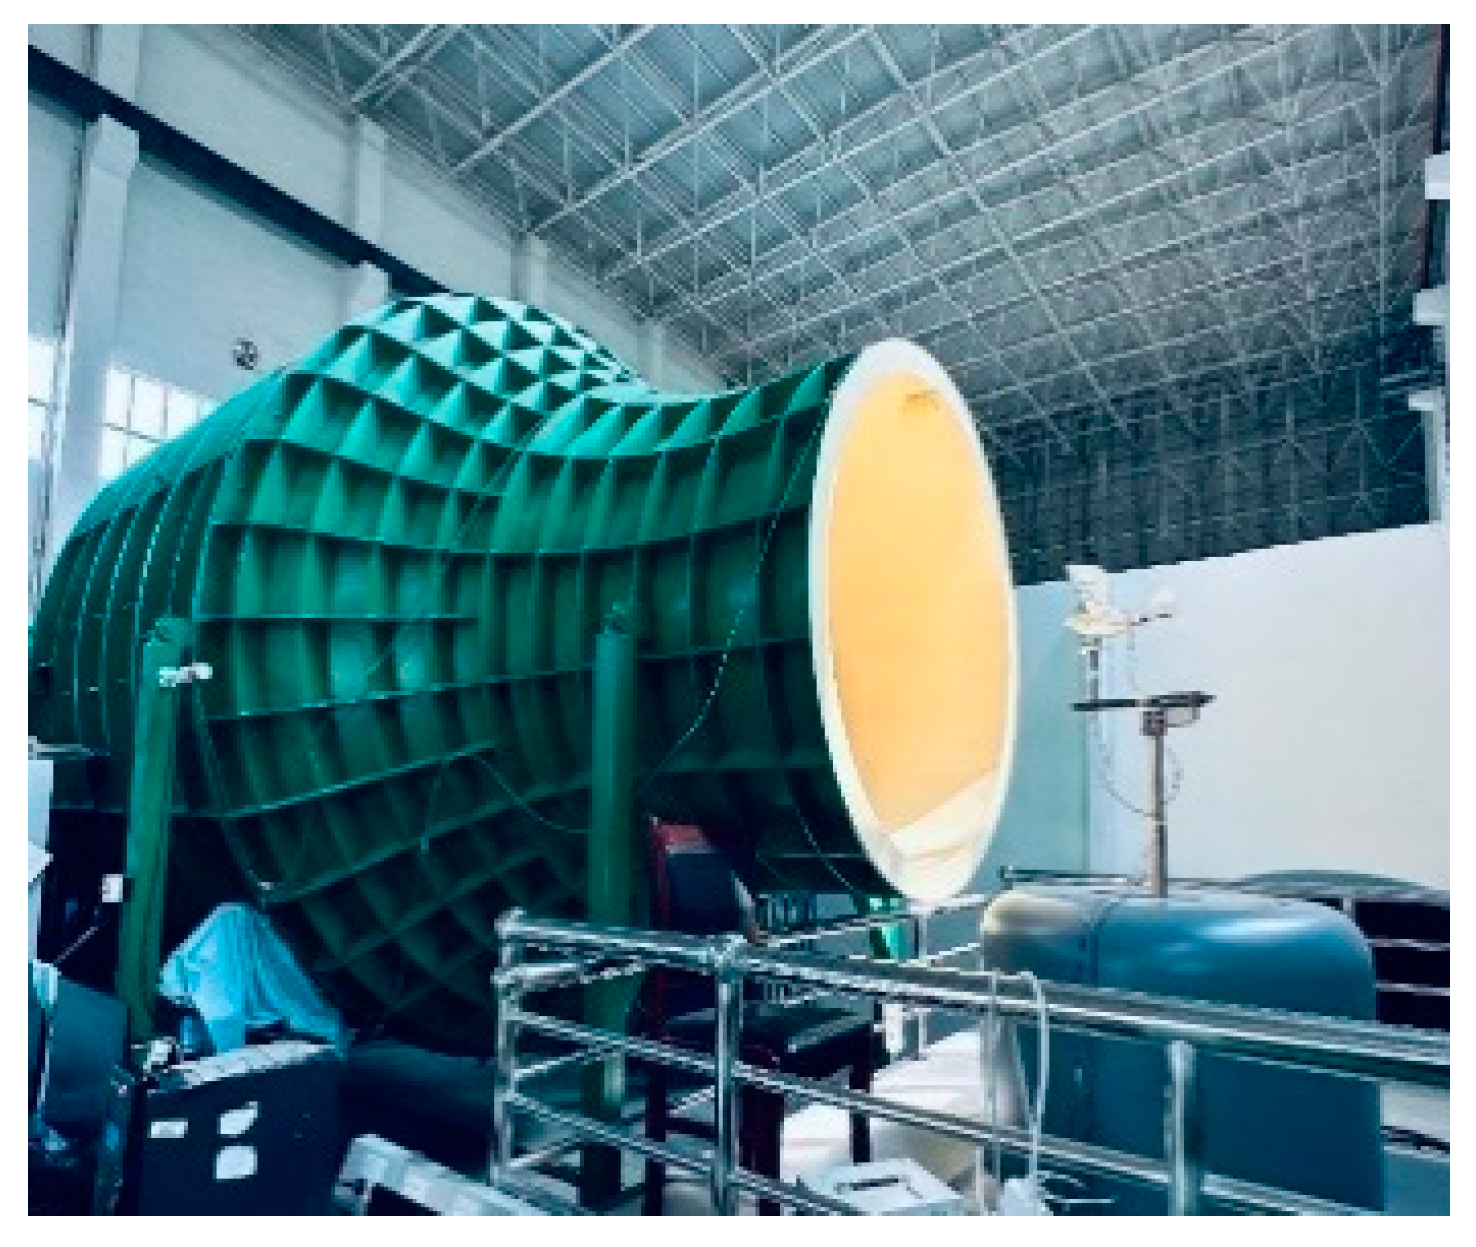
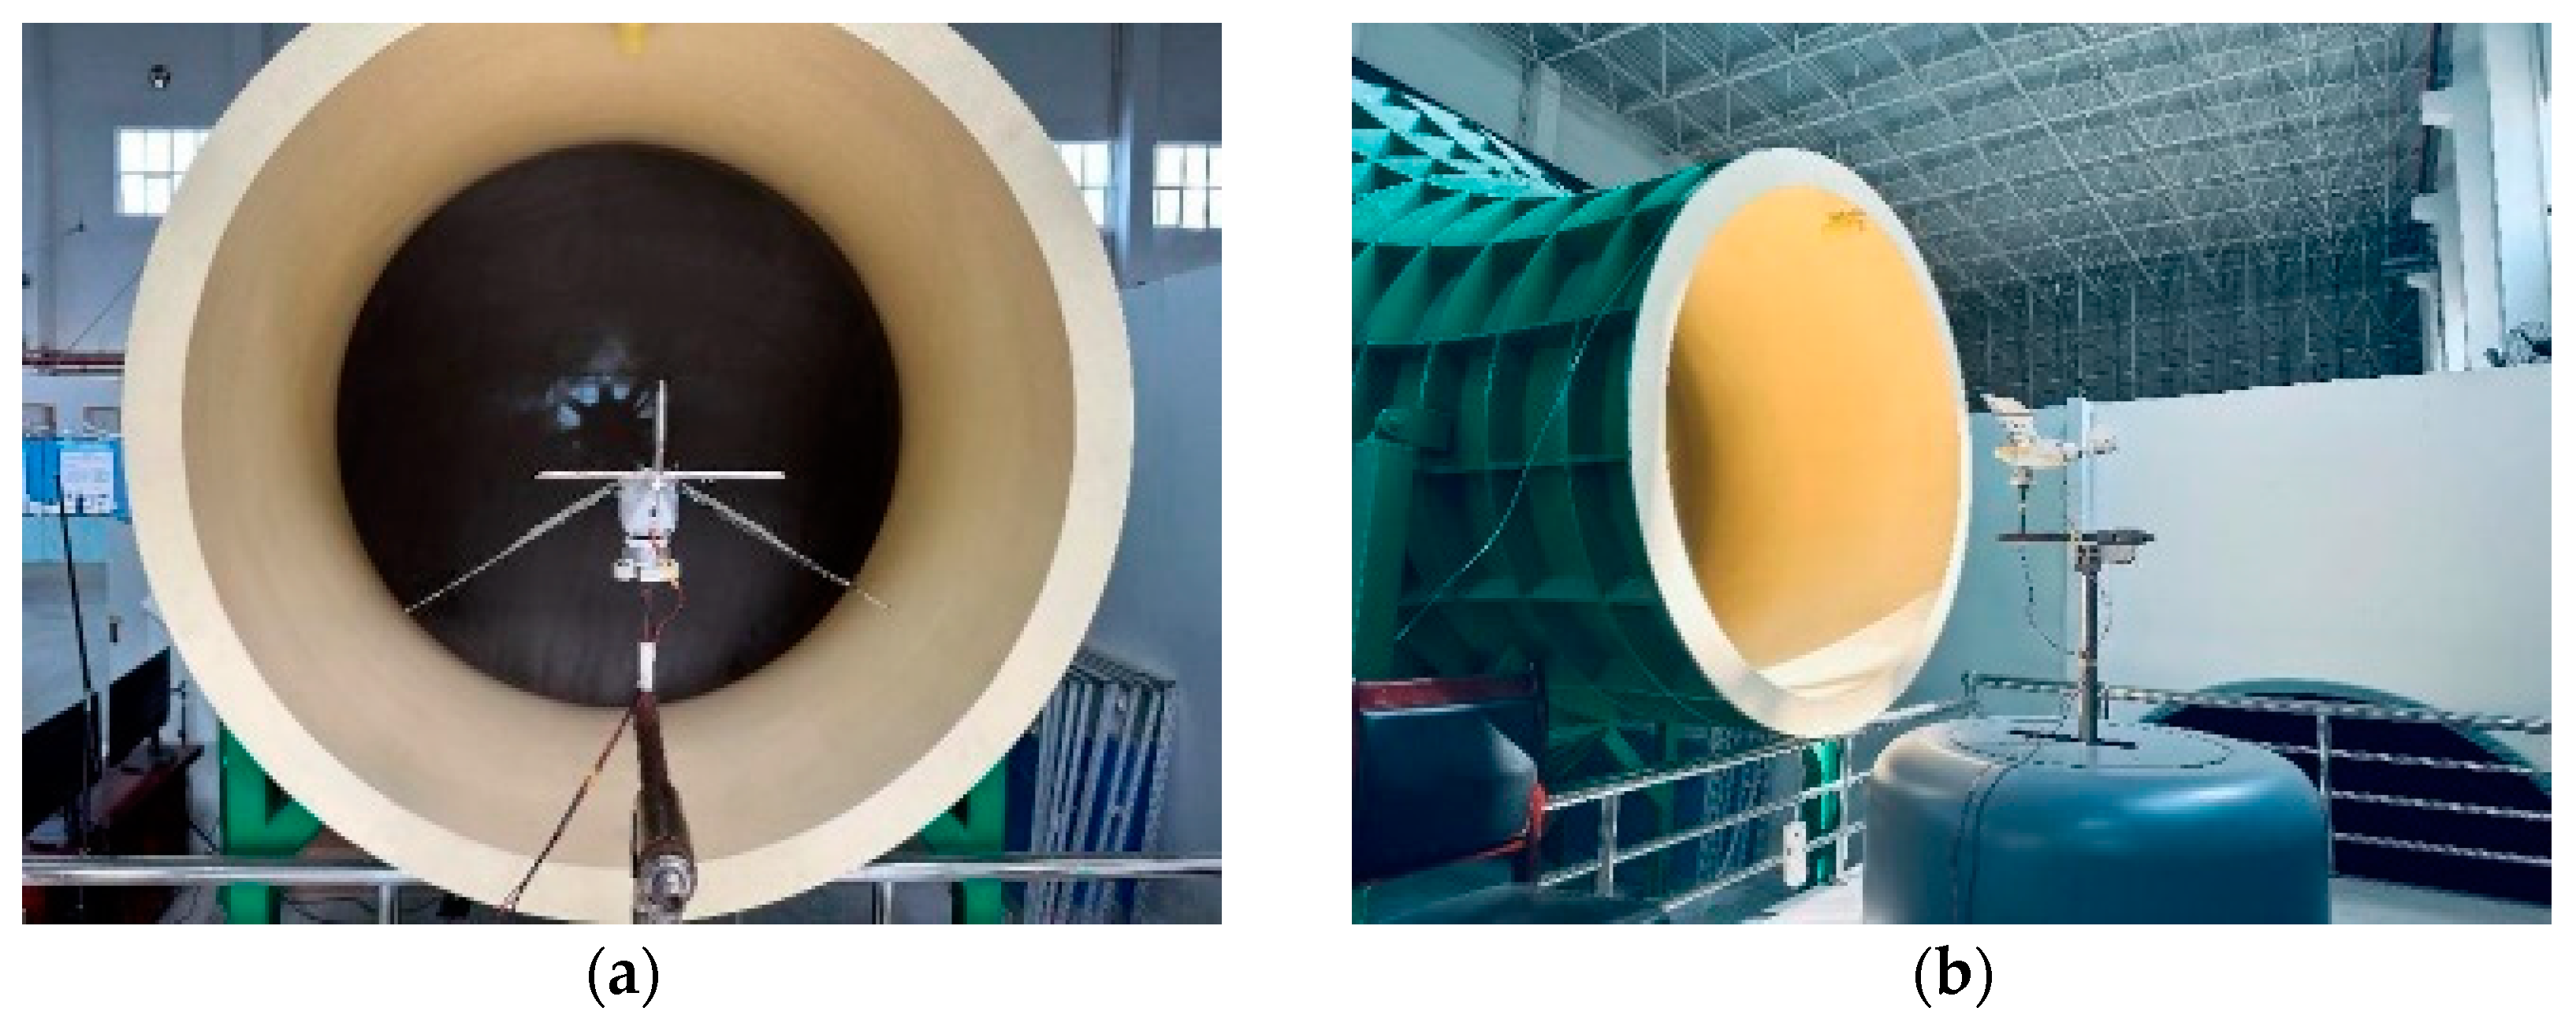
The wind tunnel experimental control system used in this section was specifically developed by the research team for flapping-wing aircraft. The external shape of the wind tunnel is shown in
Figure 12. The wind tunnel adopts a DC open jet configuration, with a test section of circular cross-section with a diameter of 1.6 m. The designed wind speed ranges from 5 m/s to 15 m/s, and the angle of attack can be adjusted from −10° to 20°. The turbulence intensity in the test section is not greater than 0.5%, and the dynamic pressure stability is not greater than 0.5%.
From a macroscopic perspective, the average values of parameters such as lift, thrust, and pitching moment generated by the flight test prototype throughout the entire flapping cycle are crucial for assessing flight performance. However, the data obtained from wind tunnel testing consist of a series of instantaneous values within the flapping cycle. Therefore, when analyzing the flight performance of the test prototype, it is necessary to calculate the average values over the entire sampled flapping cycle. For a discrete set of data over several cycles, the calculation method is as follows:
In the experiment, each sampling duration was 1 s, and a total of 10 samples were taken. By processing the instantaneous forces measured by the balance within 10 s, the time-averaged lift and thrust of the flight test prototype were obtained. The specific method for processing the balance data can be found in the referenced literature [
30,
31].
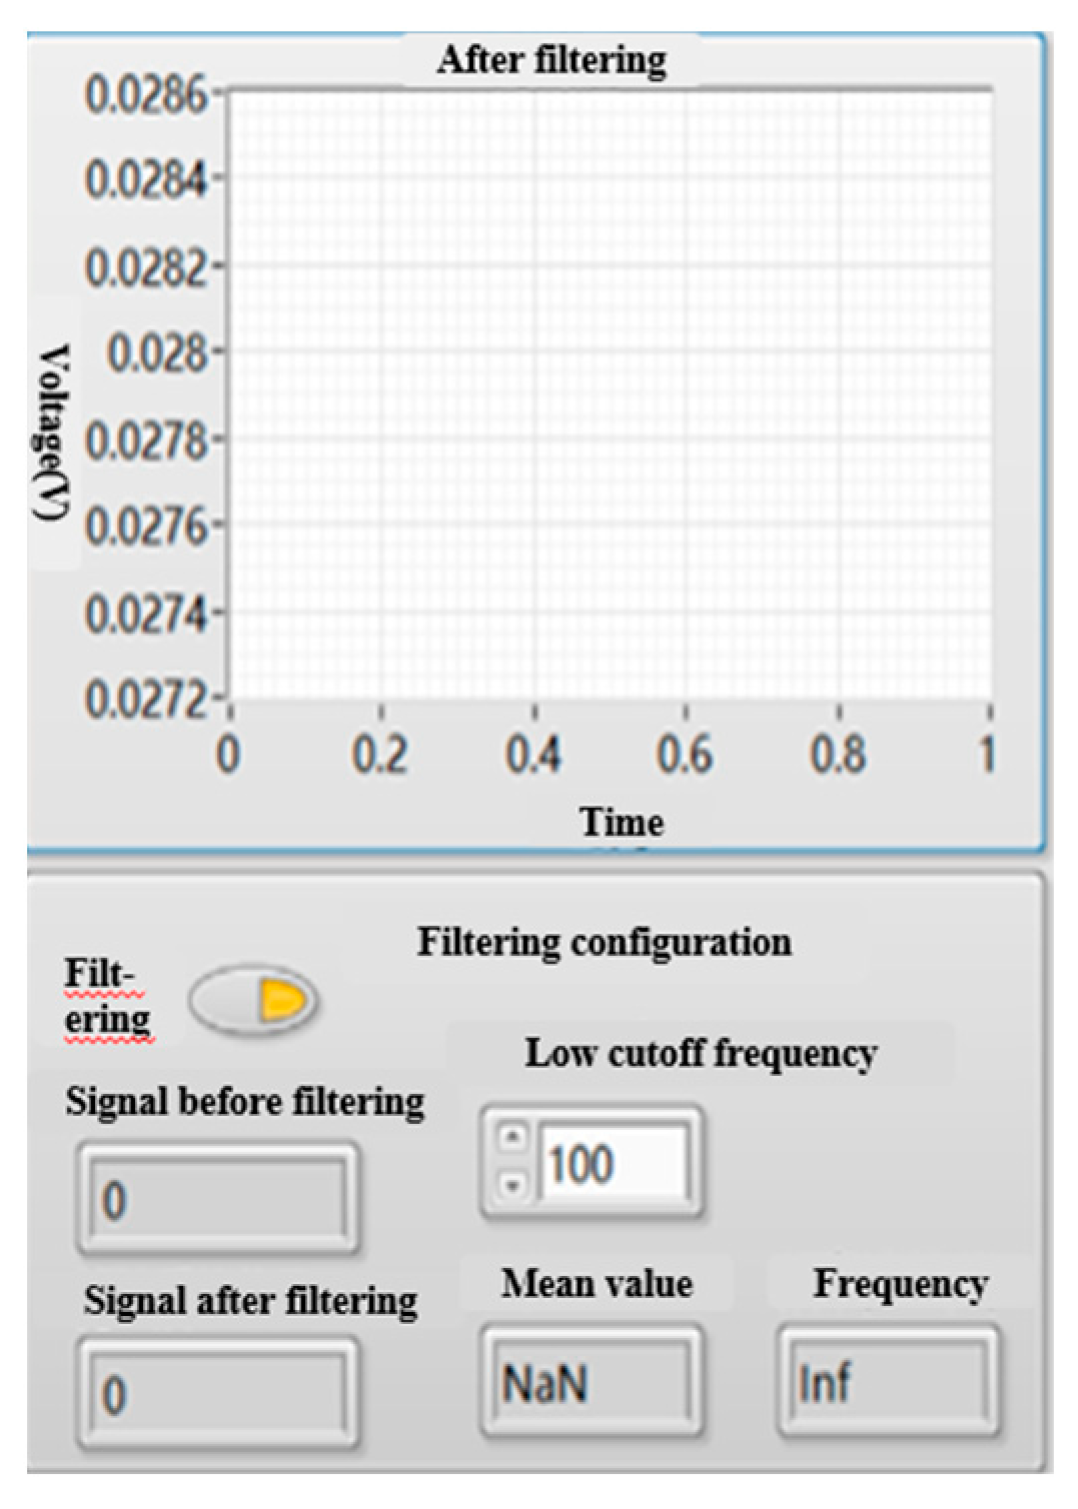
In the wind tunnel experiment, a current sampling system is used to visually display the flapping frequency of the flight test prototype. The interface of the current sampling system is shown in
Figure 13, and the flapping frequency of the flight test prototype can be directly obtained from the current frequency displayed in the bottom right corner.
To further compare the performance differences between the Aeolus 2105.5 motor and the GTS V3 2104 motor on the flight test prototype, wind tunnel load tests were conducted on the flight test prototypes equipped with the GTS V3 2104 motor and the Aeolus 2105.5 motor, as shown in
Figure 14.
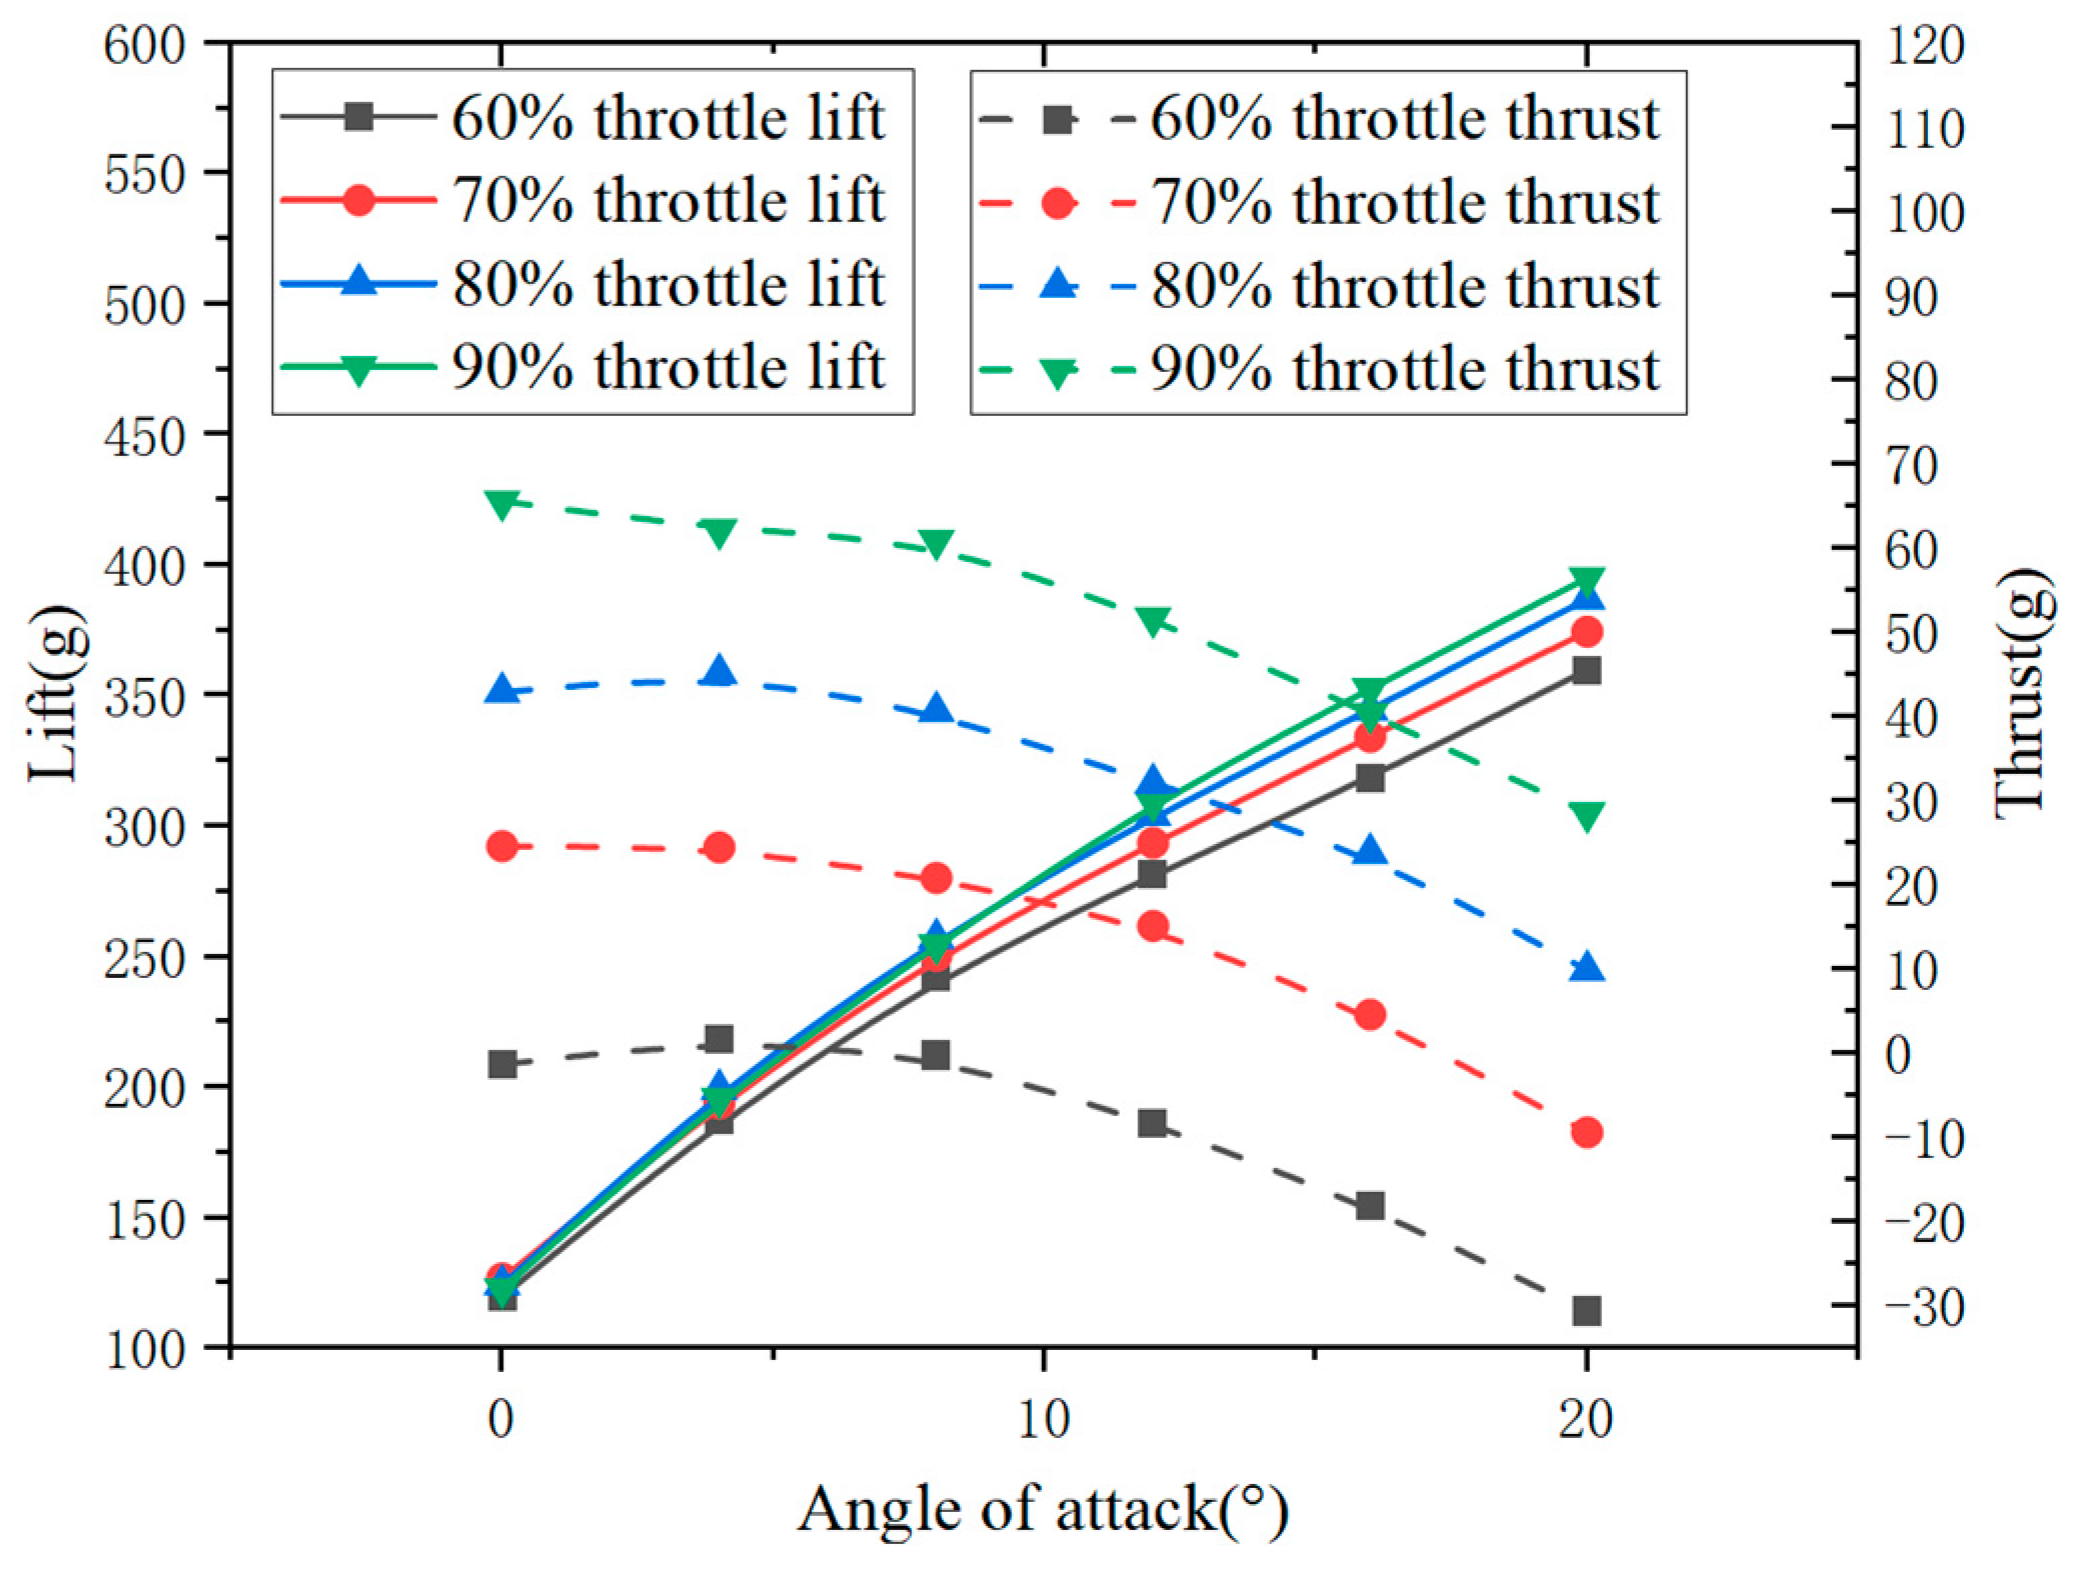
In order to obtain the range of parameters in the wind tunnel experiment, based on the flight test prototype with the GTS V3 2104 motor, the lift and thrust of the flight test prototype were obtained at a wind speed of 10 m/s and angle of attack of 0°, 4°, 8°, 12°, 16°, and 20°, respectively, at throttle settings of 60%, 70%, 80%, and 90%, as shown in
Figure 15.
At a specific throttle setting, the trim state of the aircraft can be determined by analyzing the angle of attack at zero thrust. When the throttle is set to 60%, the angle of attack at zero thrust is 7.3°, and the corresponding lift is 232.5 g. Since the total weight of the flight test prototype is 279.4 g, the aircraft cannot achieve a trim state at a wind speed of 10 m/s and throttle setting of 60%. When the throttle is set to 70%, the angle of attack at zero thrust is 17.5°, and the corresponding lift is 348.3 g. Therefore, at a wind speed of 10 m/s and throttle setting of 70%, the aircraft can achieve a trim state.
In order to obtain the actual flapping frequencies of the flight test prototypes with different motors at different throttle settings, tests were conducted on the flight test prototypes equipped with the Aeolus 2105.5 motor and the GTS V3 2104 motor. The results of the flapping frequency tests are shown in
Table 7.
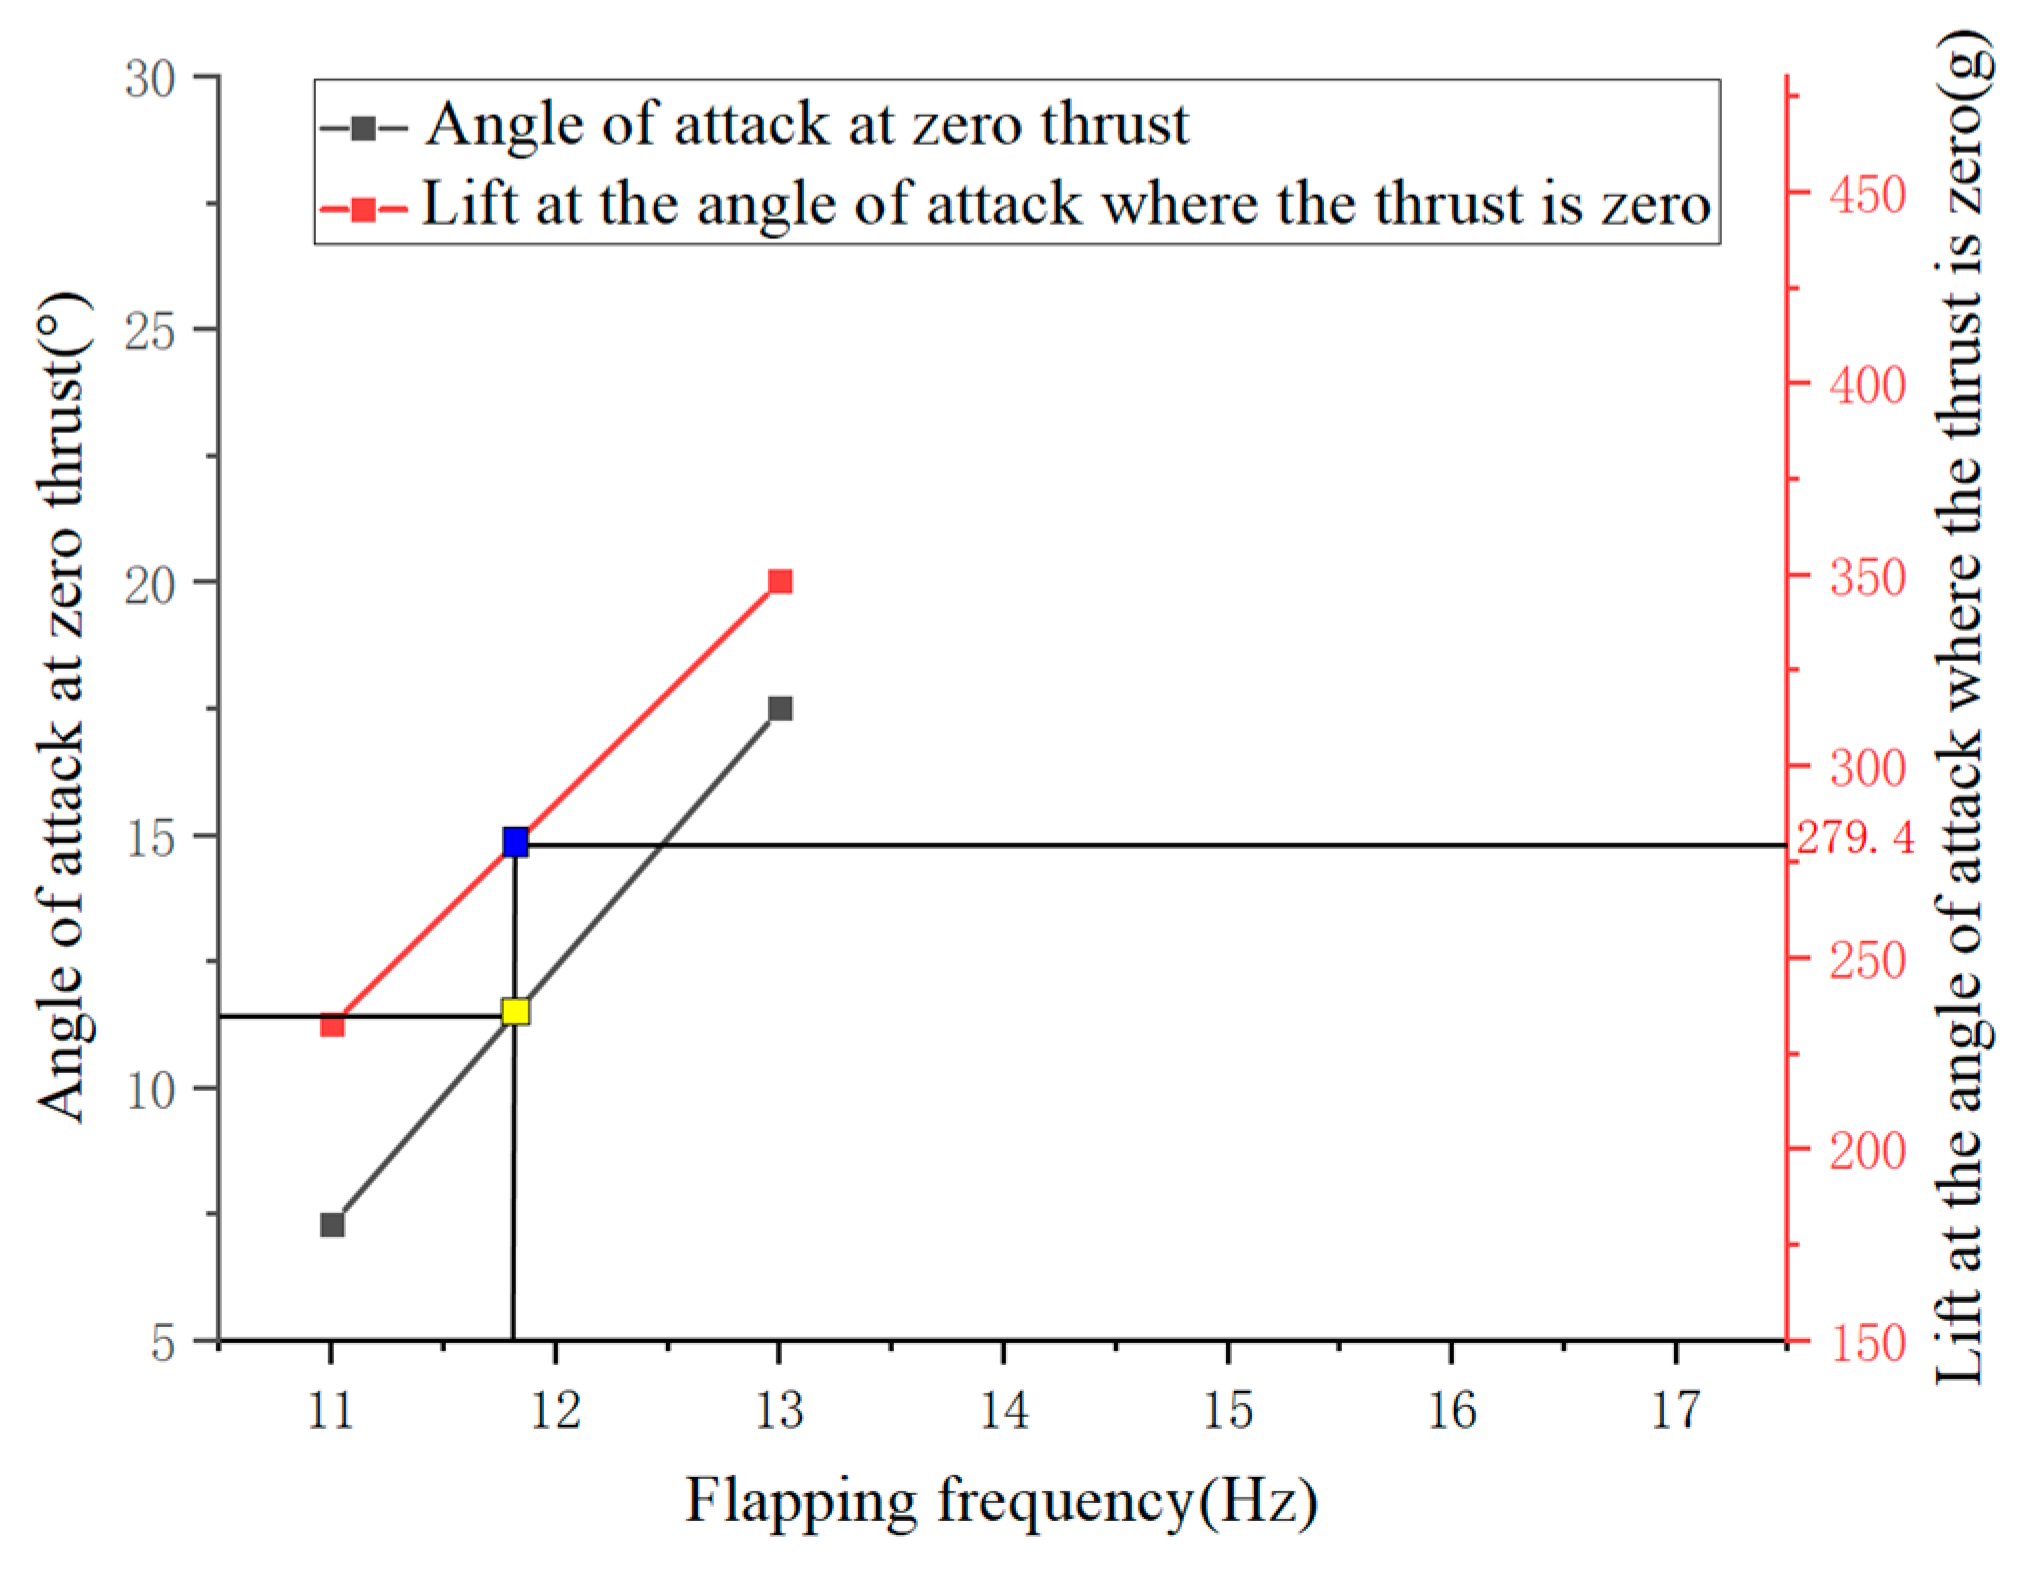
At a wind speed of 10 m/s, the trim angle of the flight test prototype with the GTS V3 2104 motor ranges from 7.3° to 17.46°. Therefore, the experimental parameter range for the angle of attack is selected as 0° to 20°. From
Table 8, it is found that at 60% throttle, the flapping frequency is 11 Hz, and at 70% throttle, the flapping frequency is 13 Hz. Considering that the total weight of the prototype is 279.4 g, the trim flapping frequency of the flight test prototype is between 11 Hz and 13 Hz, as shown in
Figure 16. Since the designed flapping frequency criterion in this study is 15 Hz and considering the significant impact of high-frequency flapping on the lifespan of the mechanism, the selected range for the flapping frequency is 12 Hz to 16 Hz. At a wind speed of 10 m/s, a flapping frequency between 11 Hz and 13 Hz can achieve a trim state for the flight test prototype. Considering that the wind tunnel’s designed wind speed range is between 10 m/s and 15 m/s, the experimental setup is conducted at wind speeds of 10 m/s and 12.5 m/s.
The Aeolus 2105.5 motor is 5 g heavier than the GTS V3 2104 motor. However, at the same throttle setting, the flight test prototype with the Aeolus 2105.5 motor has a flapping frequency that is 2 Hz higher than the flight test prototype with the GTS V3 2104 motor. Therefore, the experimental parameter range for the flight test prototype with the Aeolus 2105.5 motor is consistent with that of the flight test prototype with the GTS V3 2104 motor.
The wind tunnel experimental design variable parameters are shown in
Table 8.
4. Results and Discussion of Wind Tunnel Testing
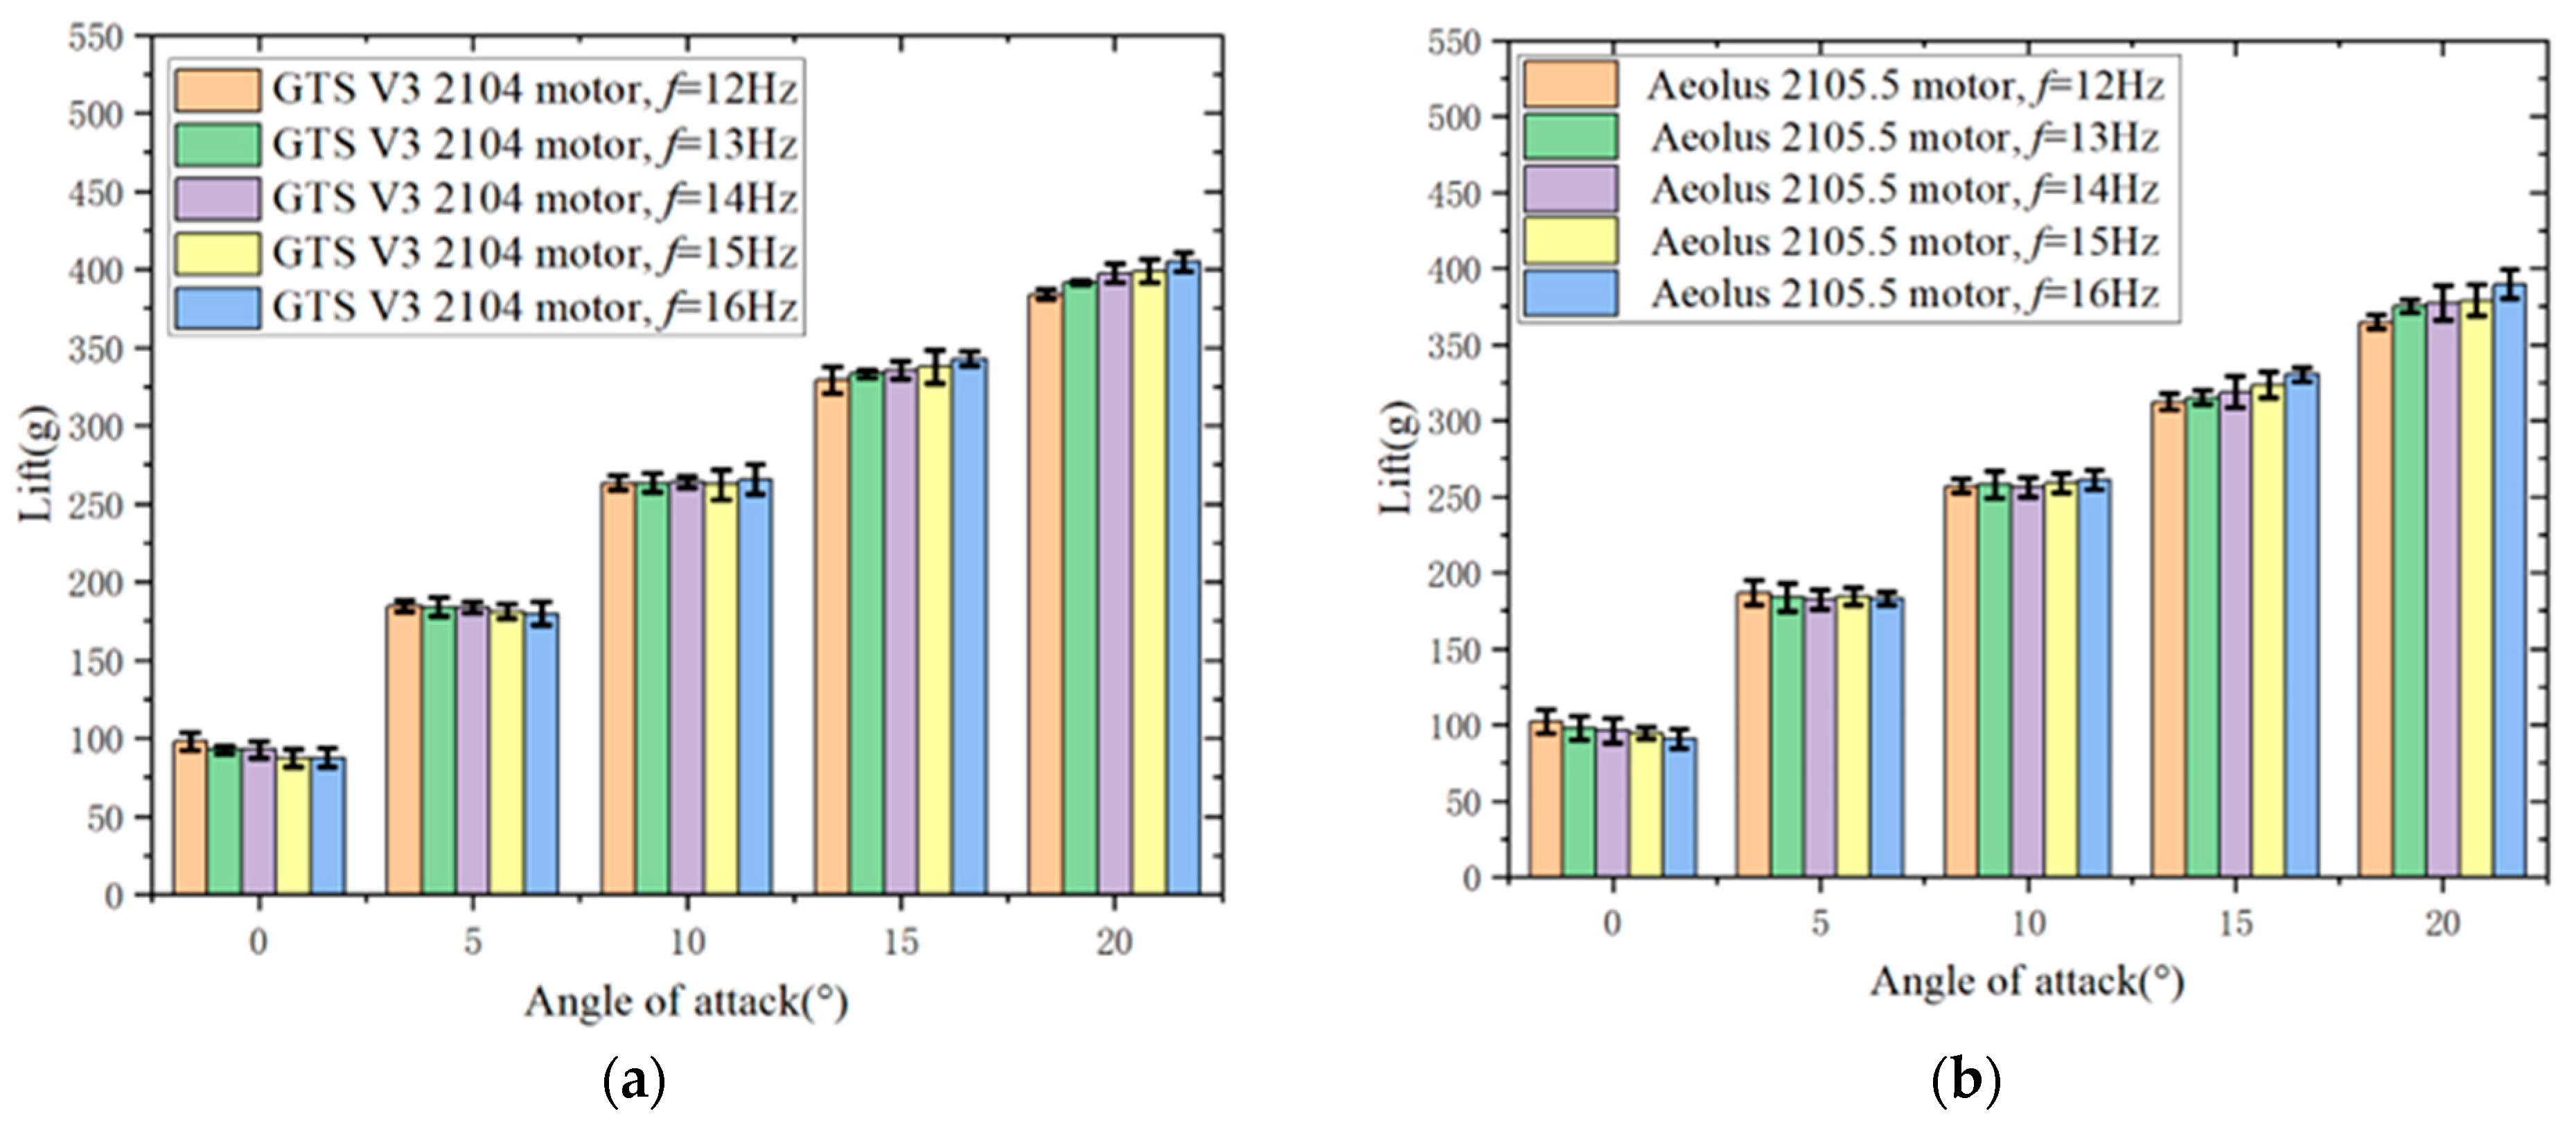
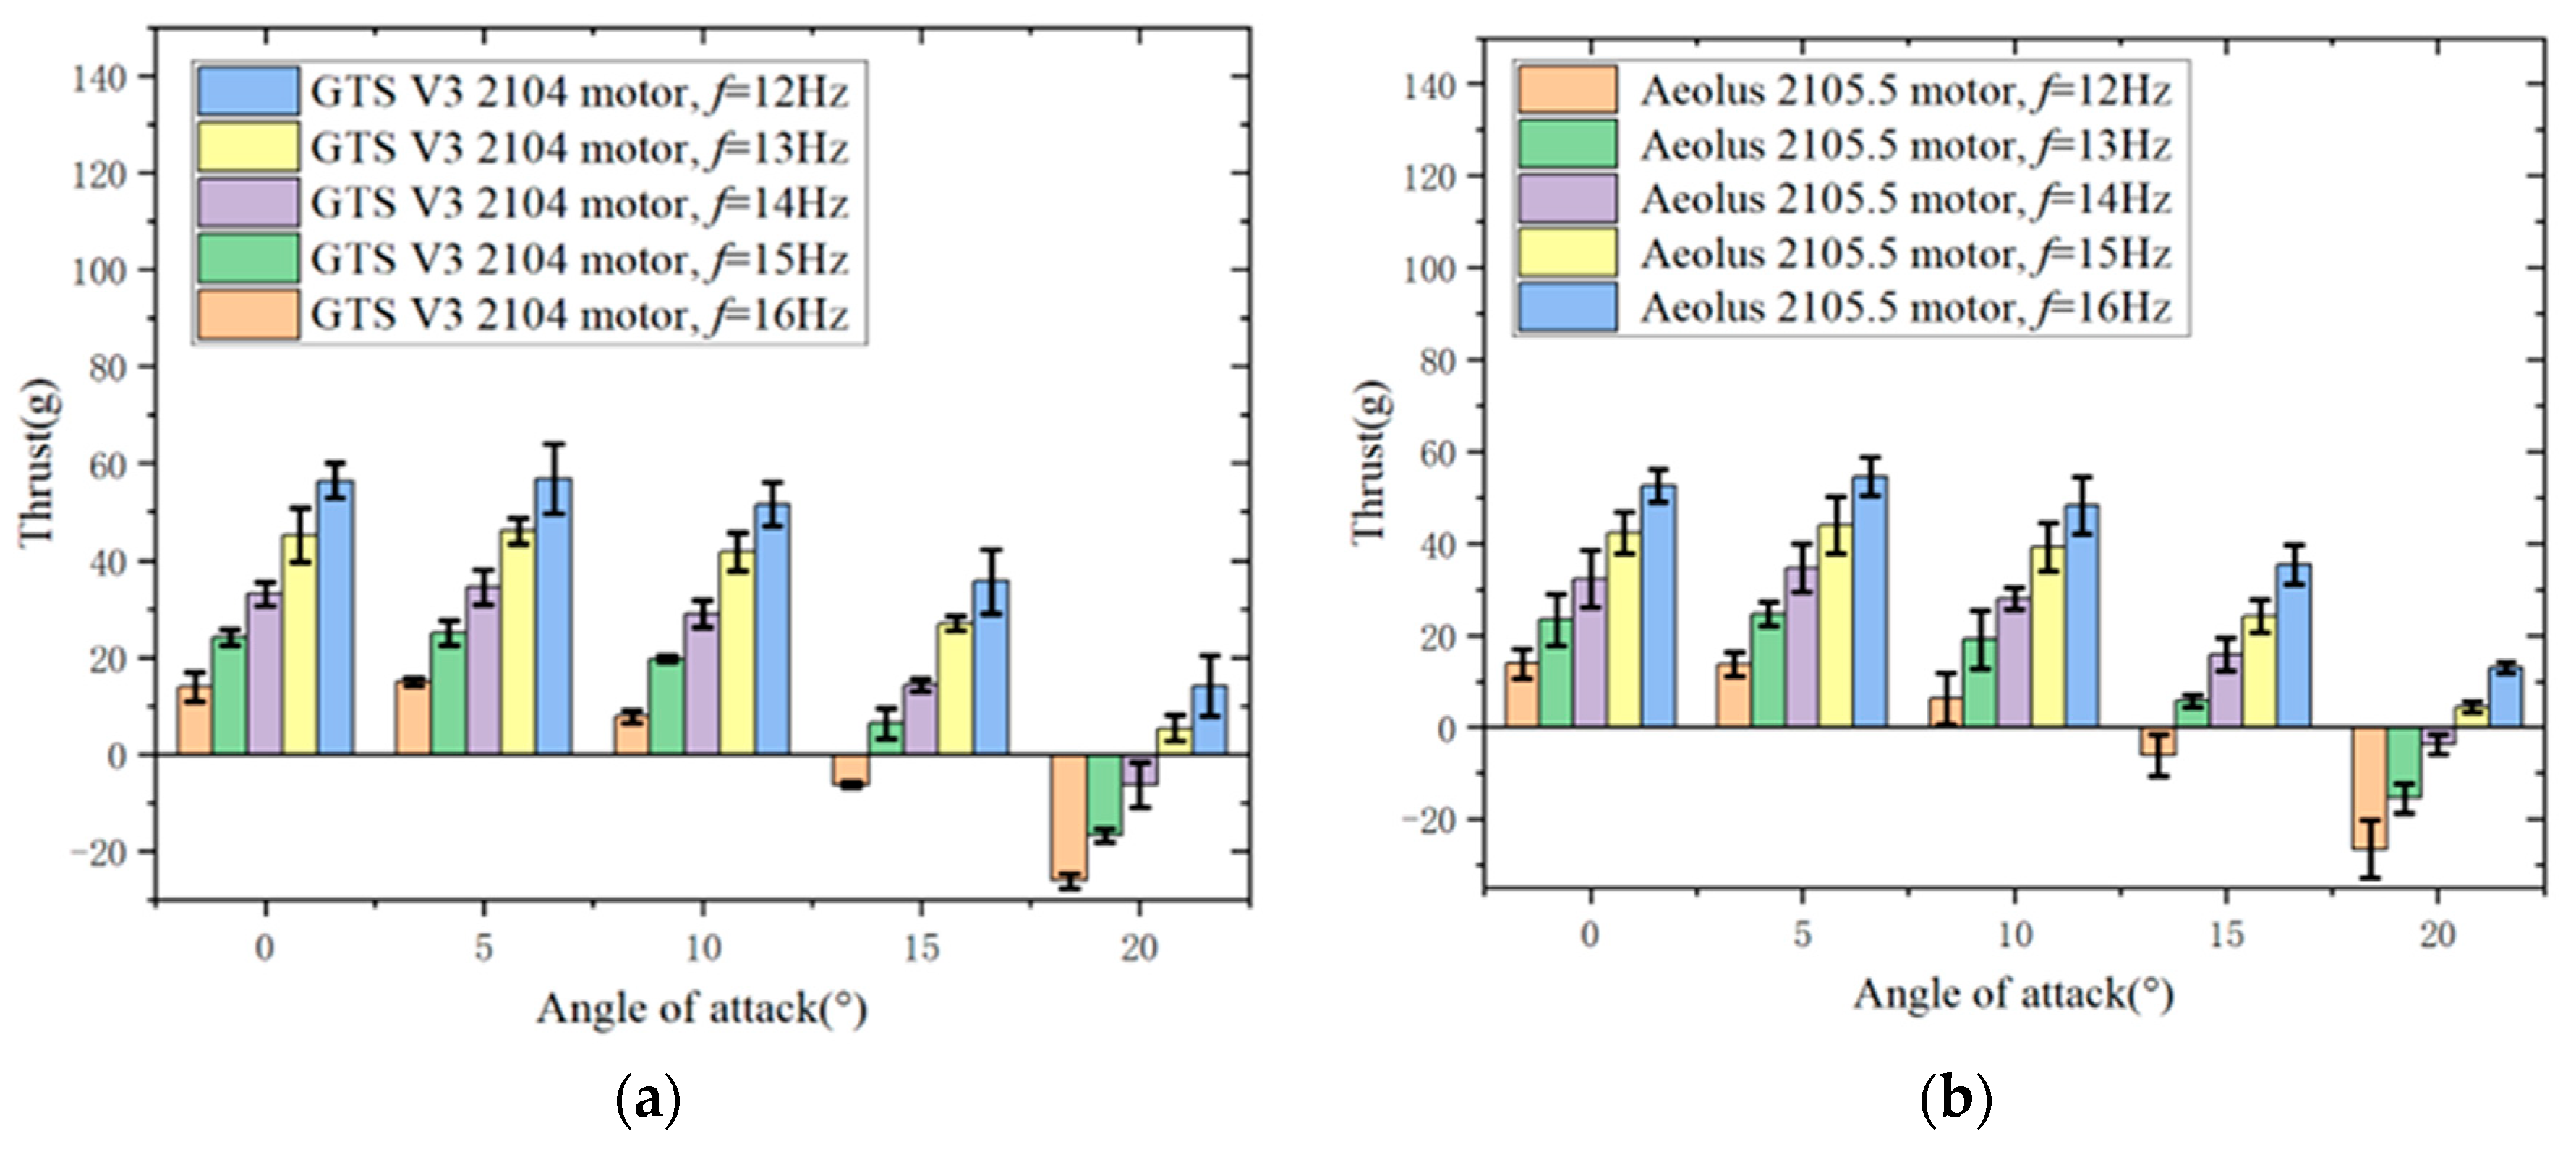
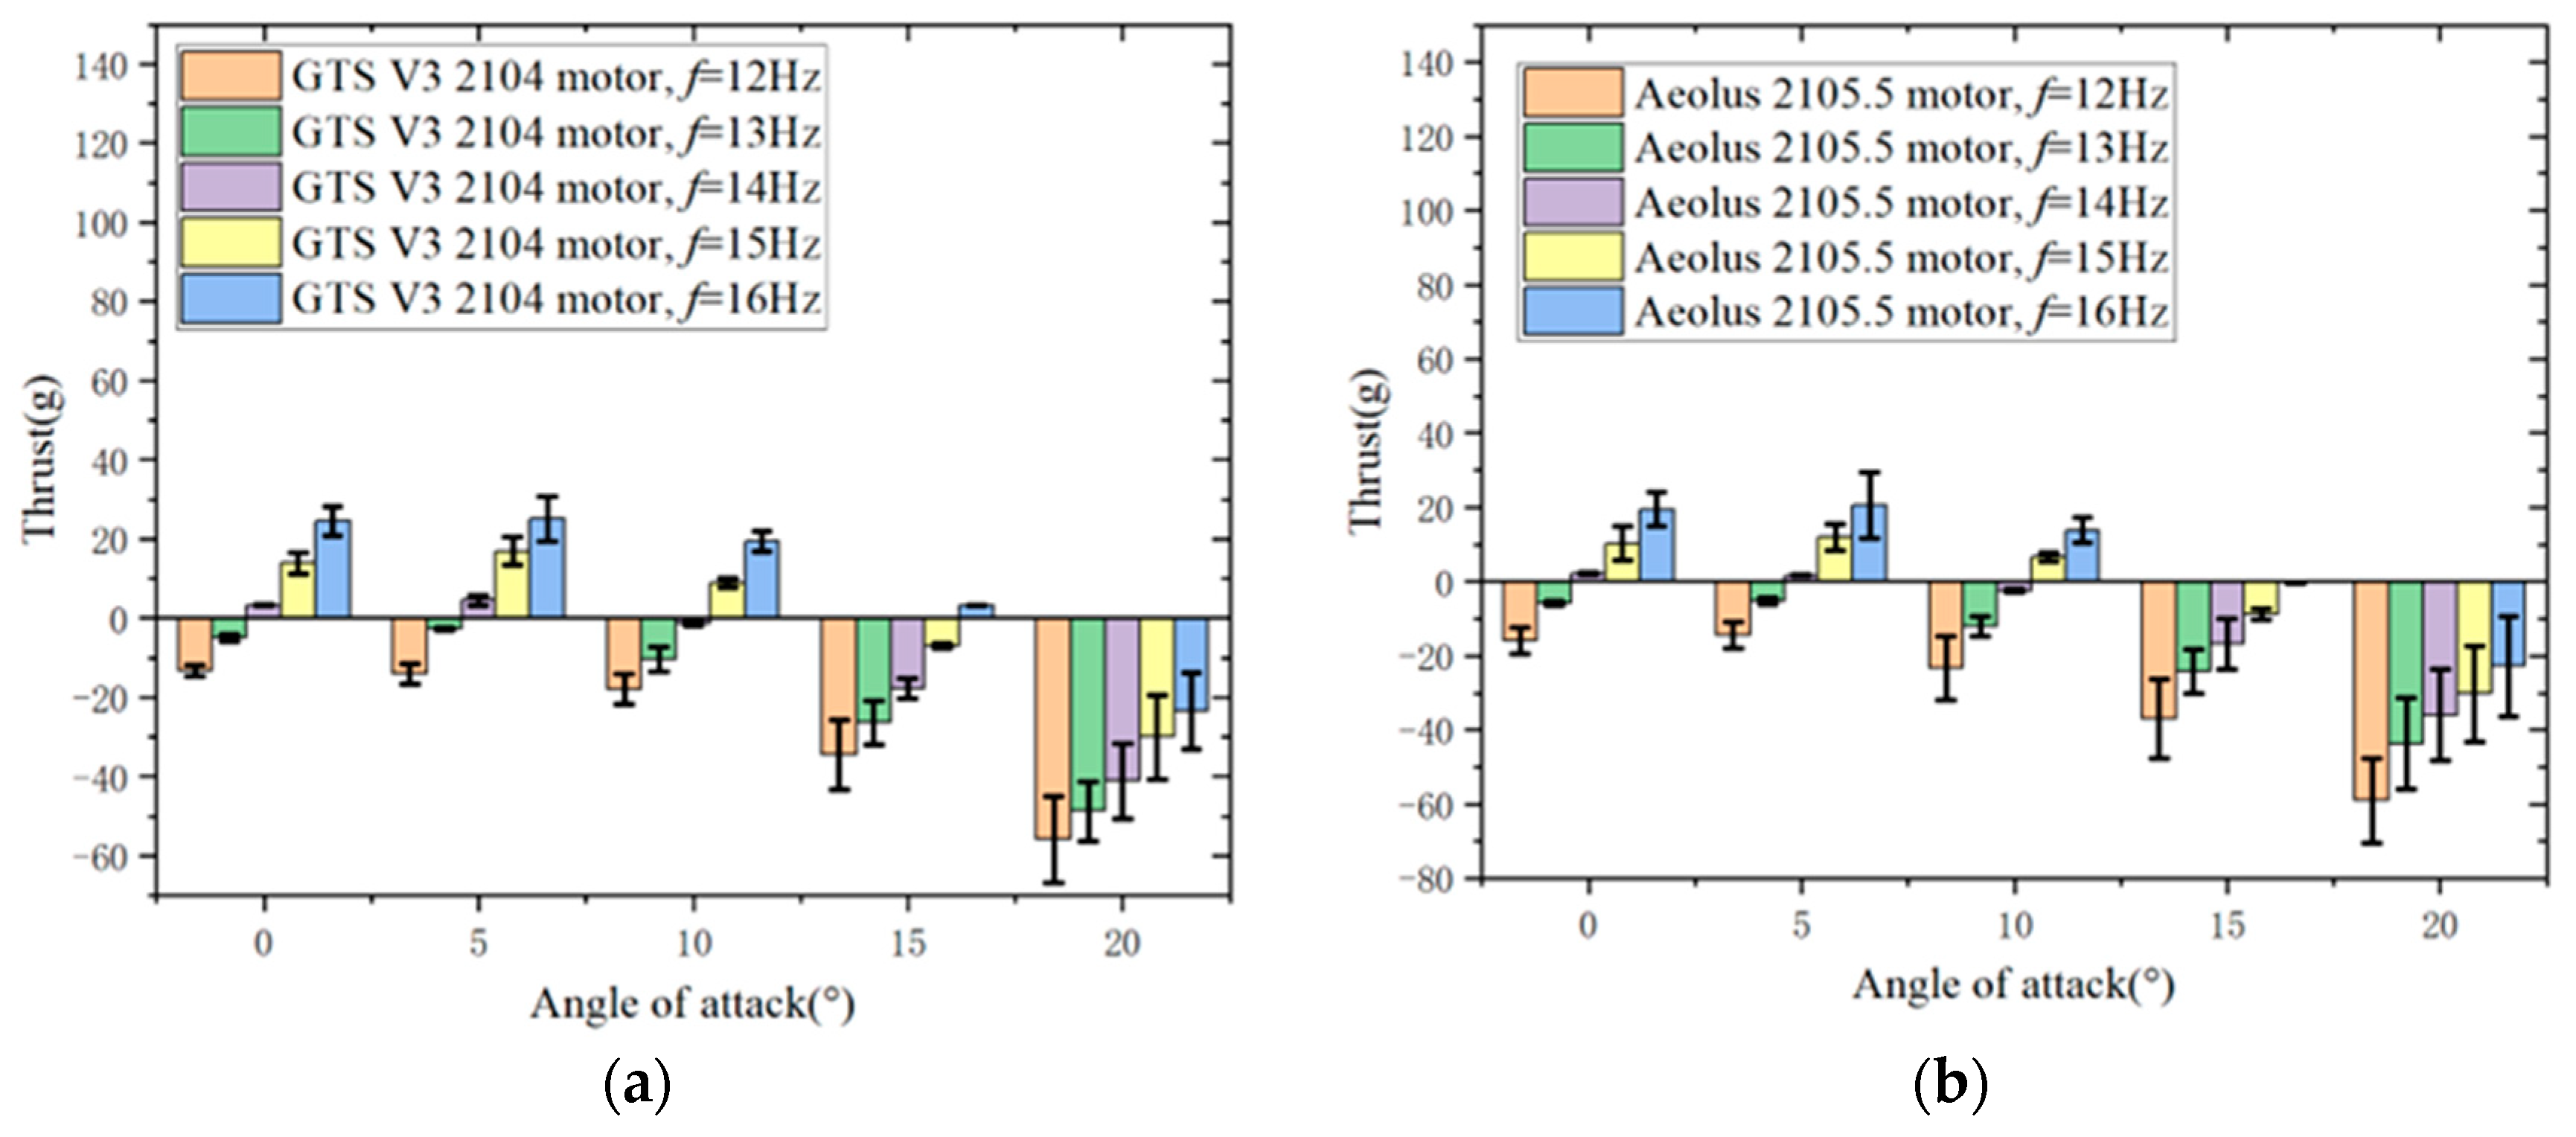
The lift and thrust of the flight test prototypes with the Aeolus 2105.5 motor and the GTS V3 2104 motor at different angles of attack and flapping frequencies at a wind speed of 10 m/s are analyzed. In
Figure 17 and
Figure 18, both the GTS V3 2104 motor and the Aeolus 2105.5 motor flight test prototypes show an increase in lift with an increase in angle of attack, while the thrust initially increases and then decreases with an increase in angle of attack.
In
Figure 17, at 0° angle of attack, the lift of both the Aeolus 2105.5 motor and the GTS V3 2104 motor flight test prototypes decreases with an increase in flapping frequency. At 5° and 10° angles of attack, the lift variation with flapping frequency is not significant for both motor flight test prototypes. At 15° and 20° angles of attack, the lift of both motor flight test prototypes increases with an increase in flapping frequency. In summary, the variation of lift with flapping frequency is not significant.
In
Figure 18, the thrust of both the Aeolus 2105.5 motor and the GTS V3 2104 motor flight test prototypes increases with an increase in flapping frequency. At 0°, 5°, and 10° angles of attack, both motor flight test prototypes generate positive thrust at any flapping frequency between 12 Hz and 16 Hz. At a 15° angle of attack, except for a negative thrust generated at a flapping frequency of 12 Hz, positive thrust is generated at all other flapping frequencies. At a 20° angle of attack, positive thrust is generated at flapping frequencies of 15 Hz and 16 Hz, while negative thrust is generated at all other flapping frequencies. Zakaria et al. [
32] analyzed “Lift and drag of flapping membrane wings at high angles of attack”. They found that increasing the flapping frequency generally leads to an increase in lift and thrust at a given flight speed and positive angle of attack, which is consistent with the findings of this study.
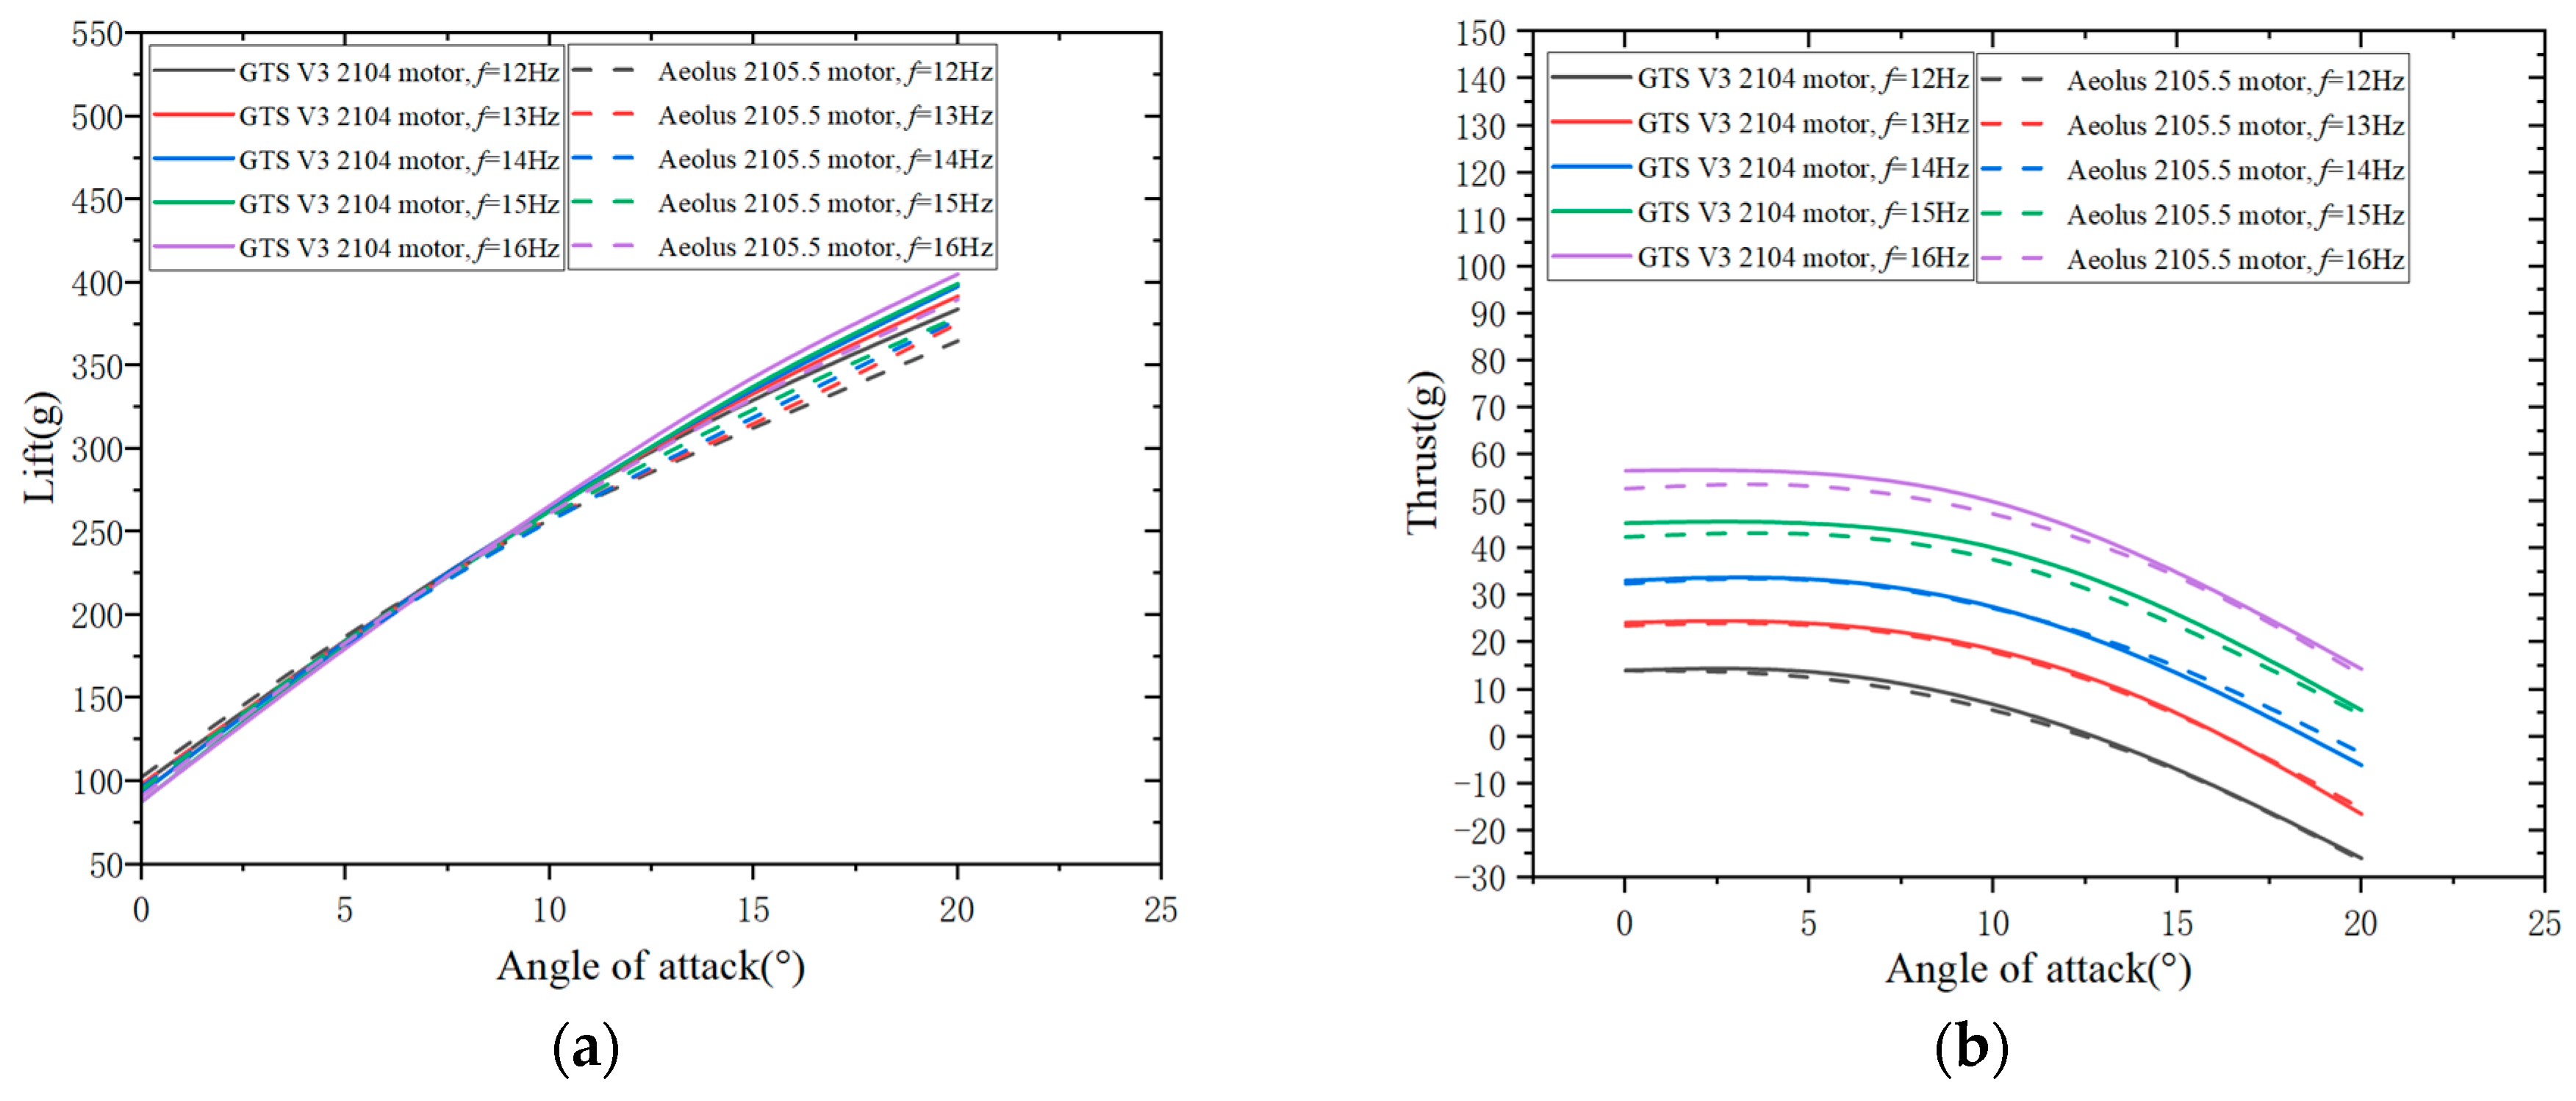
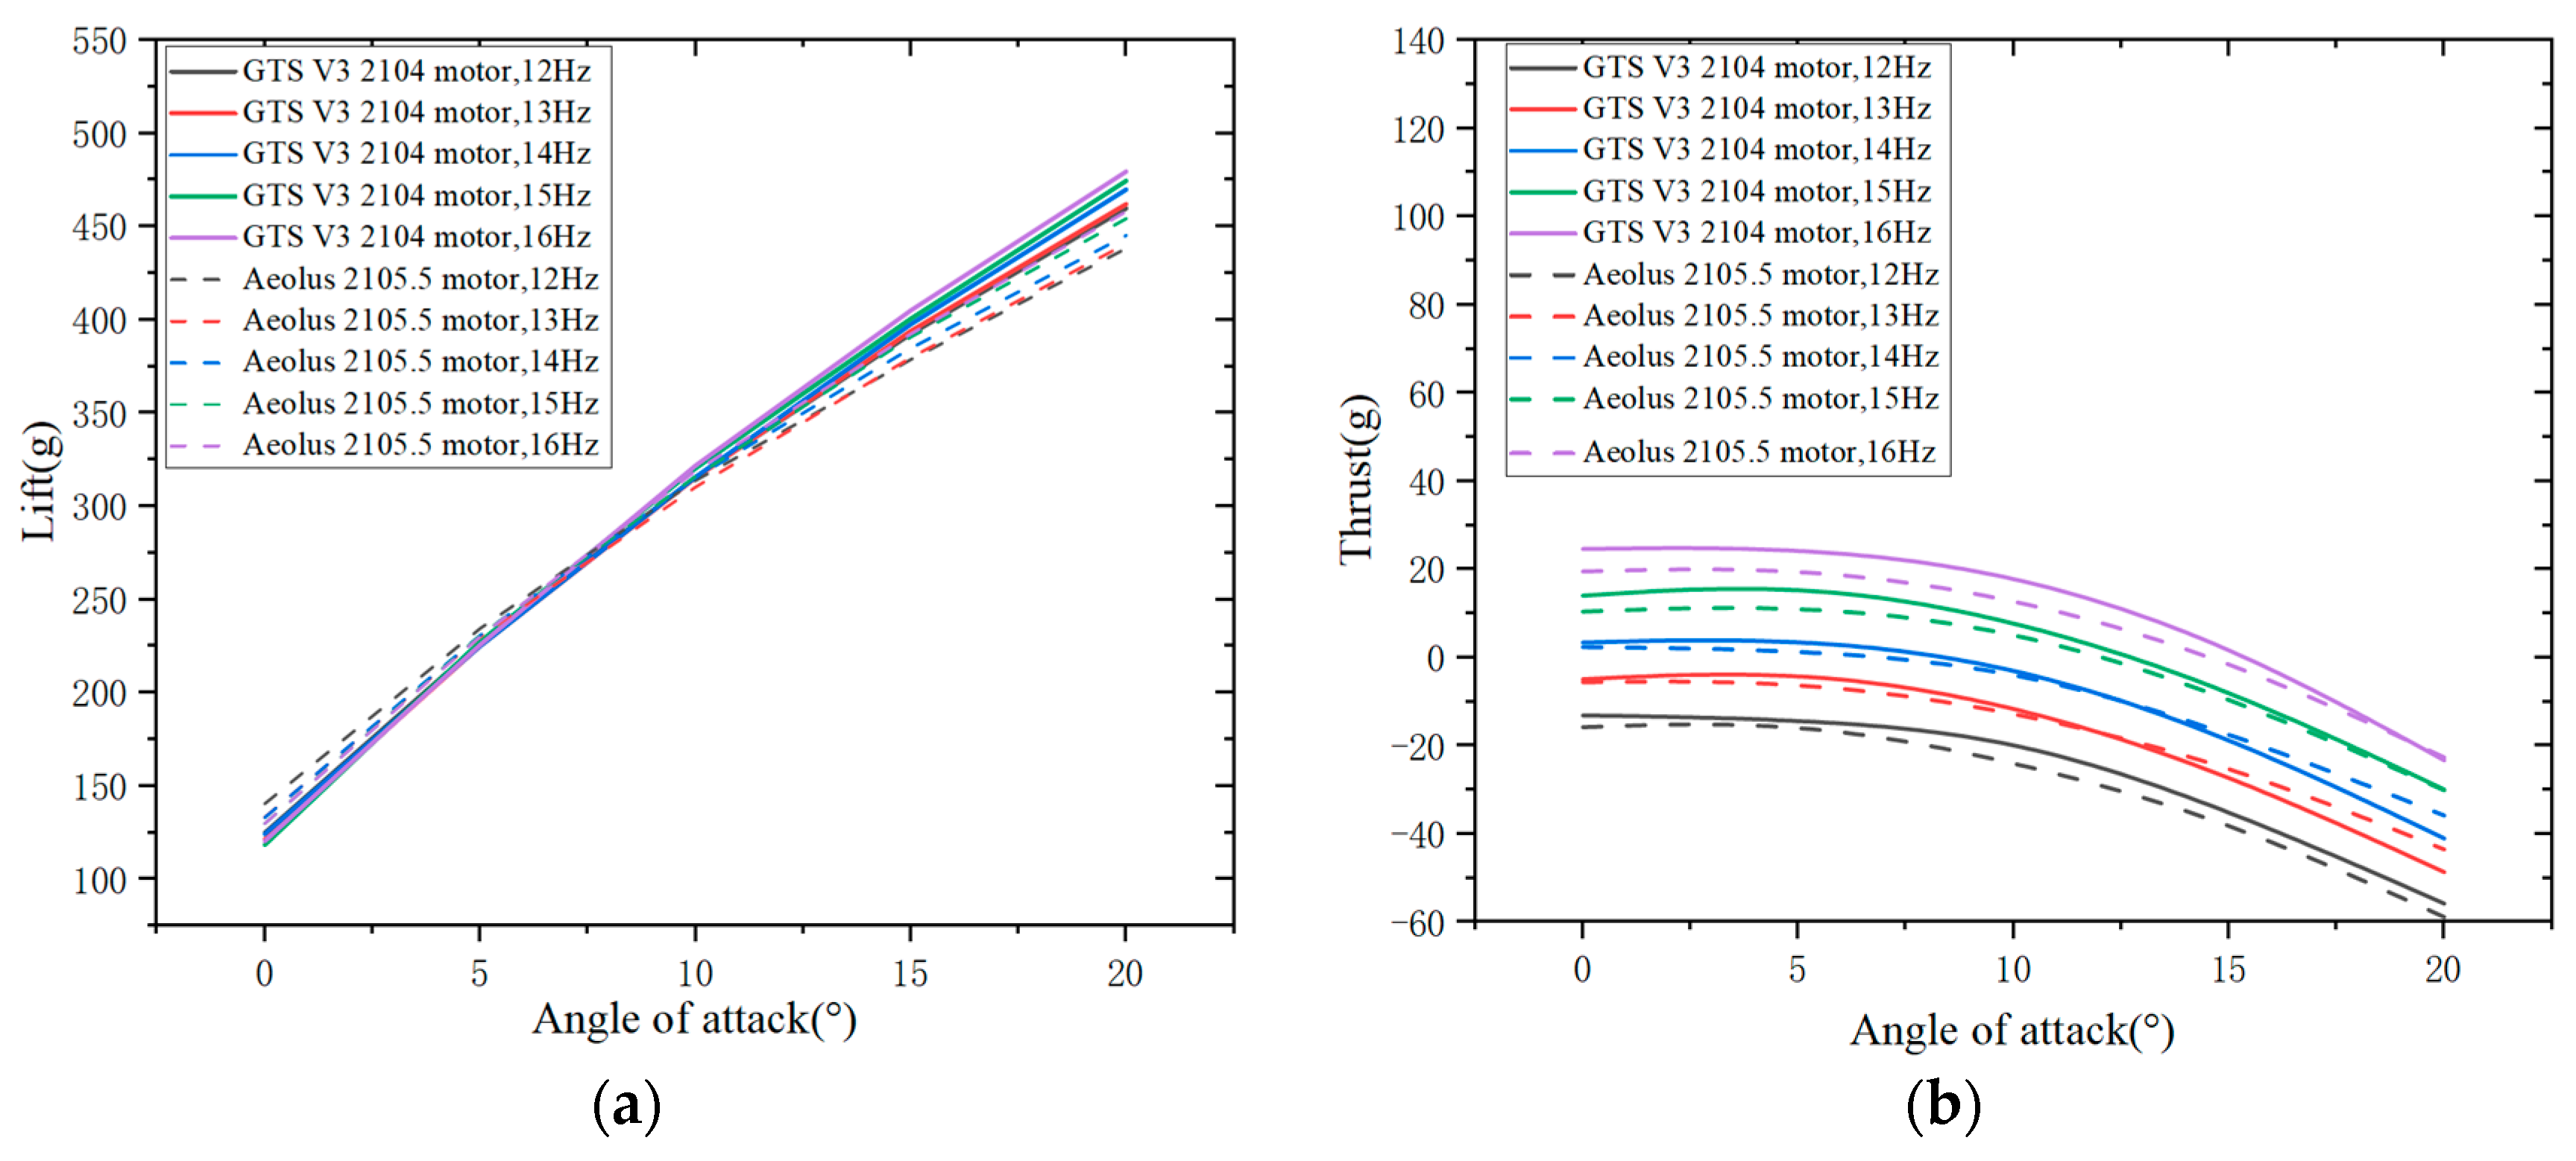
In
Figure 19, at specific flapping frequencies and angles of attack, there is not much difference in lift and thrust between the Aeolus 2105.5 motor and the GTS V3 2104 motor flight test prototypes. This is because the generation of lift and thrust is only related to the state of the flapping wing. As long as the angle of attack, wind speed, flapping frequency, and flapping wing are the same, the lift and thrust should be the same. The slight discrepancies observed in the figures may be due to the accumulated zero drift error in the balance data, control errors in wind tunnel experimental wind speed, and other factors.
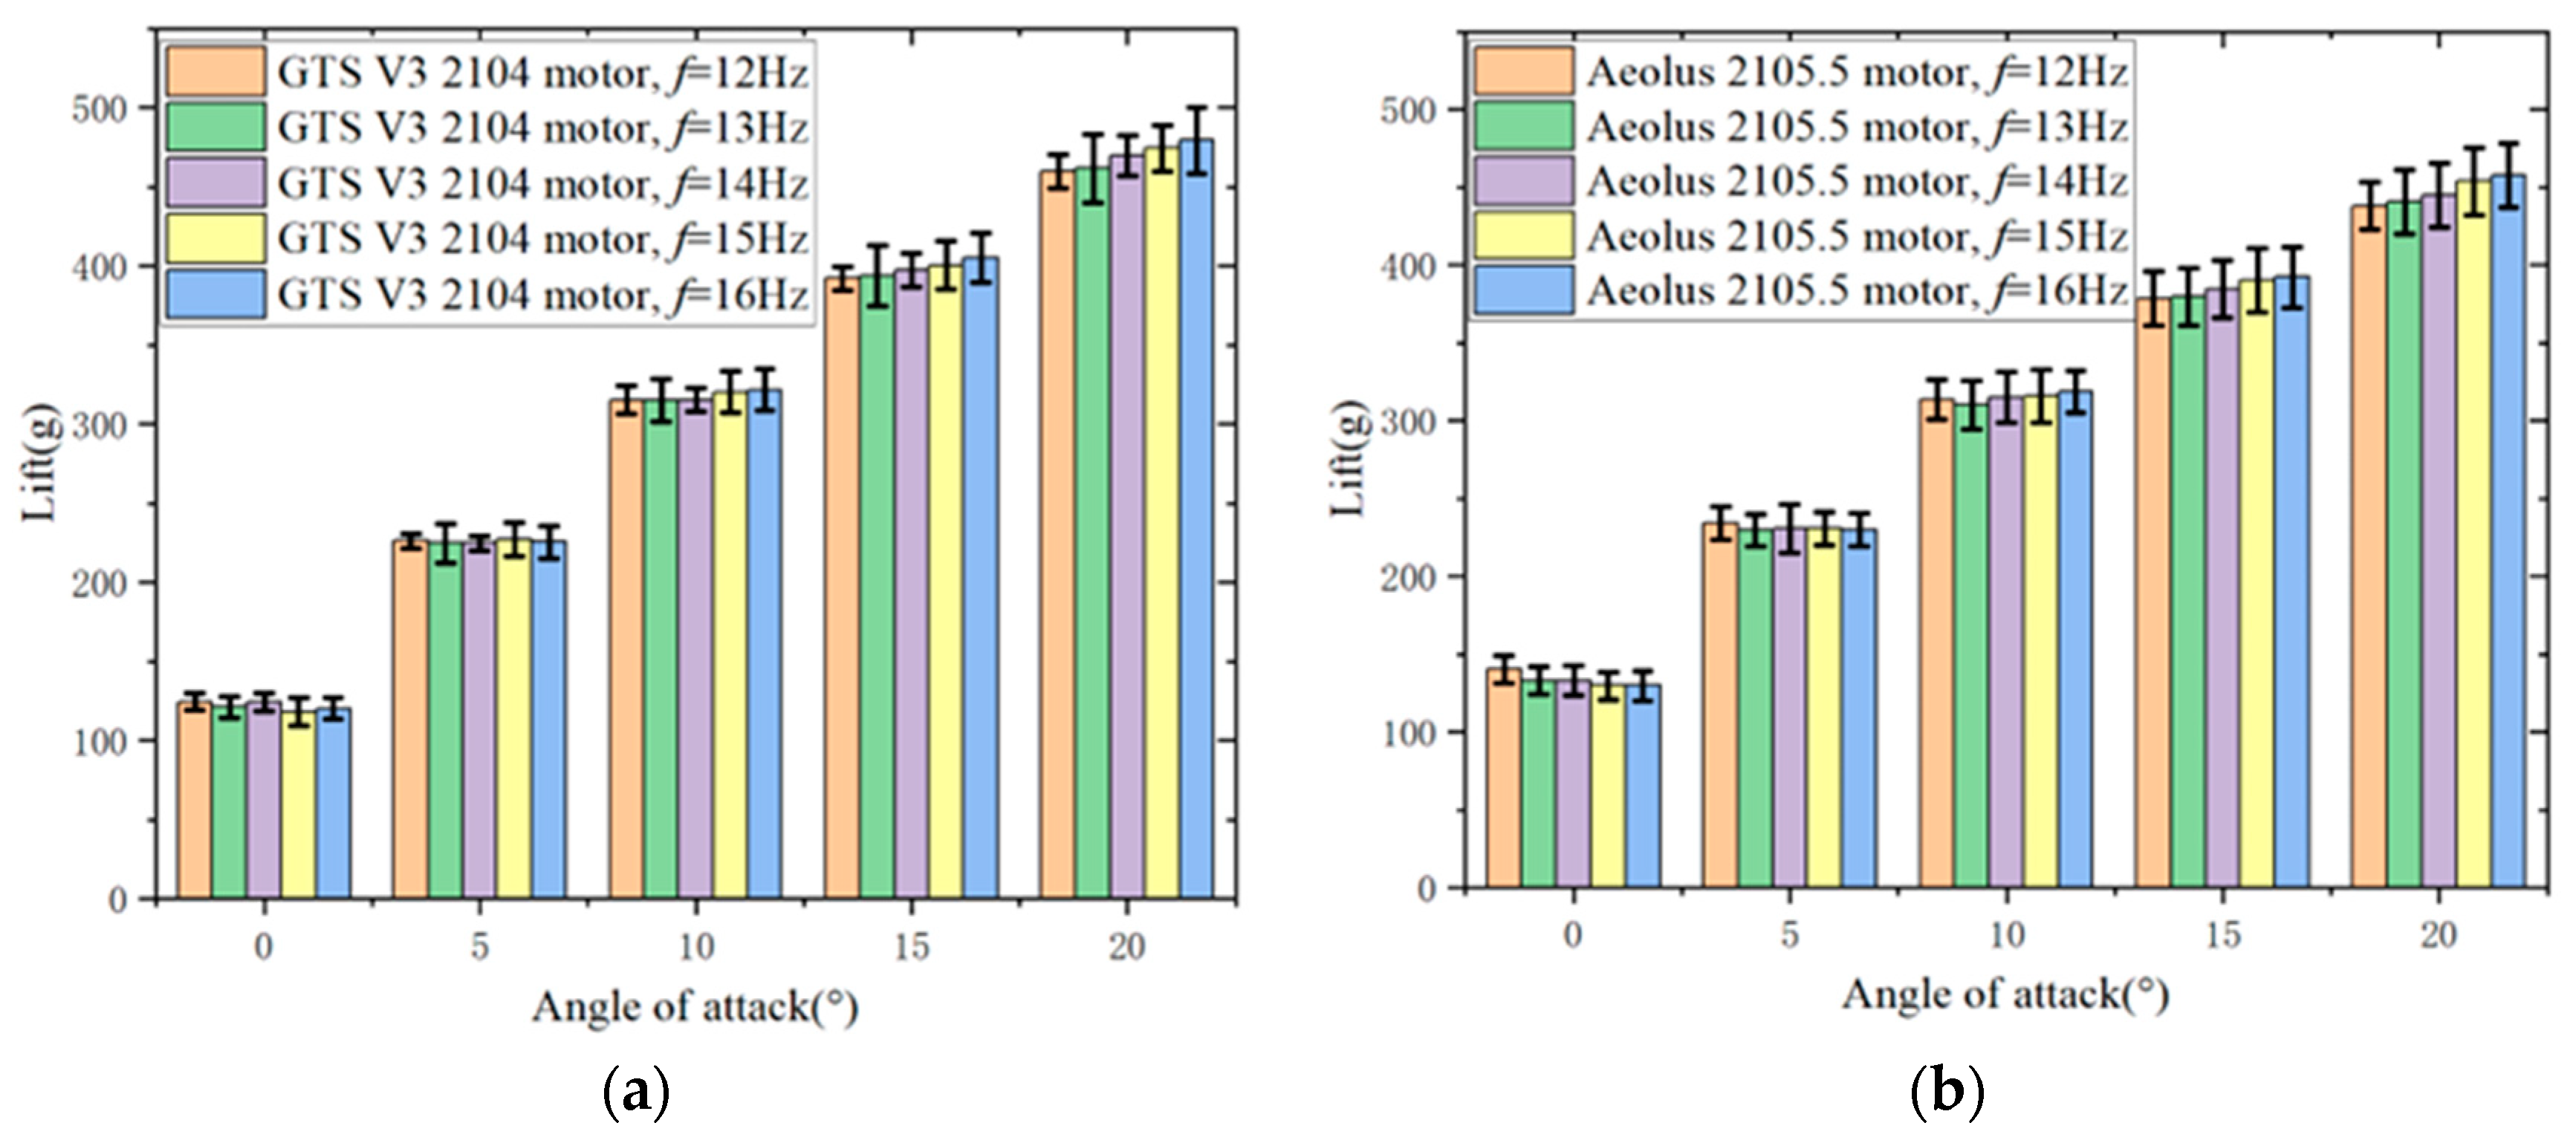
At a wind speed of 12.5 m/s and different flapping frequencies, the lift and thrust of the flight test prototypes with the Aeolus 2105.5 motor and the GTS V3 2104 motor are analyzed at various angles of attack. In
Figure 20, the lift of both the Aeolus 2105.5 motor and the GTS V3 2104 motor flight test prototypes increases with an increase in angle of attack. At 0°, 5°, and 10° angles of attack, the variation of lift with increasing flapping frequency is not significant. However, at 15° and 20° angles of attack, the lift increases with an increase in flapping frequency.
In
Figure 21, at specific flapping frequencies, the thrust of the flight test prototypes with the Aeolus 2105.5 motor and the GTS V3 2104 motor initially increases and then decreases with an increase in angle of attack. At specific angles of attack, the thrust of both motor flight test prototypes increases with an increase in flapping frequency. At a 15° angle of attack and a flapping frequency of 16 Hz, the GTS V3 2104 motor flight test prototype generates positive thrust, while the Aeolus 2105.5 motor flight test prototype generates negative thrust. At a 20° angle of attack, both motor flight test prototypes generate negative thrust at any flapping frequency between 12 Hz and 16 Hz.
In
Figure 22, the lift does not differ significantly between the Aeolus 2105.5 motor and the GTS V3 2104 motor flight test prototypes at the same flapping frequency and angle of attack. However, there is a significant difference in thrust between the two motor flight test prototypes at low angles of attack and high flapping frequencies.
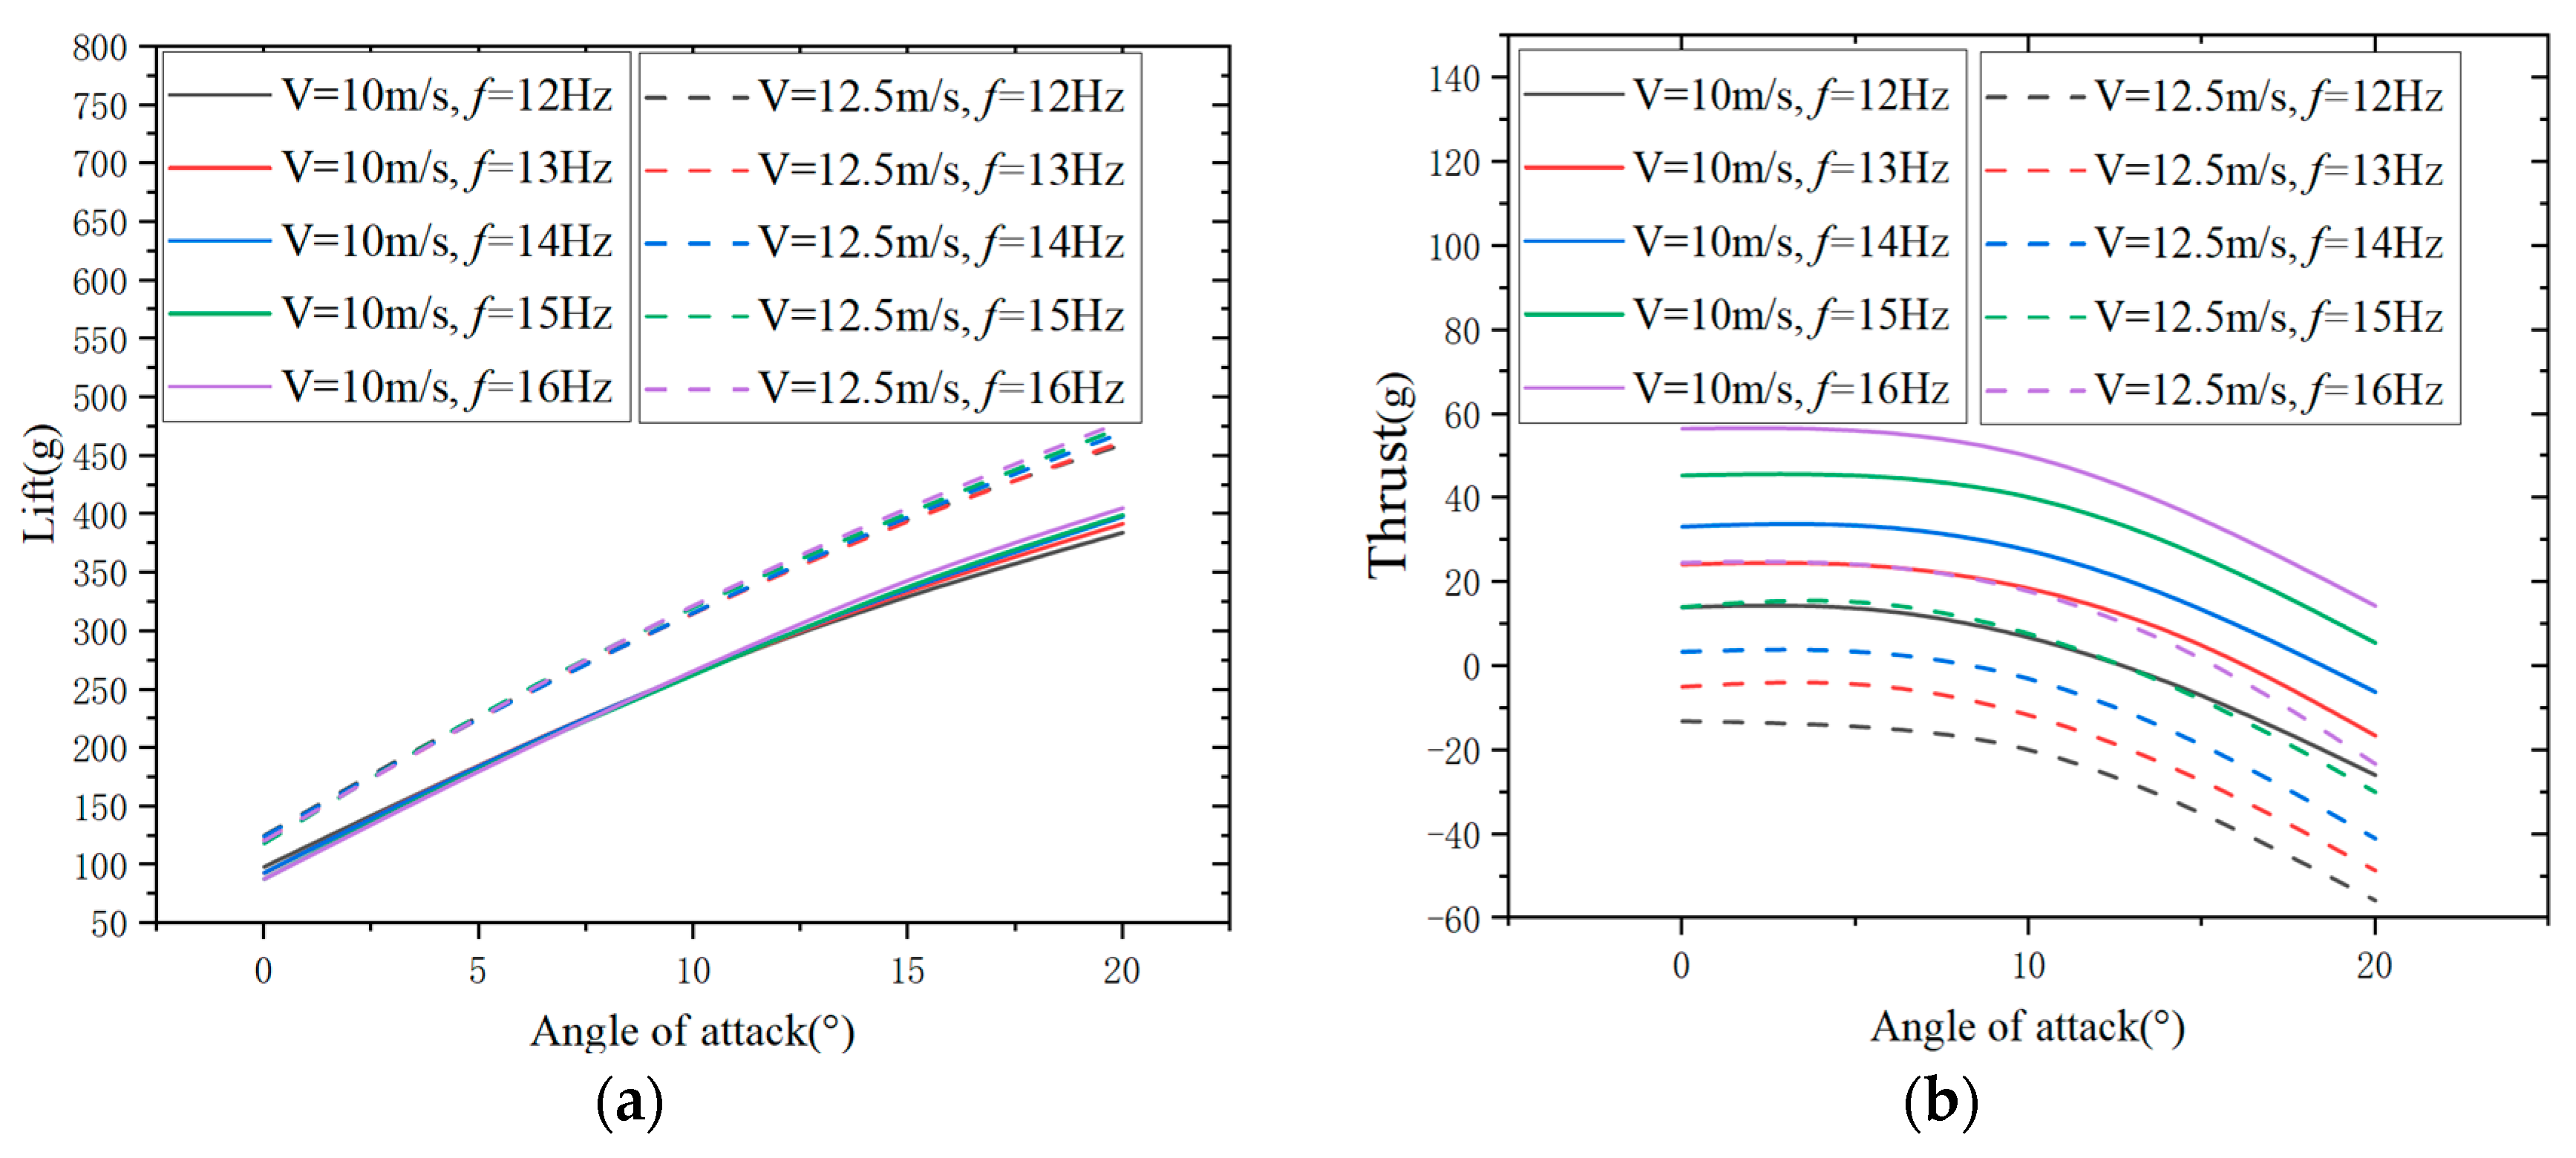
In
Figure 23, a comparison is made between the lift of the GTS V3 2104 motor flight test prototype at wind speeds of 10 m/s and 12.5 m/s. Under the same flapping frequency and angle of attack, the lift generated at a wind speed of 12.5 m/s is higher than the lift generated at a wind speed of 10 m/s. However, the thrust generated at a wind speed of 10 m/s is higher than the thrust generated at a wind speed of 12.5 m/s. This is because an increased wind speed leads to a greater pressure difference around the aircraft, resulting in increased lift. However, the increased wind speed also leads to higher drag, causing the thrust to decrease.
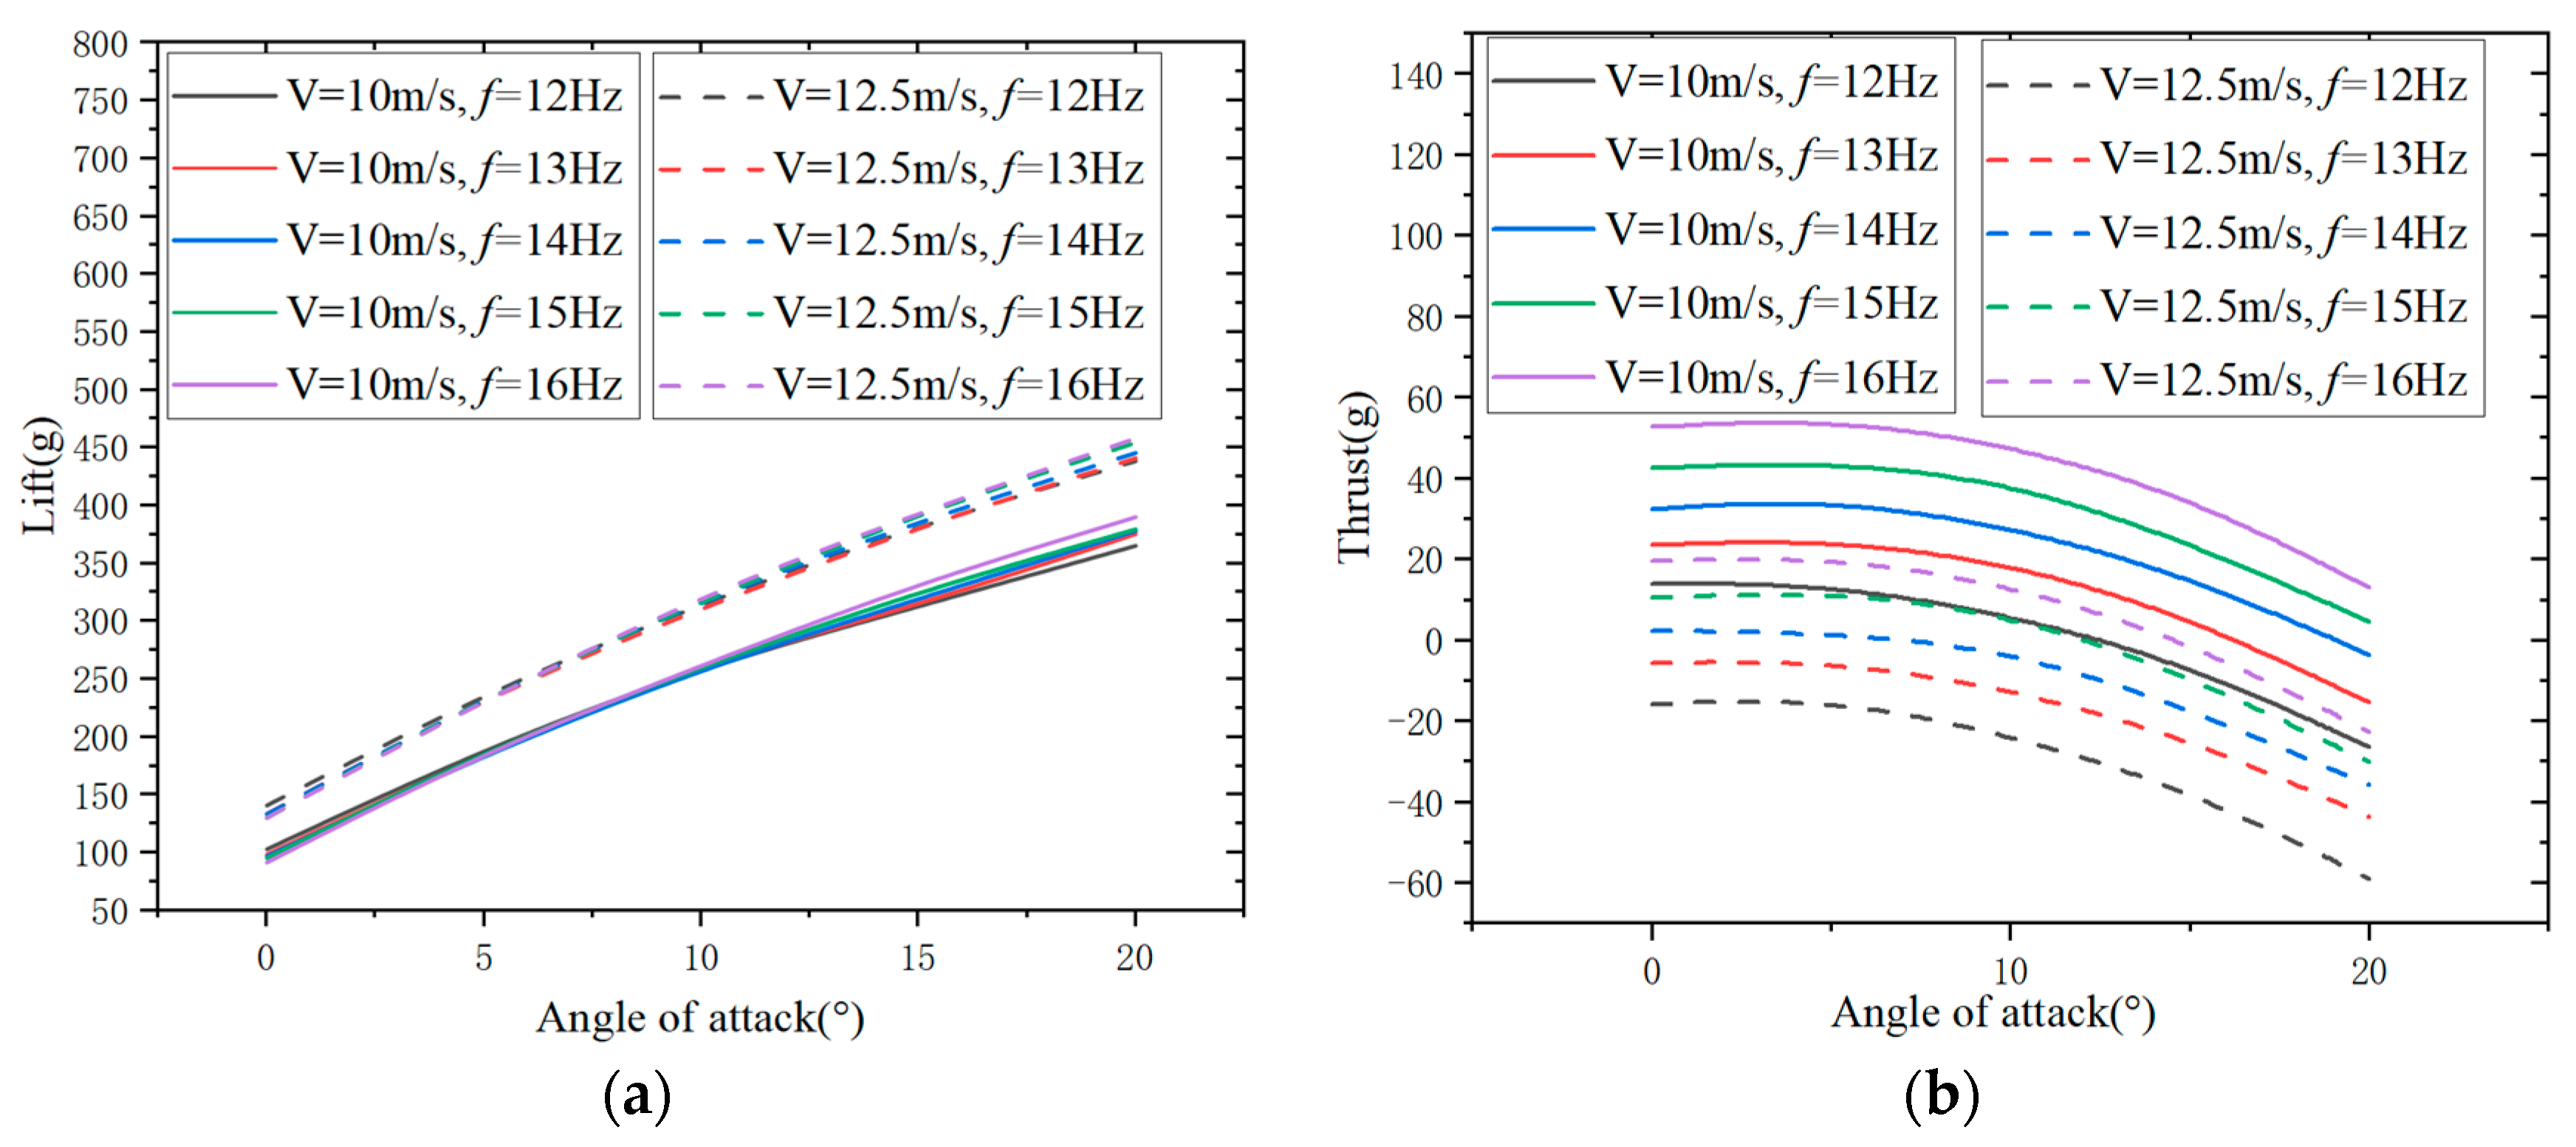
In
Figure 24, a comparison is made between the lift and thrust of the Aeolus 2105.5 motor flight test prototype at wind speeds of 10 m/s and 12.5 m/s. Under the same flapping frequency and angle of attack, the lift generated at a wind speed of 12.5 m/s is higher than the lift generated at a wind speed of 10 m/s. However, the thrust generated at a wind speed of 12.5 m/s is smaller than the thrust generated at a wind speed of 10 m/s.
Both the Aeolus 2105.5 motor flight test prototype and the GTS V3 2104 motor flight test prototype experience an increase in lift as the wind speed increases. However, the thrust decreases with an increase in wind speed. Additionally, at high angles of attack, the difference in lift between wind speeds of 10 m/s and 12.5 m/s is greater than the difference in lift at low angles of attack.
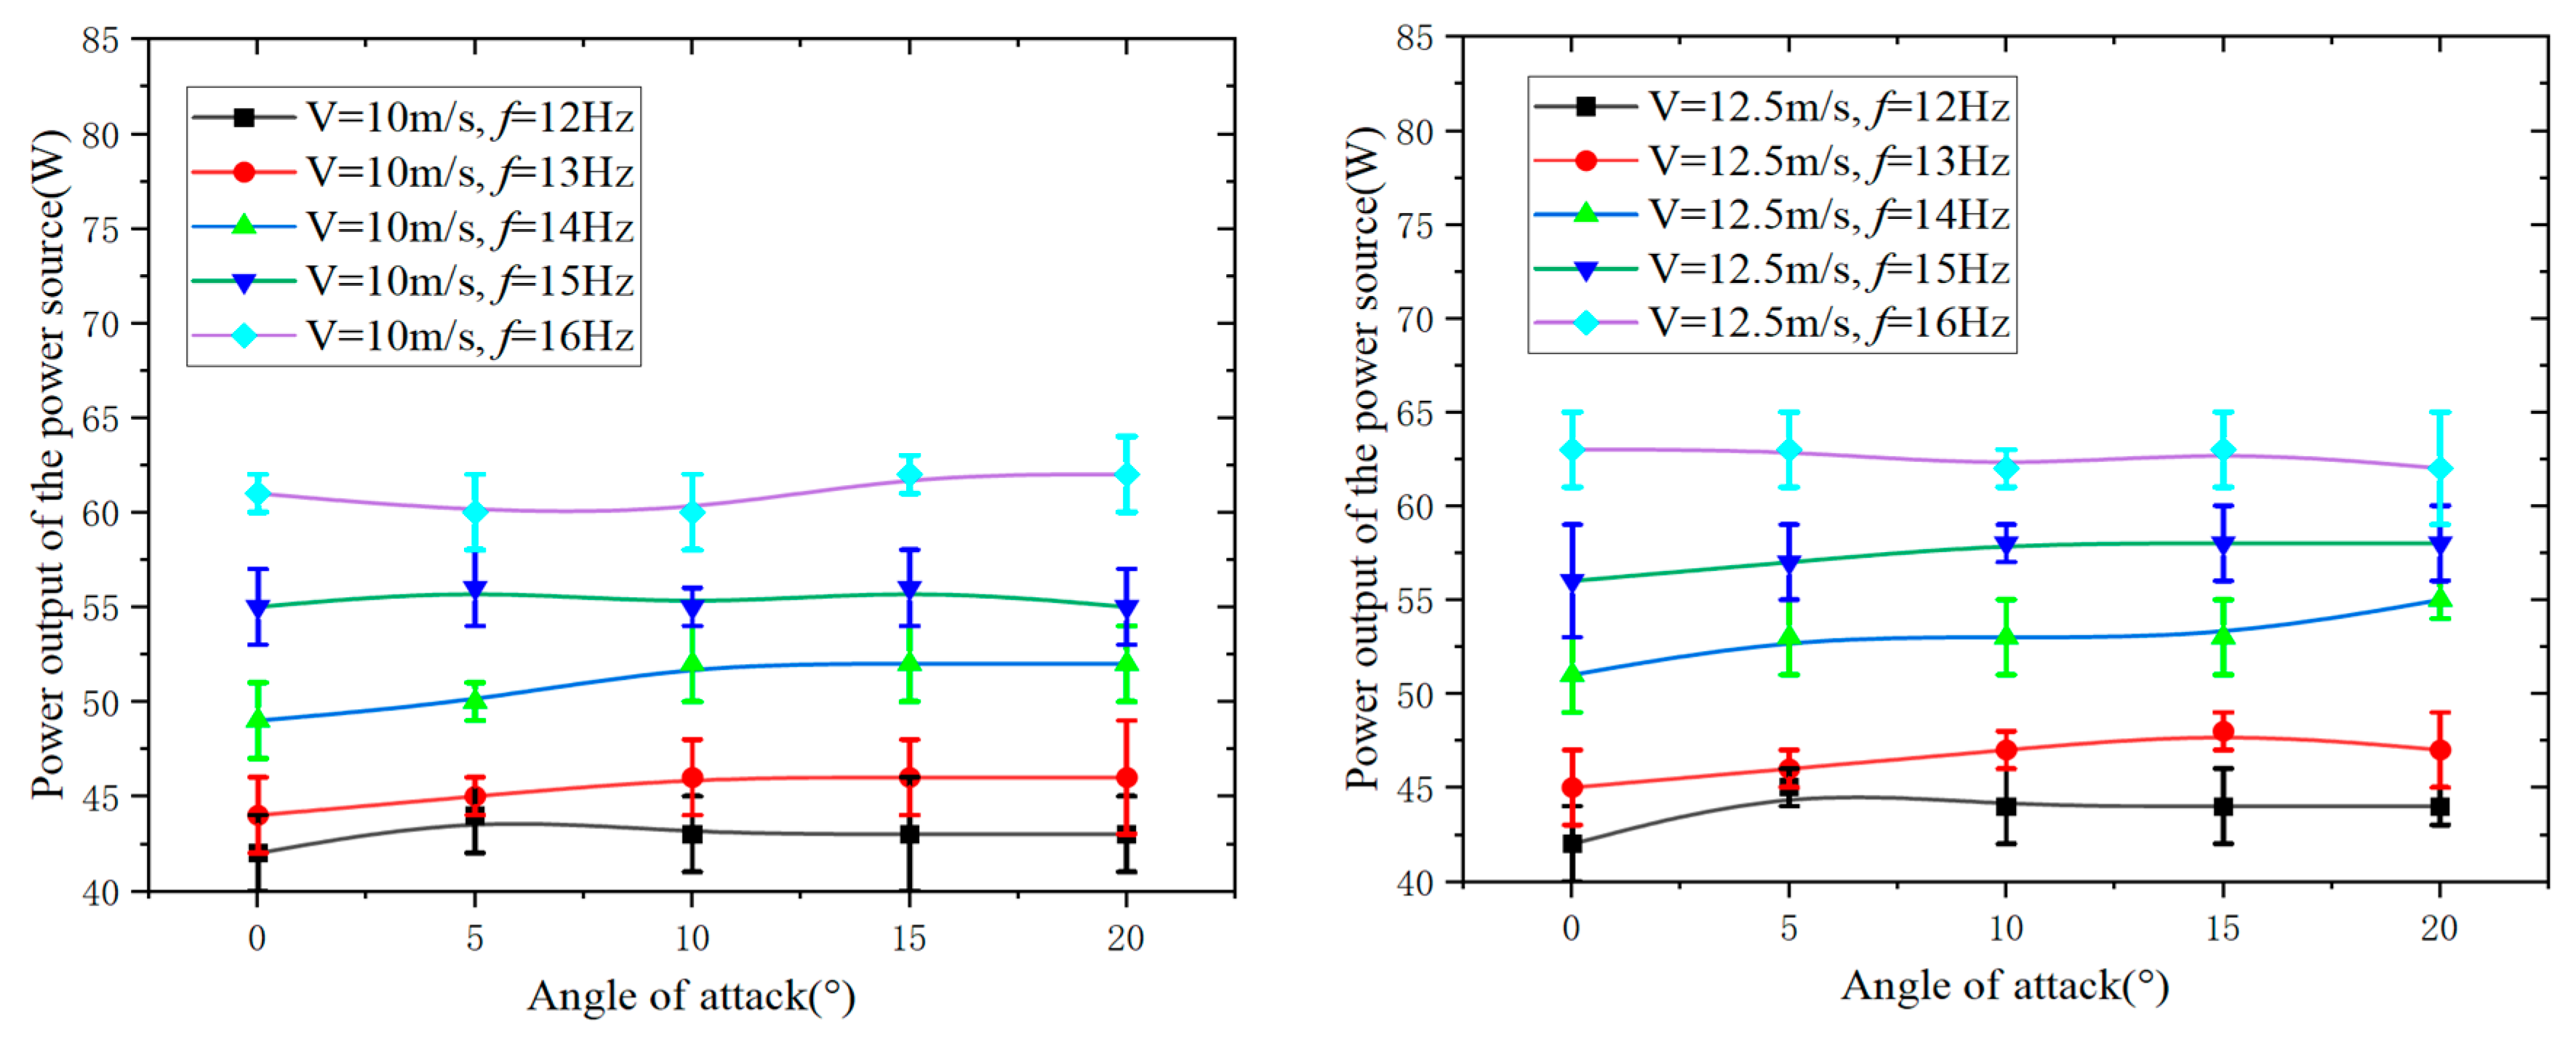
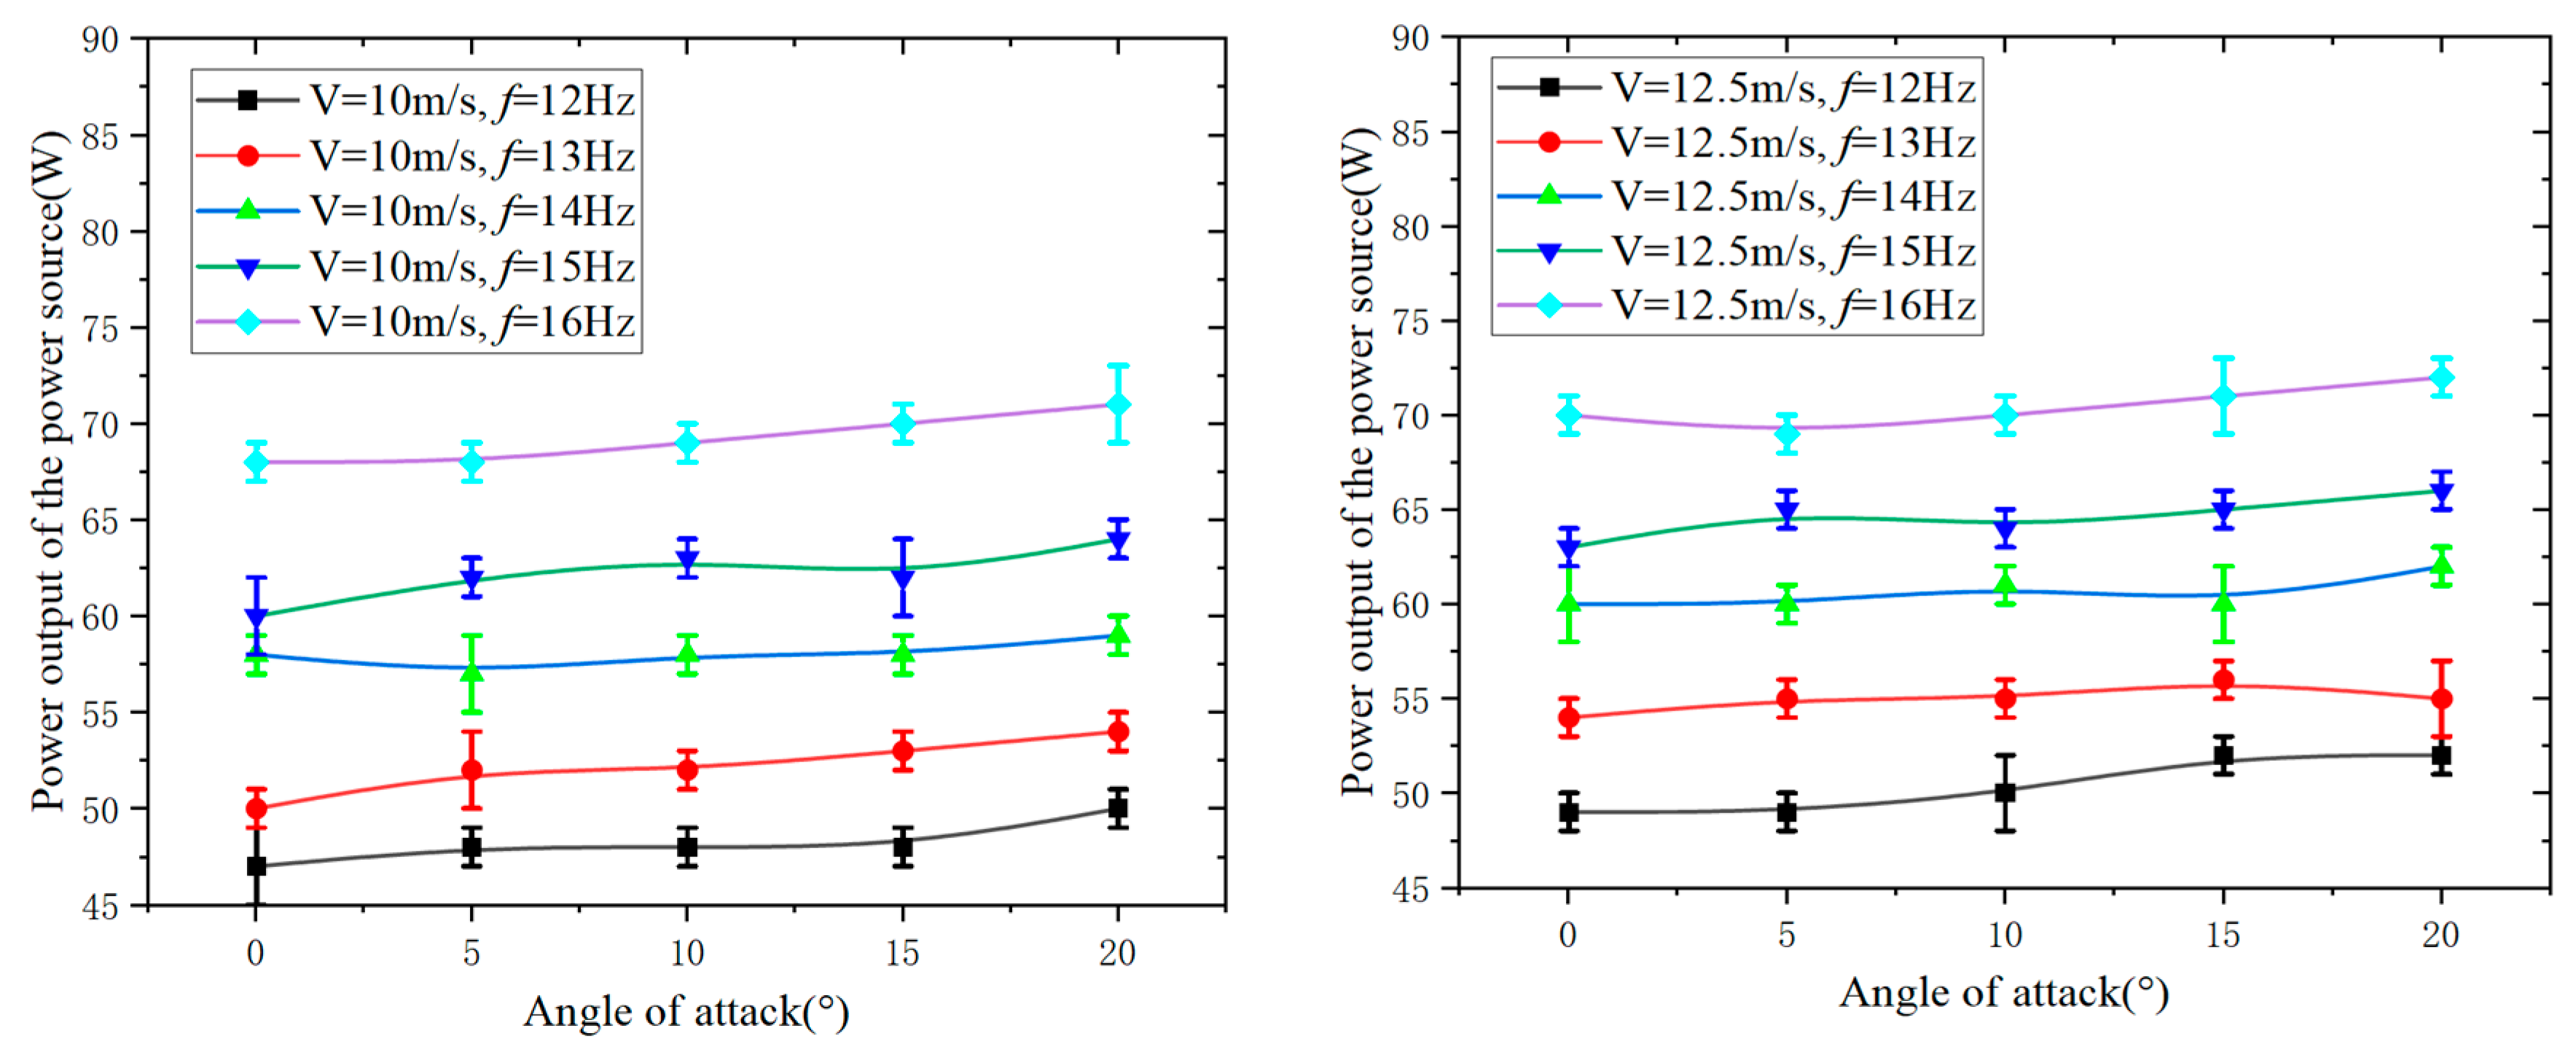
In order to obtain the input power of two different motor flight test prototypes at various wind speeds, flapping frequencies, and angles of attack, the input power of the voltage regulator was recorded simultaneously during the wind tunnel force measurements.
Figure 25 and
Figure 26 represent the power input curves of the GTS V3 2104 motor and the Aeolus 2105.5 motor, respectively, under different wind speeds and flapping frequencies as a function of the angle of attack. In
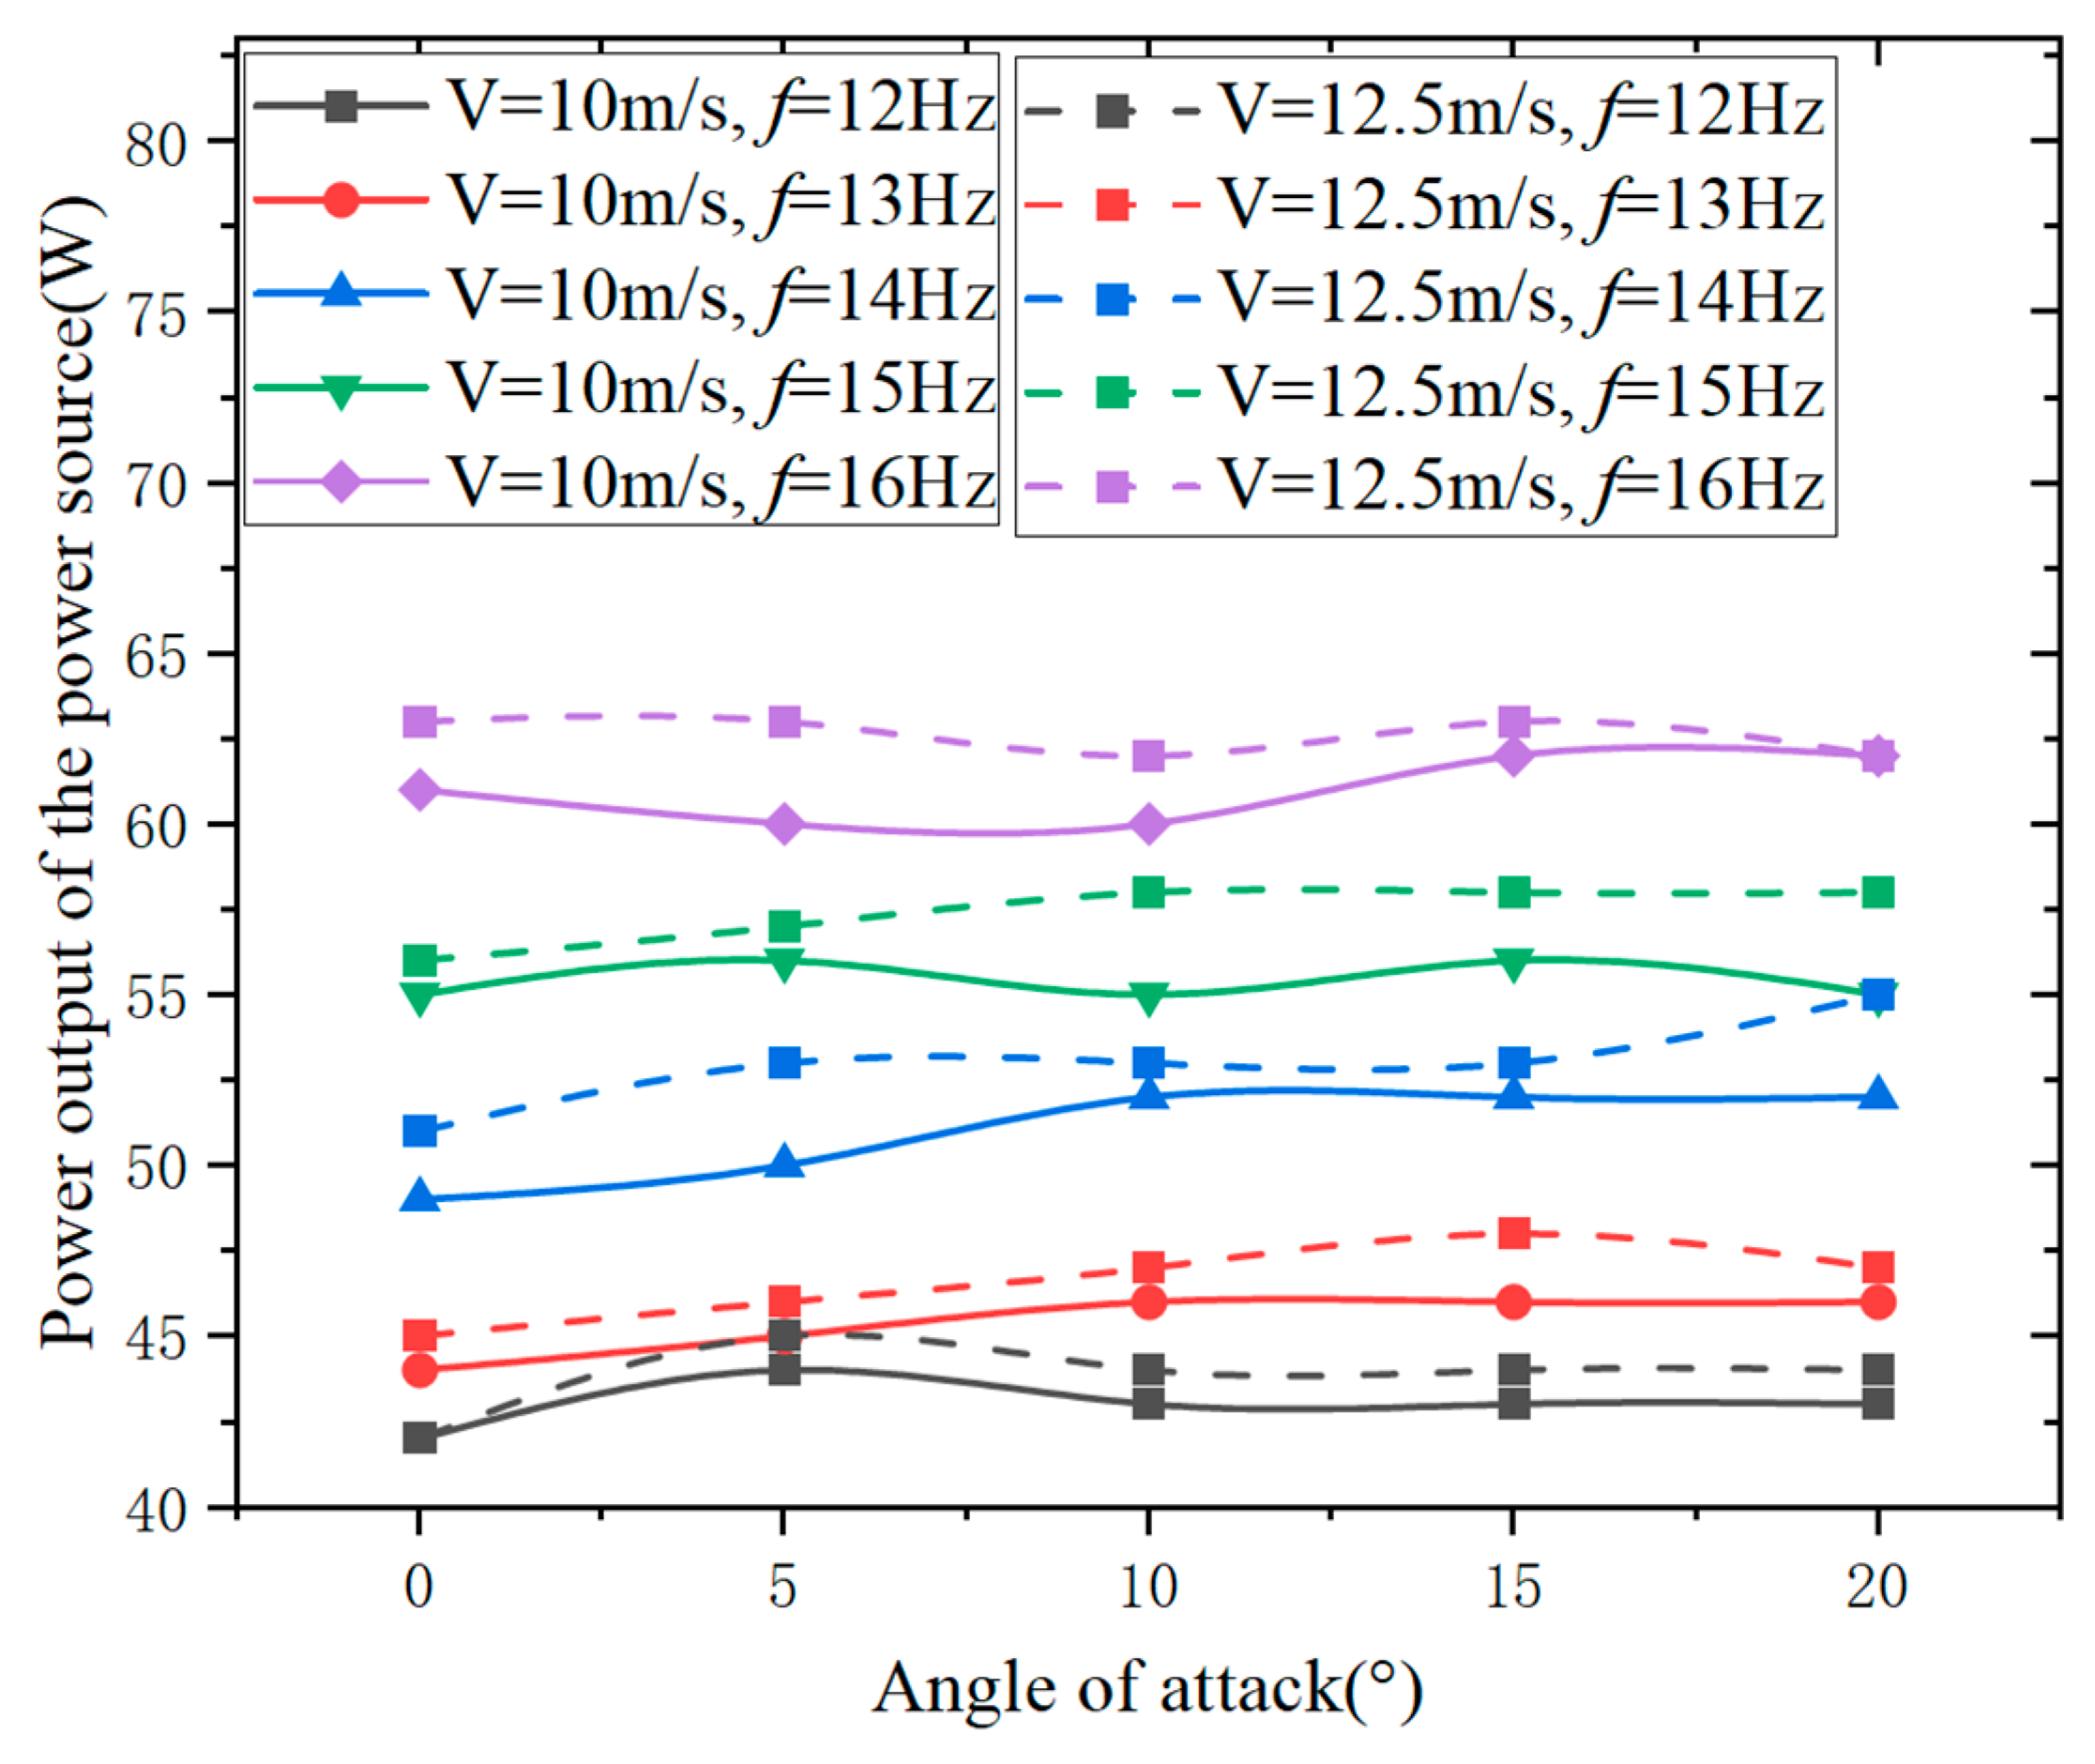
Figure 27, at specific wind speeds and flapping frequencies, the input power of the GTS V3 2104 motor flight test prototype shows little variation with an increase in angle of attack. At specific wind speeds and angles of attack, the input power increases with an increase in flapping frequency. Similarly, at specific flapping frequencies and angles of attack, the input power increases with an increase in wind speed. In
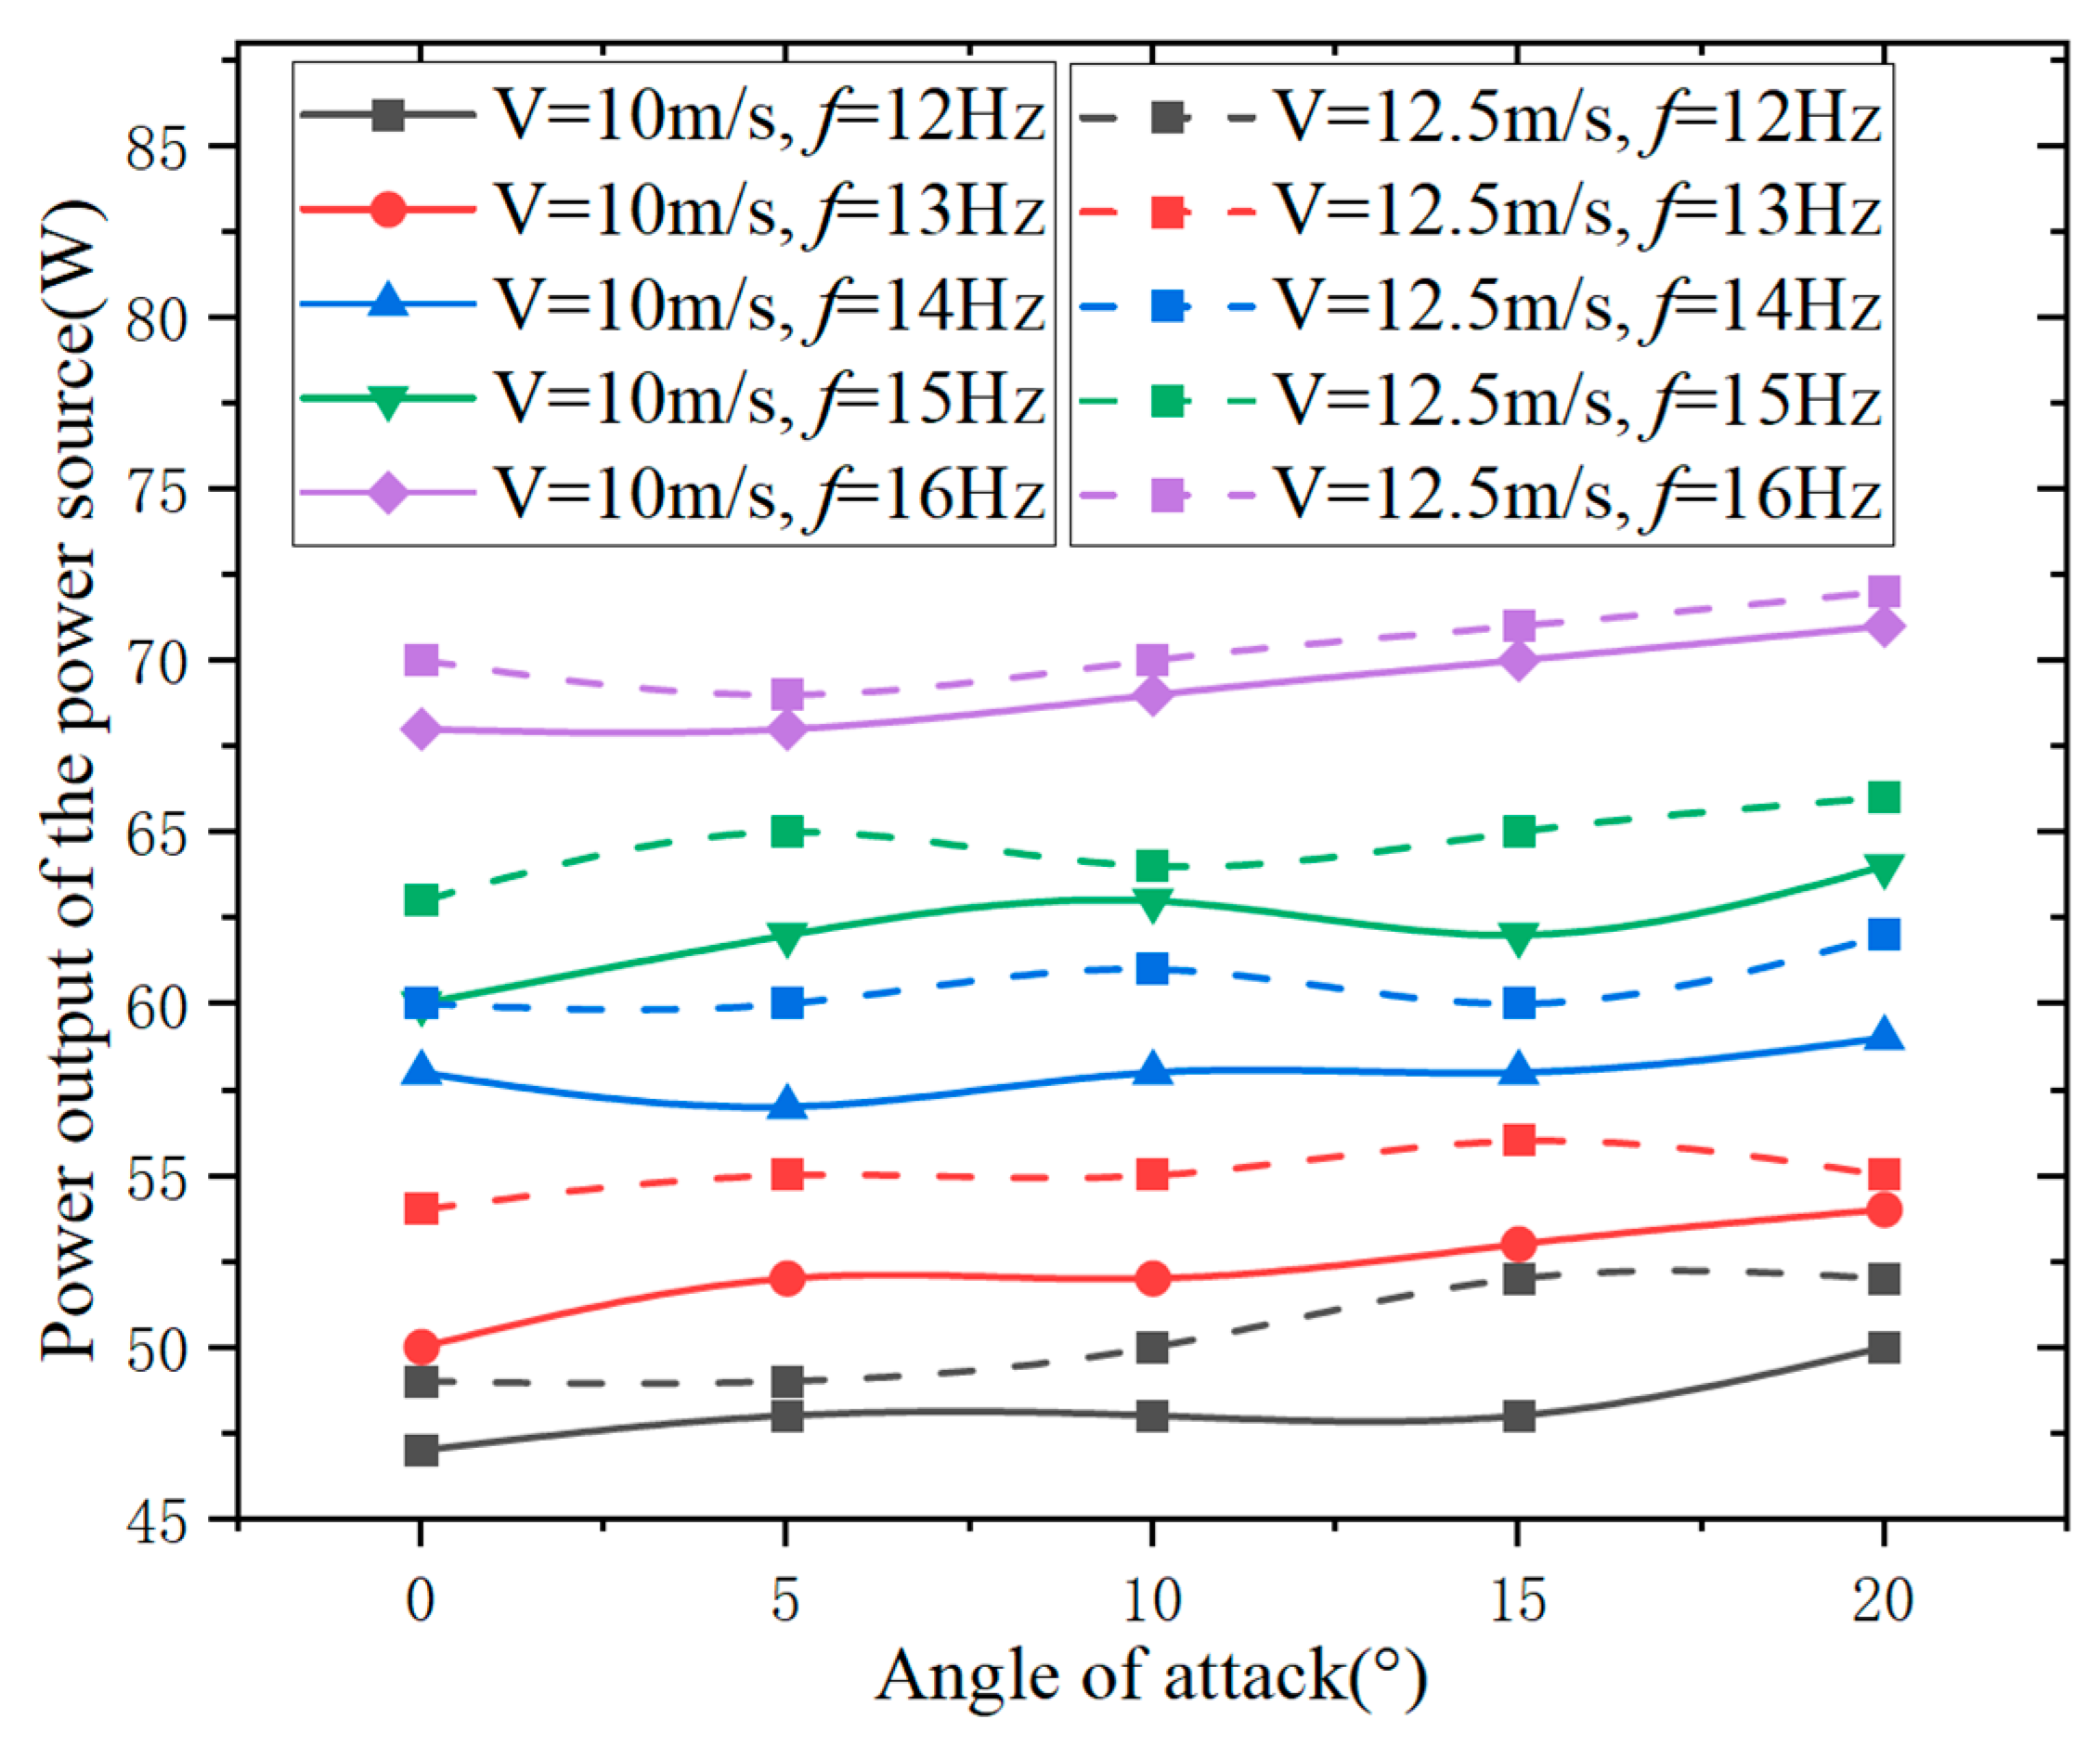
Figure 28, at specific wind speeds and flapping frequencies, the input power of the Aeolus 2105.5 motor flight test prototype also shows little variation with an increase in angle of attack. At specific wind speeds and angles of attack, the input power increases with an increase in flapping frequency. Likewise, at specific flapping frequencies and angles of attack, the input power increases with an increase in wind speed.
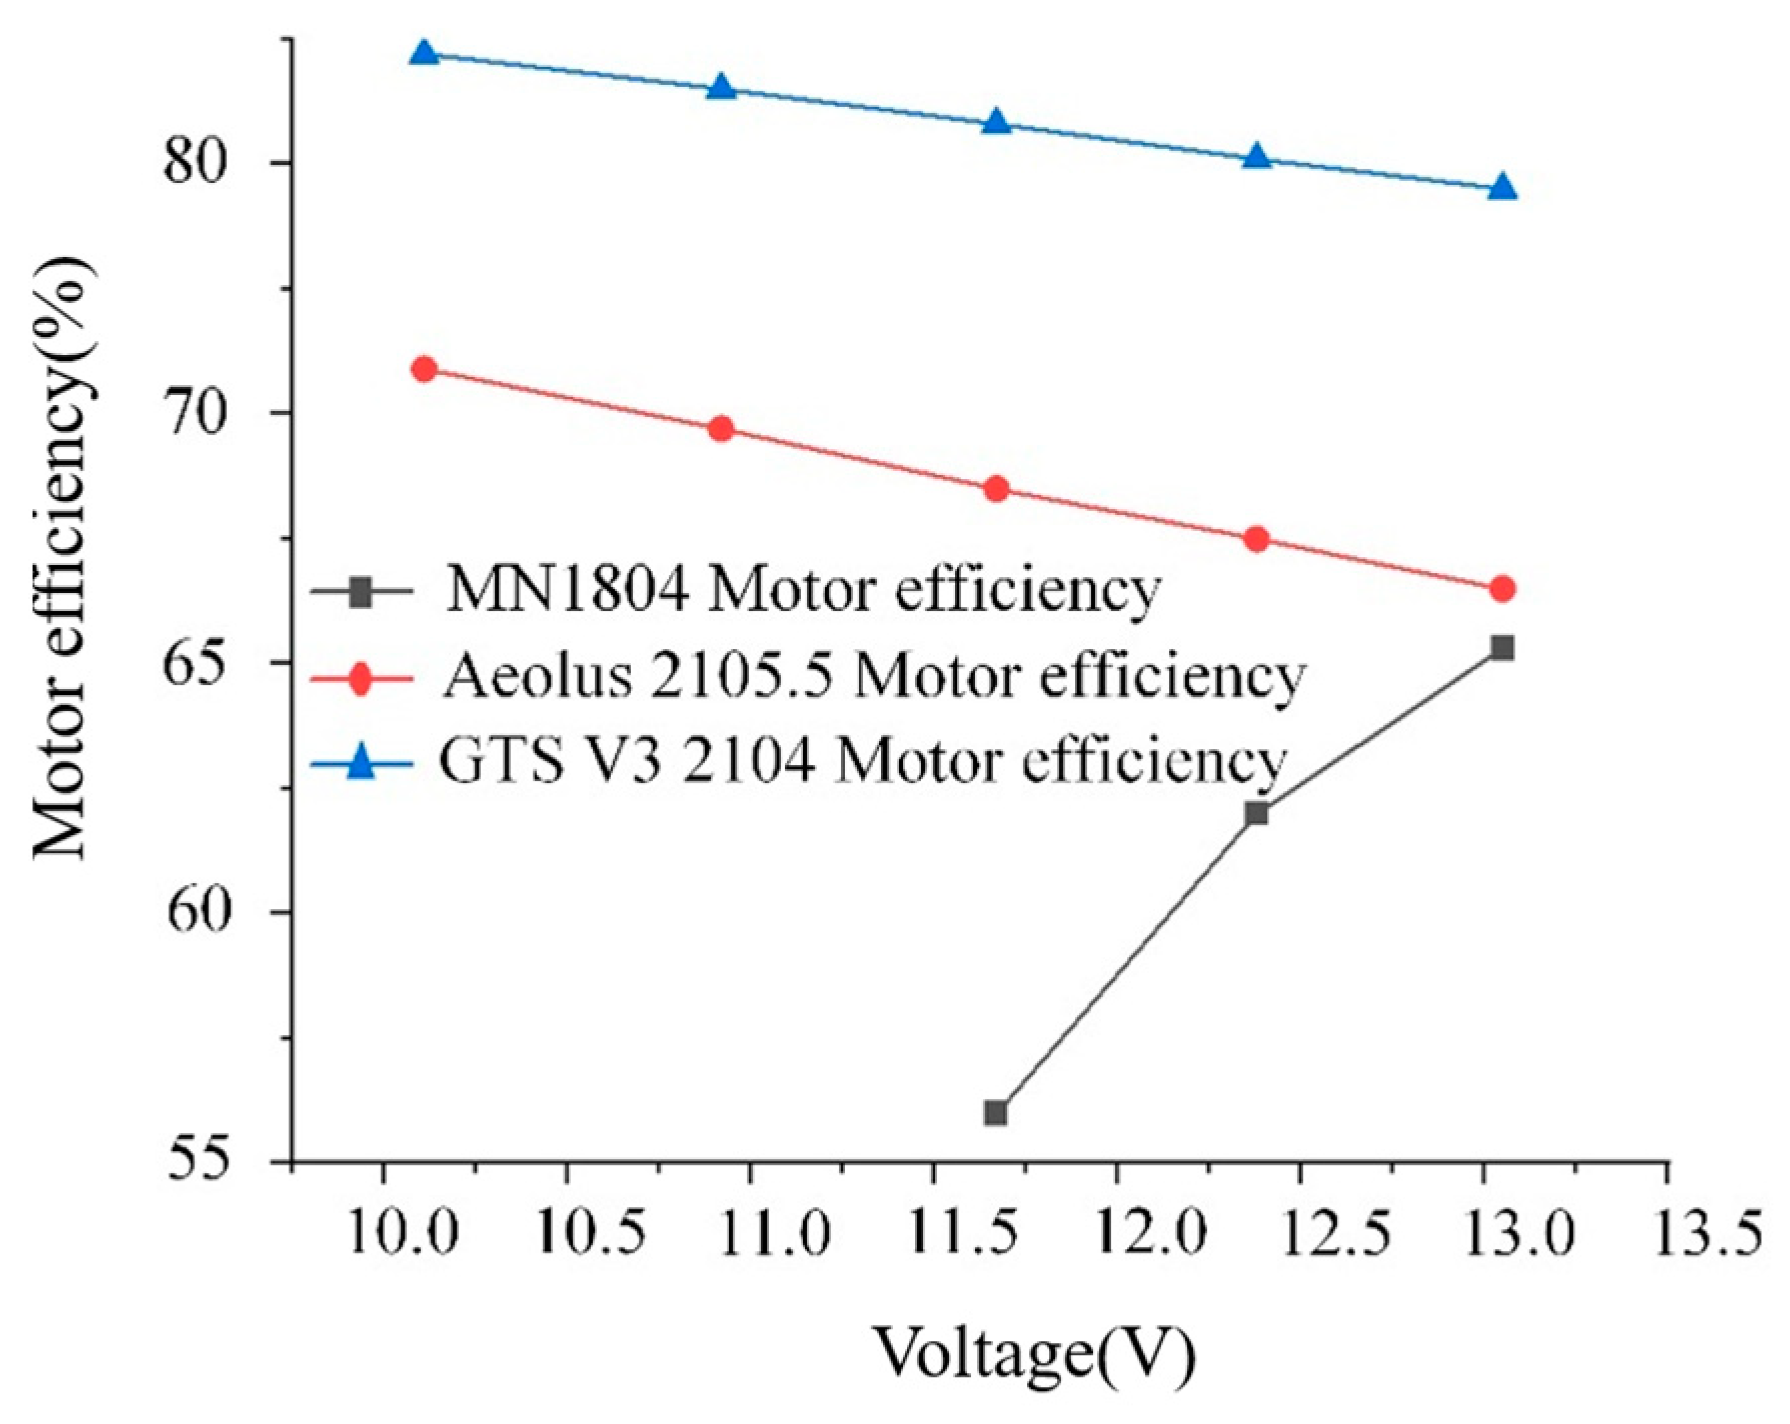
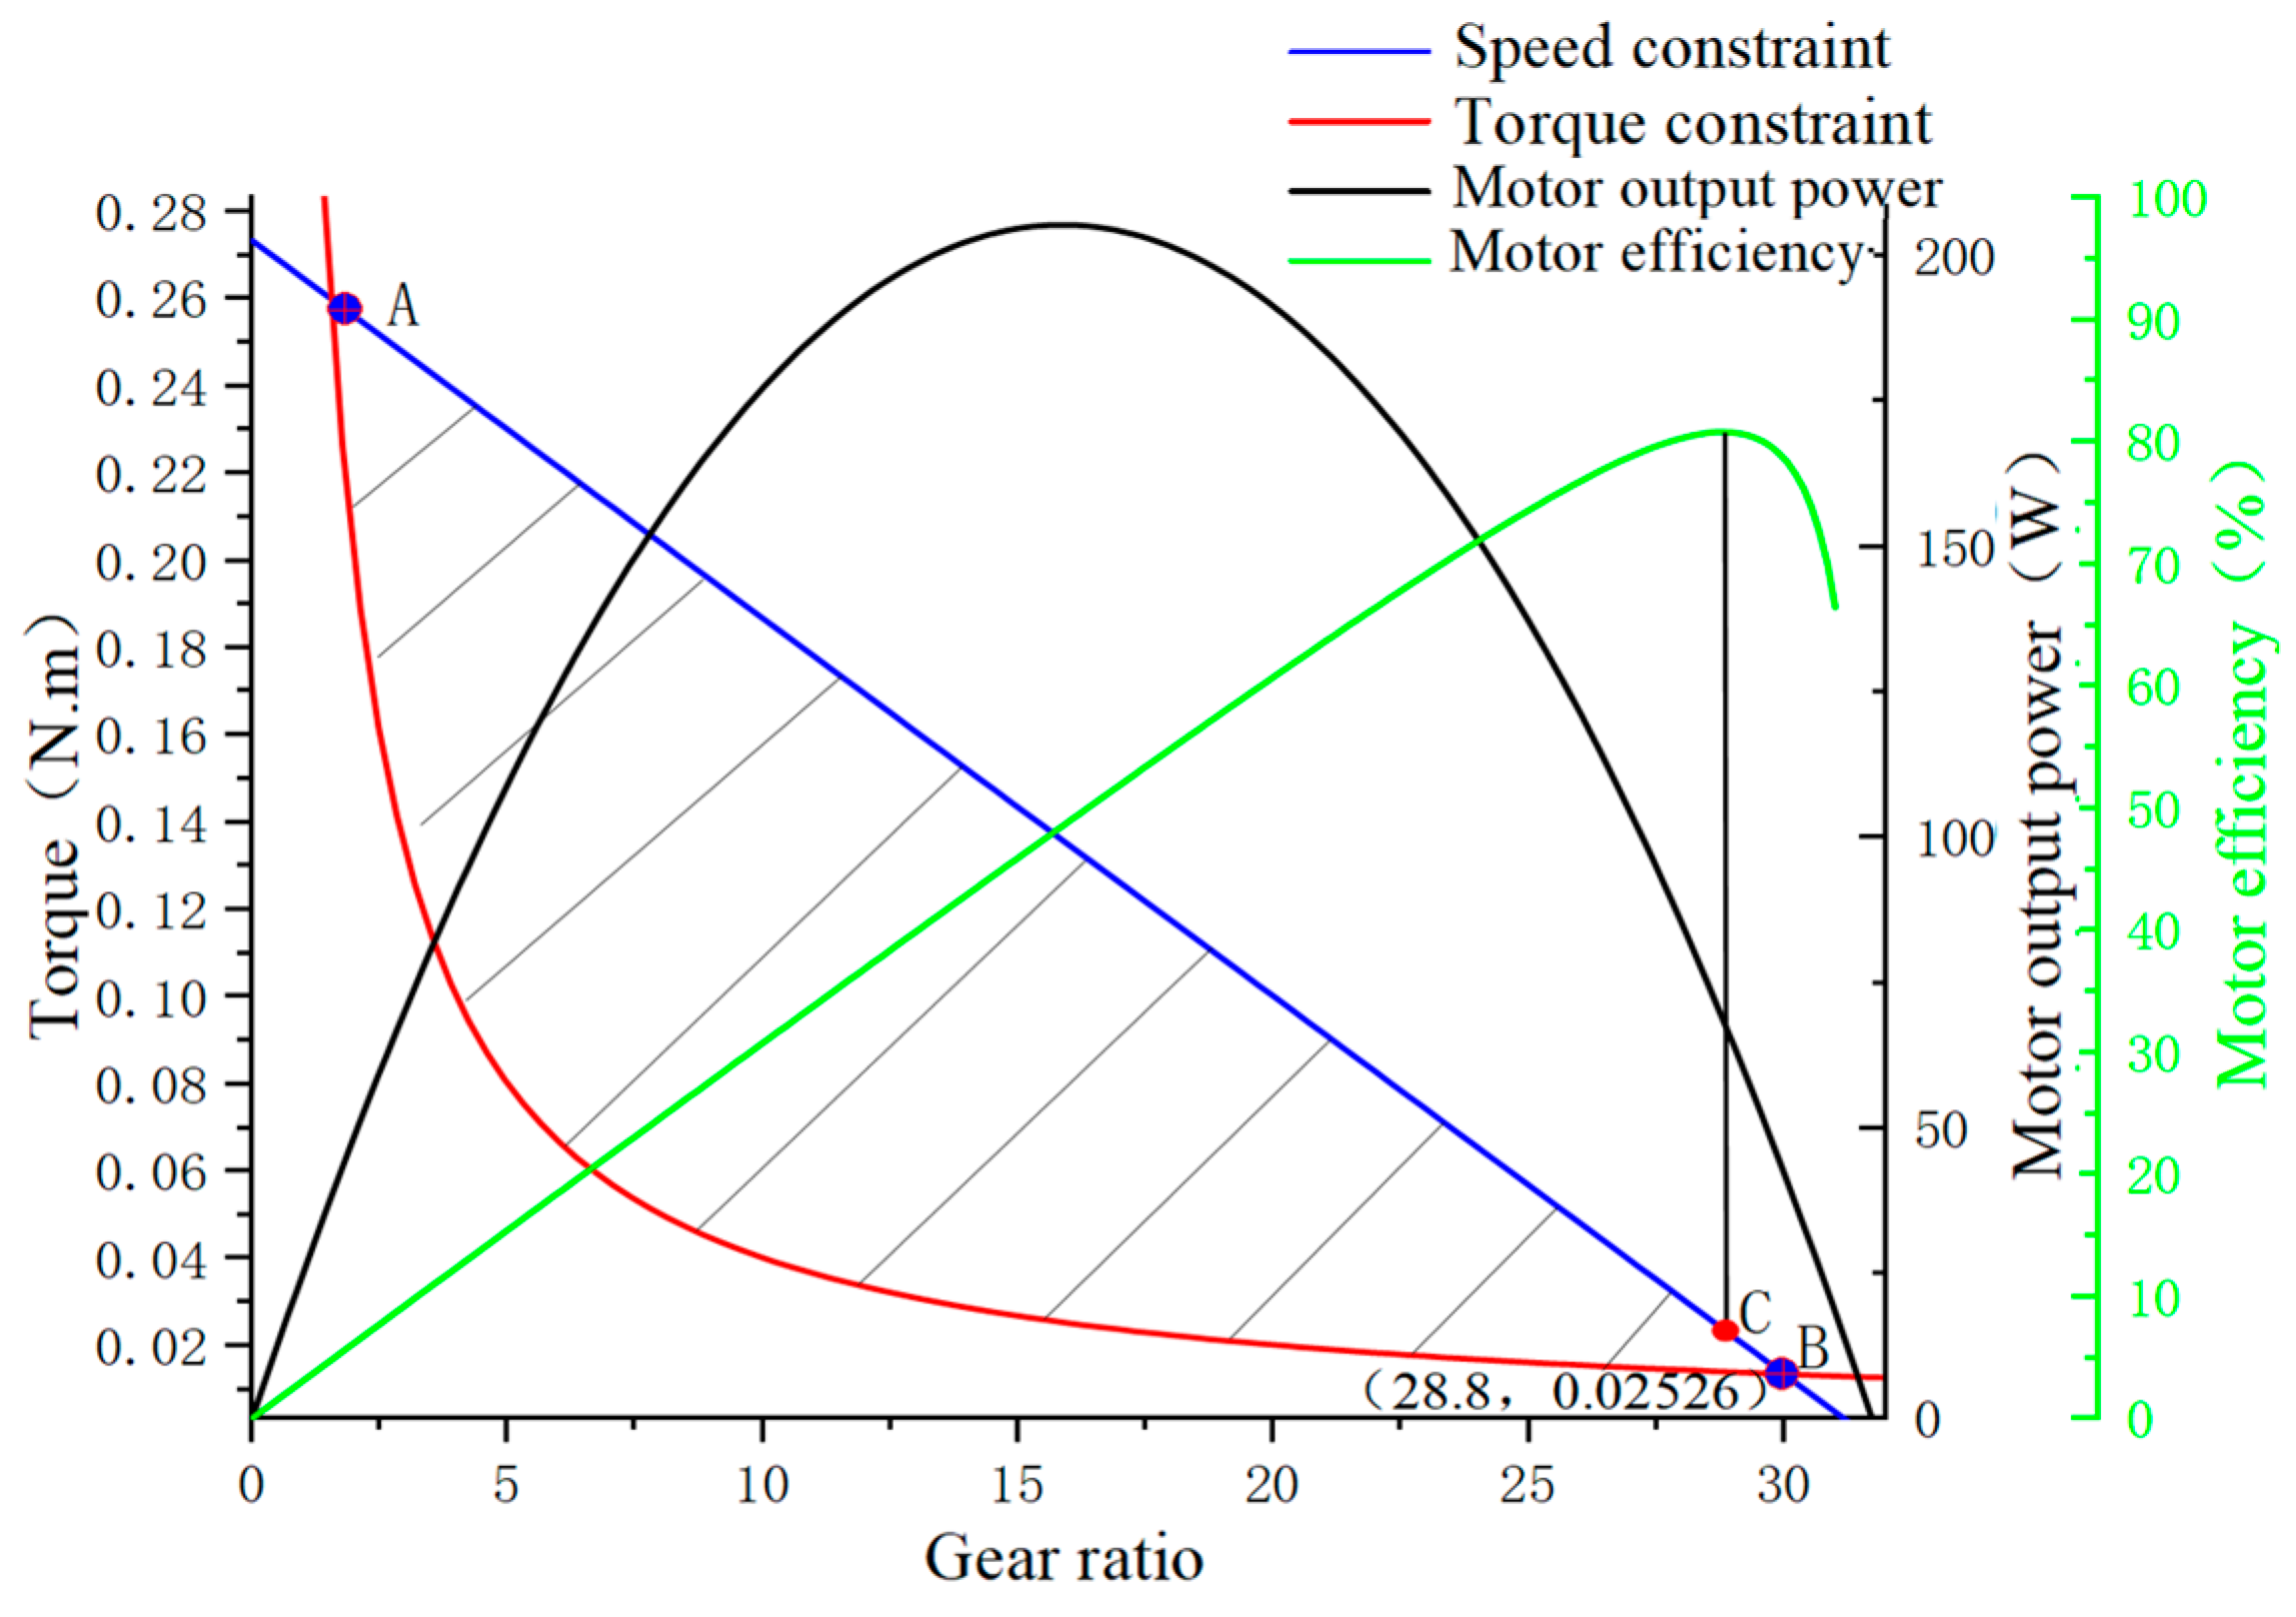
Comparing with
Figure 4, at a flapping frequency of 15 Hz, the MN1804 motor requires an input power of 60 W, the GTS V3 2104 motor requires an input power of 55.4 W, and the Aeolus 2105.5 motor requires an input power of 62.2 W. Additionally, under the same flapping frequency and angle of attack, there is little difference in lift and thrust between the Aeolus 2105.5 motor and the GTS V3 2104 motor flight test prototypes. Therefore, in order to maximize the aircraft’s endurance, the GTS V3 2104 motor is superior to the other two motors.
From the wind tunnel experimental results, it can be observed that the lift of the flight test prototype increases with an increase in angle of attack, while the thrust decreases with an increase in angle of attack. Angle of attack has a significant influence on both lift and thrust. Within a certain range, as the angle of attack increases, the lift coefficient increases, leading to an increase in lift. However, an increase in angle of attack also results in increased drag, which reduces the thrust.
At angles of attack of 15° and 20°, the lift increases with an increase in flapping frequency, but the increment is relatively small. For other angles of attack, the variation of lift with flapping frequency is not significant. This is because the increase in lift is primarily influenced by the velocity and angle of attack, while the flapping frequency can only enhance the peak instantaneous lift but has little effect on the average lift.
Regardless of the angle of attack, the thrust increases with an increase in flapping frequency, and the increment is significant. This indicates that the flapping frequency has a smaller impact on lift but a larger impact on thrust. This is because when the flapping frequency increases, the interaction between the object and the fluid occurs more frequently within a unit of time, resulting in a greater transfer of momentum to the fluid.
An increase in wind speed leads to a significant increase in lift but also a significant decrease in thrust. This is because an increase in wind speed results in a larger pressure difference between the upper and lower surfaces of the wing, thereby increasing lift. However, the faster fluid velocity generates greater momentum loss and increased drag, which reduces thrust.
Angle of attack has a minor impact on the input power of the power supply. Under different angles of attack, the difference in input power is minimal. On the other hand, flapping frequency and wind speed have a significant influence on the input power of the power supply. As the wind speed and flapping frequency increase, the input power of the power supply increases noticeably.
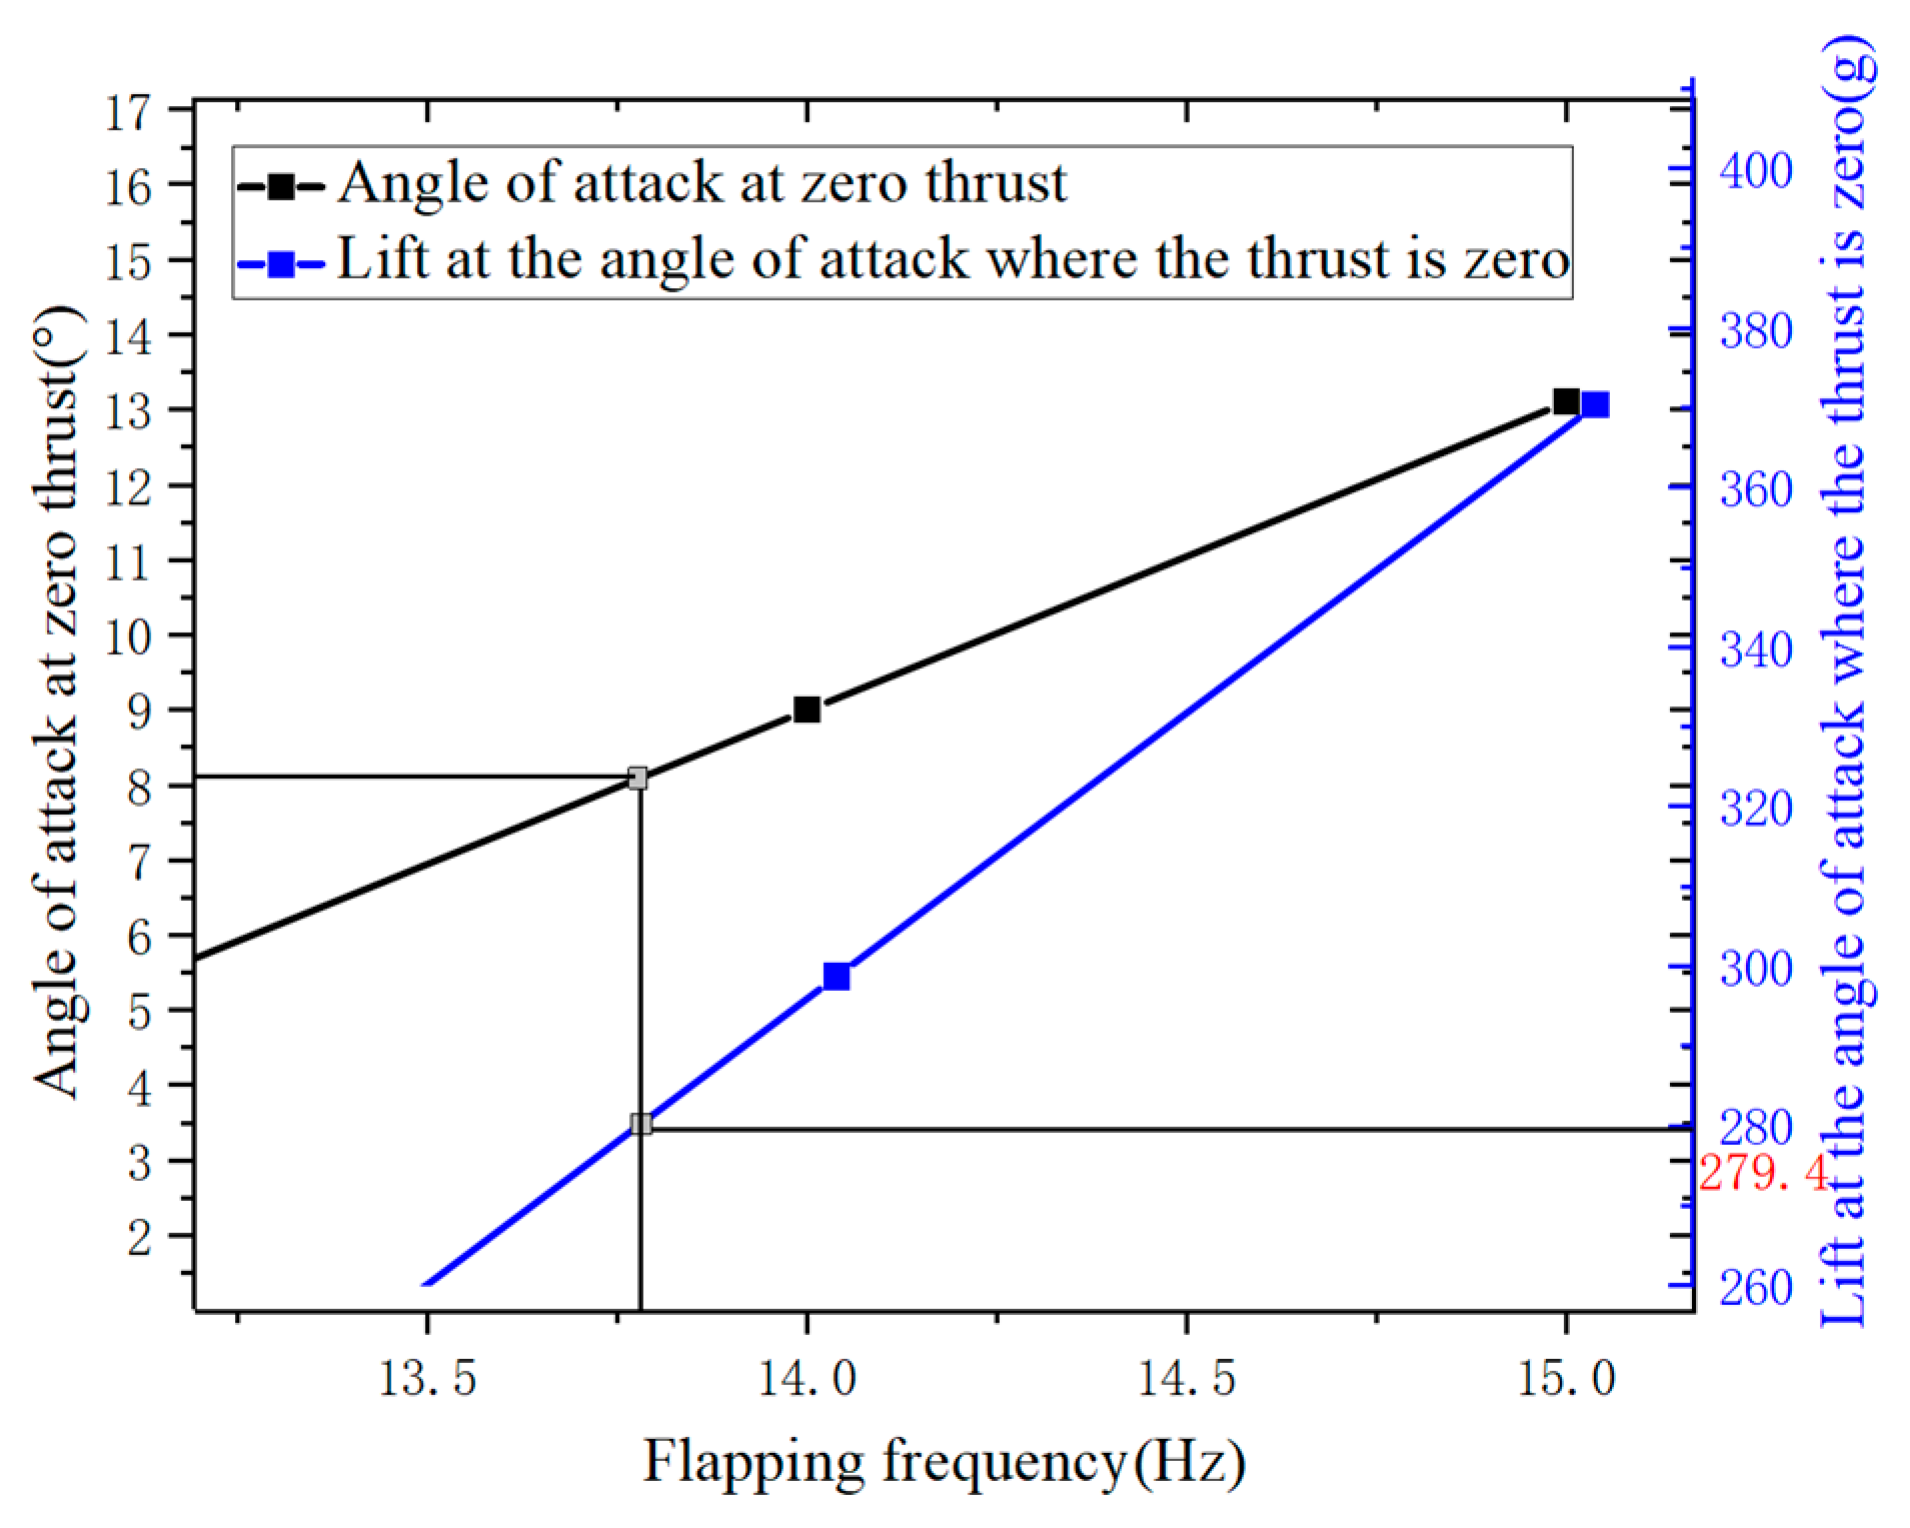
According to the wind tunnel experimental results, the variation of the angle of attack at zero thrust and the corresponding lift at a wind speed of 12.5 m/s and flapping frequencies of 14 Hz and 15 Hz are shown in
Figure 29. When the flapping frequency is 13 Hz, the thrust is non-zero at all angles of attack. Therefore, based on the results at flapping frequencies of 14 Hz and 15 Hz, a fitting extrapolation is performed, yielding a trimmed flapping frequency of 13.7 Hz and an angle of attack of 7.9° for a lift of 279.4 g.
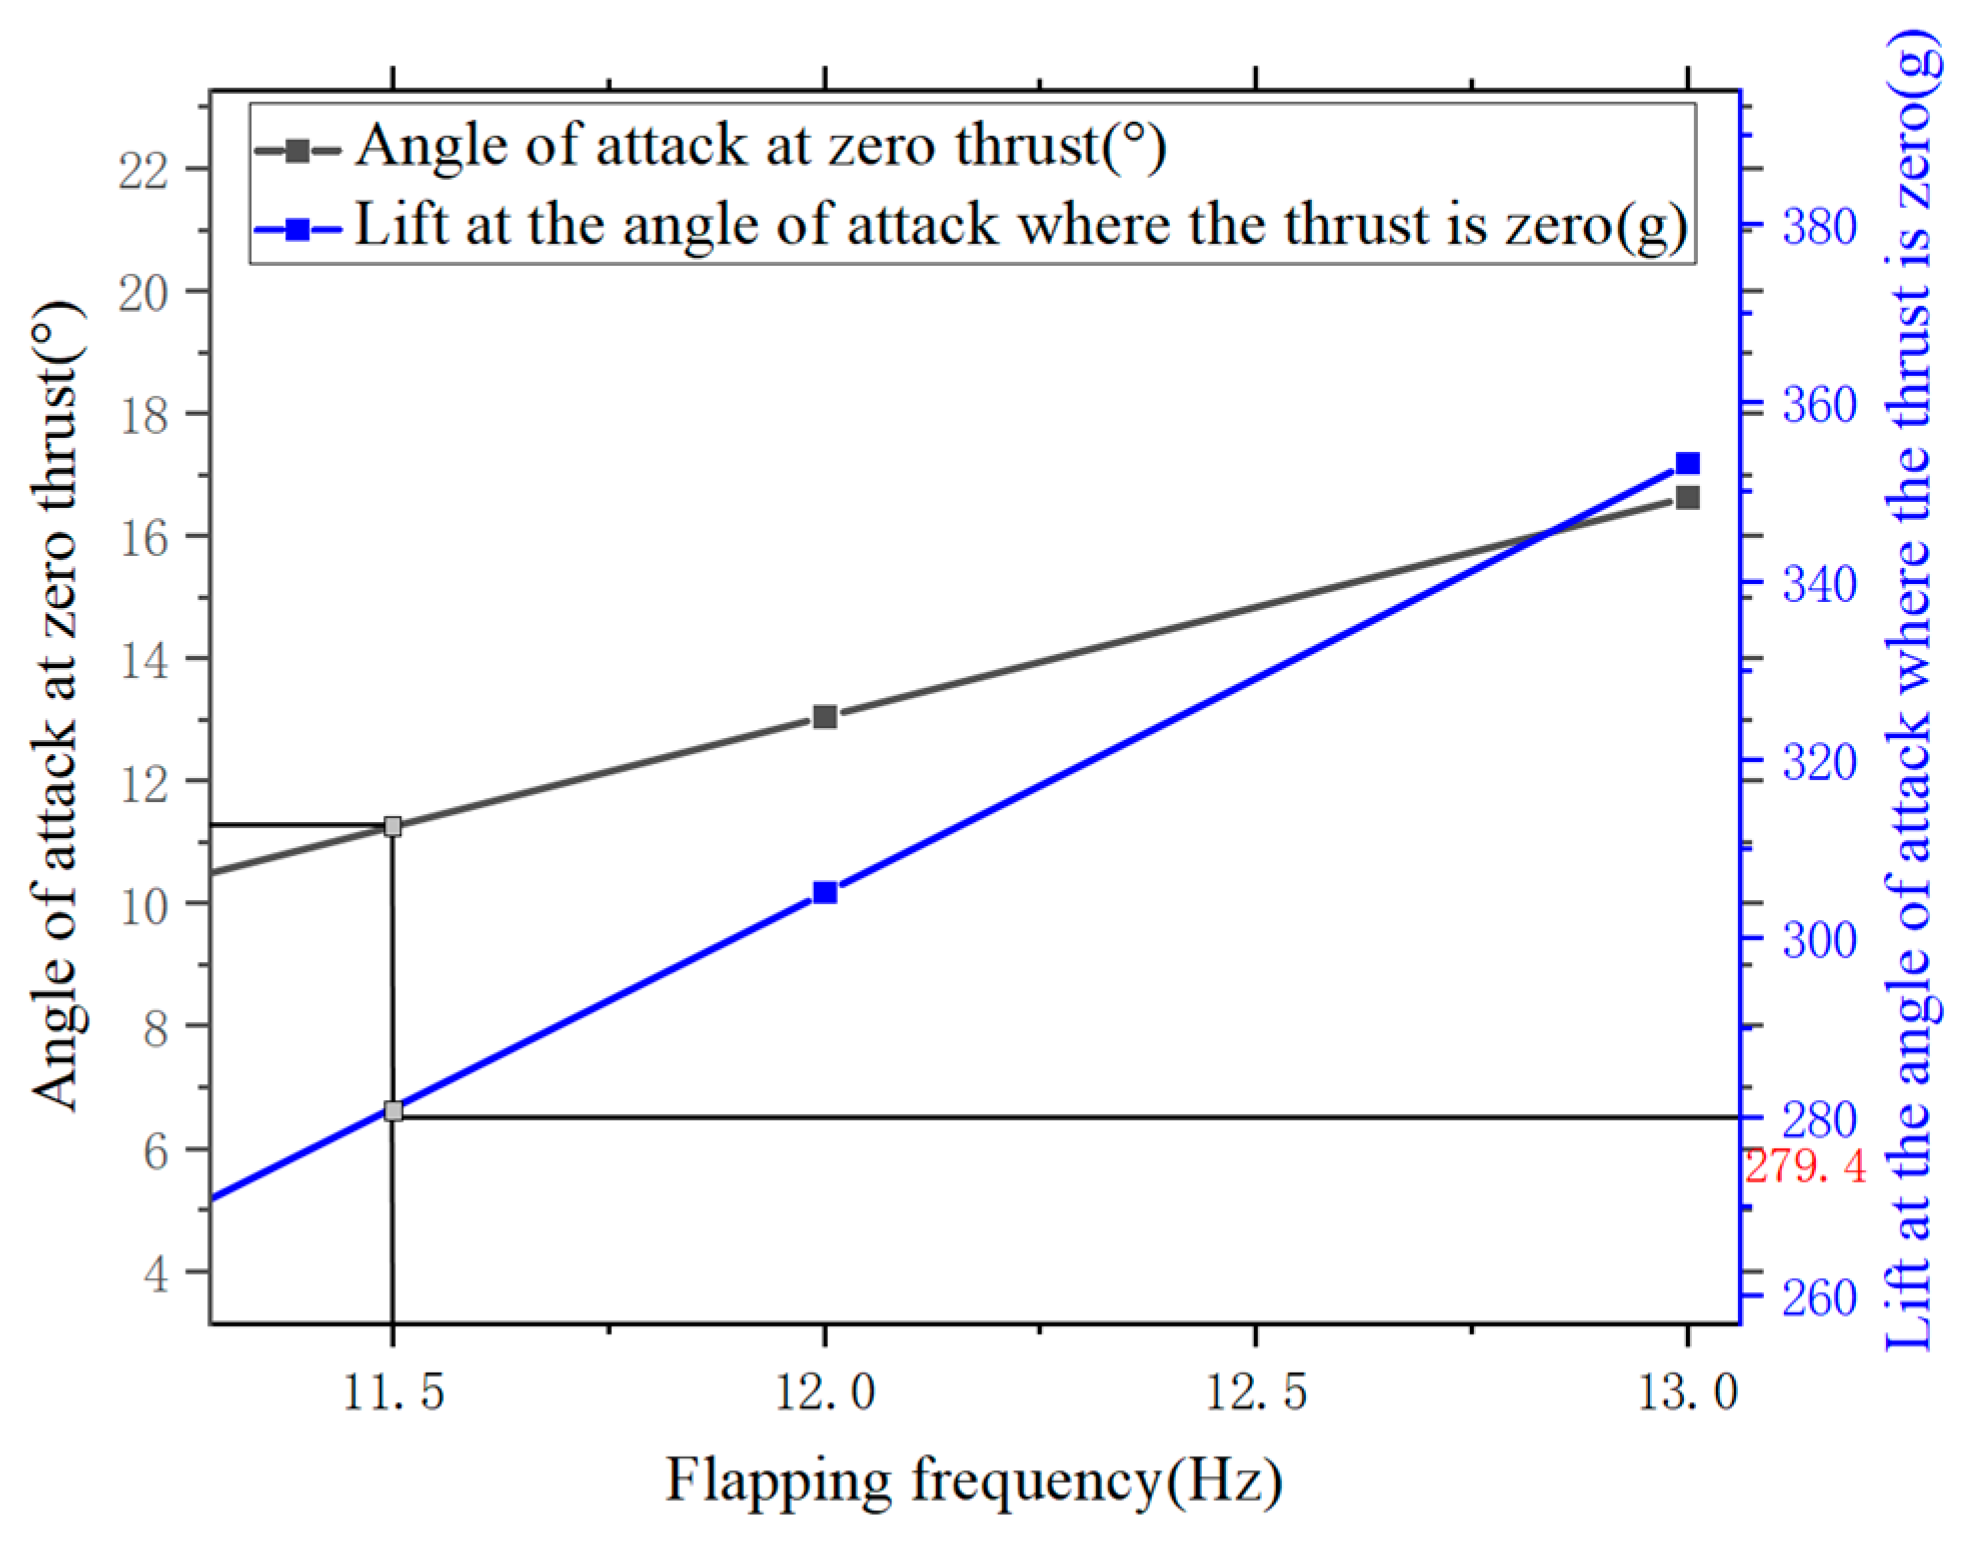
Similarly, for a wind speed of 10 m/s and flapping frequencies of 12 Hz and 13 Hz, the variation of the angle of attack at zero thrust and the corresponding lift are shown in
Figure 30. A fitting extrapolation yields a trimmed flapping frequency of 11.5 Hz and an angle of attack of 11.1° for a lift of 279.4 g.
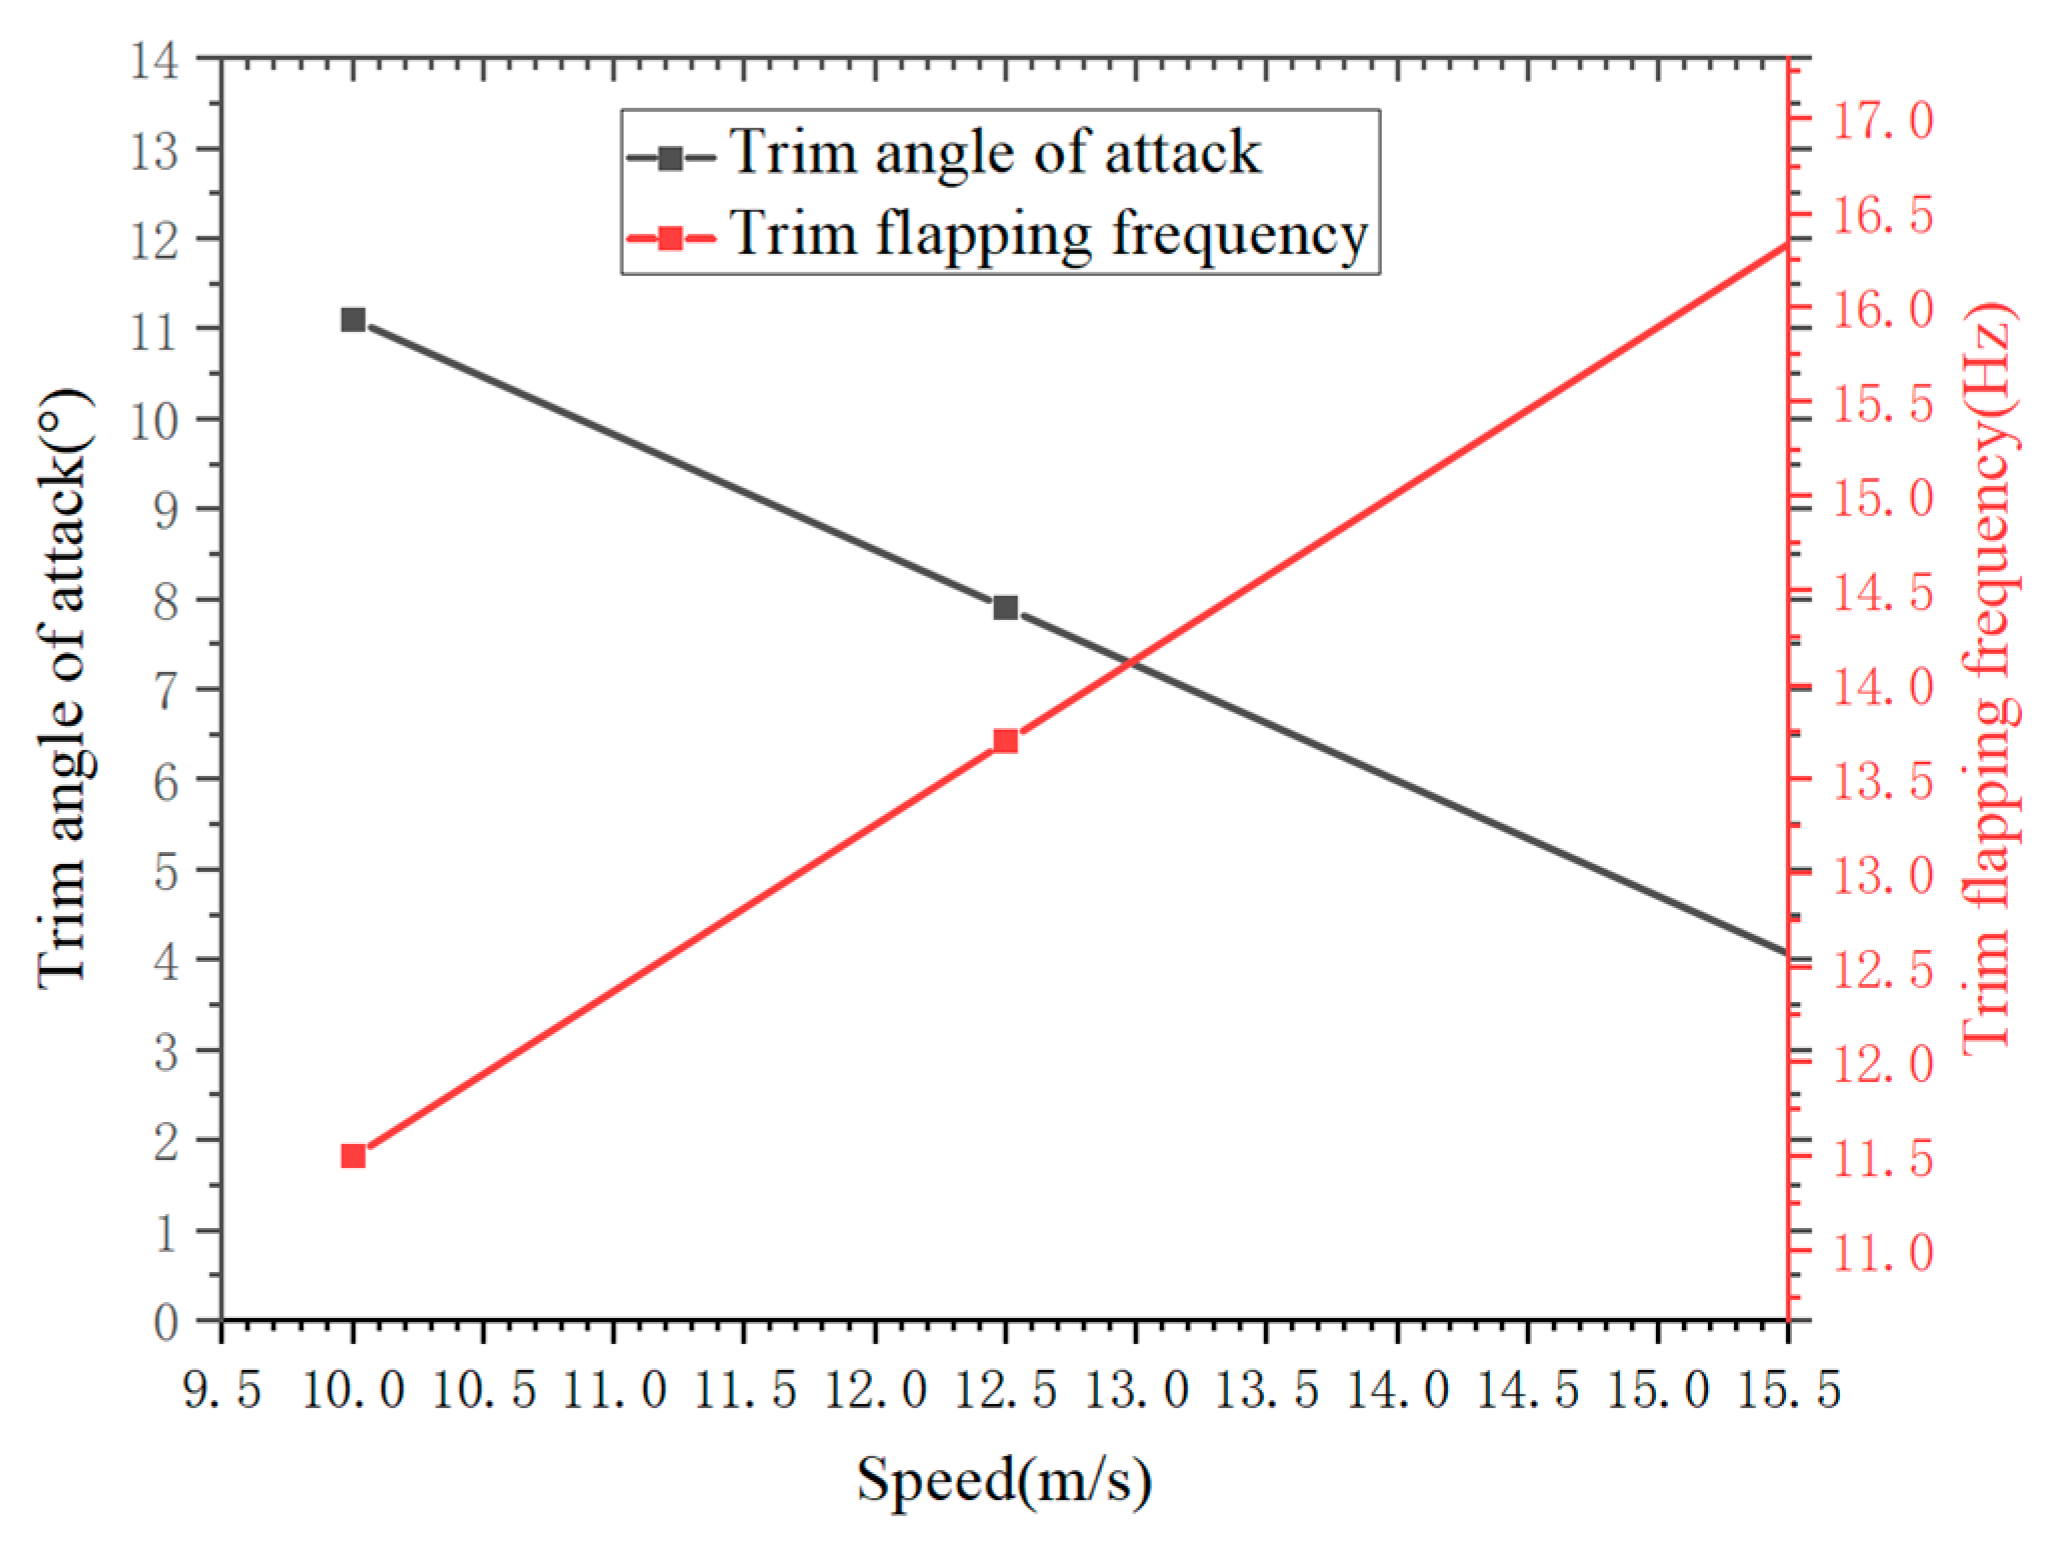
The curves depicting the trimmed flapping frequency and angle of attack as a function of velocity are shown in
Figure 31. From the graph, a fitting extrapolation can be performed to obtain the trimmed pitch angle and trimmed flapping frequency for various wind speeds in the wind tunnel experiments.
5. Results and Discussion of Flight Validation
Actual flight tests were conducted on the prototype aircraft with the GTS V3 2104 motor. The test prototype designed in this study achieved stable flight.
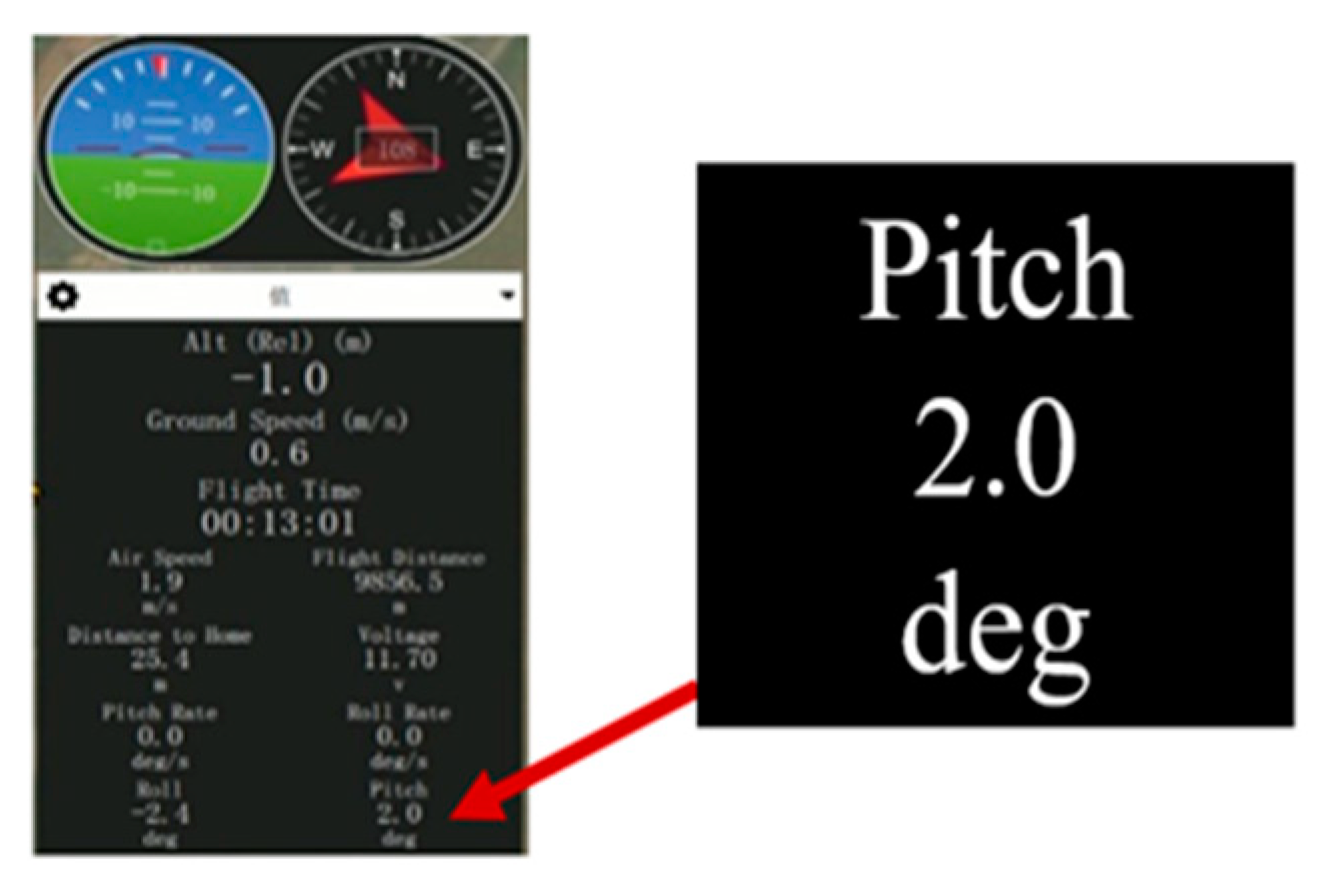
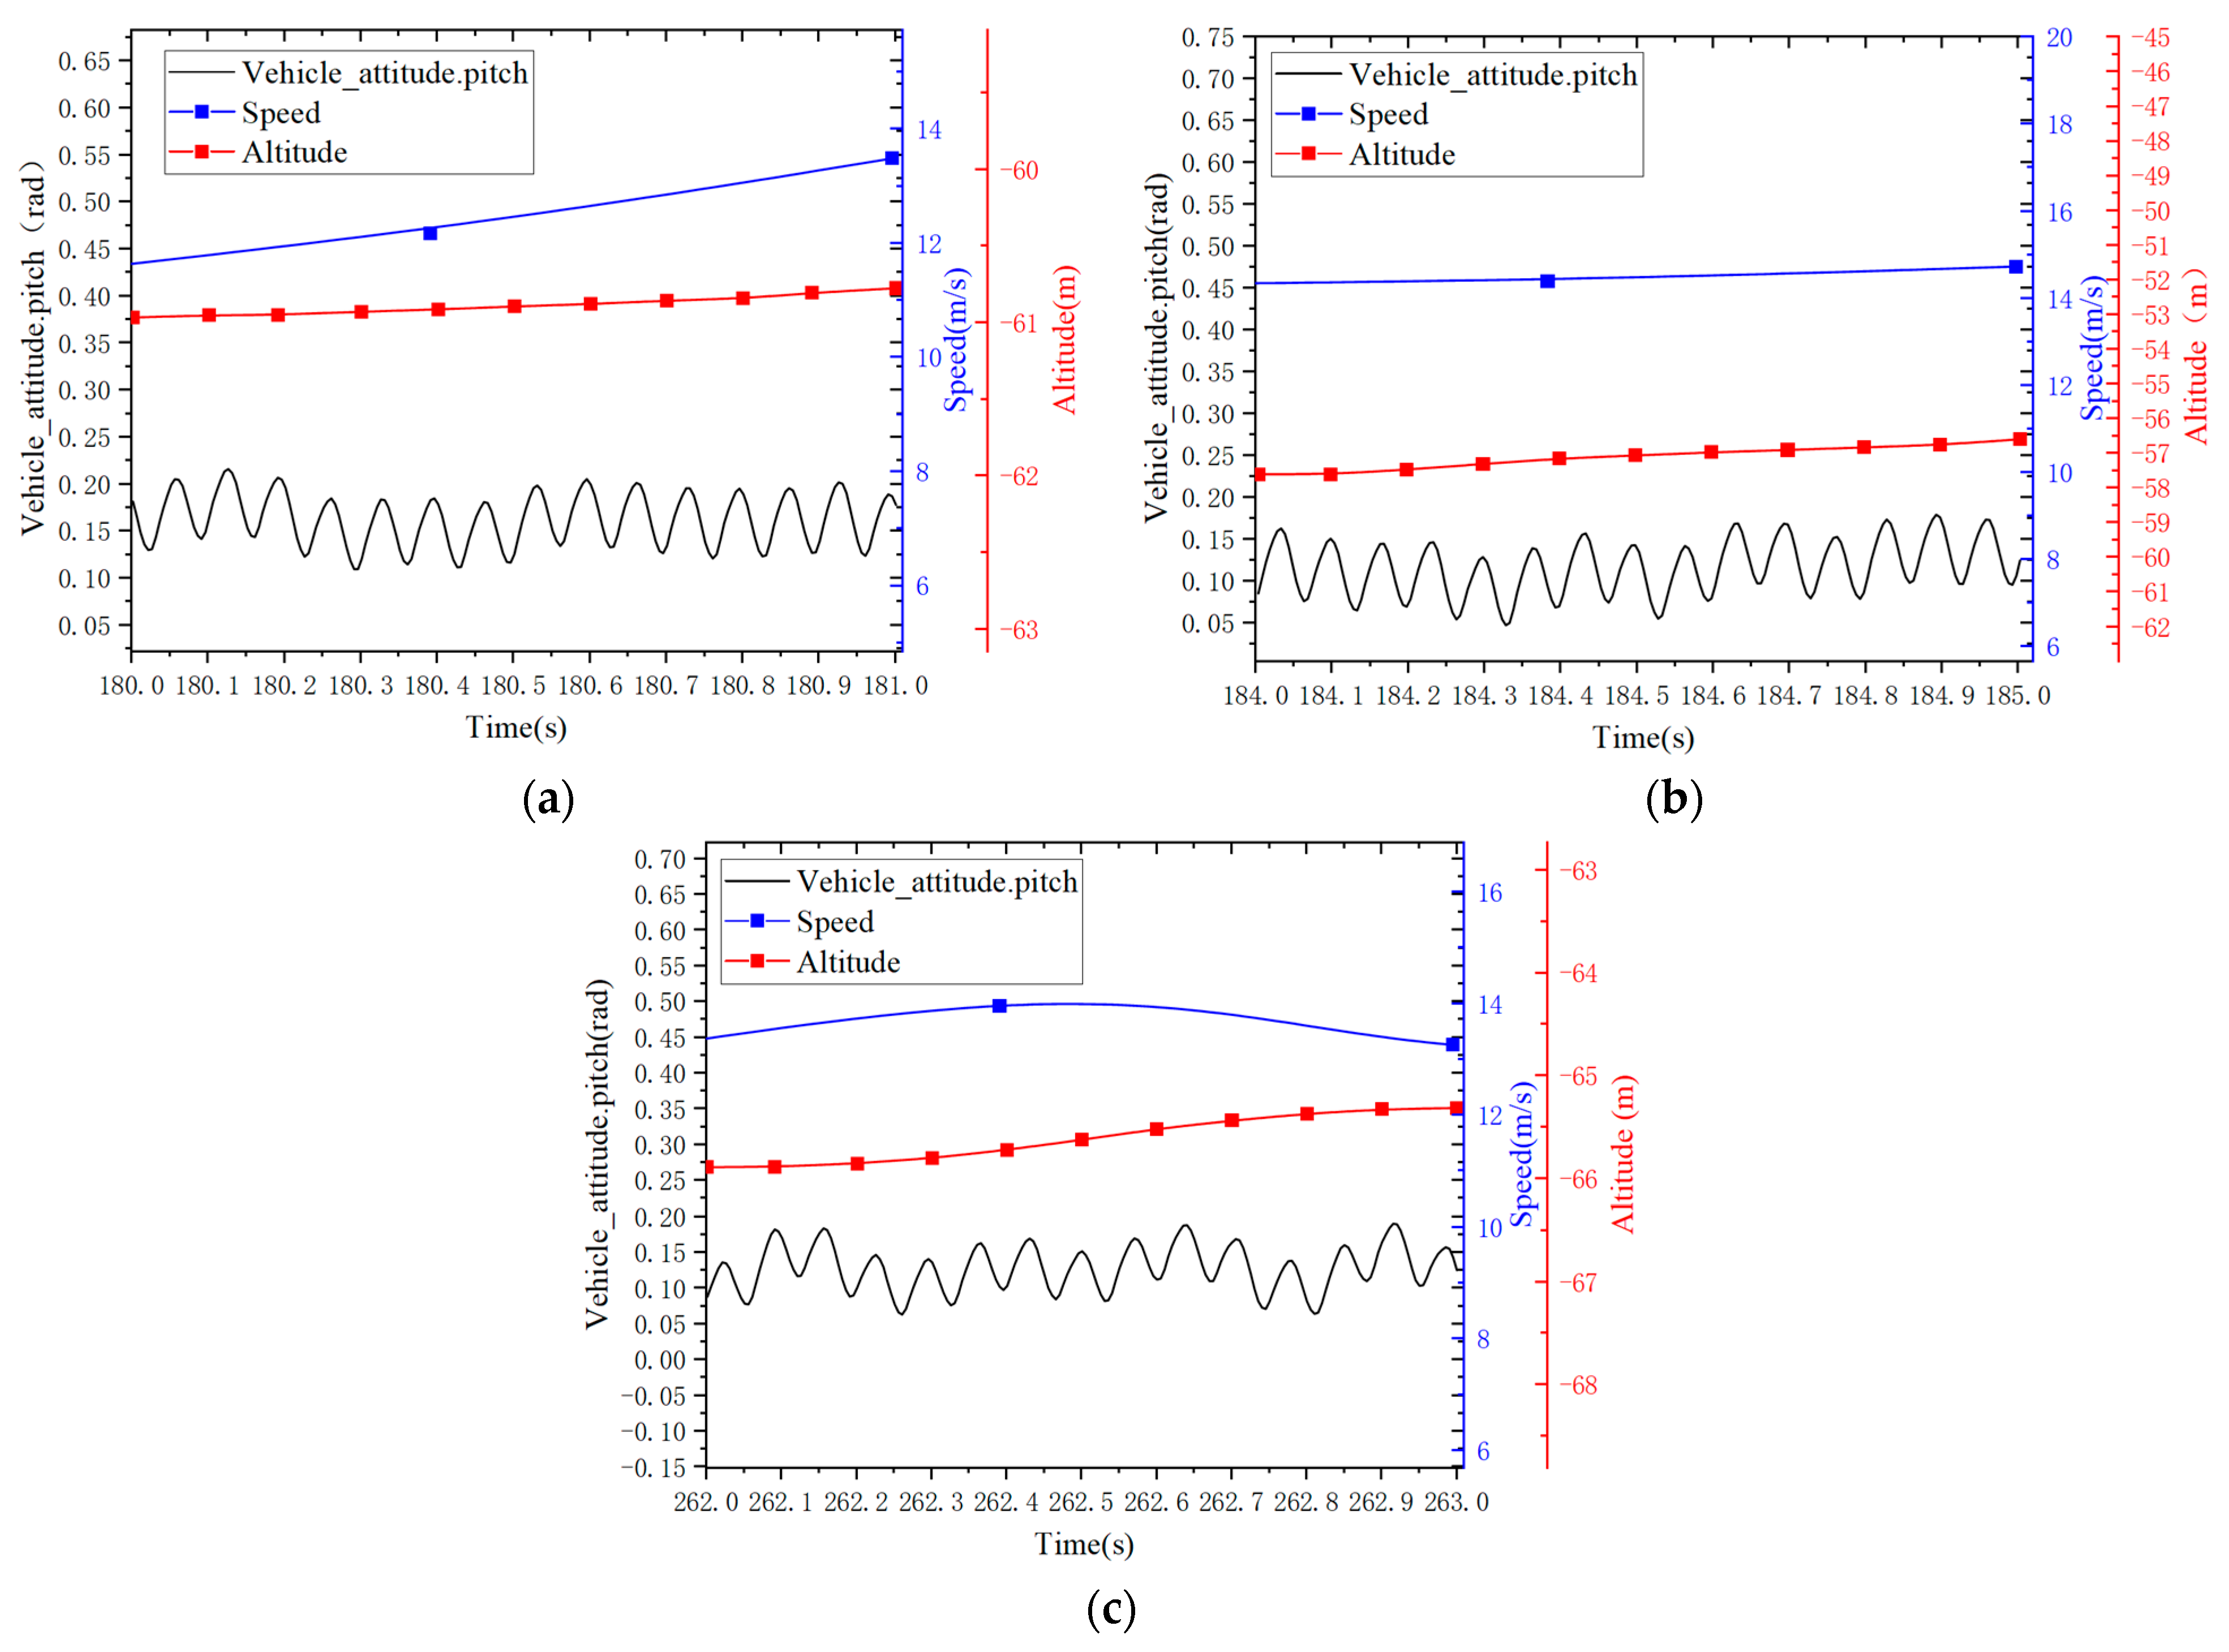
After the flight, the flight log files are converted for analysis of the flight process. The flapping aircraft exhibits a pitching frequency that corresponds to the flapping frequency. Therefore, the pitching frequency of the aircraft can be extracted from the flight log files to obtain the actual flapping frequency during flight. The initial pitch angle of the aircraft on level ground is 2.0°, as shown in
Figure 32. Three time intervals with minimal changes in altitude were selected during the flight process (180 s~181 s, 184 s~185 s, and 262 s~263 s). The average pitch angle, average flight speed, and flapping frequency for each of these intervals are presented in
Table 9. The speeds, altitudes, and pitch angles of three different time periods of the aircraft are shown in
Figure 33.
Based on the fitting results of the trimmed flapping frequency and angle of attack with respect to velocity in
Section 3, the errors of the trimmed flapping frequency, pitch angle, and flight data relative to wind tunnel experiments during the three time intervals (180 s~181 s, 184 s~185 s, 262 s~263 s) are shown in
Table 10. From the table, it can be observed that the error between the measured flapping frequency and the trimmed flapping frequency from wind tunnel experiments is within 10%. The error between the average pitch angle of the aircraft and the trimmed pitch angle from wind tunnel experiments is within 15%. These small errors further demonstrate that the obtained trimmed states from wind tunnel experiments can provide a reliable basis for setting the trim angle of attack in flight tests.
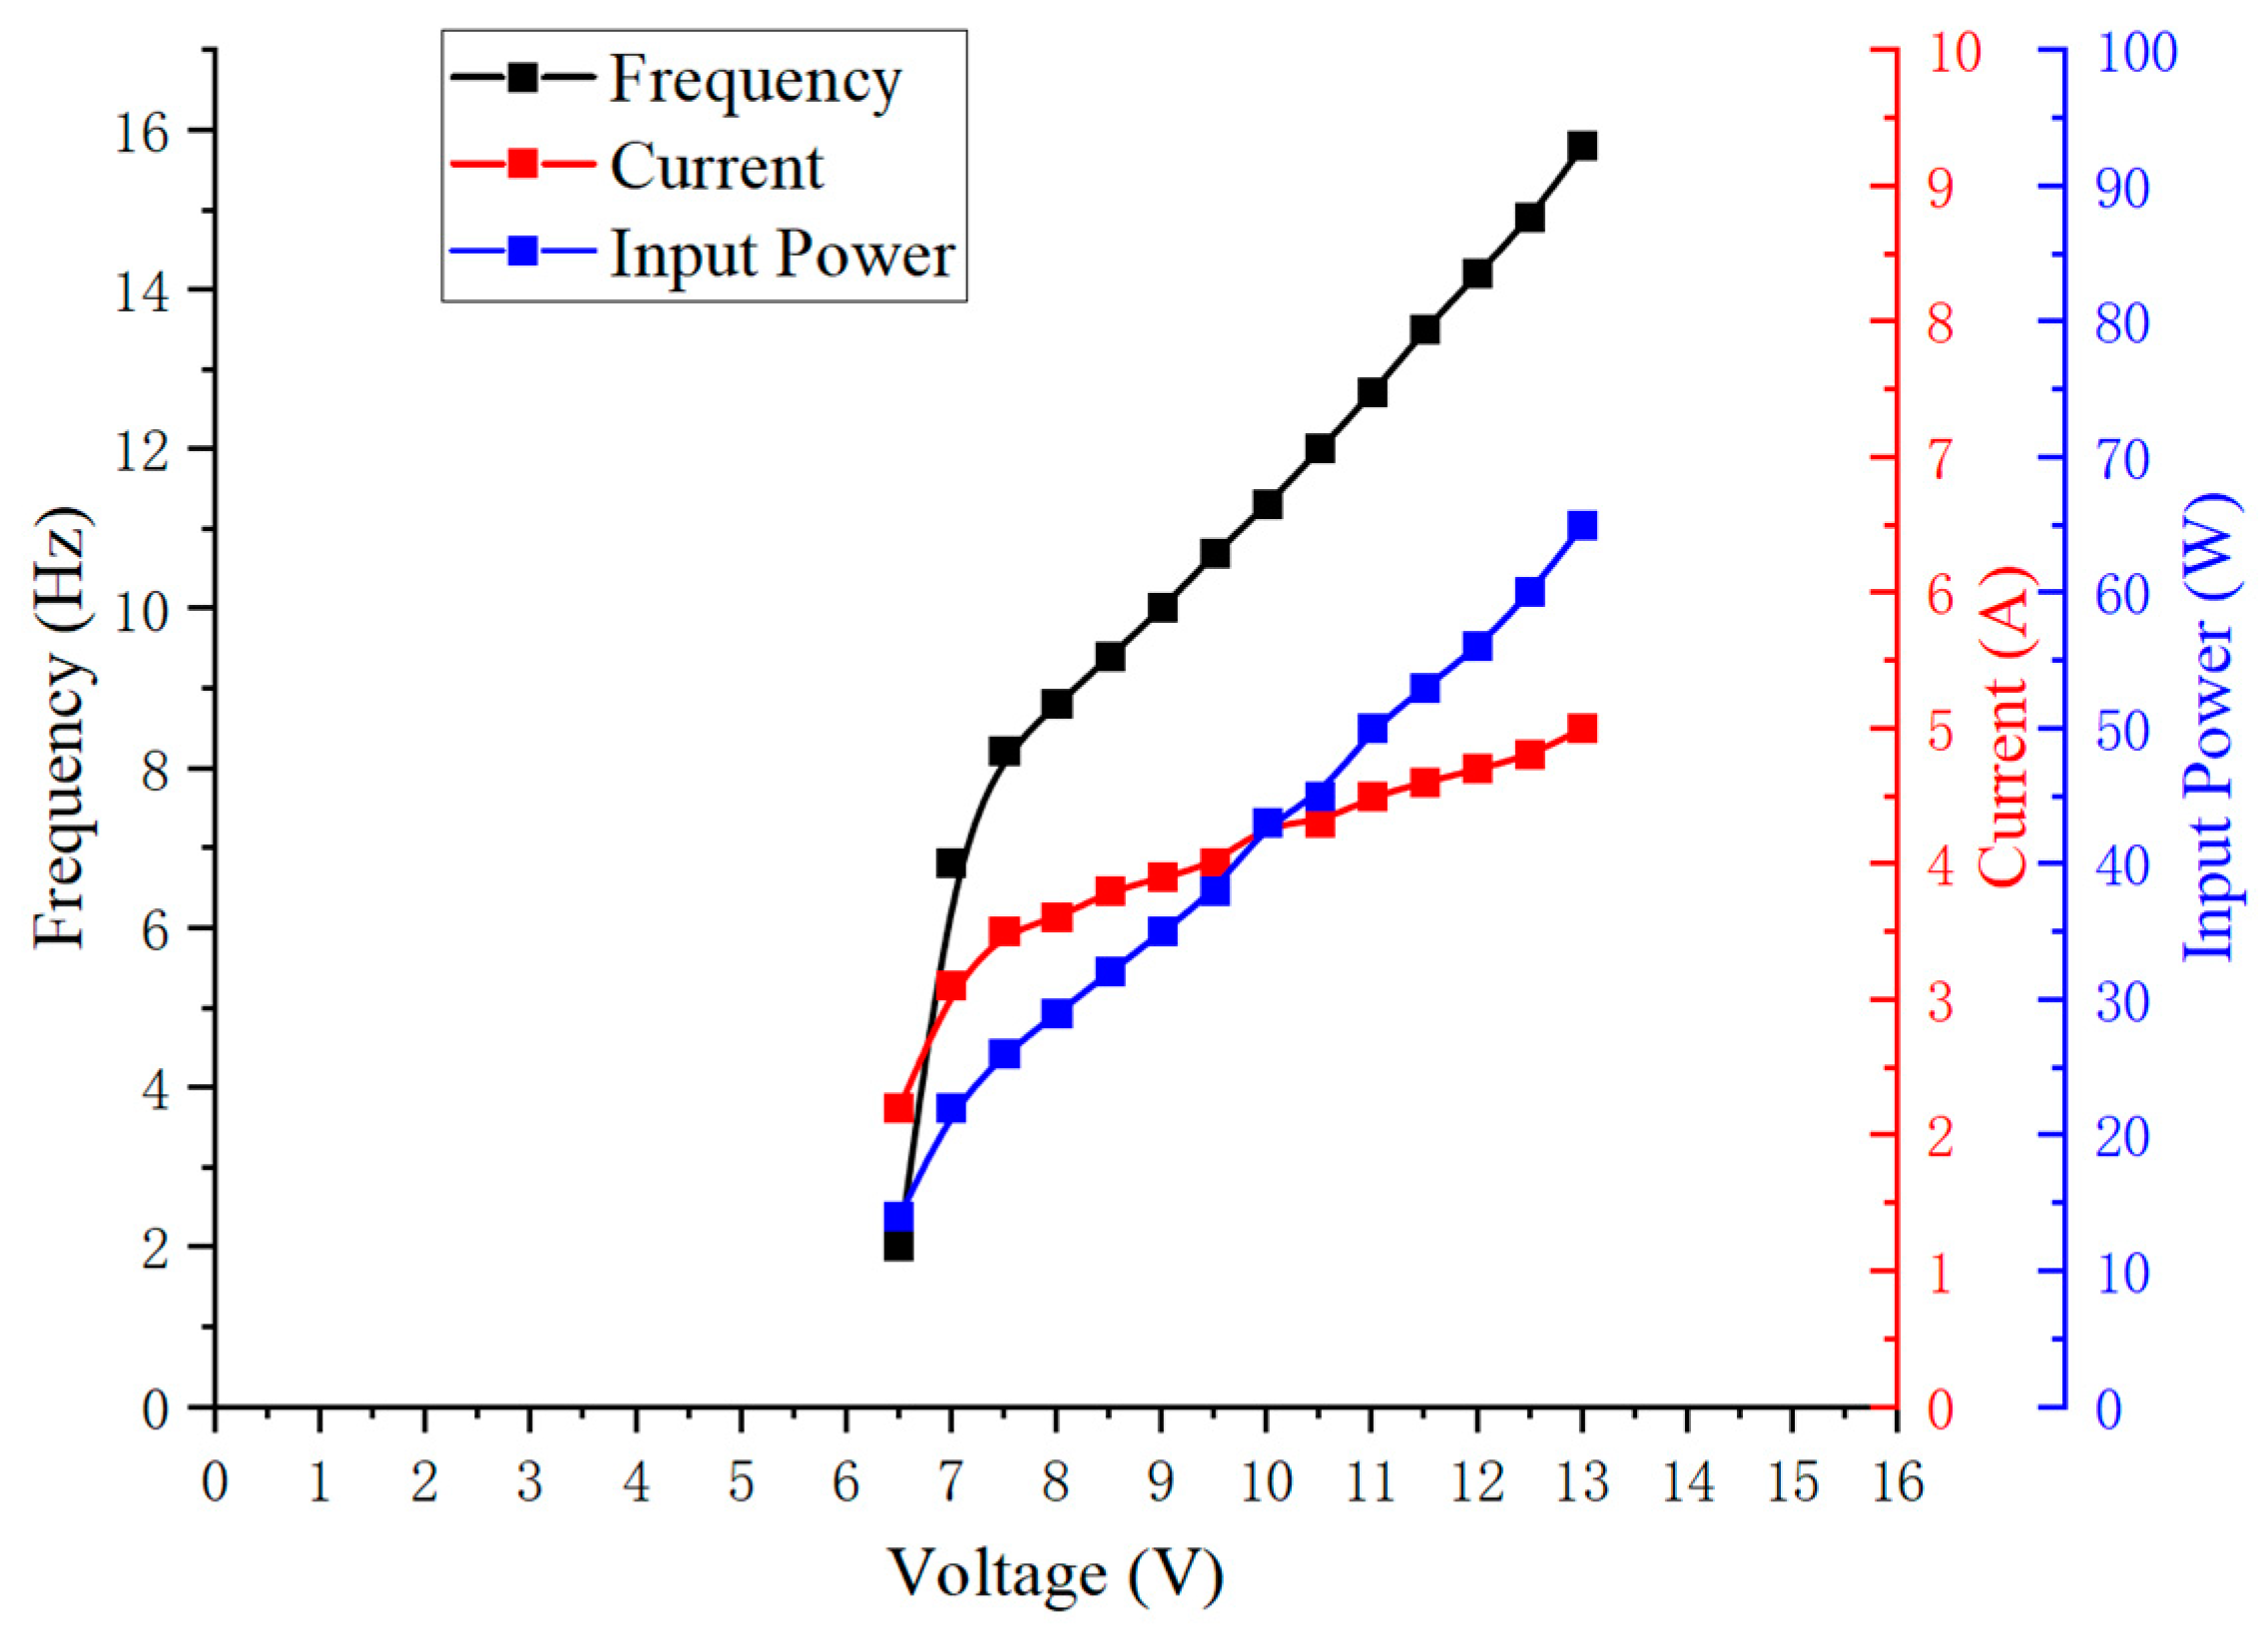
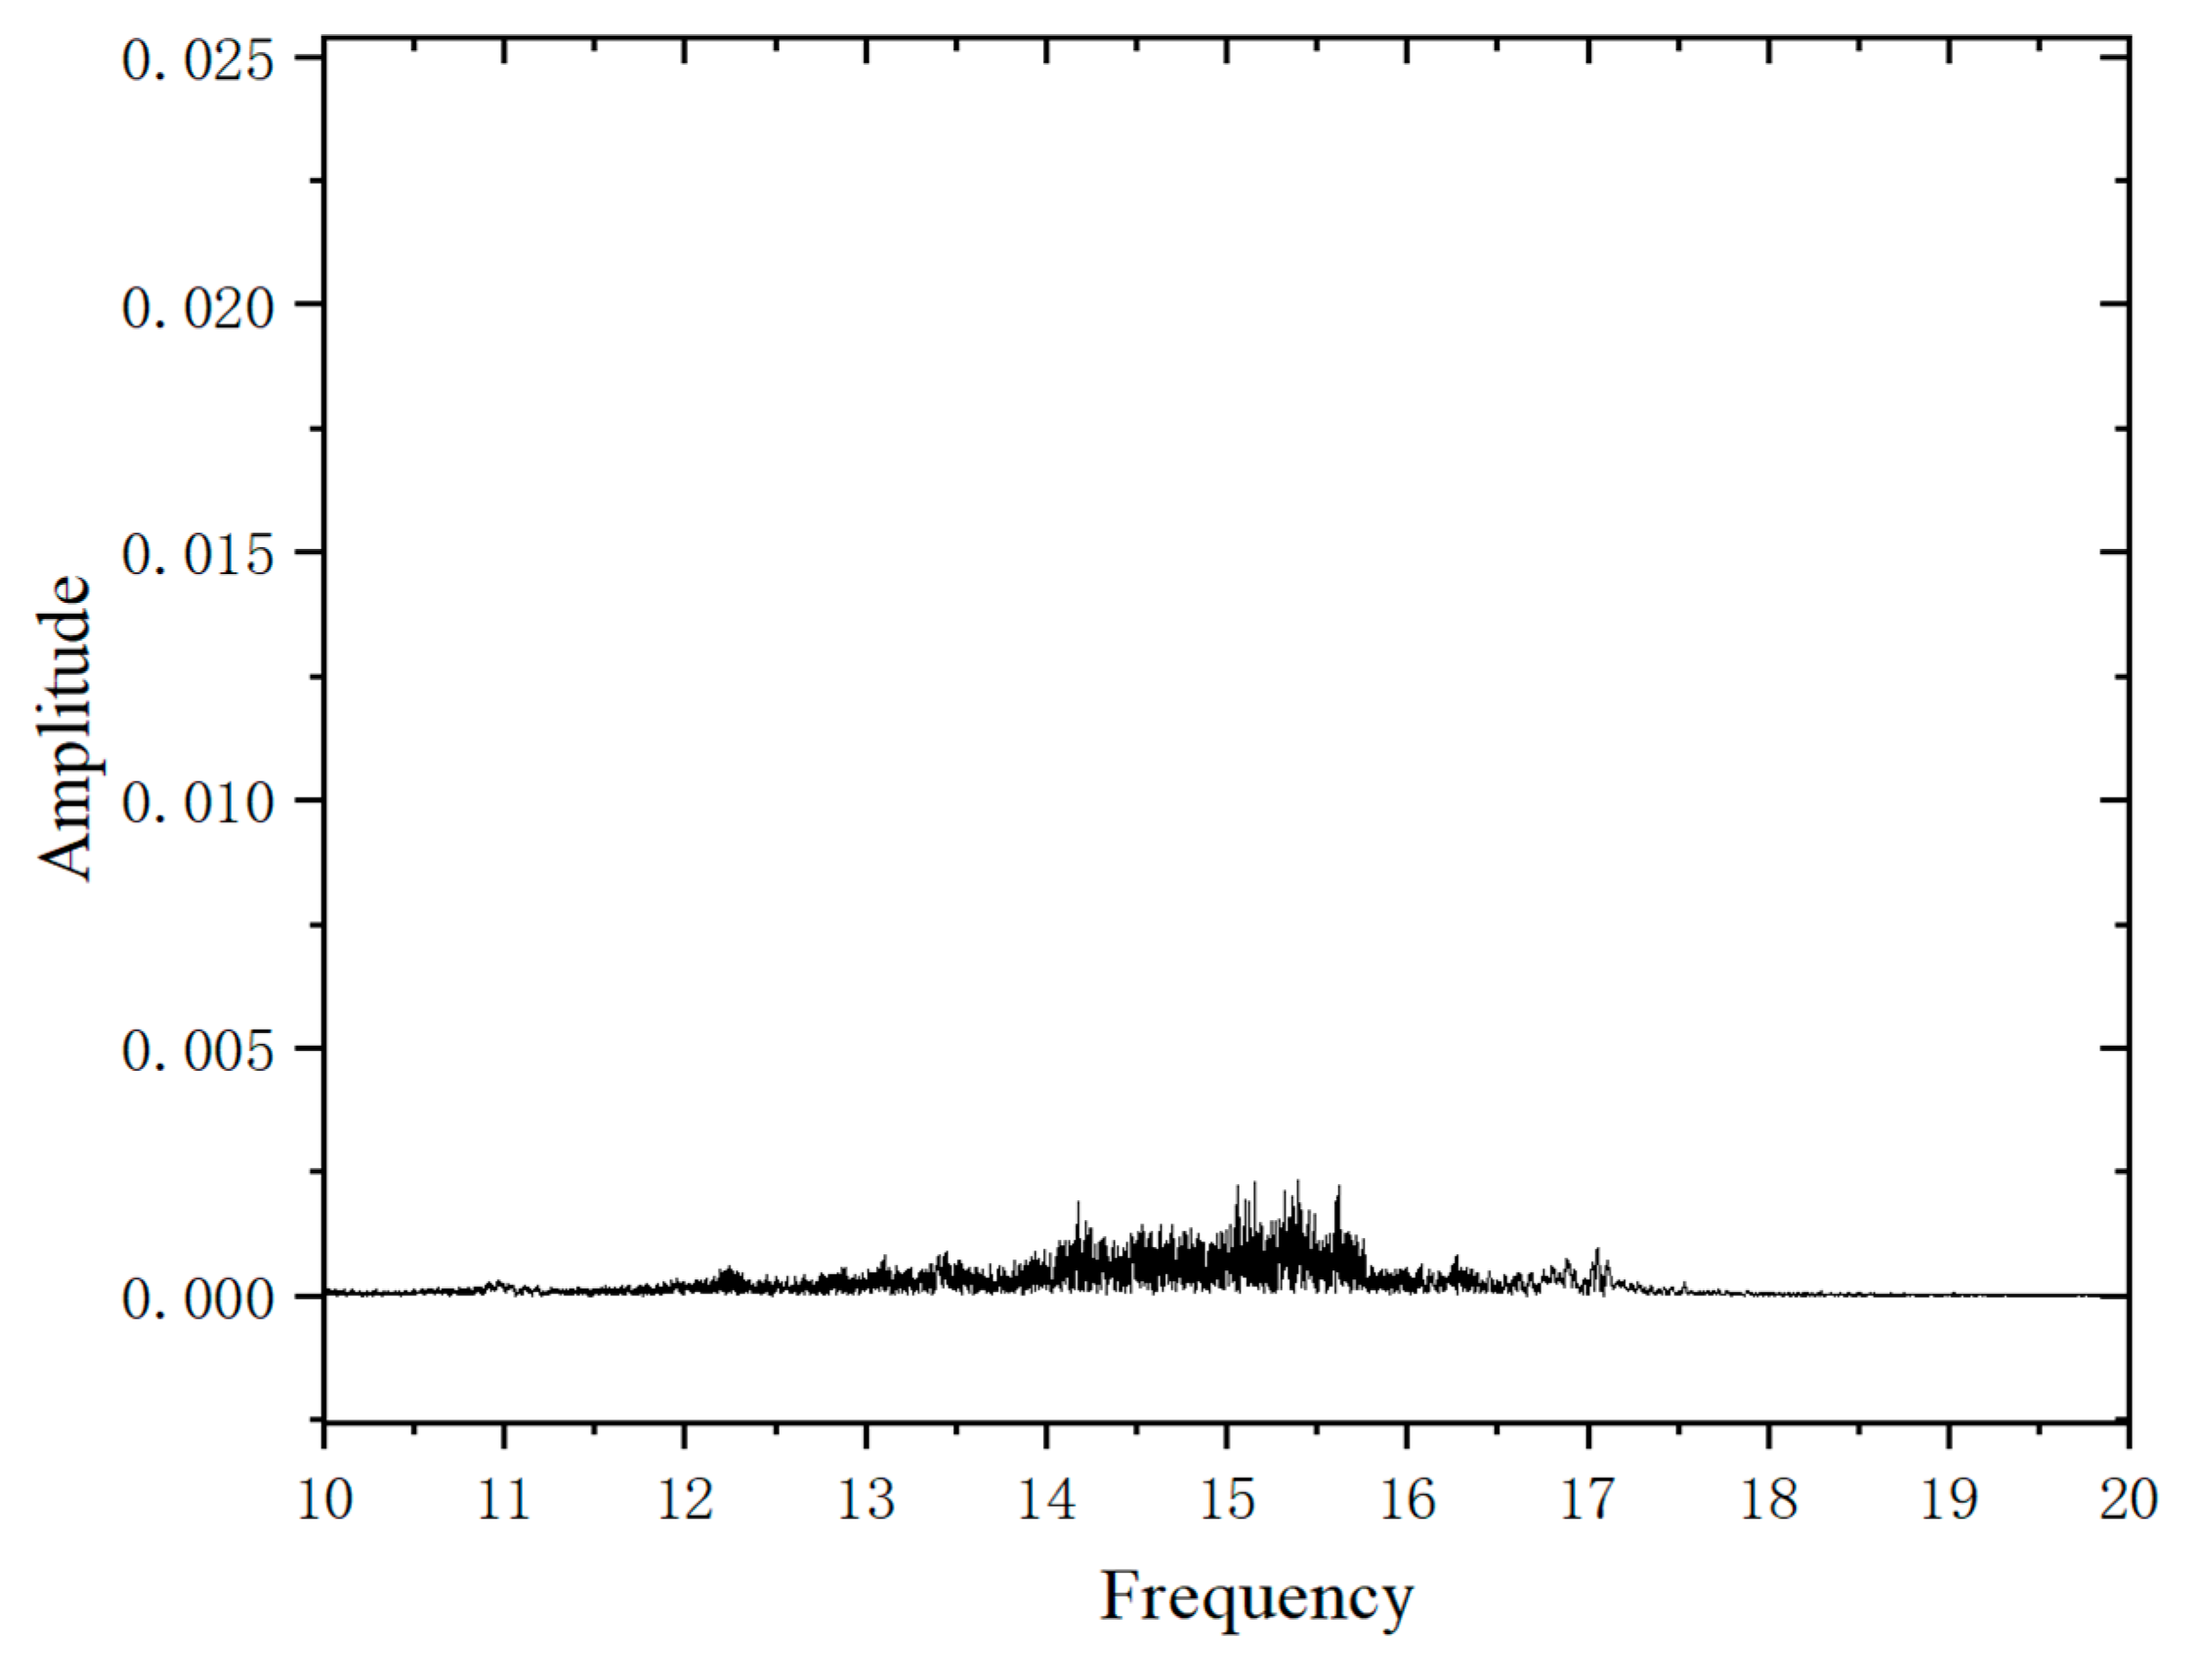
Based on the actual test results, the flapping frequency of the aircraft can reach 15 Hz only when the motor voltage is above 11.2 V. Therefore, during the entire flight phase, the flight is stopped when the battery voltage drops below 11.2 V. In
Figure 34, based on the obtained flight data, the frequency spectrum was obtained using Fast Fourier Transform, as shown in the figure. According to the analysis of the frequency spectrum, the flapping frequency of the aircraft during flight is mainly concentrated between 14 Hz and 16 Hz.
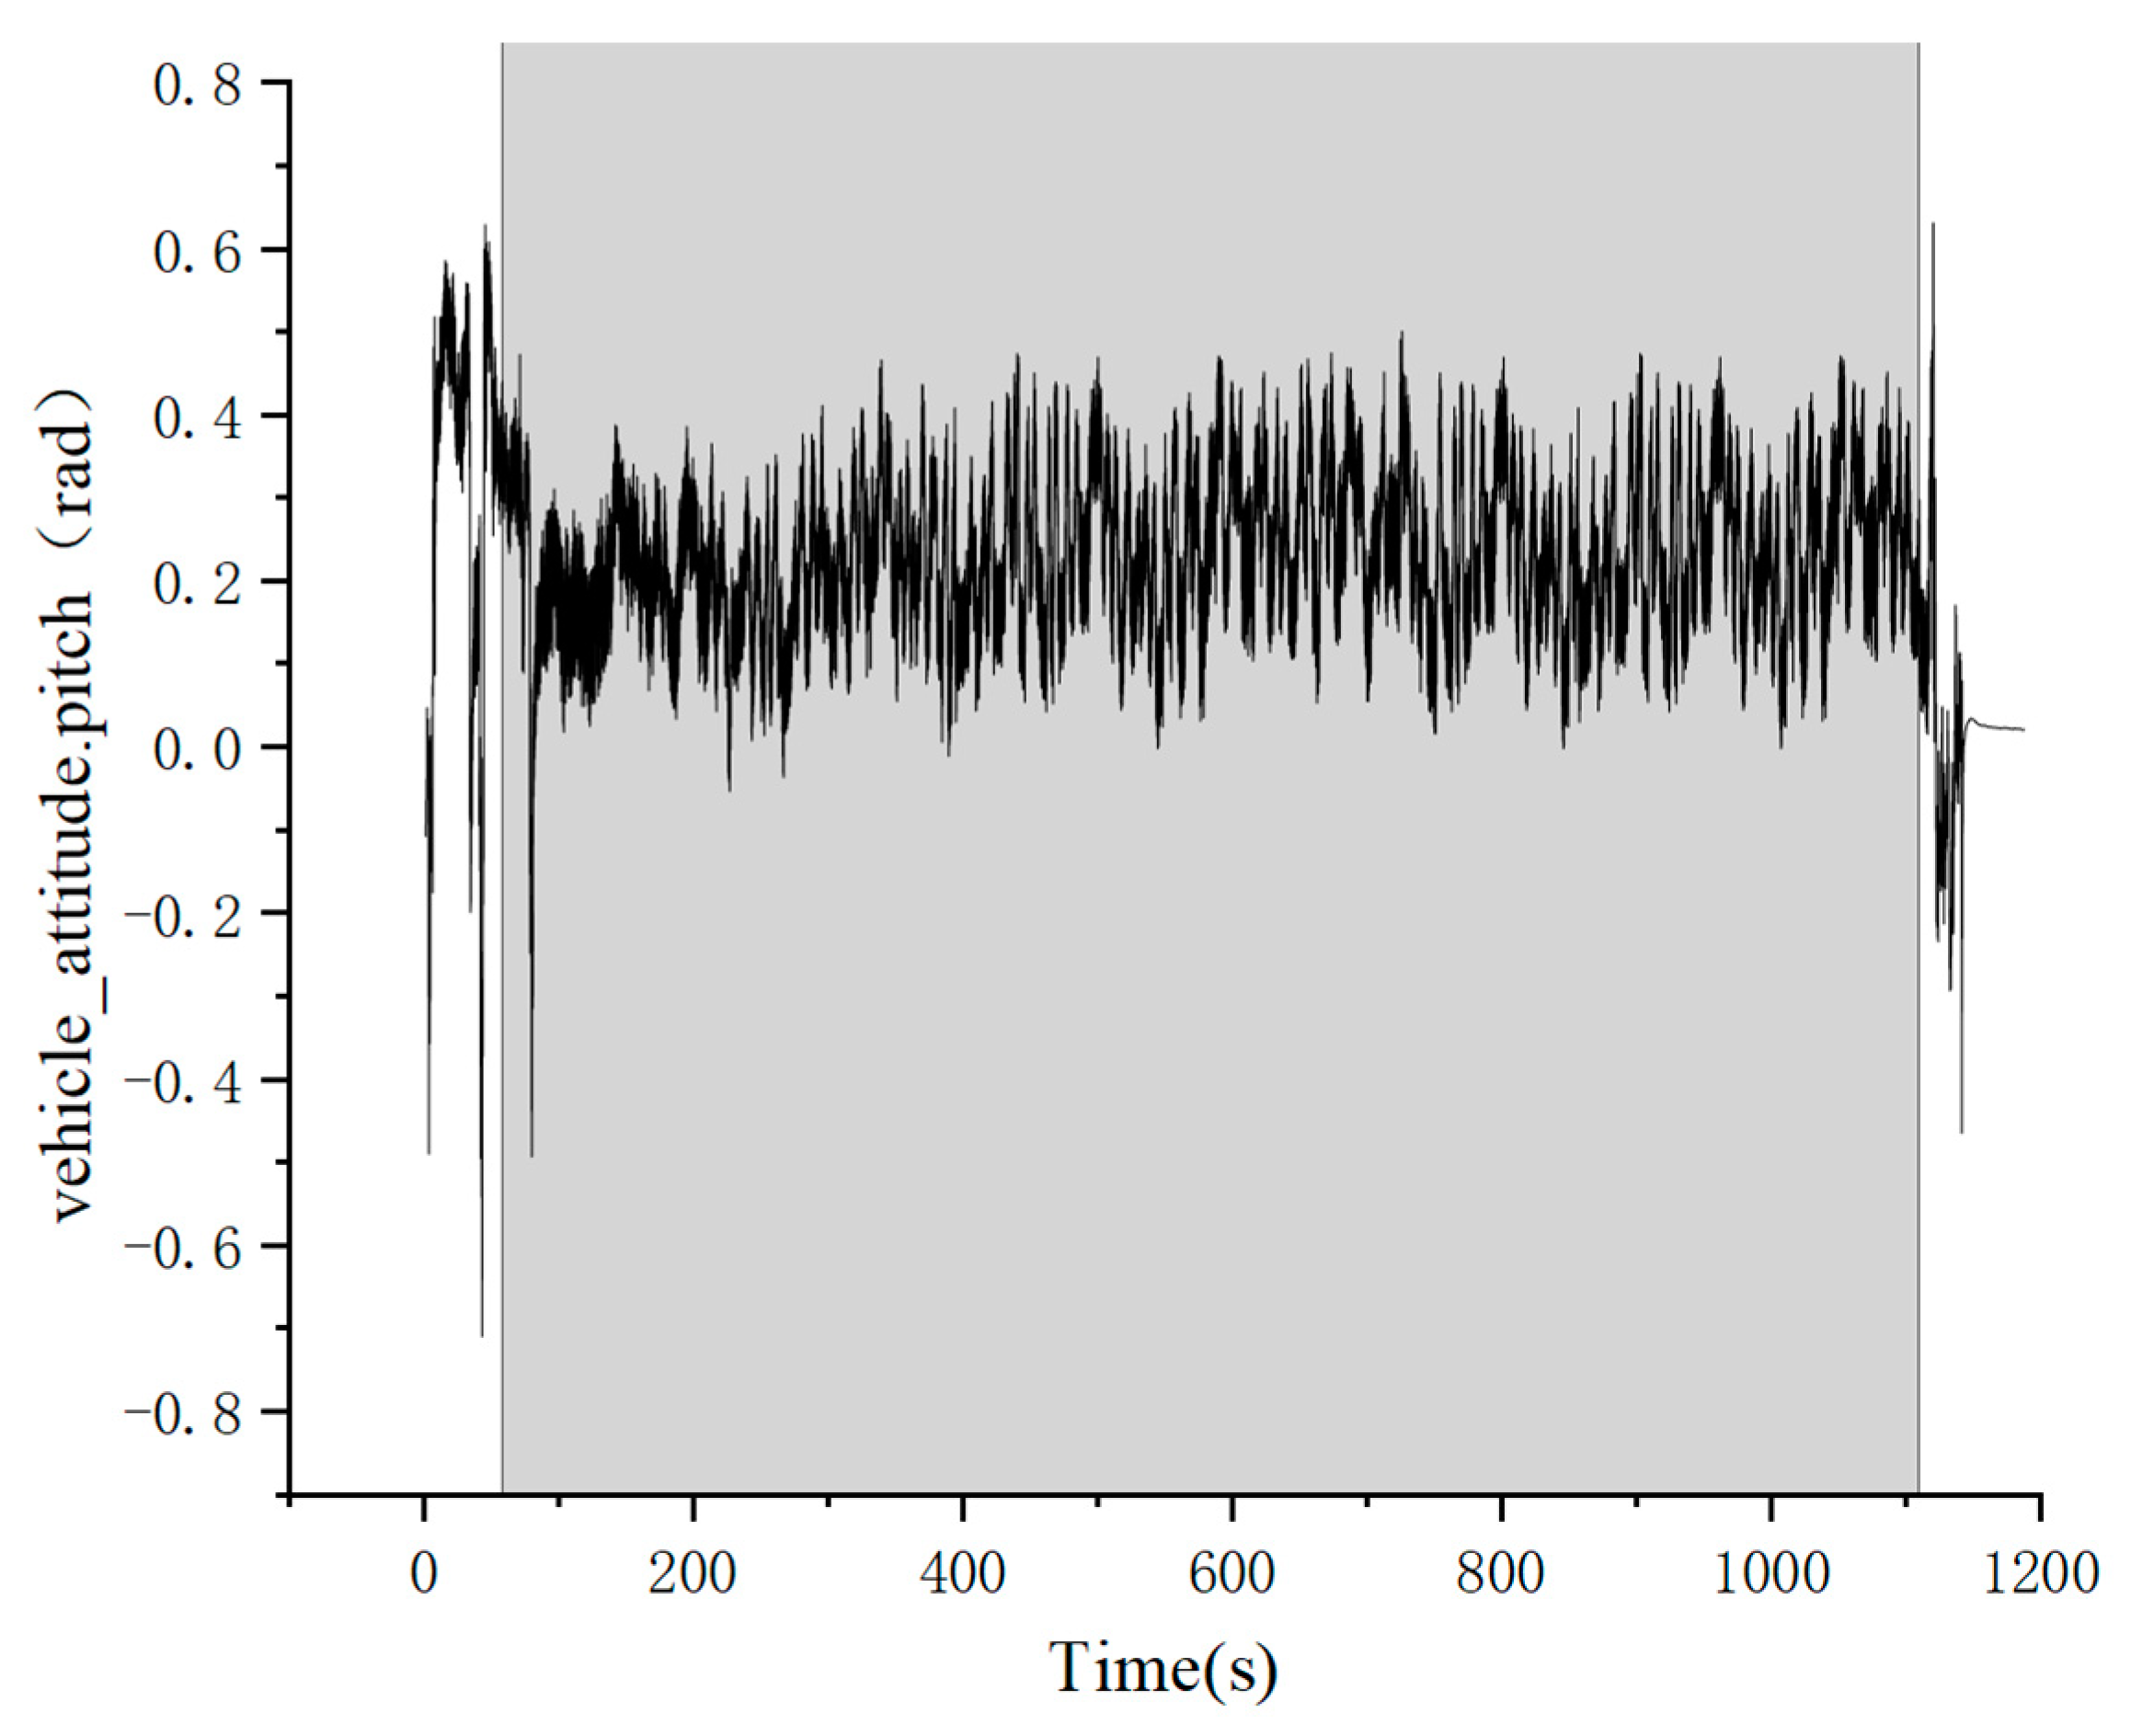
Figure 35 shows the variation of the aircraft’s pitch angle with time throughout the flight phase, where the battery voltage is maintained above 11.2 V to sustain a flapping frequency of approximately 15 Hz. The shaded area in the figure represents the stable flight phase of the aircraft (80 s–1110 s).
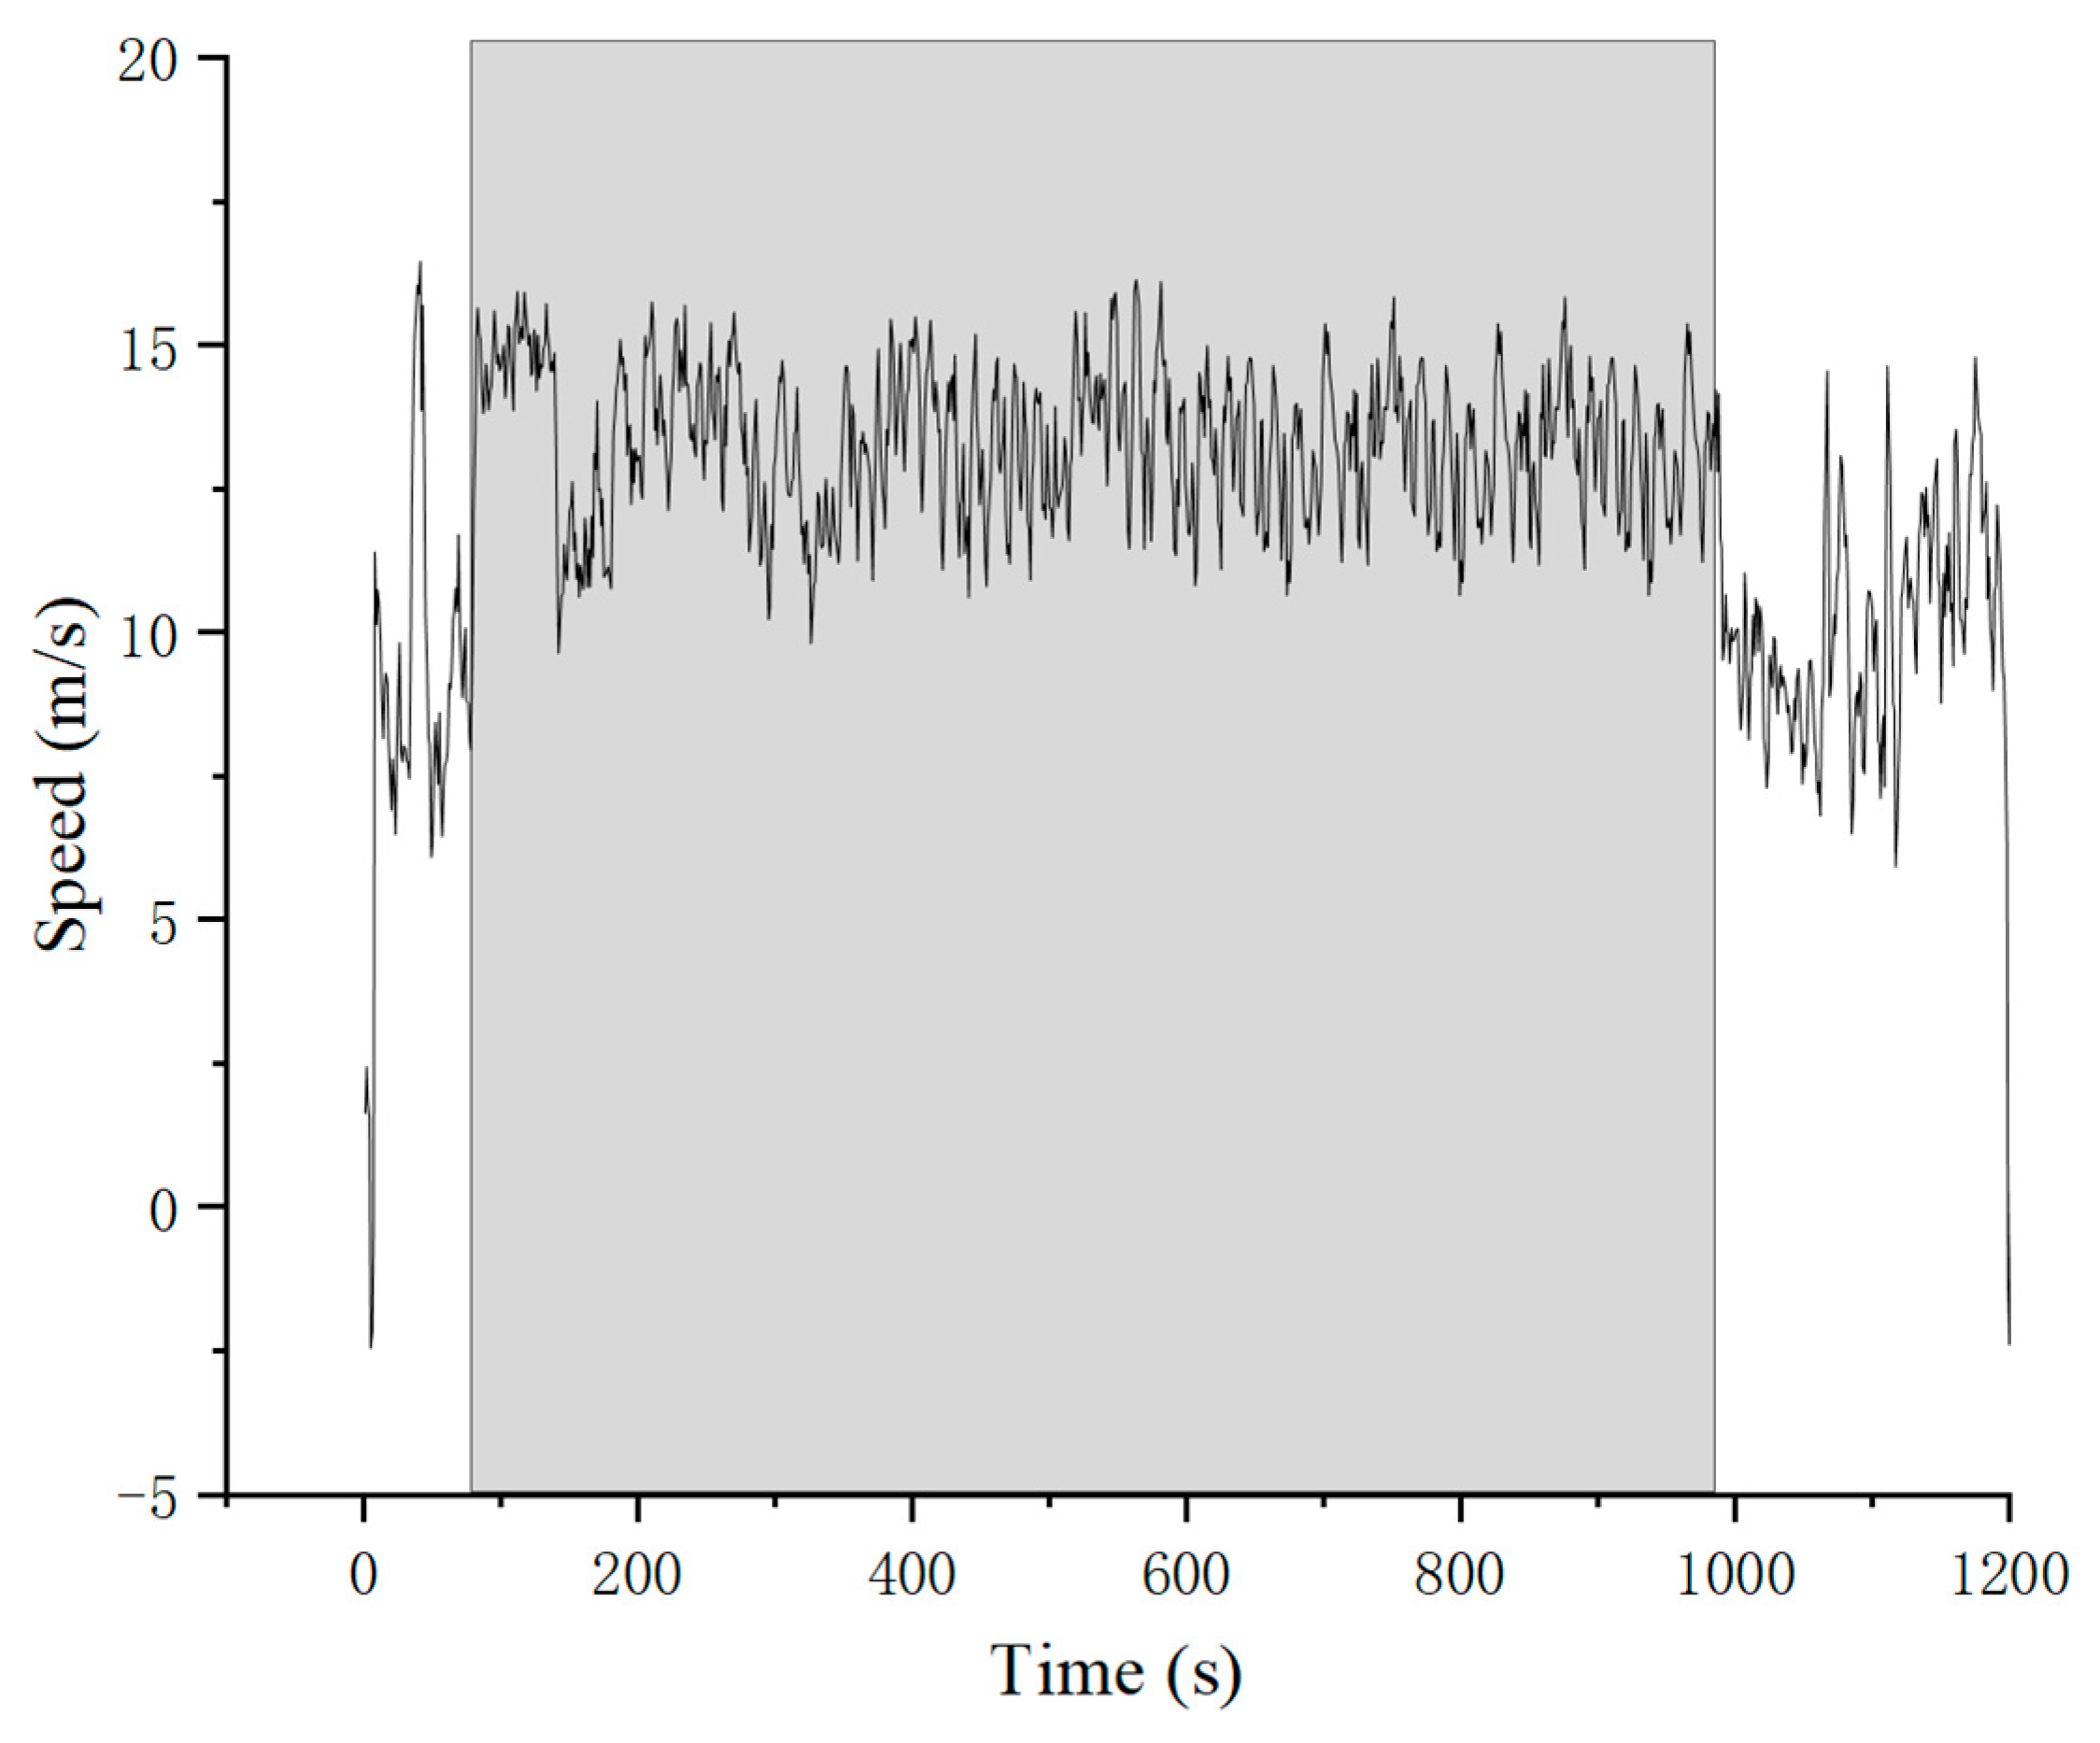
During the flight phase, a time interval (80 s–980 s) was selected where the flapping frequency was approximately 15 Hz and the flight speed remained relatively constant, as shown in
Figure 36. Within the 15 min flight duration, the average flight speed was calculated by taking the mean of the flight speeds, resulting in an average speed of 13.3 m/s. The average speed of the aircraft increased from the initial 10 m/s to 13.3 m/s, representing a 33% improvement. Furthermore, the maximum flight speed reached 16 m/s, which is close to the flight speed of pigeons in nature. The duration of high-speed flight increased from the initial 5 min to 15 min, tripling the previous duration.


