Article

UAV-Enabled Diverse Data Collection via Integrated Sensing and Communication Functions Based on Deep Reinforcement Learning

Beijing Advanced Innovation Center for Materials Genome Engineering, Beijing Engineering and Technology Research Center for Convergence Networks and Ubiquitous Services, School of Computer and Communication Engineering, University of Science and Technology Beijing, Beijing 100083, China
*
Author to whom correspondence should be addressed.
Drones 2024, 8(11), 647; https://doi.org/10.3390/drones8110647
Submission received: 4 October 2024 / Revised: 31 October 2024 / Accepted: 4 November 2024 / Published: 6 November 2024

Abstract

:
Unmanned aerial vehicles (UAVs) and drones are considered to represent a flexible mobile aerial platform to collect data in various applications. However, the existing data collection methods mainly consider uplink communication. The burgeoning development of integrated sensing and communication (ISAC) provides a new paradigm for data collection. A diverse data collection framework is established where the uplink communication and sensing functions are both considered, which can also be referred to as the uplink ISAC system. An optimization is formulated to minimize the data freshness indicator for communication and the detection freshness indicator for sensing by optimizing the UAV paths, the transmitted power of IoT devices and UAVs, and the transmission allocation indicators. Three state-of-the-art deep reinforcement learning (DRL) algorithms are utilized to solve this optimization. Experiments are conducted in both single-UAV and multi-UAV scenarios, and the results demonstrate the effectiveness of the proposed algorithms. In addition, the proposed algorithms outperform the benchmark in terms of accuracy and efficiency. Moreover, the effectiveness of the data collection mode with only communication or sensing functions is also verified. Also, the numerical Pareto front between communication and sensing performance is obtained by adjusting the importance parameter.

1. Introduction

1.1. Background

Data collection is an essential task in the modern decision-making process. In numerous fields, from environmental monitoring to urban planning and disaster management, accurate and timely data are the foundation of formulating effective strategies and responses [1]. High-quality data collection can reveal hidden patterns, predict future trends, and allow for real-time monitoring, leading to better resource allocation and risk mitigation. Without the support of reliable data, policy-making might be based on incorrect assumptions, leading to a waste of resources and a loss of opportunities [2]. Therefore, accurate, efficient, and massive data collection is crucial for enhancing decision-making’s effectiveness in various applications, especially in disaster management [3].
Unmanned aerial vehicles (UAVs)/drones offer an extremely flexible solution for data collection, capable of rapid deployment to areas that are difficult to reach or hazardous and being able to adjust their flight paths on the fly to meet varying data collection needs [4,5,6]. Compared to establishing fixed stations, UAVs are more cost-effective, particularly for short-term or temporary projects [7,8]. They can also be loaded with various sensors [9,10]. These sensors enable the Internet of Things (IoT) to provide real-time data, which are crucial for emergency responses and live monitoring [11,12]. Moreover, UAVs reduce safety risks for personnel, especially when operating in dangerous environments like volcanoes, areas with nuclear radiation, and conflict zones. They can cover vast geographical areas, respond swiftly to natural disasters, and collect essential information to support rescue and recovery efforts, all while minimizing environmental disruption [13]. Although the use of UAVs is limited by factors like battery life, weather conditions, and regulations, they offer clear advantages in terms of dynamism, flexibility, and cost-effectiveness compared to fixed stations [14].

1.2. Related Works

The existing data collection methods mainly consider the uplink communication, where UAVs serve as a key receiving aerial platform, responsible for collecting data transmitted by IoT devices in the region of interest [15,16,17]. This scheme enables UAVs to rapidly gather information from distributed sensor networks across vast areas. The high maneuverability and deployability of UAVs make them ideal relay nodes for connecting ground-based IoT devices with larger network infrastructures [18,19]. Through the uplink communication link, UAVs can effectively collect various types of data, including environmental monitoring, facility status, real-time events, etc., and then transmit these data to the cloud or ground base stations or servers for further analysis and decision-making support [20,21].
Some research has focused on optimizing the deployment, resource allocation, and scheduling of UAVs to enhance communication efficiency and service quality in IoT networks. These studies address the balance between different performance metrics, such as effective rate, transmission delay, spectral efficiency, and interference management. Hellaoui et al. [20] proposed optimizing multi-service aerial communication in an IoT network based on UAVs by allocating resources and deploying UAVs to balance the trade-off between effective rate and transmission delay. Feng et al. [22] proposed an IoT communication model that used UAVs as aerial base stations in the absence or overload of ground base stations. By optimizing communication scheduling, the public rate, transmission power, and UAV flight trajectories, the system aimed to maximize throughput. An alternating iterative algorithm was employed to solve the non-convex optimization problem, effectively enhancing the communication rate for ground users. Cai et al. [23] proposed different power allocation algorithms for the uplink communication of numerous cellular-connected UAVs. The objective was to optimize the minimum spectral efficiency or overall spectral efficiency based on the principle of successive convex approximation, to address the severe interference issues in high-density UAV deployment scenarios. Chen et al. [24] proposed a quality of service guaranteed multi-UAV coverage scheme, which optimized the deployment of UAVs through interference management and spectrum resource allocation to enhance the average UAV capacity within IoT communication hotspots, meeting various service quality requirements. Duan et al. [25] studied a multi-UAV-assisted IoT non-orthogonal multiple access uplink transmission system, where the system capacity was maximized by jointly optimizing sub-channel allocation, the uplink transmission power of the IoT nodes, and the flight altitude of UAVs. They proposed an algorithm based on K-means clustering and matching theory, which was suitable for scenarios requiring rapid deployment and efficient data collection.
Some researchers have focused on the optimization of drone trajectories and positioning to improve various aspects of communication, such as latency, power efficiency, and secrecy performance. Eldeeb et al. [26] utilized a deep reinforcement learning (DRL) framework, combined with traffic prediction techniques, to optimize the trajectory and scheduling strategies of multiple UAVs, thereby reducing the information update delay, the average transmission power of devices, and the cumulative regret in the IoT network. Yin et al. [27] studied how to enhance the secrecy performance of the uplink in satellite-supported IoT scenarios through UAV-assisted communication, aiming to achieve confidentiality and fairness among IoT users. This was primarily accomplished by optimizing the uplink power of IoT users, the position of the UAV, and beamforming.
Some research has been dedicated to analyzing and optimizing the communication performance of UAVs in specific application scenarios (such as rural areas, disaster zones, or equipment-dense networks), including reliability, efficiency, and connectivity. Liu et al. [18] investigated the uplink transmission performance of a wireless backhaul network, where UAVs were used as relays to assist user devices in transmitting data to remote ground base stations in scenarios with a lack of network coverage, such as rural areas or disaster zones. By considering the distribution of user devices and the positional changes of the UAVs, the authors developed a theoretical model to analyze the connectivity of this two-hop uplink transmission path. Nabil et al. [21] proposed a communication scheme to enhance the reliability and efficiency of device-centric uplink communications in UAV-supported aerial networks by optimizing the ratio of hovering to moving time of the UAVs.
In recent years, integrated sensing and communication (ISAC) has emerged as a new paradigm for data collection. ISAC integrates communication and sensing functions by utilizing shared hardware platforms and spectrum resources, which enhances spectral efficiency and reduces resource costs [28,29]. It not only optimizes the utilization of hardware but also enhances the flexibility of the system, allowing for both data transmission and environmental sensing to occur simultaneously on the same resource blocks [30,31,32,33,34].
In an ISAC system, Liu et al. [35] addressed the issue of multi-user uplink communication security against mobile aerial eavesdroppers by predicting the movement state of the aerial eavesdroppers and jointly designing radar signals and receive beamformers, thereby achieving an enhancement in the system’s minimum signal-to-noise ratio while ensuring the security and fairness of multi-user communication. Zhou et al. [36] proposed an integrated system of sensing, computing, and communication for drone-enabled IoT, enabling sensing of remote user devices, task computation, and data processing collaboration with access points. By jointly optimizing the CPU frequency of the drone, the radar sensing power, the transmission power of user devices, and the flight trajectory, the goal was to minimize the weighted total energy consumption of both the drone and user devices. In the context of emergency IoT networks, Zhu et al. [37] proposed an ISAC pilot optimization scheme. By employing a particle swarm optimization algorithm to allocate time–frequency resources, they aimed to minimize the bit error rate and average ranging error, thereby enhancing communication and positioning performance under dynamic channel conditions. In an IoT environment without infrastructure support, Liu et al. [38] optimized the three-dimensional flight trajectories and resource allocation of UAVs to enhance radar estimation in integrated sensing and communication systems.
However, as far as we know, the existing works present several gaps and have some drawbacks as follows. First, the existing works usually focus on traditional data collection methods with only communication, but rarely exploit the radar sensing capabilities of UAVs for data collection. Another gap exists in the consideration of the differences in source, type, and collection methods between data collected by IoT devices and radar systems. Moreover, there is a lack of effective resource sharing and interference management mechanisms to handle the simultaneous execution of communication and sensing functions, thereby achieving efficient, accurate, and comprehensive data collection. Additionally, there is a gap in the assessment of fairness during the data collection process, and the existing works often consider only the performance of communication and sensing functions.

1.3. Contributions of This Paper

Motivated by ISAC, to tackle the above drawbacks in the existing works, we propose a diverse data collection framework where uplink communication and sensing are simultaneously considered, as depicted in Figure 1. Differing from the existing works, UAVs serve not only as receiving devices for collecting uplink communication data from IoT devices but also execute active sensing tasks by emitting radar pulses and receiving the echoes. Such a framework can also be referred to as an uplink ISAC system, where the uplink communication (from IoT device to UAV) and the sensing (between UAV and sensing targets) are both considered with a time division scheme to avoid mutual interference. Compared to traditional passive sensing methods that use only optical or infrared cameras, radar sensing allows UAVs to gather information in complex environments and operate around the clock, especially in environments with limited line-of-sight or poor lighting conditions. This framework provides an accurate, reliable, and comprehensive data collection scheme, supporting the realization of autonomous decision-making and response.
In the proposed scheme, besides the data provided by optical cameras, such as the images, videos, etc., the data collected by IoT devices and the data gathered by radar pulses also have distinctly different characteristics in terms of their sources, types, and collection methods. IoT devices, as physical devices connected to the Internet, passively monitor and record digital signals of environmental changes such as temperature, humidity, and light levels through built-in sensors. The data are typically structured, for instance as time-series data, images, and sound waveforms, which are easier to store and process compared to unstructured data. In contrast, radar systems actively emit radio waves and analyze the signals reflected to detect the position, speed, and direction of objects. The data collected include information on distance, speed, angle, and size, often analog signals that require conversion and complex processing to extract useful information and are typically unstructured.
The proposed framework introduces some new challenges. First, the shared resources between communication and sensing cause congestion and interference. This is manifested not only in the competition for scarce resources between the two functions but also in the mutual interference (i.e., interference of IoT signals to sensing and interference of echo signals to communication). In addition, the complex coupled objectives and various decision variables increase the complexity of the problem, where not only the complicated relationships between the communication and sensing dual functions but also the relationships between the IoT devices influence the system’s performance. Moreover, the maneuverability of UAVs adds another layer of difficulty to this issue. This involves a complex optimization problem to find the optimal UAV position, power allocation, and association allocation.
Such a problem is complex and hard to solve because it involves many different variables and the relationships between these variables and the goals are complicated. Classic convex optimization is often good for smaller problems with simple goals. Also, the proposed two indicators, the data freshness indicator and the detection freshness indicator, are hard to reshape into a form that works well with convex optimization. The evolutionary algorithm and the gradient algorithm, other common methods, have trouble dealing with dynamic problems and have many time points to consider.
Therefore, considering the large number of time nodes and their dynamic nature, we adopt the DRL to solve this optimization. To implement the DRL, the optimization is converted into a decision-making problem regarding UAV path planning: when and where a UAV should fly to provide communication services to a particular IoT device, or when and where a UAV should move to sense specific sensing targets.
Employing DRL to tackle the problem has some advantages. It makes choices over time and discovers the best long-term plan through a series of decisions, which is well-suited for working out the best long-term solutions. In addition, since the DRL keeps working with the environment, it can get used to changes and unknowns in complex situations.
To address the above difficulties, we establish a diverse data collection framework in which the DRL algorithms are utilized to optimize the overall performance of the system. Our contributions mainly lie in five aspects, summarized as follows.
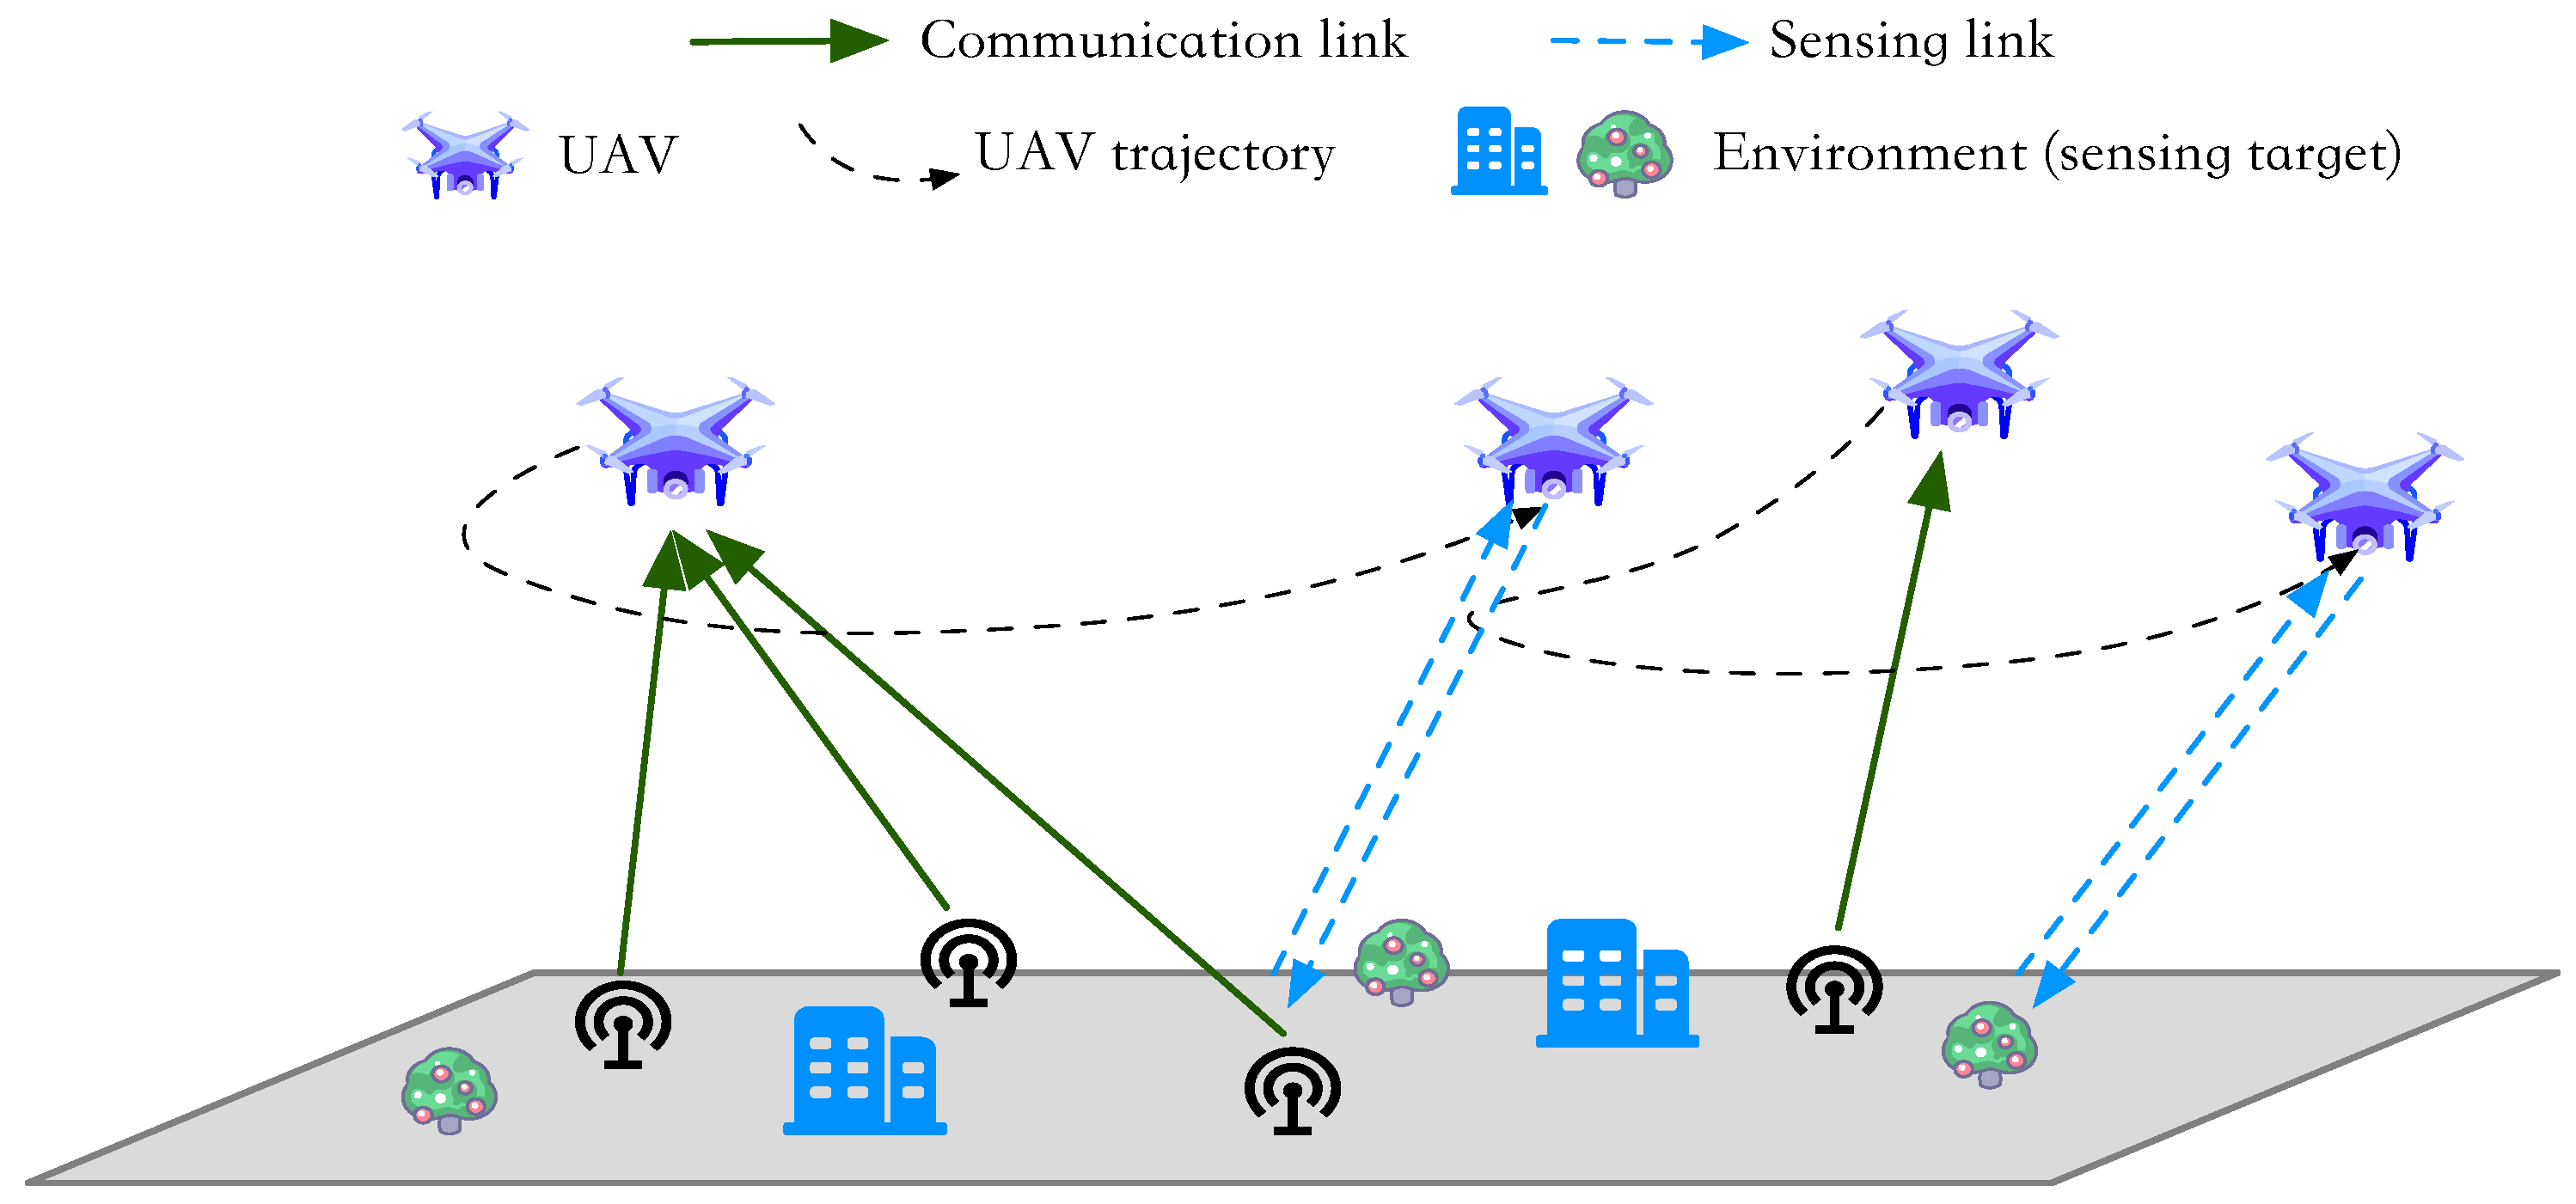
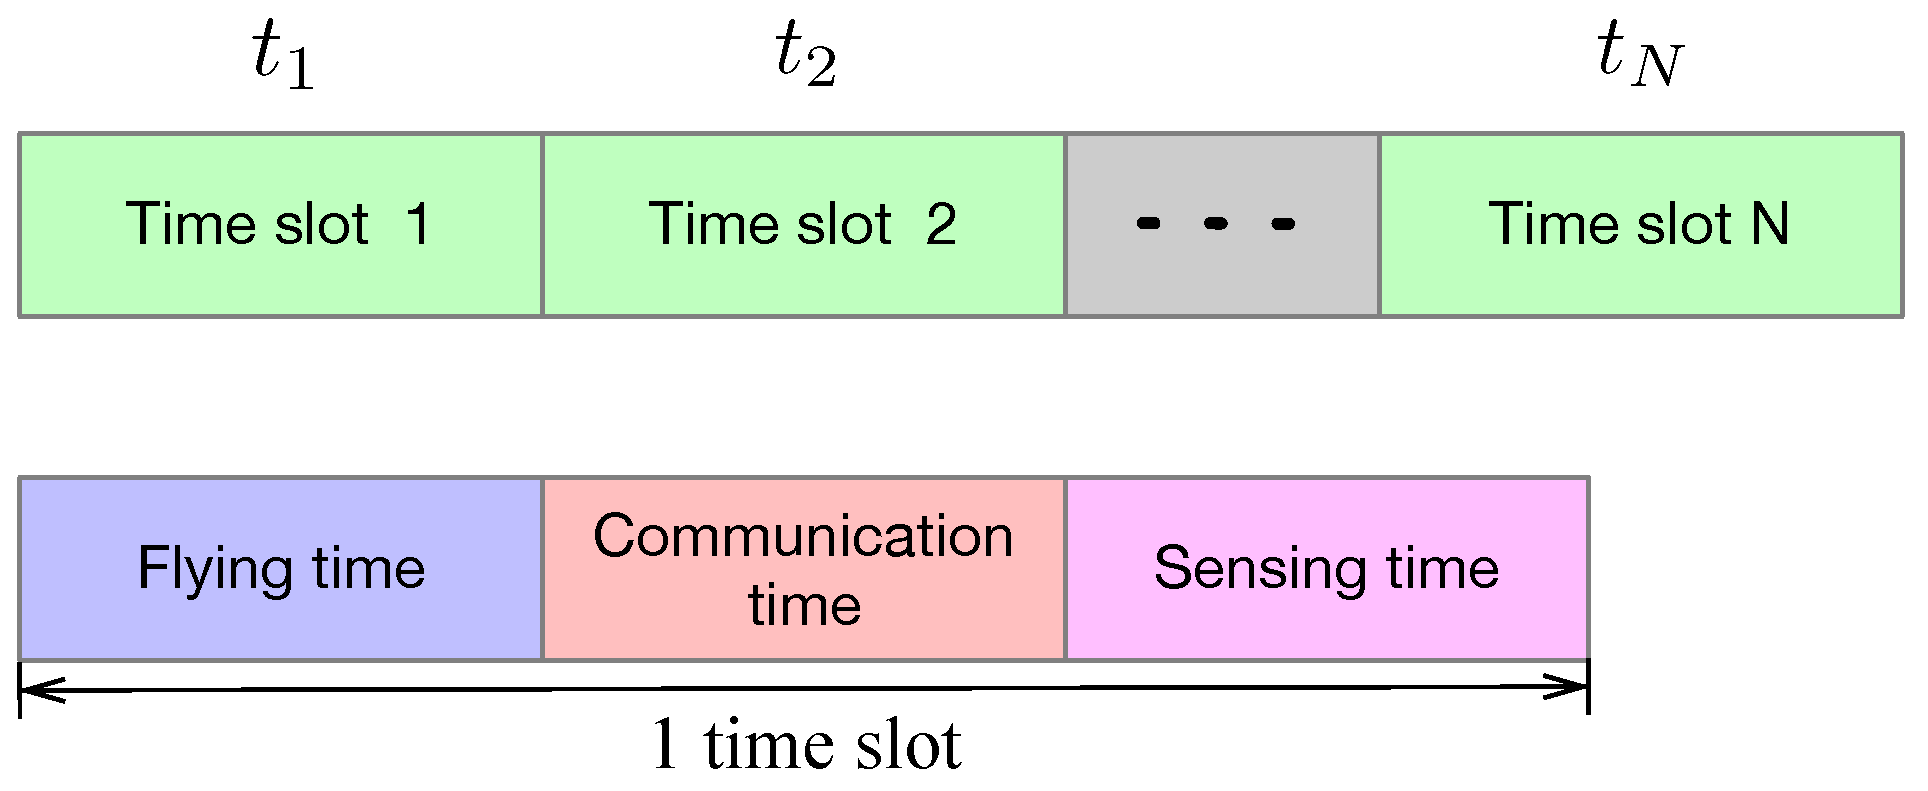
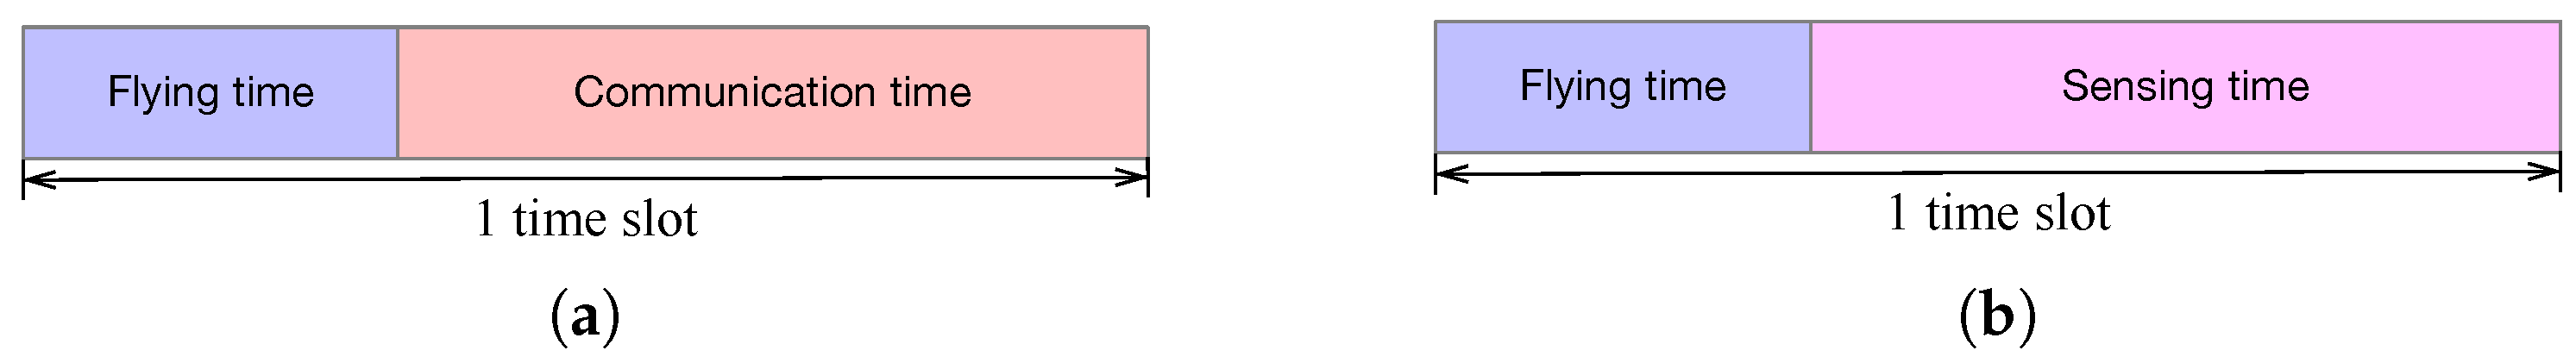
  • We establish a diverse data collection scenario where the UAVs not only collect data from IoT devices (communication functionality) but also transmit radar pulses and receive echo signals (sensing functionality). To cancel the interference between communication and sensing, we adopt the time division scheme to perform communication and sensing functions sequentially. To cancel the mutual interference among IoT devices, we adopt the frequency division scheme to allocate different sub-carriers to different IoT devices.
  • We define the successful transmission state to judge whether an IoT device successfully transmits its data to a UAV. Then, we define the data freshness indicator to characterize both the communication coverage and the fairness among IoT devices. Similarly, we define the successful sensing state and the detection freshness indicator, indicating the sensing coverage and the fairness among sensing targets, which further reflects the time-sensitivity and fairness of the system.
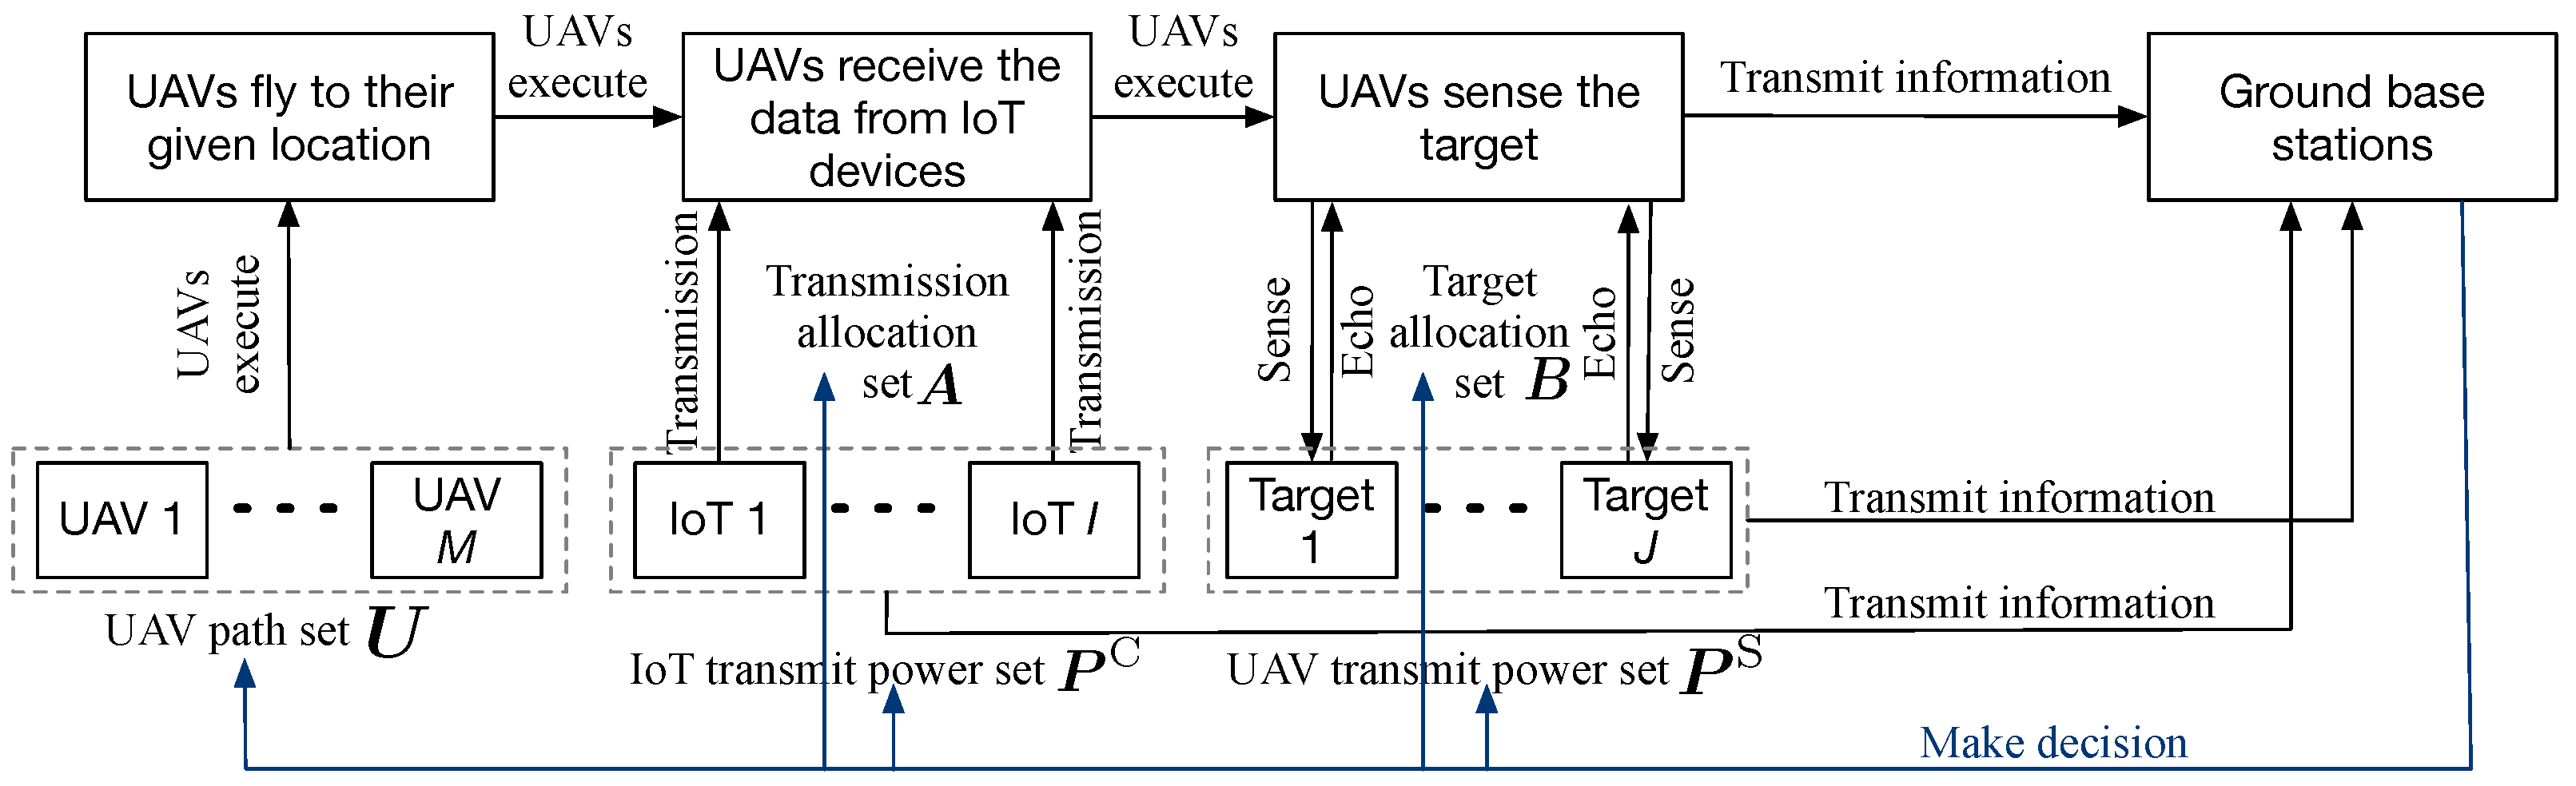
  • We formulate an optimization for diverse data collection to minimize the summation of the data freshness indicator and detection freshness indicator by optimizing the UAV paths, the transmitted power of IoT devices and UAVs, and the transmission allocation indicators. Such an objective reflects the communication performance, the sensing performance, and their corresponding fairness. In addition, we reformulate the problem as a Markov decision process (MDP) to decide the movement distance of the UAVs, the power variations of the UAVs and IoT devices, and the allocation variations of tasks.
  • To solve the formulated MDP, we propose three state-of-the-art DRL algorithms, namely twin delayed deep deterministic policy gradient (TD3), soft actor-critic (SAC), and proximal policy optimization (PPO). These are all mature algorithms designed to solve the problem with continuous action space and have been widely used in UAV trajectory planning. We provide the algorithm process to solve the established UAV-enabled diverse data collection optimization.
  • Experiments are conducted in both single-UAV and multi-UAV scenarios, and the results verify the effectiveness of the algorithms. In addition, besides the joint mode, we also consider the other two data collection modes, i.e., data collection with only communication or sensing function. Moreover, we adopt the random strategy as the benchmark, and the results show that our methods outperform the benchmark. Furthermore, the numerical Pareto front between communication and sensing performance is obtained to reflect the inherent trade-offs.
The rest of this article is organized as follows. Section 2 establishes the system model, introduces the communication and sensing performance indicators, and formulates the UAV-enabled diverse data collection problem. Section 3 provides the solution to this problem, where the DRL algorithms are utilized to make decisions. Section 4 conducts the experiments to verify the algorithms’ effectiveness and discusses the results. Finally, Section 5 concludes this paper.

2. System Model and Problem Formulation
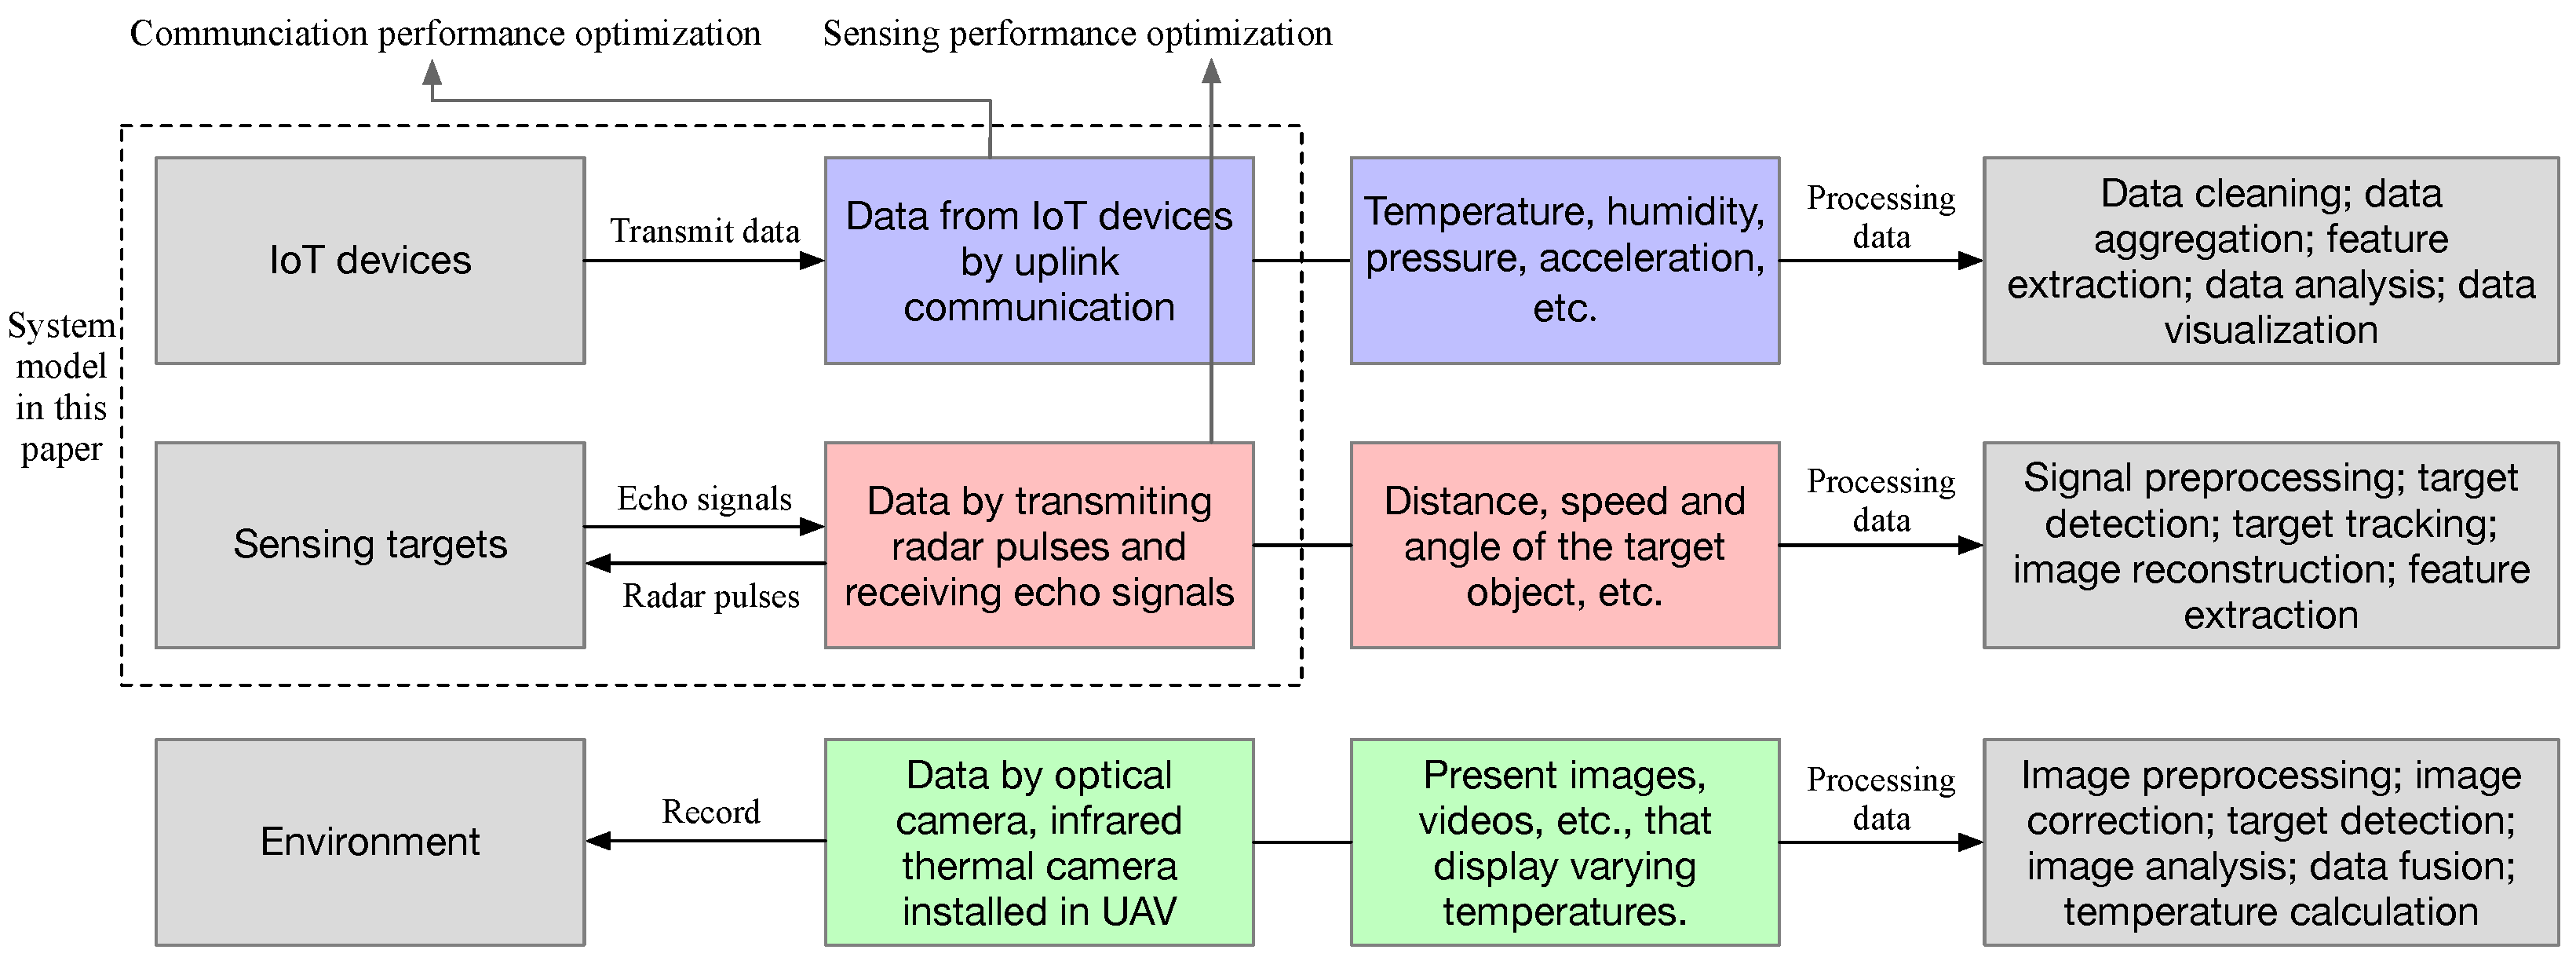
In this section, we establish the system model, introduce the communication and sensing performance indicators, and formulate the UAV-enabled diverse data collection problem.

2.1. System Model

Assume that there are M UAVs flying in a service region R to collect the information from I ground IoT devices and simultaneously provide sensing service to acquire information about J sensing targets, as depicted in Figure 2. Let U = U 1 , U 2 , , U M denote the UAV set, C = C 1 , C 2 , , C I denote the IoT device set where the IoT devices transmit information to UAVs, and  S = S 1 , S 2 , , S J denote the sensing target set where the sensing targets are intended to be detected by the UAVs.
Assume that the UAVs are fully charged, so there is no need to consider landing to recharge during the entire flight. These UAVs all communicate with satellites, where the UAVs report their real-time positions to the satellites, and the satellites transmit the flight strategies to all the UAVs. Then, the satellite is aware of the positions of ground IoT devices and potential sensing target locations. The satellite sends the corresponding collected information from UAVs, IoT devices, and sensing targets to the ground base station control center. The ground control center runs algorithms and decides on the optimal trajectory for UAVs and the power transmission strategies for UAVs and IoT devices, and then relays these strategies back to the satellite. The illustration of the workflow diagram of the system is depicted in Figure 3.
We split the whole service time into N time slots, denoted as t 1 , t 2 , , t N . In each time slot, the UAVs first fly to the preset locations, and then provide communication services (i.e., collect data from IoT devices), followed by sensing services (i.e., sensing the sensing targets). The illustration of the time scheduling of the UAV in such a scenario is depicted in Figure 4. Let t n , C and t n , S , n denote the communication time and sensing time in t n . Let L n , i C = x n , i C , y n , i C , z n , i C T denote the three-dimensional location of the IoT device C i , i where A T represents the transposition of matrix A . Similarly, let L n , j S = x n , j S , y n , j S , z n , j S T denote the three-dimensional location of the sensing target S j , j . Since the IoT devices and the sensing targets are often on the ground, we consider that z n , i C = 0 , n , i and z n , j S , n , j . Let L n , m = x n , m , y n , m , z n , m T denote the three-dimensional location of the UAV U m .

2.2. Communication Performance

In t n , C , the UAVs hover at the predesigned location, and there exists uplink communication between UAVs and IoT devices, where the IoT devices transmit data to UAVs. Not all IoT devices have the opportunity to transmit data to UAVs. The UAVs will decide which IoT devices’ data to collect, and will only collect data from those IoT devices that are within their communication range. Let A = a n , m , i | n , m , i denote the transmission allocation set where the binary variable a n , m , i 0 , 1 represents whether the UAV U m collects data from IoT C i in t n , C . If U m collects data from C i in t n , C , we take a n , m , i = 1 ; otherwise, we take a n , m , i = 0 .
We adopt a data freshness index to characterize whether the transmission between a UAV and an IoT device is successful and the freshness of the data. We consider that if the data from a specific IoT device have only been collected recently, then the previous data collected from that IoT device are considered fresh. Conversely, if the data from an IoT device have not been collected for a long time, then its previously collected data are considered not fresh. The data freshness index of C i in t n is given by
D F n , i = 0 , if m = 1 M a n , m , i = 1 and I n , i C = 1 , min D F n , i + 1 , A max , Otherwise .
Here, one IoT device only transmits its data to one UAV in a time slot, and thus m = 1 M a n , m , i 1 always holds. More precisely, m = 1 M a n , m , i 0 , 1 . If m = 1 M a n , m , i = 1 , this IoT device transmits data to a specific UAV, and vice versa. However, although the IoT device intends to transmit the data, the data may not be transmitted successfully due to the limited time delay. Hence, we define I n , i C as the successful transmission state, and if I n , i C = 1 , this IoT device successfully transmits its data, and vice versa. On one hand, the data freshness index of an IoT device is reset to zero after its data are collected, indicating that a smaller index corresponds to fresher data. On the other hand, if an IoT device’s data have not been collected in the current time slot, its data freshness index is incremented by one to reflect and penalize this lack of collection. Establishing a maximum threshold A max for the data freshness index ensures that even if certain IoT devices are continuously unable to transmit data, these IoT devices are not penalized indefinitely. This is because excessive penalties could cause UAVs to deviate from their appropriate planned routes abruptly to collect data from devices with high penalties, which is not only energy-inefficient but also detrimental to the overall system performance.
We next introduce how to characterize the successful state I n , i C 0 , 1 for IoT device C i in t n . If an IoT device can complete its transmission task within its maximum latency limit, then we consider the data transmission to be successful. Let Δ T n , i and T Max denote the data transmission latency of C i in t n , C and its limited maximum threshold, respectively. If Δ T n , i T Max , we take I n , i C = 1 ; otherwise, we take I n , i C = 0 . The data transmission latency is computed by
Δ T n , i = W n , i R n , i C ,
where W n , i and R n , i C represent the total data amount generated by C i before t n , C and the data transmission rate, respectively. We assume that in each time slot, IoT devices will delete their previous data and generate new data due to the constant changes in the dynamic environment. The transmission rate between C i and U m is calculated by
R n , i C = B log 2 1 + γ n , i C ,
where B denotes the bandwidth and γ n , i C represents the signal-interference-noise-ratio (SINR) of C i at t n , C .
SINR is the ratio of the power of a desired signal (the signal from C i to its served UAV U m ) to the sum of the power of interference signals (the signal from other IoT devices served by other UAVs to the served UAV U m ) and the power of background noise (additive white Gaussian noise), given by [39]
γ n , i C = p n , i C h n , i , m C i ^ = 1 I ( 1 a n , i ^ , m ) p n , i ^ C h n , i ^ , m C + σ 2 ,
where σ 2 denotes the additive white Gaussian noise; p n , i C denotes the transmitted power of C i to the transmitted data in t n , C ; and h n , i , m C denotes the channel between C i to U m in t n , C , typically expressed as
h n , i , m C = g C G C λ C 2 4 π 2 L n , m L n , i C 2 2 .
Here, g C represents the transmitting antenna gain, which refers to the gain of the transmitting antenna in a certain direction relative to an ideal point source antenna; G C represents the receiving antenna gain, which is the gain of the receiving antenna in its optimal reception direction relative to an ideal point source antenna; and λ C represents the signal wavelength, which is the distance that a radio wave travels in one period. The term L n , m L n , i C 2 denotes the distance between C i and U m , expressed as an L2 norm term.
The interference term i ^ = 1 I ( 1 a n , i ^ , m ) p n , i ^ C h n , i ^ , m C only comprises the interference signal from IoT devices served by other UAVs, and does not include that from IoT devices served by UAV U m . This is because the orthogonal frequency-division multiple (OFDM) scheme allows the IoT devices to share the same UAV by utilizing different orthogonal sub-carriers to transmit their data. We consider that the interference between two IoT devices that are geographically close to each other is much stronger than the interference from IoT devices that are further apart. Therefore, we adopt the OFDM scheme only between devices with strong interference to achieve the maximum benefit for interference nullification. In addition, the term 1 a n , i ^ , m eliminates the interference from the IoT devices served by U m .

2.3. Sensing Performance

In t n , S , the UAVs also hover at the predesigned location to provide the sensing service for the potential sensing targets (usually the interest of specific spots). UAVs continuously transmit radar pulse signals to different sensing targets and receive the corresponding radar echoes to extract environmental information further. The echo data of radar pulse signals fundamentally differ from the environmental data collected by IoT devices, expanding environmental data’s diversity.
Also, not all sensing targets have the opportunity to be sensed by the UAVs. The UAVs decide which sensing target to be sensed, and the target allocation set is then denoted by B = b n , m , j | n , m , j , where the variable b n , m , j 0 , 1 represents whether the UAV U m senses the sensing target S j . Here, we design a mechanism to determine the target allocation variable where the sensing targets within the UAV’s maximum sensing range D S correspond to the variable value of 1; otherwise, the value is set to 0. In other words, if  L n , m L n , j S 2 D S , we take b n , m , j = 1 ; otherwise, we take b n , m , j = 0 .
Similar to communication performance, we adopt a detection freshness index to characterize whether the radar detection between a UAV and a sensing target is successful and the freshness of the detection activity, defined as
S F n , j = 0 , if m = 1 M b n , m , j = 1 and I n , j S = 1 , min S F n , j + 1 , A max , Otherwise .
It is worth noting that m = 1 M b n , m , j 0 , 1 , where a one indicates that S j is sensed by a UAV, and a zero indicates that it is not. Although a sensing target tends to be sensed by the UAV, such a sensing activity may not be successful. We further define the binary variable I n , j S 0 , 1 to characterize the successful sensing state, and if I n , j S = 1 , the sensing target S j is successfully sensed by any UAV, and vice versa. If a sensing target is detected in t n , S , we consider that S F n , j is suddenly reduced to zero, which means fresher detection data. If a sensing target does not have the opportunity to be detected or is not successfully detected in t n , S , we consider that S F n , j is accumulated by one as an incremental penalty score.
Next, we introduce how to define a successful sensing state. The radar estimation information rate (REIR) is a commonly used metric in radar detection tasks [40]. It assesses and quantifies the radar system’s ability to sense static targets, which do not actively emit signals. In the field of radar, the detection and identification of targets is one of the core tasks, and this metric provides a standard for determining how much useful information a UAV can extract from the echo signals detected by its radar. Although static targets, such as communication devices, do not actively emit signals, their presence and characteristics (such as location, shape, material, etc.) affect the radio waves emitted by the radar and return information in the form of reflected waves. This metric can help us to optimize the design and performance of radar systems, by improving target detection accuracy and refining identification algorithms.
We assume that if the REIR of S j in t n , S exceeds its required minimum threshold, denoted as R n , j S and R Min , respectively, this sensing activity is considered successful, and vice versa. In other words, if  R n , j S R Min , we take I n , j S = 1 ; otherwise, we take I n , j S = 0 . The REIR of S j in t n , S is
R n , j S = B log 2 1 + p n , m S h n , m , j S σ 2 ,
where p n , m S denotes the transmitted power of the served UAV U m and h n , m , j S denotes the round-trip channel between U m and S j (indicating not only the path from U m to S j but also the back path from S j to U m ), expressed as
h n , m , j S = g S G S σ rcs λ S 2 4 π 2 L n , m L n , j S 2 4 .
Here, g S , G S , and  λ S also denote the transmitting antenna gain, the receiving antenna gain, and the signal wavelength for sensing, respectively. The parameter σ rcs represents the radar cross-section, which is used to describe the ability of a target to reflect radar waves—that is, the visibility of the target to radar detection. The larger the radar cross-section of a target, the stronger the signal it reflects back to the radar, and therefore, it is easier to be detected by radar. The term L n , m L n , j S 2 denotes the distance between the UAV and the sensing target.
Notice that there exists no interference (communication interference and sensing interference) for S j . This is due to the utilization of the TDMA scheme between communication and sensing, depicted in Figure 4, where the communication and sensing functions are executed using different sub-frames. Additionally, due to the varying distances between the UAV and each sensing target, as well as the different environments at each sensing target, even if the UAV sends radar pulse signals to all sensing targets simultaneously, the echo signals reflected from each sensing target will not arrive at the receiver on the UAV at the same time. Thereafter, the radar echo signals are free from interference from other echo signals.

2.4. Problem Formulation

Our goal is to simultaneously maximize the communication and sensing performance, i.e., to minimize the summation of the data freshness indicator for communication and the detection freshness indicator for sensing, by optimizing the UAV paths, the transmitted power of UAVs, the transmitted power of IoT devices, and the transmission allocation indicators in uplink ISAC system. The data freshness indicator for communication is defined as
D F = 1 N n = 1 N D F n = 1 N I n = 1 N i = 1 I D F n , i .
The detection freshness indicator for sensing is defined as
S F = 1 N n = 1 N S F n = 1 N J n = 1 N j = 1 J S F n , j .
The data freshness indicator and the detection freshness indicator are both related to the UAV path, the transmitted power of UAVs and IoT devices, and the transmission allocation indicators. These two indicators are both dimensionless. 
Let L = L n , m | n , m denote the UAV path set; P C = p n , i C | n , i denote the IoT transmitted power set; and P S = p n , m S | n , m denote the UAV transmitted power set. Then, the UAV-enabled diverse data collection problem is formulated as
min L , P C , P S , A D F L , P C , P S , A + S F L , P C , P S , A
s . t . C 1 : L n , m R , n , m , C 2 : x n , m x n 1 , m X M , n 2 , , N , m , C 3 : y n , m y n 1 , m Y M , n 2 , , N , m , C 4 : z n , m z n 1 , m Z M , n 2 , , N , m , C 5 : a n , m , i 0 , 1 , n , m , i , C 6 : m = 1 M a n , m , i 1 , n , i , C 7 : p Min S p n , m S p Max S , n , m , C 8 : p Min C p n , i C p Max C , n , i ,
where C1 is the boundary constraint for UAVs; C2–C4 are the maximum flight range constraints of UAVs for each pair of consecutive time slots; C5–C6 is the transmission allocation constraint; C7 is the UAV transmitted power constraint; and C8 is the IoT transmitted power constraint. The parameters X M , Y M , and  Z M denote the maximum flight range in the x-axis, y-axis, and z-axis, respectively; the parameters p Min S and p Max S denote the minimum and maximum transmitted power of the UAV, respectively; and the parameters p Min C and p Max C denote the minimum and maximum transmitted power of IoT devices, respectively.

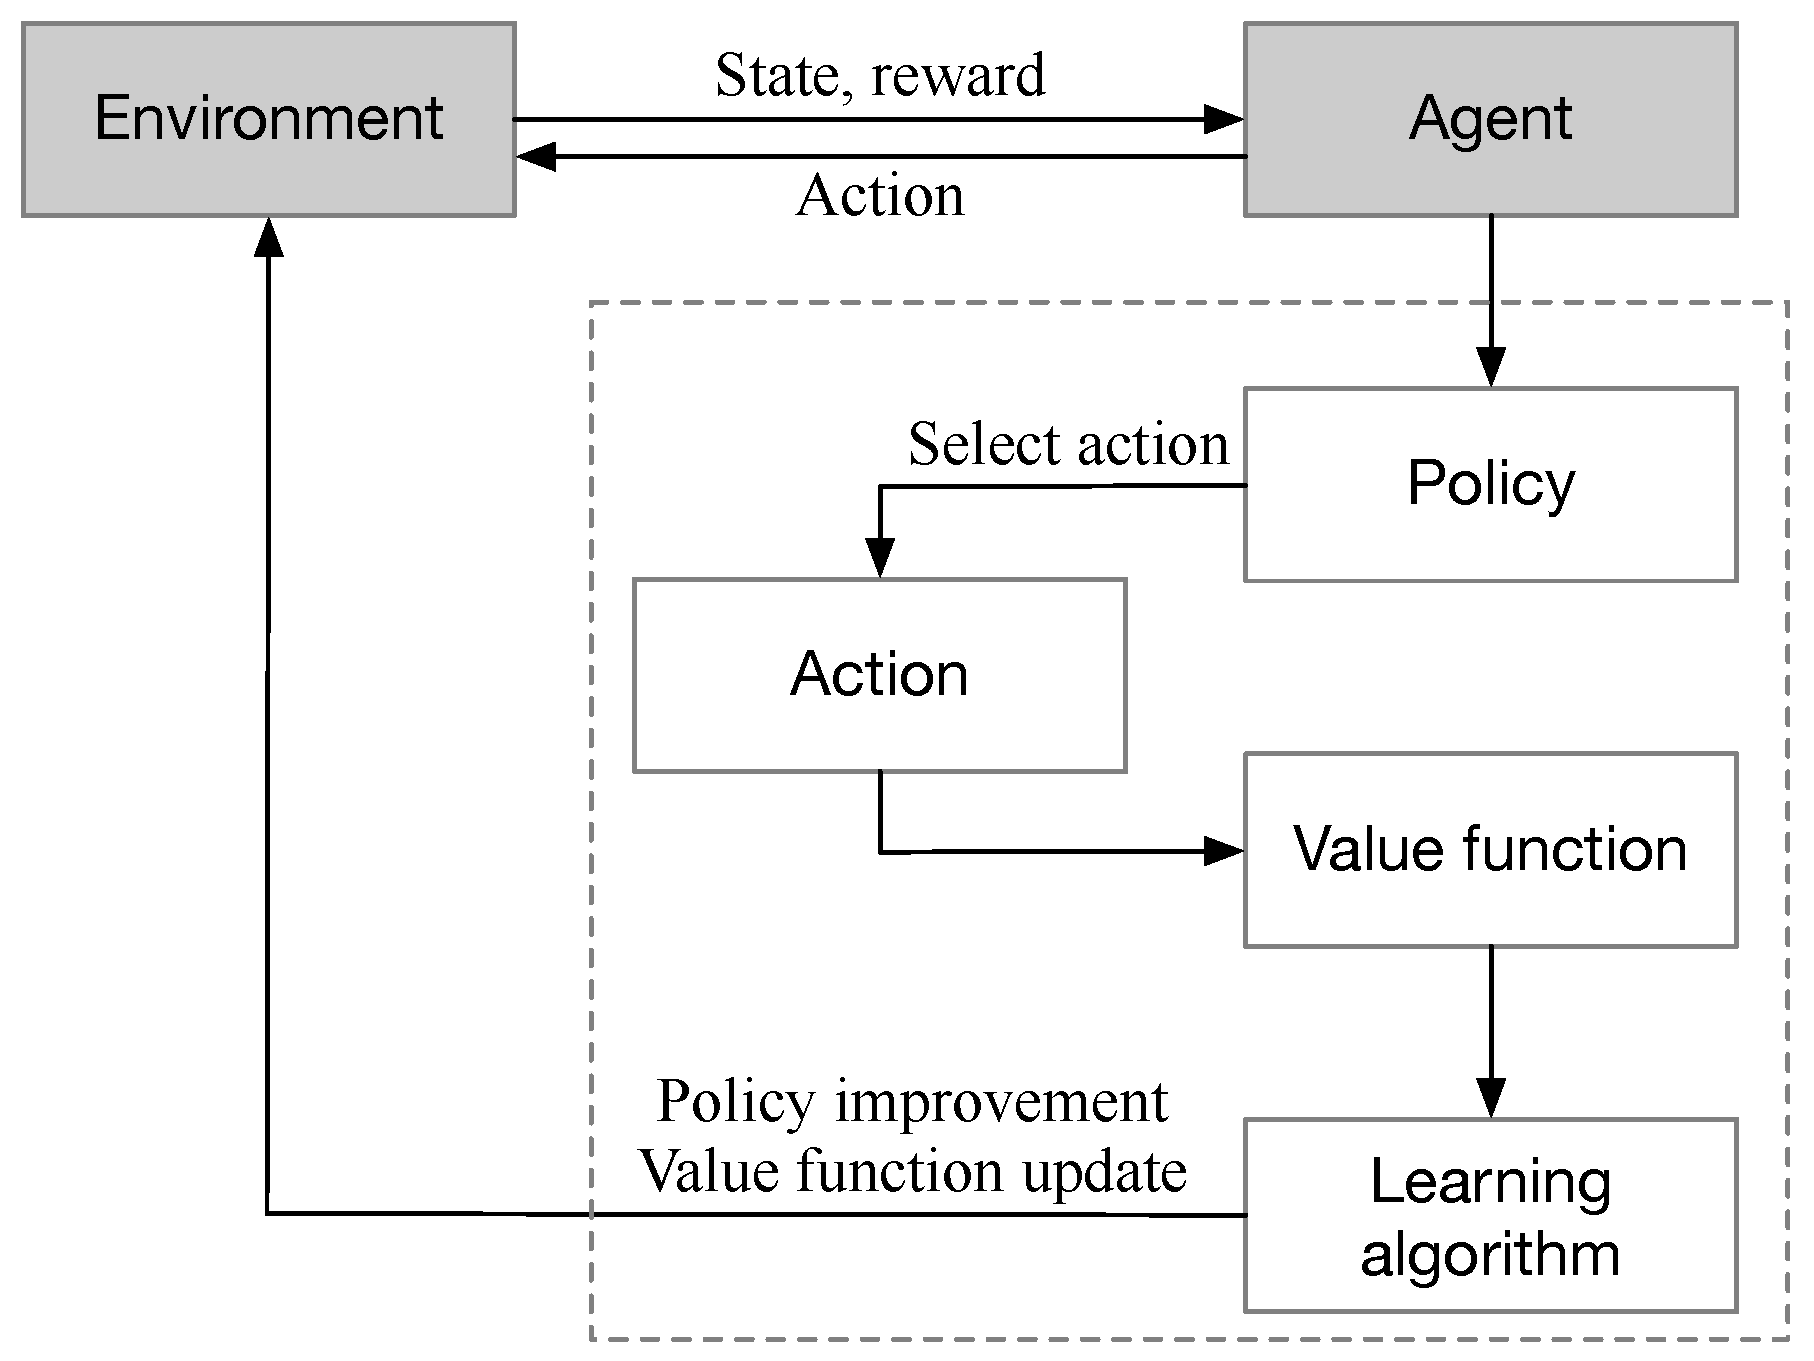
3. Deep Reinforcement Learning for UAV-Enabled Diverse Data Collection

In this section, we first reformulate the original UAV-enabled diverse data collection problem into an MDP. Then, we introduce three state-of-the-art deep reinforcement learning algorithms, namely TD3, SAC, and PPO, to solve such an MDP.

3.1. Markov Decision Process

To execute the DRL, we first reformulate the problem (11) into an MDP where some key components are included, namely the agent, environment, state, action, and reward. The MDP is the mathematical framework for the modeling of sequential decision-making problems by decision-makers in uncertain environments. We introduce these key components in the following context.
Agent: The agent is the ground base station control center that determines how to allocate resources for all UAVs and IoT devices.
Environment: The environment is the UAV-enabled diverse data collection scenario.
State: In t n , the state set S n consists of the following variables: (1) the locations of all UAVs, IoT devices, and sensing targets; (2) the data and target allocation indicators for all IoT devices and sensing targets; (3) the total data amount generated by all IoT devices; (4) the transmitted power of all UAVs and IoT devices; (5) the data transmission latency of all IoT devices; (6) the successful transmission state of all IoT devices and the successful sensing state of all sensing targets; and (7) the transmission rate of all IoT devices and the REIR of all sensing targets, expressed as
S n = L n , i C , L n , j S , L n , m , a n , m , i , b n , m , j , W n , i , p n , i C , p n , m S , Δ T n , i , I n , i C , I n , j S , D F n , i , S F n , j | i , j , m .
Action: In t n , the action set A n consists of the flight range of all UAVs in the x-axis, y-axis, and z-axis; the transmitted power of all UAVs and IoT devices; and all transmission allocation indicators, given by
A n = Δ x n , m , Δ y n , m , Δ z n , m , p n , i C , p n , m S , a n , m , i | m , i ,
where Δ x n , m = x n , m x n 1 , m , Δ y n , m = y n , m y n 1 , m , and  Δ z n , m = z n , m z n 1 , m denote the flight range of U m in the x-axis, y-axis, and z-axis, respectively. These three types of action variables correspond to three optimization variables.
Reward: In t n , we define the reward function as
R n = k D F n L , P C , P S , A + S F n L , P C , P S , A + b ,
where k and b are the coefficients to control the convergence speed and the stability of the DRL. It is worth noting that we adopt the penalty method to ensure that the UAVs tend to satisfy their boundary constraints. If the boundary constraints are not satisfied, an extremely large penalty number is subtracted from the reward function to avoid this circumstance.
We adopt DRL to solve the established MDP. DRL is a machine learning method that learns the optimal strategies through environmental interaction. In DRL, an agent receives states and rewards by performing actions, aiming to learn a policy that maximizes cumulative long-term rewards.
Within the MDP, each state transition and reward depends only on the current state and the action taken, known as the Markov property. This property simplifies the modeling of the decision-making process, since the agent does not need to consider the entire history, only the current state. This is one of the key reasons why DRL can effectively solve MDPs.
The core of solving MDPs with DRL lies in learning a policy that can tell the agent what action to take in a given state. To learn such a policy, various DRL algorithms suitable for solving different scenario problems have been proposed. These algorithms typically involve estimating state-value functions or action-value functions, which represent the expected return of taking a specific action in a specific state. By optimizing these value functions, agents can learn which actions will bring greater long-term returns in any given state. The illustration of the DRL framework for solving MDP is depicted in Figure 5.

3.2. Twin Delayed Deep Deterministic Policy Gradient

TD3 is a reinforcement learning method for continuous action spaces. It is an improved version of the deep deterministic policy gradient (DDPG) algorithm. DDPG combines the ideas of deep Q-Network (DQN) with the actor-critic framework. However, in practice, DDPG tends to overestimate the value function, leading to unstable training and decreased performance. TD3 addresses these issues with several key technical innovations, enhancing the stability and performance of the algorithm.
The TD3 algorithm has become one of the most advanced DRL algorithms due to the following advantages. First, TD3 uses two value functions (also known as Q functions) and takes the minimum of the two to reduce the overestimation of value estimates. This is inspired by Double Q-Learning, which has been shown to reduce overestimation in algorithms for discrete action spaces. In addition, the policy update frequency is less than the value function update frequency. This means that for every update of the policy network, the value network is updated multiple times. This delayed update approach allows the value estimates to stabilize, leading to a more stable learning process. Furthermore, TD3 adds noise to the target policy calculation to smooth out the target policy, avoiding excessive sensitivity to noise, which helps with the stability of the learning process.
The algorithm process step of TD3 is provided as follows.
  • Initialization: Randomly initialize two value networks (critics, Q ϕ 1 and Q ϕ 2 with parameters ϕ 1 and ϕ 2 ) and a policy network (actor, π θ with parameter θ ). Also, initialize the corresponding target networks ( Q ϕ target , 1 , Q ϕ target , 1 , and  π θ target with parameters ϕ target , 1 , ϕ target , 1 , and  θ target ) with the same parameters as the original networks.
  • Data Collection: Execute the current policy π θ , take actions in the environment, collect transitions (state S , action A , reward R , next state S ), and store them in D.
  • Sample Extraction: Randomly sample a batch of experiences S , A , R , S from D.
  • Value Network Update: Calculate the target value using the minimum Q value and the action produced by the target policy network, and update both value networks using the mean squared error, expressed as
    J Q ϕ i = E S , A , R , S D Q ϕ i ( S , A ) R + γ min i = 1 , 2 Q ϕ target , j S , π θ target S + ϵ 2 ,
    where i 1 , 2 ; A is the action sampled from state S according to the current policy; γ is the discount factor; and ϵ N 0 , σ 2 is the noise added to the target policy action to ensure exploration and smooth out the value estimates.
  • Policy Network Update: The policy network is updated using the policy gradient, which is computed using one of the value networks (typically Q ϕ 1 ):
    θ J π ( θ ) = E S D A Q ϕ 1 S , A | A = π θ S θ π θ S .
  • Target Network Soft Update: The parameters of the target networks are slowly adjusted towards those of the main networks, with a small update magnitude, typically using a small learning rate, given by
    θ target τ θ + ( 1 τ ) θ target ,
    ϕ target , i τ ϕ i + ( 1 τ ) ϕ target , i , i 1 , 2 ,
    where τ is the soft update coefficient.
  • Repeat steps 2–6 until the training conditions are satisfied.
Let V = W n , i , D S , B , G C , g C , λ C , g S , G S , λ S , σ rcs , σ 2 , X M , Y M , Z M , p Min S , p Max S , p Min C , p Max C denote the variable set related to the system parameters. The pseudocode of TD3 for UAV-enabled diverse data collection optimization is provided in Algorithm 1.
Algorithm 1 Twin delayed deep deterministic policy gradient for UAV-enabled diverse data collection optimization.
1:
Initialize V , Q ϕ 1 , Q ϕ 2 , π θ , Q ϕ target , 1 , Q ϕ target , 1 , π θ target , γ , τ , D.
2:
A n Δ x n , m , Δ y n , m , Δ z n , m , p n , i C , p n , m S , a n , m , i | m , i .
3:
R n k D F n L , P C , P S , A + S F n L , P C , P S , A + b .
4:
Collect transitions S , A , R , S and store them in D.
5:
for Each update episode l do
6:
   Sample a batch of S l , A l , R l , S l + 1 .
7:
   Update Q ϕ 1 and Q ϕ 2 according to Equation (15).
8:
   Update π θ according to Equation (16).
9:
   Update target policy π θ target according to Equation (17).
10:
   Update target value Q ϕ target , 1 and Q ϕ target , 2 according to Equation (18).
11:
end for

3.3. Soft Actor-Critic

SAC is a deep reinforcement learning algorithm based on the actor-critic architecture that incorporates the maximum entropy reinforcement learning framework to improve the algorithm’s sampling efficiency, robustness, and exploration capabilities. The goal of maximum entropy reinforcement learning is to maximize cumulative rewards and increase the entropy of the policy, encouraging the policy to take a diverse set of actions, thereby improving exploration efficiency.
SAC has several advantages over existing DRL algorithms. First, by using off-policy data and a replay buffer, SAC can use experiences more efficiently. Second, SAC employs a soft update mechanism for the value function, which can reduce the variance during training and improve learning stability. Third, the maximum entropy framework naturally encourages the policy to explore, which is particularly beneficial in complex or sparse reward environments. Fourth, as the policy is stochastic, SAC tends to be more robust when facing changes in the environment.
The algorithm process step of SAC is provided as follows.
  • Initialization: Initialize the policy network (actor, π θ with parameter θ ), two value networks (critics, Q ϕ 1 and Q ϕ 2 with parameters ϕ 1 and ϕ 2 ), their target networks ( Q ϕ target , 1 and Q ϕ target , 2 with parameters Q ϕ target , 1 and Q ϕ target , 2 ), and the replay buffer D.
  • Data Collection and Sample Extraction
  • Value Network Update: Update the value networks using the sampled experiences, usually by minimizing the mean squared error between the predicted and target values, given by
    J Q ϕ i = E S , A , R , S D [ 1 2 ( Q ϕ i S , A ( R + γ ( 1 d ) min j = 1 , 2 Q ϕ target , j ( S , A ) α log π θ ( A | S ) ) ) 2 ] , i 1 , 2 ,
    where d represents the termination flag and α is the entropy regularization coefficient. Here, the entropy regularization coefficient is adaptively adjusted.
  • Soft Value Update: Update the soft value function using the outputs of the value networks and the rewards.
  • Policy Network Update: Update the policy network to maximize the soft value function while also increasing the entropy of the policy, given by
    J π ( θ ) = E S D , A π θ α log ( π θ ( A | S ) ) Q ϕ ( S , A ) .
    Here, Q ϕ is the smaller of the two value networks, Q ϕ 1 and Q ϕ 2 .
  • Target Network Soft Update: Periodically soft update the weights of the value networks to the target networks to stabilize the training process, given by
    ϕ target , i τ ϕ i + ( 1 τ ) ϕ target , i , i 1 , 2 .
  • Repeat steps 2–6 until the policy performance meets expectations or the training reaches a predefined number of iterations.
The pseudocode of SAC for UAV-enabled diverse data collection optimization is provided in Algorithm 2.
Algorithm 2 Soft actor-critic for UAV-enabled diverse data collection optimization.
1:
Initialize V , π θ , Q ϕ 1 , Q ϕ 2 , Q ϕ target , 1 , Q ϕ target , 2 , α , γ , τ , d, D.
2:
A n Δ x n , m , Δ y n , m , Δ z n , m , p n , i C , p n , m S , a n , m , i | m , i .
3:
R n k D F n L , P C , P S , A + S F n L , P C , P S , A + b .
4:
Collect transitions S , A , R , S and store them in D.
5:
for Each update episode l do
6:
   Sample a batch of S l , A l , R l , S l + 1 .
7:
   Update Q ϕ 1 and Q ϕ 2 according to Equation (19).
8:
   Update soft value function.
9:
   Adaptively adjust entropy regularization coefficient α .
10:
   Update π θ according to Equation (20).
11:
   Softly update target value Q ϕ target , 1 and Q ϕ target , 2 according to Equation (21).
12:
end for

3.4. Proximal Policy Optimization

PPO is an algorithm widely used in reinforcement learning that maintains training stability and prevents performance collapse due to excessive changes in the policy during updates. Policy gradient methods directly adjust policy parameters by optimizing an objective function to obtain greater cumulative rewards.
Compared to other state-of-the-art DRL algorithms, the characteristics and advantages of PPO are primarily as follows. First, PPO is simpler than its earlier version trust region policy optimization (TRPO), as it avoids complex second-order computations, i.e., the Hessian matrix, and instead relies on first-order optimization methods. Second, PPO is more sample-efficient than some other on-policy algorithms because it can reuse sampled data multiple times for each update. Third, PPO ensures training stability and robustness by limiting the magnitude of policy updates, preventing large policy shifts that could lead to performance collapse. Fourth, the PPO algorithm encourages exploration while learning by limiting the size of policy updates.
The core idea of the PPO algorithm is to introduce a "proximity” constraint during policy updates to ensure that the new policy does not deviate too far from the old policy. This is achieved by clipping the probability ratio, which describes the ratio of the probabilities of taking the same action under the new policy to that under the old policy.
The steps of the PPO algorithm are roughly as follows:
  • Initialization: Initialize the policy network (actor, π θ with parameter θ ) and the value network (critic, Q ϕ with parameter ϕ ).
  • Data Collection
  • Advantage Estimation: Estimate the advantage function at each time step using the collected data, which typically involves calculating the discounted sum of rewards and a baseline to reduce variance. The temporal difference (TD) error is a method to evaluate the accuracy of the value function. At a given time step l, the TD error is given by
    δ l = R l + γ V ϕ ( S l + 1 ) V ϕ ( S l ) ,
    where V ϕ is the value function. Generalized advantage estimation (GAE) is a technique to reduce the variance of policy gradient estimates while maintaining a balance with bias, given by
    G A E l ( γ , λ ) = k = 0 ( γ λ ) k δ l + k
    where λ is a parameter between 0 and 1 used to balance bias and variance. When λ = 0 , GAE reduces to the single-step TD error, and when λ = 1 , it approaches the Monte Carlo method.
  • Policy Optimization: Optimize the policy by maximizing a specific objective function that includes a clipped ratio of probabilities and the estimated advantage function, along with an entropy bonus to encourage exploration, given by
    L CLIP ( θ ) = E l [ min ( π θ A l | S l π θ previous A l | S l G A E l , clip ( π θ A l | S l π θ previous A l | S l , 1 ξ , 1 + ξ ) G A E l ) ] ,
    where ξ is the clipping parameter.
  • Probability Ratio Clipping: Clip the probability ratio if it goes beyond a predefined interval to limit the magnitude of policy updates.
  • Value Function Update: Update the value function using the same trajectory data, usually by minimizing the mean squared error between the value predictions and the actual returns, given by
    L VF ( ϕ ) = V ϕ ( S l ) k = 0 γ k π θ A l + k | S l + k π θ previous A l + k | S l + k 2 .
  • Repeat steps 2–6 using the updated policy and value function until a termination condition is met, such as achieving a predetermined performance standard or completing a certain number of iterations.
The pseudocode of PPO for UAV-enabled diverse data collection optimization is provided in Algorithm 3.
Algorithm 3 Proximal policy optimization for UAV-enabled diverse data collection optimization.
1:
Initialize V , Q ϕ , π θ , γ , λ , ϵ , ξ D.
2:
A n Δ x n , m , Δ y n , m , Δ z n , m , p n , i C , p n , m S , a n , m , i | m , i .
3:
R n k D F n L , P C , P S , A + S F n L , P C , P S , A + b .
4:
Collect transitions S , A , R , S and store them in D.
5:
for Each update episode do
6:
   for each time step L do
7:
     Calculate temporal difference error δ l according to Equation (22).
8:
     Calculate advantage estimate G A E l ( γ , λ ) using GAE according to Equation (23).
9:
   end for
10:
   for each epoch do
11:
     for each minibatch do
12:
        Update policy parameter θ according to clipped objective function L CLIP ( θ ) in Equation (24).
13:
     end for
14:
   end for
15:
   for each epoch do
16:
     for each minibatch do
17:
        Update value function parameter ϕ according to value function loss L VF ( ϕ ) in Equation (25).
18:
     end for
19:
   end for
20:
    θ previous θ .
21:
end for

4. Experimental Results and Discussions

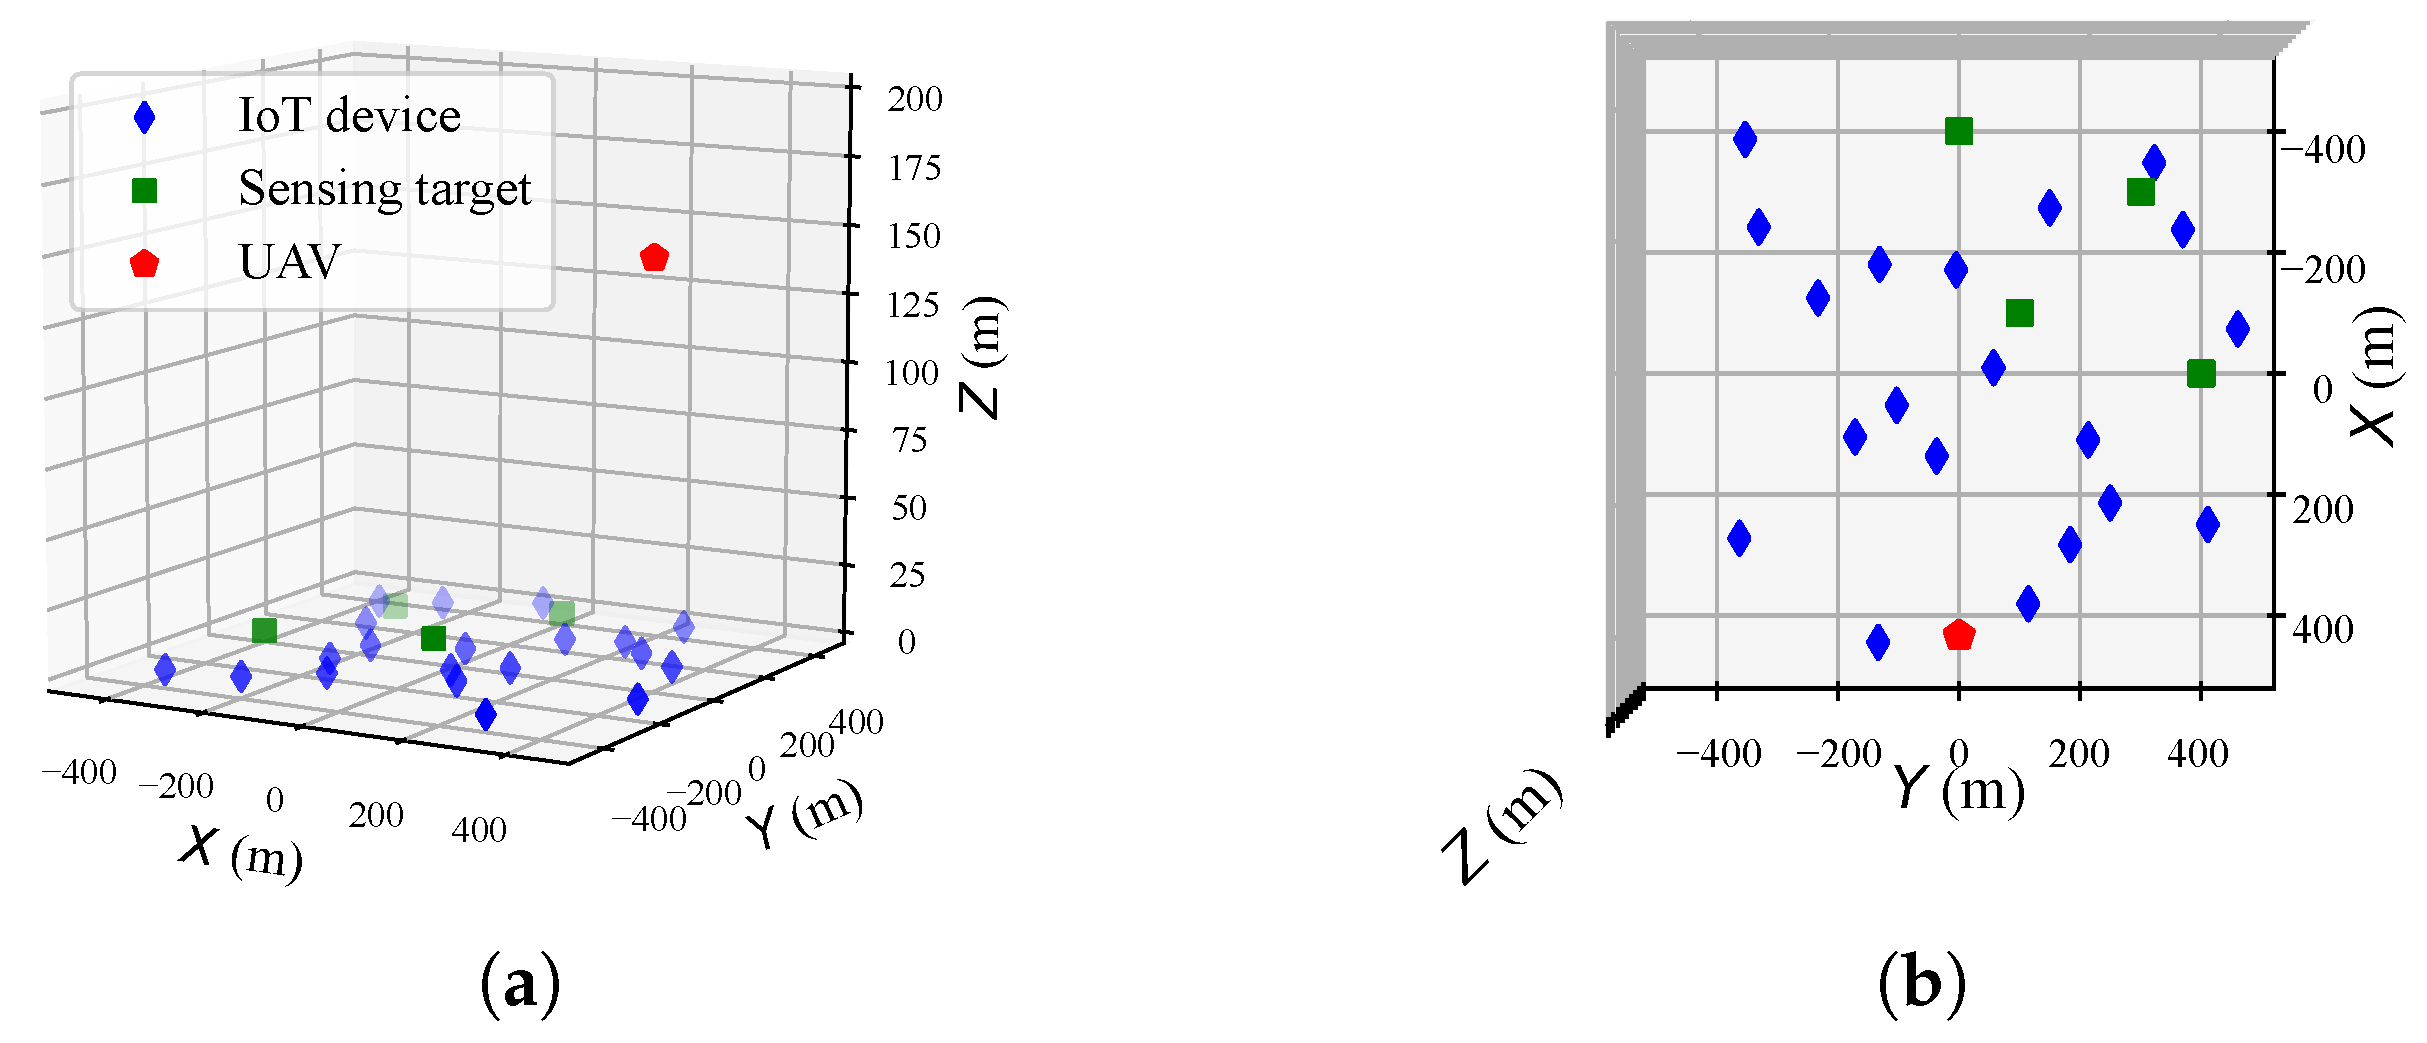
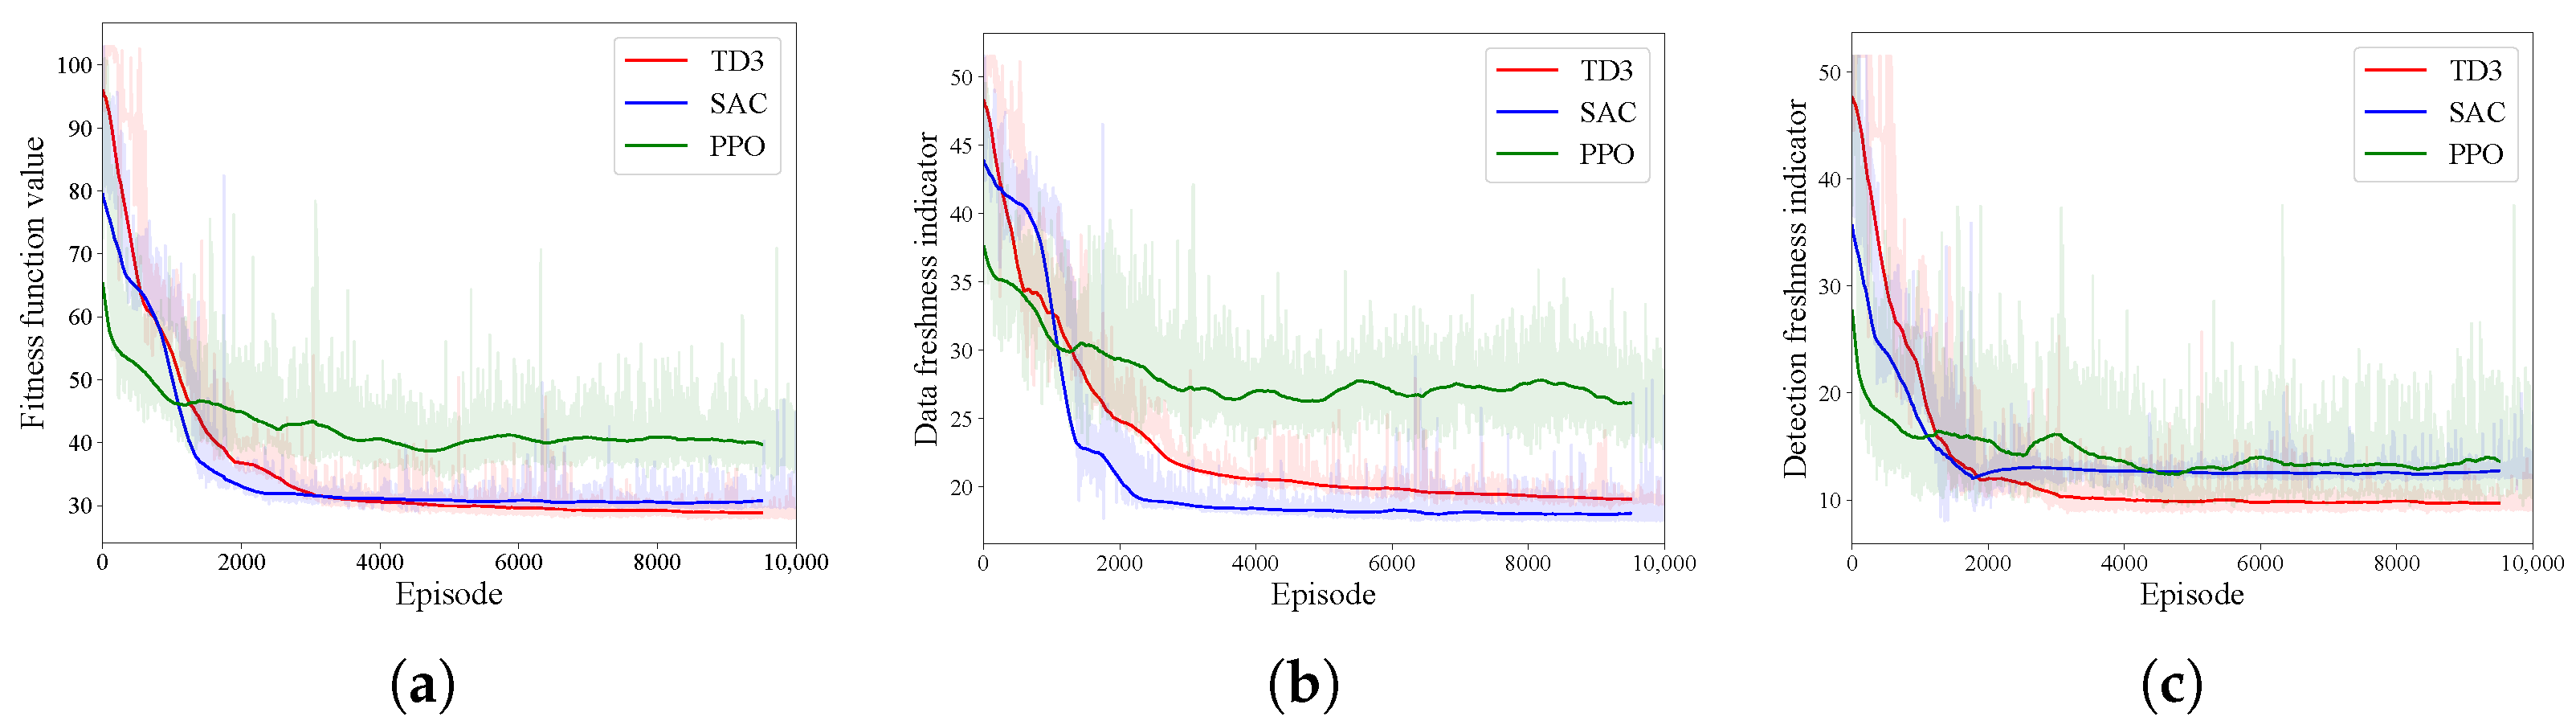
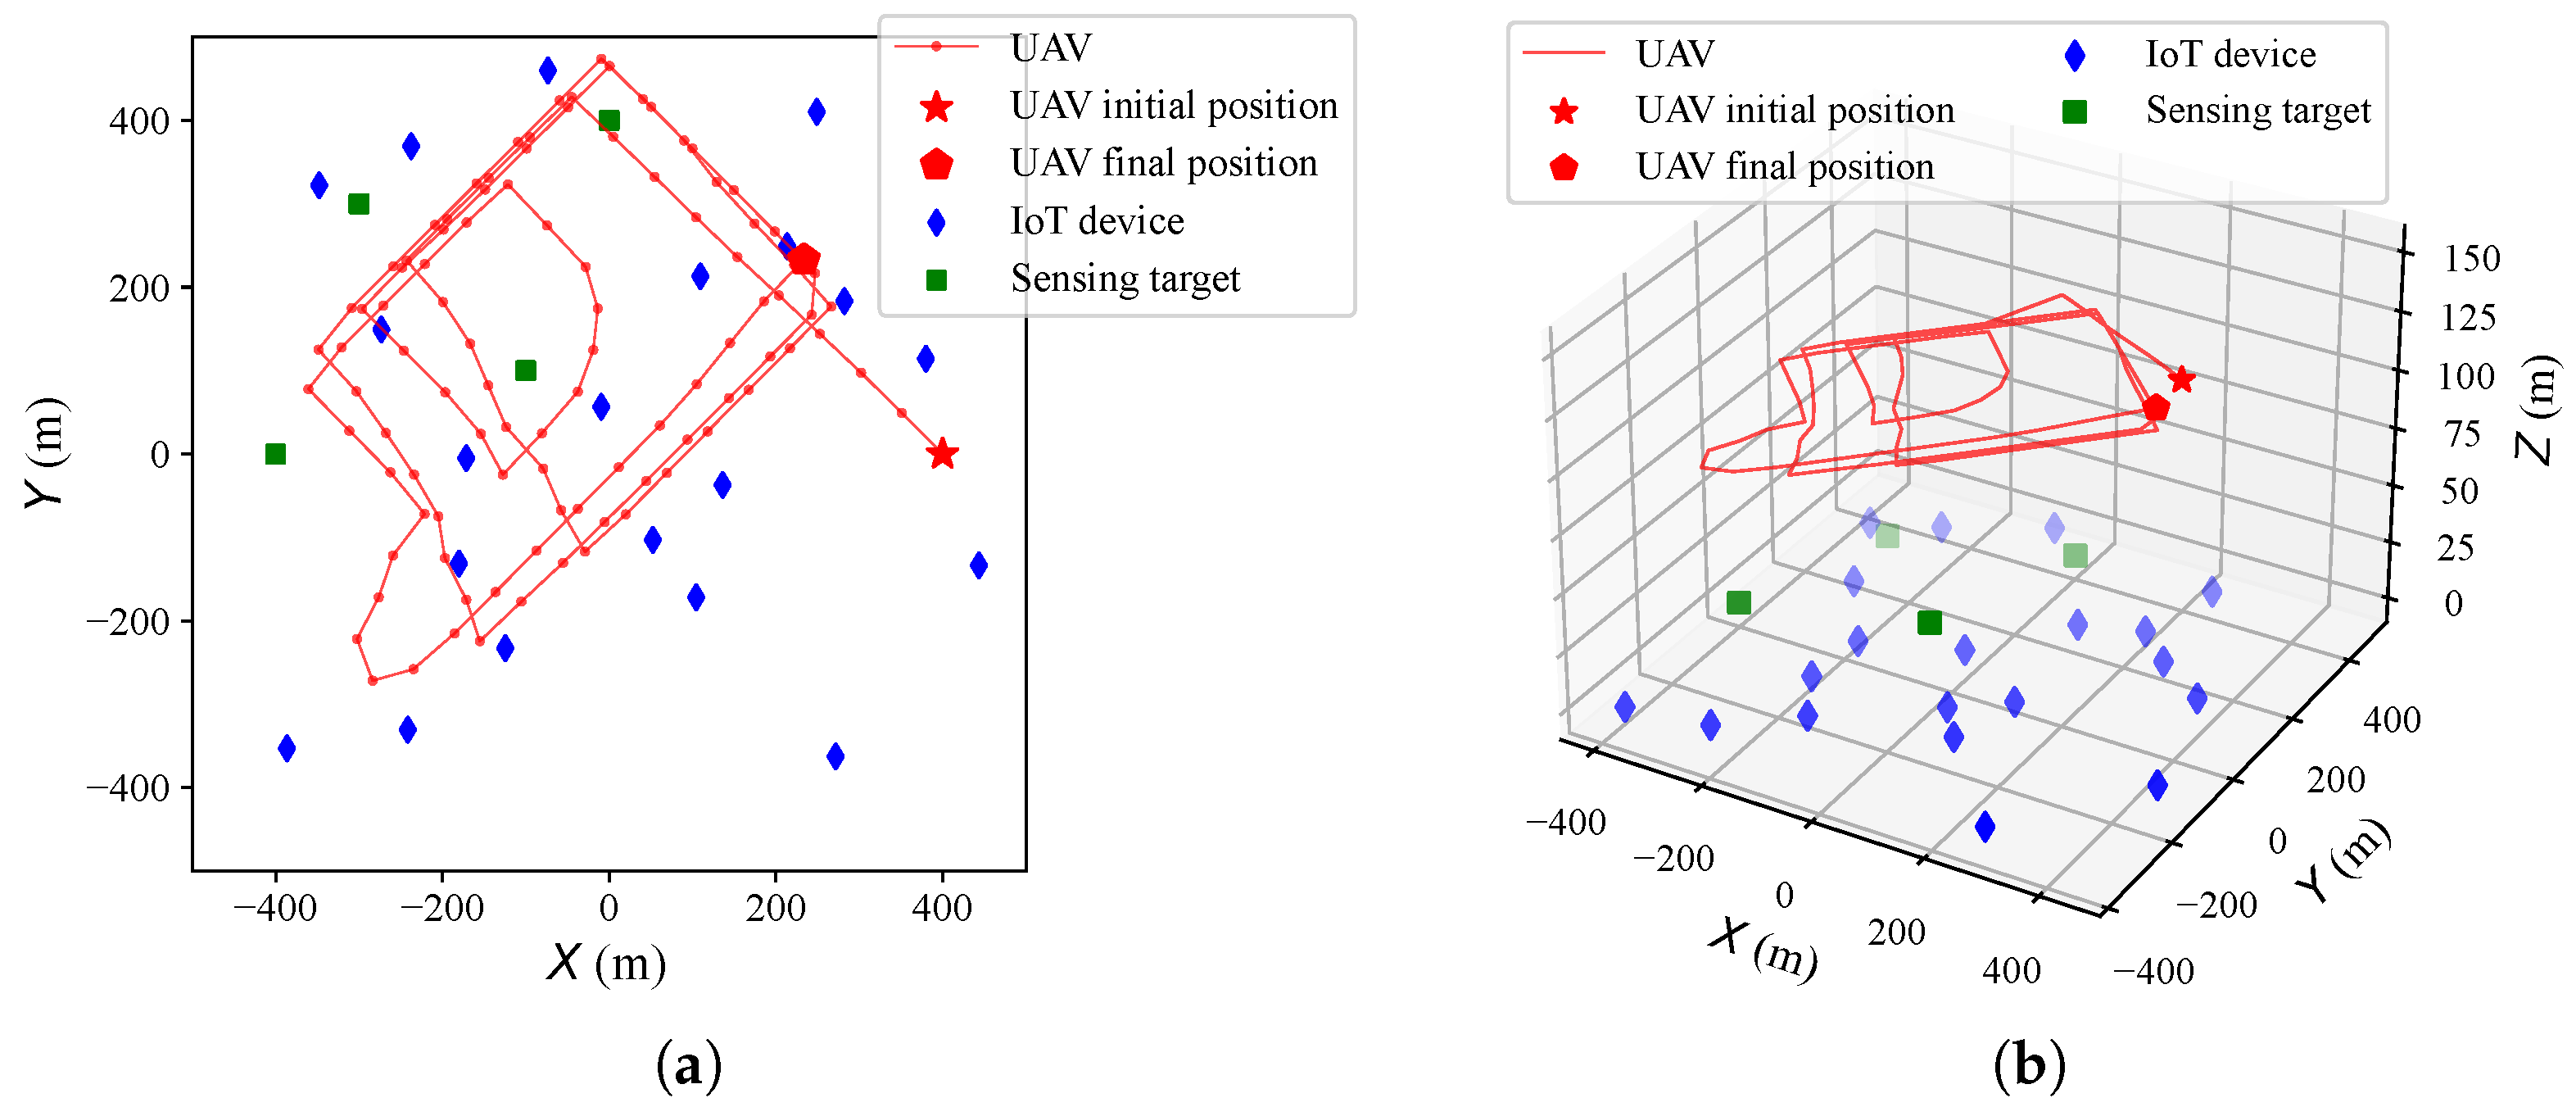
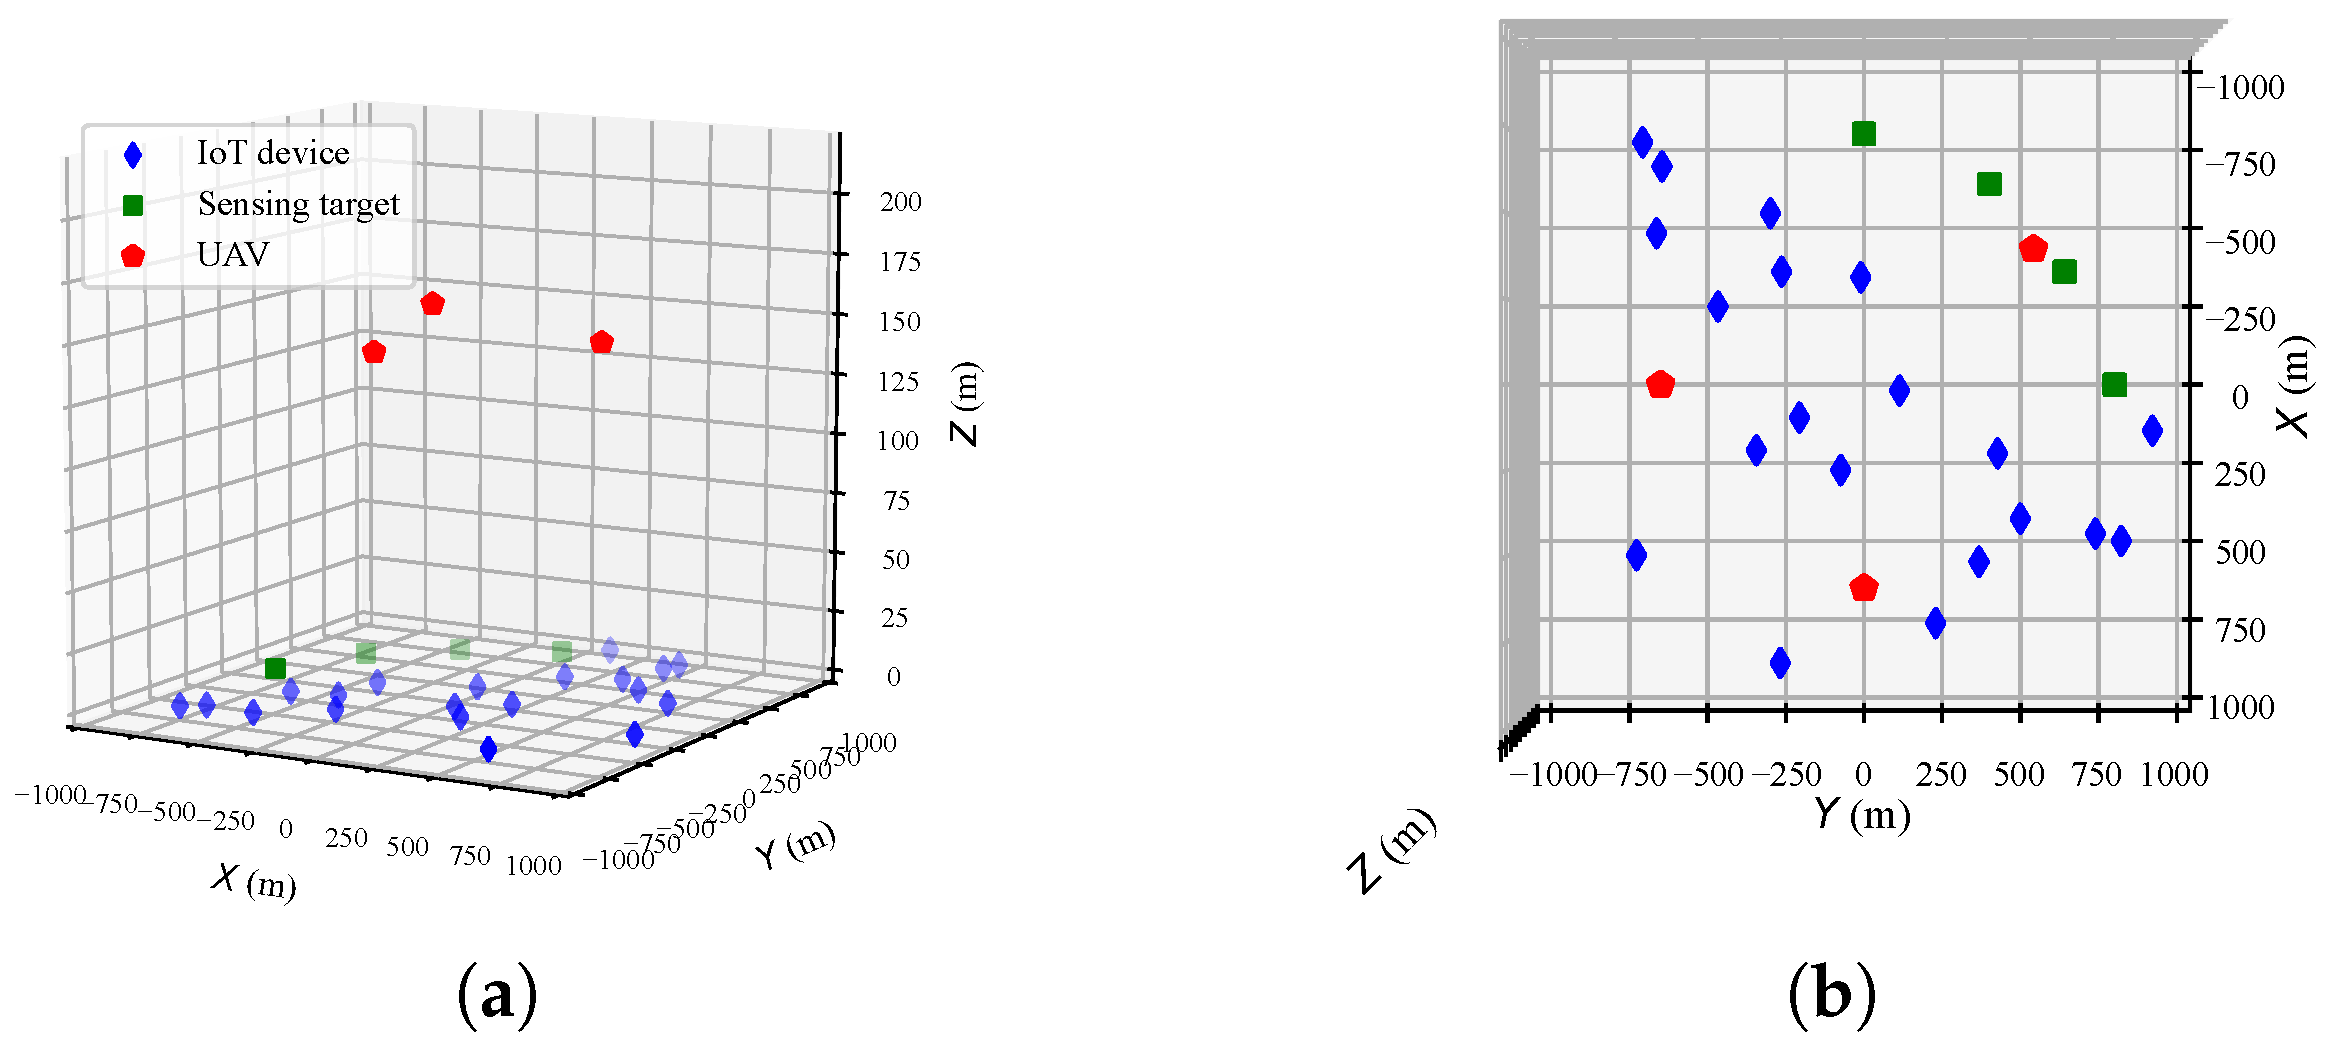
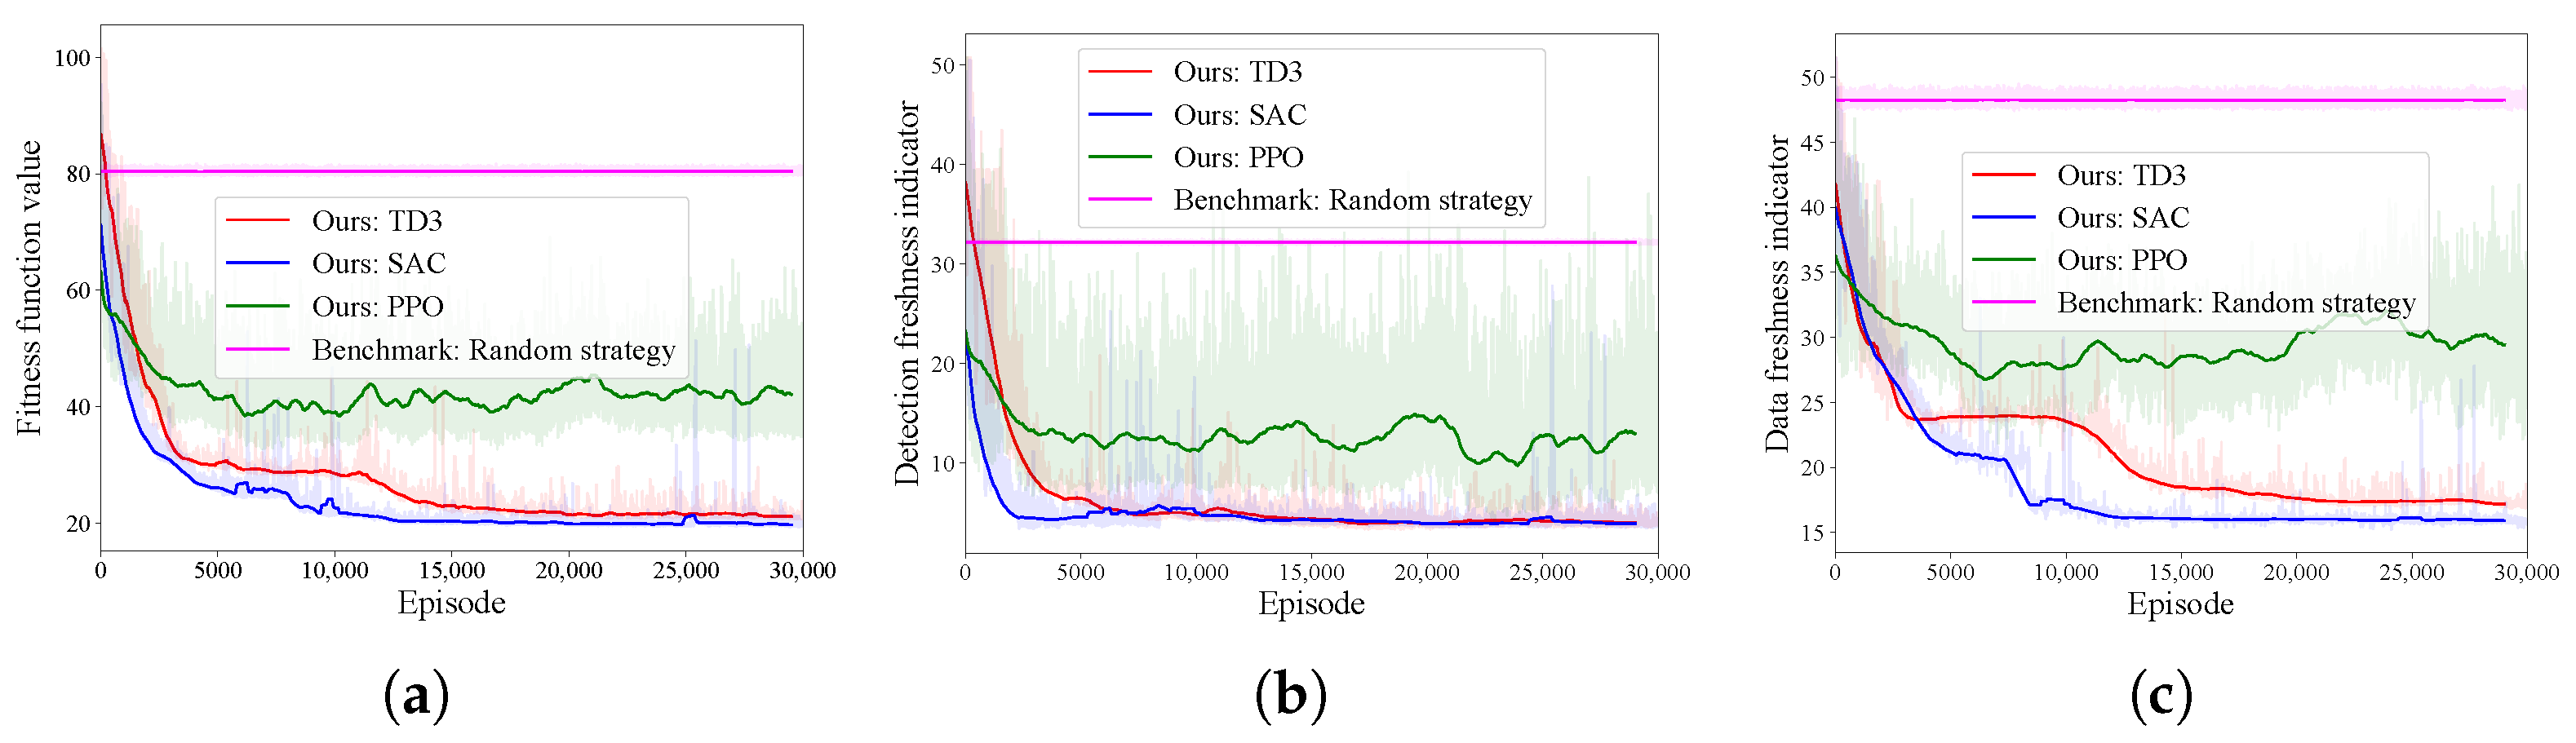
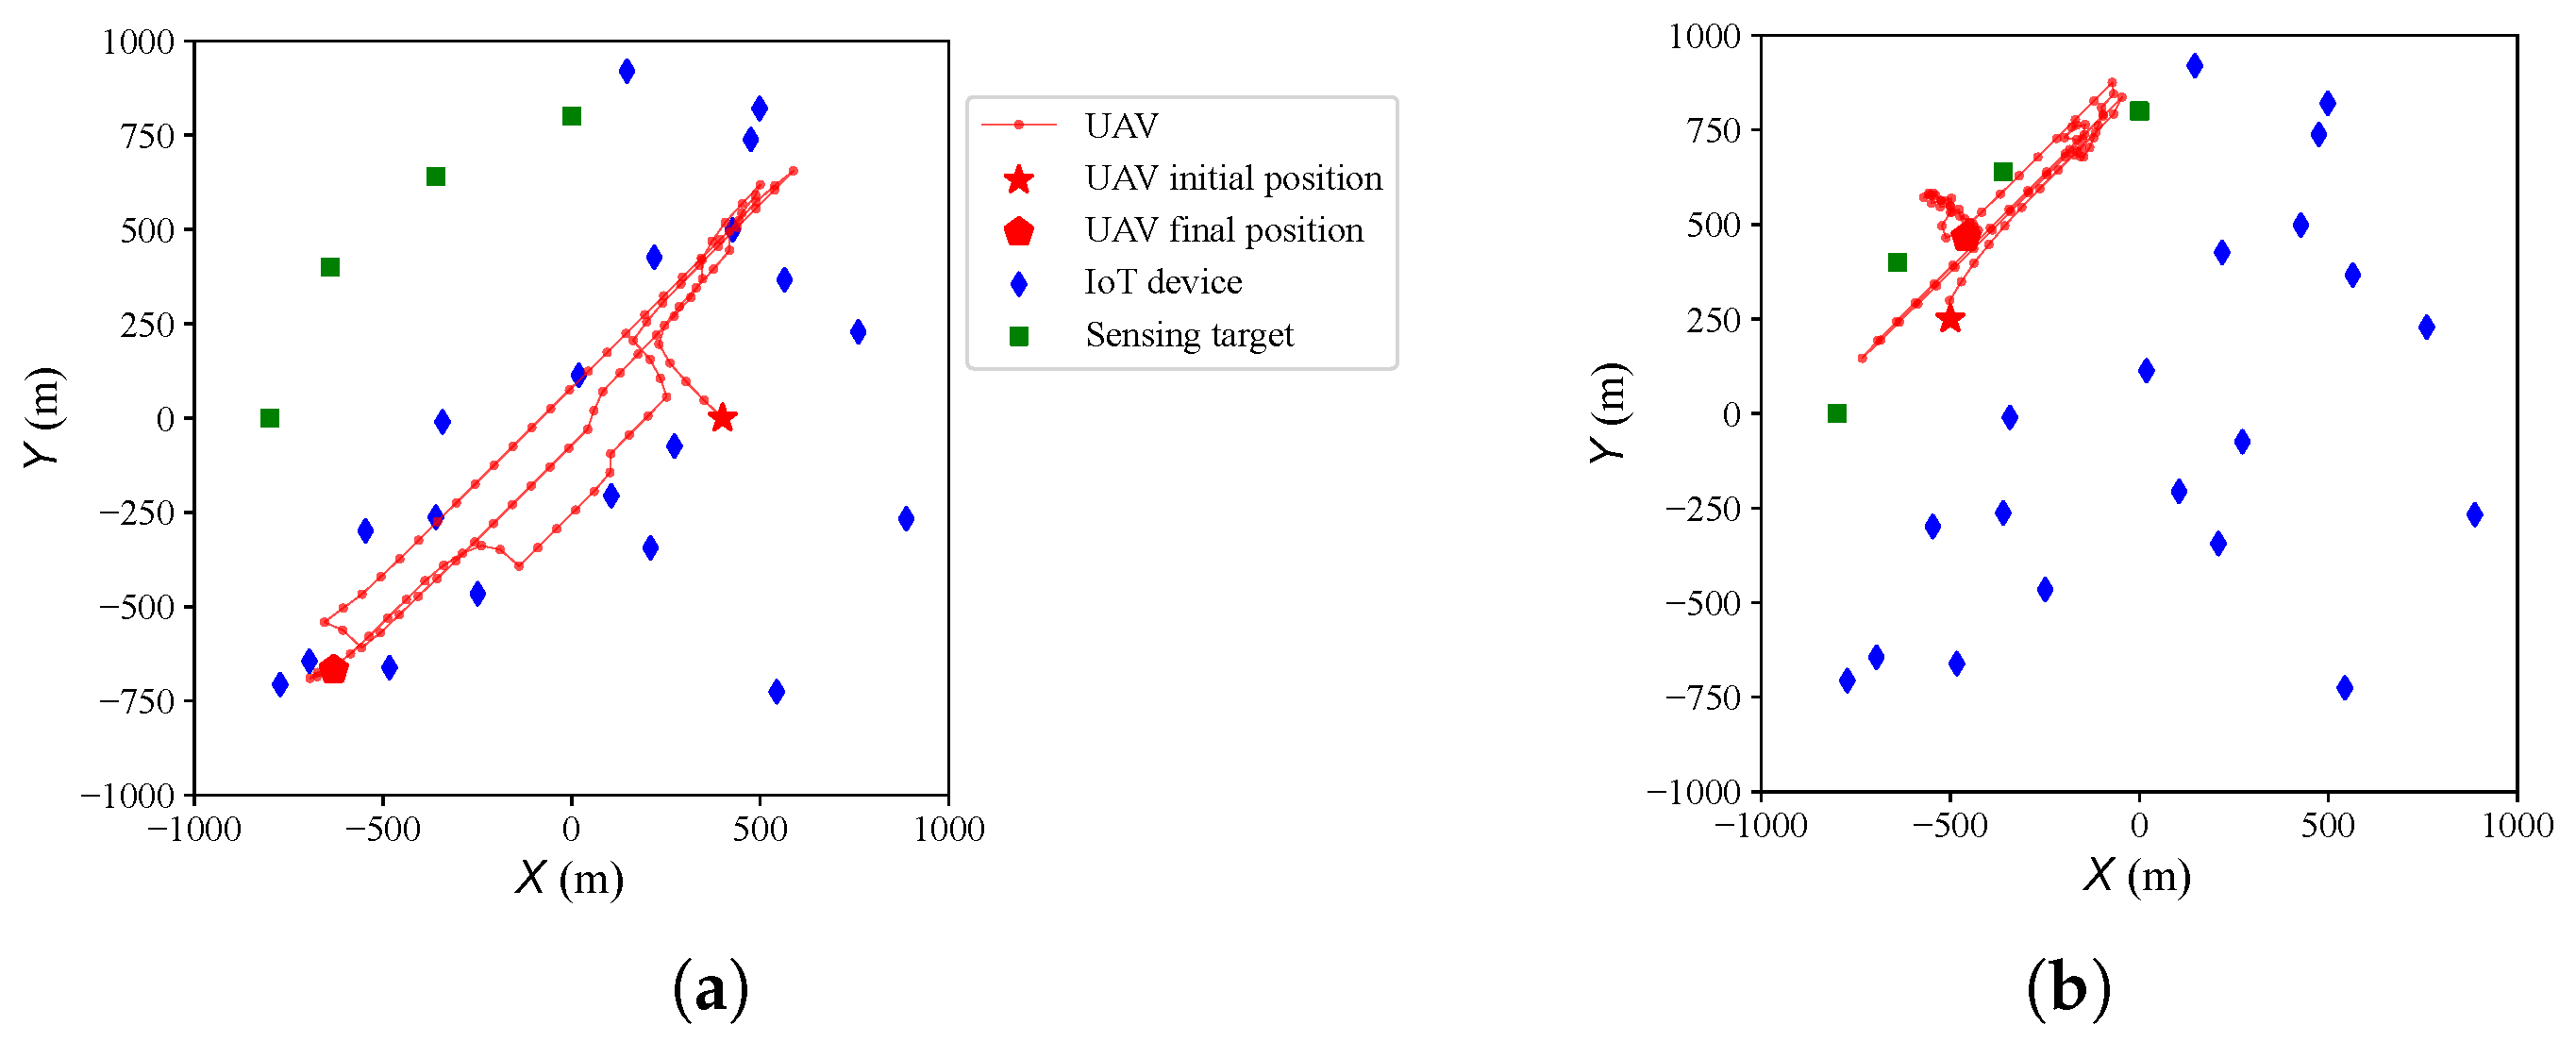
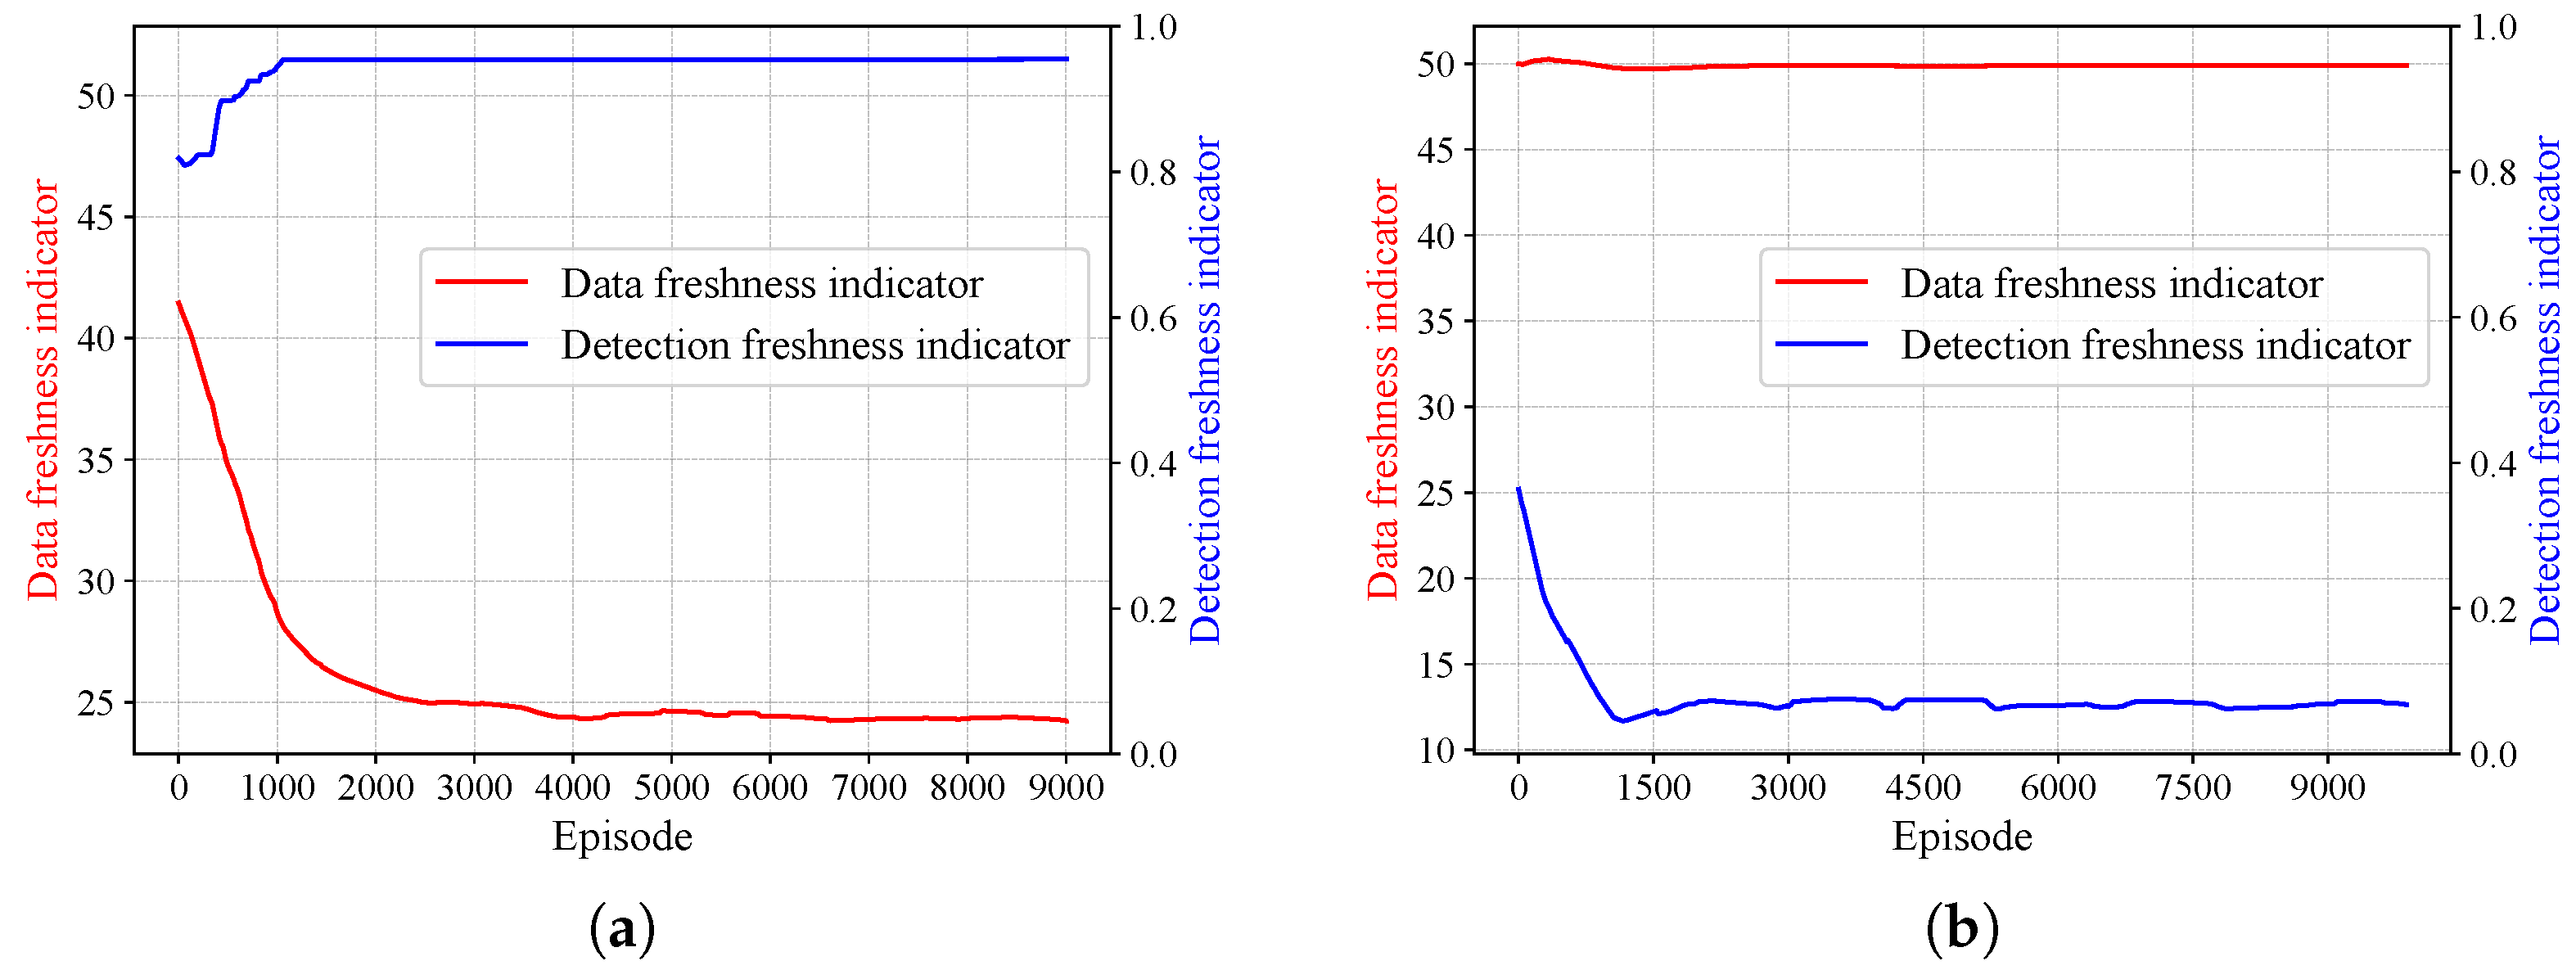
4.1. Algorithm Effectiveness in a Single-UAV Scenario

In this subsection, we testify the algorithms’ effectiveness in a synthetic single-UAV scenario where M = 1 UAV collects the data from I = 20 IoT devices and simultaneously senses J = 4 sensing targets within N = 100 time nodes in region R [ 500 m , 500 m ] × [ 500 m , 500 m ] × [ 100 m , 200 m ] . The locations of IoT devices and sensing targets are randomly generated on the ground. The initial location of the UAV is randomly generated in the three-dimensional region, as depicted in Figure 6. In Figure 6, the blue solid diamonds represent the IoT devices, the green solid squares represent the sensing targets, and the red solid pentagons represent the UAV.
The total data amount provided by each IoT device in each time slot is randomly generated at between 20 kb and 30 kb. The maximum sensing range D S is set to 180 m. The bandwidth B is set to 1 MHz. The variance of Gaussian noise σ 2 is sampled in [ 10 16 , 10 15 ] . The maximum flight range in the x-axis, y-axis, and z-axis is set to X M = 50 m , Y M = 50 m , and Z M = 5 m , respectively. The minimum and maximum transmitted power of UAVs are set to p Min S = 0.1 W and p Max S = 1 W , respectively. The minimum and maximum transmitted power of IoT devices are set to p Min C = 0.01 W and p Min C = 0.1 W , respectively. The minimum threshold of REIR is set to R Min = 10 5 bit/s. The settings of the above parameters are all based on a reasonable simulation of practical scenarios, listed in Table 1.
To verify the effectiveness, the algorithm convergence of the proposed TD3, SAC, and PPO algorithms is depicted in Figure 7. Figure 7b,c show the data freshness indicator for communication and the detection freshness indicator for sensing, respectively. It is worth noting that the summation of these two indicators is exactly the optimization objective, also referred to as the fitness function in the optimization. The illustration of the fitness function value versus episode is depicted in Figure 7a. It can be seen from Figure 7a that as the number of episodes increases, the fitness function value decreases, which demonstrates the effectiveness of the proposed algorithm. Also, we can see from Figure 7b,c that as the number of episodes increases, both indicators decrease for TD3, SAC, and PPO, meaning that communication and sensing performance improve. It is worth noting that these two indicators are both dimensionless. This indicates that the proposed three DRL algorithms are all valid in UAV-enabled diverse data collection optimization. In addition, the PPO algorithm exhibits better optimization performance in the initial stages and tends to converge faster. This is due to the high universality of the PPO algorithm. Although TD3 and SAC converge slower in the early stages, their final convergence outcomes are superior to those of the PPO algorithm in the later stages. The PPO algorithm performs slightly worse than TD3 and SAC when dealing with high-dimensional continuous action spaces. Furthermore, the SAC performs better than TD3 regarding the convergence value. SAC has better exploration capabilities and robustness with its entropy regularization, making it particularly suitable for complex continuous action space problems. However, SAC may have higher computational overheasd than TD3 and PPO due to the maintenance cost of an additional entropy term.
Then, we depict the UAV paths obtained by the SAC algorithm to further testify this algorithm’s effectiveness. The patterns of the UAV paths optimized by the three algorithms are almost identical. However, SAC exhibits the best convergence results, and thus we show the optimal UAV path obtained under this optimum. Two-dimensional and three-dimensional UAV paths are depicted in Figure 8a and Figure 8b, respectively. First, the UAV tends to fly over the entire area to provide communication services for all IoT devices and sensing services for all sensing targets. This demonstrates the effectiveness of the algorithm in terms of communication and sensing capabilities. Then, the IoT device in the bottom right corner has no opportunity to communicate during the whole service period. This is because letting the UAV specifically fly to serve that IoT device would reduce the support for other devices located in the dense region. When considering the balance between supporting frequent data collection in denser areas and collecting data from single IoT devices in remote, sparse regions, the UAV’s strategy favors the former. However, if the penalty for the IoT device not communicating gradually increases, the optimization also tends to avoid being penalized by such circumstances. Furthermore, we can observe that the UAV flies in circles over the entire area. This is to provide services to IoT devices that have not had their data collected for a long time, reflecting fairness in communication and sensing.

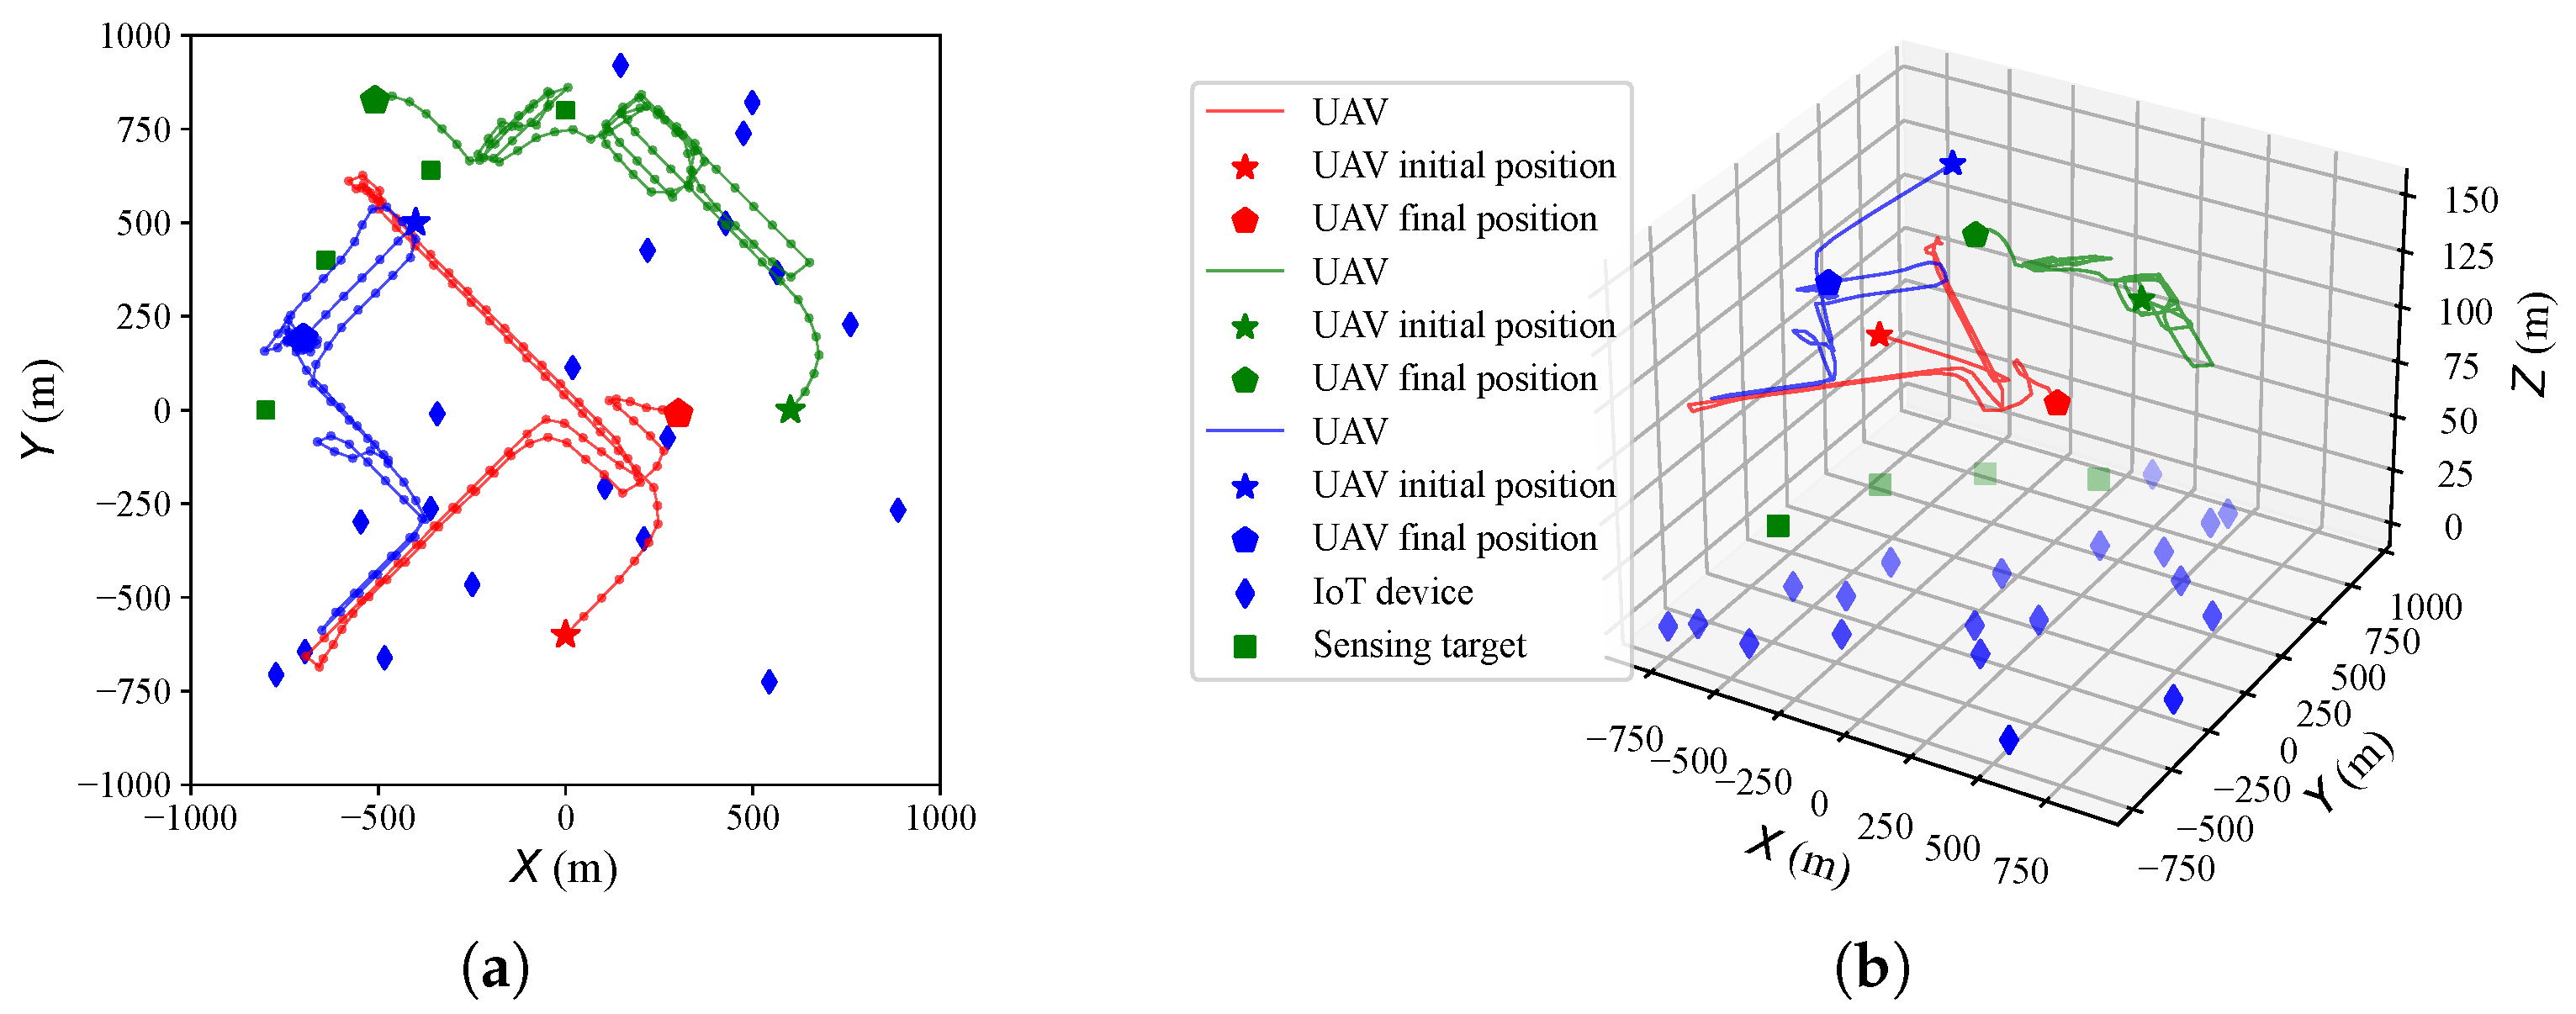
4.2. Algorithm Effectiveness in a Multi-UAV Scenario

We further verify the effectiveness of the algorithm in a multi-UAV scenario where M = 3 UAVs are considered to provide diverse data collection functions in a larger-range area R [ 1000 m , 1000 m ] × [ 1000 m , 1000 m ] × [ 100 m , 200 m ] . In practical large-scale scenarios, the number of IoT devices and sensing targets does not affect the effectiveness of the algorithm, but affects its convergence speed. To characterize the effectiveness of the algorithm, we consider a smaller number of IoT devices and sensing targets to ensure faster convergence, where I = 20 IoT devices and J = 4 sensing targets are considered. The maximum sensing range D S is set to 250 m for the larger area. The other settings of parameters are consistent with those in the single-UAV scenario. The locations of IoT devices are randomly generated in the area, but we consider that there are no IoT devices in the top right corner of the area. Sensing targets are distributed in the top right corner of the area. The initial positions of the three UAVs are also randomly generated. The illustration of the initial locations of the UAVs, IoT devices, and sensing targets in the three-UAV scenario is depicted in Figure 9, where the blue solid diamonds, the green solid squares, and the red solid pentagons represent the IoT devices, the sensing targets, and the UAVs, respectively.
To verify the effectiveness in the multi-UAV scenario, the algorithm convergence of the proposed TD3, SAC, and PPO algorithms is depicted in Figure 10. Figure 10a–c show the fitness function value, the data freshness indicator for communication, and the detection freshness indicator for sensing, respectively. It can be seen from Figure 10 that as the number of episodes increases, the fitness function value of the optimization gradually decreases, and the communication and sensing indicators also decrease, (indicating improved performance in communication and sensing), which demonstrates the effectiveness of the algorithm. In addition, the proposed SAC and TD3 algorithms outperform the proposed PPO algorithm in terms of the final result quality. However, the proposed PPO has higher stability.
To verify the effectiveness of the proposed algorithms, we consider the random strategy to compare the performance. A random strategy, serving as a benchmark, provides a simple contrast that can be used to verify and demonstrate the performance improvement of deep reinforcement learning algorithms over scenarios with no intelligence. It makes decisions by randomly selecting actions without any prior knowledge or intelligent decision-making algorithms. Specifically, the optimization variables, including the UAV path, the transmitted power of UAVs and IoT devices, and transmission allocation indicators, are randomly selected in their allowable range. For example, the moving distances of the UAVs are selected between the minimum and the maximum flight range in the x-axis, y-axis, and z-axis. The same strategy is also suitable for the other two variables. In Figure 10, the random strategy performs worse than the proposed DRL algorithms in terms of convergence value and efficiency.
The two-dimensional and three-dimensional illustrations of the UAV path obtained using the SAC algorithm in the multi-UAV scenario are depicted in Figure 11a and Figure 11b, respectively. It can be concluded from Figure 11 that the three UAVs each fly in circles within their respective areas to provide dual functions for the IoT devices and sensing targets. Their trajectories have little overlap, and they manage almost entirely different regions, which allows the UAVs to collect IoT data and perform sensing tasks in a timely manner. In the same time slot, the three UAVs tend to be dispersed to provide wider coverage. In addition, the UAVs not only collect data over the IoT devices but also perform sensing over the sensing targets.

4.3. Individual Communication and Sensing Functions for Data Collection

We consider two methods of information collection: one involves the collection of data from IoT devices via uplink communication, and the other involves receiving echo data through the transmission of radar pulses. Each of these collection methods corresponds to a different performance metric (i.e., the data freshness indicator and the detection freshness indicator), both of which are part of the optimization objectives. Then, we may consider three modes:
  • Data collection with joint communication and sensing functions: The objective function is defined as
    O = D F L , P C , P S , A + S F L , P C , P S , A ,
    where D F represents the data freshness indicator, measuring communication performance, and S F represents the detection freshness indicator, measuring sensing performance.
  • Data collection with only the communication function: The objective function is defined as
    O = D F L , P C , P S , A .
  • Data collection with only the sensing function: The objective function is defined as
    O = S F L , P C , P S , A .
We verify the effectiveness of the first joint mode in Section 4.1 under the single-UAV scenario and in Section 4.2 under the multi-UAV scenario. Here, we verify the effectiveness of the data collection with a individual function (communication/sensing function). The time scheduling of a specific UAV in a time slot with an individual communication/sensing function is depicted in Figure 12.
Here, we verify the effectiveness of modes 2 and 3 under the single-UAV scenario in the larger-range area on account of the convergence speed and the geographical distinction between IoT devices and sensing targets. Similar conclusions can also be drawn in such a scenario. We also adopt the SAC algorithm for this validation in consideration of the quality of results. Similar conclusions can also be drawn for other proposed DRL algorithms. To boost the convergence, we take b = 0.5 for these two modes in the following experiments.
To compare the two individual function modes 2 and 3, we depict the UAV paths of these two modes in Figure 13 (communication only in Figure 13a and sensing only in Figure 13b). We can conclude from Figure 13a that the UAV flies solely above the IoT devices (blue solid diamonds) to provide uplink communication for data collection without approaching the sensing targets (green solid squares) to perform sensing functions. We can conclude from Figure 13b that the UAV flies exclusively over the sensing targets to transmit radar pulses and receive echo signals, without getting close to the IoT devices to provide uplink communication capabilities. Additionally, for communication-only or sensing-only tasks, the UAV hovers above the IoT devices or sensing targets to ensure fairness among them. Moreover, the UAV flies over each IoT device/sensing target as much as possible to provide broad coverage for individual functions.
To further quantitatively analyze this comparison, we depict the data freshness indicator for communication and the detection freshness indicator for sensing versus episodes of mode 2 and mode 3 in Figure 14a and Figure 14b, respectively. It can be concluded from Figure 14a that as the number of episodes increases, the data freshness indicator gradually decreases (indicating improved communication performance) and then converges; however, the detection freshness indicator (representing sensing performance) changes little, or even increases slightly (indicating a slight deterioration in sensing performance). This is because the optimization objective is only the communication performance rather than the sensing performance. Moreover, the initial position of the UAV may achieve relatively good sensing performance, but as the optimizer iterates, it tends to provide better communication performance at the slight expense of sensing performance. It can be concluded from Figure 14b that as the number of episodes increases, the detection freshness indicator gradually decreases (indicating improved sensing performance) and then converges, while the data freshness indicator remains almost unchanged (indicating stable communication performance). This is because the optimization tends to enhance sensing performance rather than the communication performance, which is in accordance with our expectations.

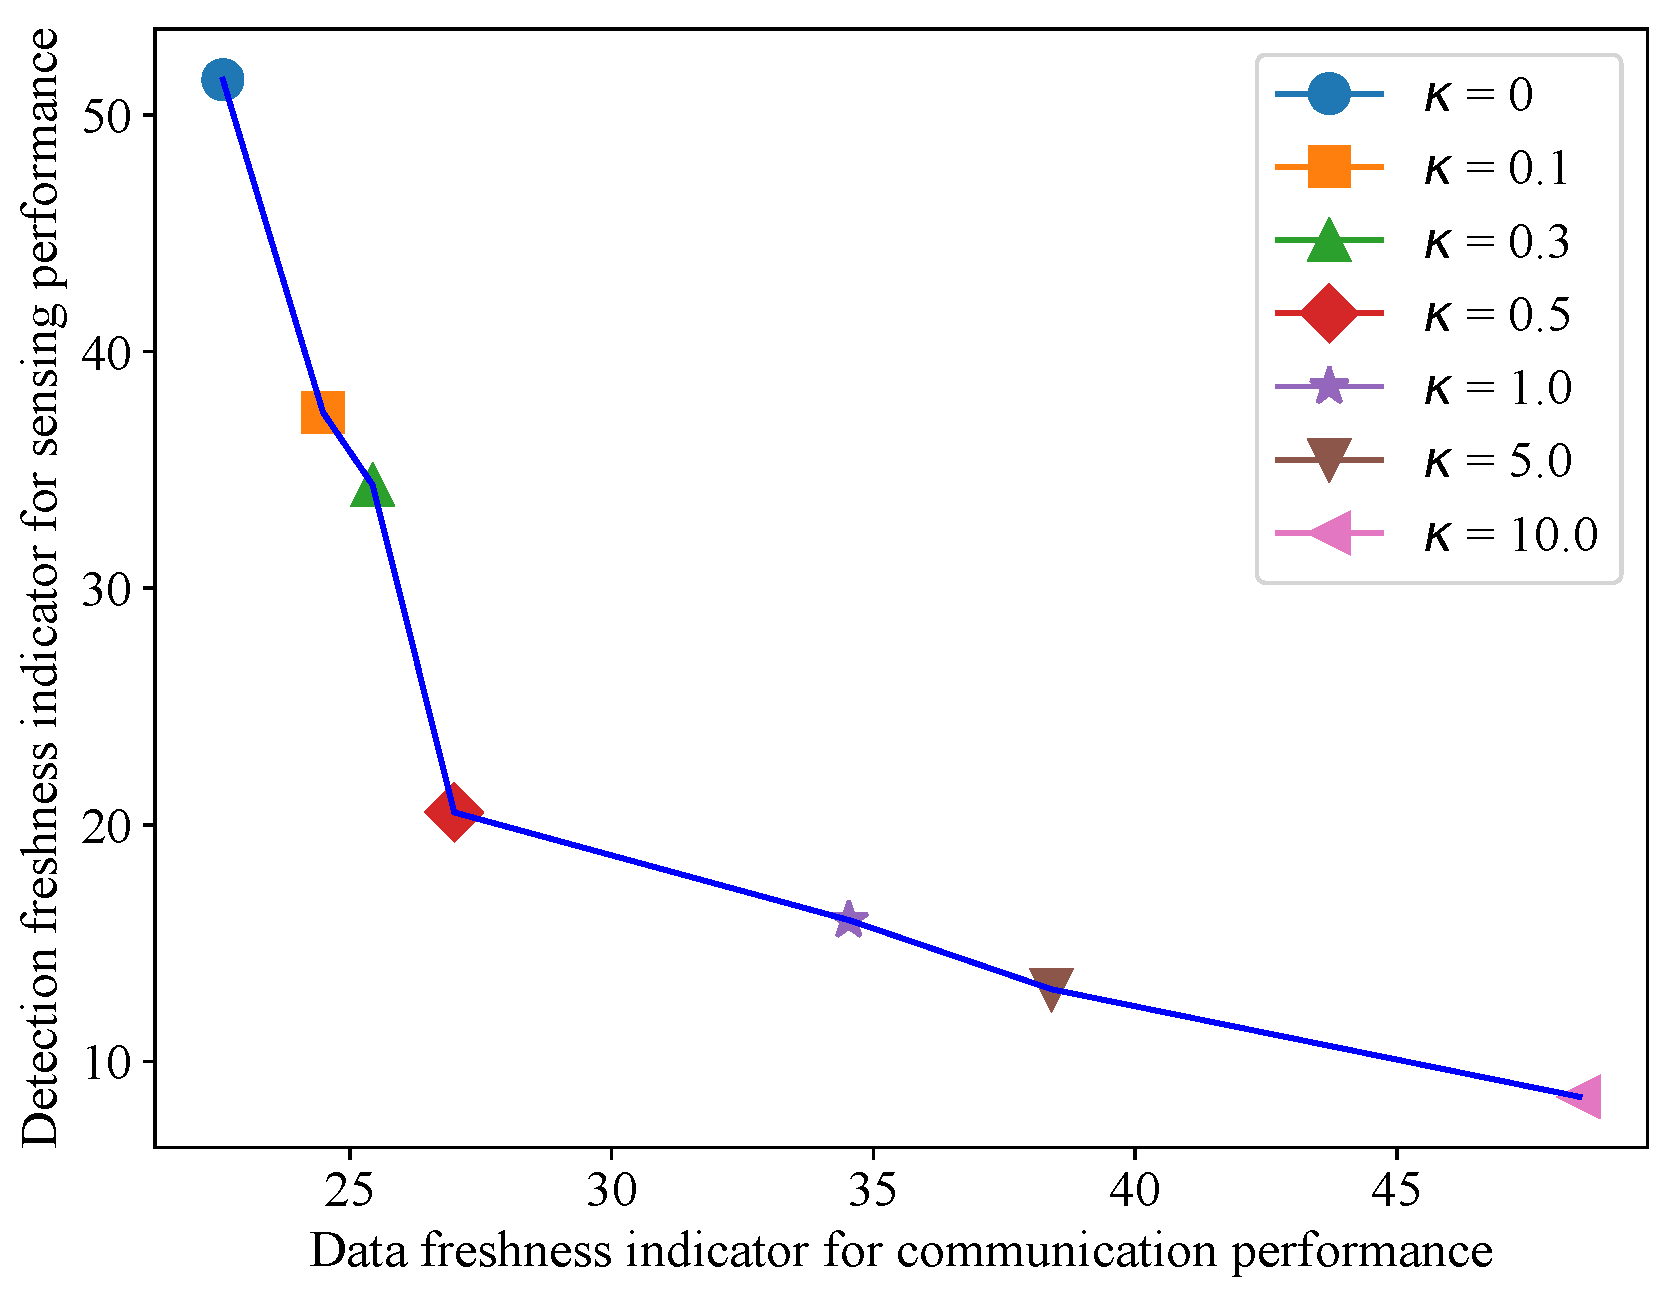
4.4. Trade-Off Between Communication and Sensing Performance

There exists an inherent trade-off between the communication and sensing functionalities in the ISAC system, and researchers have widely explored it. A well-known trade-off in the ISAC system is the deterministic-random trade-off [28,41,42], where a competitive relationship between communication and sensing performance exists. This illustrates that communication signals are generally better when they are more random, as this attempts to approach the Shannon theoretical limit; however, sensing signals are usually better when they are more deterministic, as this helps in the accurate extraction of channel information. Therefore, the optimal waveforms for communication and sensing are different. If the limited resources are allocated more toward communication, then the system tends to optimize communication performance; conversely, it tends to achieve better sensing performance. Generally speaking, when communication users and sensing targets are not the same, there is usually a competitive relationship between communication and sensing. Different communication-sensing performance pairs can be achieved by adjusting their relative importance, ultimately forming a Pareto front between communication and sensing.
To balance the trade-off between communication and sensing, we redefine the optimization problem (11) into the following form:
min L , P C , P S , A D F L , P C , P S , A + κ S F L , P C , P S , A
s . t . C 1 C 8 .
where the newly introduced parameter κ [ 0 , + ) integrated with the sensing performance term is the importance parameter that reflects how important the sensing is compared with the communication requirements. If κ is larger, then sensing performance becomes more important; conversely, communication performance becomes more important. Then, by selecting different values of κ , it is possible to obtain various communication-sensing performance pairs, which are exactly the points on the Pareto front. The communication–sensing performance pairs on the Pareto front are all dominated where they are not worse than another solution in the two objectives (i.e., the data freshness indicator for communication and the detection freshness indicator for sensing), and they are better than another solution in at least one objective. A better solution means at least an improvement in communication or sensing performance. It is worth noting that the obtained Pareto front is not its exact solution, and it is merely an approximate Pareto front due to the adoption of numerical methods (although all numerical methods are approximate solutions, such as meta-heuristic algorithms, gradient methods, learning approaches, convex approximation methods, etc.).
The illustration of the Pareto front between communication and sensing performance after 10,000 episodes by SAC is depicted in Figure 15. In Figure 15, the x-axis represents communication performance, while the y-axis represents sensing performance. Both communication and sensing performance are better when they are higher, so the nearer the Pareto front is to the upper right corner, the better. It is worth noting that the Pareto front slightly fluctuates. If more settings of κ are simulated or more Monte Carlo experiments for a specific setting are conducted, the Pareto front will become smoother and closer to the true analytical Pareto front.
To further explore the relationship between communication and sensing, we can conclude from Figure 15 that as κ increases, the detection freshness indicator increases, while the data freshness indicator decreases, which is in accordance with our expectation. A larger κ indicates better sensing performance and leads to a larger detection freshness indicator value.
To further quantitatively analyze the trade-off between these two functions, the values of κ and its corresponding data/detection freshness indicator values are listed in Table 2. We can conclude from Table 2 that as the value of κ increases, the data freshness indicator also increases, while the detection freshness indicator decreases, which is consistent with the results in Figure 15. Also, when κ = 1 , the converged data freshness indicator is 34.53 and the converged detection freshness indicator is 15.98.
Above all, the proposed algorithms are valid for diverse data collection optimization in both single-UAV and multi-UAV scenarios. In addition, they are applicable for data collection with either solely communication or sensing functions, or with both functions jointly.

5. Conclusions

We establish a UAV-enabled diverse data collection framework where the uplink communication from IoT devices to UAVs and the sensing from UAVs to sensing targets are simultaneously considered. We utilize three state-of-the-art DRL algorithms, namely TD3, SAC, and PPO, to minimize the summation of the data freshness indicator and the detection freshness indicator, and the optimal UAV paths, the optimal transmitted power of UAVs and IoT devices, and the optimal transmission allocation indicators can be obtained. Experiments are conducted in both the single-UAV and multi-UAV scenarios. The objective functions gradually converge with the increase in the episode number, which proves the effectiveness. Additionally, the optimal UAV paths are provided to further verify the effectiveness. In addition, we adopt the random strategy as the benchmark, and the results demonstrate that our method outperforms the benchmark. Moreover, the data collection modes with only communication/sensing functions are both valid with reasonable UAV paths and objective function values. Furthermore, the numerical Pareto front that reflects the inherent trade-offs between communication and sensing can be obtained.

Author Contributions

Conceptualization, Y.L. and B.H.; formal analysis, Y.L., B.H. and W.H.; investigation, Y.L. and B.H.; methodology, Y.L., X.L. and W.H.; software, Y.L., X.L., B.H., M.G. and W.H.; supervision, W.H.; validation, Y.L., X.L., M.G., B.H. and W.H.; visualization, Y.L., X.L., M.G. and W.H.; writing, original draft, Y.L.; writing, review and editing, Y.L. and W.H. All authors have read and agreed to the published version of the manuscript.

Funding

This research was funded by the National Natural Science Foundation of China (62301028, U21A20456), the Guangdong Basic and Applied Basic Research Foundation (2022A1515110053), the Young Scientists Fund of the National Natural Science Foundation of China (62306030), and the General Funding Projects of China Postdoctoral Science Foundation (2023M730218).

Data Availability Statement

No new data were created.

Conflicts of Interest

The authors declare no conflicts of interest.

References

  1. Wei, X.; Guo, H.; Wang, X.; Wang, X.; Qiu, M. Reliable data collection techniques in underwater wireless sensor networks: A survey. IEEE Commun. Surv. Tutor. 2022, 24, 404–431. [Google Scholar] [CrossRef]
  2. Simonofski, A.; Handekyn, P.; Vandennieuwenborg, C.; Wautelet, Y.; Snoeck, M. Smart mobility projects: Towards the formalization of a policy-making lifecycle. Land Use Policy 2023, 125, 106474. [Google Scholar] [CrossRef]
  3. Cao, L. AI and data science for smart emergency, crisis and disaster resilience. Int. J. Data Sci. Anal. 2023, 15, 231–246. [Google Scholar] [CrossRef]
  4. Chen, X.; Zhao, N.; Chang, Z.; Hämäläinen, T.; Wang, X. UAV-aided secure short-packet data collection and transmission. IEEE Trans. Commun. 2023, 71, 2475–2486. [Google Scholar] [CrossRef]
  5. Ma, T.; Zhou, H.; Qian, B.; Cheng, N.; Shen, X.; Chen, X.; Bai, B. UAV-LEO integrated backbone: A ubiquitous data collection approach for B5G internet of remote things networks. IEEE J. Sel. Areas Commun. 2021, 39, 3491–3505. [Google Scholar] [CrossRef]
  6. Wei, Z.; Zhu, M.; Zhang, N.; Wang, L.; Zou, Y.; Meng, Z.; Wu, H.; Feng, Z. UAV-assisted data collection for Internet of Things: A survey. IEEE Internet Things J. 2022, 9, 15460–15483. [Google Scholar] [CrossRef]
  7. Liu, J.; Tong, P.; Wang, X.; Bai, B.; Dai, H. UAV-aided data collection for information freshness in wireless sensor networks. IEEE Trans. Wirel. Commun. 2021, 20, 2368–2382. [Google Scholar] [CrossRef]
  8. Liu, Y.; Huangfu, W.; Zhou, H.; Zhang, H.; Liu, J.; Long, K. Fair and energy-efficient coverage optimization for UAV placement problem in the cellular network. IEEE Trans. Commun. 2022, 70, 4222–4235. [Google Scholar] [CrossRef]
  9. Jia, Z.; Sheng, M.; Li, J.; Niyato, D.; Han, Z. LEO-satellite-assisted UAV: Joint trajectory and data collection for internet of remote things in 6G aerial access networks. IEEE Internet Things J. 2021, 8, 9814–9826. [Google Scholar] [CrossRef]
  10. Zhang, S.; Zhang, S.; Yeung, L.K.; James, J. Urban internet of electric vehicle parking system for vehicle-to-grid scheduling: Formulation and distributed algorithm. IEEE Trans. Veh. Technol. 2023, 73, 67–79. [Google Scholar] [CrossRef]
  11. Zhang, S.; Zhang, S.; Yuan, W.; Li, Y.; Hanzo, L. Efficient rate-splitting multiple access for the Internet of Vehicles: Federated edge learning and latency minimization. IEEE J. Sel. Areas Commun. 2023, 41, 1468–1483. [Google Scholar] [CrossRef]
  12. Abu-Baker, A.; Shakhatreh, H.; Sawalmeh, A.; Alenezi, A.H. Efficient Data Collection in UAV-Assisted Cluster-Based Wireless Sensor Networks for 3D Environment: Optimization Study. J. Sens. 2023, 2023, 9513868. [Google Scholar] [CrossRef]
  13. Alawad, W.; Halima, N.B.; Aziz, L. An unmanned aerial vehicle (UAV) system for disaster and crisis management in smart cities. Electronics 2023, 12, 1051. [Google Scholar] [CrossRef]
  14. Zhang, H.; Feng, L.; Liu, X.; Long, K.; Karagiannidis, G.K. User scheduling and task offloading in multi-tier computing 6G vehicular network. IEEE J. Sel. Areas Commun. 2022, 41, 446–456. [Google Scholar] [CrossRef]
  15. Ning, Z.; Hu, H.; Wang, X.; Guo, L.; Guo, S.; Wang, G.; Gao, X. Mobile edge computing and machine learning in the internet of unmanned aerial vehicles: A survey. ACM Comput. Surv. 2023, 56, 1–31. [Google Scholar] [CrossRef]
  16. Zhang, H.; Xi, S.; Jiang, H.; Shen, Q.; Shang, B.; Wang, J. Resource allocation and offloading strategy for UAV-assisted LEO satellite edge computing. Drones 2023, 7, 383. [Google Scholar] [CrossRef]
  17. Zhang, H.; Huang, M.; Zhou, H.; Wang, X.; Wang, N.; Long, K. Capacity maximization in RIS-UAV networks: A DDQN-based trajectory and phase shift optimization approach. IEEE Trans. Wirel. Commun. 2022, 22, 2583–2591. [Google Scholar] [CrossRef]
  18. Liu, Y.; Wang, Q.; Dai, H.N.; Fu, Y.; Zhang, N.; Lee, C.C. UAV-assisted wireless backhaul networks: Connectivity analysis of uplink transmissions. IEEE Trans. Veh. Technol. 2023, 72, 12195–12207. [Google Scholar] [CrossRef]
  19. Zhang, H.; Ma, X.; Liu, X.; Li, L.; Sun, K. GNN-Based Power Allocation and User Association in Digital Twin Network for the Terahertz Band. IEEE J. Sel. Areas Commun. 2023, 41, 3111–3121. [Google Scholar] [CrossRef]
  20. Hellaoui, H.; Bagaa, M.; Chelli, A.; Taleb, T.; Yang, B. On supporting multiservices in UAV-enabled aerial communication for Internet of Things. IEEE Internet Things J. 2023, 10, 13754–13768. [Google Scholar] [CrossRef]
  21. Nabil, Y.; ElSawy, H.; Al-Dharrab, S.; Attia, H.; Mostafa, H. Ultra-reliable device-centric uplink communications in airborne networks: A spatiotemporal analysis. IEEE Trans. Veh. Technol. 2023, 72, 9484–9499. [Google Scholar] [CrossRef]
  22. Feng, J.; Liu, X.; Liu, Z.; Durrani, T.S. Optimal Trajectory and Resource Allocation for RSMA-UAV Assisted IoT Communications. IEEE Trans. Veh. Technol. 2024, 73, 8693–8704. [Google Scholar] [CrossRef]
  23. Cai, X.; Kovács, I.Z.; Wigard, J.; Amorim, R.; Tufvesson, F.; Mogensen, P.E. Power Allocation for Uplink Communications of Massive Cellular-Connected UAVs. IEEE Trans. Veh. Technol. 2023, 72, 8797–8811. [Google Scholar] [CrossRef]
  24. Chen, R.; Cheng, W.; Ding, Y.; Wang, B. QoS-guaranteed multi-UAV coverage scheme for IoT communications with interference management. IEEE Internet Things J. 2023, 11, 4116–4126. [Google Scholar] [CrossRef]
  25. Duan, R.; Wang, J.; Jiang, C.; Yao, H.; Ren, Y.; Qian, Y. Resource allocation for multi-UAV aided IoT NOMA uplink transmission systems. IEEE Internet Things J. 2019, 6, 7025–7037. [Google Scholar] [CrossRef]
  26. Eldeeb, E.; Shehab, M.; Alves, H. Traffic Learning and Proactive UAV Trajectory Planning for Data Uplink in Markovian IoT Models. IEEE Internet Things J. 2023, 11, 13496–13508. [Google Scholar] [CrossRef]
  27. Yin, Z.; Cheng, N.; Song, Y.; Hui, Y.; Li, Y.; Luan, T.H.; Yu, S. UAV-assisted secure uplink communications in satellite-supported IoT: Secrecy fairness approach. IEEE Internet Things J. 2023, 11, 6904–6915. [Google Scholar] [CrossRef]
  28. Liu, F.; Cui, Y.; Masouros, C.; Xu, J.; Han, T.X.; Eldar, Y.C.; Buzzi, S. Integrated sensing and communications: Toward dual-functional wireless networks for 6G and beyond. IEEE J. Sel. Areas Commun. 2022, 40, 1728–1767. [Google Scholar] [CrossRef]
  29. Wang, D.; Wang, Z.; Yu, K.; Wei, Z.; Zhao, H.; Al-Dhahir, N.; Guizani, M.; Leung, V.C. Active aerial reconfigurable intelligent surface assisted secure communications: Integrating sensing and positioning. IEEE J. Sel. Areas Commun. 2024, 42, 2769–2785. [Google Scholar] [CrossRef]
  30. Liu, Y.; Huang, T.; Liu, F.; Ma, D.; Huangfu, W.; Eldar, Y.C. Next-Generation Multiple Access for Integrated Sensing and Communications. Proc. IEEE 2024. early access. [Google Scholar] [CrossRef]
  31. Zhang, H.; Zhang, Y.; Liu, X.; Ren, C.; Li, H.; Sun, C. Time allocation approaches for a perceptive mobile network using integration of sensing and communication. IEEE Trans. Wirel. Commun. 2023, 23, 1158–1169. [Google Scholar] [CrossRef]
  32. Zhang, H.; Su, R.; Zhu, Y.; Long, K.; Karagiannidis, G.K. User-centric cell-free massive MIMO system for indoor industrial networks. IEEE Trans. Commun. 2022, 70, 7644–7655. [Google Scholar] [CrossRef]
  33. Liu, X.; Huang, T.; Shlezinger, N.; Liu, Y.; Zhou, J.; Eldar, Y.C. Joint transmit beamforming for multiuser MIMO communications and MIMO radar. IEEE Trans. Signal Process. 2020, 68, 3929–3944. [Google Scholar] [CrossRef]
  34. Wang, D.; Wu, M.; Chakraborty, C.; Min, L.; He, Y.; Guduri, M. Covert communications in air-ground integrated urban sensing networks enhanced by federated learning. IEEE Sens. J. 2023, 24, 5636–5643. [Google Scholar] [CrossRef]
  35. Liu, P.; Fei, Z.; Wang, X.; Zhang, J.A.; Zheng, Z.; Zhang, Q. Securing multi-user uplink communications against mobile aerial eavesdropper via sensing. IEEE Trans. Veh. Technol. 2023, 72, 9608–9613. [Google Scholar] [CrossRef]
  36. Zhou, Y.; Liu, X.; Zhai, X.; Zhu, Q.; Durrani, T.S. UAV-Enabled Integrated Sensing, Computing and Communication for Internet of Things: Joint Resource Allocation and Trajectory Design. IEEE Internet Things J. 2023, 11, 12717–12727. [Google Scholar] [CrossRef]
  37. Zhu, W.; Han, Y.; Wang, L.; Xu, L.; Zhang, Y.; Fei, A. Pilot optimization for OFDM-based ISAC signal in emergency IoT networks. IEEE Internet Things J. 2023, 11, 29600–29614. [Google Scholar] [CrossRef]
  38. Liu, Z.; Liu, X.; Liu, Y.; Leung, V.C.; Durrani, T.S. UAV assisted integrated sensing and communications for Internet of Things: 3D trajectory optimization and resource allocation. IEEE Trans. Wirel. Commun. 2024, 23, 8654–8667. [Google Scholar] [CrossRef]
  39. Xu, J.; Zeng, Y.; Zhang, R. UAV-enabled multiuser wireless power transfer: Trajectory design and energy optimization. In Proceedings of the IEEE 23rd Asia-Pacific Conference on Communications (APCC), Perth, Australia, 11–13 December 2017; pp. 1–6. [Google Scholar] [CrossRef]
  40. Chiriyath, A.R.; Paul, B.; Jacyna, G.M.; Bliss, D.W. Inner bounds on performance of radar and communications co-existence. IEEE Trans. Signal Process. 2015, 64, 464–474. [Google Scholar] [CrossRef]
  41. Liu, F.; Xiong, Y.; Wan, K.; Han, T.X.; Caire, G. Deterministic-random tradeoff of integrated sensing and communications in Gaussian channels: A rate-distortion perspective. In Proceedings of the 2023 IEEE International Symposium on Information Theory (ISIT), Taipei, Taiwan, 25–30 June 2023; pp. 2326–2331. [Google Scholar] [CrossRef]
  42. Xiong, Y.; Liu, F.; Lops, M. Generalized deterministic-random tradeoff in integrated sensing and communications: The sensing-optimal operating point. arXiv 2023, arXiv:2308.14336. [Google Scholar]
Figure 1. Diverse data collection framework.
Drones 08 00647 g001
Figure 2. UAV-enabled diverse data collection scenario.
Drones 08 00647 g002
Figure 3. The illustration of the workflow diagram of the system.
Drones 08 00647 g003
Figure 4. The illustration of the time scheduling of a specific UAV.
Drones 08 00647 g004
Figure 5. The illustration of the DRL framework for solving MDP.
Drones 08 00647 g005
Figure 6. Initial locations of the UAV, IoT devices, and sensing targets in the single-UAV scenario. (a) Normal view. (b) Top view.
Drones 08 00647 g006
Figure 7. Algorithm convergence of TD3, SAC, and PPO in the single-UAV scenario. (a) Fitness function value. (b) Data freshness indicator for communication (Objective 1). (c) Detection freshness indicator for sensing (Objective 2).
Drones 08 00647 g007
Figure 8. UAV path according to the SAC algorithm after 10,000 episodes in the single-UAV scenario. (a) Two-dimensional path. (b) Three-dimensional path.
Drones 08 00647 g008
Figure 9. Initial locations of the UAVs, IoT devices, and sensing targets in the three-UAV scenario. (a) Normal view. (b) Top view.
Drones 08 00647 g009
Figure 10. Algorithm convergence of TD3, SAC, and PPO in the multi-UAV scenario. (a) Fitness function value. (b) Data freshness indicator for communication (Objective 1). (c) Detection freshness indicator for sensing (Objective 2).
Drones 08 00647 g010
Figure 11. UAV paths obtained using the SAC algorithm after 30,000 episodes in the multi-UAV scenario. (a) Two-dimensional path. (b) Three-dimensional path.
Drones 08 00647 g011
Figure 12. The illustration of time scheduling of a specific UAV in a time slot with an individual communication/sensing function. (a) Communication function. (b) Sensing function.
Drones 08 00647 g012
Figure 13. UAV paths obtained using the SAC algorithm after 10,000 episodes in two individual function modes. (a) Mode 2: Communication only. (b) Mode 3: Sensing only.
Drones 08 00647 g013
Figure 14. Data freshness indicator for communication and the detection freshness indicator for sensing versus episodes provided by the SAC algorithm. (a) Mode 2: Communication only. (b) Mode 3: Sensing only.
Drones 08 00647 g014
Figure 15. Pareto front between communication and sensing performance after 10,000 episodes in DRL.
Drones 08 00647 g015
Table 1. Settings of parameters.
VariableValueVariableValue
g C 5 dB G C 15 dB
λ C 0.1 m g S 15 dB
G S 15 dB λ S 0.35 m
σ rcs 1 m 2 k 1 / 50
b1.3 γ 0.98
τ 0.01 ξ 0.2
Table 2. Different values of κ and its corresponding data/detection freshness indicator values after 10,000 episodes in SAC.
κ Data Freshness IndicatorDetection Freshness Indicator
022.5851.49
0.124.4937.43
0.325.4434.36
0.526.9920.53
1.034.5315.98
5.038.4013.05
10.048.488.51
Disclaimer/Publisher’s Note: The statements, opinions and data contained in all publications are solely those of the individual author(s) and contributor(s) and not of MDPI and/or the editor(s). MDPI and/or the editor(s) disclaim responsibility for any injury to people or property resulting from any ideas, methods, instructions or products referred to in the content.

