


Quantifying Well Clear Thresholds for UAV in Conjunction with Trajectory Conformity


Abstract
1. Introduction
2. Literature Review
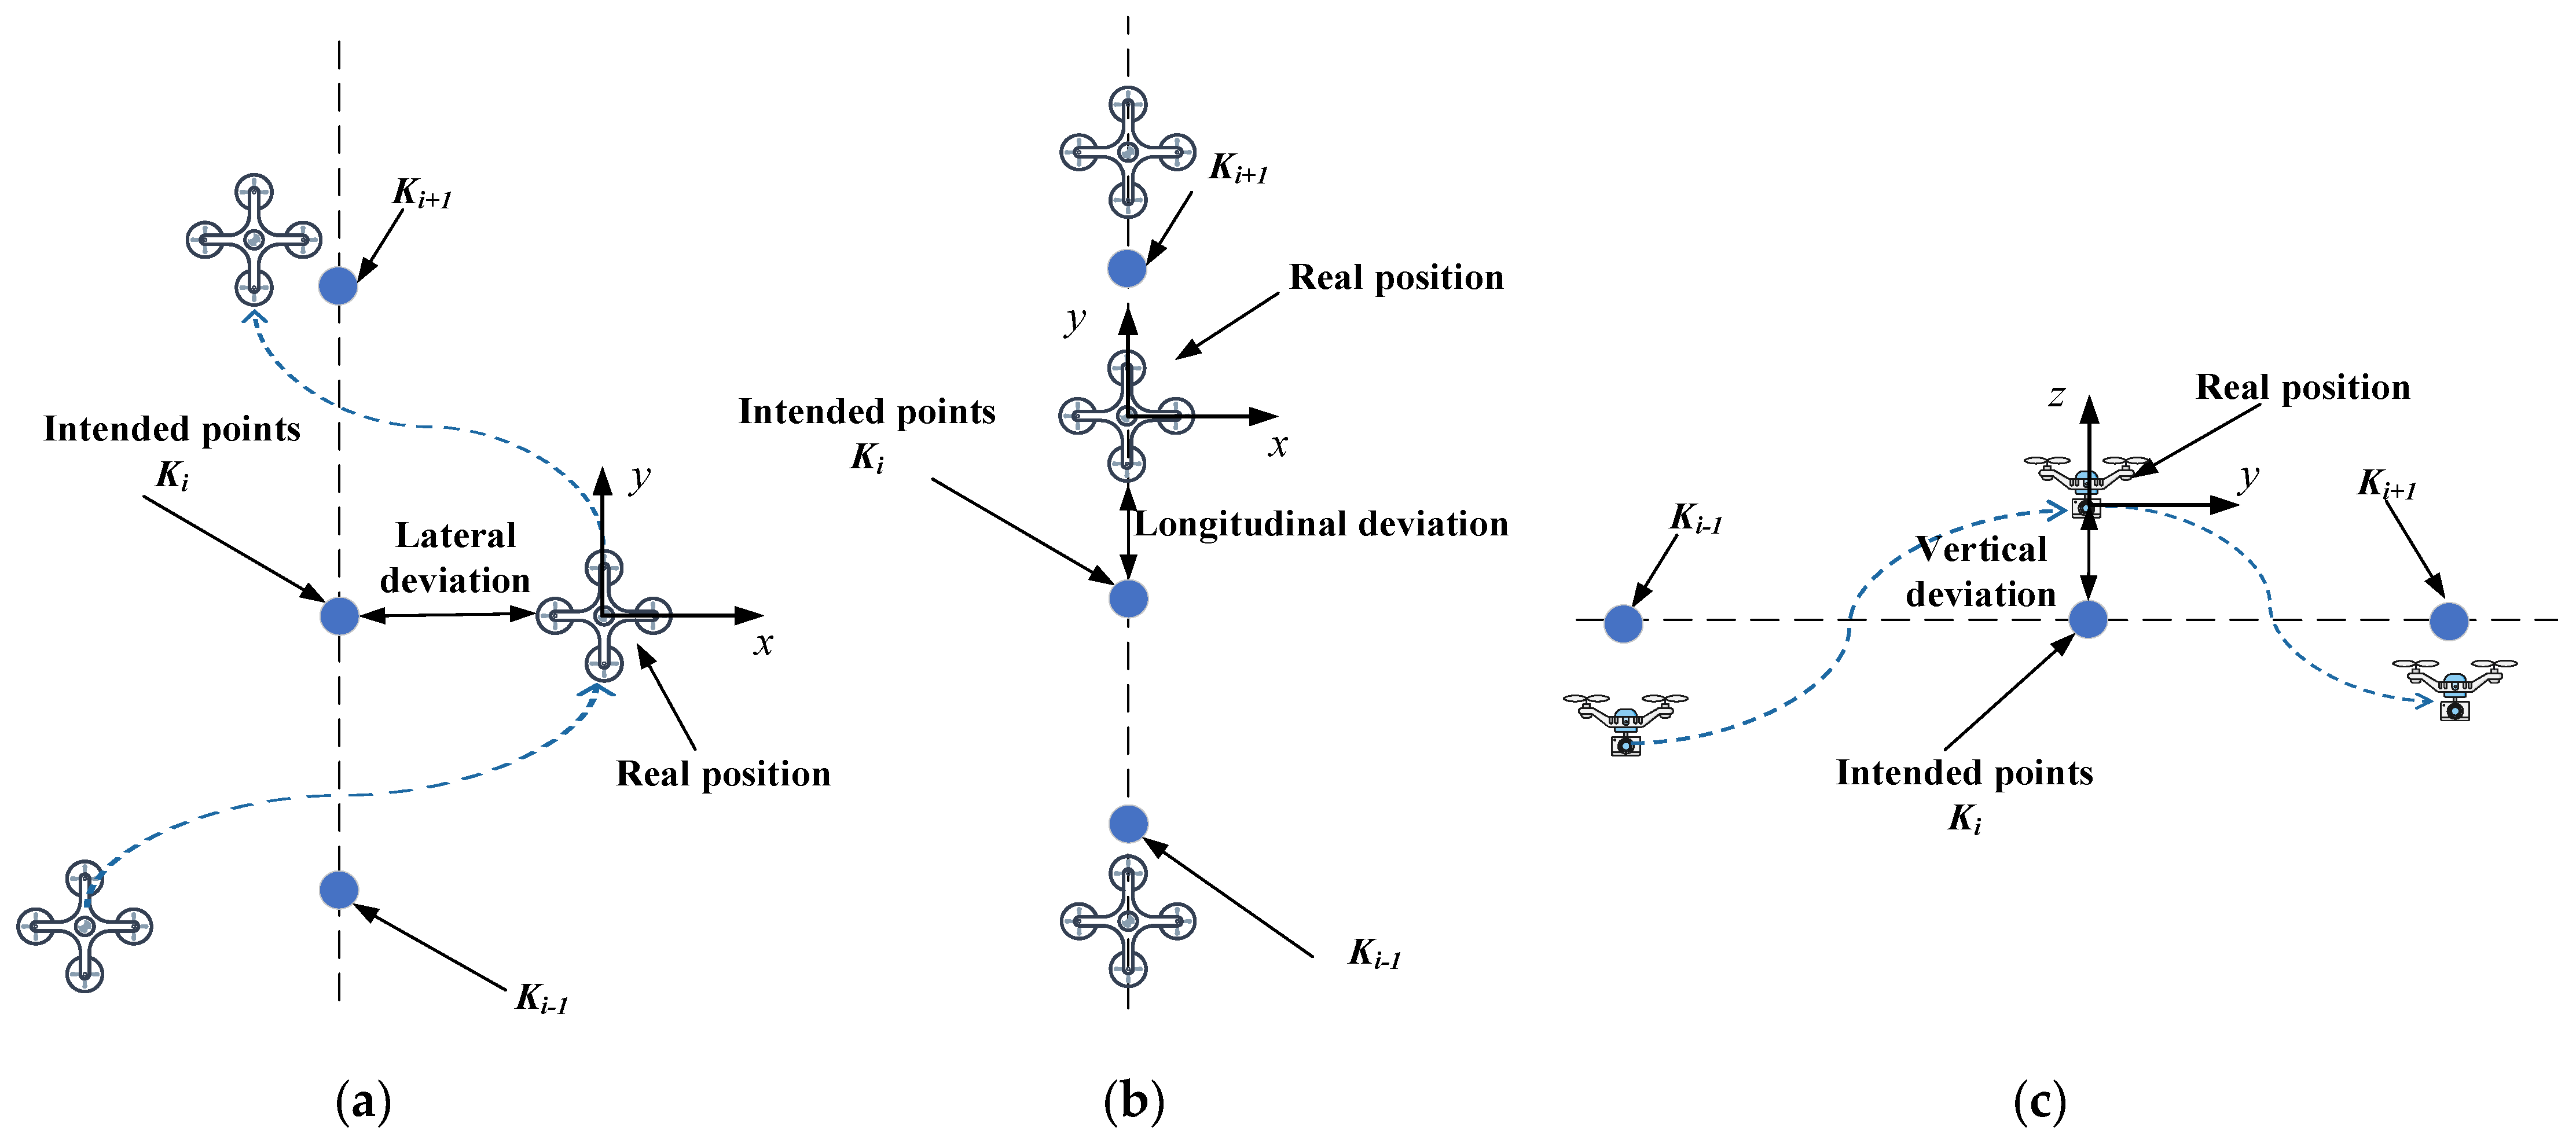
3. Trajectory Conformity
3.1. Definition
3.2. Data Acquisition and Analysis
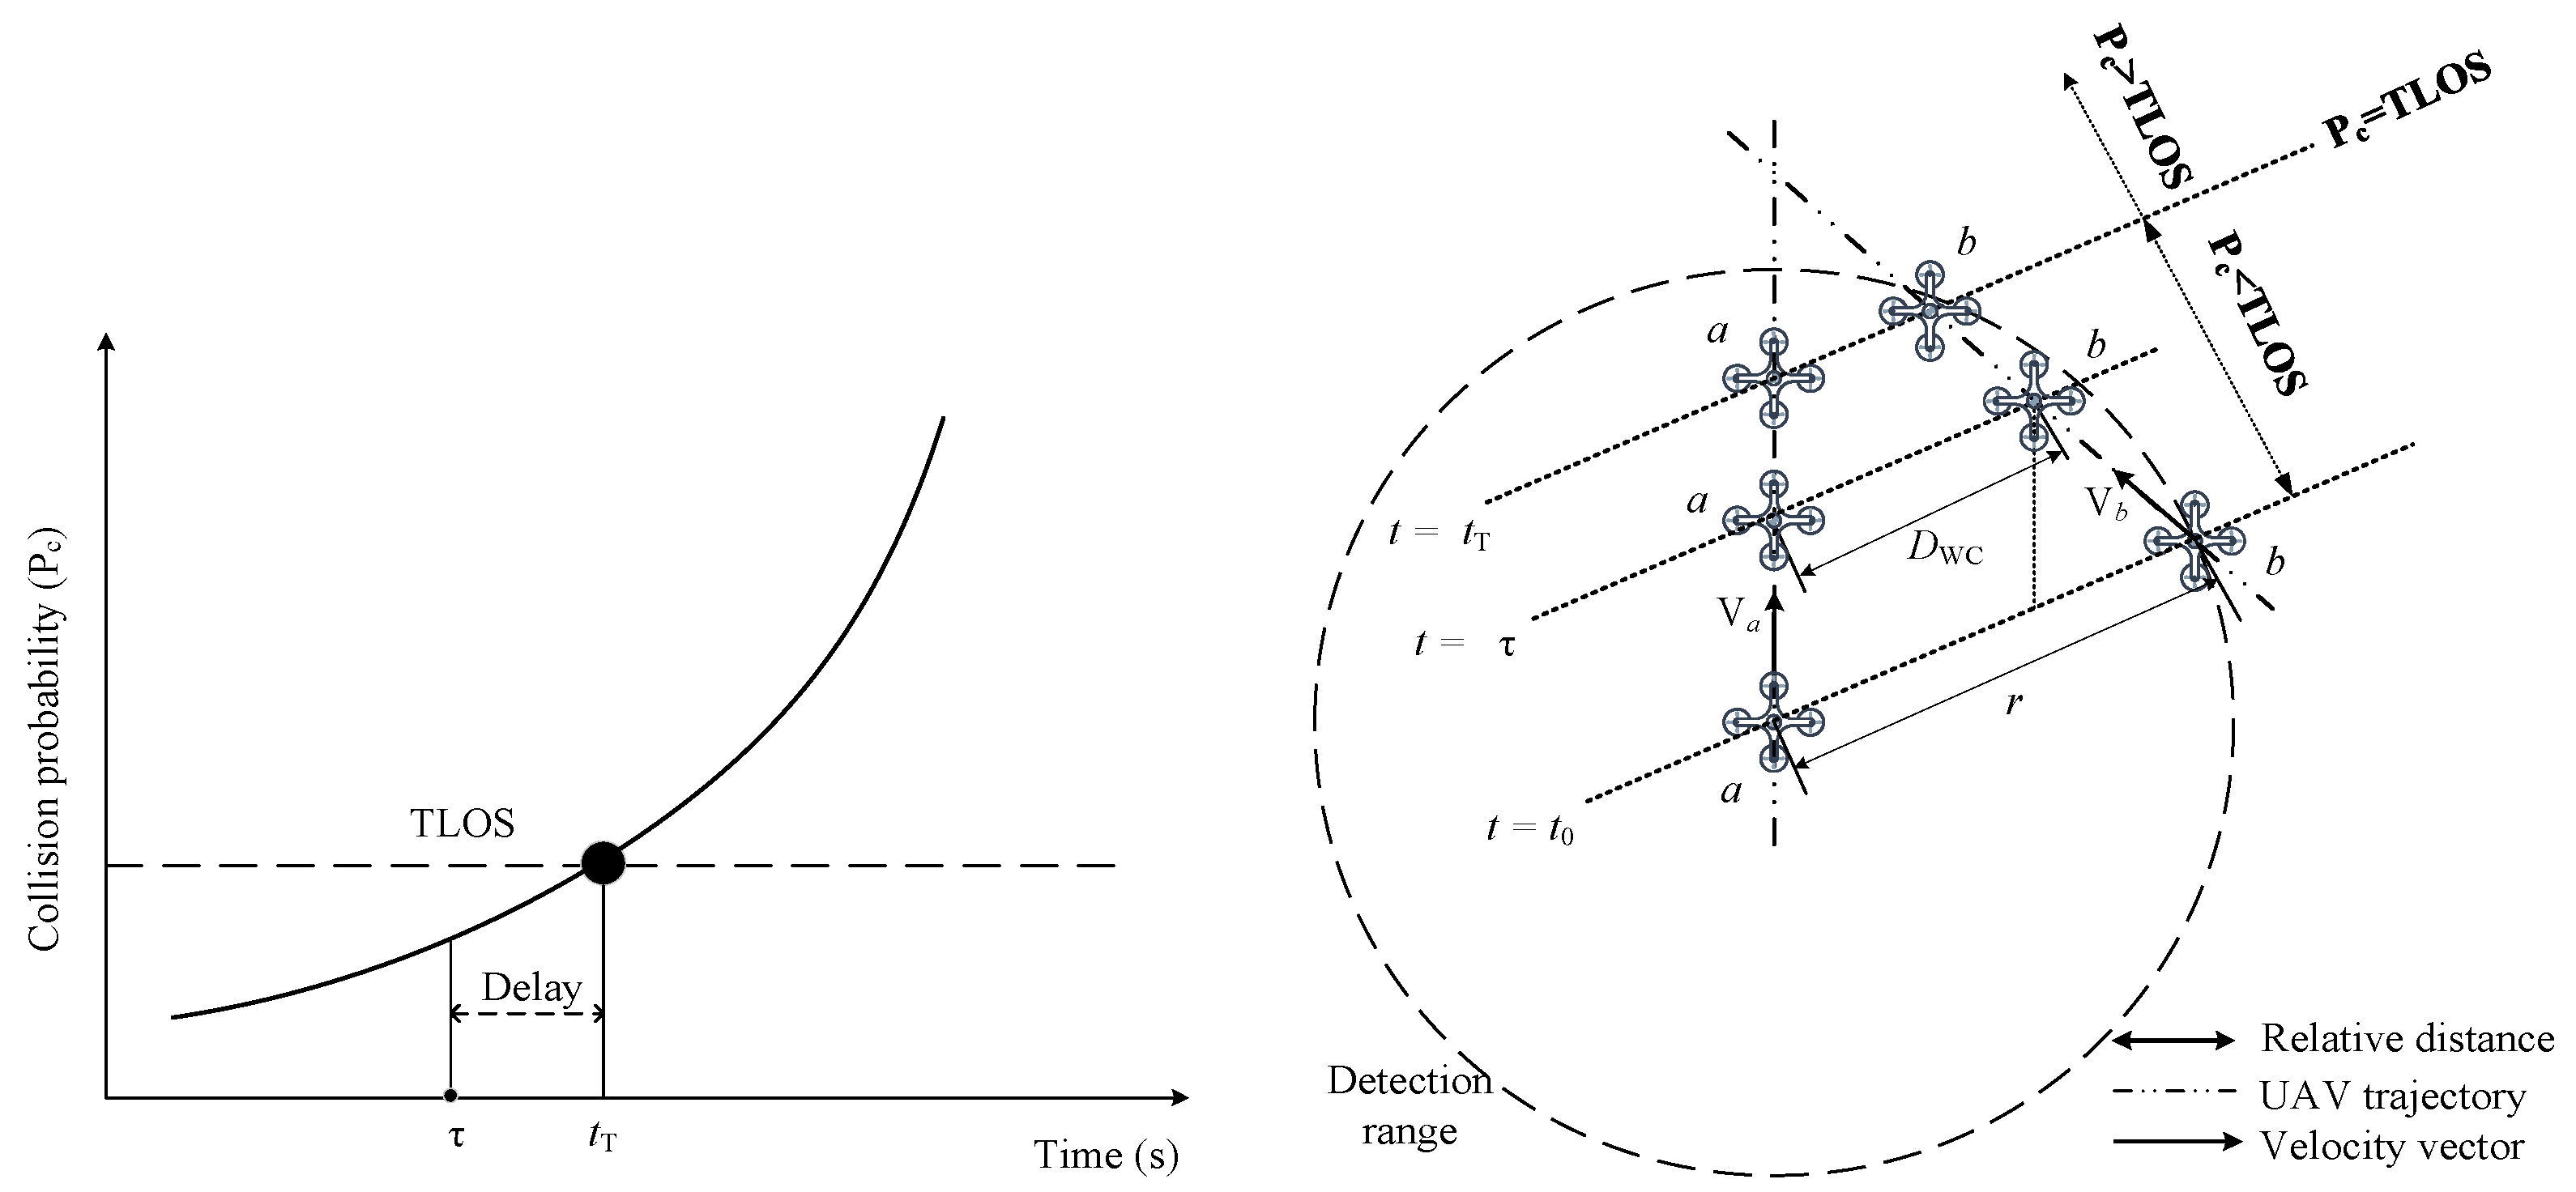
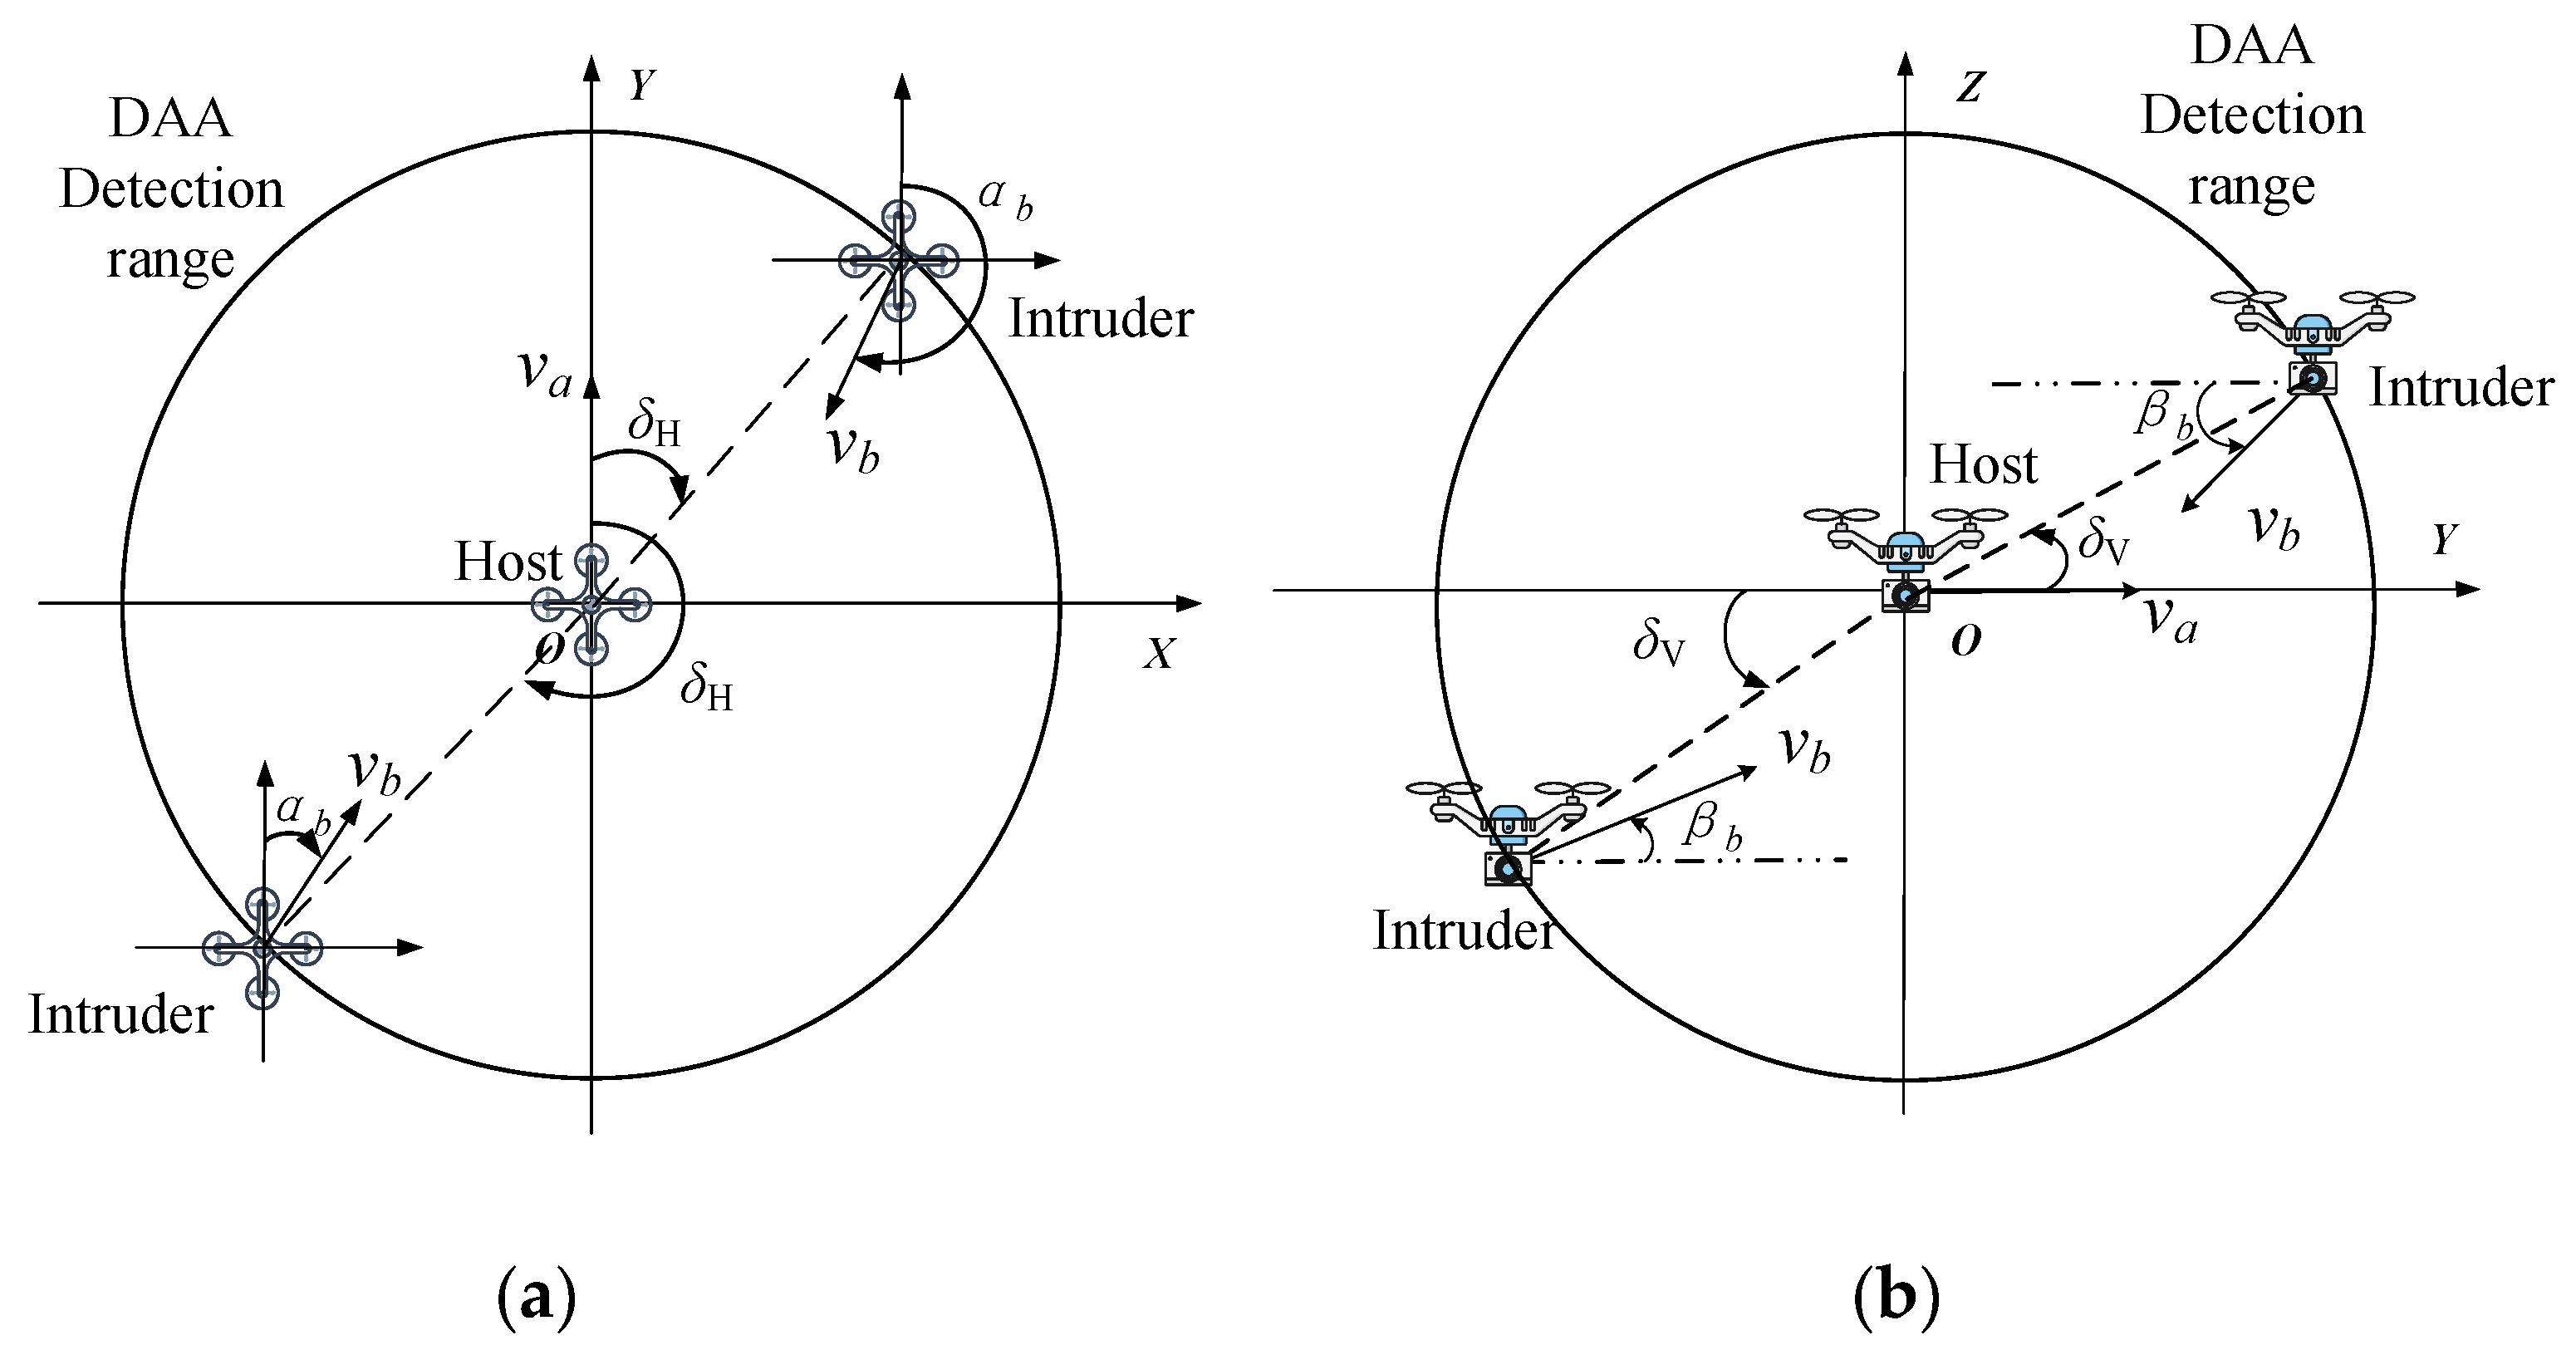
4. Collision Risk Assessment
5. Simulation and Results
5.1. Scenario Setting
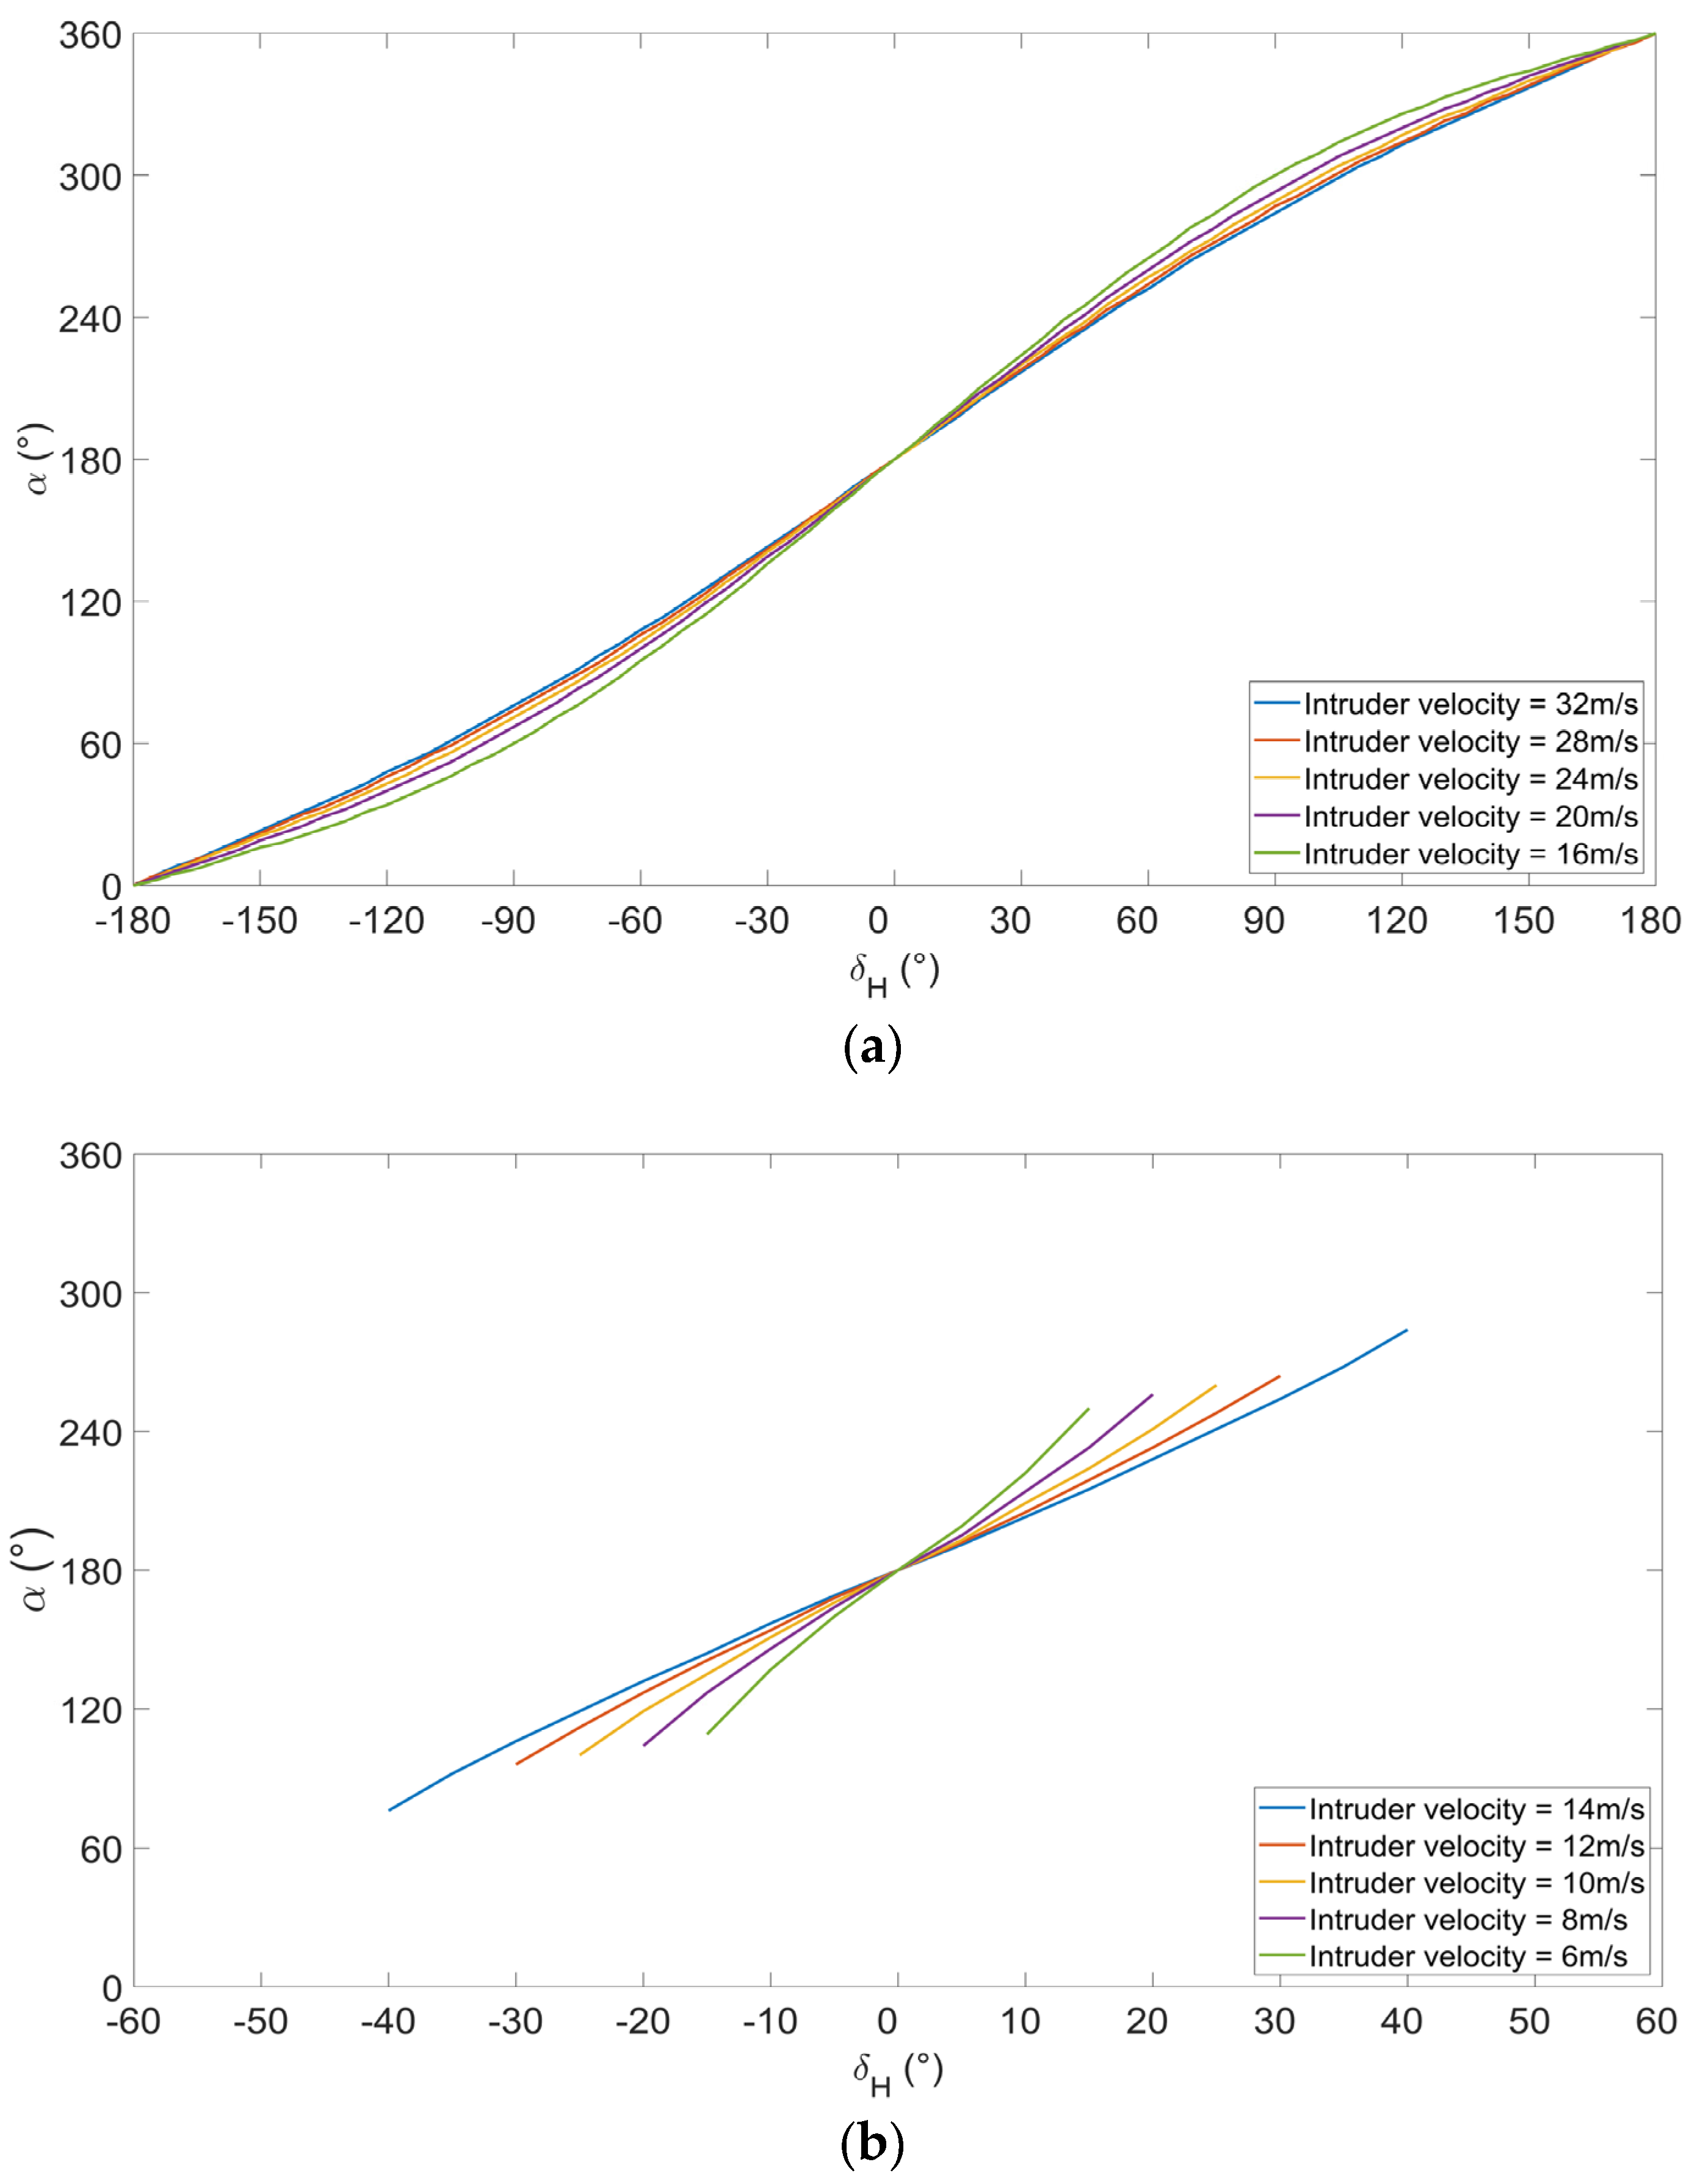
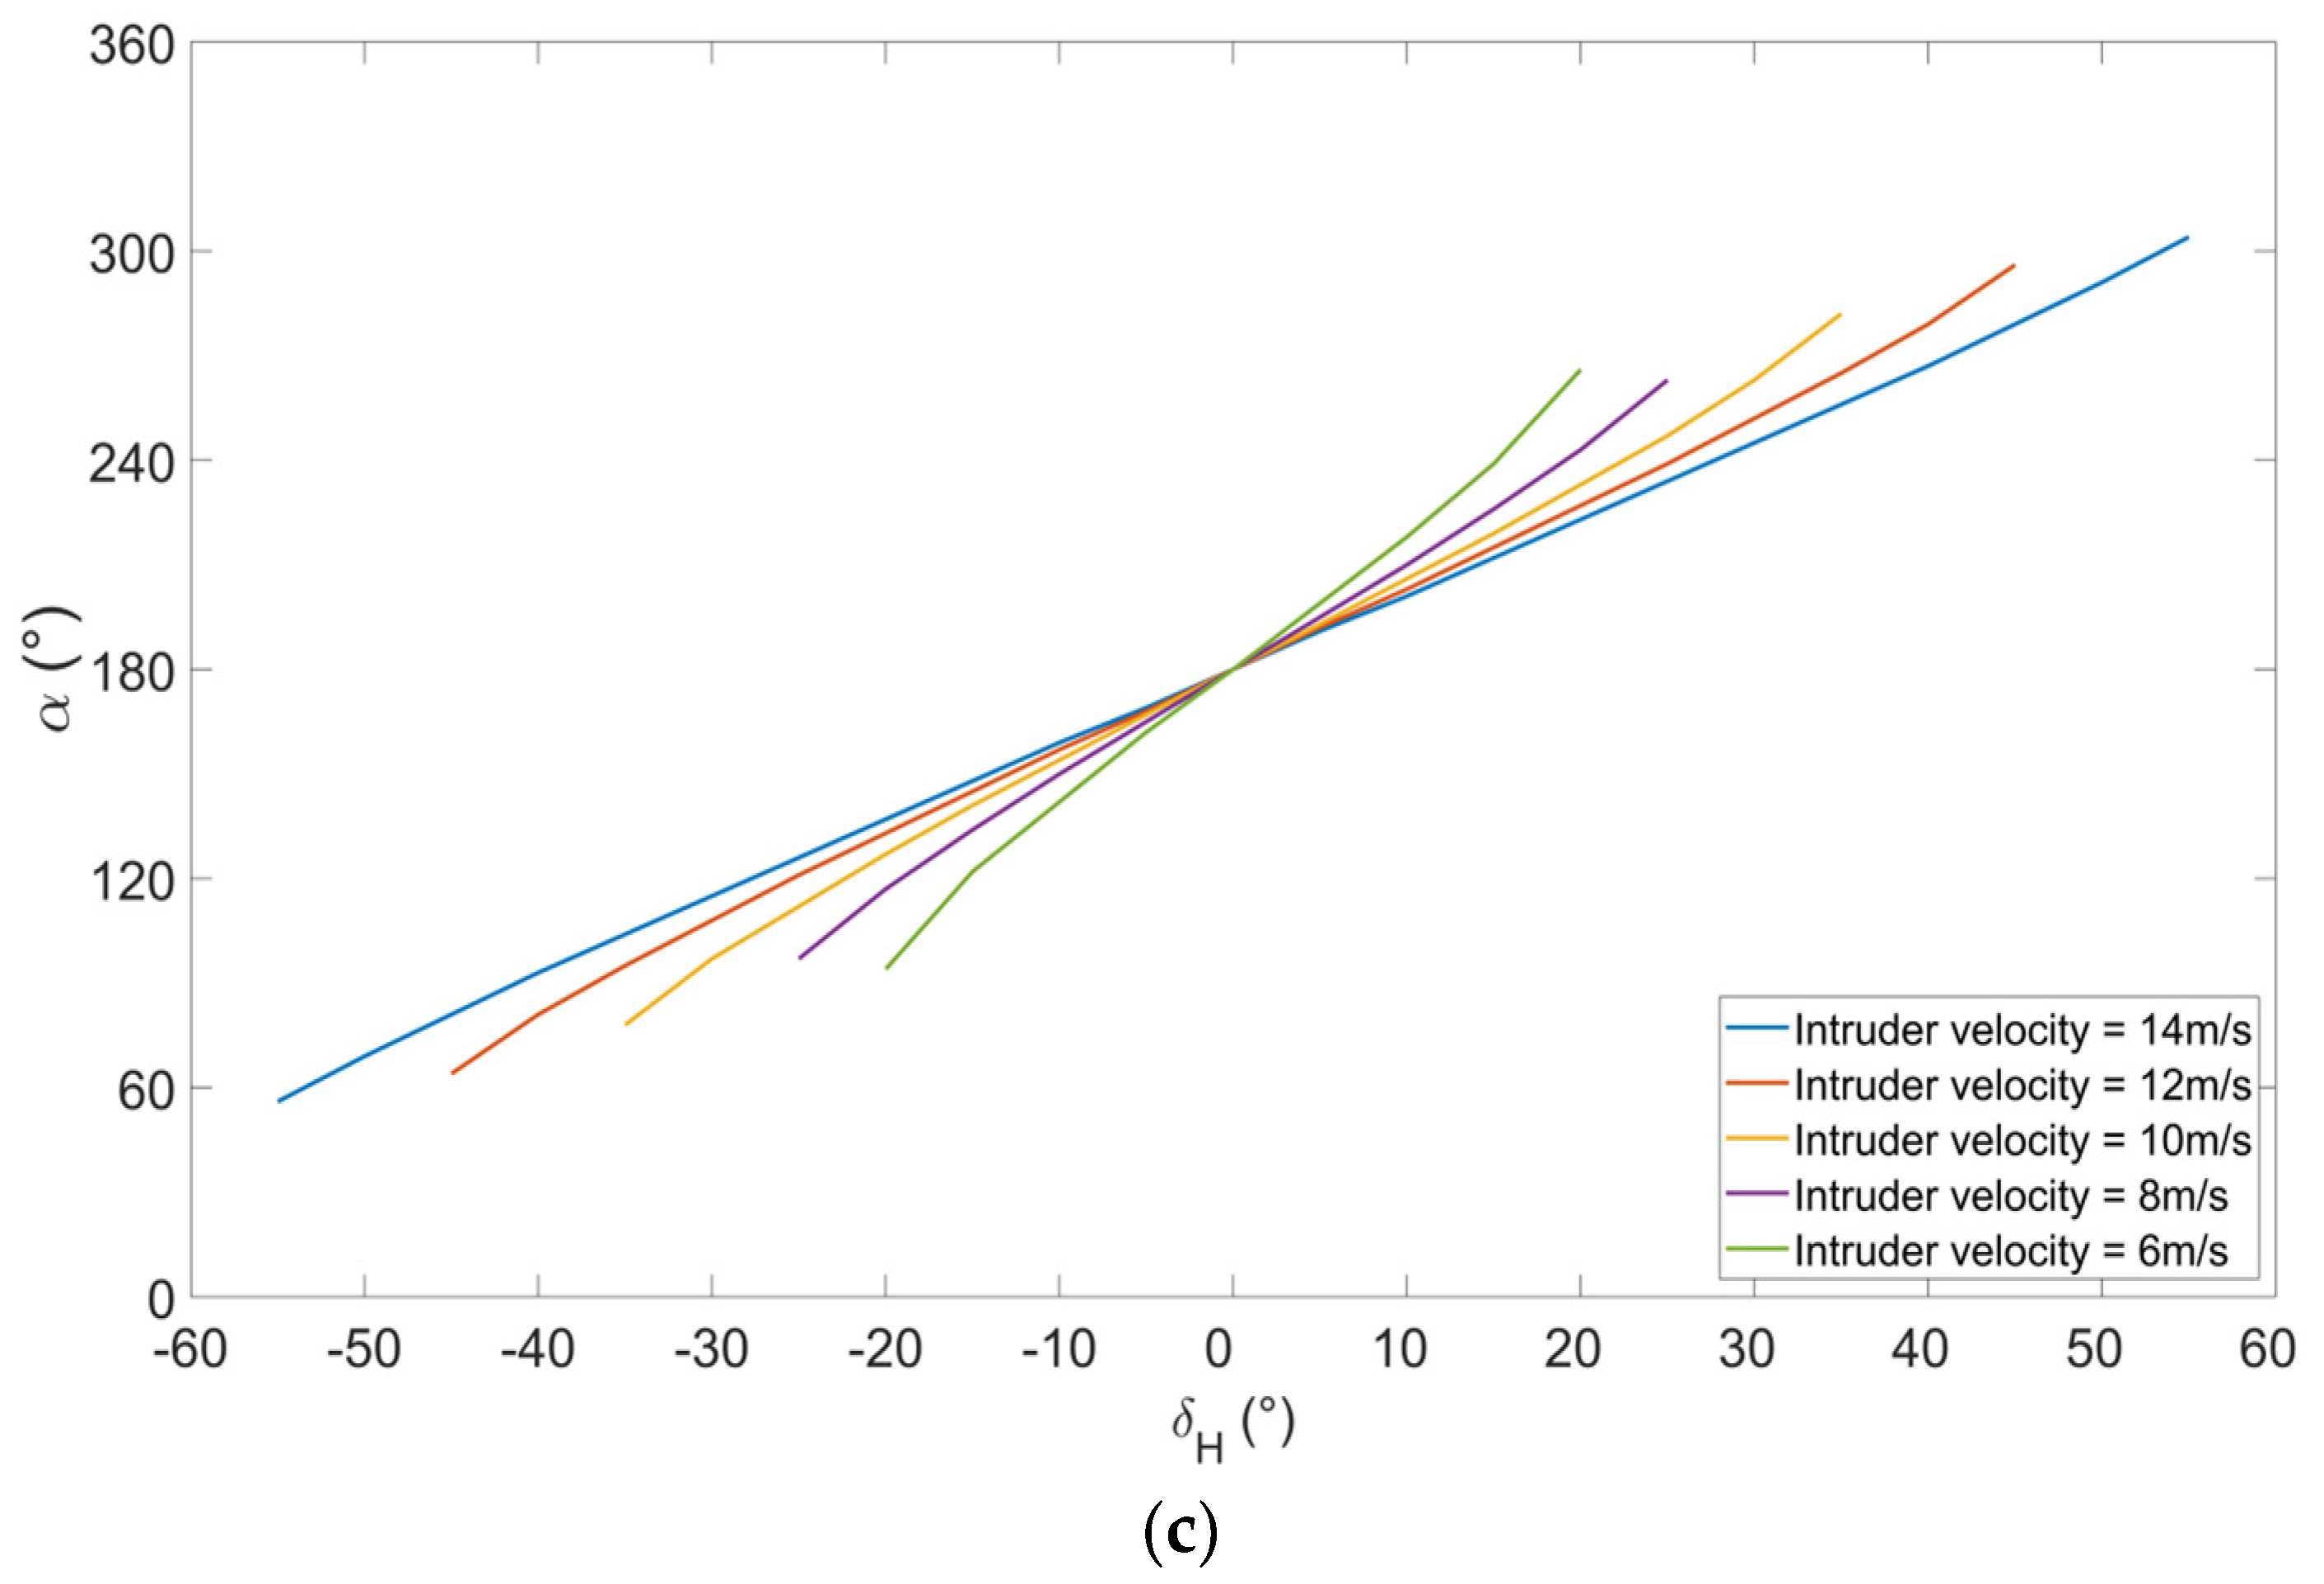
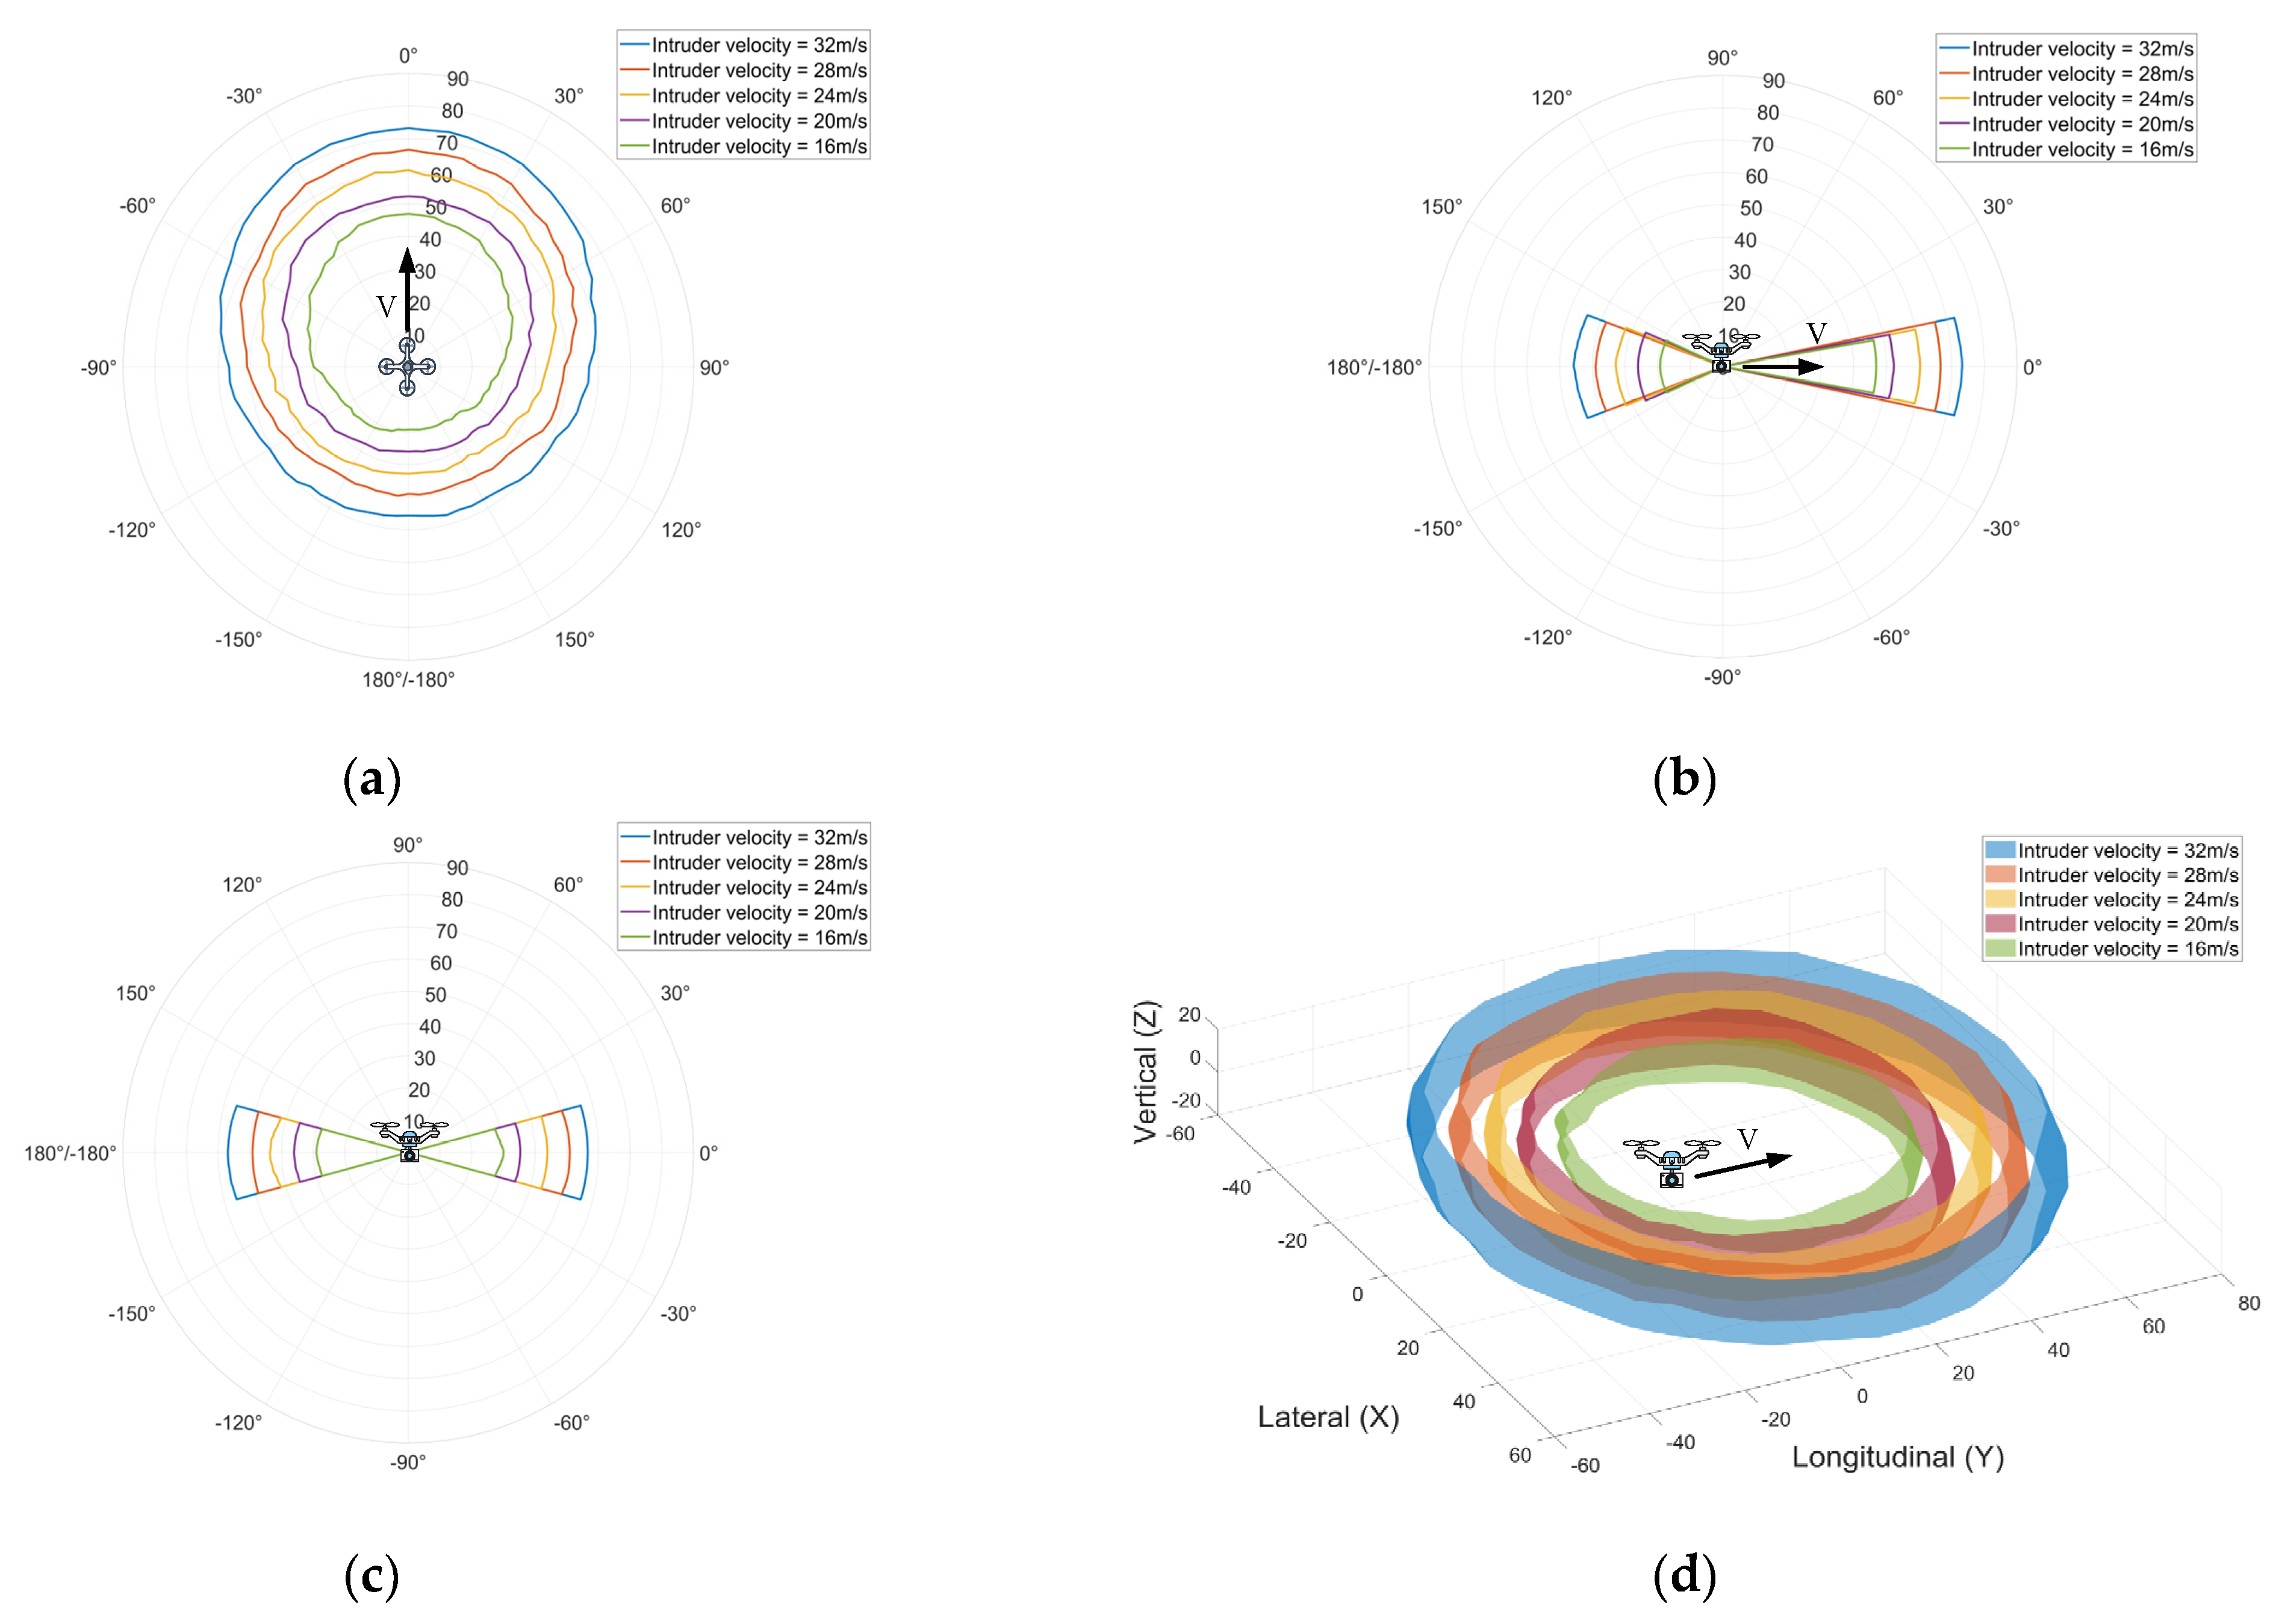
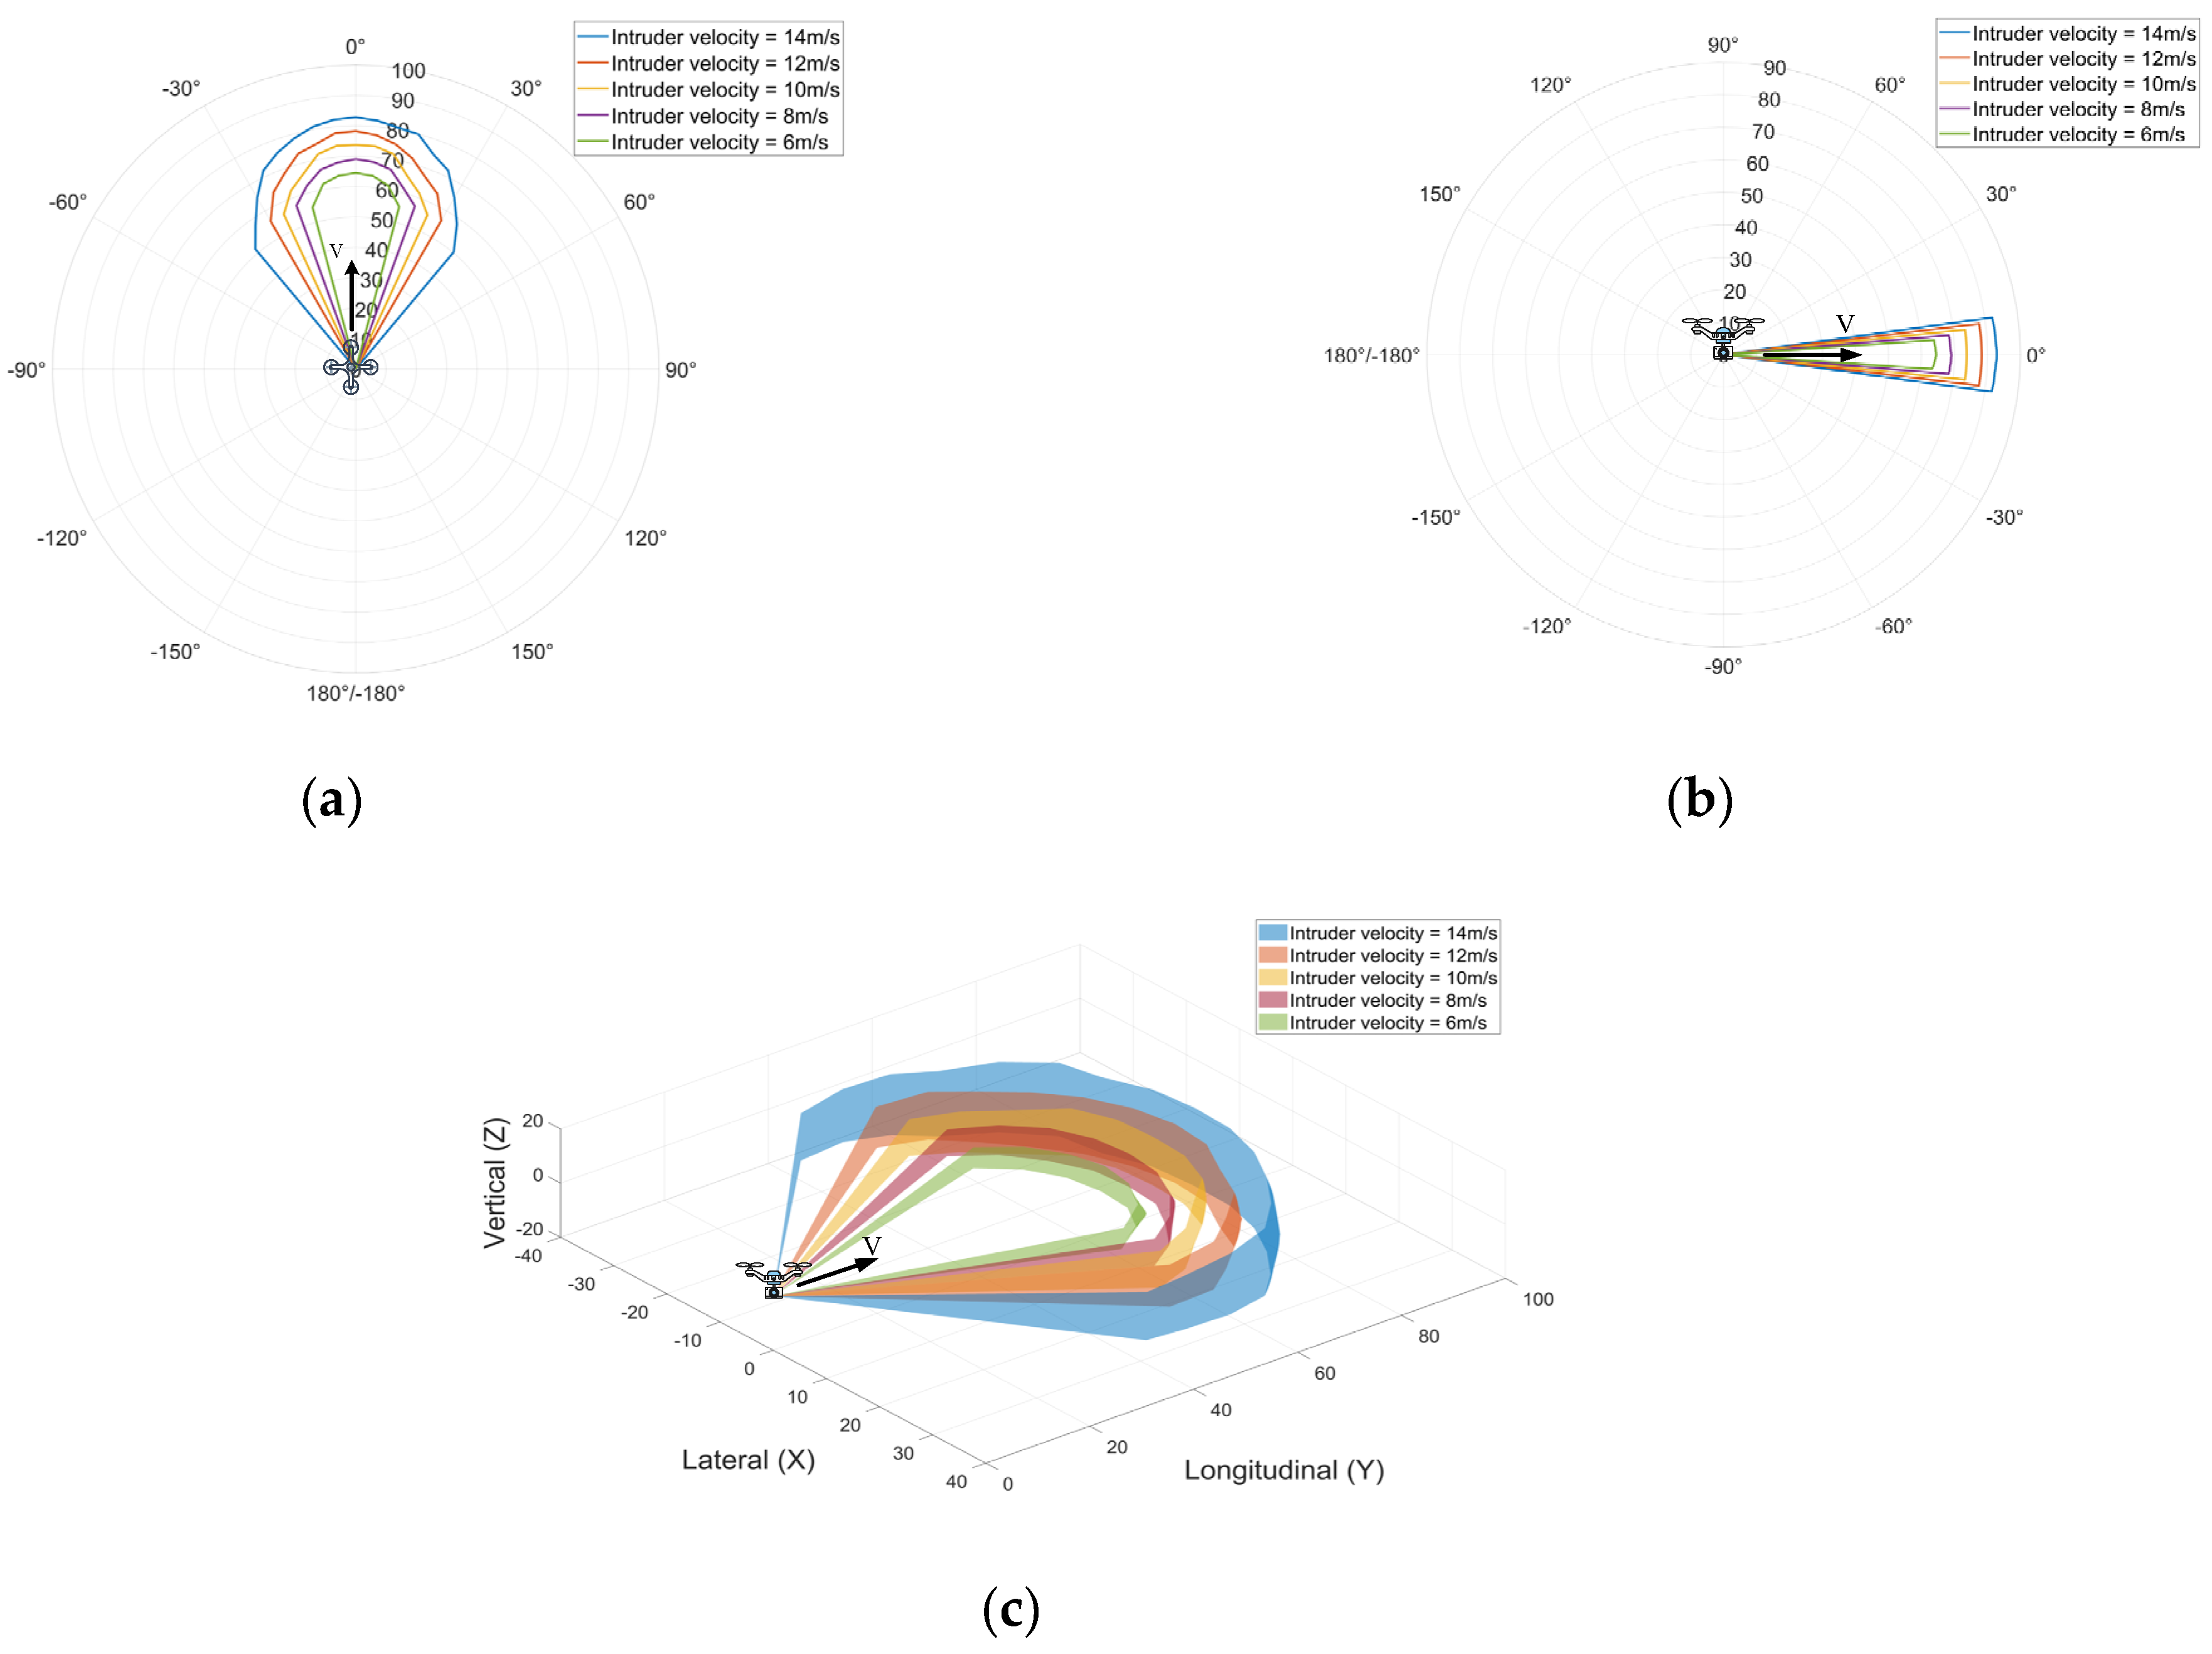
5.2. Simulation and Results
- (i)
- As the fast intruder approaches the slow host, the omni-azimuths of the intruder at the heading of intruder pose collision risks to the host; therefore, the host must maneuver to avoid the intruder before reaching the well clear thresholds. However, when the slow intruder approaches the fast host, only those intruders roughly in reciprocal azimuths pose collision risks to the host.
- (ii)
- As the fast intruder approaches the slow host and the intruder flies reciprocal to the host, the elevation range becomes progressively larger as the velocity of the intruder increases. In contrast, when two UAVs are flying on the same track, the elevation range becomes smaller as the velocity of the intruder increases.
- (iii)
- As the slow intruder approaches the fast host and the intruder flies reciprocal to the host, the elevation range becomes progressively larger as the velocity of the intruder increases.
- (iv)
- A larger intruder’s velocity yields a greater well clear threshold.
- (v)
- Reciprocally approaching azimuths (along the same track) yield larger well clear thresholds than other azimuths.
- (vi)
- A larger vertical altitude difference between two UAVs yields lower well clear thresholds.
- (vii)
- When the slow UAV approaches the fast UAV, the range of intruding azimuths that do not satisfy the TLOS increases as the host UAV’s velocity decreases.
6. Concluding Remarks
Author Contributions
Funding
Data Availability Statement
Conflicts of Interest
Abbreviations
| ANOVA | Analysis of variance |
| ATC | Air traffic control |
| DAA | Detect and avoid |
| FTE | Flight technical error |
| NMAC | Near mid-air collision |
| NSE | Navigation system error |
| PBN | Performance-based navigation |
| PDE | Path definition error |
| RTK | Real-time kinematic |
| TLOS | Target level of safety |
| TSE | Total system error |
| UAV | Unmanned air vehicle |
| UTM | Unmanned aircraft system traffic management |
| Symbols | |
| Well clear spatial distance | |
| DAA detect range | |
| Actual position vector of host UAV | |
| Actual position vector of intruder UAV | |
| Relative actual position vector | |
| Desired position vector of host UAV | |
| Desired position vector of intruder UAV | |
| Relative desired position vector | |
| Rotation matrix of host UAV | |
| Rotation matrix of intruder UAV | |
| Time at | |
| Maneuvering delay time | |
| Trajectory conformity of host UAV | |
| Trajectory conformity of intruder UAV | |
| Velocity vector of host UAV | |
| Velocity vector of intruder UAV | |
| Relative velocity vector | |
| Heading angle | |
| Climb angle | |
| Maneuvering time threshold | |
| The horizontal azimuth of the intruder from the host | |
| the elevation of the intruder from the horizontal profile | |
Appendix A
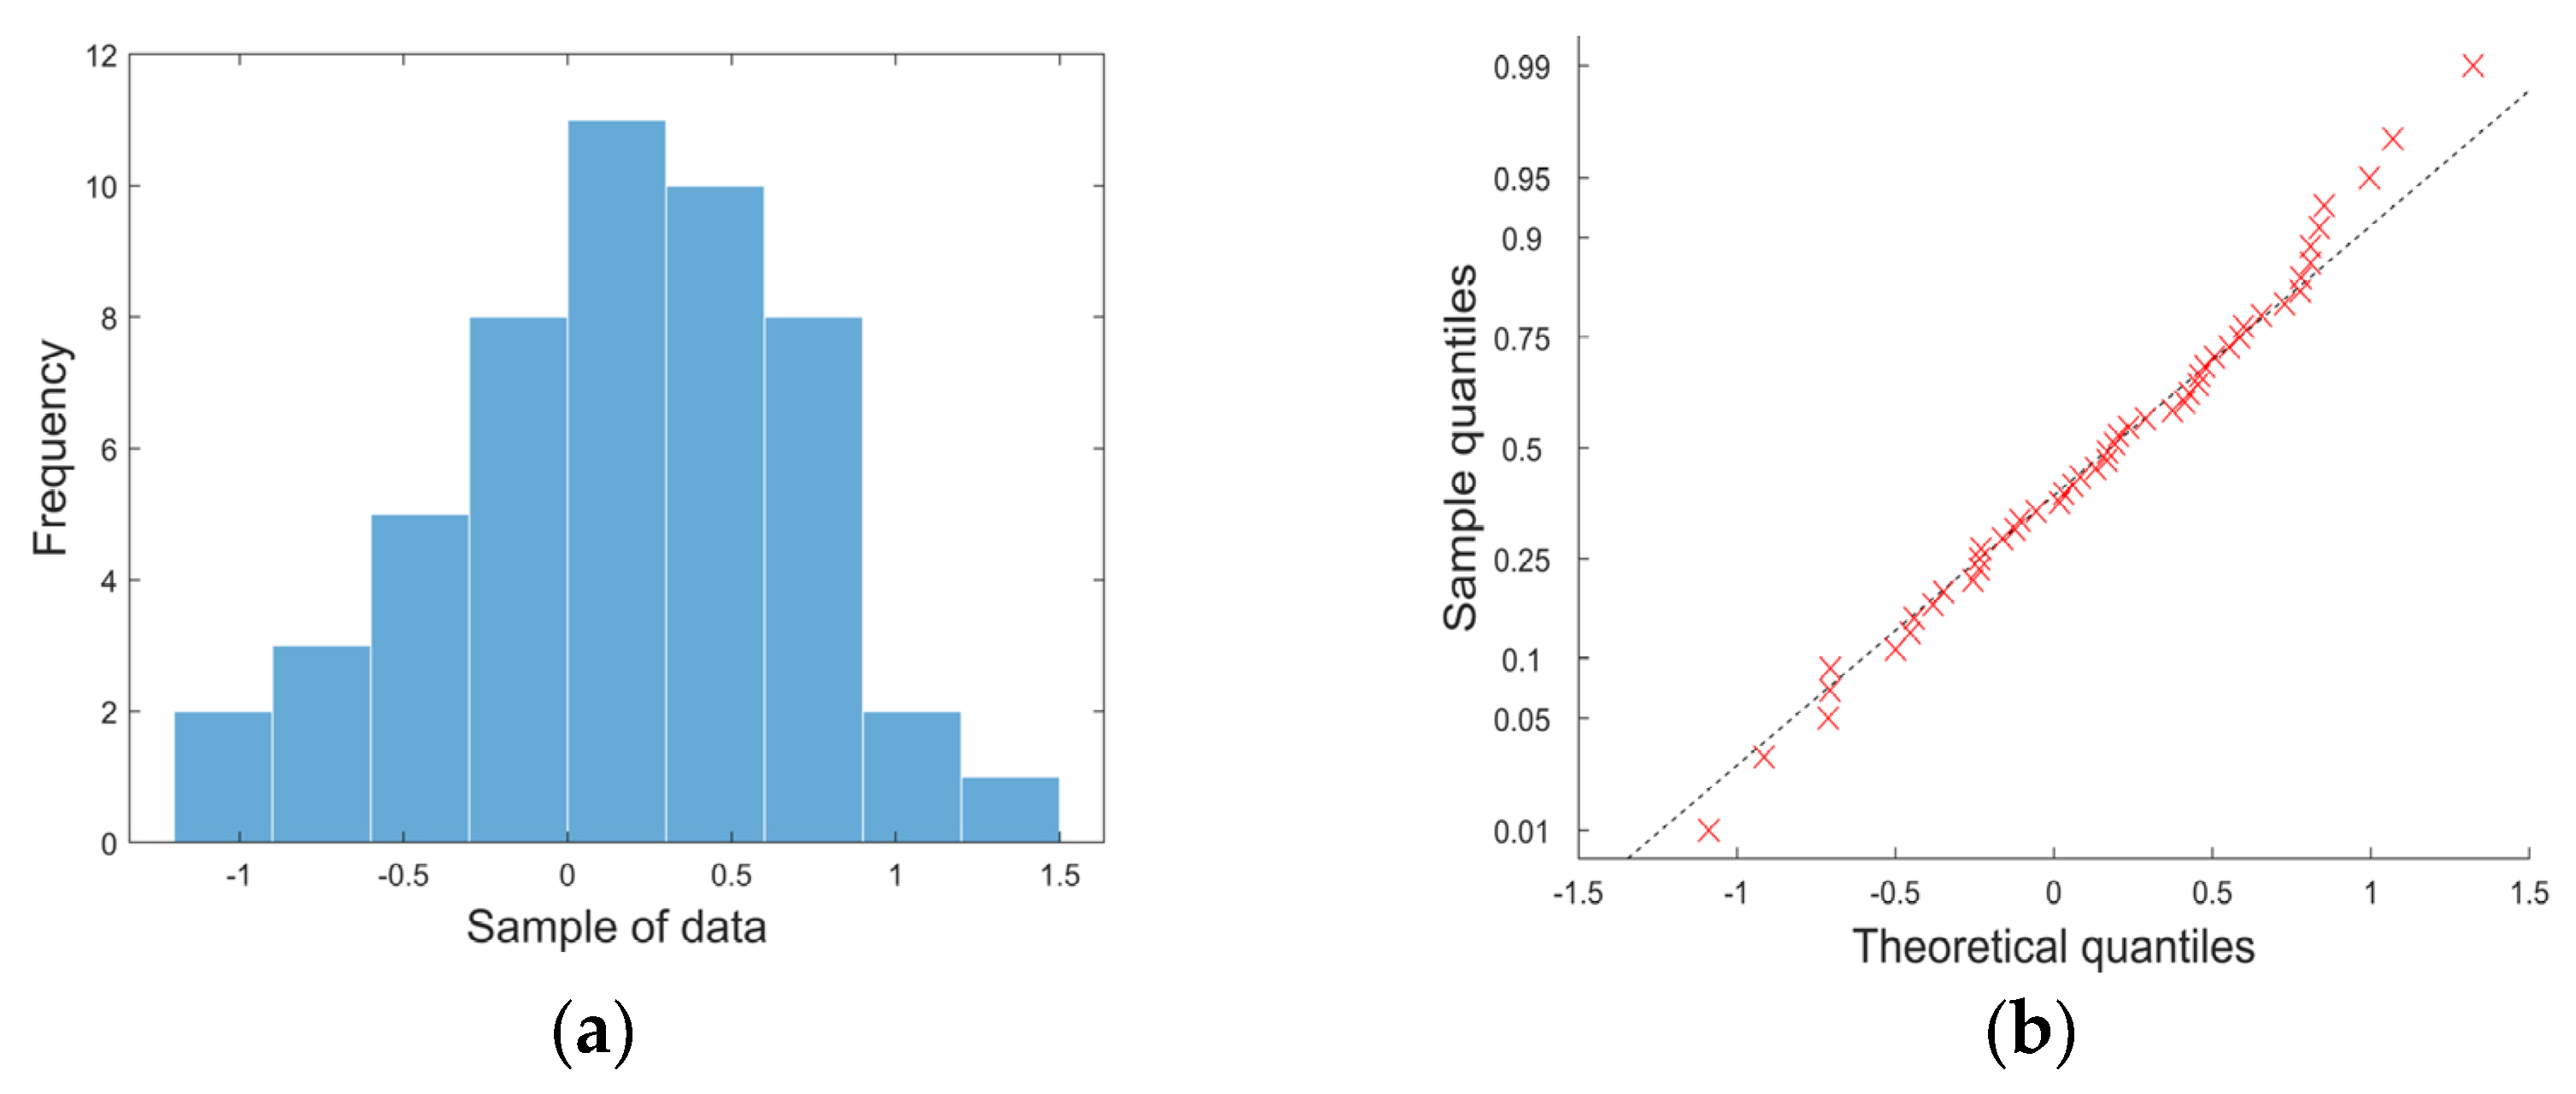
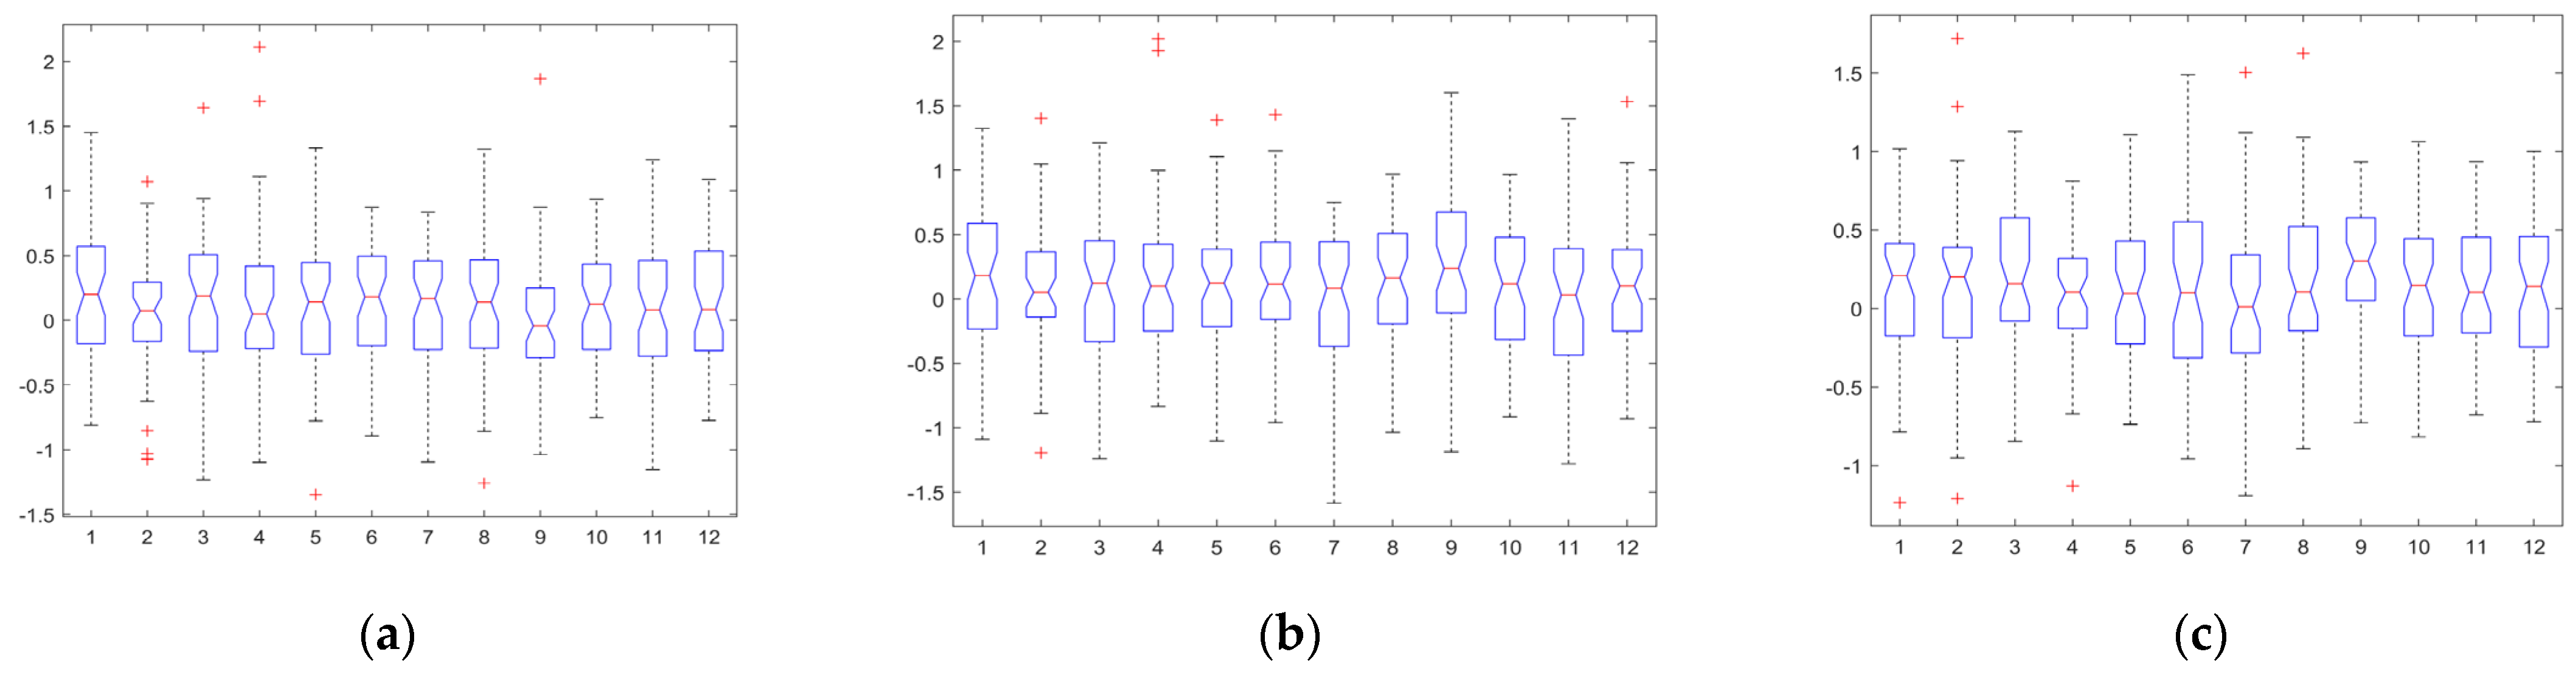
- (a)
- Normality Test

| Test Days (i) | Lateral (m) Equation (1) | Longitudinal (m) Equation (2) | Vertical (m) Equation (3) |
|---|---|---|---|
| Day 1 | 0.50000 | 0.13086 | 0.50000 |
| Day 2 | 0.15469 | 0.45561 | 0.14105 |
| Day 3 | 0.06741 | 0.33017 | 0.39374 |
| Day 4 | 0.17346 | 0.39796 | 0.30990 |
| Day 5 | 0.10891 | 0.50000 | 0.41185 |
| Day 6 | 0.50000 | 0.50000 | 0.50000 |
| Day 7 | 0.06700 | 0.50000 | 0.21887 |
| Day 8 | 0.50000 | 0.23459 | 0.50000 |
| Day 9 | 0.50000 | 0.19121 | 0.11343 |
| Day 10 | 0.44522 | 0.44478 | 0.50000 |
| Day 11 | 0.50000 | 0.24395 | 0.43476 |
| Day 12 | 0.50000 | 0.50000 | 0.29910 |
| Test Days (i) | Lateral (m) Equation (1) | Longitudinal (m) Equation (2) | Vertical (m) Equation (3) |
|---|---|---|---|
| Day 1 | 0.50000 | 0.50000 | 0.46930 |
| Day 2 | 0.41560 | 0.49634 | 0.50000 |
| Day 3 | 0.50000 | 0.15743 | 0.50000 |
| Day 4 | 0.50000 | 0.42746 | 0.29661 |
| Day 5 | 0.46523 | 0.50000 | 0.11429 |
| Day 6 | 0.20951 | 0.50000 | 0.39196 |
| Day 7 | 0.50000 | 0.19556 | 0.50000 |
| Day 8 | 0.50000 | 0.50000 | 0.50000 |
| Day 9 | 0.46339 | 0.12305 | 0.24851 |
| Day 10 | 0.34975 | 0.50000 | 0.50000 |
| Day 11 | 0.50000 | 0.50000 | 0.34832 |
| Day 12 | 0.50000 | 0.14986 | 0.46893 |
| Test Days (i) | Lateral (m) Equation (1) | Longitudinal (m) Equation (2) | Vertical (m) Equation (3) |
|---|---|---|---|
| Day 1 | 0.43565 | 0.25334 | 0.50000 |
| Day 2 | 0.50000 | 0.34600 | 0.50000 |
| Day 3 | 0.50000 | 0.45299 | 0.50000 |
| Day 4 | 0.50000 | 0.50000 | 0.37140 |
| Day 5 | 0.26004 | 0.50000 | 0.39384 |
| Day 6 | 0.27960 | 0.40441 | 0.38868 |
| Day 7 | 0.50000 | 0.50000 | 0.50000 |
| Day 8 | 0.10518 | 0.50000 | 0.50000 |
| Day 9 | 0.50000 | 0.26932 | 0.50000 |
| Day 10 | 0.50000 | 0.06105 | 0.50000 |
| Day 11 | 0.15414 | 0.25313 | 0.50000 |
| Day 12 | 0.31150 | 0.41983 | 0.44073 |
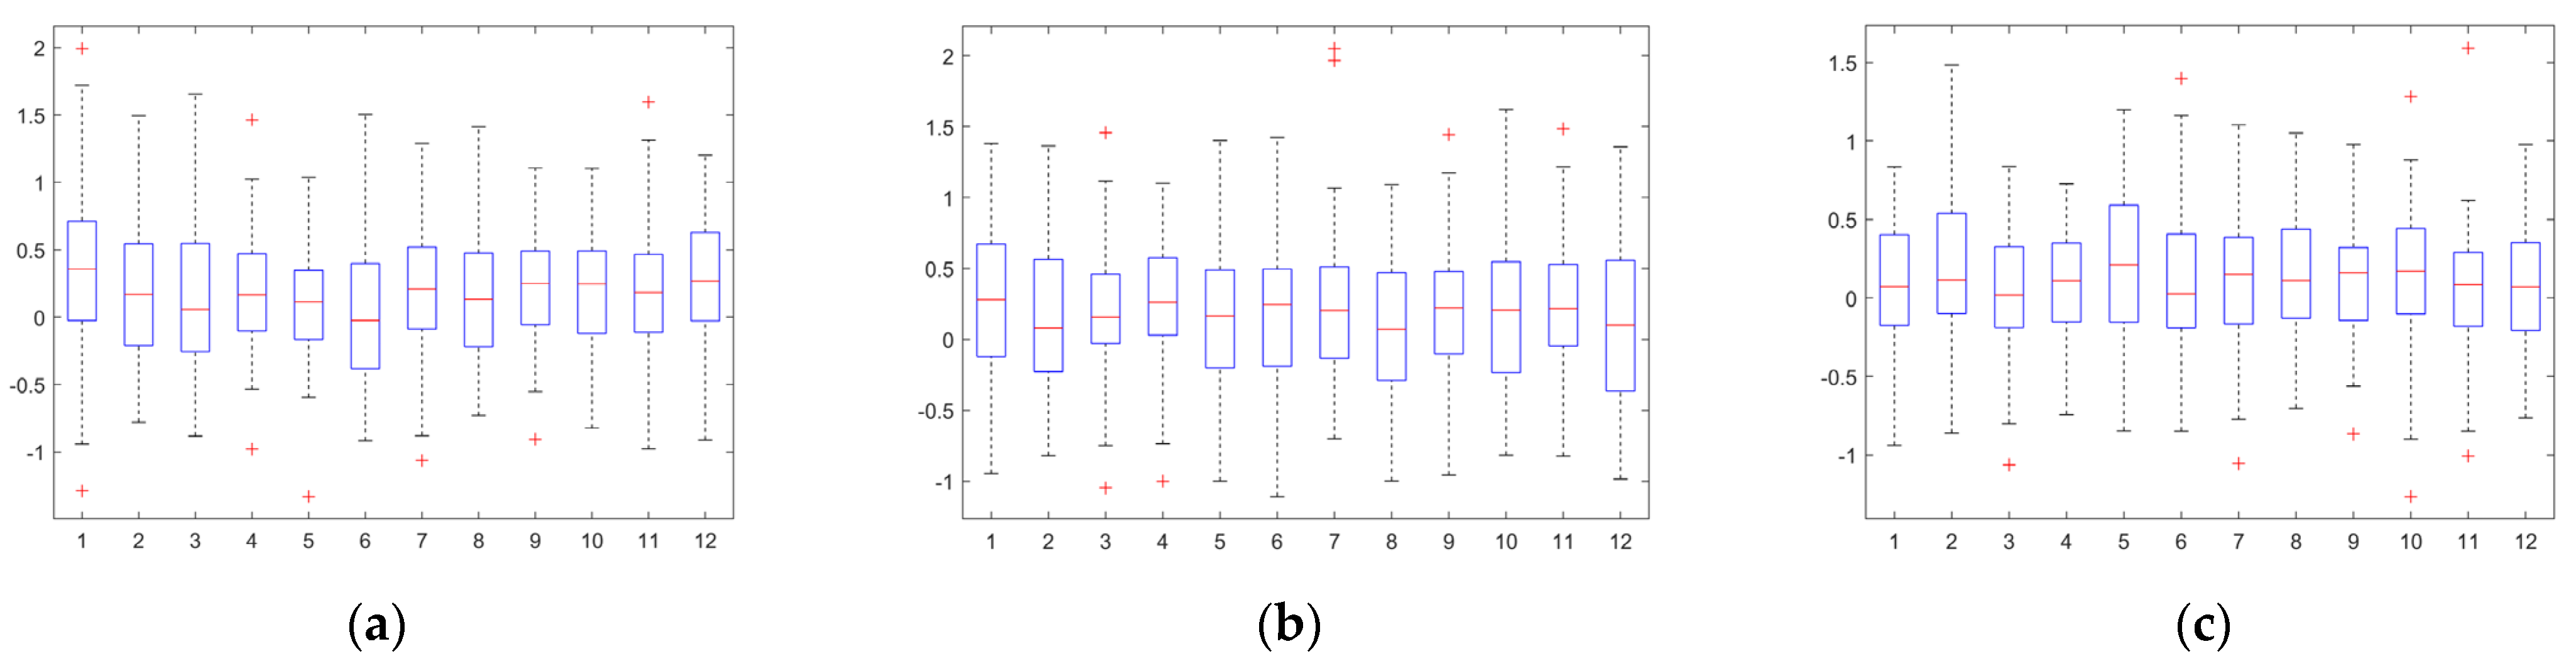
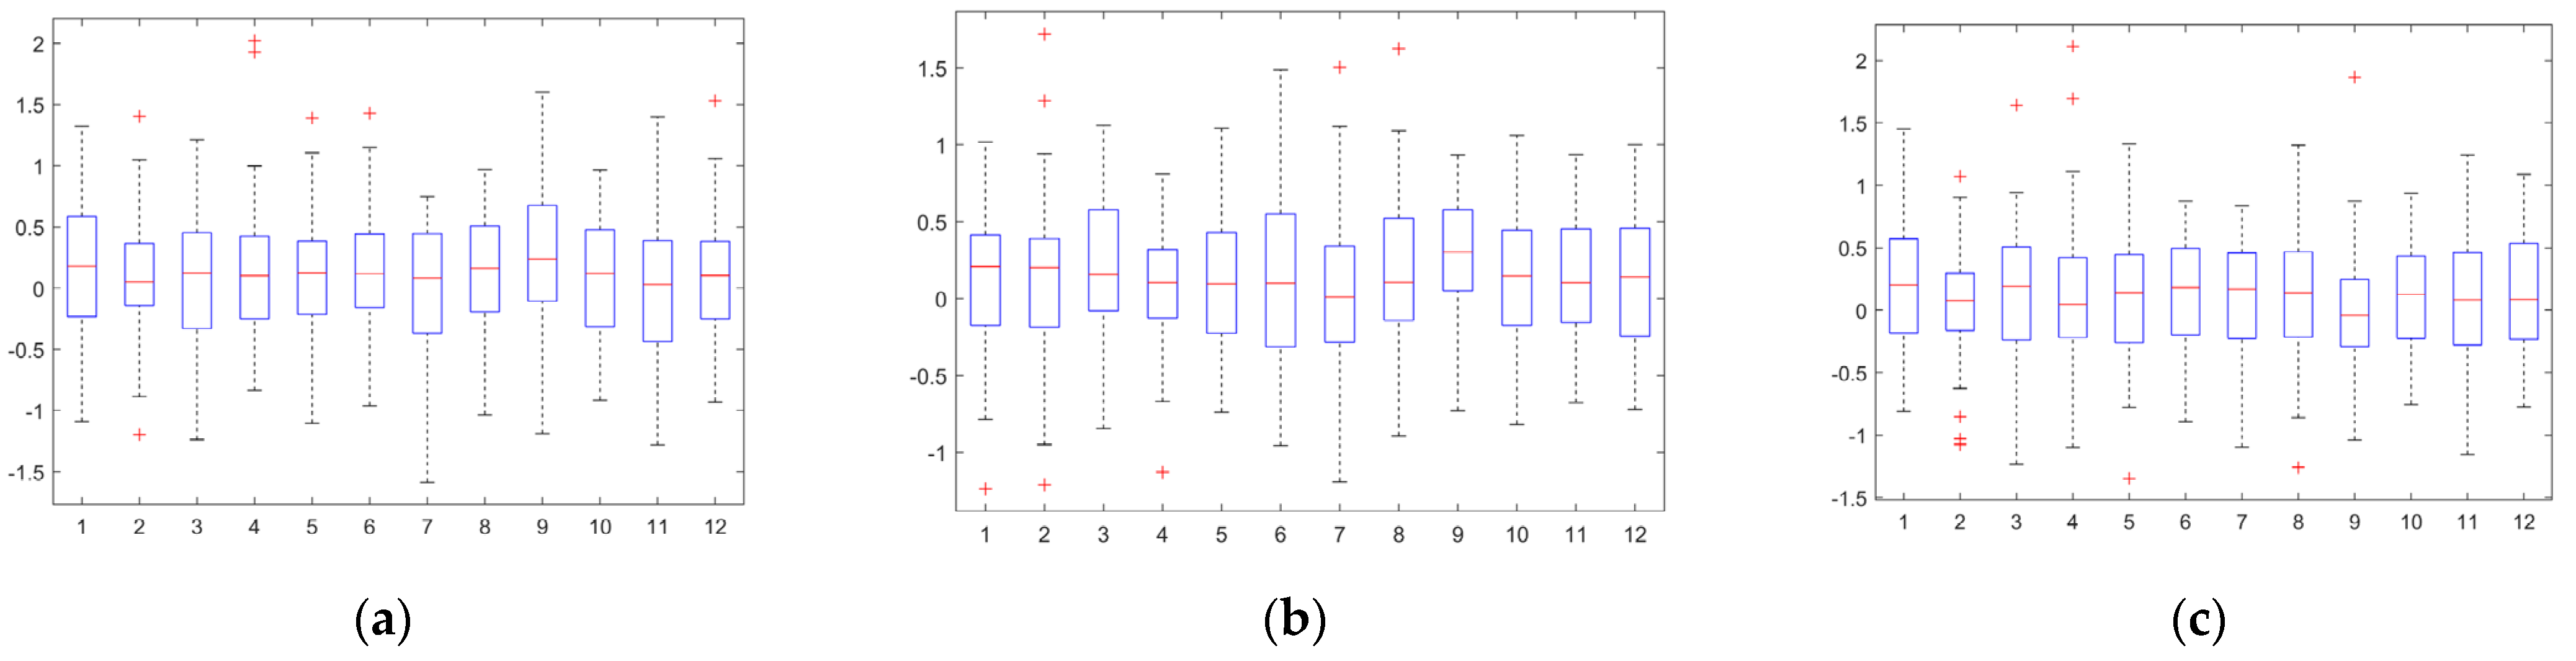
- (b)
- Homogeneity test of the variance

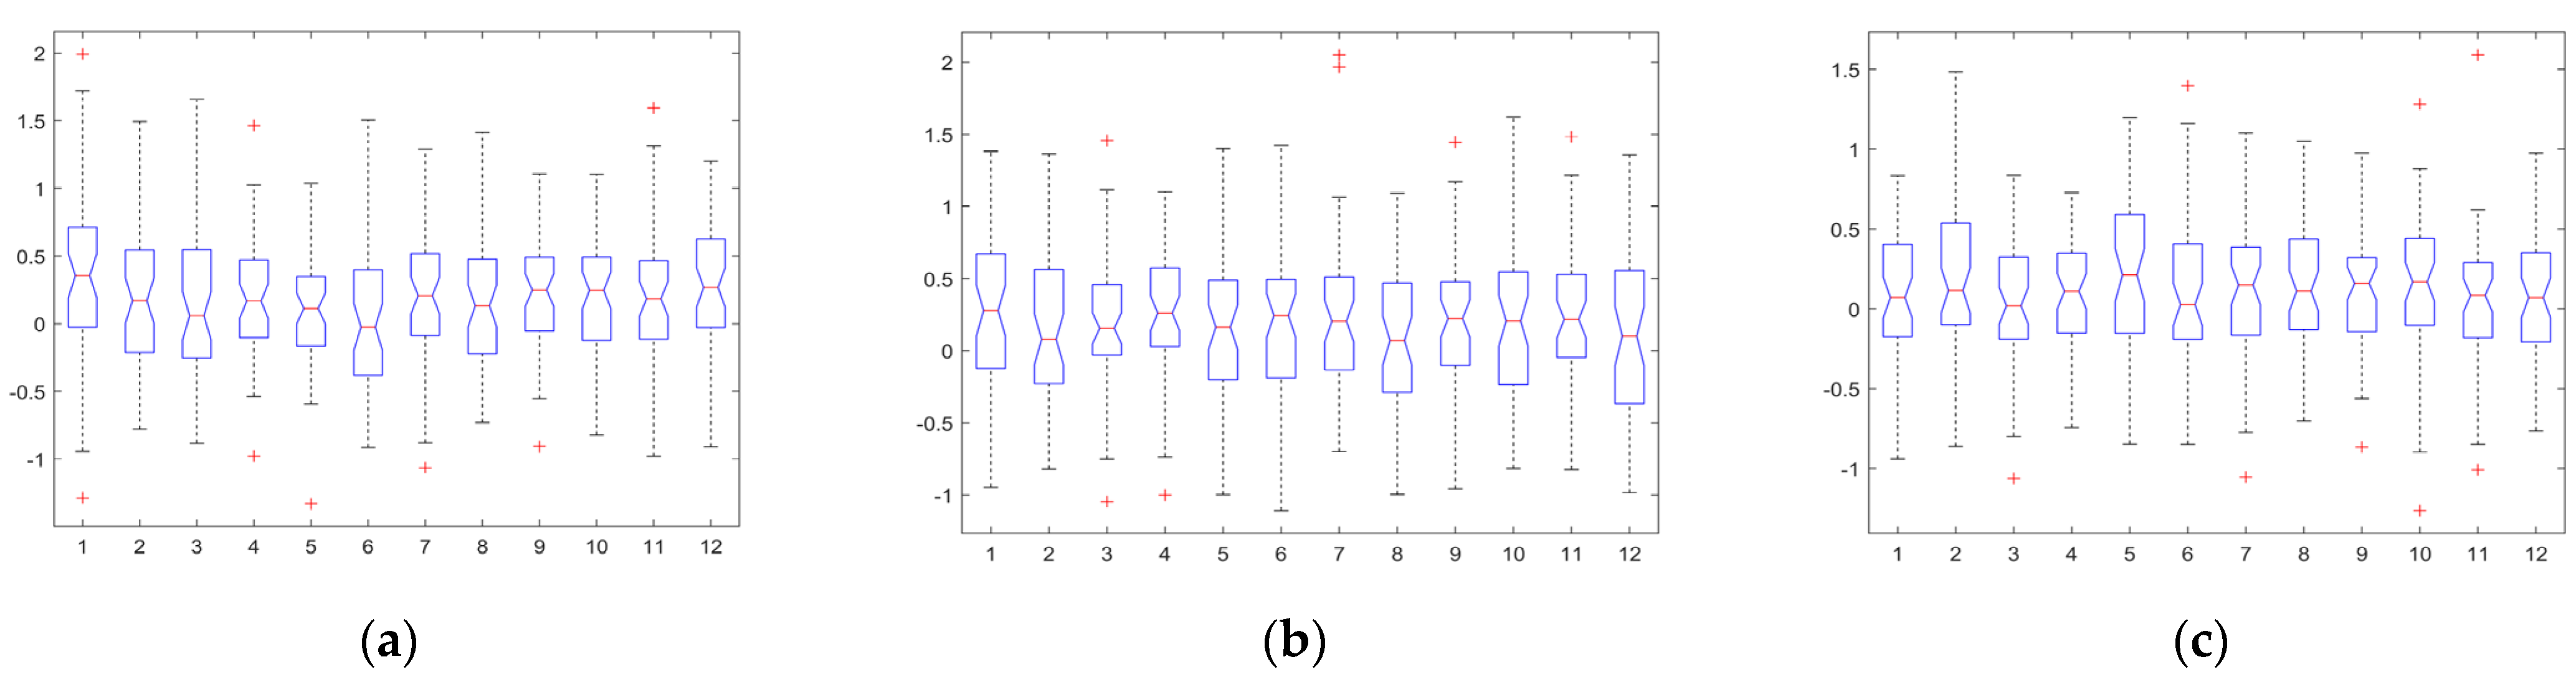
- (c)
- Hypothesis test of the mean

References
- FAA and NASA. FAA UTM Concept of Operations—v1.0. 2018. Available online: https://utm.arc.nasa.gov/docs/2018-UTM-ConOps-v1.0.pdf (accessed on 5 June 2024).
- FAA and NASA. FAA UTM Concept of Operations—v2.0. 2022. Available online: https://www.faa.gov/sites/faa.gov/files/2022-08/UTM_ConOps_v2.pdf (accessed on 5 June 2024).
- Davies, L.; Bolamm, R.C.; Vagapov, Y.; Anuchin, A. Review of Unmanned Aircraft System Technologies to Enable Beyond Visual Line of Sight (BVLOS) Operations. In Proceedings of the 2018 X International Conference on Electrical Power Drive Systems (ICEPDS), Novocherkassk, Russia, 3–6 October 2018; pp. 1–6. [Google Scholar]
- Sorbelli, F.B.; Chatterjee, P.; Das, P.; Pinotti, C.M. Risk Assessment in BVLoS Operations for UAVs: Challenges and Solutions. In Proceedings of the 2024 20th International Conference on Distributed Computing in Smart Systems and the Internet of Things (DCOSS-IoT), Abu Dhabi, United Arab Emirates, 29 April–1 May 2024; pp. 300–307. [Google Scholar]
- Usach, H.; Vila, J.A.; Gallego, Á. Trajectory-Based, Probabilistic Risk Model for UAS Operations; IntechOpen: London, UK, 2020. [Google Scholar]
- Bauranov, A.; Rakas, J. Designing airspace for urban air mobility: A review of concepts and approaches. Prog. Aerosp. Sci. 2021, 125, 100726. [Google Scholar] [CrossRef]
- Pang, B.; Hu, X.; Dai, W.; Low, K.H. UAV path optimization with an integrated cost assessment model considering third-party risks in metropolitan environments. Reliab. Eng. Syst. Saf. 2022, 222, 108399. [Google Scholar] [CrossRef]
- Blom, H.A.P.; Jiang, C.; Grimme, W.B.A.; Cheung, Y.S. Third-party risk modelling of Unmanned Aircraft System operations, with application to parcel delivery service. Reliab. Eng. Syst. Saf. 2021, 214, 107788. [Google Scholar] [CrossRef]
- Jang, D.S.; Ippolito, C.A.; Sankararaman, S.; Stepanyan, V. Concepts of airspace structures and system analysis for uas traffic flows for urban areas. In Proceedings of the AIAA Information Systems-AIAA Infotech@Aerospace, Grapevine, TX, USA, 9–13 January 2017; p. 0449. [Google Scholar]
- Sunil, E.; Hoekstra, J.; Ellerbroek, J.; Bussink, F.; Nieuwenhuisen, D. Metropolis: Relating airspace structure and capacity for extreme traffic densities. In Proceedings of the ATM Seminar 2015, 11th USA/EUROPE Air Traffic Management R&D Seminar, Lisbon, Portugal, 23–26 June 2015. [Google Scholar]
- Yang, J.; Wang, Y.; Hang, X.; Delahaye, D. A review on airspace design and risk assessment for urban air mobility. IEEE Access 2024, 11, 3481148. [Google Scholar] [CrossRef]
- Pang, B.; Dai, W.; Ra, T.; Low, K.H. A Concept of Airspace Configuration and Operational Rules for UAS in Current Airspace. In Proceedings of the 2020 AIAA/IEEE 39th Digital Avionics Systems Conference (DASC), San Antonio, TX, USA, 11–15 October 2020; pp. 1–9. [Google Scholar]
- Zhu, D.; Chen, Z.; Xie, X.; Chen, J. Discretization Method to Improve the Efficiency of Complex Airspace Operation. Aerospace 2023, 10, 780. [Google Scholar] [CrossRef]
- Zhang, Z.; Liang, Y. Bayesian network-based study on collision risk in free flight. China Saf. Sci. J. 2014, 24, 40–45. [Google Scholar]
- Zhang, Z.N.; Yu, S. On the collision risk in rectification of the aircraft positioning error under the free flight condition. Saf. Environ. Eng. 2017, 17, 16331636. [Google Scholar]
- International Civil Aviation Organization (ICAO). Doc 9613: Performance Based Navigation (PBN) Manual; ICAO: Montréal, QC, Canada, 2013. [Google Scholar]
- Wang, C.H.J.; Ng, E.M.; Low, K.H. Investigation and modeling of flight technical error (FTE) associated with UAS operating with and without pilot guidance. IEEE Trans. Veh. Technol. 2021, 70, 12389–12401. [Google Scholar] [CrossRef]
- Pang, B.; Zhang, M.; Deng, C.; Low, K.H. Investigation of Flight Technical Error for UAV Separation Requirement Based on Flight Trajectory Data. In Proceedings of the AIAA Aviation 2022 Forum, Chicago, IL, USA, 27 June–1 July 2022; p. 3763. [Google Scholar]
- Zhang, N.; Liu, H.; Ng, B.F.; Low, K.H. Collision probability between intruding drone and commercial aircraft in airport restricted area based on collision-course trajectory planning. Transp. Res. Part C Emerg. Technol. 2020, 120, 102736. [Google Scholar] [CrossRef]
- Lee, H.T.; Meyn, L.A.; Kim, S.Y. Probabilistic safety assessment of unmanned aerial system operations. J. Guid. Control. Dyn. 2013, 36, 610–617. [Google Scholar] [CrossRef]
- Bijjahalli, S.; Gardi, A.; Pongsakornsathien, N.; Sabatini, R. A Unified Collision Risk Model for Unmanned Aircraft Systems. In Proceedings of the 2021 IEEE/AIAA 40th Digital Avionics Systems Conference (DASC), San Antonio, TX, USA, 3–7 October 2021; pp. 1–10. [Google Scholar]
- Johnson, M.; Santiago, C.; Mueller, E. Characteristics of a well clear definition and alerting criteria for encounters between uas and manned aircraft in class e airspace. In Proceedings of the Air Traffic Management (ATM) Research and Development Seminar, Lisbon, Portugal, 23–26 June 2015. No. ARC-E-DAA-TN22684. [Google Scholar]
- Park, J.W.; Oh, H.D.; Tahk, M.J. UAV collision avoidance based on geometric approach. In Proceedings of the 2008 SICE Annual Conference, Tokyo, Japan, 20–22 August 2008; IEEE: Piscataway, NJ, USA, 2008; pp. 2122–2126. [Google Scholar]
- McFadyen, A.; Martin, T. Understanding vertical collision risk and navigation performance for unmanned aircraft. In Proceedings of the AIAA 37th Digital Avionics Systems Conference (DASC), London, UK, 23–27 September 2018; IEEE: Piscataway, NJ, USA, 2018; pp. 1–10. [Google Scholar]
- la Cour-Harbo, A.; Schiøler, H. Probability of Low-Altitude Midair Collision Between General Aviation and Unmanned Aircraft. Risk Anal. 2019, 39, 2499–2513. [Google Scholar] [CrossRef] [PubMed]
- Zhang, H.; Li, B.; Liu, H.; Zhong, G.; Fei, Y. Demarcation method of safety separation for multi-rotor UAV in free airspace. Syst. Eng. Electron. 2023, 45, 3149–3156. [Google Scholar]
- Weibel, R.; Edwards, M.; Fernandes, C. Establishing a risk-based separation standard for unmanned aircraft self separation. In Proceedings of the 11th AIAA Aviation Technology, Integration, and Operations (ATIO) Conference, including the AIAA Balloon Systems Conference and 19th AIAA Lighter-Than, Virginia Beach, VA, USA, 20–22 September 2011; p. 6291. [Google Scholar]
- Weinert, A.; Campbell, S.; Vela, A.; Schuldt, D.; Kurucar, J. Well-clear recommendation for small unmanned aircraft systems based on unmitigated collision risk. J. Air Transp. 2018, 26, 113–122. [Google Scholar] [CrossRef]
- Munoz, C.; Narkawicz, A.; Chamberlain, J.; Consiglio, M.C.; Upchurch, J.M. A Family of Well-Clear Boundary Models for the Integration of UAS in the NAS. In Proceedings of the 14th AIAA Aviation Technology, Integration, and Operations Conference, Atlanta, GA, USA, 16–20 June 2014; p. 2412. [Google Scholar]
- Mullins, M.; Holman, M.W.; Foerster, K.M.; Kaabouch, N.; Semke, W. Dynamic separation thresholds for a small airborne sense and avoid system. In Proceedings of the AIAA Infotech@ Aerospace (I@A) Conference, Boston, MA, USA, 19–22 August 2013; p. 5148. [Google Scholar]
- Fellner, A.; Konieczka, R. Rotorcraft in the performance-based navigation international civil aviation organization implementation. Trans. Aerosp. Res. 2019, 2019, 53–64. [Google Scholar] [CrossRef]
- Dai, W.; Deng, C. Urban Performance-Based Navigation (uPBN): Addressing the CNS Variation Problem in the Urban Airspace in the Context of UAS Traffic Management. In Proceedings of the 2023 IEEE 26th International Conference on Intelligent Transportation Systems (ITSC), Bizkaia, Spain, 24–28 September 2023; pp. 5524–5529. [Google Scholar]
- Pang, B.; Ng, E.M.; Low, K.H. UAV trajectory estimation and deviation analysis for contingency management in urban environments. In Proceedings of the AIAA Aviation 2020 Forum, Online, 15–19 June 2020; p. 2919. [Google Scholar]
- Deng, C.; Wang, C.H.J.; Low, K.H. Preliminary UAS navigation performance analysis in urban-like environments. In Proceedings of the AIAA Aviation 2021 Forum, Online, 2–6 August 2021; p. 2385. [Google Scholar]
- Kallinen, V.; Martin, T.; McFadyen, A. Required navigation performance specifications for unmanned aircraft based on UTM flight trials. In Proceedings of the 2020 International Conference on Unmanned Aircraft Systems (ICUAS), Athens, Greece, 1–4 September 2020; IEEE: Piscataway, NJ, USA, 2020; pp. 196–203. [Google Scholar]
- Bernard, J.; Lacher, A.R. Flight Trajectory Options to Mitigate the Impact of Unmanned Aircraft Systems (UAS) Contingency Trajectories—A Concept of Operations. In Center for Advanced Aviation System Development; MITRE Corporation: McLean, VA, USA, 2013. [Google Scholar]
- Zou, Y.; Zhang, H.; Feng, D.; Liu, H.; Zhong, G. Fast collision detection for small unmanned aircraft systems in urban airspace. IEEE Access 2021, 9, 16630–16641. [Google Scholar] [CrossRef]
- Mohamed Salleh, M.F.B.; Wanchao, C.; Wang, Z.; Huang, S.; Tan, D.Y.; Huang, T.; Low, K.H. Preliminary concept of adaptive urban airspace management for unmanned aircraft operations. In Proceedings of the 2018 AIAA Information Systems-AIAA Infotech@Aerospace, Kissimmee, FL, USA, 8–12 January 2018; p. 2260. [Google Scholar]
- Guan, X.; Lyu, R.; Shi, H.; Chen, J. A survey of safety separation management and collision avoidance approaches of civil UAS operating in integration national airspace system. Chin. J. Aeronaut. 2020, 33, 2851–2863. [Google Scholar] [CrossRef]
- Lin, L. Application of GPS RTK and total station system on dynamic monitoring land use. In Proceedings of the ISPRS Congress, Istanbul, Turkey, 12–23 July 2004; pp. 1–6. [Google Scholar]
- Federal Aviation Administration. Federal Aviation Regulations/Aeronautical Information Manual 2014; Simon and Schuster: New York, NY, USA, 2013.
- International Civil Aviation Organization. Thirteenth Air Navigation Conference: Report of the Conference. In Proceedings of the AN-Conf/13, ICAO, Montreal, QC, Canada, 9–19 October 2018. [Google Scholar]
- Lin, X.; Fulton, N.; Westcott, M. Target level of safety measures in air transportation-Review, validation and recommendations. In Proceedings of the IASTED International Conference, Beijing, China, 12–14 October 2009. [Google Scholar]
- Li, D.B.; Xu, X.H.; Li, X. Target level of safety for Chinese airspace. Saf. Sci. 2009, 47, 421–424. [Google Scholar] [CrossRef]
- Brooker, P. P-RNAV, safety targets, blunders and parallel route spacing. J. Navig. 2004, 57, 371–384. [Google Scholar] [CrossRef]
- Zhong, G.; Du, S.; Zhang, H.; Zhou, J.; Liu, H. Demarcation method of safety separations for sUAV based on collision risk estimation. Reliab. Eng. Syst. Saf. 2024, 242, 109738. [Google Scholar] [CrossRef]
- Paielli, R.A.; Erzberger, H. Conflict probability estimation for free flight. J. Guid. Control Dyn. 1997, 20, 588–596. [Google Scholar] [CrossRef]
- Fasano, G.; Accado, D.; Moccia, A.; Moroney, D. Sense and avoid for unmanned aircraft systems. IEEE Aerosp. Electron. Syst. Mag. 2016, 31, 82–110. [Google Scholar] [CrossRef]
- Dai, W.; Quek, Z.H.; Low, K.H. Probabilistic modeling and reasoning of conflict detection effectiveness by tracking systems towards safe urban air mobility operations. Reliab. Eng. Syst. Saf. 2024, 244, 109908. [Google Scholar] [CrossRef]
- Cook, S.P.; Brooks, D.; Hackenberg, D.; Raska, V. Defining well clear for unmanned aircraft systems. In Proceedings of the AIAA Infotech@Aerospace, Kissimmee, FL, USA, 5–9 January 2015; p. 0481. [Google Scholar]
- Weibel, R.E.; Hansman, R.J. Safety Considerations for Operation of Unmanned Aerial Vehicles in the National Airspace System. Available online: http://hdl.handle.net/1721.1/34912 (accessed on 20 June 2024).
- Ghasemi, A.; Zahediasl, S. Normality tests for statistical analysis: A guide for non-statisticians. Int. J. Endocrinol. Metab. 2012, 10, 486. [Google Scholar] [CrossRef] [PubMed]
- Lever, J.; Krzywinski, M.; Altman, N. Points of significance: Principal component analysis. Nat. Methods 2017, 14, 641–643. [Google Scholar] [CrossRef]
- Pace, L. One-Way Analysis of Variance. In Statistics in Plain English; Routledge: London, UK, 2022. [Google Scholar]


| H703-NG (UAV a) | H723-200 (UAV b) | H713-400 (UAV c) | |
|---|---|---|---|
| UAV size | (m) | (m) | |
| Trajectory conformity ( ) | Lateral mean: 0.168 m, var: 0.335 m Longitudinal mean: 0.276 m, var: 0.325 m Vertical mean: 0.171 m, var: 0.373 m | Lateral mean: 0.179 m, var: 0.250 m Longitudinal mean: 0.186 m, var: 0.269 m Vertical mean: 0.113 m, var: 0.183 m | Lateral mean: 0.324 m, var: 0.601 m Longitudinal mean: 0.649 m, var: 0.909 m Vertical mean: 0.320 m, var: 0.591 m |
| Economic cruising velocity () | 8 (m/s) | 16 (m/s) | 20 (m/s) |
| Maximum climb angle () | |||
| DAA detection range (r) | 500 (m) | 500 (m) | 500 (m) |
| Total system delay () | 1.7 (s) | 1.7 (s) | 2.3 (s) |
Disclaimer/Publisher’s Note: The statements, opinions and data contained in all publications are solely those of the individual author(s) and contributor(s) and not of MDPI and/or the editor(s). MDPI and/or the editor(s) disclaim responsibility for any injury to people or property resulting from any ideas, methods, instructions or products referred to in the content. |
© 2024 by the authors. Licensee MDPI, Basel, Switzerland. This article is an open access article distributed under the terms and conditions of the Creative Commons Attribution (CC BY) license (https://creativecommons.org/licenses/by/4.0/).
Share and Cite
Meng, L.; Zhang, H.; Zhao, Y.; Low, K.H. Quantifying Well Clear Thresholds for UAV in Conjunction with Trajectory Conformity. Drones 2024, 8, 624. https://doi.org/10.3390/drones8110624
Meng L, Zhang H, Zhao Y, Low KH. Quantifying Well Clear Thresholds for UAV in Conjunction with Trajectory Conformity. Drones. 2024; 8(11):624. https://doi.org/10.3390/drones8110624
Chicago/Turabian StyleMeng, Linghang, Hongyang Zhang, Yifei Zhao, and Kin Huat Low. 2024. "Quantifying Well Clear Thresholds for UAV in Conjunction with Trajectory Conformity" Drones 8, no. 11: 624. https://doi.org/10.3390/drones8110624
APA StyleMeng, L., Zhang, H., Zhao, Y., & Low, K. H. (2024). Quantifying Well Clear Thresholds for UAV in Conjunction with Trajectory Conformity. Drones, 8(11), 624. https://doi.org/10.3390/drones8110624