Article

Latency Analysis of Drone-Assisted C-V2X Communications for Basic Safety and Co-Operative Perception Messages

Department of Electrical, Computer and Biomedical Engineering, Toronto Metropolitan University, 350 Victoria St., Toronto, ON M5B 2K3, Canada
*
Author to whom correspondence should be addressed.
Drones 2024, 8(10), 600; https://doi.org/10.3390/drones8100600
Submission received: 7 September 2024 / Revised: 10 October 2024 / Accepted: 16 October 2024 / Published: 18 October 2024
(This article belongs to the Special Issue Wireless Networks and UAV)

Abstract

:
Drone-assisted radio communication is revolutionizing future wireless networks, including sixth-generation (6G) and beyond, by providing unobstructed, line-of-sight links from air to terrestrial vehicles, enabling robust cellular cehicle-to-everything (C-V2X) communication networks. However, addressing communication latency is imperative, especially when considering autonomous vehicles. In this study, we analyze different types of delay and the factors impacting them in drone-assisted C-V2X networks. We specifically investigate C-V2X Mode 4, where multiple vehicles utilize available transmission windows to communicate the frequently collected sensor data with an embedded drone server. Through a discrete-time Markov model, we assess the medium access control (MAC) layer performance, analyzing the trade-off between data rates and communication latency. Furthermore, we compare the delay between cooperative perception messages (CPMs) and periodically transmitted basic safety messages (BSMs). Our simulation results emphasize the significance of optimizing BSM and CPM transmission intervals to achieve lower average delay as well as utilization of drones’ battery power to serve the maximum number of vehicles in a transmission time interval (TTI). The results also reveal that the average delay heavily depends on the packet arrival rate while the processing delay varies with the drone occupancy and state-transition rates for both BSM and CPM packets. Furthermore, an optimal policy approximates a threshold-based policy in which the threshold depends on the drone utilization and energy availability.

1. Introduction

In sixth-generation (6G) cellular vehicle-to-everything (C-V2X) communication networks, drones or unmanned aerial vehicles (UAVs) continue to find increasing applications as flying communication platforms that enable reliable vehicular communications through embedded aerial computing capability [1]. However, in these drone-assisted C-V2X communication networks, simultaneously maximizing the drone’s coverage range, minimizing data loss while communicating with the ground entities, and ensuring low latency is a challenging task [2]. Achieving this optimization is further constrained due to the limited battery power available in drone operations [3]. Furthermore, C-V2X broadcast packets transmitted to the drones for processing have critical latency and reliability requirements [4]. Since vehicles and drones operate at different speeds, a distributed scheduling protocol such as sensing-based semi persistent scheduling (SPS) can be utilized to enable vehicles to independently select and manage bandwidth and communication resources [5].
In drone-assisted C-V2X communications inspired by recent third-generation partnership (3GPP) standards, the round-trip latency, known as sojourn time, must be of the order of a few milliseconds [6]. In data sensing, which involves storing the sensed data in a buffer memory, timely communication with the drone and subsequent computing requirements are some major factors that contribute to the delay in C-V2X communication networks [7]. The transmission window size and sojourn time are further restricted by high data transmission rates [8]. The delay also depends on the type of information contained in a packet, such as video, high-definition maps, or real-time traffic. Furthermore, network failures and communication bottlenecks significantly increase the delay in C-V2X communication, which is the sum of the delay experienced by packets on each link. Various techniques to ensure adaptive and resilient network response are being investigated to mitigate delay resulting from heterogeneous packets and their contents [9].
In this paper, we use basic safety messages (BSMs) and cooperative perception messages (CPMs) defined by the society of automotive engineers (SAE) to study UAV utilization within a single sub frame in C-V2X mode 4 [10]. Transmission resources are allocated in scheduled time slots for vehicles to transmit or receive data. To analyze the delay introduced during data sensing and communication with the drone, the data transmission iterations are viewed as Markov kernels [11]. Here, the vehicles’ sensor data characteristics vary according to a Markov chain with a transition probability matrix with variations in the state space of the Markov chain [12]. The delay ( D ) varies with the type of packet, packet size, the queuing architecture, transmission window characteristics, and the network infrastructure [13], as depicted in Figure 1. Due to the dynamic and time-varying channel characteristics, varying packet arrival rates ( λ ), packet departure rates, ( μ ) and propagation losses, the optimal use of the drone’s available battery power is critical for delay mitigation [14]. Furthermore, the combination of drone mobility and vehicle mobility introduces delay due to Doppler spread [15]. We characterize the latency–utility trade-off when a flying drone selects vehicles for data transmission.

1.1. Contributions

This paper utilizes a discrete-time Markov chain (DTMC) approach using BSMs and CPMs to minimize delay in a realistic drone-assisted C-V2X communication network. Here, we assume that multiple vehicles aim to communicate with the drone in a transmission window and all the vehicles have a fair chance to communicate with the drone. For optimal driving decisions, fair selection of vehicles by the drone is a critical requirement, and this has been investigated in detail in our other works based on a federated reinforcement learning approach in [16] and Markovian game theoretic approach in [17]. Unlike existing works, we aim to jointly minimize queuing delay and processing delay and maximize the drone’s available power utilization so that it covers the maximum number of vehicles in a transmission time interval (TTI), specifically in gross data transmission scenarios comprising BSM and CPM packets.
The main contributions of this paper are as follows:
  • We calculate the average delay experienced by a packet when BSM inter-arrival time ( T B S M ) is varied. In real-world scenarios where multiple vehicles compete to communicate with the drone in each TTI, the drone needs to make a time-bound decision on whether to accept a vehicle’s data or not.
  • We investigate the interplay between the variation of average delay for CPMs with number of vehicles (V) for different transmission window length ( L w ) and CPM inter-arrival time ( T C P M ) pairs. We also study the variation of average delay with the inter-arrival time of CPMs for varying packet arrival rates ( λ ).
  • For BSM and CPM transmissions, we analyze the variation of the drone’s average energy consumption (Joules/s) with number of vehicles (V) for varying vehicle speed and road length ( R L ) in a single sub frame of C-V2X mode 4 [10].
  • For varying μ , λ , T B S M , and T C P M values, we plot the variations in average packet delay for varying number of vehicles (V) and the vehicle velocity under different road length ( R L ) segments.

1.2. Organization

The rest of the article is structured as follows: Section 2 discusses some recent publications that applied 3GPP-based approaches to drone-assisted vehicular communications. This section also analyzes some message generation standards for co-operative and intelligent transportation systems. This section then delves into some recent mixed integer non-linear programming approaches in drone-assisted wireless communications. Particularly, we focus on some select recent works where the objective was drone trajectory optimization for sum-rate maximization, task offloading, and communication performance enhancement. Section 3 presents our system model and the drone-ground communication architecture considered in this paper. Section 4 presents our problem formulation, where we formulate the delay minimization problem as a Markov decision process (MDP). Section 5 outlines our proposed solution approach based on DTMC analysis of the drone and vehicle states and state-transitions. Section 6 discusses the findings of this work. Here, we assess the latency observed for packets of varying byte sizes for different { λ , μ } pairs using BSM and CPM packets. Section 7 concludes the paper and discusses some avenues for future research.

2. Related Work

The authors in [18] have analyzed state-of-the-art 3GPP mobile cellular communication standards based on long-term evolution (LTE) and new radio (NR) technology to enhance the performance of vehicular communications. The authors in [18] have proposed multi-radio access technology with dual connectivity (MR-DC) architecture for resource allocation schemes, packet transmission frequencies, packet size, and vehicle density in V2X communications. Here, OMNeT++ was used for simulation of the decentralized communication mode 4 and MATLAB was used to simulate the centralized communication mode 3. The authors concluded that the contemporary LTE networks lack the capability to meet the stringent performance requirements in current vehicular communications. It was also observed that, in comparison to LTE, cellular networks based on centralized modes yielded improved performance [18].
The authors in [19] present a simulation study that benchmarks the performance of C-V2X mode 3 technologies based on LTE and fifth-generation (5G) cellular networks in an urban setting. Here, parameters such as varying traffic intensity from different numbers of vehicles, communication perimeter range, and message generation frequency were used to estimate average end-to-end (E2E) latency and packet delivery ratio (PDR). For two, four, and eight ground base-stations (BSs), the authors examined the impact of infrastructure deployment density on the performance of C-V2X communication. When the density was increased from two BSs to four BSs, performance metrics including communication perimeter, traffic intensity, and message generation frequency were reported to improve significantly [19].
Furthermore, for vehicle-to-everything (V2X) connectivity in cooperative intelligent transport systems (C-ITS), 3GPP has standardized the LTE-V2X architecture in Release 14. Here, mode 4 enables vehicles to allocate radio resources autonomously without deploying cellular infrastructure to support vehicle to vehicle (V2V) communications. Additionally, in [20], a comparison of LTE-V2X mode 4 and a short-range vehicular communication mode termed as ITS-G5 (where G5 implies the 5.9 GHz frequency band) is presented. The performance analysis is based on the parameters of sensing-based resource allocation such as traffic load and quality of service (QoS). According to the authors, a number of simulation scenarios from 3GPP demonstrate that the parameters of the sensing-based SPS mechanism and the traffic load significantly influence the performance of LTE-V2X. They also demonstrate that the QoS in LTE-V2X outperforms the the QoS in ITS-G5 in a realistic environment [20].

2.1. Message Generation Standards for Co-Operative and Intelligent Transportation Systems

In order to sense the surrounding environment, connected and automated vehicles (CAVs) use embedded sensors. Exchanging this information with neighboring vehicles enhances the cooperative or collective perception capabilities in CAVs [21]. How often these messages should be generated and transmitted has been a critical area of research. Moreover, to prevent packet drops and to meet the latency requirements, the European Telecommunications Standards Institute (ETSI) defines a set of relevant criteria for message generation for collective perception, emphasizing when and how these messages should be generated. In a recent study, the authors in [21] hypothesize that although CAVs’ perception capabilities can be improved by transmitting CPMs frequently, transmitting too many messages saturates the communication channel. Therefore, it is critical to place an upper bound on how frequently the vehicles generate these perception messages. The authors further demonstrate that, based on current ETSI standards, there is an abundance of CPMs that are generated. However, due to only a few relevant objects and surrounding information contained in these messages, this leads to inefficient utilization of the communication channels [21]. Consequently, the authors proposed an algorithm to improve the reliability of V2X communication by modifying the generation pattern of CPMs [21].
In a significant extension of the above work, the authors in [22] have established a set of rules to determine the type of information to be included in a CPM based on the mobility and dynamics of detected objects. The authors demonstrated that the existing ETSI rules lead to vehicles transmitting redundant information and generating small and frequent CPMs. The proposed techniques in [22] improve perception and reduce the age of information by developing a baseline mobility-based generation rule for CPMs. The proposed method discards redundant messages and organizes information about objects to avoid the frequent transmission of small messages. The notable contributions of this work are redundancy control, organizing sensed information to avoid small and frequent messages, reduced channel load, and improved scalability [22].
The authors in [23] have shown that the cooperative perception of the surrounding traffic environment is enhanced through a mechanism termed as adaptive message priority for vehicular cooperative perception. This involves communicating cooperative awareness messages (CAMs) and CPMs with constraints such as congestion control or mixed traffic between driver-less CAVs and vehicles with human drivers [23]. When the message transmission frequency of CAMs and CPMs is controlled using a congestion control mechanism, the number of perceptible objects contained in these messages decreases. According to the proposed method, the transmission priority is given to CPMs that include information from multiple in-vehicle sensors [23]. The simulation results revealed that with wireless congestion control and 20% CAV penetration rate, approximately 75% of CAVs perceive their neighboring vehicles within a specified time-frame [23].
The authors in [24] argue that basic safety messages (BSMs) in C-V2X are subject to collisions because of spectrum constraints and due to an increase in the number of embedded sensors in the vehicles. To reduce BSM collisions and packet drops, the authors proposed a transmission frequency adjustment mechanism (TFAM) based on the channel busy ratio (CBR). The CBR is calculated using BSM transmission frequencies and channel occupancy probabilities [24]. An optimization problem is formulated to minimize the freshness of information (FoI), which leads to a trade-off between the reliability and latency of BSMs to derive the optimal transmission frequency. The authors demonstrated that, with the proposed TFAM, vehicles can exchange BSMs with the minimal FoI metric [24].

2.2. Mixed Integer Non-Linear Programming Approaches in UAV-Assisted Wireless Communications

In a recent work, the authors in [25] studied the problem of throughput maximization in cellular communication networks. The problem considers the overlaying of multiple small cells over a macro cell, with multiple small cells providing wireless backhaul and energy harvesting connections. Communication between BSs is enabled by the data links, and energy harvesting nodes are enabled by the energy links. Scheduling these links effectively is crucial to maintaining network performance and minimizing energy consumption [25]. The authors developed a scheduling mechanism and power minimization algorithm for both types of link based on mixed integer non-linear programming (MINLP). Then, a benders decomposition method and a single-stage optimization technique were proposed to maximize the number of scheduled data links while minimizing the transmit power simultaneously. The simulation results showed that the proposed approach achieves near-optimal link scheduling with a reduced number of iterations, when nodes require 0.1 Joules of energy [25].
To minimize the load on traditional ground-cellular systems, drone-assisted wireless networks have led to the emergence of super-flexible, low-altitude platforms. Deploying drone-assisted wireless networks on demand is difficult due to the constraints on drone location, resource provisioning requirements, and demand distribution that must be simultaneously optimized [26]. An autonomous learning framework is proposed to solve the problem by predicting the traffic demand and deploying proactive systems to meet this demand. The method also fine-tunes resources to achieve network planning without manual operations in a dynamic environment. The benders decomposition algorithm and optimal convergence learning are used to optimize the drones’ location and resource provisioning. By reducing the bias caused by traffic demand prediction, a machine-learning algorithm is proposed to minimize the degradation of users’ transmission rates. Simulation results on an open-source dataset validated the superiority of the proposed method compared to the existing baseline solutions [26].
The authors in [27] have proposed a UAV-aided network that creates energy-efficient emergency networks using Terahertz (THz) frequency communication in scenarios where deploying traditional BSs is not feasible. UAVs are used to assist in the deployment of THz-enabled 6G networks and coverage probability is used to measure energy efficiency. The authors derive coverage probability using stochastic geometry tools and propose a method for optimizing energy efficiency [27]. The optimization problem is formulated as an NP-hard problem based on Dinkelbach nonlinear fractional programming. Using a ConCave–convex procedure (CCCP), the NP-hard problem is transformed into a convex optimization problem [27].
The authors in [28] examined UAVs in a wireless communication network that collects data from IoT devices. By optimizing the communication scheduling of IoT devices, UAV trajectory, and transmission bandwidth allocations jointly, the authors aimed to minimize the UAV’s flight time. The authors proposed dividing IoT devices into multiple clusters in order to facilitate data collection by UAVs [28]. There is a high computational complexity to the mixed-integer, non-convex problem. Based on the block coordinate descent (BCD) method and the successive convex approximation (SCA) method, simulation results show that the proposed scheme achieves significant performance gains over baseline solutions [28].
In the context of UAV networks that operate in an environment comprising visual sensor networks (VSNs), the authors in [29] argue that, due to the high energy consumption of wireless nodes in video processing applications, VSNs have a short lifetime. Furthermore, the number of sensors continues to increase, but the deployment and maintenance budgets of UAVs continue to be limited. This makes it important to maximize total weighted target sensor coverage while extending the lifespan of the UAV. The authors investigate the deployment of VSNs assisted by a provision for the UAV to return to the charging stations in order to replenish its battery. The rechargeable UAV is expected to enhance network performance while ensuring longevity of the maintenance budgets [29]. The problem is formulated as am MINLP; a greedy heuristic algorithm and particle swarm optimizer are proposed to solve the MINLP. The simulation results suggest that the proposed method provides a better network performance but takes a longer time to converge [29].
The authors in [30] studied a multi-UAV-assisted data collection problem in wireless sensor networks (WSNs) with different distribution characteristics. The authors considered emergency communication scenarios with stringent data collection and transmission deadlines. The mixed integer non-convex problem is divided into two sub-problems [30]. The first sub-problem optimizes node assignment while the second sub-problem optimizes UAV trajectory subject to the UAV energy constraint [30]. Using an assignment algorithm based on sensor distribution characteristics, the UAV task assignment problem, as well as trajectory and hover position optimization, has been solved. When using the same data size as in existing schemes, the simulation results reported a comparatively shorter data collection time [30].

2.3. UAV Trajectory Optimization for Sum-Rate Maximization and Performance Enhancement

The authors in [31] utilize UAVs as aerial base stations and radio resource managers to enhance channel capacity and provide ubiquitous coverage to ground nodes. The authors hypothesize that UAV positioning and radio resource management affect the performance of the system and user experience [31]. This imposes constraints on the data rates achievable by the ground nodes, the capacity of wireless backhaul links between the UAV and ground BSs, and the power budgets of the BSs. The authors maximize the sum rate achieved with a system involving a ground BS and a number of UAVs [31]. It is computationally NP-hard to solve the mixed-integer, non-convex optimization that optimizes the locations of UAVs, the association between users and BSs, the assignment of access link channels, and the UAV power allocation. Hence the authors proposed a fast, low-complexity algorithm that achieves performance gain compared to the common block coordinate descent-based solution approaches with a lesser execution time [31].
The authors in [32] utilize UAVs as mobile fog computing (MFC) devices to reduce the energy consumption of UAV-empowered MFC systems. The authors consider an NP-hard, nonlinear, non-convex, and mixed-integer problem associated with UAVs, IoT devices, and stop points when constructing the trajectories of UAVs [32]. Based on variable population size and IoT devices associated with stop points, the authors proposed a simulated annealing trajectory optimization algorithm (SATOA). Here, the number and location of stop points is generated and updated randomly [32]. The experimental results on nine different scenarios with 40 to 200 IoT devices demonstrated that SATOA optimized UAVs’ association with stop points and their trajectory. The proposed SATOA method outperformed the state-of-the-art algorithms based on reduced energy consumption [32].
The authors in [33] use UAV assistance and freshness as metrics to minimize the average spatial correlation age of information (SCAoI) of all nodes in a specified region for data collection. Using the maximum communication distance of the nodes as the cluster formation radius, we optimize the number of clusters, UAV flight paths, and the order of data collection from cluster members. The authors propose a maximum-minimum distance clustering algorithm to cluster nodes in a region to get the minimum number of clusters [33]. To obtain minimum flight time for a corresponding trajectory, ant colony algorithm is applied to the NP-hard trajectory optimization problem. When determining the nodes in a cluster, a greedy algorithm is used, and the instantaneous SCAoI of the UAV arriving at the cluster head is calculated. The proposed method was reported to improve the freshness of data and reduce the average SCAoI by 61% [33].
The authors in [34] proposed a mechanism to enhance the performance of C-V2X systems and reduce signaling overhead. The proposed scheme includes a two-timescale vehicle association and resource management, which is a hierarchical optimization problem [34]. When resource re-allocation occurs frequently in C-V2X communications, short-timescale resource management incurs signaling overhead and latency. This decreases the frequency of resource allocation, causing a mismatch between QoS requirements and resources, degrading resource efficiency and decreasing vehicle QoS [34]. The work proposed a short-timescale power control algorithm for the long-timescale, using matching-auction-based vehicle association, spectrum assignment, and power control algorithms. The solution aimed to satisfy various services’ instantaneous QoS requirements. Simulation results showed that the proposed scheme maximizes the system sum-rate, guarantees the users’ QoS requirements, and reduces the signaling overhead [34].

2.4. Task Offloading and UAV-Assisted Vehicular Edge Computing Approaches

The authors in [35] proposed UAV-assisted vehicular edge computing networks (VECNs) to provide computing resources to vehicles in temporary congestion scenarios via line-of-sight (LoS) links to a roadside unit (RSU). By caching data in RSU/UAV, task execution delay and bandwidth costs are reduced. A combination of cached data selection and replacement is proposed to cover a set of vehicles [35]. However, the solution needed a high number of iterative calculations due to the limited storage and computation capacities of UAVs and the dynamic demands of vehicles. The authors examine content caching and service caching to minimize task completion delays for RSUs and UAVs [35]. They optimize the UAV data selection for hybrid caching and the task offload strategy for vehicles using a deep Q-network (DQN). In order for the RSU and UAV to update their caching data separately, a double-DQN (DDQN)-based solution was proposed. The simulation results reported the proposed algorithm to converge faster and reduce task completion delays efficiently [35].
In dynamic and resource-limited vehicular networks with intermittent connectivity and time-varying channel conditions, UAVs are used to enhance connectivity [36]. The authors in [37] address the problem of computation-intensive graph job scheduling, in which vehicles and UAVs communicate frequently. The scheduling problem is modeled as a nonlinear binary programming problem with the objective to minimize average completion delay per job. The solution is based on a multiple-job scheduling scheme that considers each job’s scheduling order [37]. In order to optimize the scheduling order of jobs and task offloading decisions, the remaining processing delay on servers and the available resources on vehicular networks are taken into account. The proposed solution was reported to significantly reduce the average completion delay of jobs [37].
The authors in [38] propose a method to optimize the user schedule, resource allocation, and flight trajectory control. The method considers some realistic constraints on users’ QoS requirements, communication resources, and flight trajectory to ensure a minimum average throughput for all users [38]. By utilizing the UAV’s mobility, mobile users in a dual mobility scenario are provided with controllable coverage. However, as dynamic changes in user scheduling result in the degradation of the user’s QoS, an algorithm is proposed for solving the optimization sub-problems alternately until convergence as the optimization problem is mixed-integer and non-convex. The simulation results were reported to improve the minimum average throughput of mobile users [38].
An analysis of the computation offloading problem in space–air–ground integrated networks (SAGINs) based on hybrid edge-clouds is presented in [39]. A joint optimization is performed on partial computation offloading, UAV trajectory control, user scheduling, edge-cloud computing, radio resource allocation and admission control. Using multi-hop, low-earth-orbit (LEO) satellite communication, the SAGIN consists of multiple UAV-mounted edge servers with controllable UAV trajectory and a cloud server [39]. In order to minimize the weighted energy consumption while satisfying the maximum delay constraints of the computation tasks, a non-convex MINLP optimization problem is proposed. An alternating optimization approach is used to solve four sub-problems: scheduling of users, partial offloading of computing resources, bandwidth allocation, and control of multi-UAV trajectory [39]. UAV trajectory control and feasibility verification strategies are applied to deal with overloaded networks through the SCA method. The SCA approach is further used to solve non-convex computation resource allocation, and bandwidth control as well as the non-convex UAV trajectory control problem [39].
The authors in [40] minimize the completion time in UAV-enabled IoT networks where the UAV collects data generated by IoT devices in several discrete time slots. During each time slot, the UAV’s location remains unchanged as long as the duration of each time slot is less than the predefined threshold [40]. The authors propose optimizing the location, trajectory, velocity, and association scheme of the IoT devices in order to minimize the task completion time of the UAV. Due to the random number of time slots, the authors reformulated the problem as a MDP and proposed a DDPG-based solution [40]. The proposed solution reported fast convergence and low task completion time.

3. System Model

Figure 2 illustrates the 2-layer vehicular communication architecture considered in this paper, where V vehicles denoted by { v 1 , …, v n } are grouped into a cluster, C . Data are transmitted from the vehicles to the drone. In each TTI, only a subset of vehicles is selected by the drone. The packets are either aggregated at the drone upon arrival or held in a queue until the computing server embedded in the drone becomes available. In this work, we simulate periodically transmitted BSMs and Poisson-distributed decentralized CPMs and study the drone utility.
As shown in Figure 2, we consider the number of edge servers ( k e ), packet arrival rate ( λ e ), and packet departure rate ( μ e ). For each vehicle v, the utilization ( ρ e ) of the e t h edge server (ES) is given as:
ρ e = λ e k e μ e
The queuing delay of this ( M / M / k ) network is determined from the steady-state analysis of the Markov chain. The probability of a packet being queued at the e t h ES is:
P Q e = β = k e π β = π 0 k e k e k e ! ρ e k e 1 ρ e
where π β is the steady-state probability that β number of edge servers are occupied. The steady-state probability that the e t h ES is available is:
π 0 = β = 0 k e 1 ( k e ρ e ) β β ! + k e k e k e ! ρ e k e 1 ρ e 1
The queuing delay of the e t h ES is:
E [ T Q e ] = 1 λ e · ρ e 1 ρ e · P Q e
Furthermore, we define p w as the size of the batch of packets arriving at the drone in a transmission window. We denote the queue length at the end of the previous window as ( L w 1 ). In scenarios where the drone’s processor is busy or the queue is full, all the incoming packets cannot be processed by the drone in a TTI. In this case, ( L w 1 ) also indicates the number of packets at the drone at the start of the current window. The number of packets departing the drone in window ( W ) is d w = min { L w 1 , c w } and the number of packets at the drone at the end of window ( W ) is { L w = L w 1 d w + p w }. Here, d w implies the number of packets that depart the queue and c w implies the capacity of the queue. To analyze packet latency and to minimize the sojourn times, we use the M / M / k service discipline to model the order in which packets arrive at the queue [12]. According to the recent releases by 3GPP and the underlying specifications, the transmission window is limited by maximum latency. A packet must be transmitted to the drone within this window based on the steady-state probability ( π 0 ) of the wait time represented by ( L w 1 ) equiprobable states. The main symbols and parameters used in this paper are briefly described in Table 1.

4. Problem Formulation

Based on the approach detailed by the authors in [41], we vary the service time and compute drone utilization ( U ), where the service time is exponentially distributed. We formulate the delay minimization problem as an MDP. Moreover, we utilize the relative value iteration (RVI) algorithm to measure transmission latency [42]. As vehicles continuously sense and transmit data, the outcomes of the previous transmission windows do not influence the next transmission window at a vehicle. At the drone, due to a single queue for both BSMs and CPMs, the state of previous outcomes influences the future delay over a finite state space. The delay minimization problem ( P 1 ) is formulated in Equation (5) as:
P 1 : w 1 ( Minimize Ψ v i D ) + w 2 ( Maximize P u Ψ = 1 N u Ψ u )
where ( Ψ v i ) is the size of the data transmitted from vehicle v, accumulated at the i t h ES, and ( D ) is the average delay. Along with delay minimization, the problem (P1) aims to simultaneously maximize the number of packets ( P u ) transmitted to the drone. Here, ( Ψ u ) is the size of packets arriving at the drone and ( N u ) implies the number of packets arriving at the drone in a single transmission window, subject to the following constraints:
C 1 : ρ i < 1 , n ES ,
C 2 : P Q i < α , n ES ,
C 3 : Ψ v i { 0 , 1 } , v V , n UAV ,
C 4 : N u i c w , n UAV ,
C 5 : u = 1 N u n Ψ u < Ψ n , n UAV ,
C 6 : UAV u { 0 , 1 } , u U ,
C 7 : w 1 + w 2 = 1
The constraint C1 ensures that the utilization of each ES in Equation (1) remains below 100% to prevent queue overflow. The constraint C2 ensures that the queuing probability in Equation (2) at the i t h ES remains below a predefined value ( α ). In C3, the binary value 1 indicates that the data from the vehicles have arrived at the drone for processing, and the binary value 0 indicates queuing. The constraint C4 ensures the number of packets transmitted from a vehicle i do not exceed the capacity of the queue at the drone. The constraint C5 implies the number of packets at the drone remain below the front-haul capacity of the drone, which is limited by the drone’s battery power. In C6, the drone utility operator is introduced. The constraint C7 indicates that the weight values in the delay minimization problem ( P 1 ) in Equation (5) should add to unity. The non-linearity in C2 and the binary variable in C3 formulate ( P 1 ) as a mixed-integer, non-linear programming problem. Overall, the problem ( P 1 ) is a multi-objective optimization problem where allocating resources to one vehicle affects the resources allocated to other vehicles. We vary the transmission window size ( L w ) and study its impact on the resulting queue length. The problem is an MINLP and a N P -hard problem [43]. As the simultaneous objective of delay minimization and maximizing data rate is a non-convex optimization problem, we further decompose the problem into two optimization sub-problems.

5. Proposed Solution Approach Based on DTMC Analysis

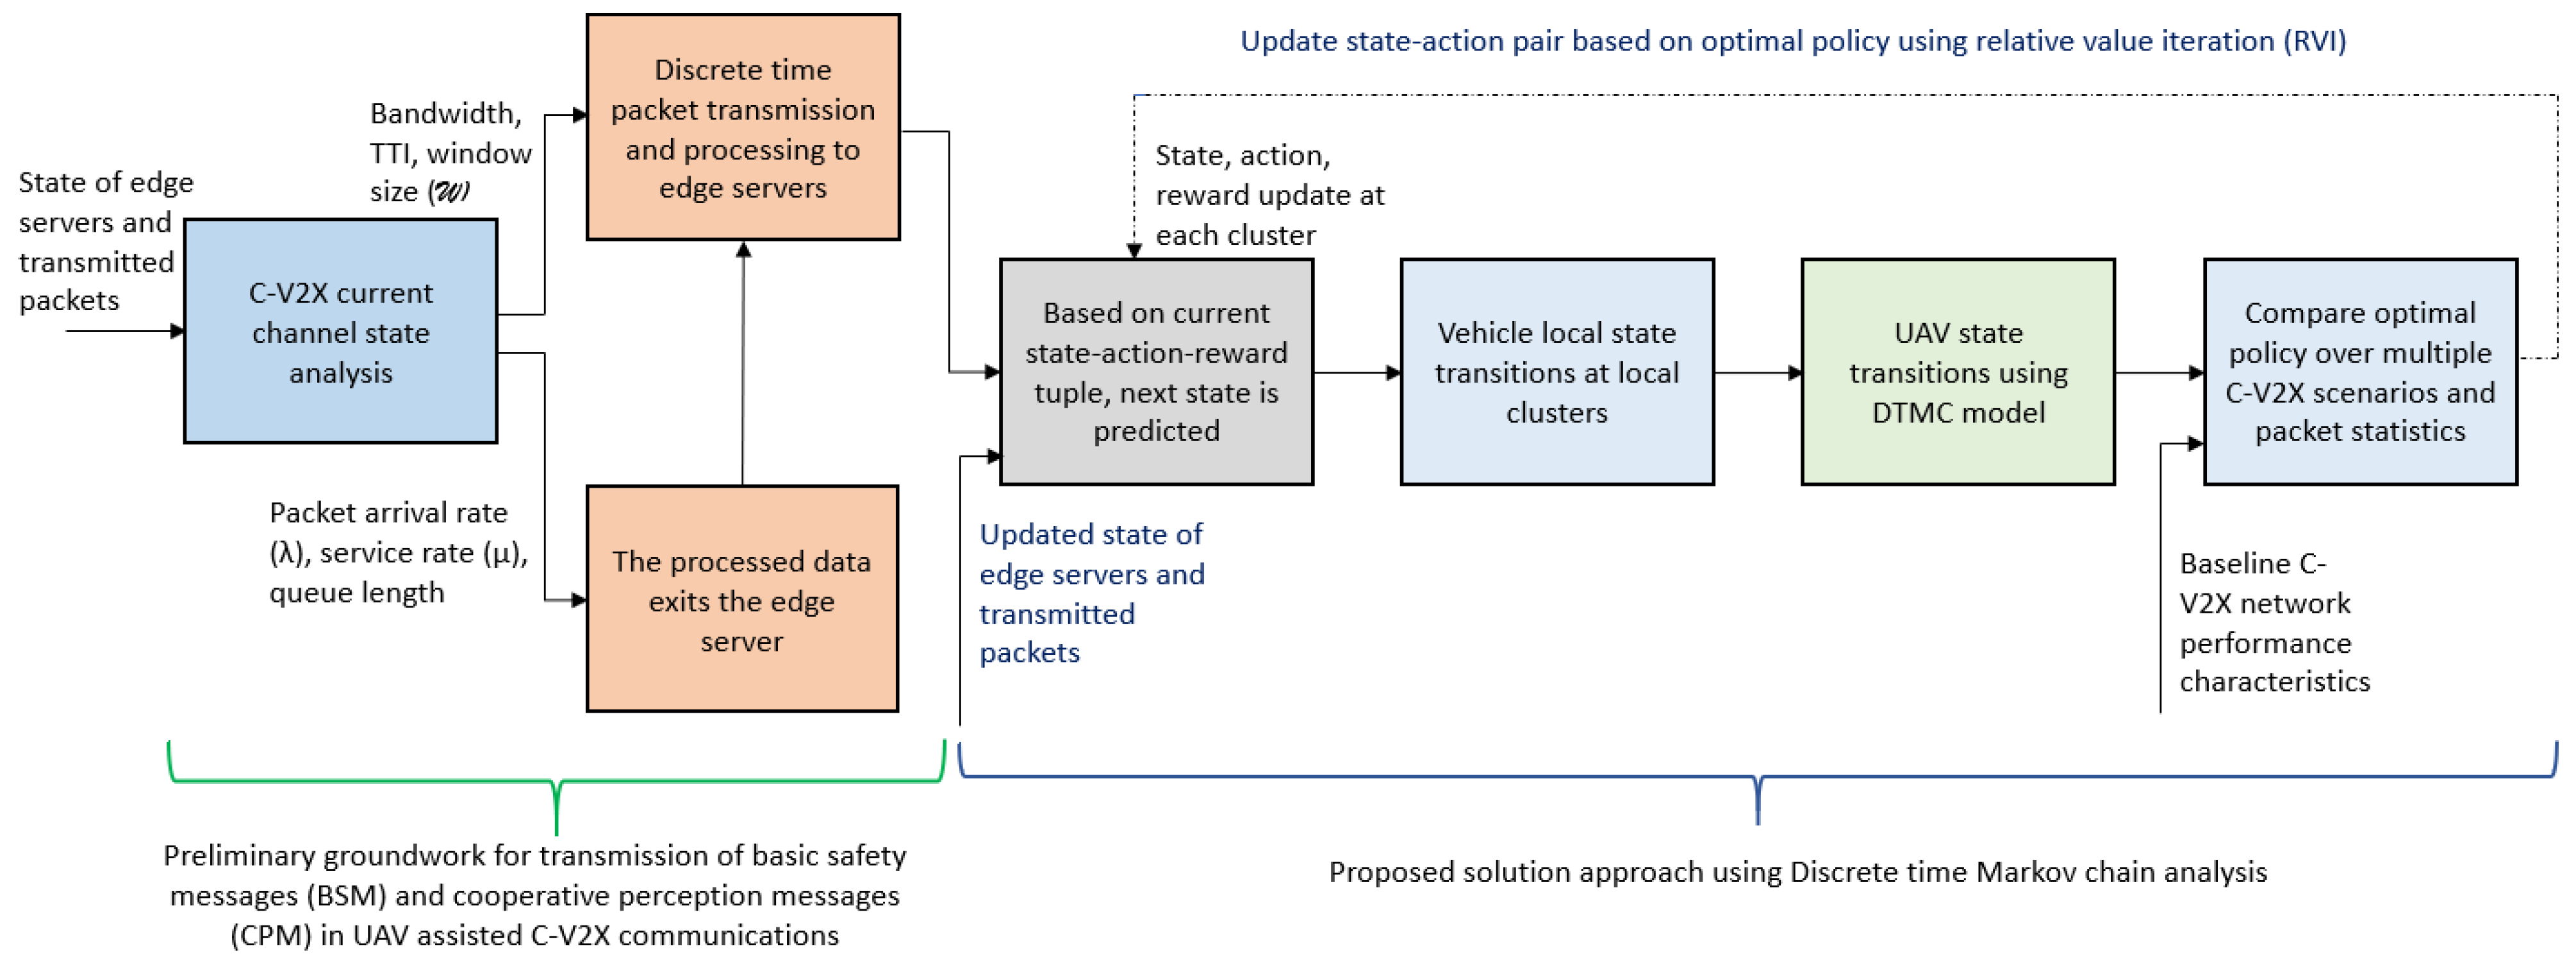
This paper proposes a DTMC-based approach to analyze drone and vehicle communication states to find an optimal latency of data transmissions for multi-objective situations. The vehicles sense the data and communicate the data to the drone in the form of BSMs and CPMs. The drone processes the BSMs and CPMs and intermittently transmits the processed data to the vehicles, and the process repeats based on the agents’ intermittent state-transitions. In this paper, the DTMC agents are the vehicles and the drone. It is possible for the agents to have partial information about the states of the other agents. The vehicles attempt to communicate frequently with the drone, thus consuming the drone’s resources. Whenever a vehicle establishes communication with a drone in a TTI, other vehicles wait to gain access to the drone’s resources. The drone’s utility is a factor of available battery power, percentage of processed packets, and queue length. The proposed solution approach is represented as a block diagram in Figure 3.

5.1. Intermittent States of Vehicles and State-Transitions During Communication with Drone

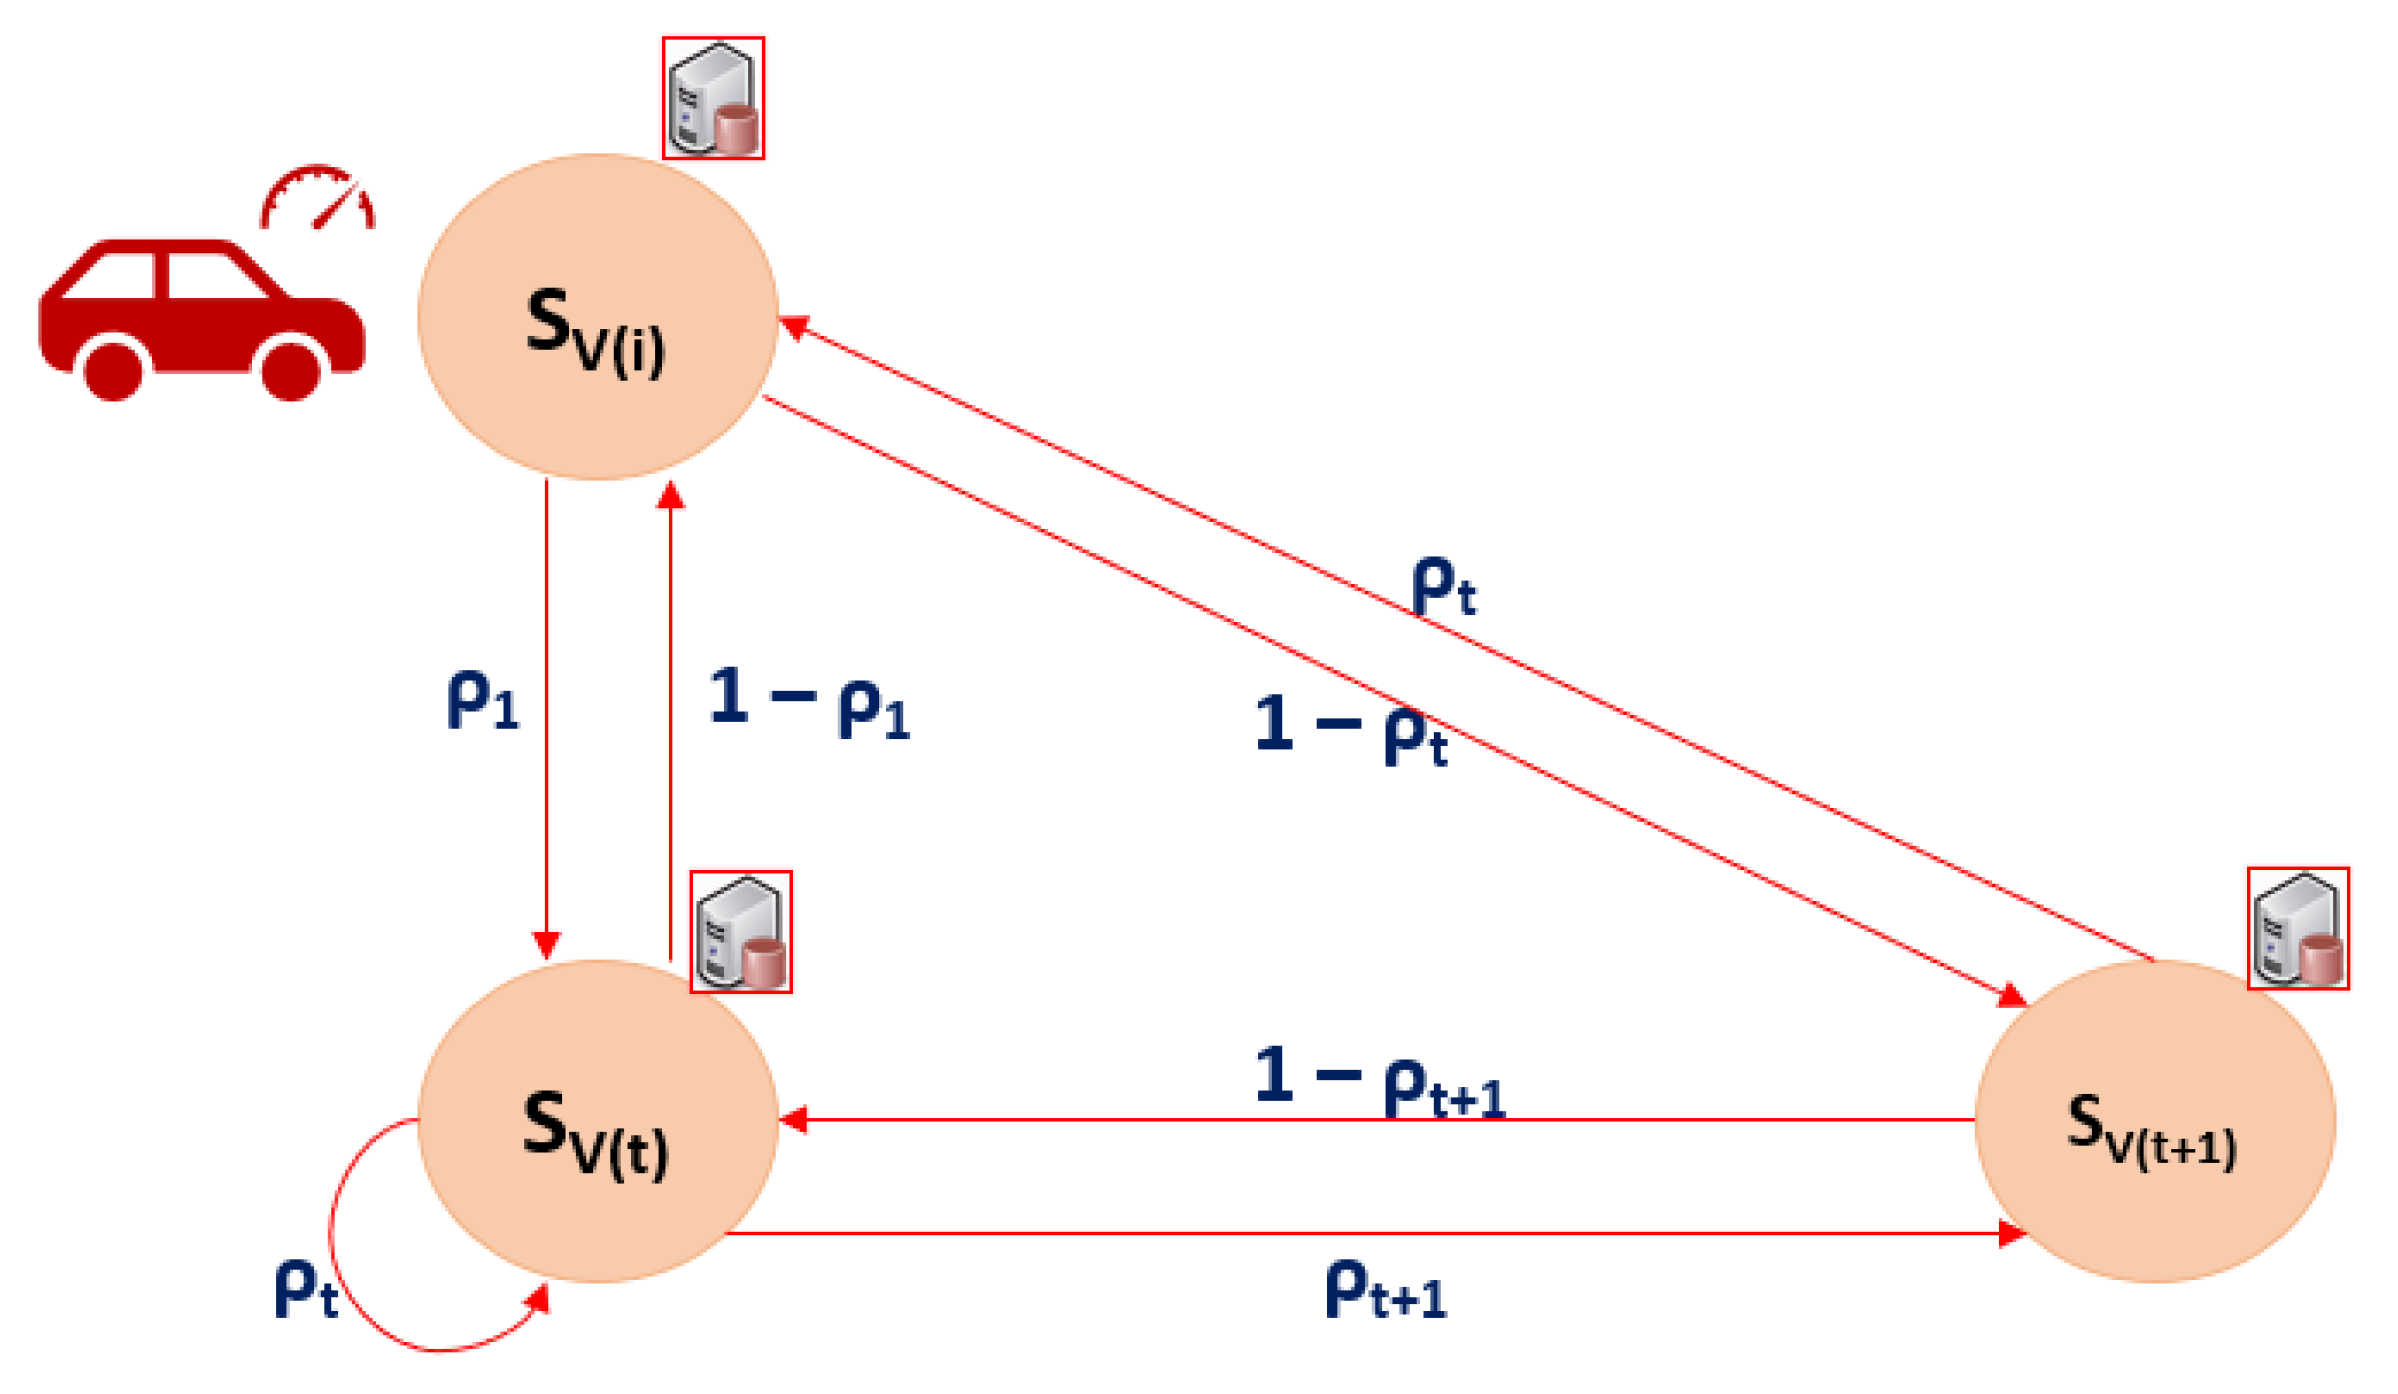
We analyze the intermittent states and state-transitions using a DTMC for SPS mode 4 where the smallest transmission window is 1 ms. The i t h entry of the Markov kernel between the neighboring data streams is sampled to generate a random vector Ψ ( w ) , which implies the size of the data transmitted in window (w). Figure 4 illustrates a state-transition model for an ES with utilization ( ρ ) and three states: ( S i ), ( S t ), and ( S t + 1 ). Here, (P) is the transition matrix for a regular Markov chain with data vector ( Ψ ). For an initial state ( S i ) and initial data vector ( Ψ ), Ψ P n Ψ as n , where (n) implies number of state transitions. The Markov chain { ζ = ζ 0 , ζ 1 , , ζ n } describes the initial ES states and Markov chain { ϱ = ϱ 0 , ϱ 1 , , ϱ n } describes the drone states with finite state-transition probability, where ζ and ϱ are independent processes. In a transmission window of length L w , the vehicles and the drone can transition from a state ( s ζ a , s ϱ a ) to any other state ( s ζ k , s ϱ k ) .
Moreover, ζ ( a ) is a random variable with expectation E ( ζ ( a ) ) = p i j ( a ) . As per constraint C3, P ( ζ ( a ) = 1 ) = p i j ( a ) and P ( ζ ( a ) = 0 ) = 1 p i j ( a ) , where p i j ( a ) is the i j t h entry of P ( a ) . In Figure 4, the expected number of times the chain arrives at state ( s ζ a ) during the first (b) steps from initial state ( s ζ ), is E ( ζ ( 0 ) + ζ ( 1 ) + + ζ ( b ) ) = p i j ( 0 ) + p i j ( 1 ) + + p i j ( b ) for a set of states, S = { s 1 , s 2 , , s ζ } . The steady-state probability distribution is
π S ζ = ( 1 p ) ζ 1 ( 1 p ) b · π S ζ
and
π S ζ + 1 = ( 1 p ) ζ + 1 1 ( 1 p ) b · π S ζ + 1
where (p) denotes the steady-state probability of successful transmission of packets from the vehicles to the drone without queuing.

5.2. Impact of Drone Server Occupancy on State Transitions

At a specific flying altitude and while spanning a stochastic trajectory, the drone’s ability to process incoming packets depends on factors such as percentage of packets being processed from the previous window, current packet arrival rate, and packet size. The available battery power also limits the drone’s ability to serve the number of vehicles in a transmission window. We use the term ( D p m ) to indicate a process where the drone is busy processing a packet ( m 1 ) when packet (m) arrives at the drone. The process ( D ¯ p m ) implies an arrival of packet (m) at the drone. Then, the drone state space s u a v ( t ) is represented as ( δ u a v ( t ) , u b ( t ) , u s ( t ) , U b ( t ) , U s ( t ) , Δ U b ( t ) , Δ U s ( t ) ) , where δ u a v ( t ) is the time spent by packets in the queue waiting to arrive at the drone. The binary variable u b ( t ) { 0 , 1 } implies an occupancy indicator for the drone’s buffer queue and u s ( t ) { 0 , 1 } is a binary variable that implies the drone’s occupancy indicator.
In addition, the term U b ( t ) { 0 , 1 } is an occupancy indicator for the transmission queue and U s ( t ) { 0 , 1 } implies a cumulative occupancy indicator for the drone in a TTI. The term Δ U b ( t ) is the status update at the drone, whereas Δ U s ( t ) is the duration a packet is processed at the drone. The four occupancy indicators u b ( t ) , u s ( t ) , U b ( t ) , and U s ( t ) imply that the drone has a current status update of its occupancy as well as of the queue and buffer states. These indicators establish a performance bound for learning policies in the RVI method. For instance, for a state s u a v ( t ) , the combinations ( u b ( t ) , u s ( t ) ) = ( 1 , 1 ) or ( u s ( t ) , U s ( t ) ) = ( 1 , 1 ) or ( U b ( t ) , U s ( t ) ) = ( 1 , 1 ) imply an action a ( t ) that the packets are not transmitted to the drone as it is fully occupied. The selected action in a transmission window t is a ( t ) A = { 0 , 1 } , where a ( t ) = 1 indicates a packet being transmitted at the beginning of transmission window t, and a ( t ) = 0 indicates a later transmission. For an initial state s ( 0 ) S , the policy ( π ) is defined as
V π ( s ( 0 ) ) = lim T 1 T t = 0 T 1 E ( δ ( t ) s ( 0 ) )
where the expectation ( E ( δ ( t ) s ( 0 ) ) ) is measured with respect to the selected action in a transmission window and the variation in the time taken to serve each packet at the drone. The goal in Equation (15) is to calculate an optimal policy ( π * ) that leads to minimum long-term average delay. Whenever a drone server is in a busy state, new packets will be queued for a finite time until the drone becomes available. The above MDP is described by the tuple ( S , A , P s u a v ( t + 1 ) s u a v ( t ) , a u a v ( t ) ) , C s u a v ( t ) , a u a v ( t ) . Here, C ( s u a v ( t ) , a u a v ( t ) ) implies the cost of selecting an action a u a v ( t ) when the drone is in the state s u a v ( t ) . We specify this cost, C ( s u a v ( t ) , a u a v ( t ) ) = δ ( t + 1 ) , as the accumulated delay in transmission window t + 1 when a particular state-action pair is selected. In this scenario, the state-transition probability P s u a v ( t ) s , a = P s u a v ( t + 1 ) s ( t ) , a ( t ) indicates the probability of the agent transitioning from the current state s = s ( t ) to the next state s ( t ) = s ( t + 1 ) upon selecting an action a = a ( t ) . The term φ indicates an irrelevant delay when the drone is idle. In this scenario, the transition probability from state s = ( δ u a v , u s , U s , Δ s ) to a specific next state s ( t ) = ( δ u a v ( t ) , u s ( t ) , U s ( t ) , Δ s ( t ) ) upon selecting an action a is described in Equation (16) as:
P ( s u a v ( t ) s u a v ) = 1 , s u a v ( t ) = ( [ δ ] Δ , 0 , 0 , φ ) ; R { 0 , 1 } f { λ , μ } , s u a v ( t ) = ( [ δ ] Δ , 0 , 1 , 0 ) ; R { 0 , 1 } f { λ , μ } , s u a v ( t ) = ( [ δ ] Δ , 1 , 0 , φ ) ; R { 0 , 1 } f { λ , μ } , s u a v ( t ) = ( [ δ ] Δ , 0 , 1 , 0 ) ; R { 0 , 1 } f { λ , μ } , s u a v ( t ) = ( [ δ ] Δ , 1 , 0 , φ ) ; 0 , otherwise .
where R { 0 , 1 } indicates a real number between 0 and 1. The term f { λ , μ } implies a function that depends on packet arrival rate and service rate. Note, the packets randomly arrive from the vehicles to the drone. Consequently, due to varying packet arrival and service rates, it is possible for a vehicle or drone to return to a previous state in the next transition. The term [ δ ] Δ is the processing delay experienced by a packet following the queuing delay, and the optimal policy for the state change with minimal delay is:
π * ( s u a v ( 0 ) ) = arg min π { lim T 1 T t = 0 T 1 E [ R ( s u a v ( t ) , a u a v ( t ) ) s u a v ( 0 ) ] }
We solve Equations (17) and (18) recursively to find the optimal policy. Note, according to Equations (17) and (18), for a given initial state of the drone ( s u a v ( 0 ) ), there are a set of optimal values ( V s * ) for all states ( s S ) that meet the condition:
V s * = min a A { R ( s , a ) + s u a v ( t ) S P ( s u a v ( t ) s , a ) V s ( t 1 ) * }
where, for an initial value V π * ( s ( 0 ) ) , the action a A attains minimum delay at an optimal policy π * s u a v ( 0 ) . For utilization less than 100%, i.e., for ρ 1 and for 0 μ 1 , the state ( δ , 1 , 0 , φ ) is accessible from any other state. On the contrary, for 100% utilization, i.e., ρ = 1 and 0 μ 1 , the state ( δ , 0 , 1 , Δ ) is accessible from any other state. For example, in a current state where a packet is already waiting to be processed at the drone, the probability of an unsuccessful transmission in ( L w ) for the next consecutive transmission windows is non-zero.
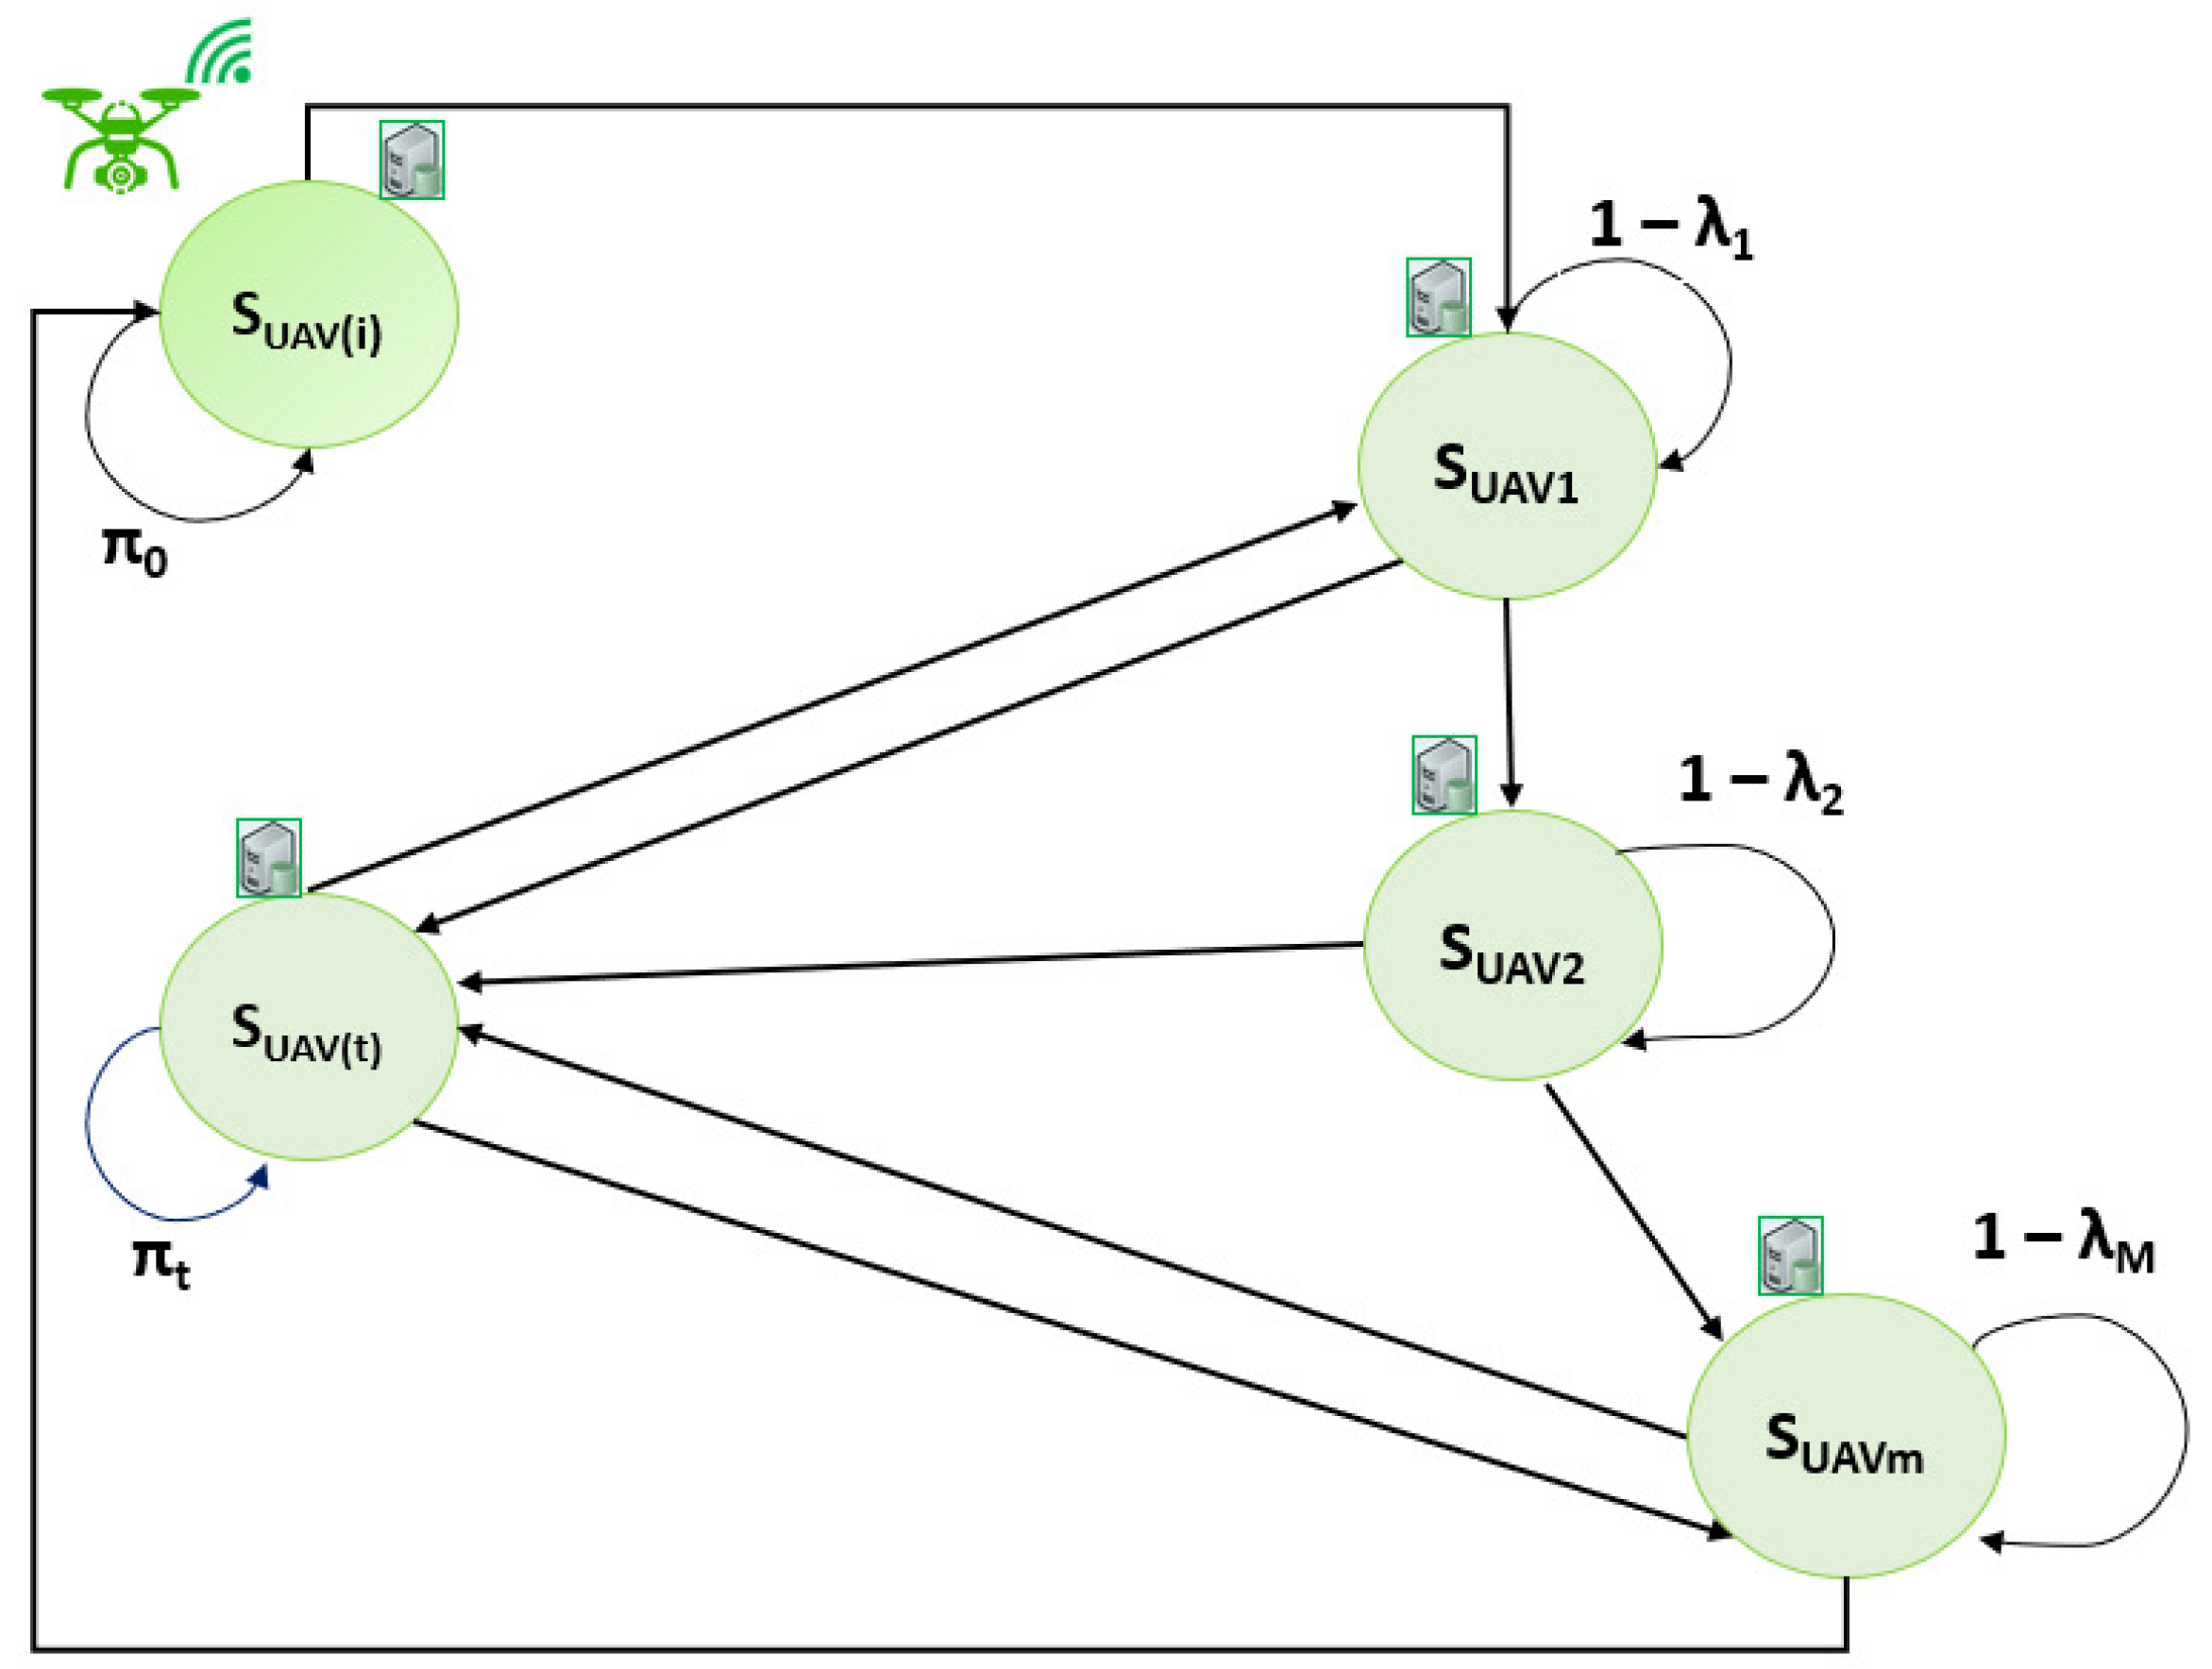
As illustrated in Figure 5, a state s = ( δ , 0 , 0 , φ ) implies an idle drone for different μ and λ values. When current delay ( δ ) is lower than a specified threshold, the optimal action for the drone is to remain idle and not accept new packets for processing. When the delay exceeds the specified threshold, an optimal action is to transmit the processed data from the drone to the vehicle’s ES. When the drone service rate μ increases, the delay threshold decreases. For varying values of λ and μ , the average delay (ms) based on an optimal policy obtained using RVI is discussed in the following section. When λ increases, the optimal policy leads to longer wait times for incoming packets. The optimal action set is determined for s = ( δ , 0 , 0 , φ ) (i.e., empty processor at the drone), s = δ , 0 , 1 , φ (a packet at the ES), and s = δ , 0 , 1 , φ (a packet at the drone). For an empty drone which currently does not have any packets to serve, the optimal policy is to remain idle to conserve the drone energy until a significant number of packets arrive at the drone’s computing server. For varying numbers of packets at the drone and the vehicle’s ES, the optimal action at initial state s = ( δ , 0 , 0 , 1 , 0 , ψ , ψ ) and subsequent states is identified using RVI to minimize the delay in the current transmission window.

5.3. State-Transitions and Transition Probability

BSMs are periodically broadcast by each vehicle to provide information regarding their location co-ordinates, position on the road, velocity, and traffic status. CPMs are event-triggered messages that pertain to an emergency event or a hazardous driving condition. CPMs are modeled as a Poisson process of rate ( λ ) arrivals per unit time, where the number of arrivals in a time interval of length t is ( λ t ) and the number of arrivals in disjoint time intervals are independent. Note, the probability of state transition at t ( n + 1 ) depends only on state at time t ( n ) . Each state is a function of ( Ψ , l ) , where Ψ { 0 , , Ψ } is a stochastic process which represents Ψ packets and l { 0 , , L } is a stochastic process which represents that l transmission windows have passed since the initial transmission. Here, ( T n ) is the time of arrival of the ( n t h ) packet relative to a starting time (0) and ( N t ) is the number of packets that arrive in [ 0 , t ] . Then, the distribution of T 1 in the event T 1 > t , the event that a packet waits more than t seconds to obtain the first CPM packet, is the same as the event N t = 0 . This implies the event when there are no CPM packets in the first t seconds as follows:
P ( T 1 > t ) = P ( N t = 0 ) = e λ t P ( T 1 t ) = 1 e λ t
For instance, let us consider the scenario of determining the probability ( p i j ( 2 ) ) which indicates if the Markov chain is in state (i) at time (t), it will be in state (j) in the next two windows. If it is a BSM packet in the current transmission window, then the event that it is a CPM in the next two windows is the disjoint union of the following three events:
  • BSM in the next arrival and CPM in the subsequent arrival.
  • CPM now and BSM in the next arrival.
  • BSM now and BSM in the next arrival.

6. Simulation Results and Discussion

We consider the Manhattan mobility model and assume an average vehicle speed of 50 km/h and an average inter-vehicle distance of 50 m. Here, BSMs and CPMs are utilized for communication, and their reference packet formats are specified by the SAE. We consider a BSM packet inter-arrival time between 100 ms and 1 s. The inter-arrival time of the event-triggered CPM is modeled as a Poisson process, and the average repetition frequency of CPM packets is varied from 100 to 500 ms, with average number of packet re-transmissions between 1 and 5. The packet arrival rate ( λ ) is varied from 1000 to 2000 packets/s. Table 2 lists the main parameters used in the simulations.

6.1. Variation of Average Delay with Inter-Arrival Time of BSM

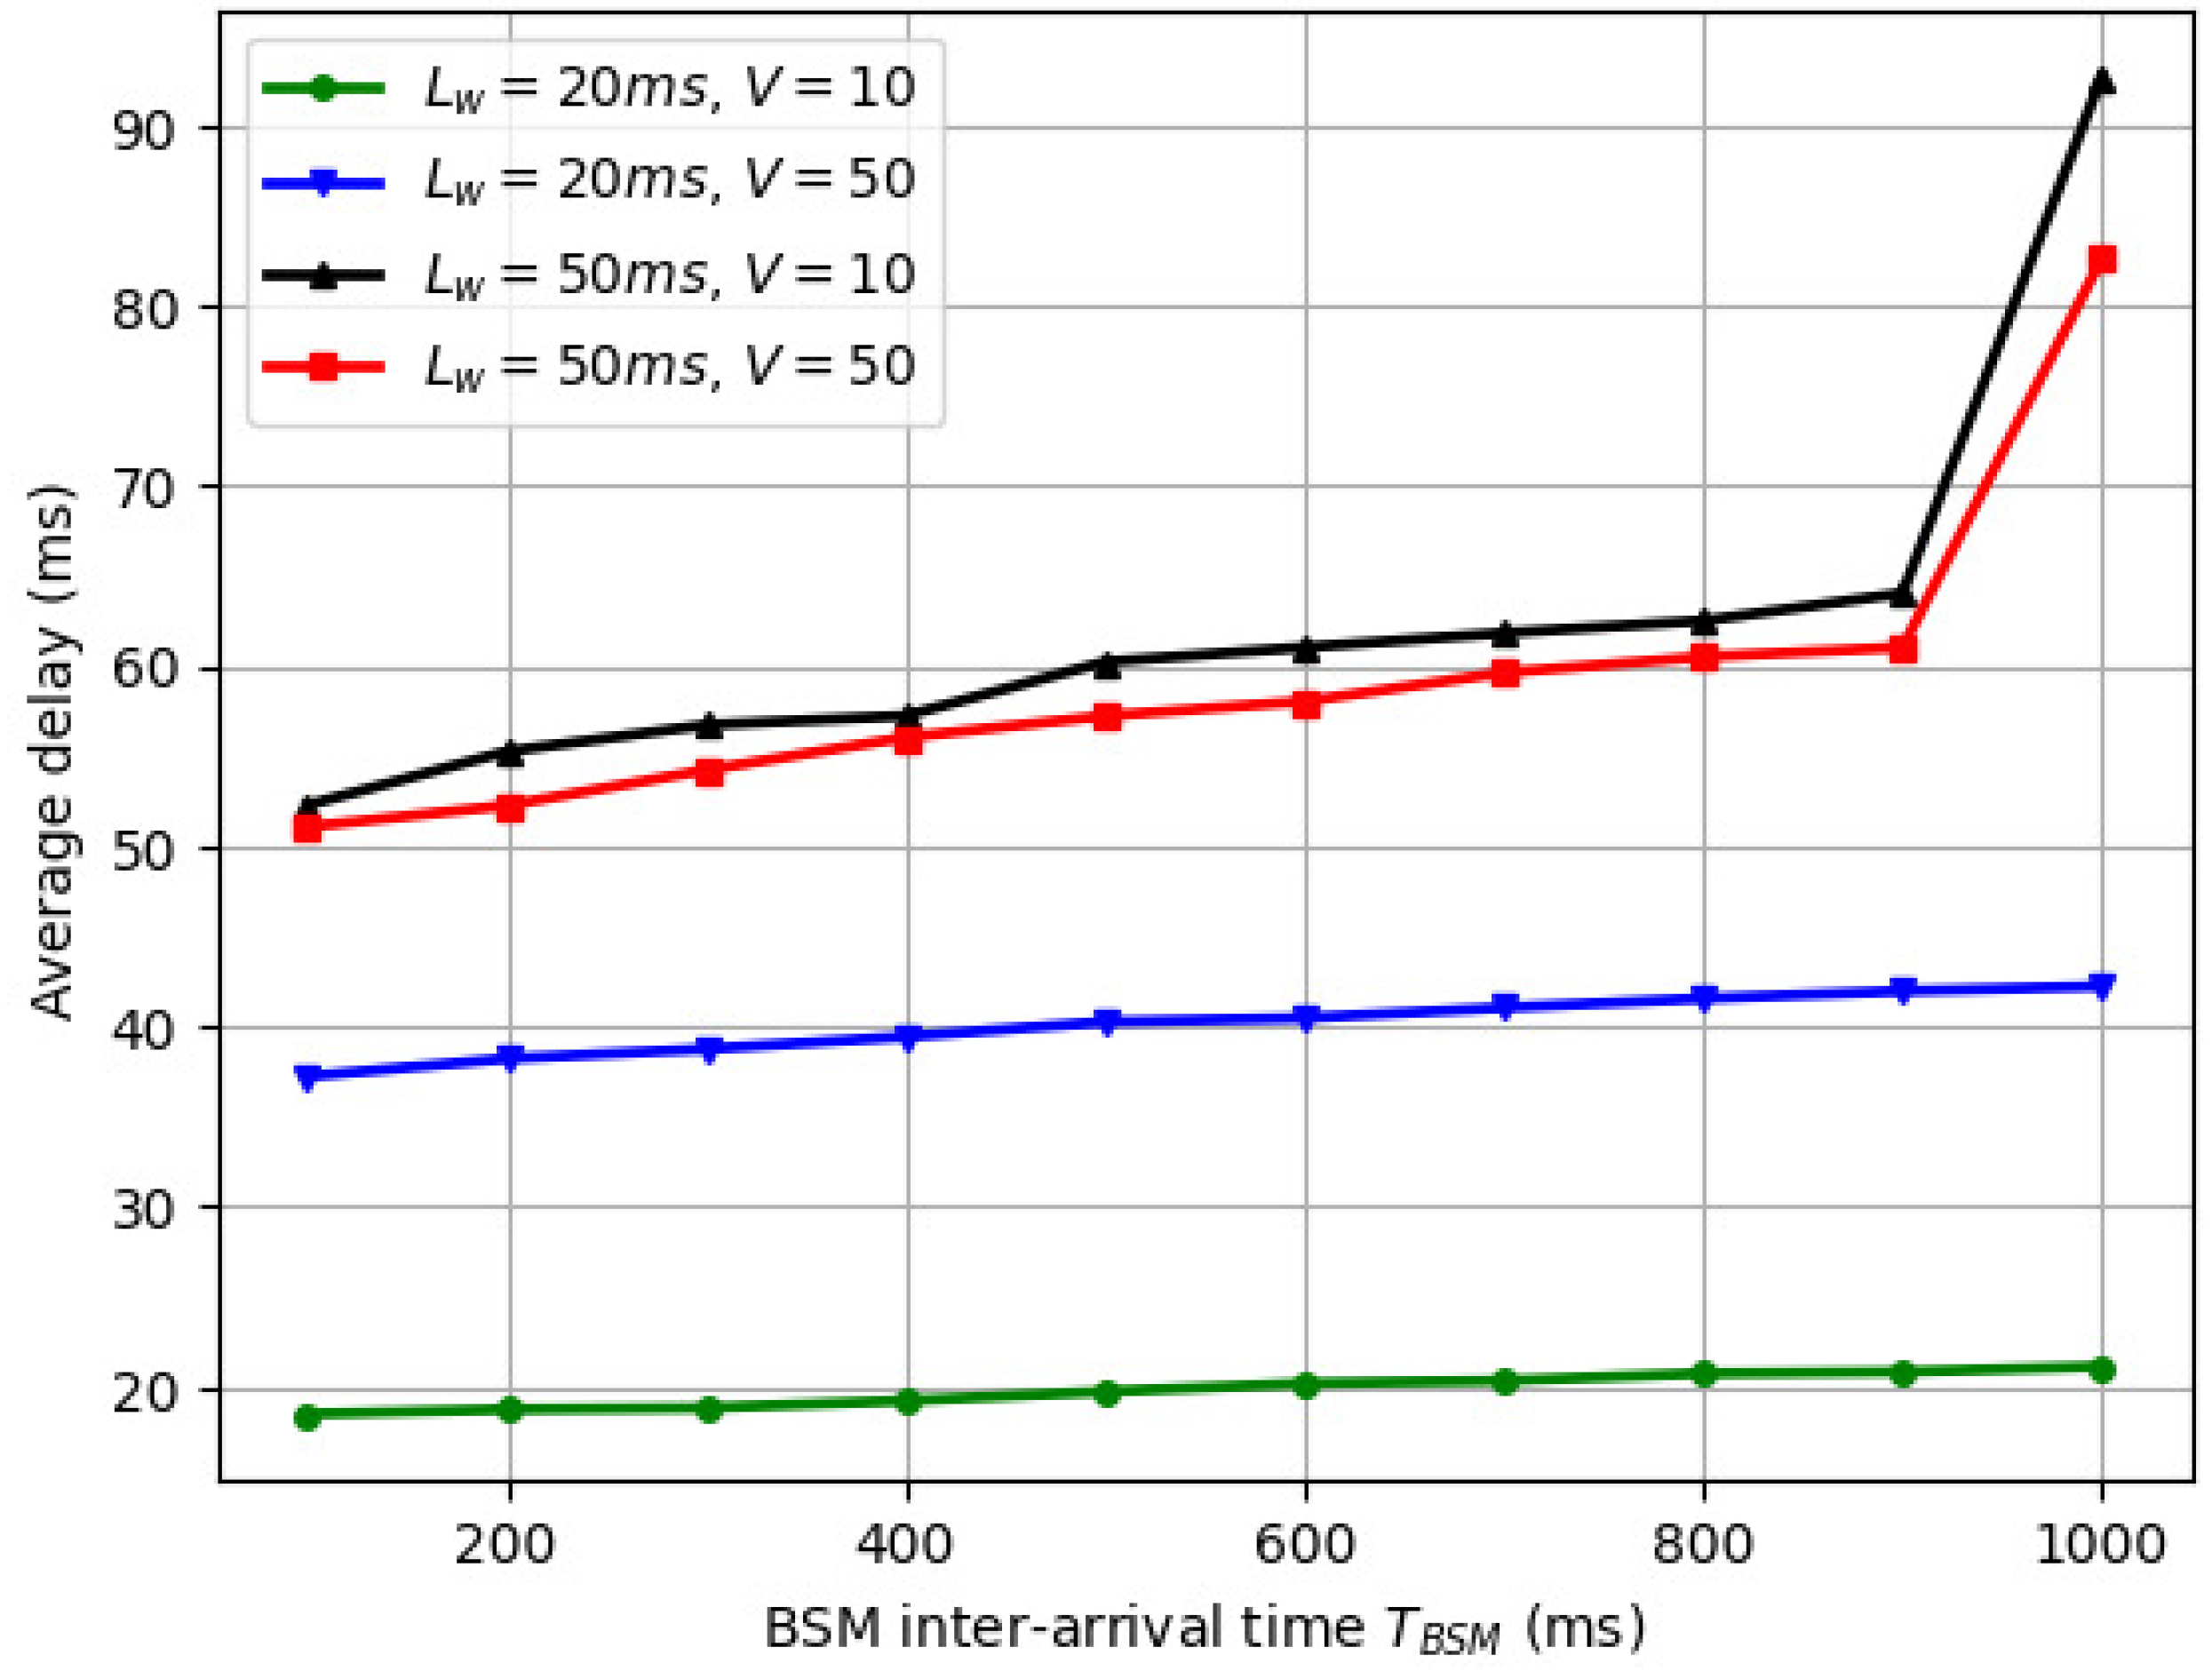
BSMs are periodically transmitted messages that are transmitted at a fixed interval. The BSMs contain the useful driving scene information required for safe vehicle navigation, but the messages are of a non-critical nature. The variation of average delay with the inter-arrival time of BSMs is illustrated in Figure 6 for V = 10 and V = 50 . We vary ( L w ) from 20 ms to 50 ms and study the delay experienced by various packets. The average delay does not vary significantly with the increase in number of vehicles in a cluster. This is because sufficient resources are available for the vehicles to communicate with the drone.
For L w = 20 ms and V = 10 , the mean time spent by the packets in a queue is between 15 ms and 25 ms. When T B S M is varied from 1 ms to 1000 ms, for L w = 40–50 ms and V = 50 , the delay gradually increases from 40 ms to 60 ms. For V = 50 , the delay sharply rises with incoming packets as the drone resources are shared between multiple vehicles. For all L w and T B S M pairs, the average delay gradually increases when the frequency of packet arrival increases. Furthermore, increasing the number of vehicles that can sense the available subframe also increases the average delay.

6.2. Variation of Average Packet Delay for BSMs with Number of Vehicles (V), Varying Vehicle Speed, and Road Length ( R L )

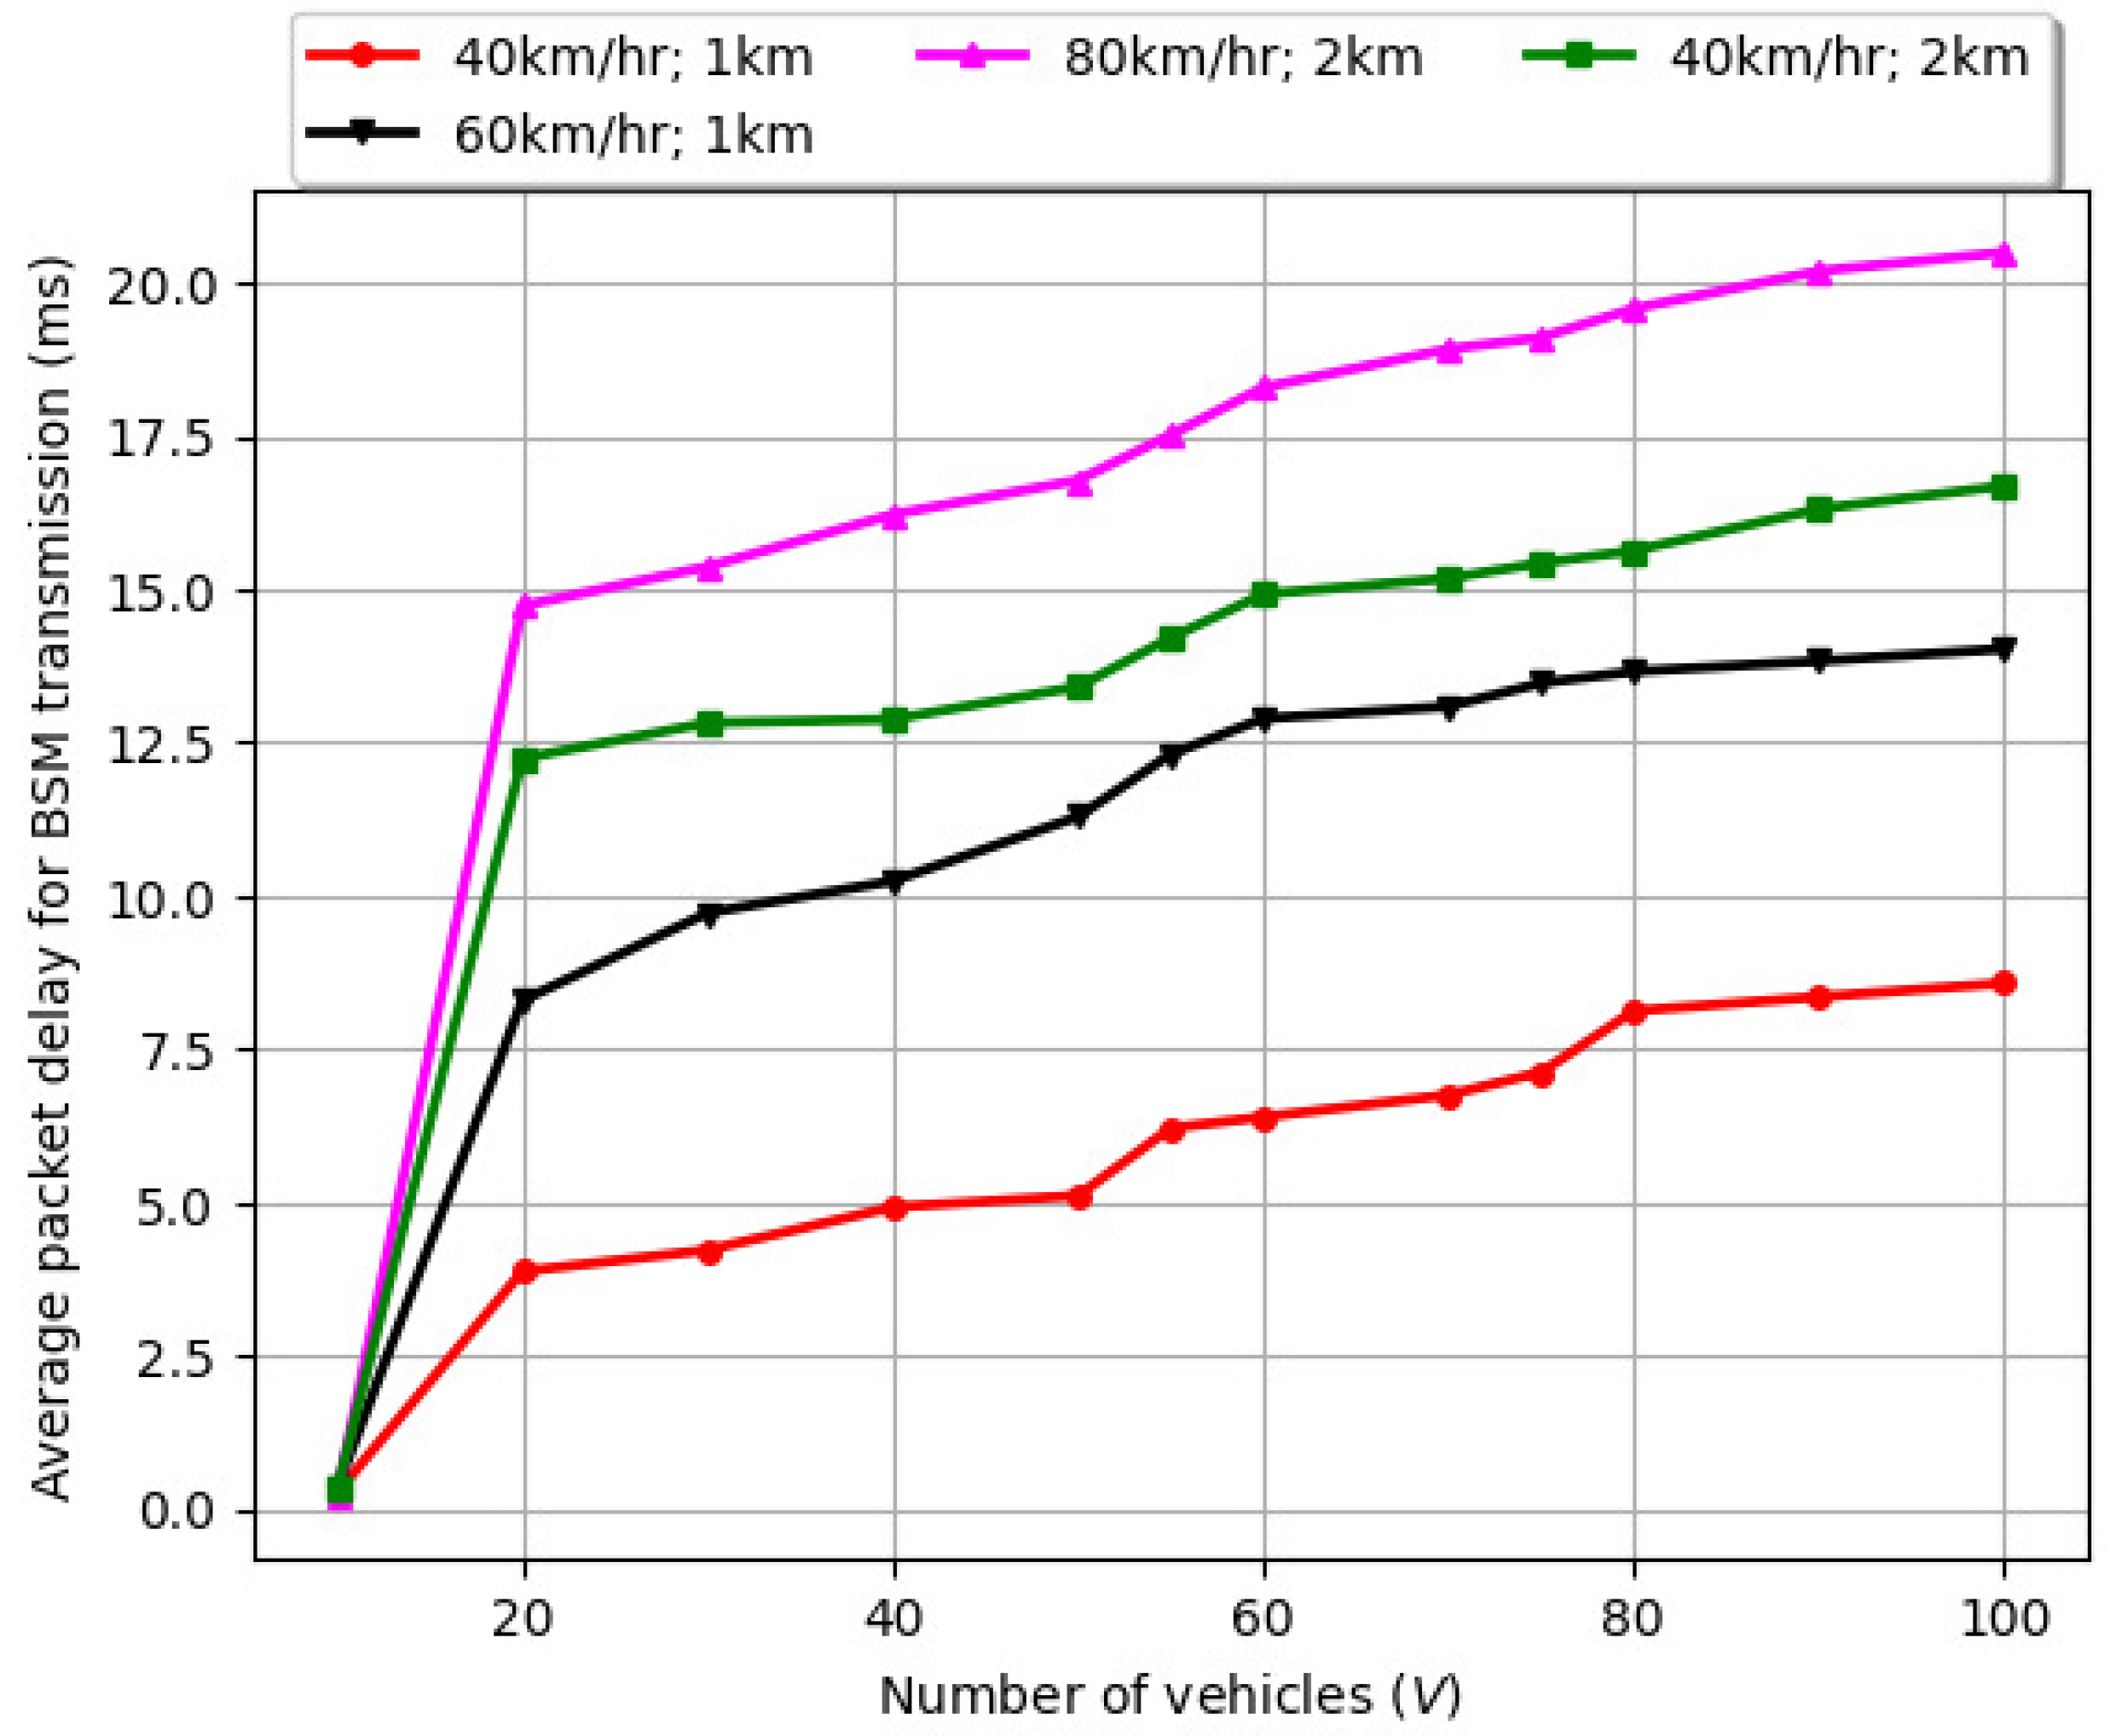
The average delay experienced by a packet in the BSM transmission scenario is illustrated in Figure 7. Here, the vehicle velocity is varied as 40 km/h, 60 km/h, and 80 km/h. We vary the number of vehicles (V) from 1 to 100 and select road length ( R L ) to be 1 km and 2 km. We note that for L w = 20 ms, T B S M = 1000 ms, vehicle velocity = 40 km/h, and R L = 1 km, the maximum average packet delay for 100 vehicles is approximately 8.5 ms. This comparatively lower value of average delay is attributed to the higher inter-arrival time ( T B S M = 1000 ms), which restricts the packet arrival rate to being significantly low. Hence, an incoming packet has a higher probability of being processed by the drone without being queued.
For L w = 20 ms, T B S M = 1000 ms, and velocity = 40 km/h, when R L is changed to 2 km, the maximum average packet delay for 100 vehicles is approximately 16.5 ms. This comparatively higher value of average delay is attributed to the inter-arrival time ( T B S M = 1000 ms) over a longer R L . Here, the packet arrival rate is greater than that in the case of R L = 1 km, and hence an incoming packet has a higher probability of being queued before being processed by the drone. Similarly, when the vehicle velocity is increased to 60 km/h for R L = 1 km, the maximum average packet delay for 100 vehicles is approximately 13.5 ms. When the vehicle velocity is further increased to 80 km/h for R L = 2 km, the maximum average packet delay for 100 vehicles is approximately 20.5 ms. Furthermore, for V = 1–20, there is a sharp increase in the maximum average packet delay experienced by a packet. For V = 20–100, the maximum average packet delay experienced by a packet gradually increases with V and the road length ( R L ).
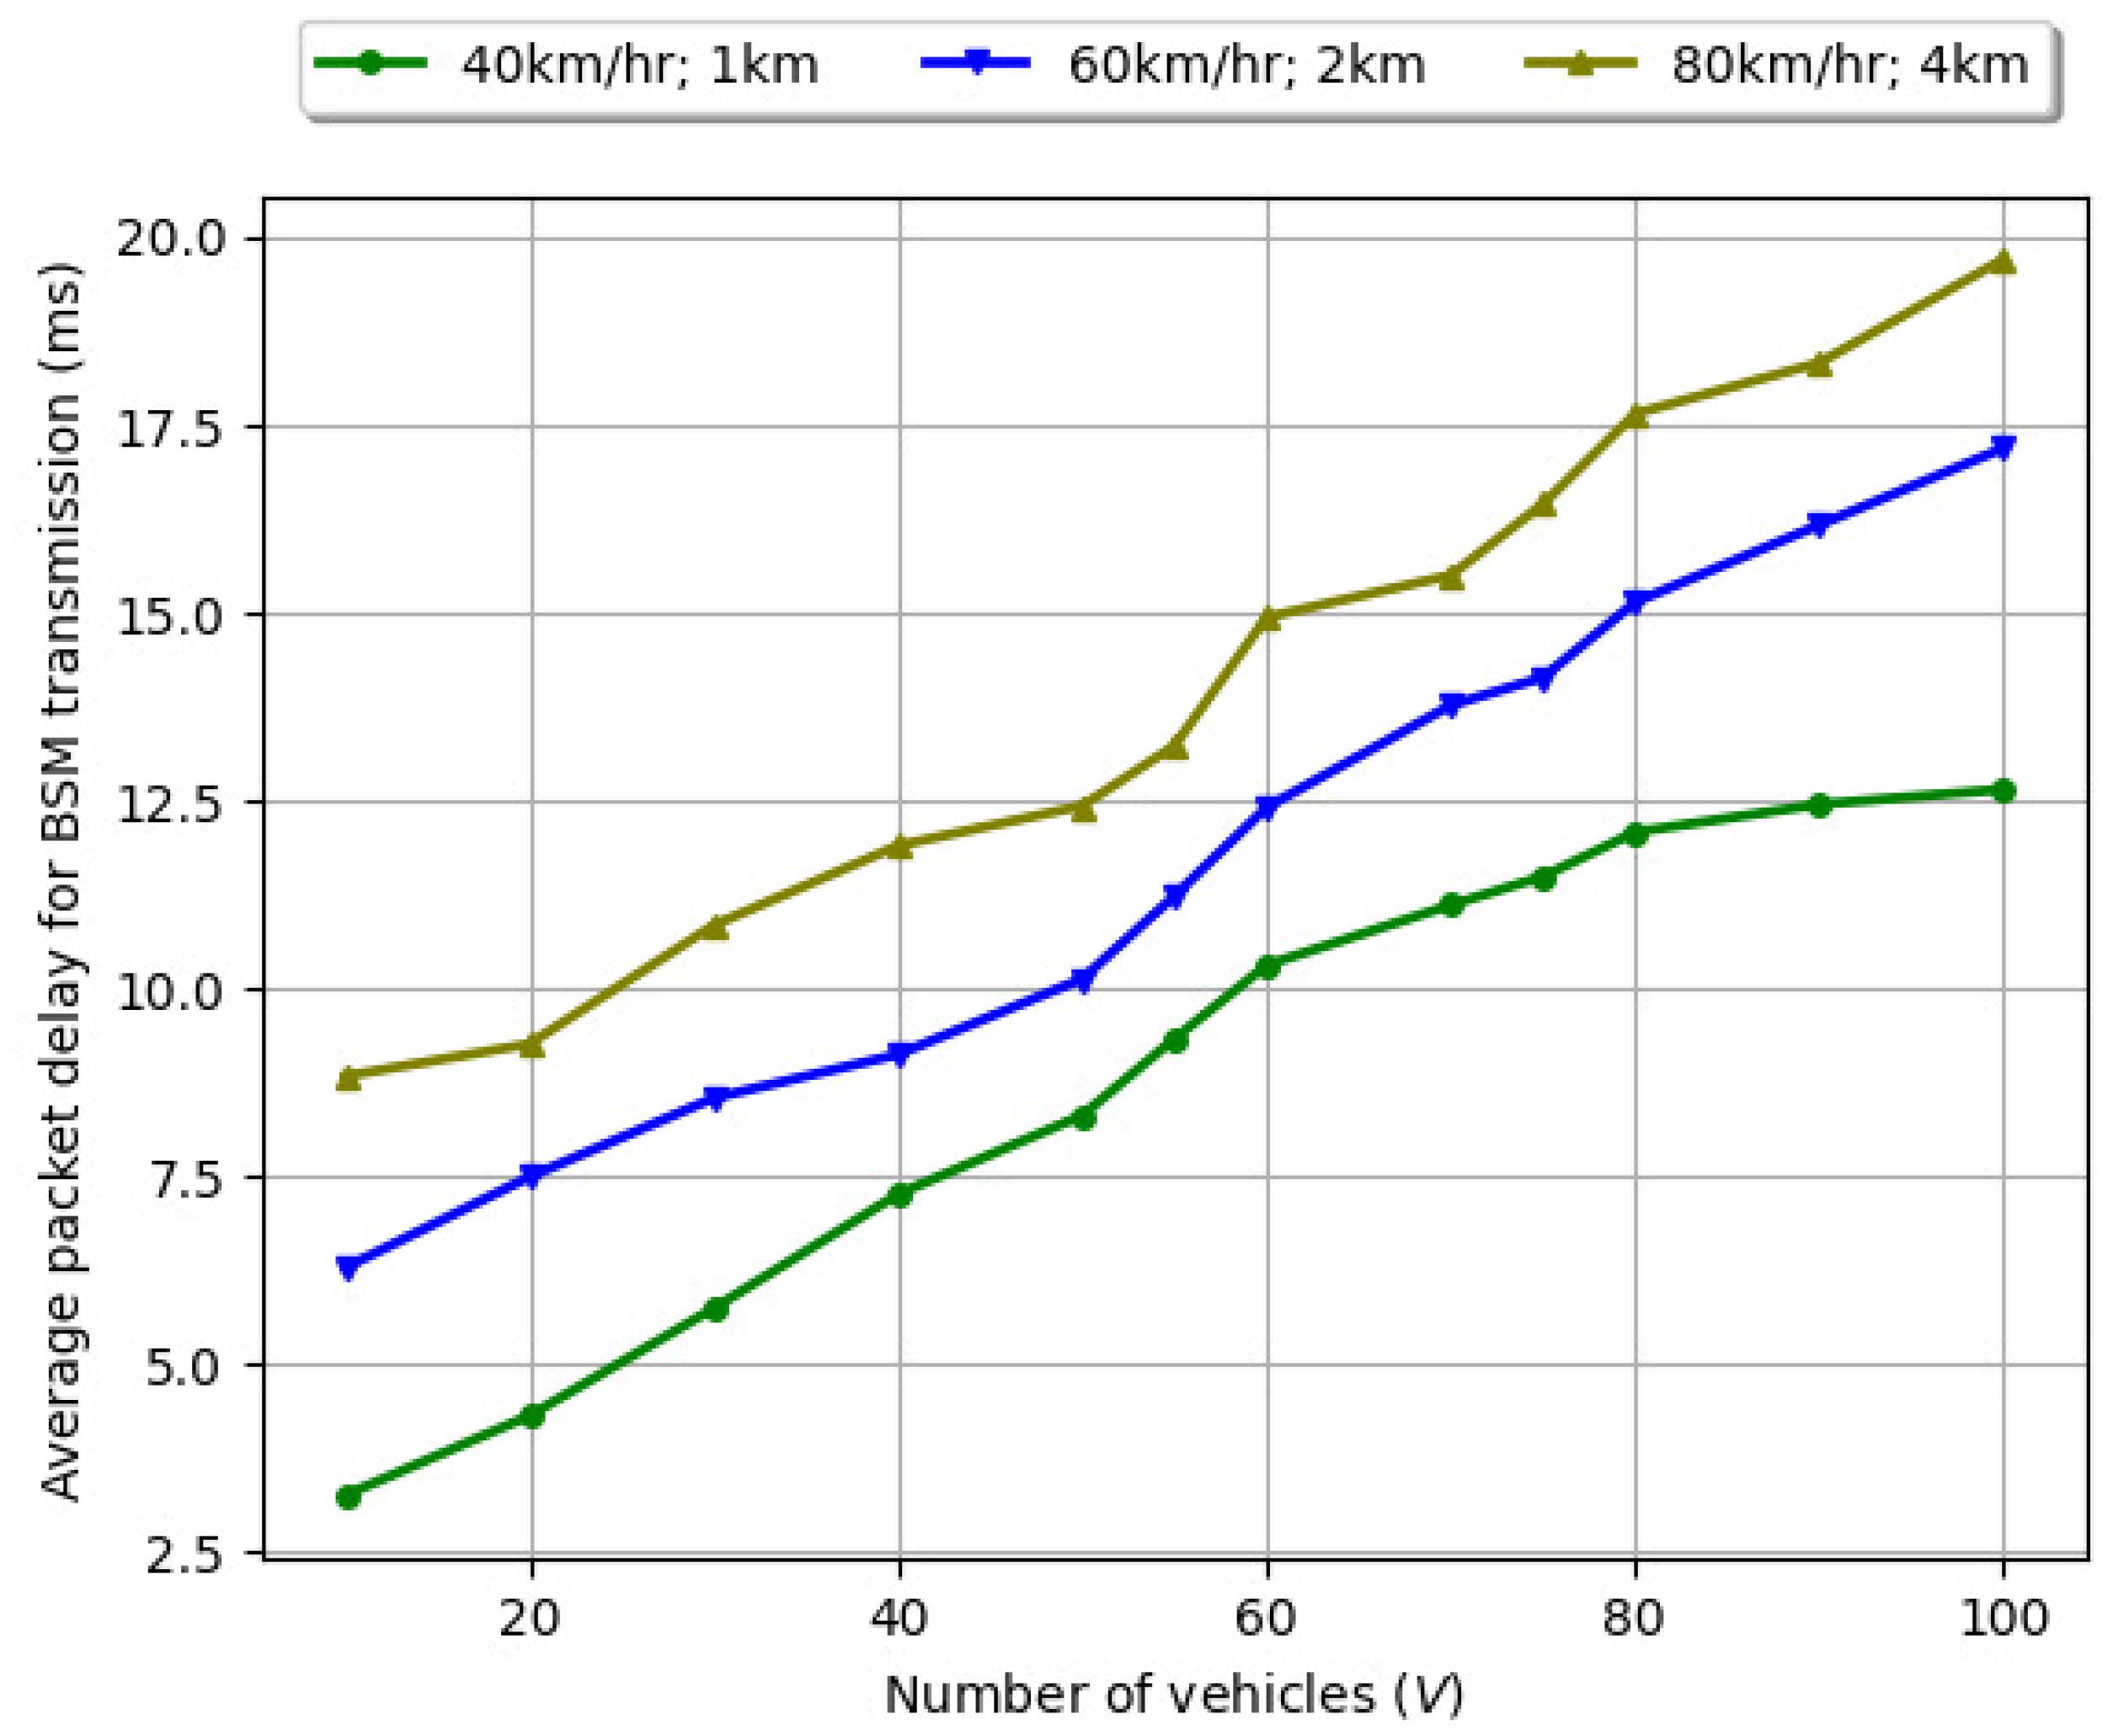
However, the average delay increases when the BSM packet inter-arrival time is reduced to 200 ms, i.e., T B S M = 200 ms, as illustrated in Figure 8. Due to the smaller inter-arrival time, the packet arrival rate is significantly higher compared to the previous scenario where T B S M = 1000 ms. Due to the larger number of incoming packets, more packets compete to access the drone’s computing resources. When the transmission window length is L w = 20 ms and T B S M = 200 ms, the maximum average packet delay for 100 vehicles, when the vehicle velocity = 40 km/h and R L = 1 km, is approximately 10 ms. Even for a lower number of vehicles, such as V = 50, the maximum average delay is observed to be above 10 ms for all vehicle velocities.
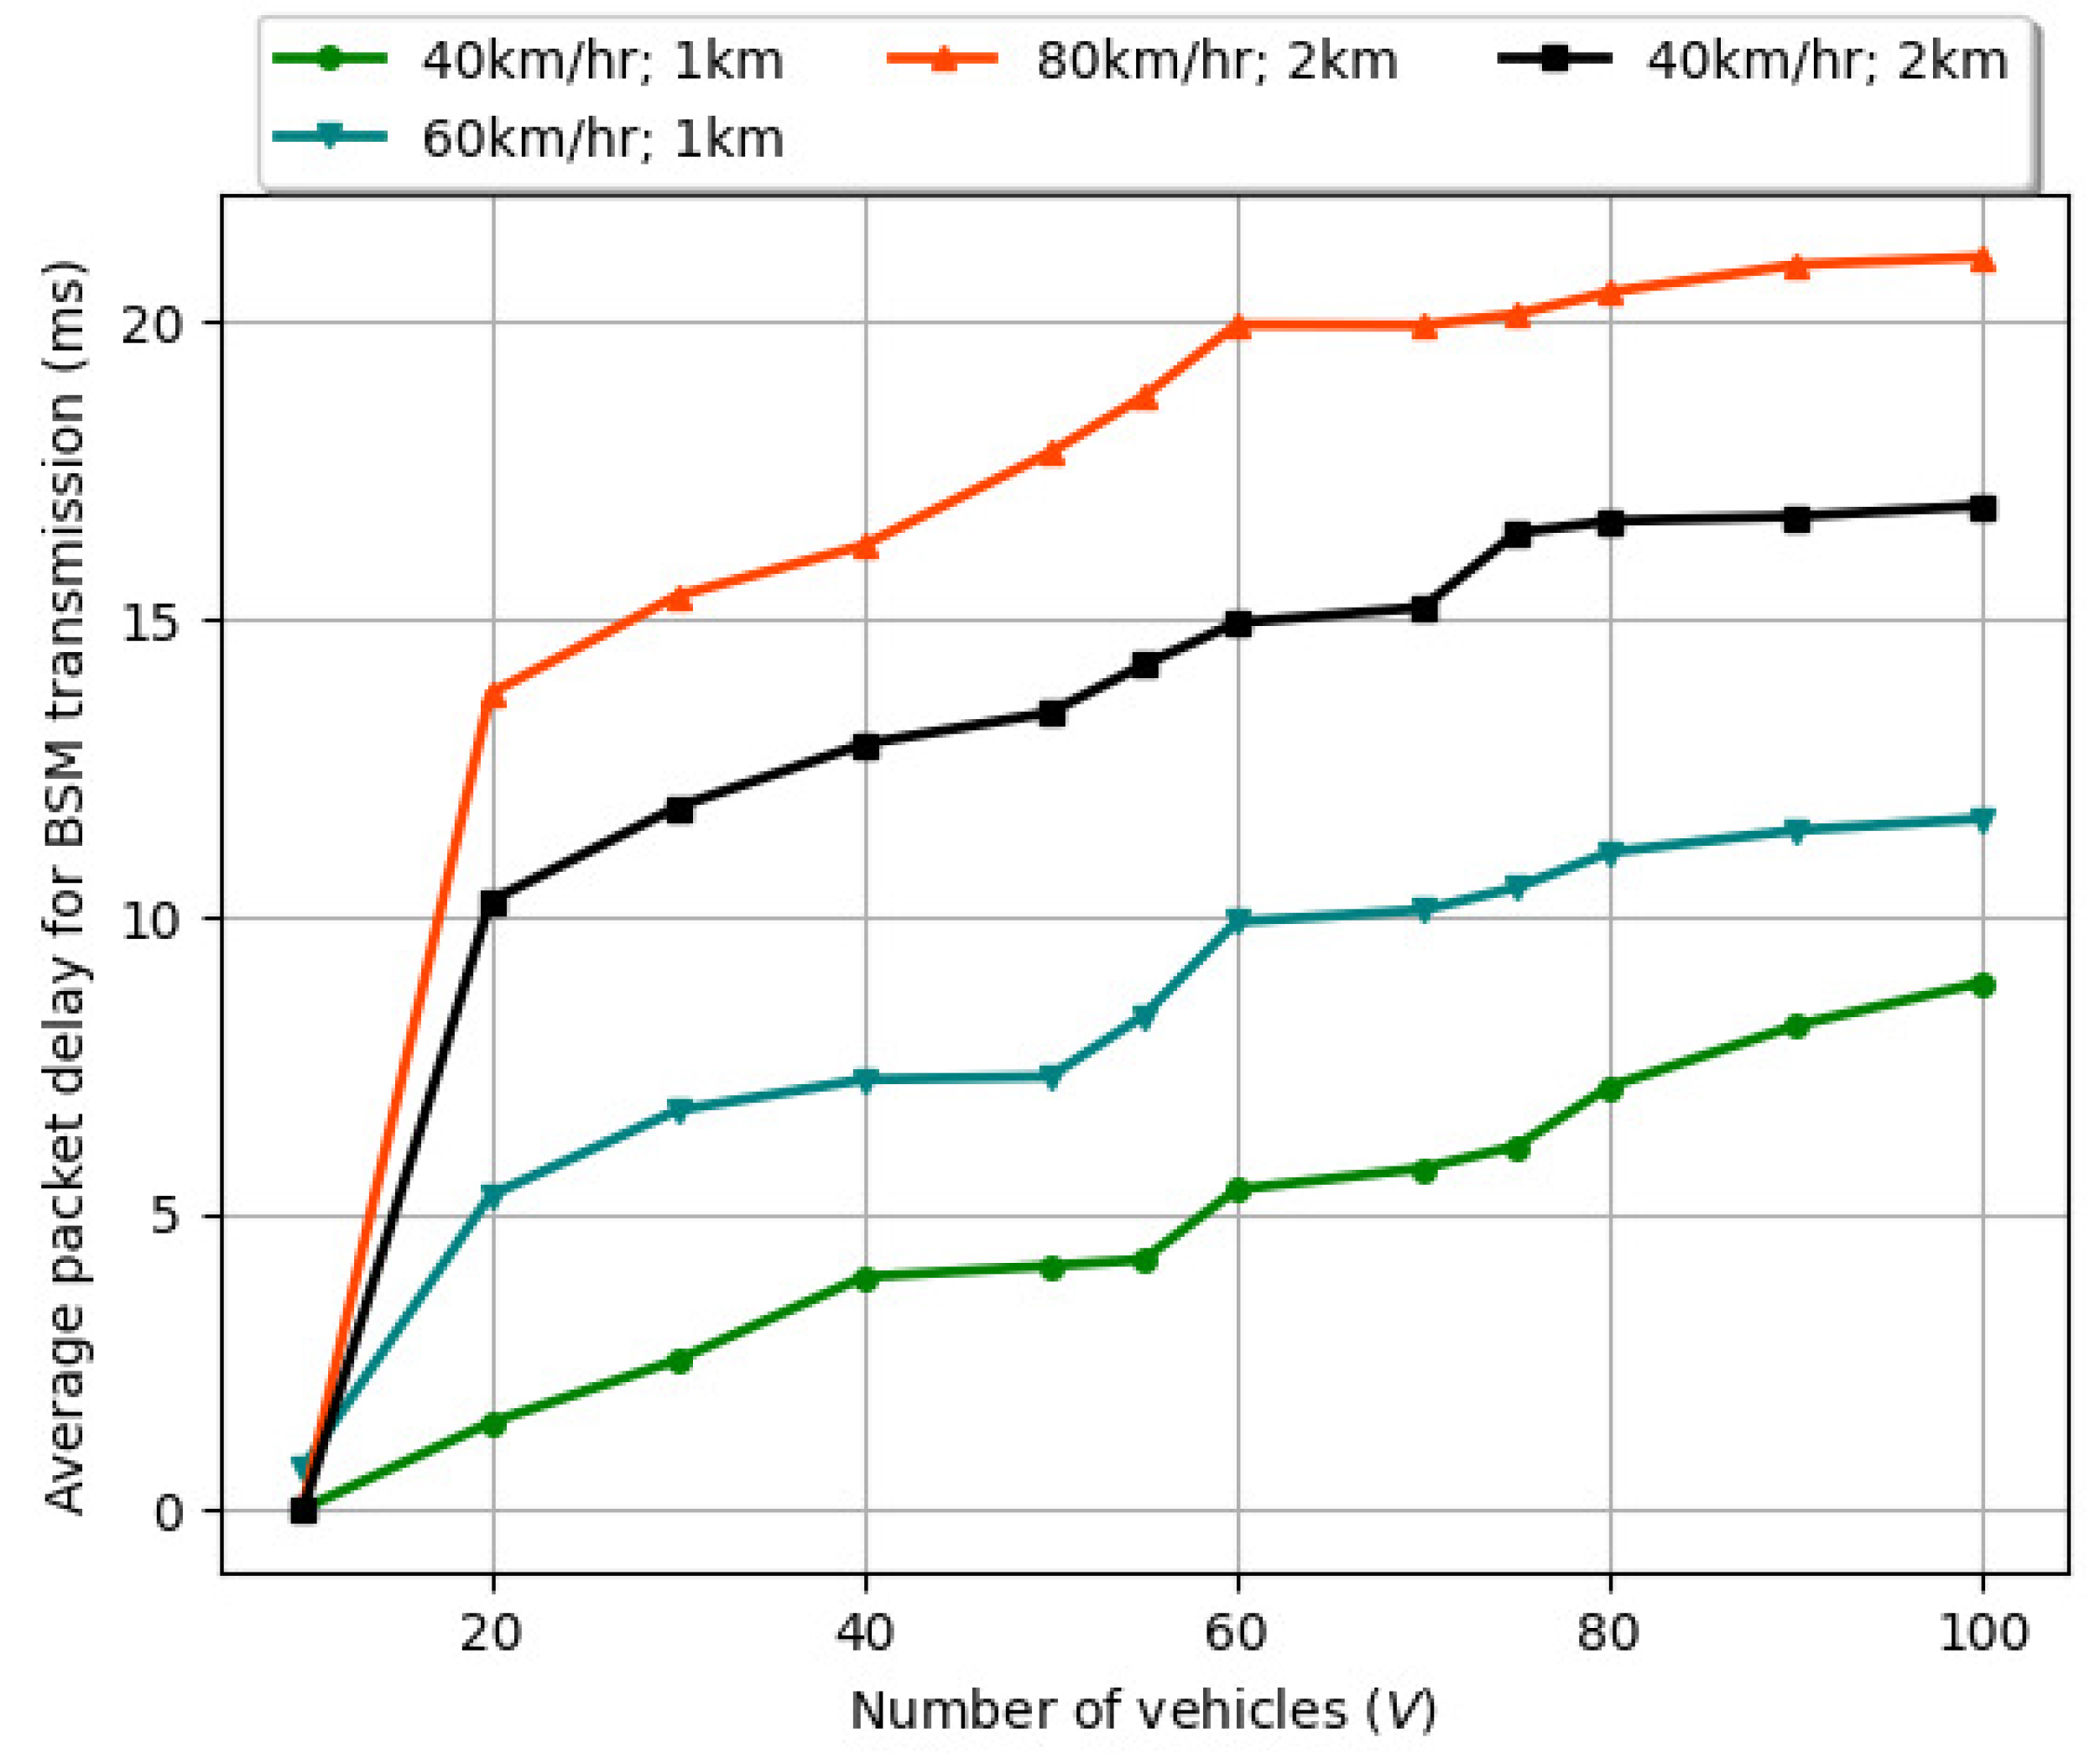
Over a sequence of the drone’s state transitions, the experimental results reveal that the delay profile for BSMs and the average delay experienced by a packet increases with reduction in T B S M , as illustrated further in Figure 9. In Figure 9, we vary V from 1 to 100, velocity from 40 km/h to 80 km/h, and R L from 1 km to 2 km, and L w = 50 ms and T B S M = 200 ms. When the transmission window length in increased from L w = 20 ms to L w = 50 ms, we note a reduction in average delay by approximately 25% for vehicle velocity = 40 km/h and R L = 1 km. This is due to the fact that, due to a larger transmission window length, a packet’s re-transmission in subsequent windows reduces. Consequently, a packet’s queuing at the drone also minimizes, leading to faster processing and lower delay.

6.3. Variation of Average Delay for CPMs with Number of Vehicles (V) for Different L w

The CPMs are mission critical and modeled as a Poisson process with packets arriving at the queue at a rate of λ packets per unit time, and the number of arrivals in a time interval t is ( λ t ) . The variation of average delay for CPMs with number of vehicles (V) is illustrated in Figure 10. Here, we vary the number of vehicles from V = 1 to 100.
When the transmission window is set to L w = 50 ms, increasing the number of vehicles and packet transmissions does not lead to a sharp increase in delay. The average delay remains between 5 ms and 10 ms. Moreover, as noted from Figure 10, we concur that the fluctuating behavior is due to the larger window size, which allows more packets to be transmitted from the vehicles to the drone. At the same time, the packet arrival rate limits the number of packets that arrive from the vehicles to the drone in a transmission window. Hence, the delay does not follow a strictly linear pattern but is an unpredictable variable.
In addition, reducing L w results in random wait time, and the average delay is between 10 ms and 45 ms. Figure 10 indicates that with a higher number of vehicles (V) and smaller L w , the delay continues to increase. When V = 1–10, for L w = 50 ms, the delay reduces from 20 ms to 10 ms due to the random arrival pattern of CPM. For L w = 20 ms and L w = 50 ms, if the service rate ( μ ) is higher than the repetition frequency of CPM packets, then the average delay increases. Figure 11 illustrates the variation of average delay with inter-arrival time of CPMs for varying ( λ ). Here, we vary ( λ ) from 1000 to 2000 packets/s. The CPM packet arrival rate is based on the occurrence and severity of an event. For L w = 20 ms and L w = 50 ms, an increase in the average delay for smaller values of T C P M is noticed. This is because of congestion due to more packets being transmitted. When L w = 50 ms and λ = 2000 packets/s, the lowest average delay is 15 ms. When the CPM packet arrival rate is increased, the delay remains steady with service rate ( μ ) for different CPM arrival rates.

6.4. Variation of Average Packet Delay for CPMs with Number of Vehicles (V), Varying Vehicle Speed, and Road Length ( R L )

In this section, we discuss the variation in average packet delay for CPMs with number of vehicles (V), varying vehicle speed, and road length ( R L ). We also vary the transmission window length L w , inter-arrival time of CPMs ( T C P M ), and packet arrival rate ( λ ).
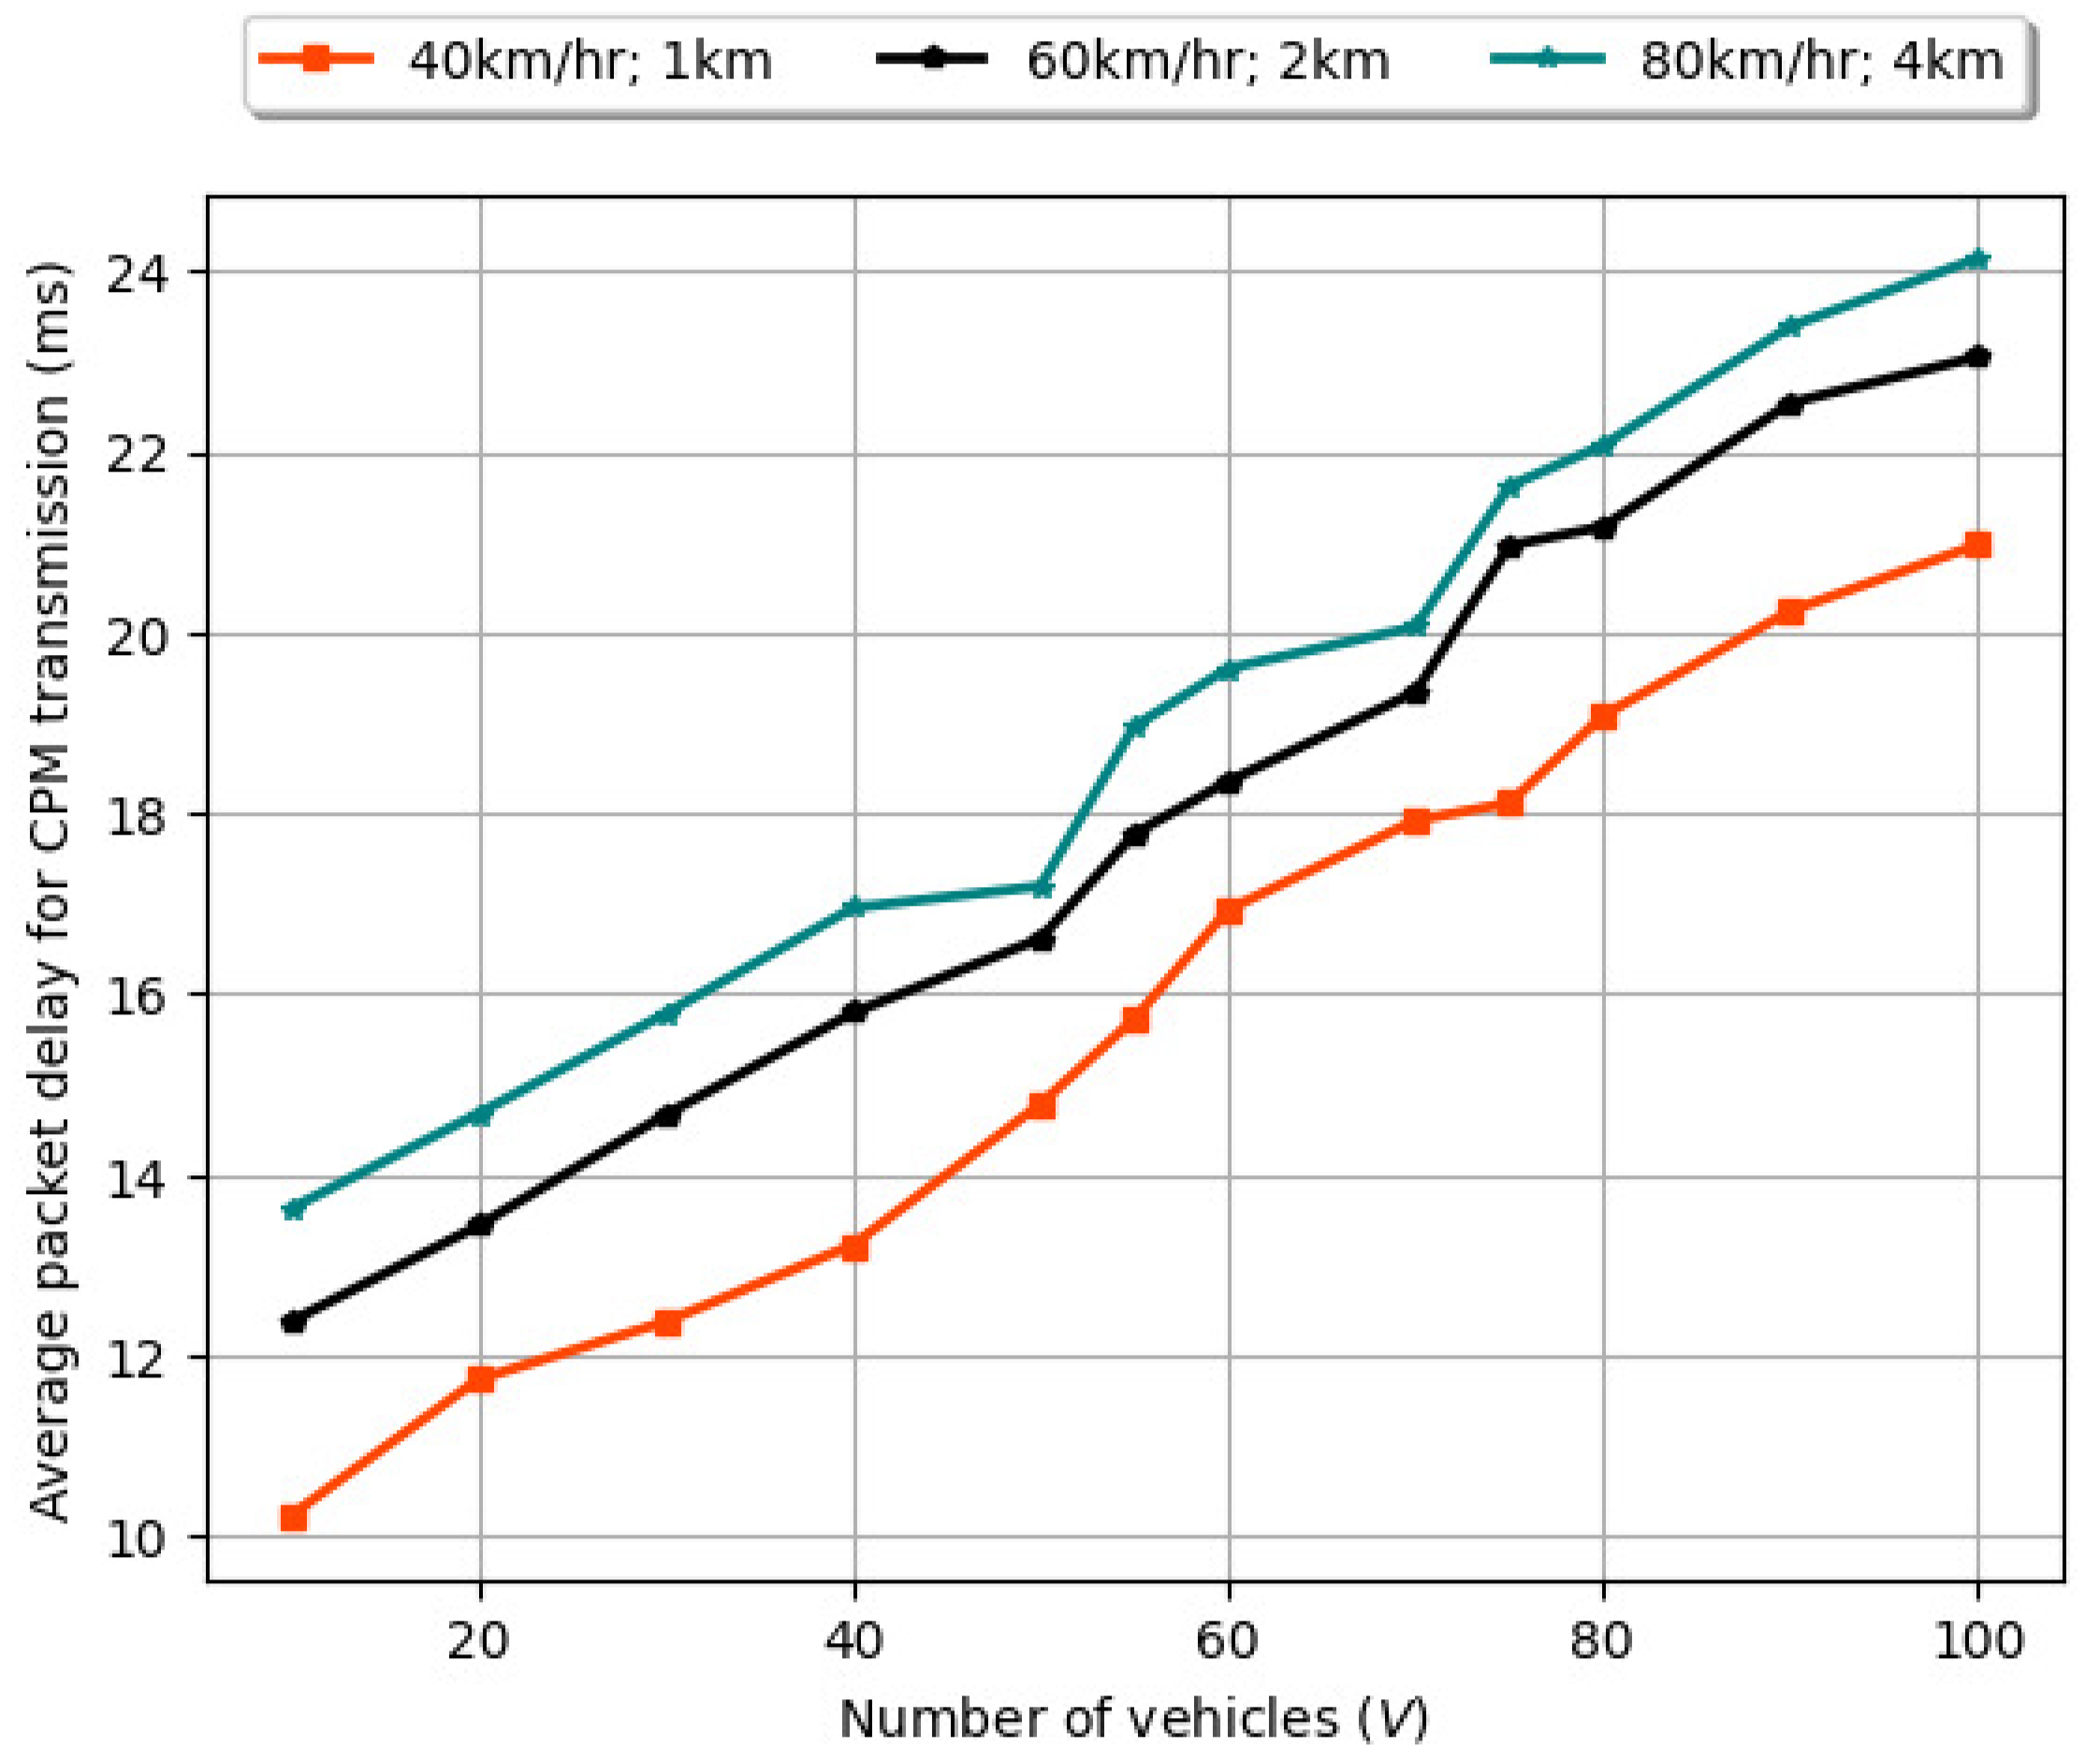
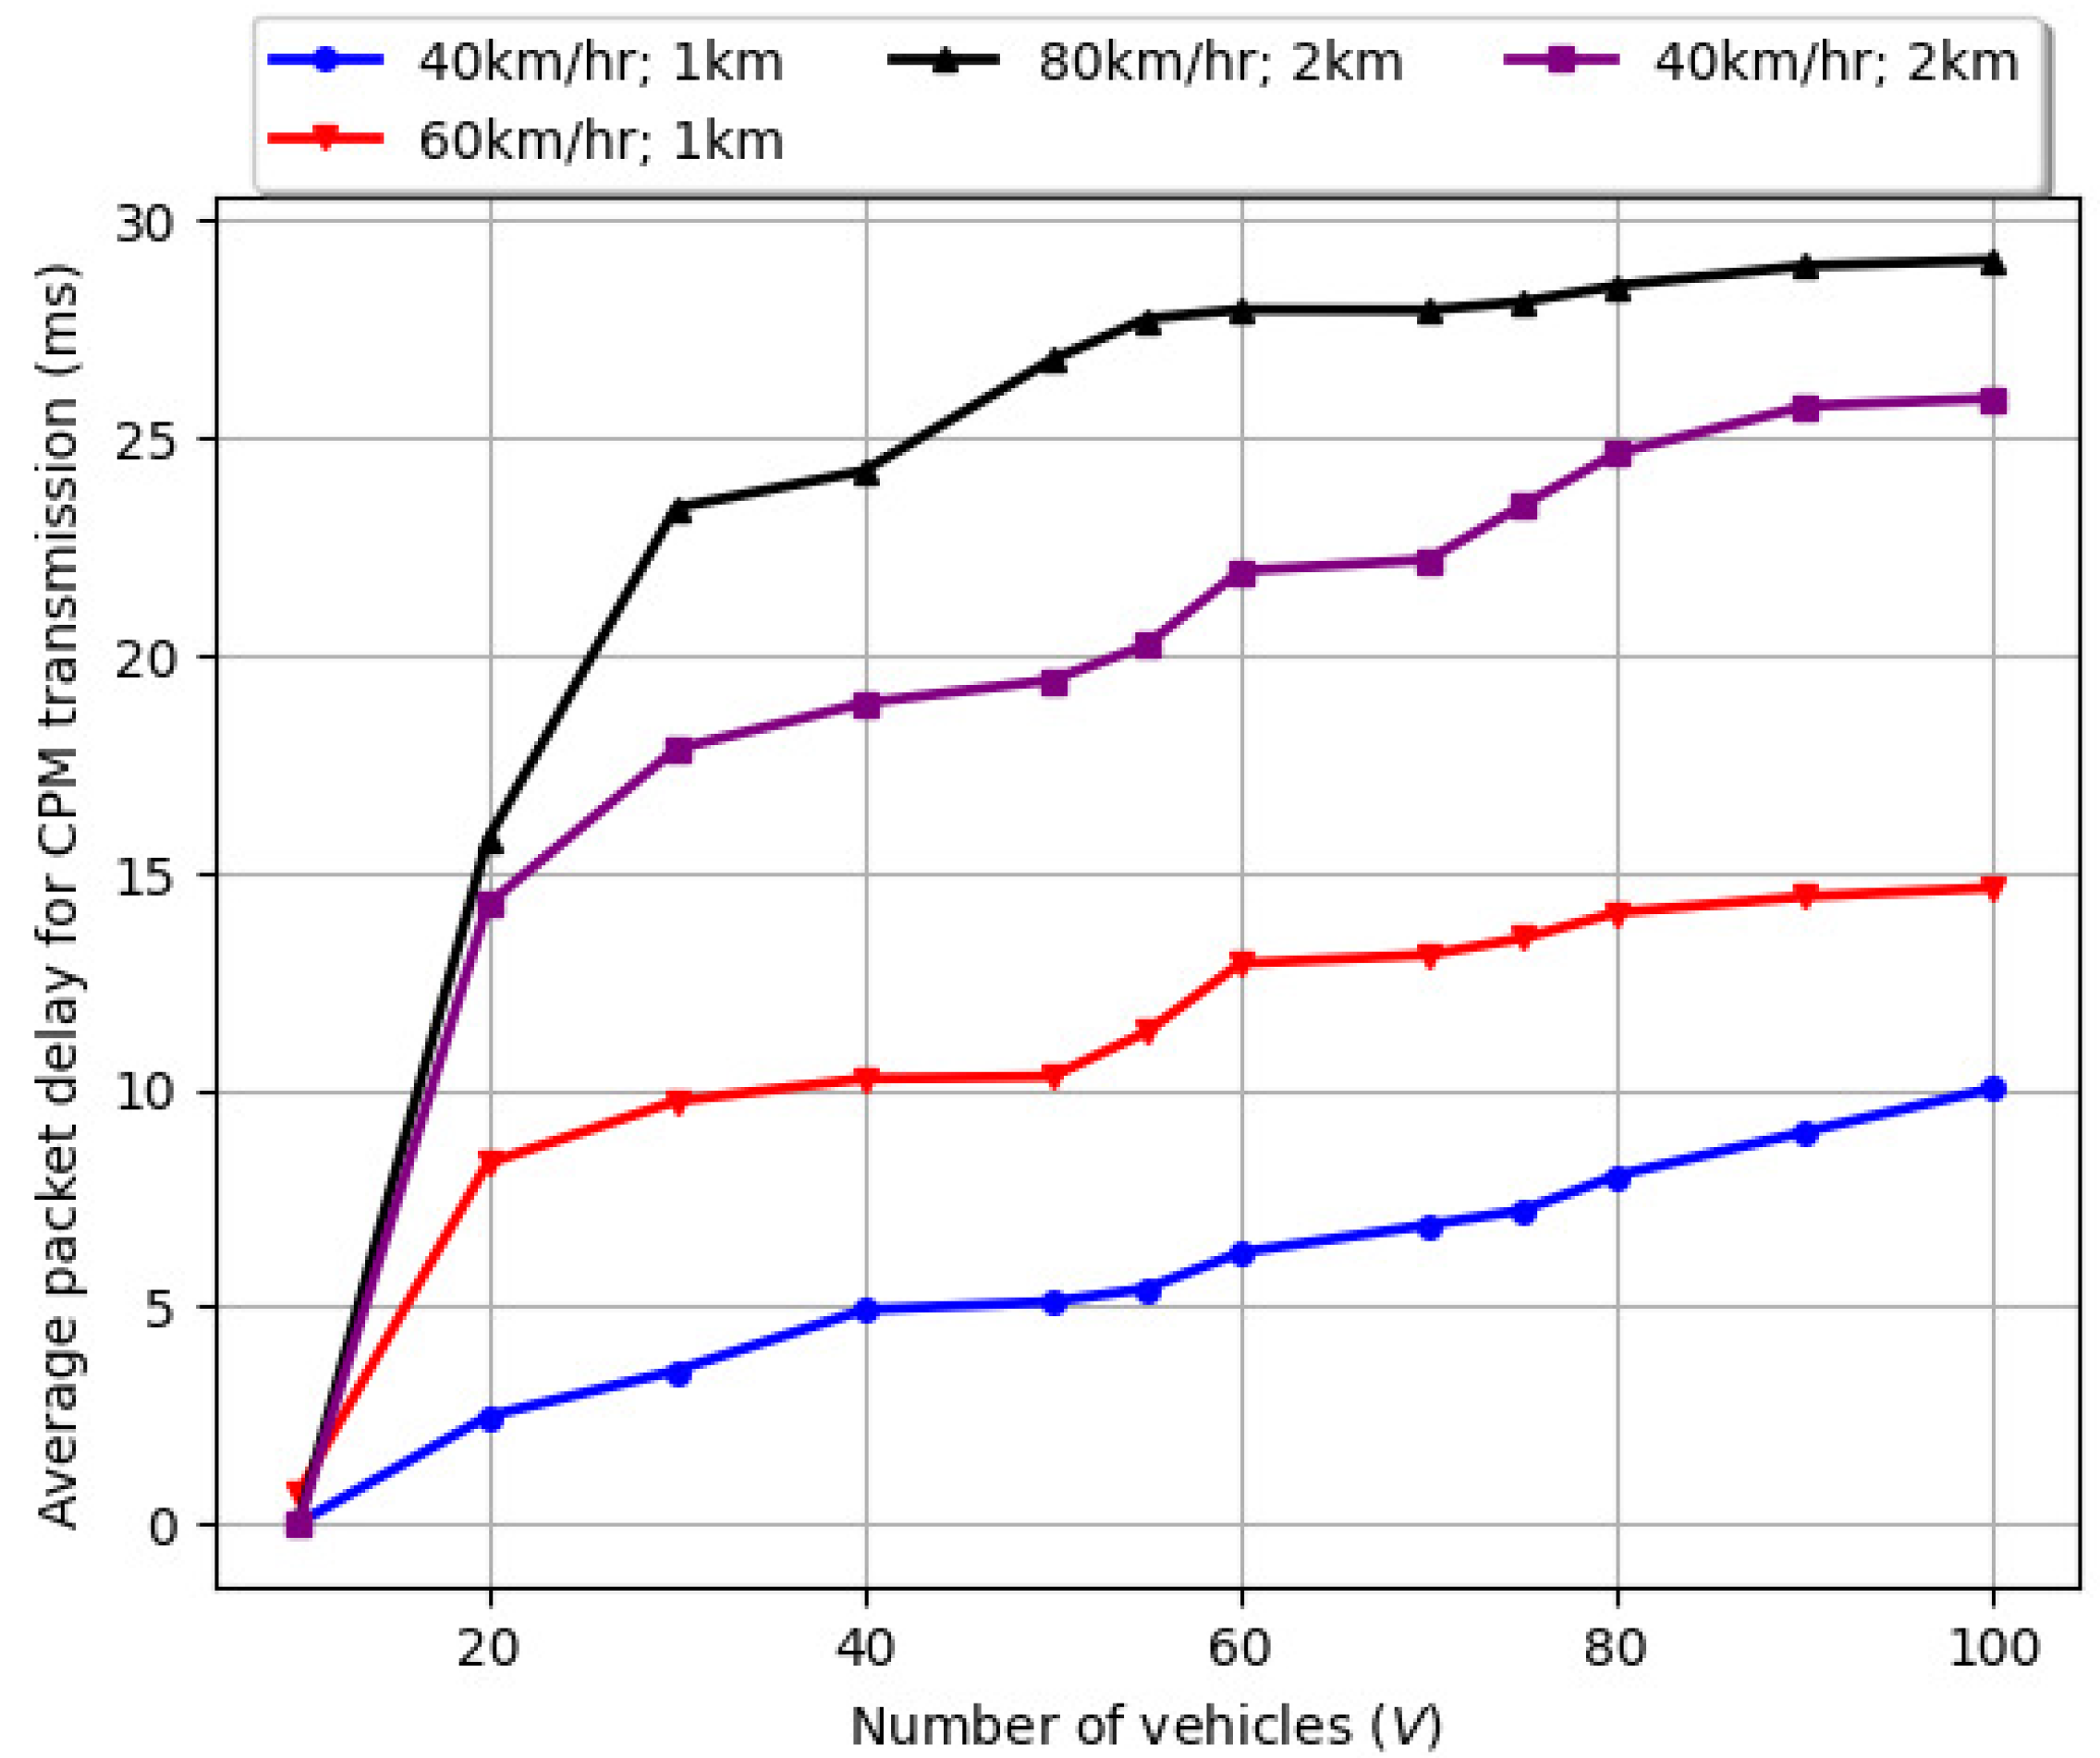
As illustrated in Figure 12, the average delay experienced by a CPM packet is approximately 40% higher than that experienced by a BSM packet in a similar C-V2X environment. Here, the vehicle velocity is varied as 40 km/h, 60 km/h, and 80 km/h. We vary the number of vehicles (V) from 1 to 100 and select road length ( R L ) to be 1 km, 2 km, and 4 km. From Figure 12, we note that for L w = 20 ms, T C P M = 200 ms, vehicle velocity = 40 km/h, and R L = 1 km, the maximum average packet delay for 100 vehicles is approximately 22.5 ms. The comparatively higher average delay is attributed to the low inter-arrival time ( T C P M = 200 ms) and the packet arrival rate λ = 1000 packets/s. Since the CPM packet arrival is random in nature, an incoming packet has a higher probability of being queued before being processed by the drone. We note that the average delay experienced by a CPM packet continues to steadily increase with the increase in vehicle velocity and road length. For L w = 20 ms, T C P M = 200 ms, vehicle velocity = 80 km/h, and R L = 4 km, the maximum average packet delay for 100 vehicles is approximately 24 ms.
As noted from Figure 13, for L w = 20 ms, T C P M = 500 ms, and velocity = 40 km/h, when R L is 1 km, the maximum average packet delay for 100 vehicles is approximately 10 ms. This comparatively lower value of average delay is attributed to the inter-arrival time ( T C P M = 500 ms) over a smaller R L . Here, the packet arrival rate, λ = 2000 packets/s, is greater than the scenario in Figure 12. Consequently, an incoming CPM packet has a lower probability of being queued before being processed by the drone. However, when the vehicle velocity is increased to 60 km/h for R L = 1 km, the maximum average packet delay for 100 vehicles is approximately 15 ms. When the vehicle velocity is further increased to 80 km/h for R L = 2 km, the maximum average packet delay for 100 vehicles is approximately 28 ms. Furthermore, for V = 1–30, there is a sharp increase in the maximum average packet delay experienced by a packet. For V = 30–100, the maximum average packet delay experienced by a packet gradually increases with V and the road length ( R L ).

6.5. Variation of Drone’s Average Energy Consumption (Joules/s) with Number of Vehicles (V)

Figure 14 illustrates the variation in the drone’s average energy consumption with number of vehicles (V). Here, we vary the vehicle speed and road length. Increasing the number of vehicles (V) increases the number of packets and, due to collisions, it leads to larger delay. The energy spent increases from 0.001 J/s to 0.3 J/s as the maximum road length is varied from 1 km to 2 km. The delay continues to increase with number of vehicles as well as with vehicle speed. The drone energy is limited and is spent in packet transmissions to and from the drone, spent when the drone is idle, and spent by the drone in flying.
The drone energy consumption (J/s) is a function of the vehicle’s packet transmission frequency, packet size, and the channel bandwidth. Increasing the number of vehicles increases the drone energy consumption, as depicted in Figure 14. Furthermore, reducing the number of vehicles in a cluster does not lead to a drastic reduction in drone energy consumption, as the inter-vehicle distance increases and the drone spans a larger trajectory to extend the coverage range. In addition, for a specific number of vehicles in a cluster, an increase in the number of packet re-transmissions also increases the drone’s energy consumption. The delay increases with the ratio between number of packets received by the drone and the number of packets transmitted by a vehicle in a transmission window ( L w ).

6.6. Variation of Drone’s Transmit Power (dBm) vs. Drone’s Altitude (m) with Number of Vehicles (V) for Varying Vehicle Velocity and R L

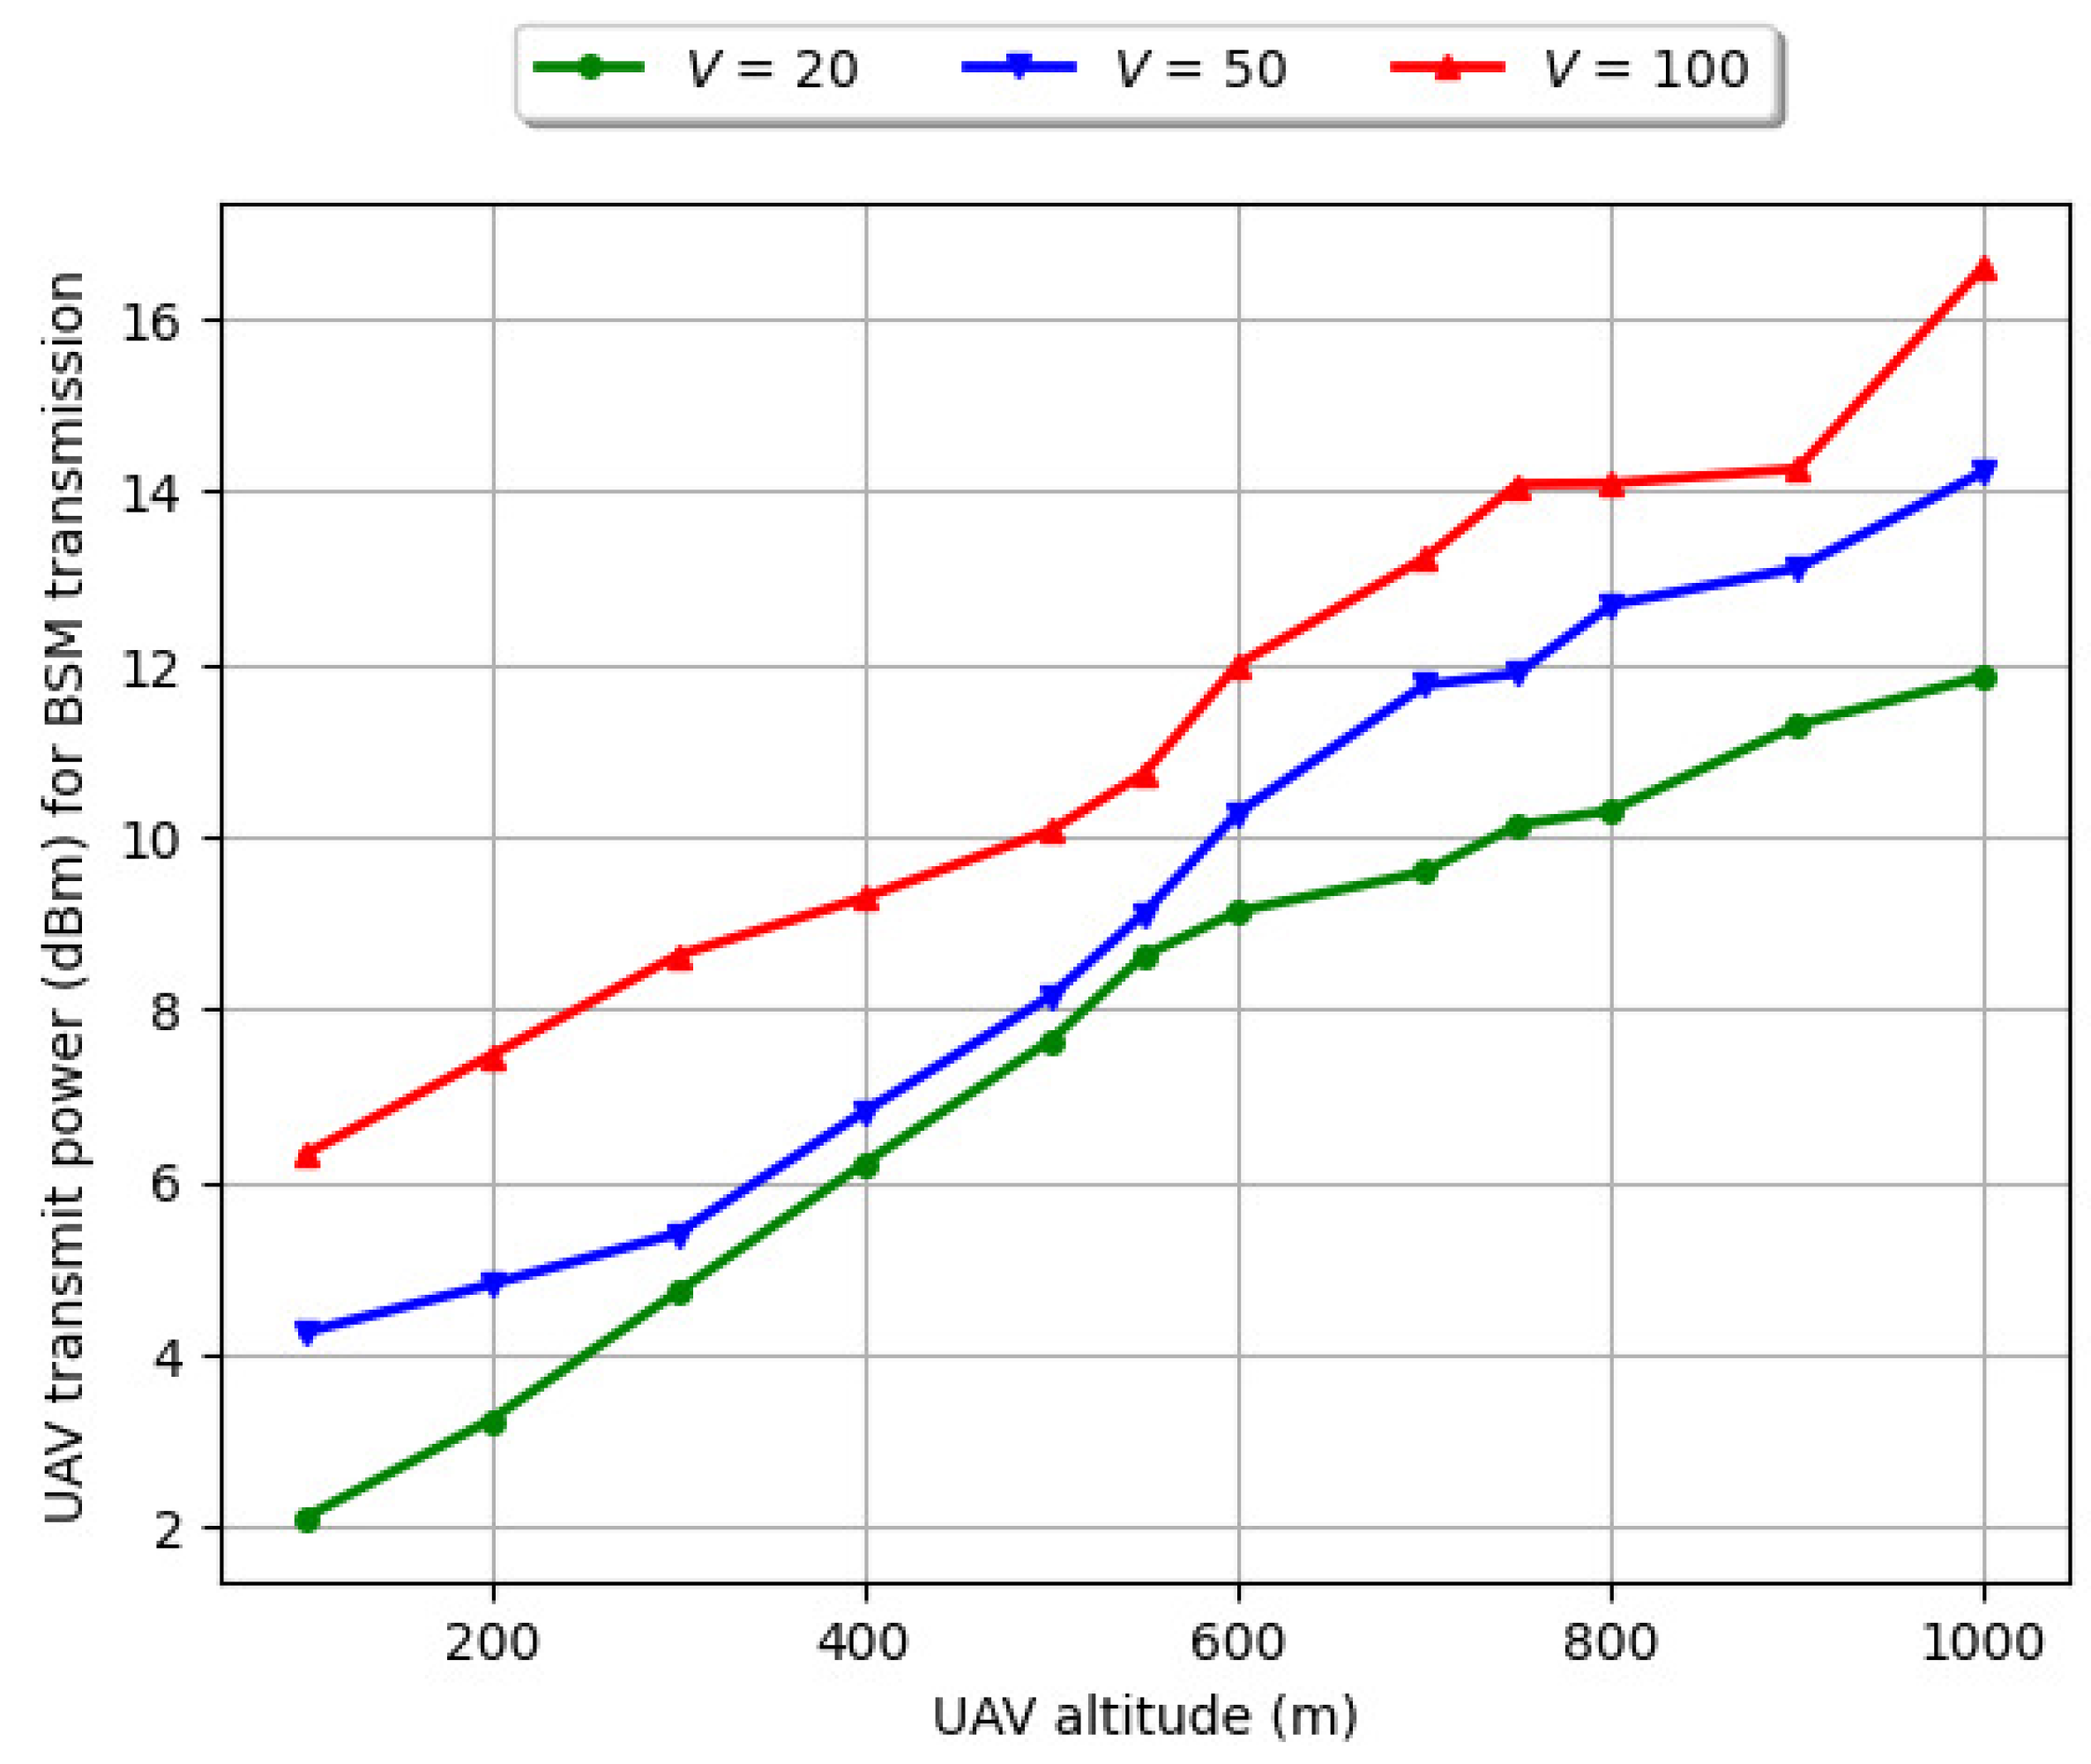
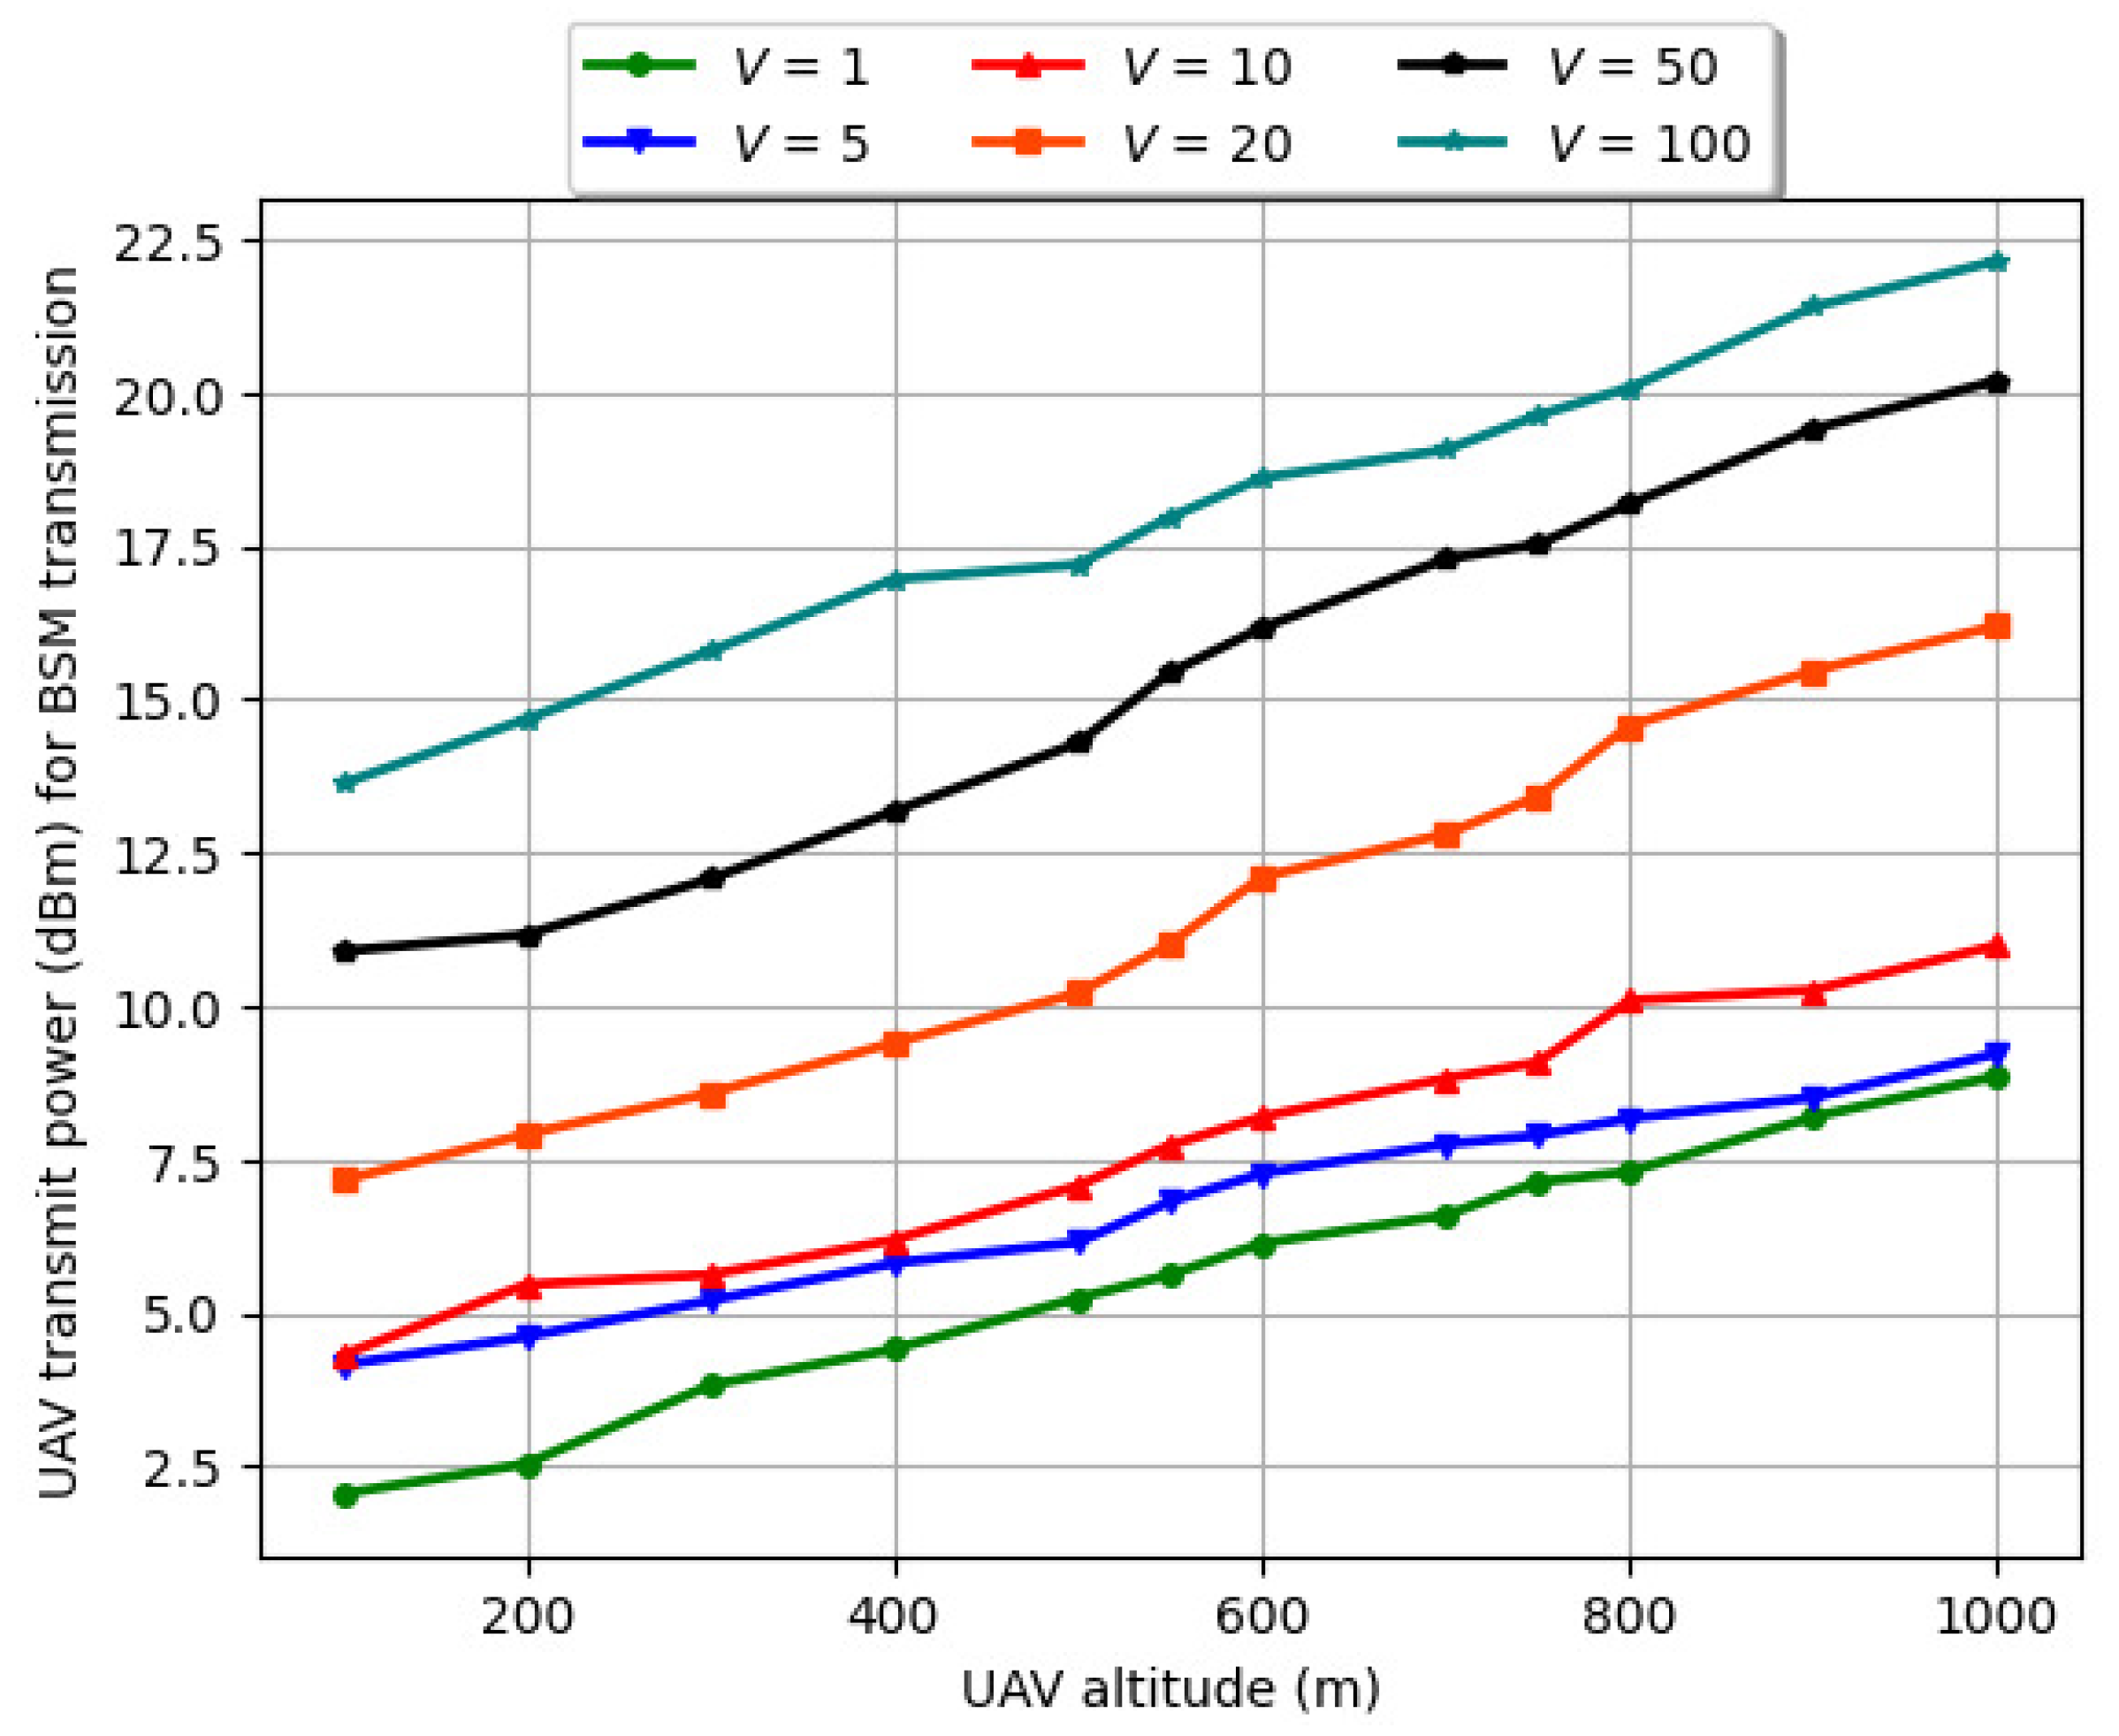
For BSM transmission, the variation in the drone’s transmit power (dBm) with the drone’s altitude (m) for varying V is illustrated in Figure 15 and Figure 16. It is noted from Figure 15 and Figure 16 that when the transmission window length ( L w ) is increased from 20 ms to 50 ms, the drone’s power consumption increases from 17 dBm to 22 dBm. This is attributed to the fact that BSM transmissions are periodic in nature. Consequently, when L w increases, more packets arrive from the vehicles to the drone and all the incoming packets are not processed promptly by the drone’s processor. Hence, a larger percentage of the packets is queued. This leads to more power consumption at the drone. Conversely, for a smaller L w , the number of packets arriving at the drone is less for a similar driving environment. As a result, the drone’s power consumption is marginally lower (17 dBm).
Moreover, Figure 15 and Figure 16 indicate that the drone’s power consumption steadily and progressively increases with V, along with the drone’s altitude for a given R L . This trend is noticed from the positive slope of the graphs, which imply a gradual and continual increase in the power consumption and does not imply a plateau. Considering this power consumption profile and the delay experienced by a BSM packet, we infer from Figure 16 that the drone’s power consumption increases when T B S M = 200 ms. This is because, when the inter-arrival time between packets is less, more BSM packets periodically arrive at the drone. This leads to higher power consumption in queuing and processing.
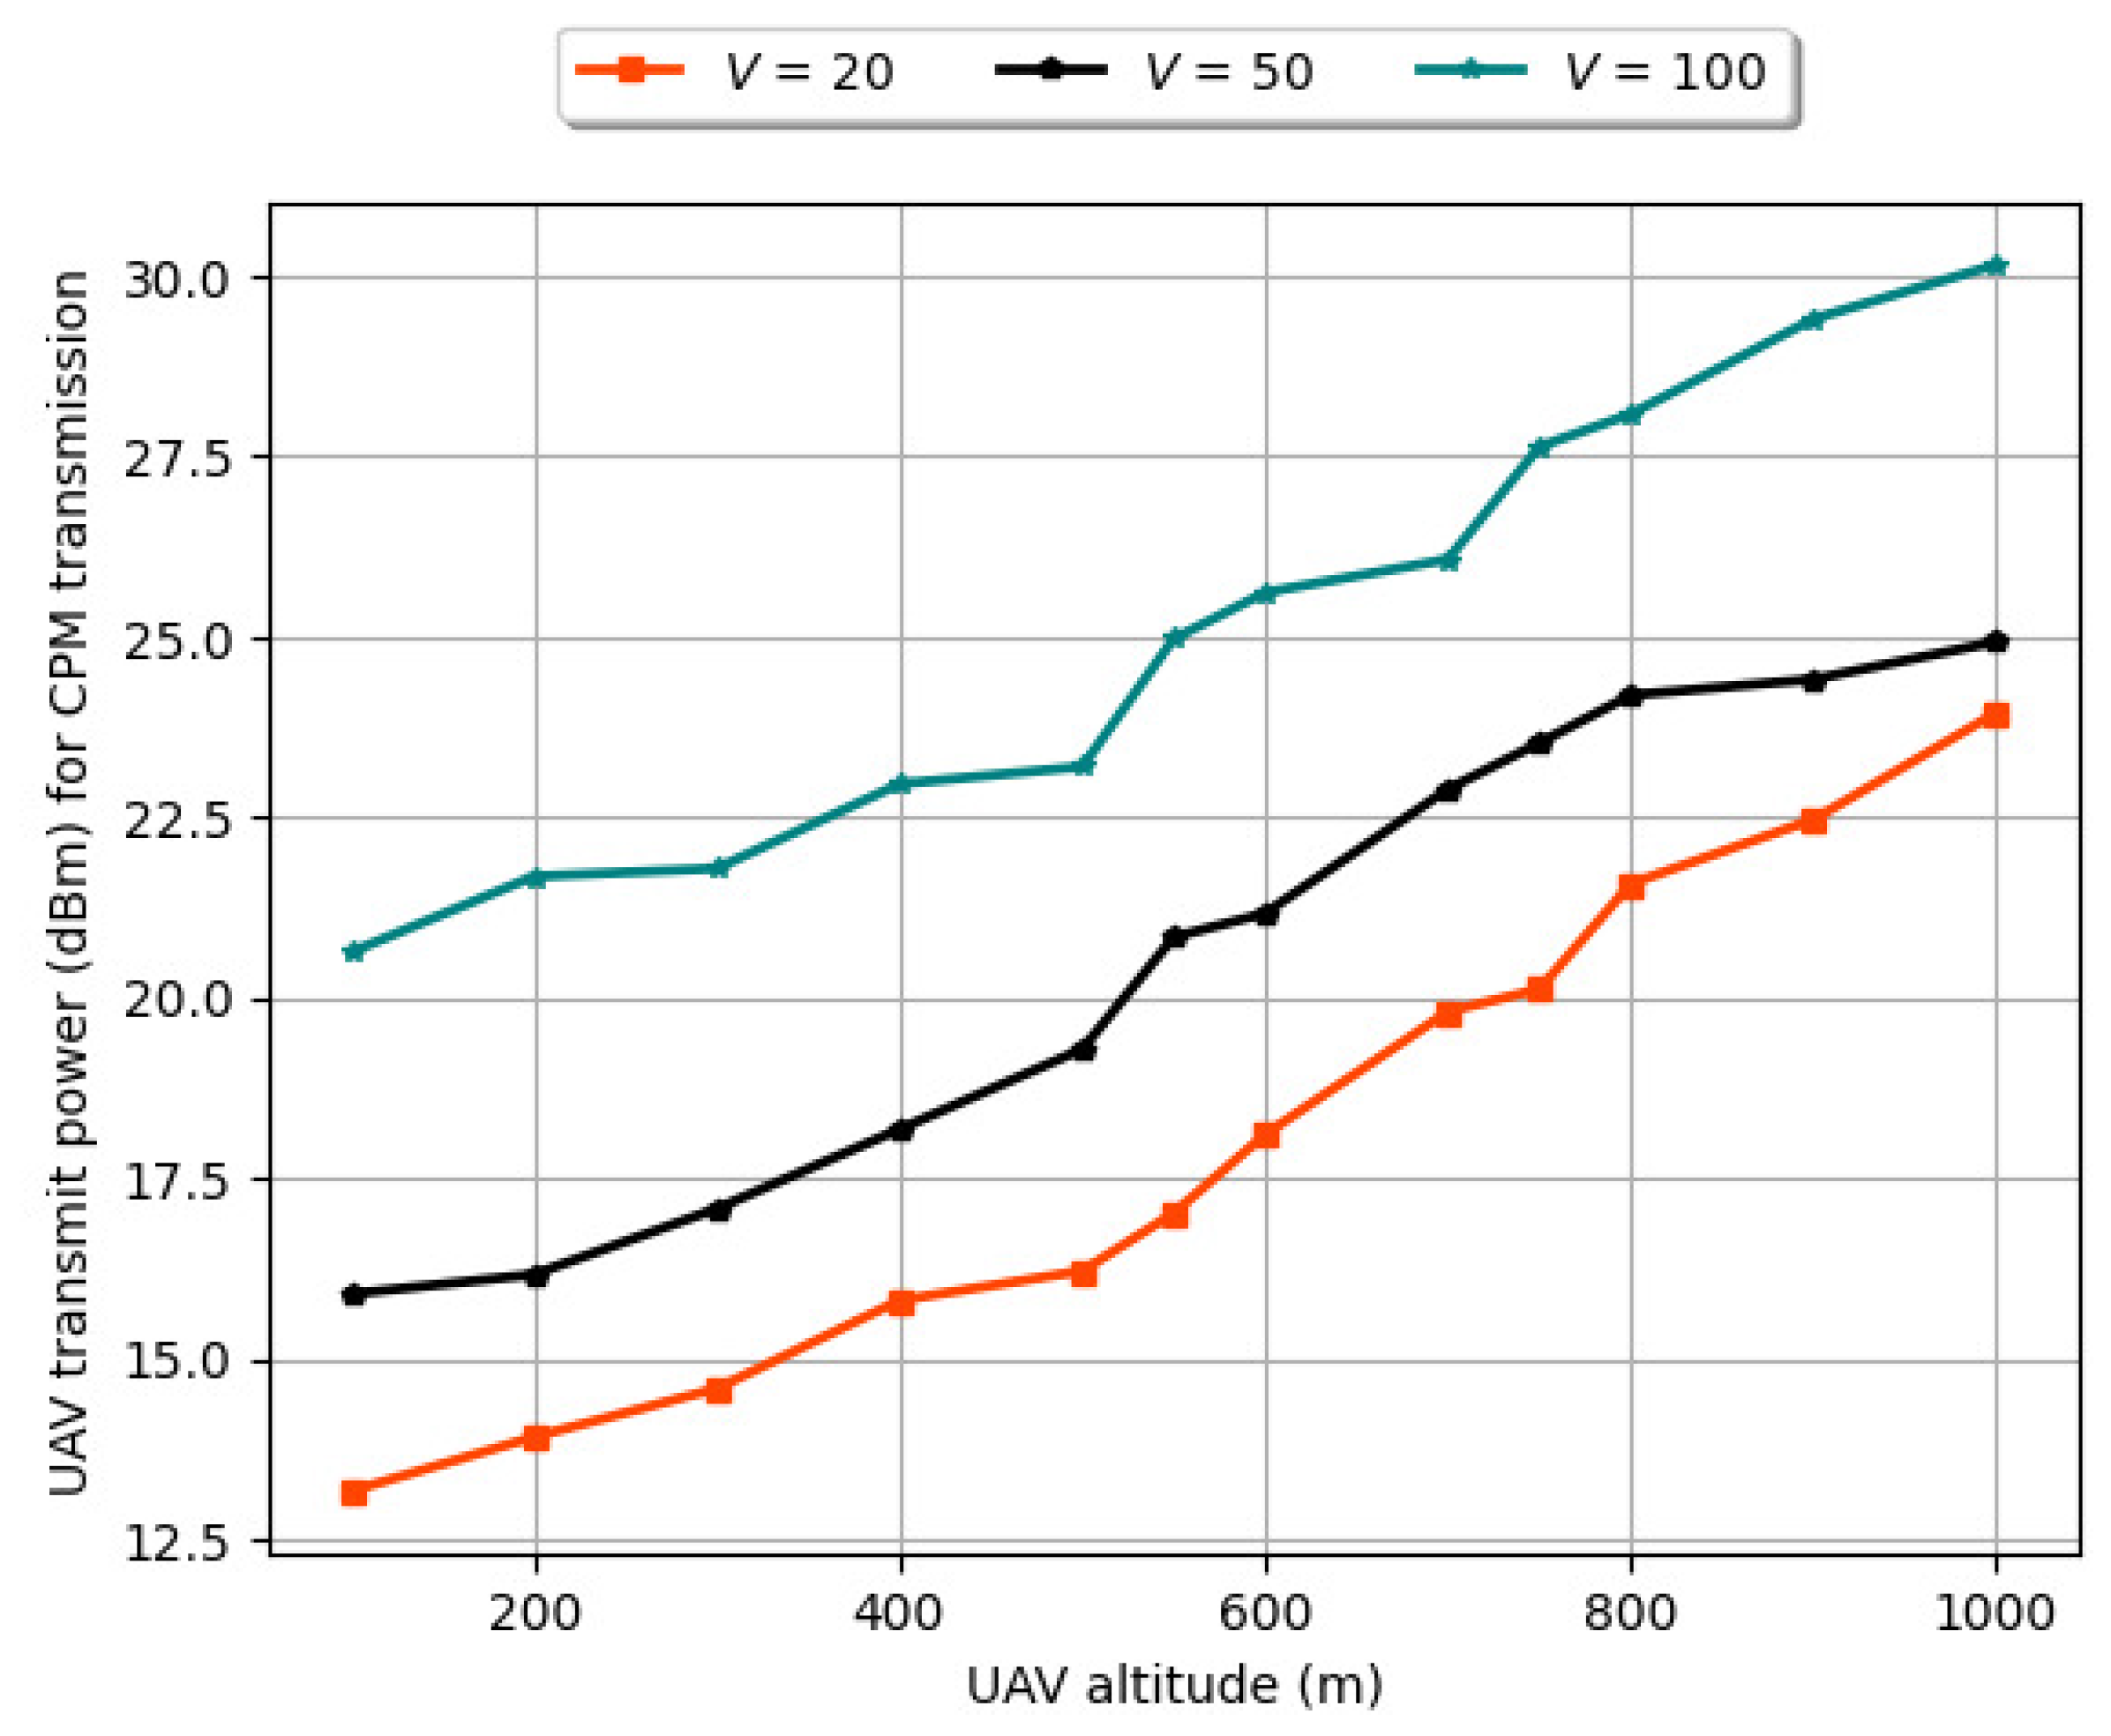
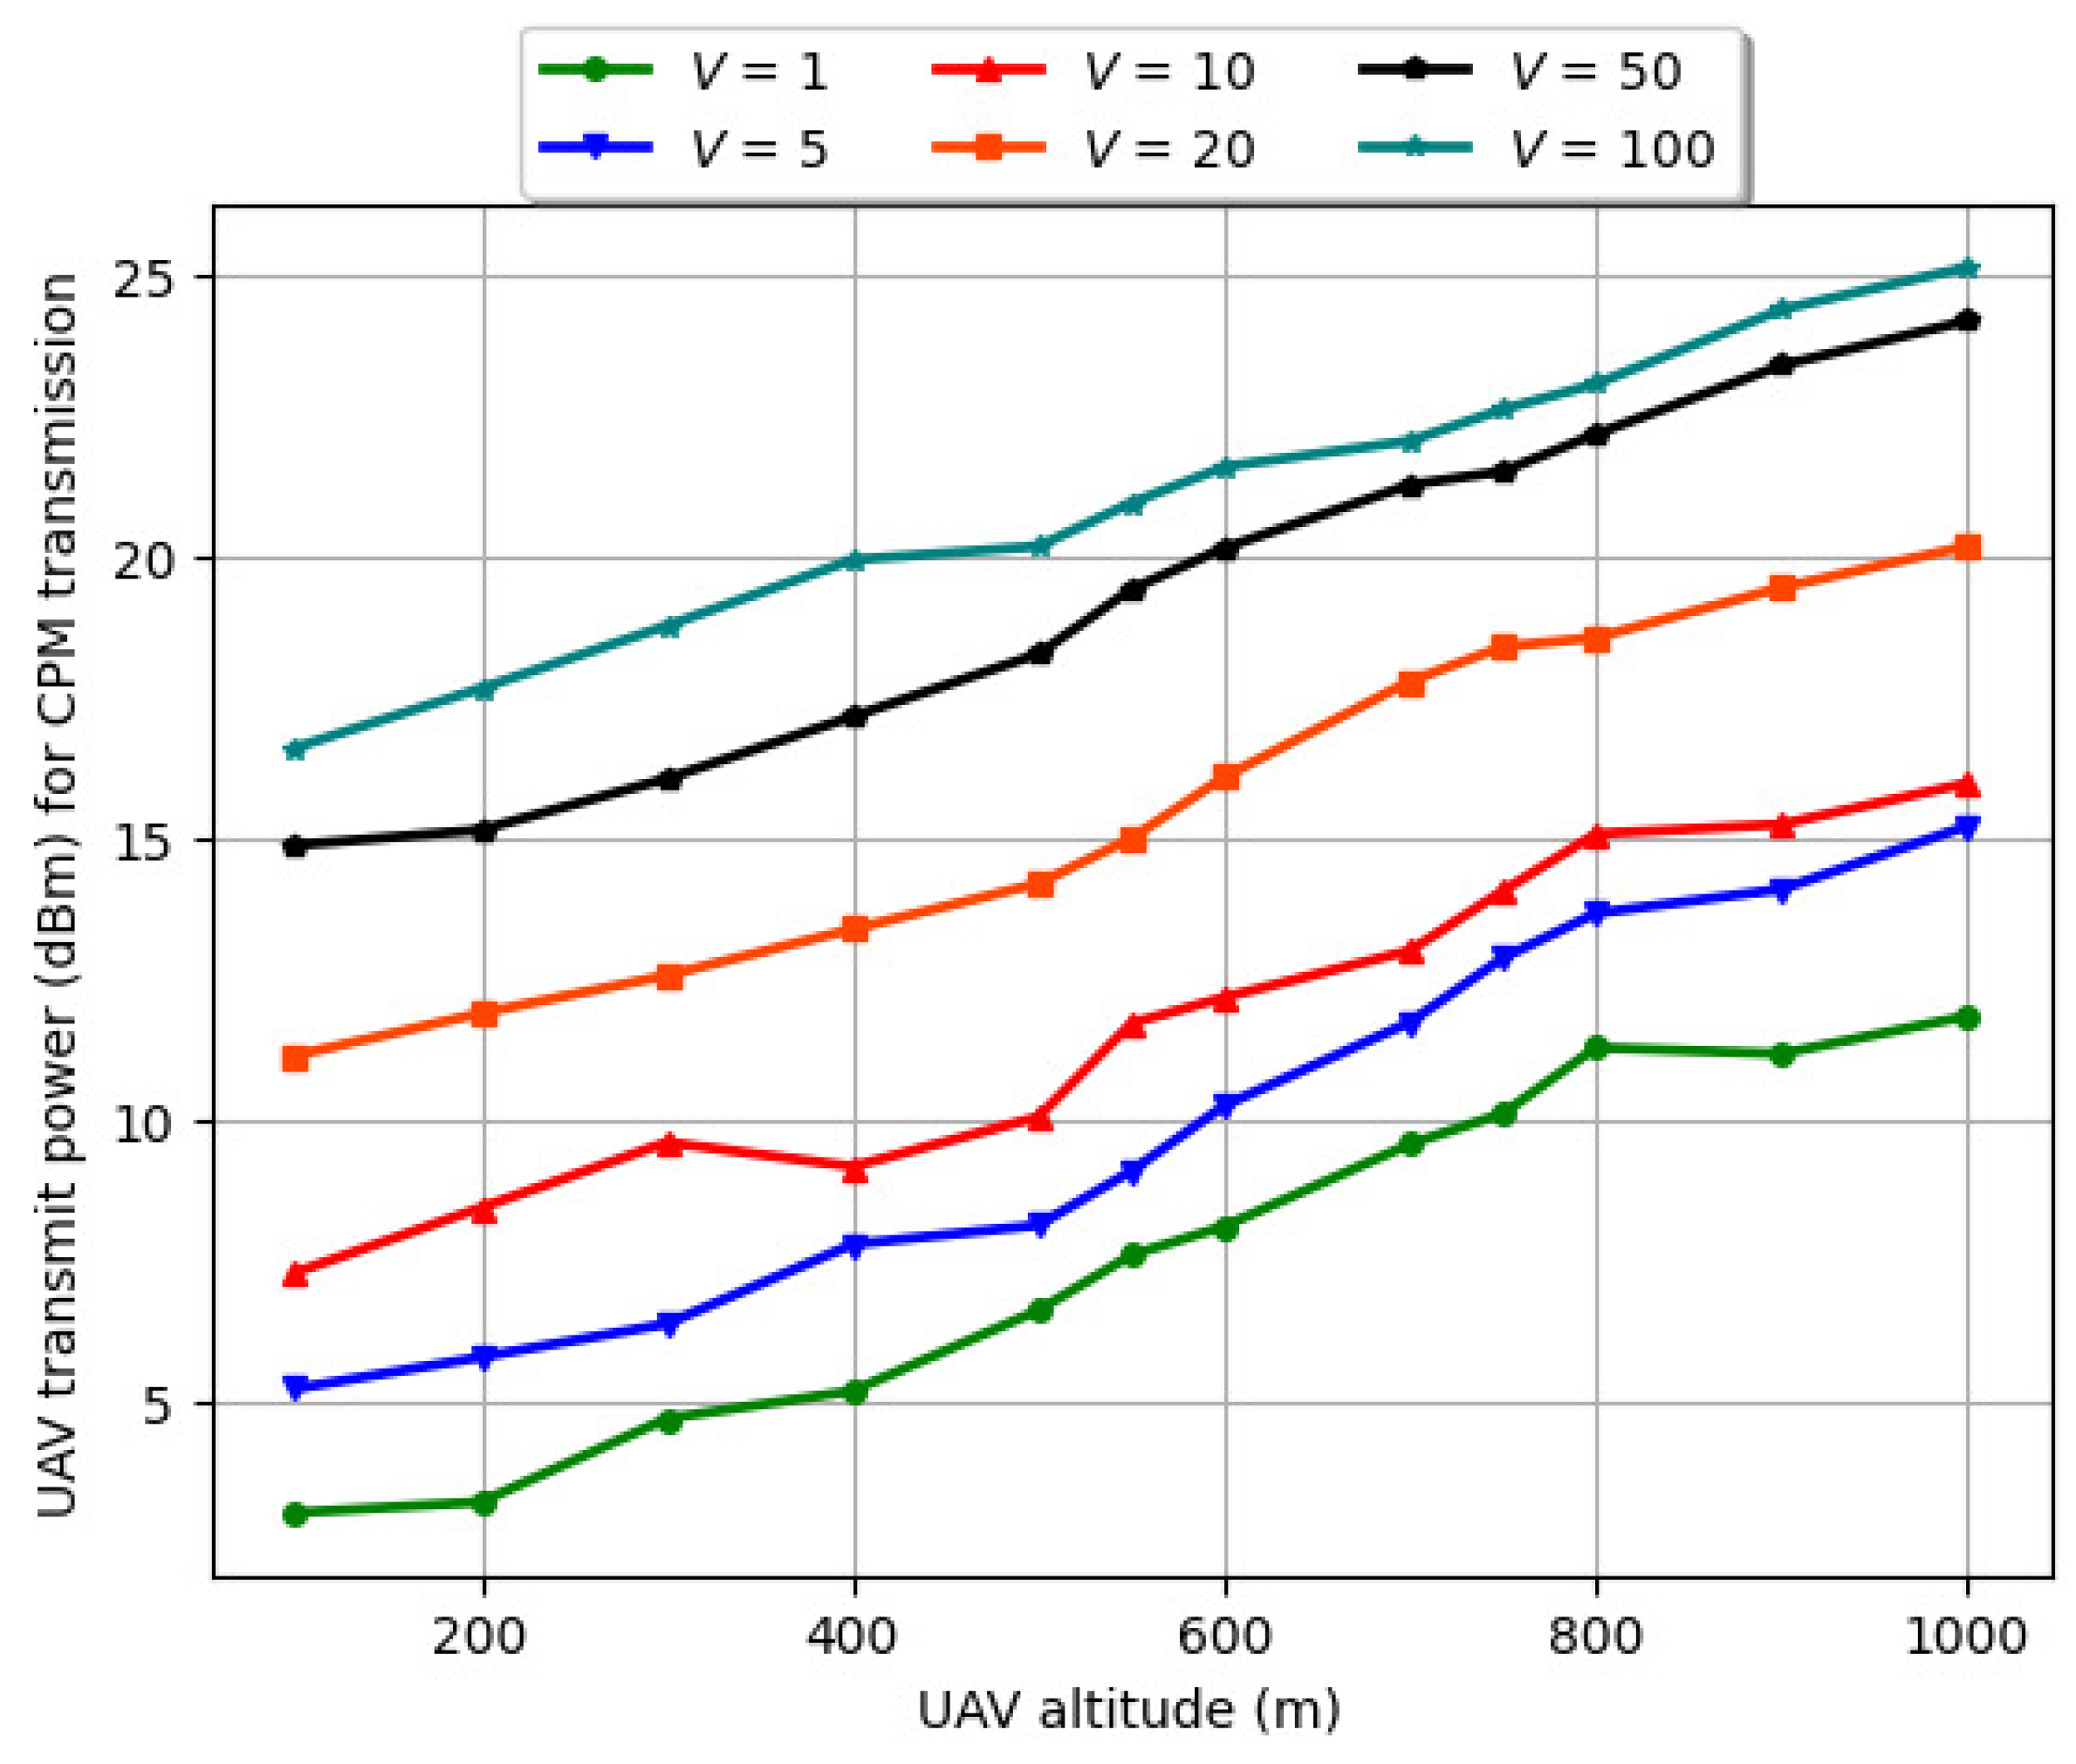
For CPM transmission, the variation in the drone’s transmit power (dBm) with the drone’s altitude (m) for varying V is illustrated in Figure 17 and Figure 18. It is noted from Figure 17 and Figure 18 that when the transmission window length ( L w ) is increased from 20 ms to 50 ms, the drone’s maximum power consumption for V = 100 increases from 25 dBm to 30 dBm. This is attributed to the fact that CPM transmissions are random in nature. Consequently, when L w increases, more packets arrive from the vehicles to the drone and a larger percentage of the packets are queued. This leads to more power consumption at the drone. Similarly, for a smaller T C P M = 200 ms, the number of packets arriving at the drone is less for the similar driving environment. As a result, the drone’s power consumption is marginally higher at 30 dBm. When T C P M = 500 ms, the drone’s power consumption is approximately 25 dBm.
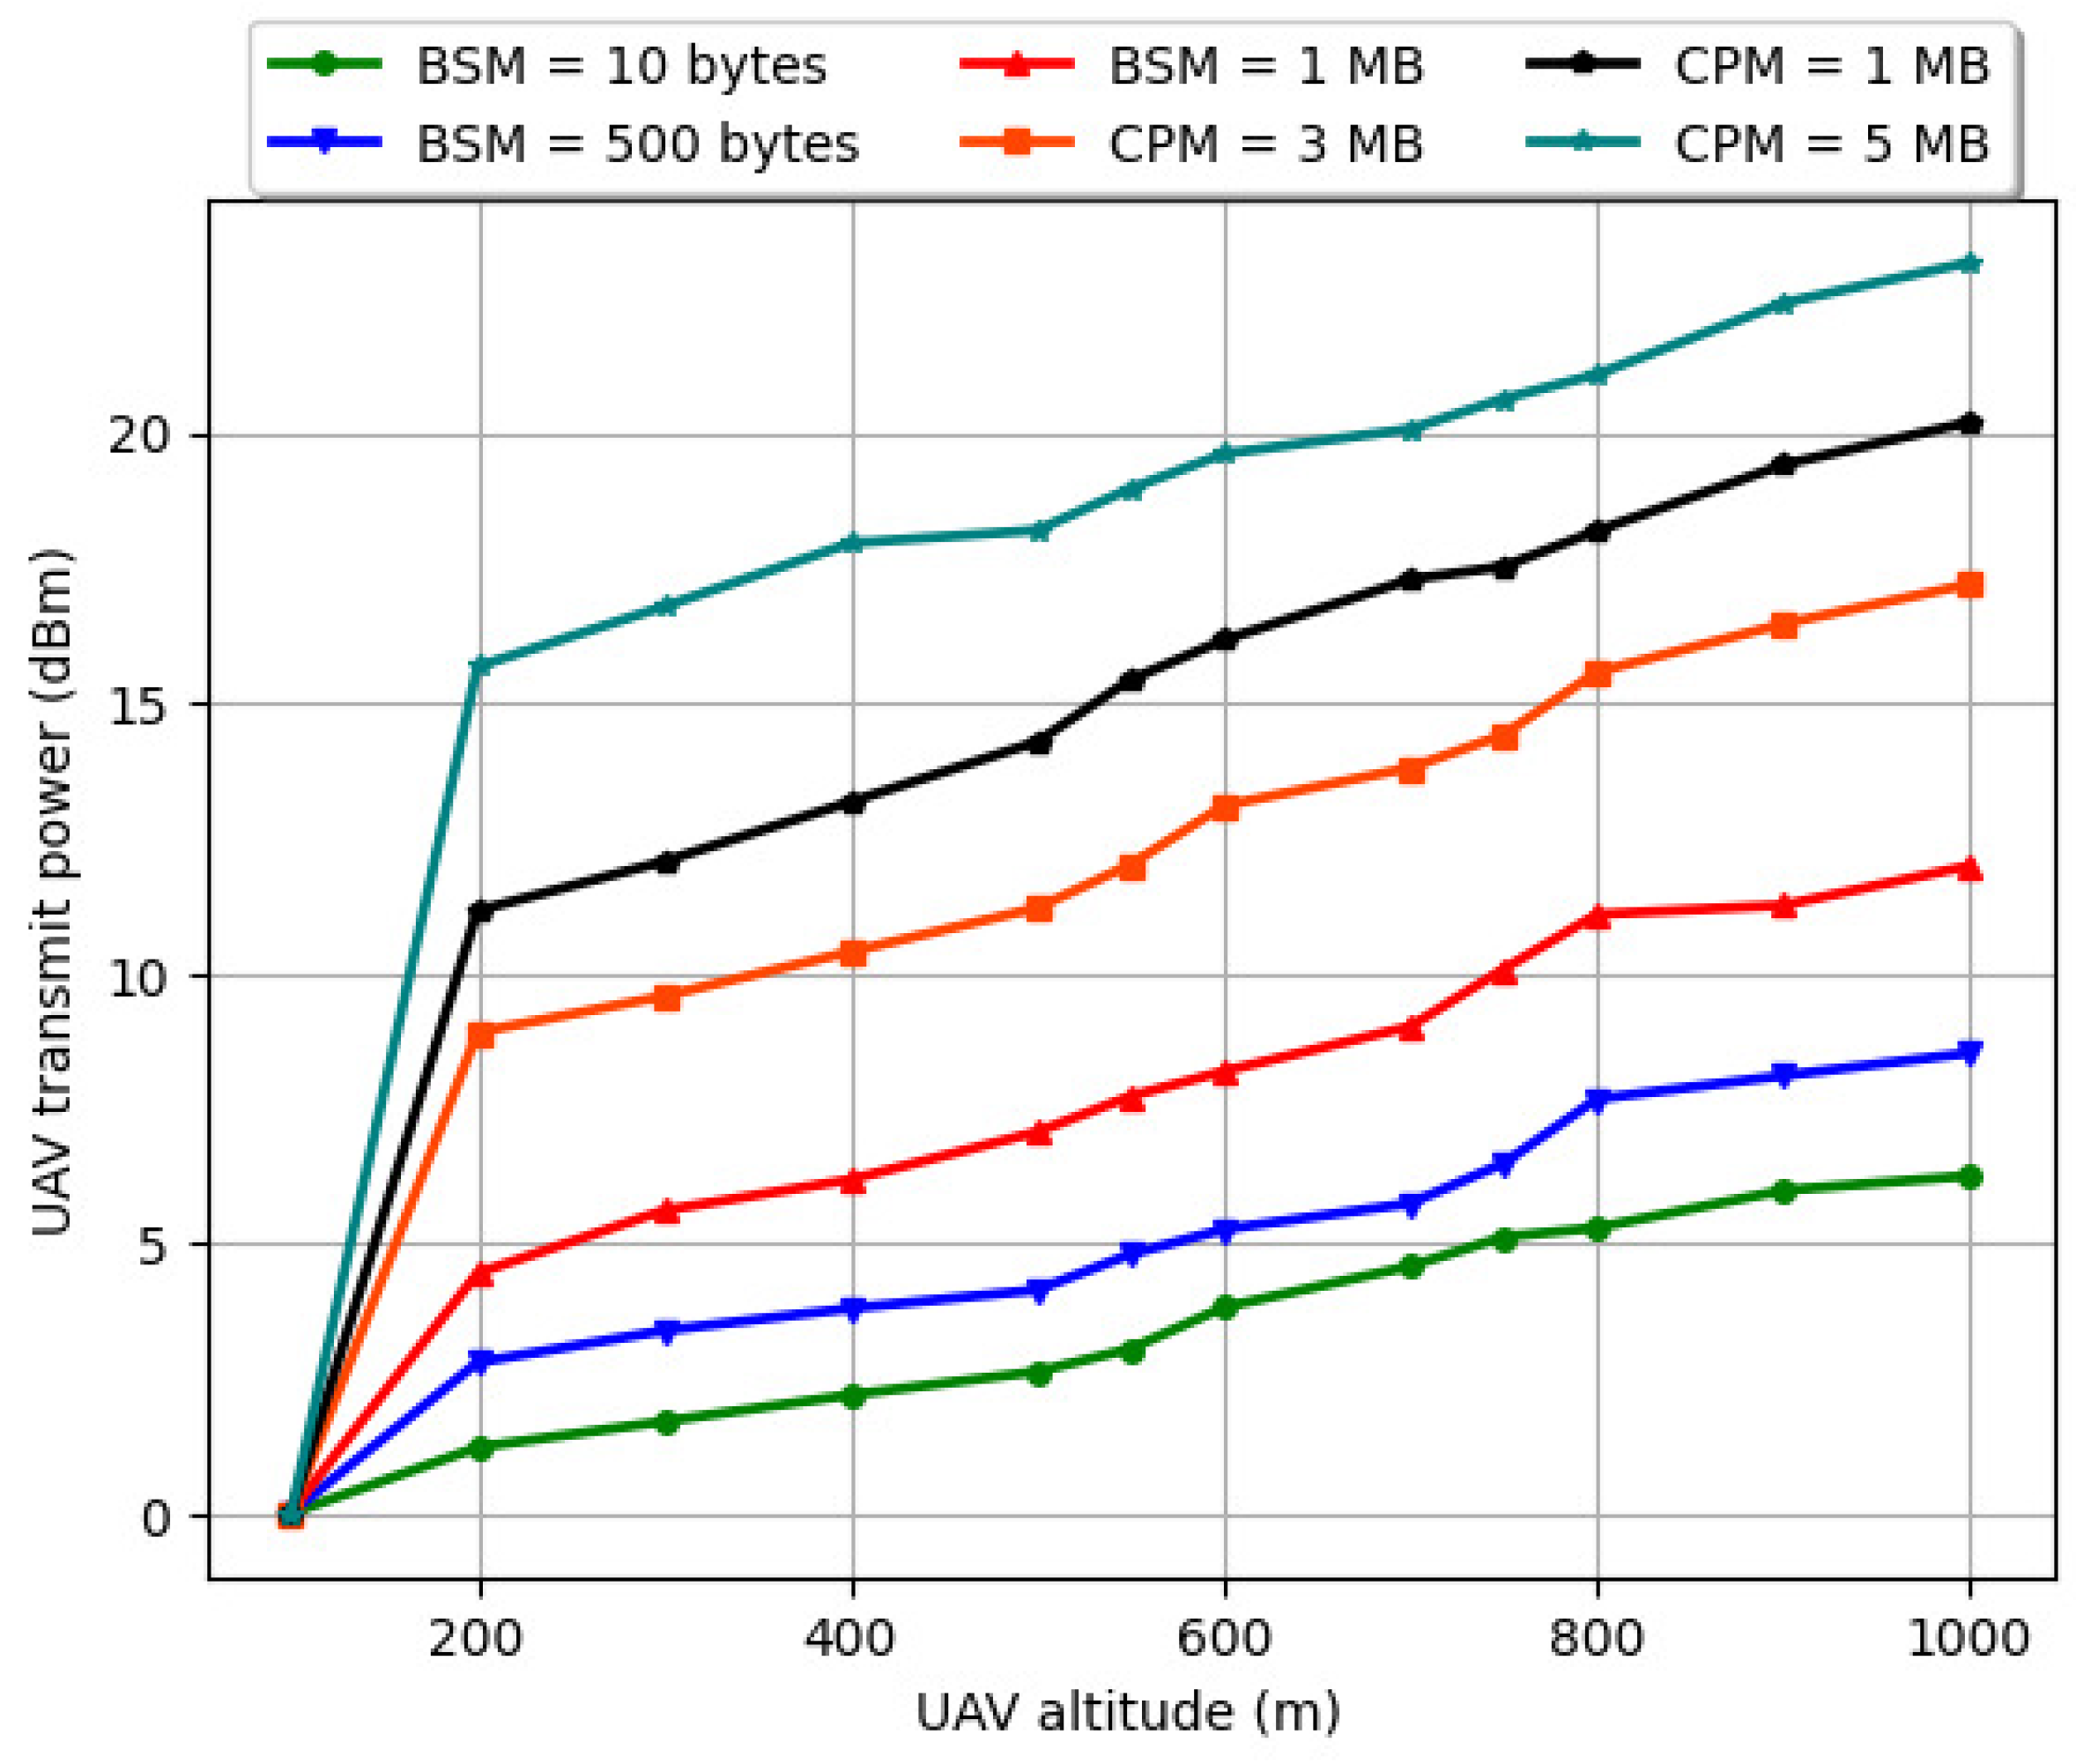
For intermittent BSM and CPM transmissions, the variation in the drone’s transmit power (dBm) with the drone’s altitude (m) for a varying number of vehicles (V) is illustrated in Figure 19. When the BSM packet size is varied from 10 bytes to 1 MB, and CPM packet size is varied from 1 MB to 5 MB, the drone’s power consumption is approximately 24 dBm, which is below the maximum transmit power (30 dBm). Moreover, it is observed from Figure 19 that the drone’s maximum power consumption for intermittent BSM and CPM transmissions is approximately 24 dBm. Furthermore, for an altitude above 200 m, the drone’s power consumption pattern reveals a steady and progressive increase with the number of vehicles and the drone’s altitude, as well as the transmission window length ( L w ). The positive slope of the graphs implies and substantiates this trend, which emphasizes a continuous increase rather than a plateau.

7. Conclusions

This paper presented a discrete-time Markov chain model to improve the communication efficiency of UAV-assisted C-V2X communications. We studied the performance of 3GPP C-V2X mode 4 communication links with a flying drone based on average delay and drone utilization. We considered both BSM and CPM packet communication between vehicles and the drone. The results revealed that the average delay significantly depends on the packet arrival rate for both BSMs and CPMs. Furthermore, the queuing delay does not increase significantly for variations in drone altitude as long as the required packet re-transmissions are minimal.
In addition, we also studied the variation in average delay for various policies that consider the drone occupancy status. It was noted that an optimal policy approximates a threshold-based policy in which the threshold depends on the drone utilization and available energy while covering maximum trajectory at a given altitude. The processing delay varied with the drone occupancy and state-transition rates for both BSM and CPM packets of varying byte sizes and different { λ , μ } values. Another noteworthy metric is the computational complexity of the solution approach, which we propose to consider as a future work. As additional future work, we aim to extend the proposed DTMC approach to compare the delay in a gross data offloading and federated learning scenario. This would give us some critical insights into the effectiveness of FL and FRL approaches in drone-assisted vehicular communications where the data is locally processed before transmission to the drone. We also aim to extend this approach to optimize resource allocation in communication scenarios featuring multiple drones.

Author Contributions

Conceptualization, A.G. and X.N.F.; methodology, A.G.; writing—original draft preparation, A.G.; writing—review and editing, X.N.F.; supervision, X.N.F.; funding acquisition, X.N.F. All authors have read and agreed to the published version of the manuscript.

Funding

This research was funded by NSERC Canada, grant number RGPIN-2024-04924.

Data Availability Statement

The data presented in this study are available on request from the corresponding author as the authors are still working on the topic to extend their work.

Conflicts of Interest

The authors declare no conflict of interest. The funders had no role in the design of the study; in the collection, analyses, or interpretation of data; in the writing of the manuscript, or in the decision to publish the results.

Abbreviations

The following abbreviations are used in this manuscript:
3GPPThird-generation partnership project
5GAAFifth-generation automotive association
6GSixth-generation (Communication networks)
BCDBlock coordinate descent
BSBase station
BSMsBasic safety messages
CAVConnected and automated vehicles
CBRChannel busy ratio
CCCPConCave–convex procedure
C-ITSCo-operative intelligent transport systems
CPMsCooperative perception messages
C-V2XCellular vehicle-to-everything
DNNDeep neural network
DTMCDiscrete time Markov chain
DQNDeep Q-network
DDQNDouble deep Q-network
E2EEnd-to-end
ESEdge Server
ETSIEuropean Telecommunications Standards Institute
FoIFreshness of information
FLFederated learning
FRLFederated reinforcement learning
GHzGigaHertz
ITS-G5Short-range vehicular communication, G5 implies 5.9 GHz frequency band
LoSLine-of-sight
LTELong-term evolution
MACMedium access control
MDPMarkov Decision Process
MFCMobile fog computing
MINLPMixed integer non-linear programming
MLMachine learning
MR-DCMulti-radio access technology with dual connectivity
NRNew radio
PDRPacket delivery ratio
QoSQuality of service
RSURoadside unit
RTTRound trip time
RVIRelative value iteration
SAESociety of automotive engineers
SAGINSpace-air-ground integrated network
SATOASimulated annealing trajectory optimization algorithm
SCASuccessive convex approximation
SCAoISpatial correlation age of information
SPSSensing-based semi persistent scheduling
TFAMTransmission frequency adjustment mechanism
THzTeraHertz
TTITransmission time interval
UAVUnmanned aerial vehicle
VECVehicular edge computing
V2VVehicle to vehicle
VECNsVehicular edge computing networks
VSNsVisual sensor networks
WSNWireless sensor networks

References

  1. Manogaran, G.; Hsu, C.H.; Shakeel, P.M.; Alazab, M. Non-Recurrent Classification Learning Model for Drone Assisted Vehicular Ad-Hoc Network Communication in Smart Cities. IEEE Trans. Netw. Sci. Eng. 2021, 8, 2792–2800. [Google Scholar] [CrossRef]
  2. Liu, Z.; Huang, G.; Zhong, Q.; Zheng, H.; Zhao, S. UAV-Aided Vehicular Communication Design with Vehicle Trajectory’s Prediction. IEEE Wirel. Commun. Lett. 2021, 10, 1212–1216. [Google Scholar] [CrossRef]
  3. Hosseini, M.; Ghazizadeh, R. Stackelberg Game-Based Deployment Design and Radio Resource Allocation in Coordinated UAVs-Assisted Vehicular Communication Networks. IEEE Trans. Veh. Technol. 2023, 72, 1196–1210. [Google Scholar] [CrossRef]
  4. Deng, D.; Wang, C.; Wang, W. Joint Air-to-Ground Scheduling in UAV-Aided Vehicular Communication: A DRL Approach with Partial Observations. IEEE Commun. Lett. 2022, 26, 1628–1632. [Google Scholar] [CrossRef]
  5. Shimizu, T.; Cheng, B.; Lu, H.; Kenney, J. Comparative Analysis of DSRC and LTE-V2X PC5 Mode 4 with SAE Congestion Control. In Proceedings of the 2020 IEEE Vehicular Networking Conference (VNC), New York, NY, USA, 16–18 December 2020; pp. 1–8. [Google Scholar]
  6. Chafii, M.; Bariah, L.; Muhaidat, S.; Debbah, M. Twelve Scientific Challenges for 6G: Rethinking the Foundations of Communications Theory. IEEE Commun. Surv. Tutor. 2023, 25, 868–904. [Google Scholar] [CrossRef]
  7. Bithas, P.S.; Nikolaidis, V.; Kanatas, A.G.; Karagiannidis, G.K. UAV-to-Ground Communications: Channel Modeling and UAV Selection. IEEE Trans. Commun. 2020, 68, 5135–5144. [Google Scholar] [CrossRef]
  8. Stefanovic, C.; Panic, S.; Bhatia, V.; Kumar, N. On Second-Order Statistics of the Composite Channel Models for UAV-to-Ground Communications with UAV Selection. IEEE Open J. Commun. Soc. 2021, 2, 534–544. [Google Scholar] [CrossRef]
  9. Gemici, O.F.; Hokelek, I.; Crpan, H.A. Modeling Queuing Delay of 5G NR with NOMA Under SINR Outage Constraint. IEEE Trans. Veh. Technol. 2021, 70, 2389–2403. [Google Scholar] [CrossRef]
  10. Sempere-García, D.; Sepulcre, M.; Gozalvez, J. LTE-V2X Mode 3 scheduling based on adaptive spatial reuse of radio resources. Ad Hoc Netw. 2021, 113, 102351. [Google Scholar] [CrossRef]
  11. Moreira, I.; Pimentel, C.; Barros, F.P.; Chaves, D.P.B. Modeling Fading Channels with Binary Erasure Finite-State Markov Channels. IEEE Trans. Veh. Technol. 2017, 66, 4429–4434. [Google Scholar] [CrossRef]
  12. NBA, G.P.W.; Haapola, J.; Samarasinghe, T. A Discrete-Time Markov Chain Based Comparison of the MAC Layer Performance of C-V2X Mode 4 and IEEE 802.11p. IEEE Trans. Commun. 2021, 69, 2505–2517. [Google Scholar] [CrossRef]
  13. Kang, B.; Yang, J.; Paek, J.; Bahk, S. ATOMIC: Adaptive Transmission Power and Message Interval Control for C-V2X Mode 4. IEEE Access 2021, 9, 12309–12321. [Google Scholar] [CrossRef]
  14. Molina-Masegosa, R.; Gozalvez, J.; Sepulcre, M. Comparison of IEEE 802.11p and LTE-V2X: An Evaluation with Periodic and Aperiodic Messages of Constant and Variable Size. IEEE Access 2020, 8, 121526–121548. [Google Scholar] [CrossRef]
  15. Wang, B.; Yuan, Z.; Zheng, S.; Liu, Y. Data-Driven Intelligent Receiver for OTFS Communication in Internet of Vehicles. IEEE Trans. Veh. Technol. 2023, 73, 6968–6979. [Google Scholar] [CrossRef]
  16. Gupta, A.; Fernando, X. Federated Reinforcement Learning for Collaborative Intelligence in UAV-assisted C-V2X Communications. Drones 2024, 8, 321. [Google Scholar] [CrossRef]
  17. Fernando, X.; Gupta, A. Analysis of Unmanned Aerial Vehicle-Assisted Cellular Vehicle-to-Everything Communication Using Markovian Game in a Federated Learning Environment. Drones 2024, 8, 238. [Google Scholar] [CrossRef]
  18. González, E.E.; Garcia-Roger, D.; Monserrat, J.F. LTE/NR V2X Communication Modes and Future Requirements of Intelligent Transportation Systems Based on MR-DC Architectures. Sustainability 2022, 14, 3879. [Google Scholar] [CrossRef]
  19. Petrov, T.; Pocta, P.; Kovacikova, T. Benchmarking 4G and 5G-Based Cellular-V2X for Vehicle-to-Infrastructure Communication and Urban Scenarios in Cooperative Intelligent Transportation Systems. Appl. Sci. 2022, 12, 9677. [Google Scholar] [CrossRef]
  20. Ghodhbane, C.; Kassab, M.; Maaloul, S.; Aniss, H.; Berbineau, M. A Study of LTE-V2X Mode 4 Performances in a Multiapplication Context. IEEE Access 2022, 10, 63579–63591. [Google Scholar] [CrossRef]
  21. Thandavarayan, G.; Sepulcre, M.; Gozalvez, J. Generation of Cooperative Perception Messages for Connected and Automated Vehicles. IEEE Trans. Veh. Technol. 2020, 69, 16336–16341. [Google Scholar] [CrossRef]
  22. Thandavarayan, G.; Sepulcre, M.; Gozalvez, J.; Coll-Perales, B. Scalable cooperative perception for connected and automated driving. J. Netw. Comput. Appl. 2023, 216, 103655. [Google Scholar] [CrossRef]
  23. Kunibe, M.; Yamazaki, R.; Murakawa, T.; Shigeno, H. Adaptive Message Prioritization for Vehicular Cooperative Perception at Target Intervals. J. Inf. Process. 2023, 31, 57–65. [Google Scholar] [CrossRef]
  24. Zhang, X.; Wang, H.; Feng, W.; Lin, S. Vehicle Environment Awareness based Messages Transmission Frequency Optimization in C-V2X. IEEE Wirel. Commun. Lett. 2023, 12, 1116–1119. [Google Scholar] [CrossRef]
  25. Zhong, K.; Liu, S.; Fu, L. Throughput Maximization in Cellular Networks with Wireless Backhaul and Energy Harvesting. IEEE Trans. Veh. Technol. 2024, 73, 3551–3567. [Google Scholar] [CrossRef]
  26. Hu, J.; Zhang, H.; Liu, Y.; Li, X.; Ji, H. An Intelligent UAV Deployment Scheme for Load Balance in Small Cell Networks Using Machine Learning. In Proceedings of the 2019 IEEE Wireless Communications and Networking Conference (WCNC), Marrakesh, Morocco, 15–18 April 2019; pp. 1–6. [Google Scholar]
  27. Huq, K.M.S.; Otung, I.E.; Rodriguez, J. A Study of Coverage Probability-Based Energy-Efficiency Analysis for UAV-Aided THz-Enabled 6G Networks. IEEE Trans. Intell. Transp. Syst. 2023, 24, 7404–7411. [Google Scholar] [CrossRef]
  28. Li, D.; Xu, S.; Li, Y. Massive heterogeneous data collecting in UAV-assisted wireless IoT networks. IET Commun. 2023, 17, 1706–1720. [Google Scholar] [CrossRef]
  29. Zhu, X.; Zhou, M. Maximal Weighted Coverage Deployment of UAV-Enabled Rechargeable Visual Sensor Networks. IEEE Trans. Intell. Transp. Syst. 2023, 24, 11293–11307. [Google Scholar] [CrossRef]
  30. Xie, Q.; Zhao, W.; Liu, C.; Peng, L. Task Assignment Optimization in Multi-UAV-Assisted WSNs Considering Energy Budget and Sensor Distribution Characteristics. Sensors 2023, 23, 7842. [Google Scholar] [CrossRef]
  31. Elnabty, I.A.; Fahmy, Y.; Kafafy, M. Framework for fast and low-complexity deployment of UAVs-assisted communication. Phys. Commun. 2023, 61, 102198. [Google Scholar] [CrossRef]
  32. Asim, M.; Junhong, C.; Muthanna, A.; Wenyin, L.; Khan, S.; El-Latif, A.A.A. A novel simulated annealing trajectory optimization algorithm in an autonomous UAVs-empowered MFC system for medical internet of things devices. Wirel. Netw. 2023, 29, 3163–3176. [Google Scholar] [CrossRef]
  33. Zhou, X.; Zhu, Q. Optimization Algorithm for AoI-Based UAV-Assisted Data Collection. Int. J. Distrib. Sens. Netw. 2024, 2024, 6691579. [Google Scholar] [CrossRef]
  34. Xue, T.; Ding, H.; Zhang, H.; Yuan, D. Two-timescale Vehicle Association and Resource Management for C-V2X Networks. IEEE Wirel. Commun. Lett. 2023, 12, 1259–1263. [Google Scholar] [CrossRef]
  35. Liu, Y.; Yang, C.; Chen, X.; Wu, F. Joint Hybrid Caching and Replacement Scheme for UAV-Assisted Vehicular Edge Computing Networks. IEEE Trans. Intell. Veh. 2024, 9, 866–878. [Google Scholar] [CrossRef]
  36. Lin, N.; Fu, L.; Zhao, L.; Min, G.; Al-Dubai, A.; Gacanin, H. A Novel Multimodal Collaborative Drone-Assisted VANET Networking Model. IEEE Trans. Wirel. Commun. 2020, 19, 4919–4933. [Google Scholar] [CrossRef]
  37. Chai, J.; Meng, Y.; Wang, W.; Lyu, Y.; Yue, H.; Liu, X. Task scheduling of computation-intensive graph jobs in UAV-assisted hybrid vehicular networks. Veh. Commun. 2023, 42, 100630. [Google Scholar] [CrossRef]
  38. Yan, X.; Fang, X.; Deng, C.; Wang, X. Joint Optimization of Resource Allocation and Trajectory Control for Mobile Group Users in Fixed-Wing UAV-Enabled Wireless Network. IEEE Trans. Wirel. Commun. 2024, 23, 1608–1621. [Google Scholar] [CrossRef]
  39. Nguyen, M.D.; Le, L.B.; Girard, A. Integrated Computation Offloading, UAV Trajectory Control, Edge-Cloud and Radio Resource Allocation in SAGIN. IEEE Trans. Cloud Comput. 2024, 12, 100–115. [Google Scholar] [CrossRef]
  40. Zhang, S.; Liu, W.; Ansari, N. Completion Time Minimization for Data Collection in a UAV-enabled IoT Network: A Deep Reinforcement Learning Approach. IEEE Trans. Veh. Technol. 2023, 72, 14734–14742. [Google Scholar] [CrossRef]
  41. Chetlur, V.V.; Dhillon, H.S. Coverage and Rate Analysis of Downlink Cellular Vehicle-to-Everything (C-V2X) Communication. IEEE Trans. Wirel. Commun. 2020, 19, 1738–1753. [Google Scholar] [CrossRef]
  42. Bedewy, A.M.; Sun, Y.; Kompella, S.; Shroff, N.B. Optimal Sampling and Scheduling for Timely Status Updates in Multi-Source Networks. IEEE Trans. Inf. Theory 2021, 67, 4019–4034. [Google Scholar] [CrossRef]
  43. Plaisted, D. Some Polynomial and Integer Divisibility Problems are NP-Hard. SIAM J. Comput. 1978, 7, 458–464. [Google Scholar] [CrossRef]
Figure 1. Introduced and accumulated delays in UAV (drone)-assisted C-V2X communication. We assume that the cloud server for computing and data processing is located at the drone. Data packets collected from vehicle sensors are stored at a local queue. In each transmission time interval (TTI), randomly sized packets are transmitted to the drone.
Drones 08 00600 g001
Figure 2. System Model: Delay is accumulated as vehicles in different clusters capture and transmit sensor data to the UAV (drone) in the form of BSMs and CPMs. From the UAV, control signals are transmitted back to the vehicles to facilitate driving actions.
Drones 08 00600 g002
Figure 3. Proposed solution approach using DTMC and relative value iteration for UAV-assisted C-V2X communications environment for transmission of basic safety messages (BSMs) and cooperative perception messages (CPMs).
Drones 08 00600 g003
Figure 4. State transitions for an edge server (ES) with utilization ( ρ ) and three states: S i , S t , and S t + 1 .
Drones 08 00600 g004
Figure 5. State transitions for a drone with packet arrival rate ( λ ) and initial state ( S i ). Note, due to constraints C2, C5, and C6, a drone state is relevant as long as the vehicle’s transmission window ( L w ) is active.
Drones 08 00600 g005
Figure 6. Variation of average delay with inter-arrival time of basic safety messages.
Drones 08 00600 g006
Figure 7. Variation of average packet delay for BSMs with number of vehicles (V), varying vehicle speed, and road length ( R L ). Here, L w = 20 ms and T B S M = 1000 ms.
Drones 08 00600 g007
Figure 8. Variation of average packet delay for BSMs with number of vehicles (V), varying vehicle speed, and road length ( R L ). Here, L w = 20 ms and T B S M = 200 ms.
Drones 08 00600 g008
Figure 9. Variation of average packet delay for BSMs with number of vehicles (V), varying vehicle speed, and road length ( R L ). Here, L w = 50 ms and T B S M = 200 ms.
Drones 08 00600 g009
Figure 10. Variation of average delay for CPMs with number of vehicles (V) for different L w and T C P M pairs.
Drones 08 00600 g010
Figure 11. Variation of average delay with inter-arrival time of CPMs for varying ( λ ).
Drones 08 00600 g011
Figure 12. Variation of average packet delay for CPMs with number of vehicles (V), varying vehicle speed, and road length ( R L ). Here, L w = 20 ms and T C P M = 200 ms, λ = 1000 packets/s.
Drones 08 00600 g012
Figure 13. Variation of average packet delay for CPMs with number of vehicles (V), varying vehicle speed, and road length ( R L ). Here, L w = 20 ms and T C P M = 500 ms, λ = 2000 packets/s.
Drones 08 00600 g013
Figure 14. Variation of drone’s average energy consumption with number of vehicles (V) for varying vehicle speed and road length ( R L ).
Drones 08 00600 g014
Figure 15. Variation of drone’s transmit power vs. drone’s altitude (m) with number of vehicles (V) for varying vehicle speed. Here, R L = 1 km, L w = 20 ms, and T B S M = 1000 ms.
Drones 08 00600 g015
Figure 16. Variation of drone’s transmit power vs. drone’s altitude (m) for BSMs with number of vehicles (V) for varying vehicle speed. Here, R L = 2 km, L w = 50 ms, and T B S M = 200 ms.
Drones 08 00600 g016
Figure 17. Variation of drone’s transmit power vs. drone’s altitude (m) for CPMs with number of vehicles (V) for varying vehicle speed. Here, R L = 1 km, L w = 20 ms, and T C P M = 200 ms, λ = 1000 packets/s.
Drones 08 00600 g017
Figure 18. Variation of drone’s transmit power vs. drone’s altitude (m) for CPMs with number of vehicles (V) for varying vehicle speed. Here, R L = 2 km, L w = 50 ms, and T C P M = 500 ms, λ = 2000 packets/s.
Drones 08 00600 g018
Figure 19. Variation in overall transmit power (dBm) of the drone with altitude for varying packet sizes of BSMs and CPMs.
Drones 08 00600 g019
Table 1. Definition of some key symbols and parameters used in this paper.
SymbolDefinition
q = [ q 1 , q 2 , , q n ] UAV trajectory at different time steps
C Vehicle cluster
V Number of vehicles in a cluster C
k e Number of edge servers
λ e Packet arrival rate
μ e Packet departure rate
ρ e Utilization of the e t h edge server
M / M / k                    Queuing model considered in this paper
P Q e Probability of a packet being queued at the e t h ES
E [ T Q e ] Queuing delay of the e t h ES
π 0 Steady-state probability that the e t h ES is available
π β Steady-state probability that β number of edge servers are occupied
p w Size of the batch of packets arriving at the drone in a transmission window
d w The number of packets that depart the queue in a TTI
c w Capacity of the queue
L w 1 Queue length at the end of the previous window
U Drone utilization
Ψ v i Size of the data transmitted from vehicle v, accumulated at the i t h ES
D Average delay experienced by a batch of packets
Ψ u Size of packets arriving at the drone
N u Number of packets arriving at the drone in a single transmission window
R L Varying road lengths considered in this work
Ψ v i Size of data transmitted from vehicle v, accumulated at the i t h ES
P u Number of packets transmitted to the drone
α The queuing probability at the ( i t h ) ES remains below this predefined value
π S ζ , π S ζ + 1 Steady-state probability distributions
D p m Process where drone is busy when packet (m) arrives at the drone
D ¯ p m Successful arrival of packet (m) at the drone
s u a v ( t ) Drone state-space
δ u a v ( t ) Time spent by packets in the queue waiting to arrive at the drone
u b ( t ) Occupancy indicator for the buffer queue { 0 , 1 }
u s ( t ) Drone occupancy indicator { 0 , 1 }
U b ( t ) Occupancy indicator for the transmission queue { 0 , 1 }
U s ( t ) Cumulative occupancy indicator for the drone in a TTI
Δ U b ( t ) Status update at the drone
Δ U s ( t ) Duration for which packet is processed at the drone
C ( s u a v ( t ) , a u a v ( t ) ) Cost of selecting an action a u a v ( t ) when the drone is in the state s u a v ( t )
P s u a v ( t ) s , a State-transition probability of the agent
φ An irrelevant delay when the drone is idle
R { 0 , 1 } Real number between 0 and 1
f { λ , μ } Function that depends on packet arrival rate and service rate
[ δ ] Δ Processing delay experienced by a packet following the queuing delay
π * ( s u a v ( 0 ) ) An optimal policy for the state change with minimal delay
V s * Set of optimal values for all states ( s S )
Table 2. Simulation parameters.
ParameterValue
Vehicle MobilityManhattan Mobility
Number of vehicles (V)1–100
Number of drones1
Drone deployment altitude100 m–2 km
Edge server locationIn-vehicle
Communication frequency5.9 GHz
Distance between vehicles10–100 m
Modulation technique16-QAM
Road length1–5 km
Vehicle speed0–100 kmph
Payload size for BSM, CPM1 byte–3 Megabytes
T B S M 100 ms–1000 ms
T C P M 100, 200, 300, 500 ms
λ 1000, 2000 packets/s
Mean speed of vehicles50 km/h
Drone transmission power30 dBm (1000 mW)
Drone receiving threshold−80 dBm
Vehicle transmission power25 dBm (316.2 mW)
Standard deviation in speed10 km/h
Disclaimer/Publisher’s Note: The statements, opinions and data contained in all publications are solely those of the individual author(s) and contributor(s) and not of MDPI and/or the editor(s). MDPI and/or the editor(s) disclaim responsibility for any injury to people or property resulting from any ideas, methods, instructions or products referred to in the content.