YOLO-RWY: A Novel Runway Detection Model for Vision-Based Autonomous Landing of Fixed-Wing Unmanned Aerial Vehicles
Abstract
1. Introduction
- With the ability to hover, rotary-wing UAVs utilize a relatively straightforward landing control strategy [6], therefore VAL has been successfully applied to rotary-wing UAVs [28,29,30]. In contrast, fixed-wing UAVs have much higher speeds, requiring the establishment of a stable landing configuration [31]. This results in a lower error tolerance, making the landing more challenging [32]. Moreover, in the safety-critical aviation field, runway detection models in VAL systems must meet rigorous requirements for robustness and safety. This necessitates sufficient stability, resistance to interference, and the ability to withstand potential adversarial attacks [26,33].
- Rotary-wing UAVs typically rely on downward-facing cameras to detect landing targets that are visually simple and specifically designed for easy recognition, often operating under favorable visual conditions [6]. In contrast, fixed-wing UAVs often operate in large-scale environments and perform long-endurance missions, where landing runways present complex textures, backgrounds, lighting conditions, perspectives, and weather, making accurate detection and positioning more difficult [23].
- Previous research primarily utilizes satellite remote-sensing runway datasets [34]. However, VAL systems require images captured by forward-looking cameras during landing, which is more vulnerable to challenges posed by complex lighting, atmospheric conditions, adverse weather, unique perspectives, and distortions [27]. Acquiring front-looking runway images is challenging due to flight management and safety considerations, leading to a lack of large-scale, high-quality, and diverse runway detection datasets. Although simulation engines can generate synthetic images, there is still a considerable disparity in diversity and feature distribution [27].
- Due to constraints on computational load, power consumption, and the weight of onboard embedded devices, VAL requires lightweight runway detection models that balance real-time performance and accuracy, thereby minimizing the impact on flight performance [24].
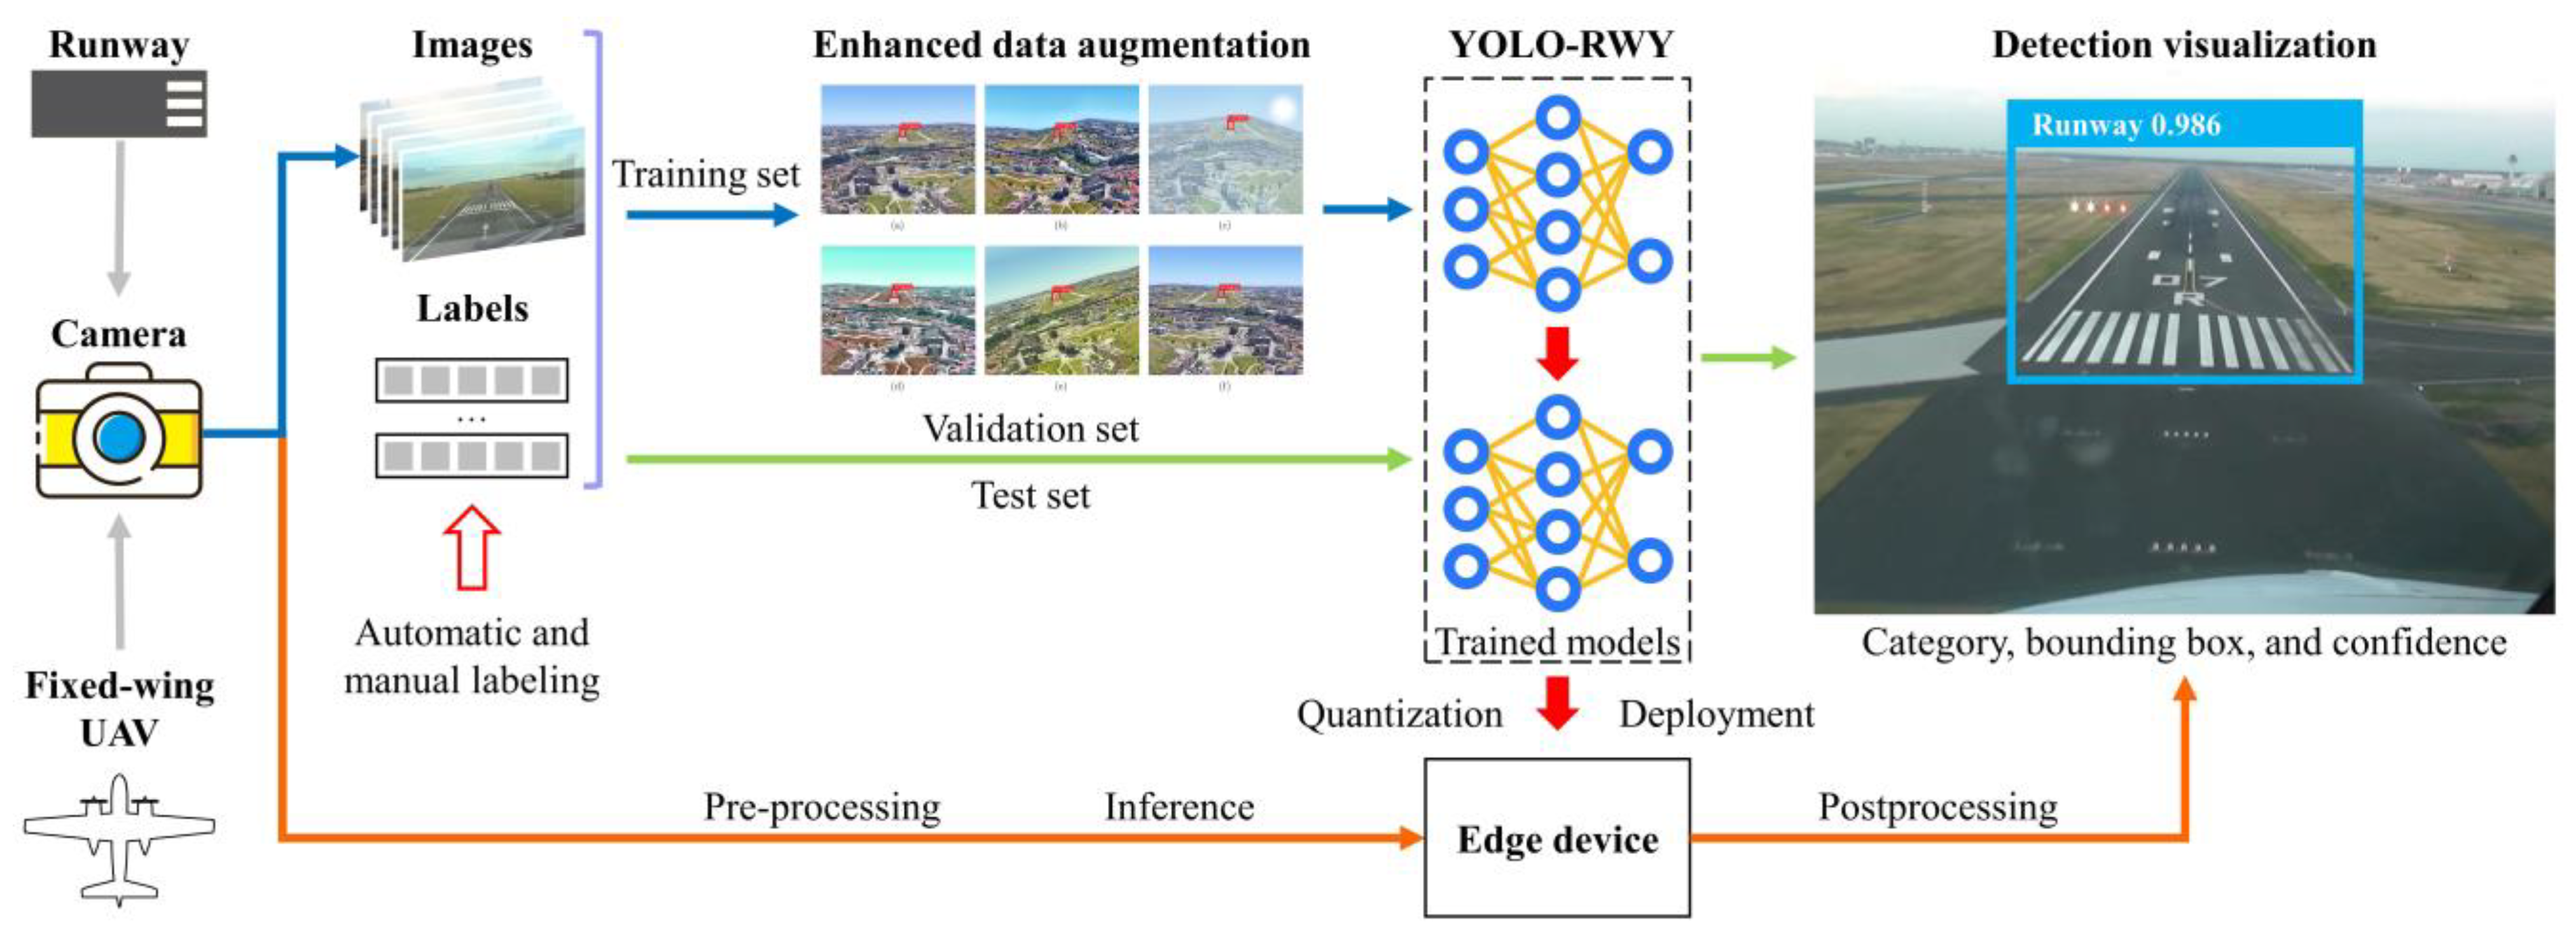
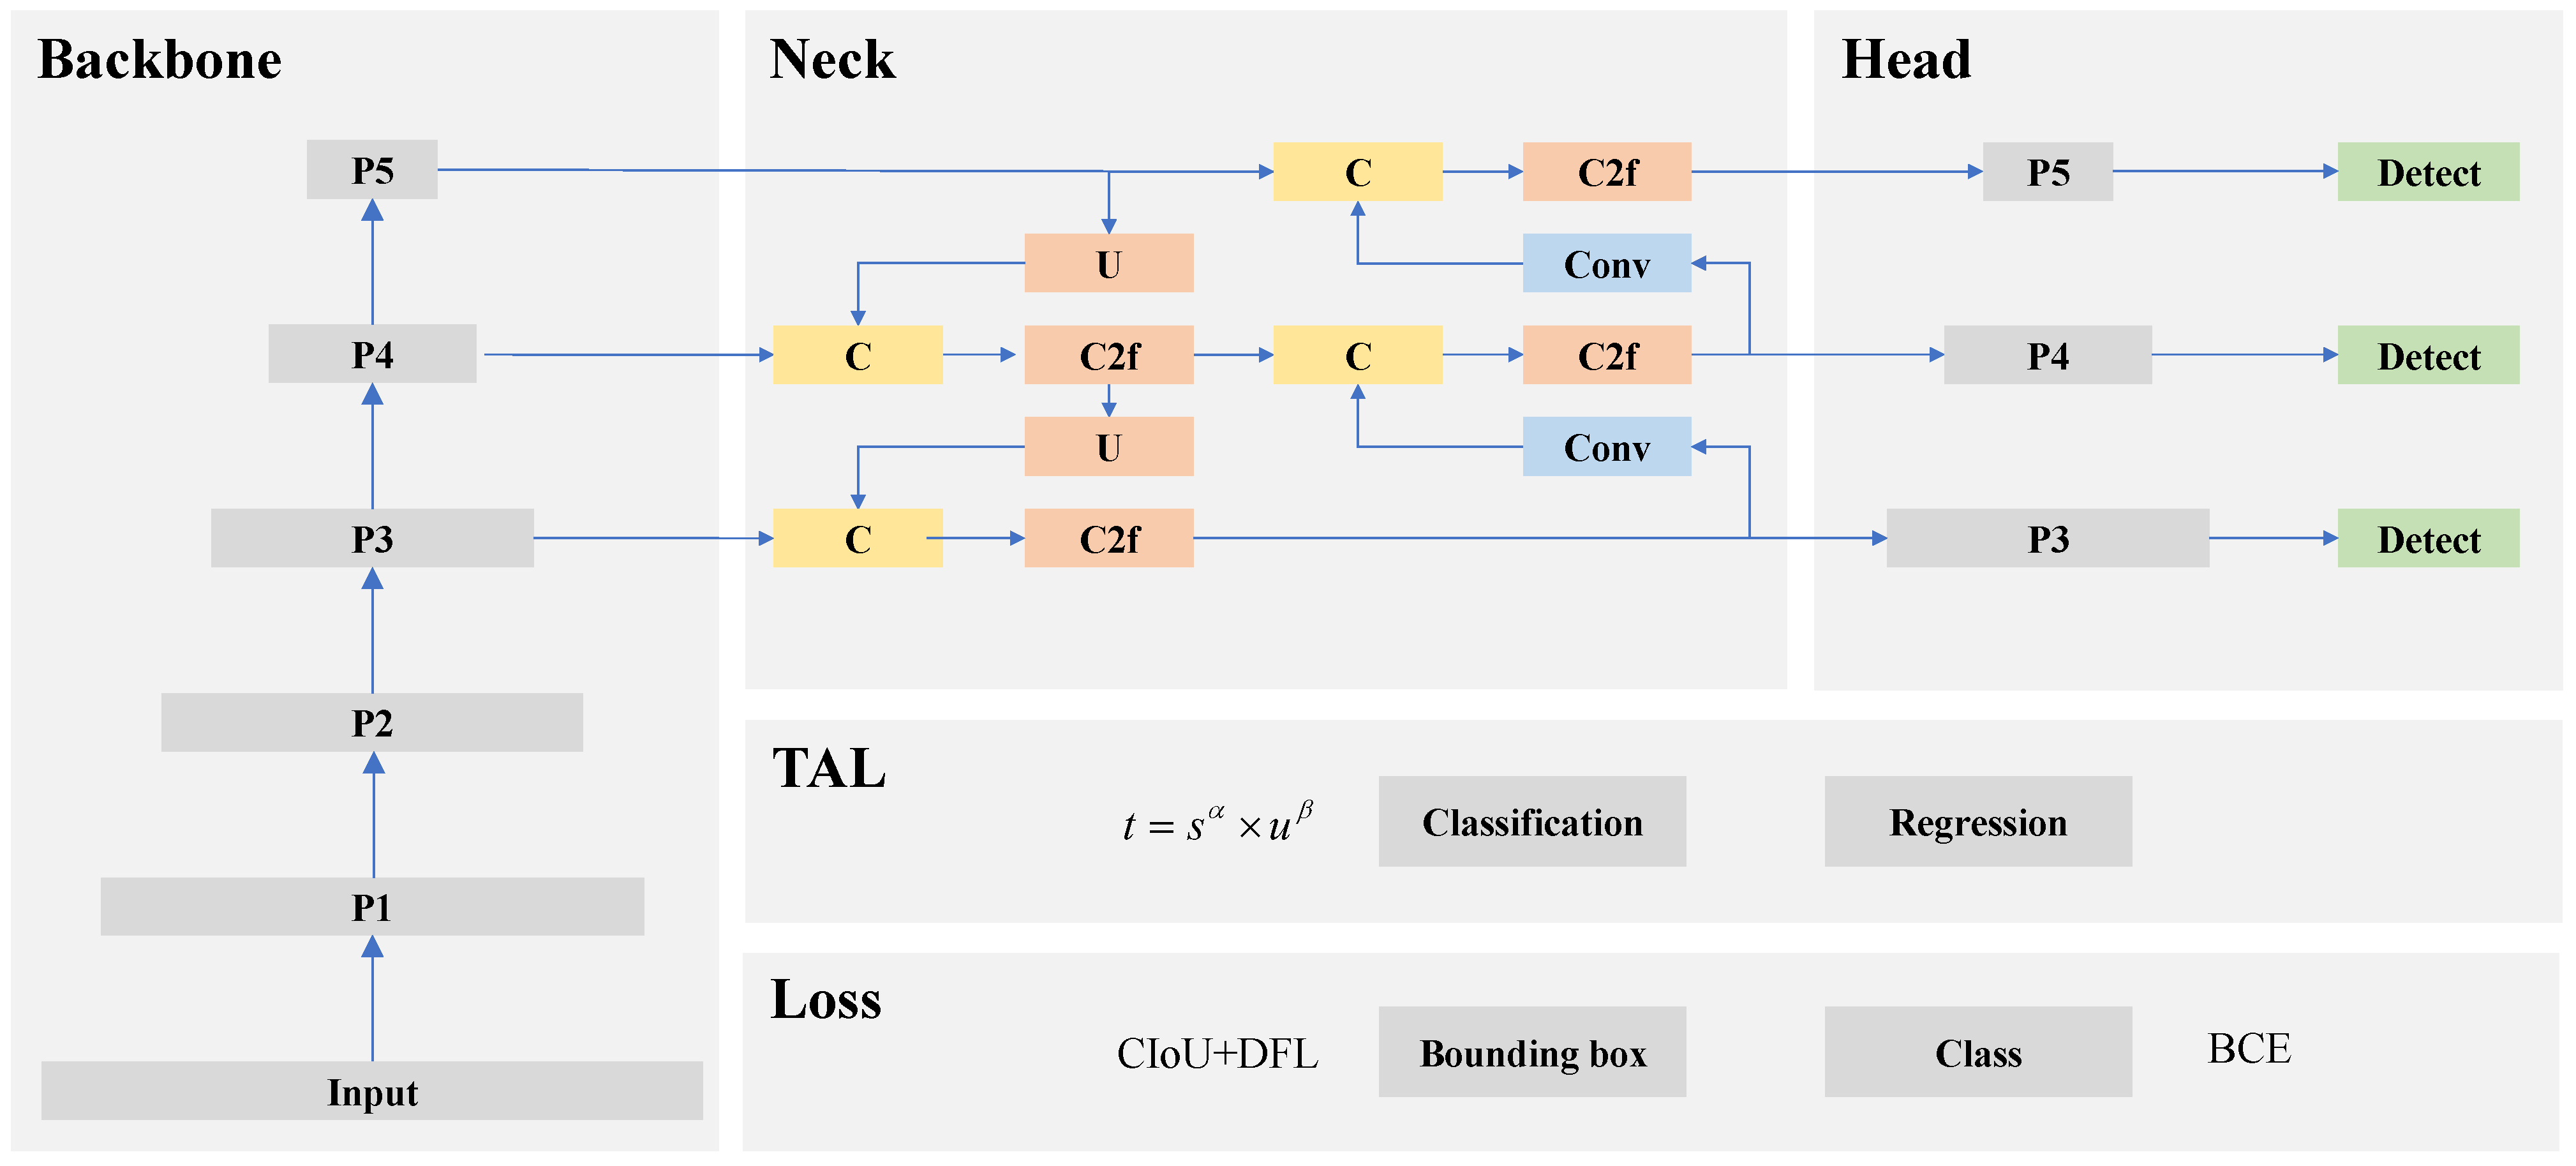
- The YOLO-RWY model is constructed based on the powerful single-stage, anchor-free, and decoupled you only look once v8 (YOLOv8) model architecture, with several key modules introduced to optimize the landing runway detection performance. The proposed model meets the requirements of the VAL system for accurate and real-time runway perception.
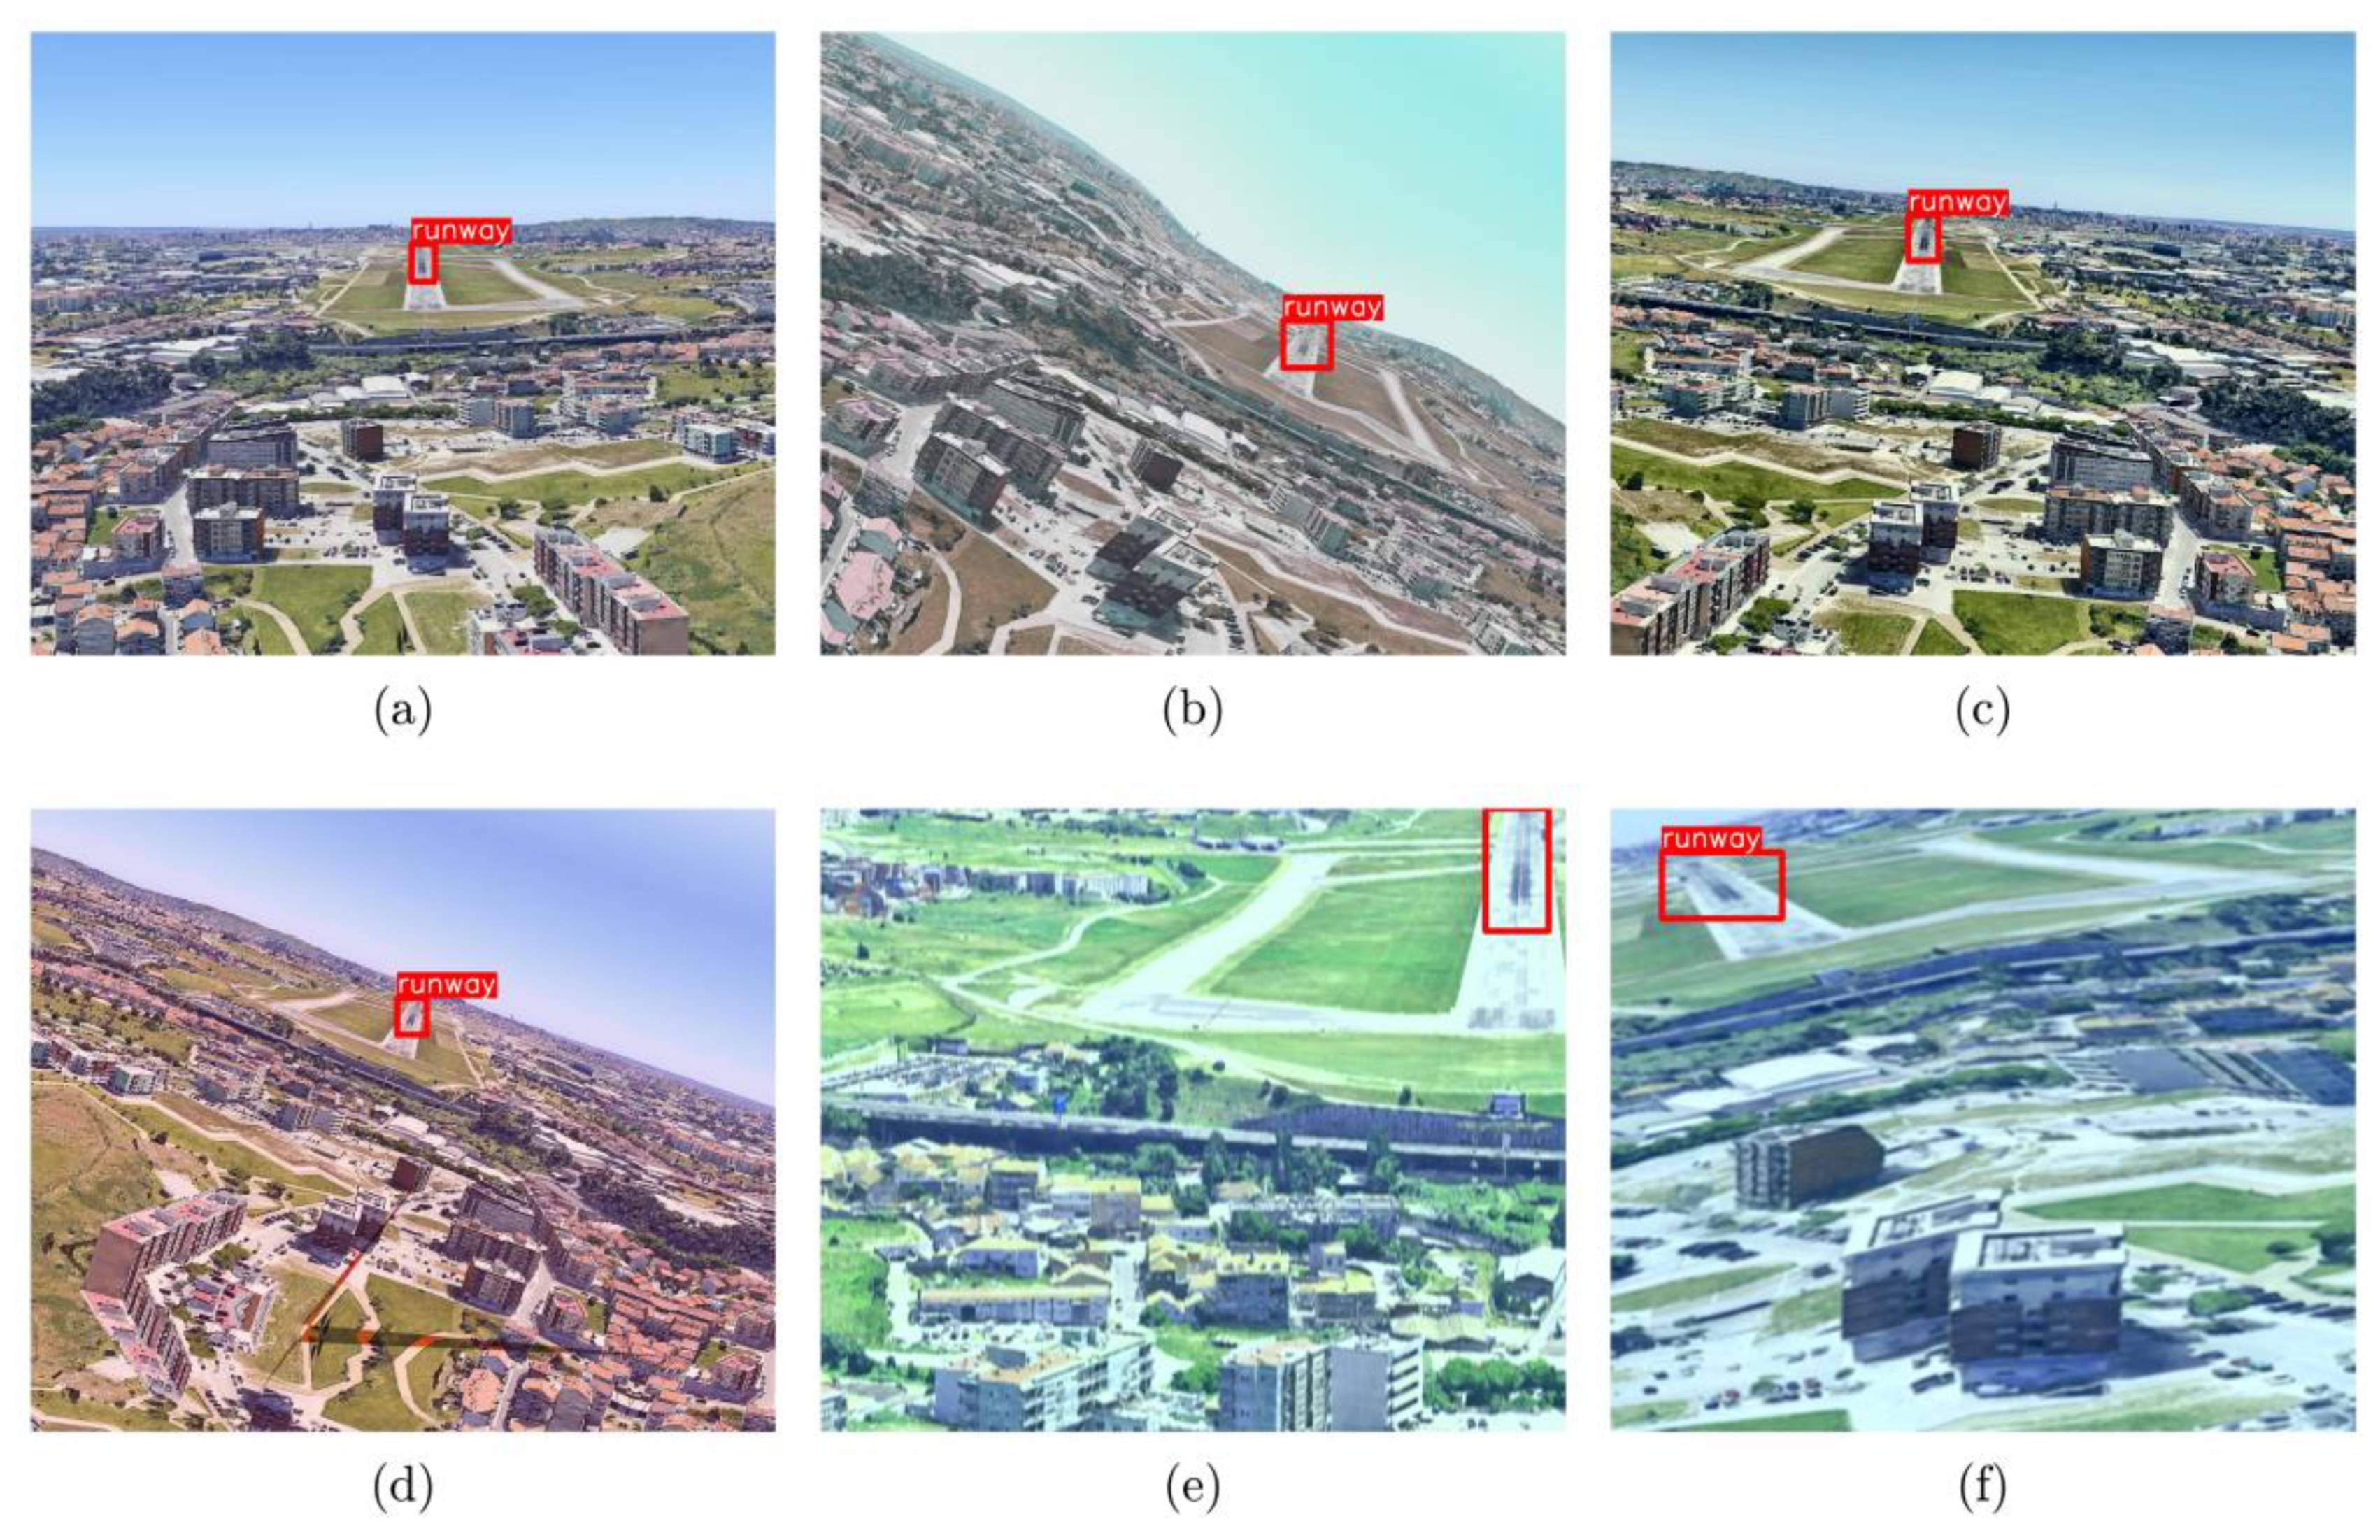
- Given the limitations of training images regarding representation diversity and the safety requirements in aviation applications for resisting disturbances, an enhanced data augmentation (EDA) module is proposed. EDA provides richer, more diverse, and more complex augmentations during training, including methods for augmenting color, geometry, blur, weather, and image quality. By randomly applying these augmentations, perturbations and enhancements are introduced, and the generalization, robustness, and safety of the model are improved, enabling accurate runway detection under various complex conditions.
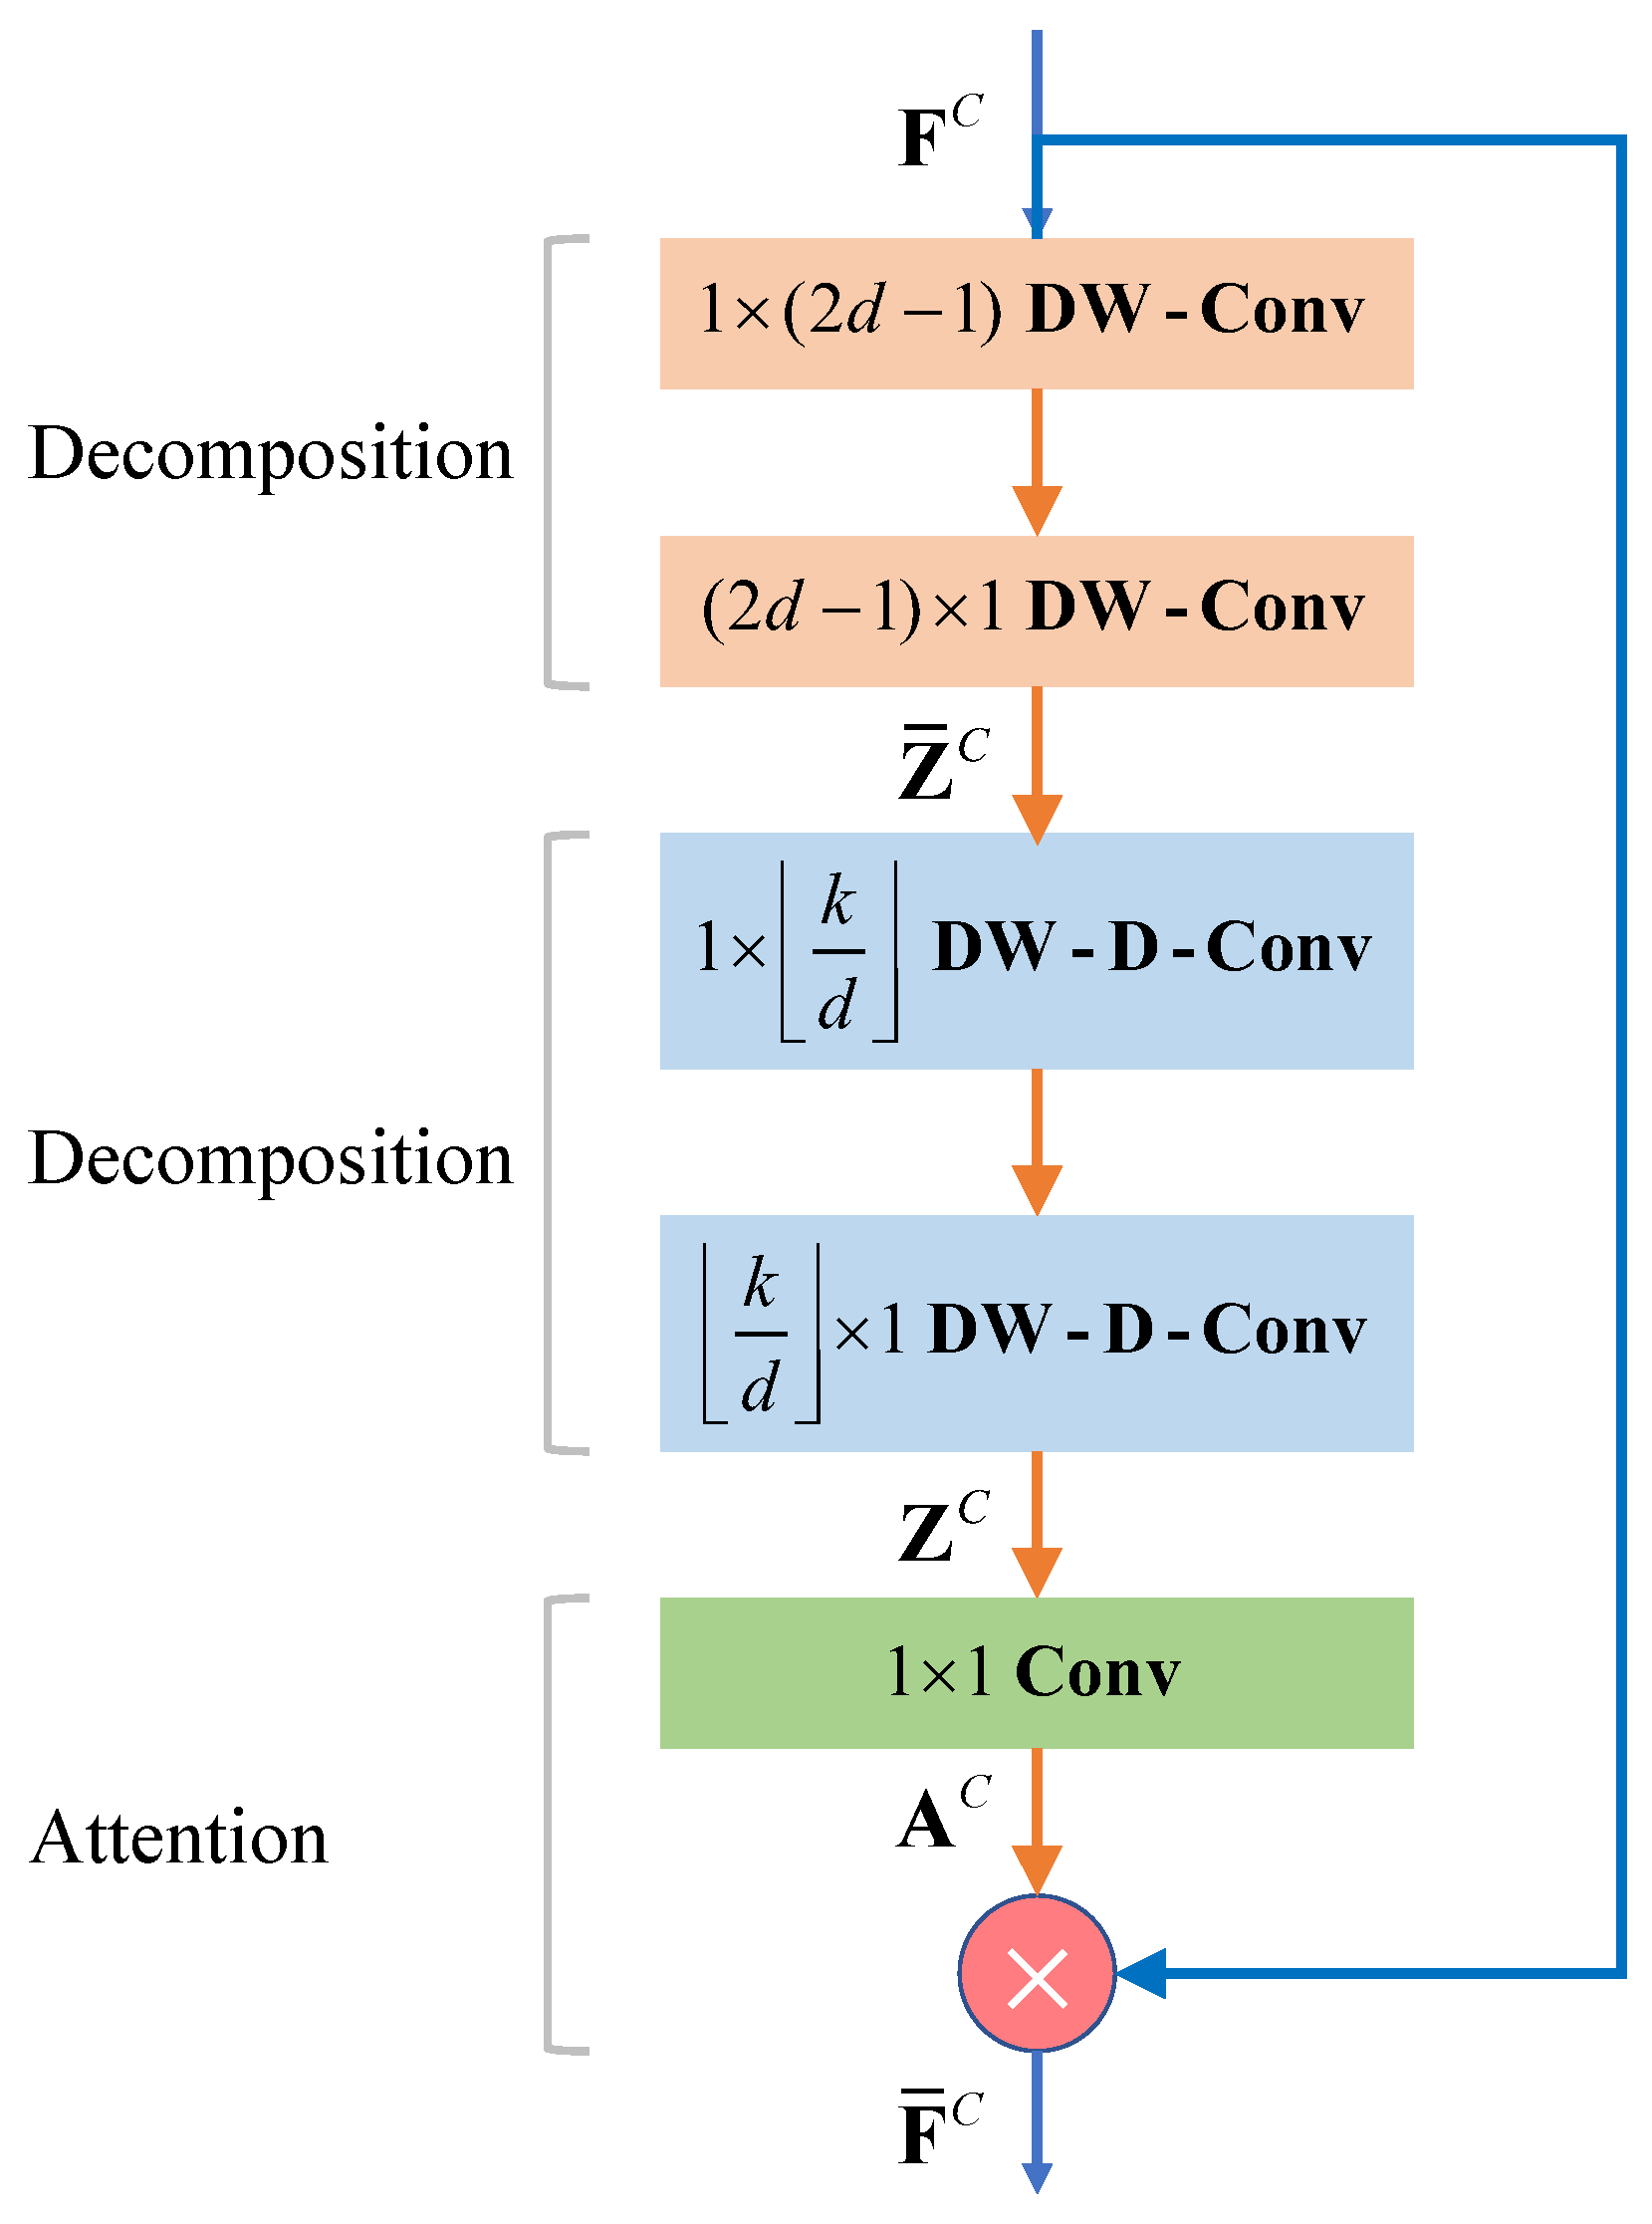
- To account for variations in runway scales, orientations, aspect ratios, textures, backgrounds, and visual disturbances, three key modules, namely large separable kernel attention (LSKA), bidirectional feature pyramid network (BiFPN), and efficient intersection over union (EIoU) are introduced to optimize the model structure and training. (a) LSKA enhances long-range dependency modeling capabilities using large kernels and encodes more shape-related information, aiding in detecting runways with varying shapes. (b) BiFPN offers lightweight, weighted multi-scale feature aggregation, beneficial for detecting runways of different scales and distances. (c) EIoU provides a more comprehensive and effective description of bounding box differences, optimizing both the sample assignment and regression loss, thereby improving model convergence and performance.
- Extensive experiments demonstrate the superior accuracy, speed, and robustness of the proposed YOLO-RWY model. Experiments show that the proposed model achieves an accuracy of 0.760, 0.611, 0.413, and 0.578 on the synthetic, real nominal, real edge, and overall real test sets, respectively, with improvements of 0.8%, 4.3%, 18.7%, and 6.1%, despite being trained solely on the training set composed of synthetic samples. When further finetuned with real-world data, the proposed model demonstrated a 40.2% performance improvement on the real edge test set, increasing from 0.413 to 0.579. These results demonstrate the superior performance of the proposed YOLO-RWY model. Experiments on the edge computing device Jetson AGX Orin show that the and FPS are 0.578 and 154.4 for an input size of 640, and 0.707 and 46.0 for an input size of 1280. Both configurations show superior accuracy and real-time performance, and meet the practical requirements for onboard deployment of fixed-wing UAVs.
2. Related Works
2.1. Image Processing-Based Models
2.2. Machine Learning-Based Models
2.3. Deep Learning-Based Models
3. Methodologies
3.1. Runway Detection Framework
3.1.1. Object Detection Framework: You Only Look Once V8
3.1.2. Structure of the Proposed YOLO-RWY Model
- The enhanced data augmentation (EDA) module is employed during training to introduce more diverse images, thereby improving model generalization and safety.
- The large separable kernel attention (LSKA) module is integrated into the backbone structure to enhance feature representation by introducing a visual attention mechanism.
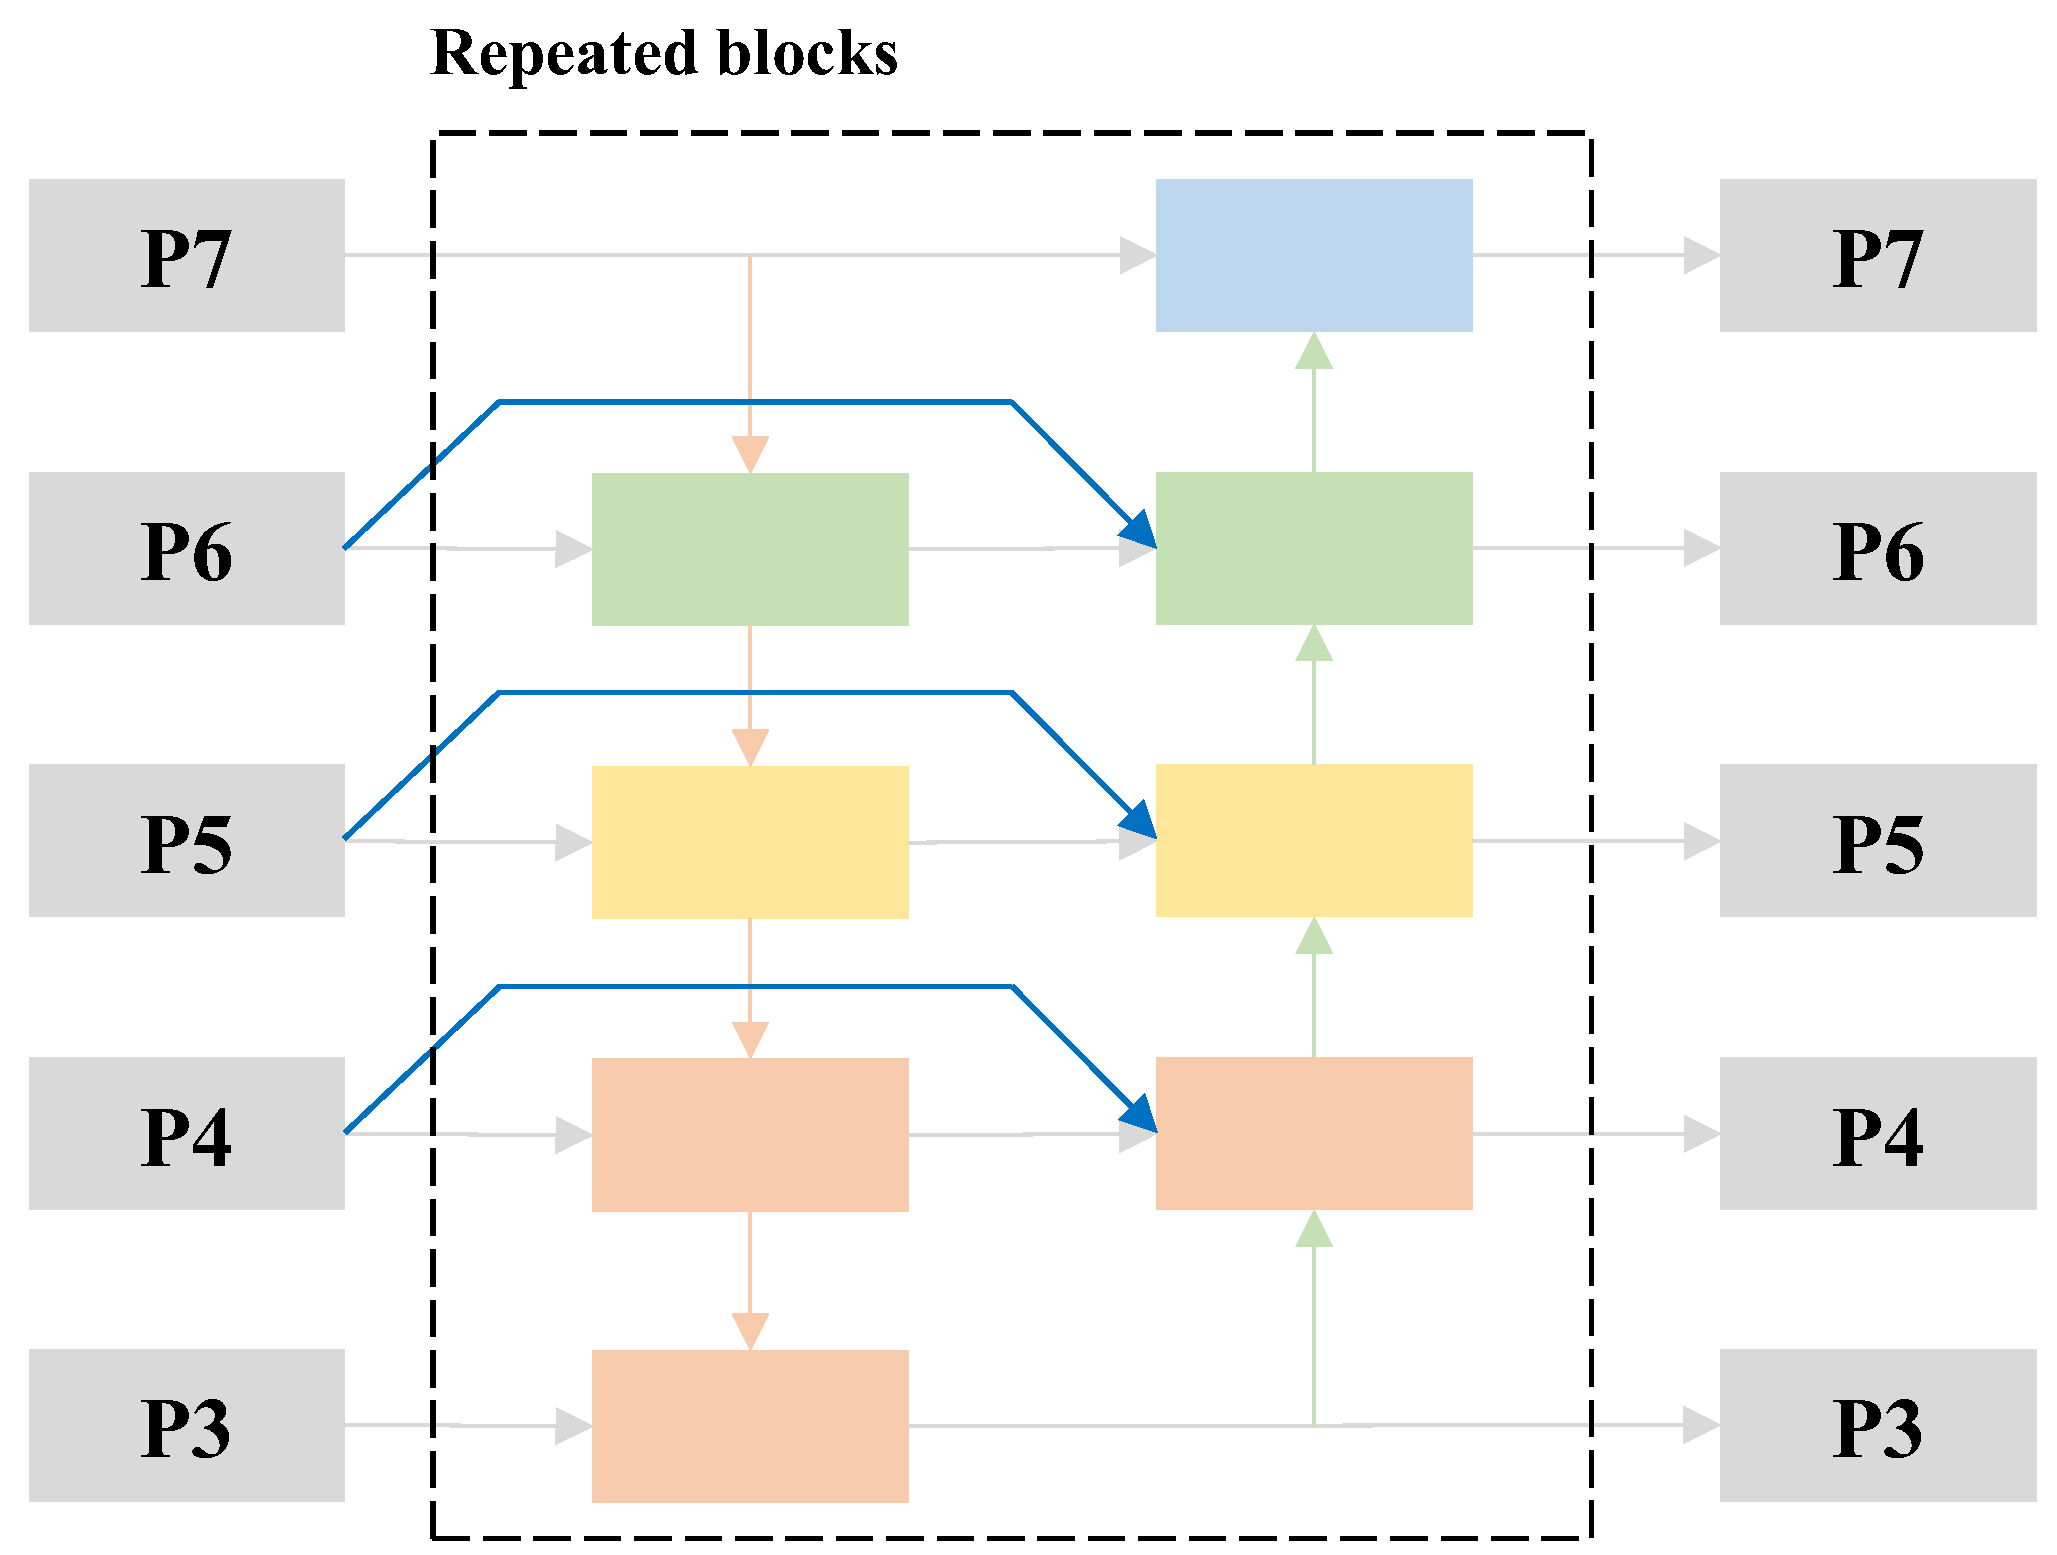
- The bidirectional feature pyramid network (BiFPN) module is introduced to reconfigure the neck structure and improve feature aggregation.
- The efficient intersection over union (EIoU) is integrated into the TAL assigner to form an efficient task-aligned learning (ETAL) assigner, optimizing sample assignment and accelerating convergence.
- The EIoU is also incorporated into the regression loss to form an EIoU loss, providing a more accurate bounding box description and better convergence guidance.
3.2. Key Improvement Modules of the Proposed Model
3.2.1. Enhanced Data Augmentation Module
- High similarity among samples in runway detection datasets: The EDA module is essential for reducing redundancy due to the high similarity of samples within runway detection datasets. Numerous images are continuously captured and sampled during landing, resulting in highly similar adjacent images. Overall, the similarity in the runway detection datasets is much higher than in the conventional task datasets.
- Limitations and idealisms of synthetic runway detection datasets: Synthetic runway detection datasets are constructed using ideal camera imaging models and are often based on satellite maps captured under favorable weather conditions. This leads to a lack of representation of real-world scenarios, necessitating the EDA module to improve diversity.
- Safety considerations in applying deep learning in aviation: Numerous safety considerations arise when applying deep learning models in the aviation industry, necessitating the EDA module to introduce various perturbations and implicit regularization, thereby enhancing robustness and safety [38]. Deep learning models are susceptible to input perturbations, which can lead to unreliable detections. Additionally, these models may be vulnerable to adversarial attacks that are imperceptible to humans but significantly disruptive to models.
3.2.2. Large Separable Kernel Attention Module
3.2.3. Bidirectional Feature Pyramid Network Module
3.2.4. Efficient Intersection over Union Loss and Efficient Task-Aligned Learning Assigner
4. Experiments
4.1. Datasets
- Figure 7 illustrates that the airports are primarily concentrated in Europe but are distributed worldwide across many countries and regions. The location diversity ensures that the runways cover various materials, geometric dimensions, surface markings, and surrounding terrain and landscapes, contributing to visual diversity.
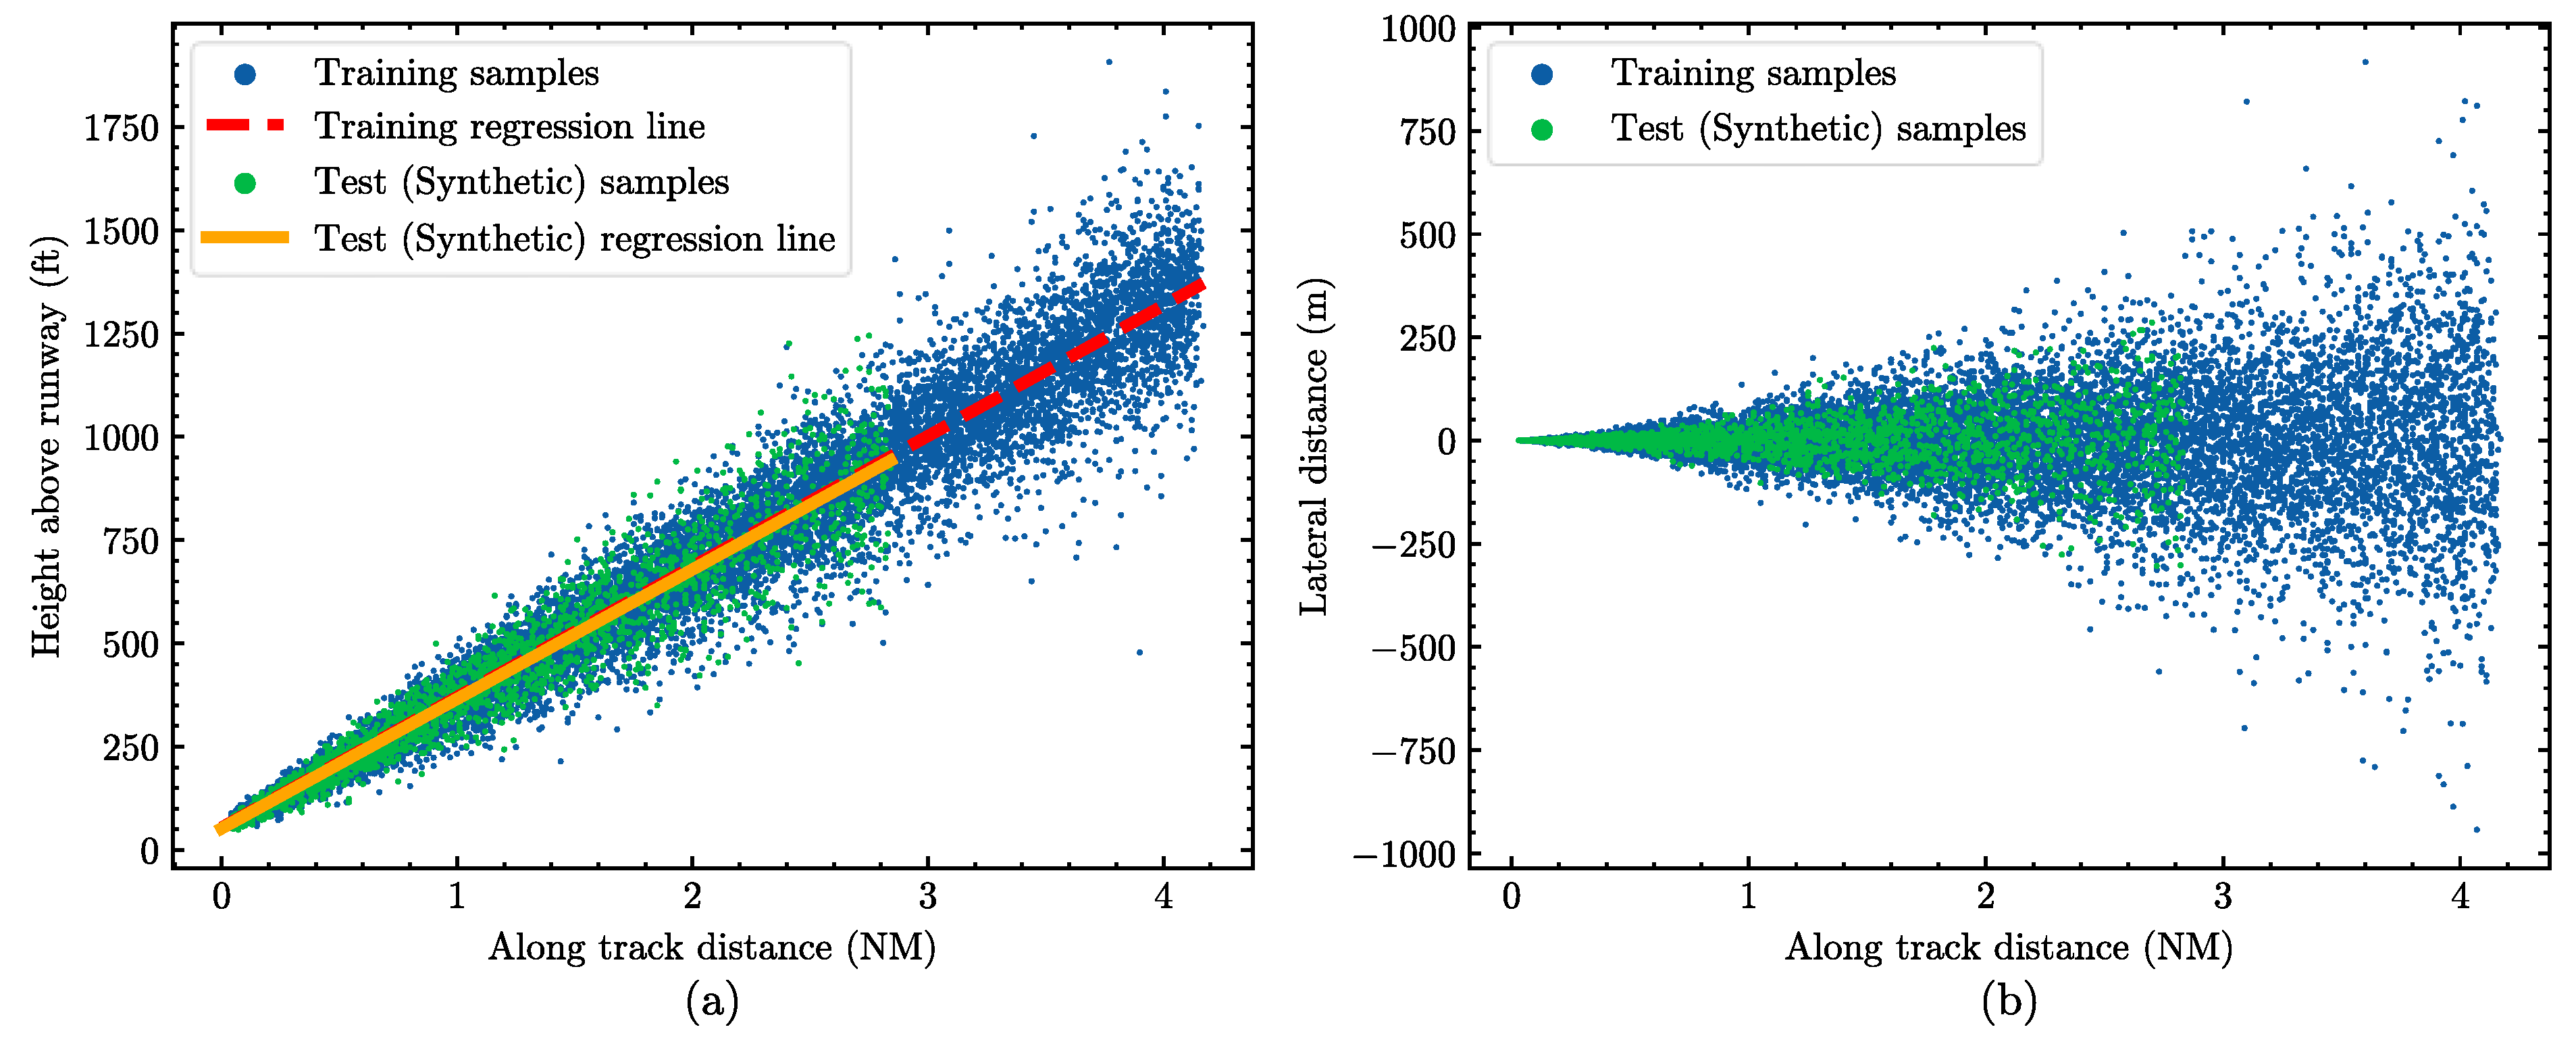
- Figure 8 shows that the camera positions (corresponding to aircraft positions) are distributed around both sides of the glide path, covering a variety of acceptable vertical deviations. Similarly, the samples are positioned along both sides of the localizer, covering a variety of acceptable lateral deviations.
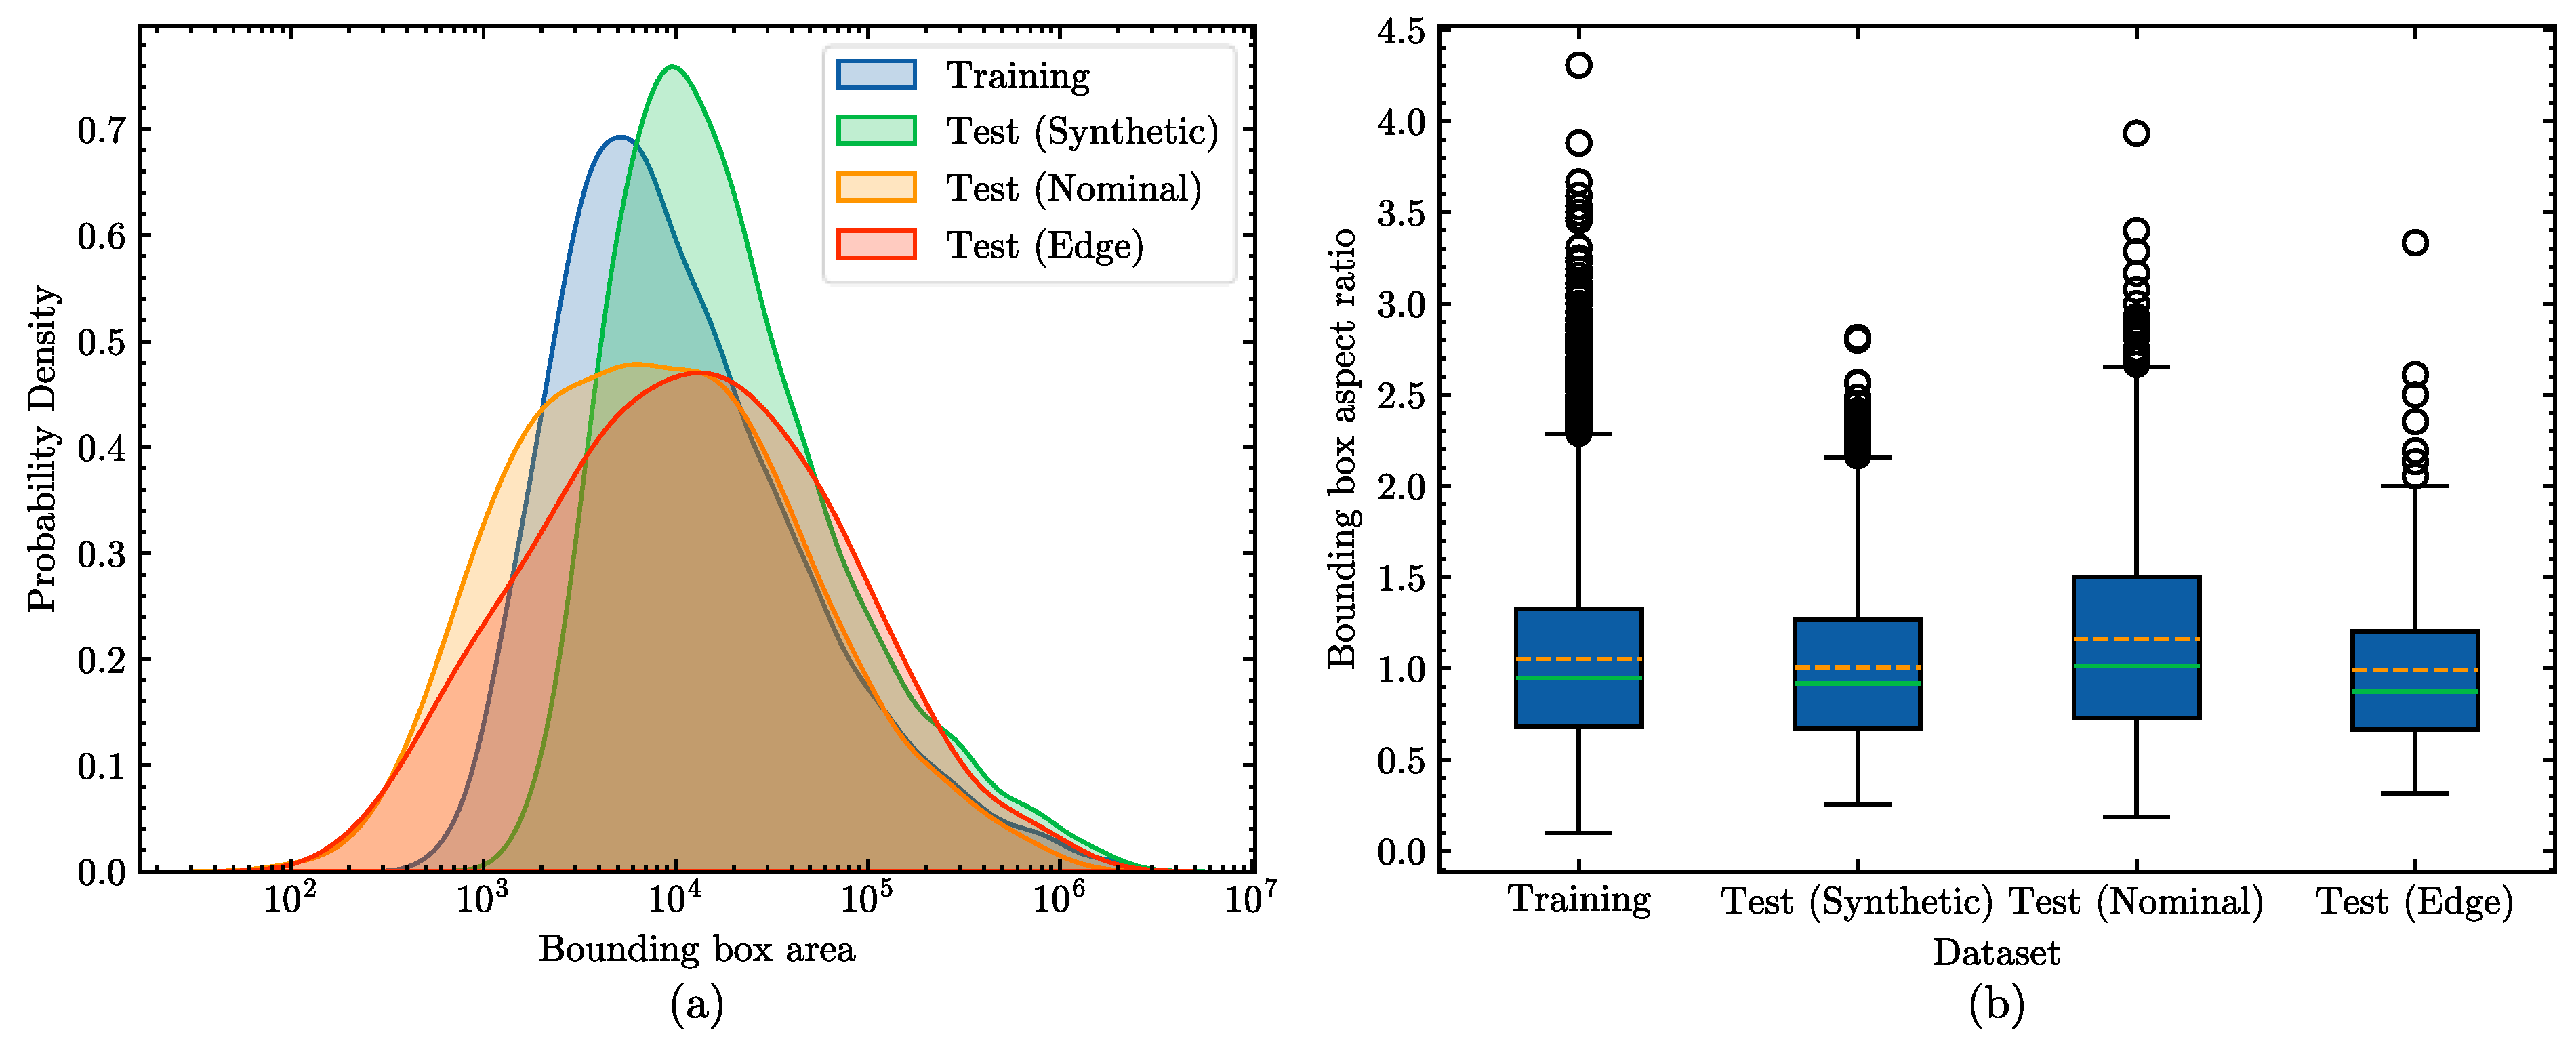
- Figure 9a indicates that the bounding box area distributions are similar across different datasets, encompassing visual features at various distances and scales. Compared to the synthetic datasets, the distribution of the real datasets is relatively more dispersed. Figure 9b indicates that the distributions of aspect ratios are also similar across different datasets, ensuring visual diversity under varying proportions.
- Figure 10 demonstrates that the bounding boxes are primarily concentrated in the center of the images. For the synthetic images, the horizontal distribution is relatively dispersed, while the vertical distribution is more concentrated, limited by the reasonable pitch range of UAVs. In contrast, real images exhibit a more balanced distribution in both directions due to variations in camera placements within the cockpits.
4.2. Evaluation Metrics
4.3. Experiment Settings
4.3.1. Experimental Environments
4.3.2. Experimental Details and Parameters
4.4. Experiment I: Comparison with Benchmark Models
- YOLOv8n exhibits outstanding performance, significantly outperforming all benchmarks across all the test sets, with values of 0.754, 0.586, 0.348, and 0.545 on synthetic, real nominal, real edge, and overall real test sets, respectively. Additionally, YOLOv8n features a parameter size of 3.011 M, FLOPs of 8.194 G, and an FPS of 135.0. The superiority in accuracy and efficiency validates the selection of YOLOv8n as the baseline for the proposed model.
- The proposed YOLO-RWY model achieves the best accuracy metrics across all test sets, with values of 0.760, 0.611, 0.413, and 0.578 on the synthetic, real nominal, real edge, and overall real test sets, respectively. Compared to YOLOv8n, the proposed model shows a small improvement of 0.8% on the synthetic test set and significant improvements on all the real test sets, with increases of 4.3%, 18.7%, and 6.1%, respectively. This indicates the improved accuracy and strong generalization of the proposed model.
- The proposed model demonstrates excellent computational efficiency and speed, with only small differences compared to YOLOv8n. The parameter size is 3.106 M, and the FLOPs are 8.308 G, representing increases of 3.2% and 1.4%, respectively. The inference speed is 125.3 FPS, showing a slight decrease of 7.2%. Overall, the proposed model meets real-time requirements.
4.5. Experiment II: Module Comparisons and Ablation Experiments
4.5.1. Comparison of Attention Modules
- Visual attention modules do not necessarily lead to improvements in accuracy. Modules such as EMA, CBAM, LSK, ECA, and GAM result in accuracy degradation on all the real test sets, even though the accuracy on the synthetic test set is either close to or slightly better than YOLOv8n. The SE module slightly improves accuracy on the real edge test set. The CPCA module achieves the best accuracy on the synthetic test set and shows improvements on all the real test sets. This may suggest that the enhanced feature learning capability brought by the attention modules could lead to overfitting on training sets.
- Introducing the LSKA module leads to the best accuracy on all the real test sets, although its accuracy on the synthetic test set is slightly lower. Compared to YOLOv8n, the values of YOLOv8n-LSKA on the synthetic, real nominal, real edge, and overall real test sets are 0.751, 0.590, 0.366, and 0.552, with changes of −0.4%, 0.7%, 5.2%, and 1.3%, respectively. The decrease in might indicate a reduction in overfitting, considering that the model is trained exclusively using the synthetic training set, which has a highly similar distribution to the synthetic test set. This suggests that the LSKA module effectively increases accuracy and generalization on real-world datasets, which is the focus of the VAL research in this paper.
- Compared to YOLOv8n, introducing the LSKA module does not significantly increase the parameter size and computational load. The inference speed is also minimally affected. The parameter size of YOLOv8n-LSKA is 3.089 M, and the FLOPs are 8.256 G, representing increases of 2.6% and 0.8%, respectively. The inference speed is 132.3 FPS, showing a slight decrease of 2.0%. Overall, the introduction of LSKA meets the requirements of real-time performance.
4.5.2. Comparison of Feature Pyramid Network Modules
- Although the AFPN module leads to the highest improvement in , it results in decreased accuracy across all the real test sets. Due to the complex structure and powerful feature fusion capability, AFPN appears to overfit the synthetic training set. Additionally, AFPN significantly increases the parameter size and computational load, notably reducing inference speed.
- Compared to the YOLOv8n with PAN-FPN, the BiFPN module improves accuracy on all the test sets. The values of YOLOv8n-BiFPN on the synthetic, real nominal, real edge, and overall real test sets are 0.758, 0.591, 0.365, and 0.553, with improvements of 0.5%, 0.9%, 4.9%, and 1.5%, respectively. This suggests that BiFPN is effective in enhancing accuracy and generalization.
- With its simple structure, BiFPN has minimal impact on parameter size and computational load, remaining nearly consistent with YOLOv8n. The parameter size is 3.027 M, and the FLOPs are 8.247 G, with increases of 0.5% and 0.6%, respectively. The inference speed reaches 135.4 FPS, showing a slight increase attributed to experimental randomness. Therefore, the introduction of BiFPN continues to meet the real-time performance requirements.
4.5.3. Analysis of the Enhanced Data Augmentation Module
- Under different probabilities of applying EDA, the values all decrease while values increase across all the real test sets. The EDA module reduces the distribution similarity between the synthetic training and synthetic test sets, thereby alleviating overfitting. This demonstrates that the EDA module effectively optimizes the detection performance on real-world datasets.
- At an EDA probability of 5%, the YOLOv8n model achieves the best improvements across all the real test sets. The values on the synthetic, real nominal, real edge, and overall real test sets are 0.749, 0.600, 0.381, and 0.563, with changes of −0.7%, 2.4%, 9.5%, and 3.3%, respectively. This indicates that the EDA module significantly improves generalization and accuracy across all the real test sets, with the most substantial improvement observed on the real edge test set. Therefore, an EDA probability of 5% is selected for the proposed model in this paper.
- The EDA module does not affect parameter size and computational load, as the EDA module is a pre-processing method and independent of the model network structure. The variations in FPS are attributed to experimental randomness. Nonetheless, as an online pre-processing algorithm, the EDA module inevitably extends the training duration. As the EDA probability increases, the overall training time correspondingly rises. Specifically, when the probability grows from 0% to 5%, the training time increases from 140.42 min to 160.92 min, an increase of 14.6%.
4.5.4. Ablation Experiments
- When introducing LSKA alone, accuracy improves on all the real test sets while slightly decreasing on the synthetic test set. Introducing the BiFPN alone leads to accuracy improvements across all the test sets. However, introducing EIoU alone results in a slight accuracy improvement on the synthetic test set but a decrease in all the real test sets.
- The combination of LSKA and BiFPN improves accuracy on all the test sets, with greater improvements than using either module alone. This suggests that LSKA and BiFPN work synergistically to enhance feature learning across different levels. However, combining LSKA or BiFPN with EIoU improves accuracy on the synthetic test set but decreases accuracy on all the real test sets.
- When integrating LSKA, BiFPN, and EIoU, accuracy improves significantly across all the test sets. The values of the proposed (w/o EDA) model on the synthetic, real nominal, real edge, and overall real test sets are 0.762, 0.600, 0.393, and 0.563, with improvements of 1.1%, 2.4%, 12.9%, and 3.3%, respectively. This indicates that the combination of LSKA, BiFPN, and EIoU effectively enhances detection performance, even though EIoU performs less well in isolation.
- Further introducing the EDA module results in significant accuracy improvements across all the real test sets, with only small fluctuations on the synthetic test set. The values of the proposed model on the synthetic, real nominal, real edge, and overall real test sets are 0.760, 0.611, 0.413, and 0.578, with improvements of 0.8%, 4.3%, 18.7%, and 6.1%, respectively. This highlights the positive contribution of the EDA module to the proposed model, especially in challenging real edge cases where runway detection is more difficult compared to less complex cases.
- All models in the ablation experiments show no significant increase in parameter size or computational load, remaining nearly consistent with YOLOv8n. The inference speed of each model also remains largely unchanged. The FPS difference between the proposed (w/o EDA) and the proposed model is due to experimental randomness. Besides the EDA module, the introduction of various modules and their combinations does not significantly alter the training duration, further demonstrating that the proposed modifications to the network architecture are lightweight yet effective. The improvements in accuracy are achieved without incurring significant additional training costs. When the EDA module is introduced, it enables further enhanced performance with only a moderate and acceptable increase in training cost. Compared to the proposed (w/o EDA) model, the training time of the proposed model increases from 141.53 min to 160.12 min, an increase of 13.14%.
4.6. Experiment III: Performance Analysis under Different Conditions
4.6.1. Performance under Different Target Sizes
- The runway detection accuracy of each model decreases progressively from large to medium to small targets. Small runway objects occupy a smaller pixel area within the image, making accurate detection more challenging. Additionally, when the image is scaled down before being processed by the model, the small area becomes even smaller, further complicating detection.
- The proposed (w/o EDA) model shows improved accuracy for different runway sizes across all the test sets compared with YOLOv8n. The most significant improvement is observed on the real edge test set, where accuracy increases by 35.5% for small objects, 19.0% for medium objects, and 8.9% for large objects. The proposed (w/o EDA) model exhibits greater accuracy improvement for small objects than for medium and large objects across all the test sets. This proves the validity of the improved network structure of the proposed model.
- Introducing the EDA module further improves the detection accuracy. The proposed model shows better accuracy improvements than the proposed (w/o EDA) model for medium objects in the synthetic test set, all sizes in the real nominal test set, small and large sizes in the real edge test set, and all sizes in the overall real test set. The most significant improvement is again observed on the real edge test set, with accuracy increases of 73.6% for small objects, 14.2% for medium objects, and 18.7% for large objects compared with YOLOv8n. The results demonstrate that the EDA module is essential, and the proposed model is highly effective for detecting runways of varying sizes, particularly in challenging scenarios.
4.6.2. Performance under Different Distances
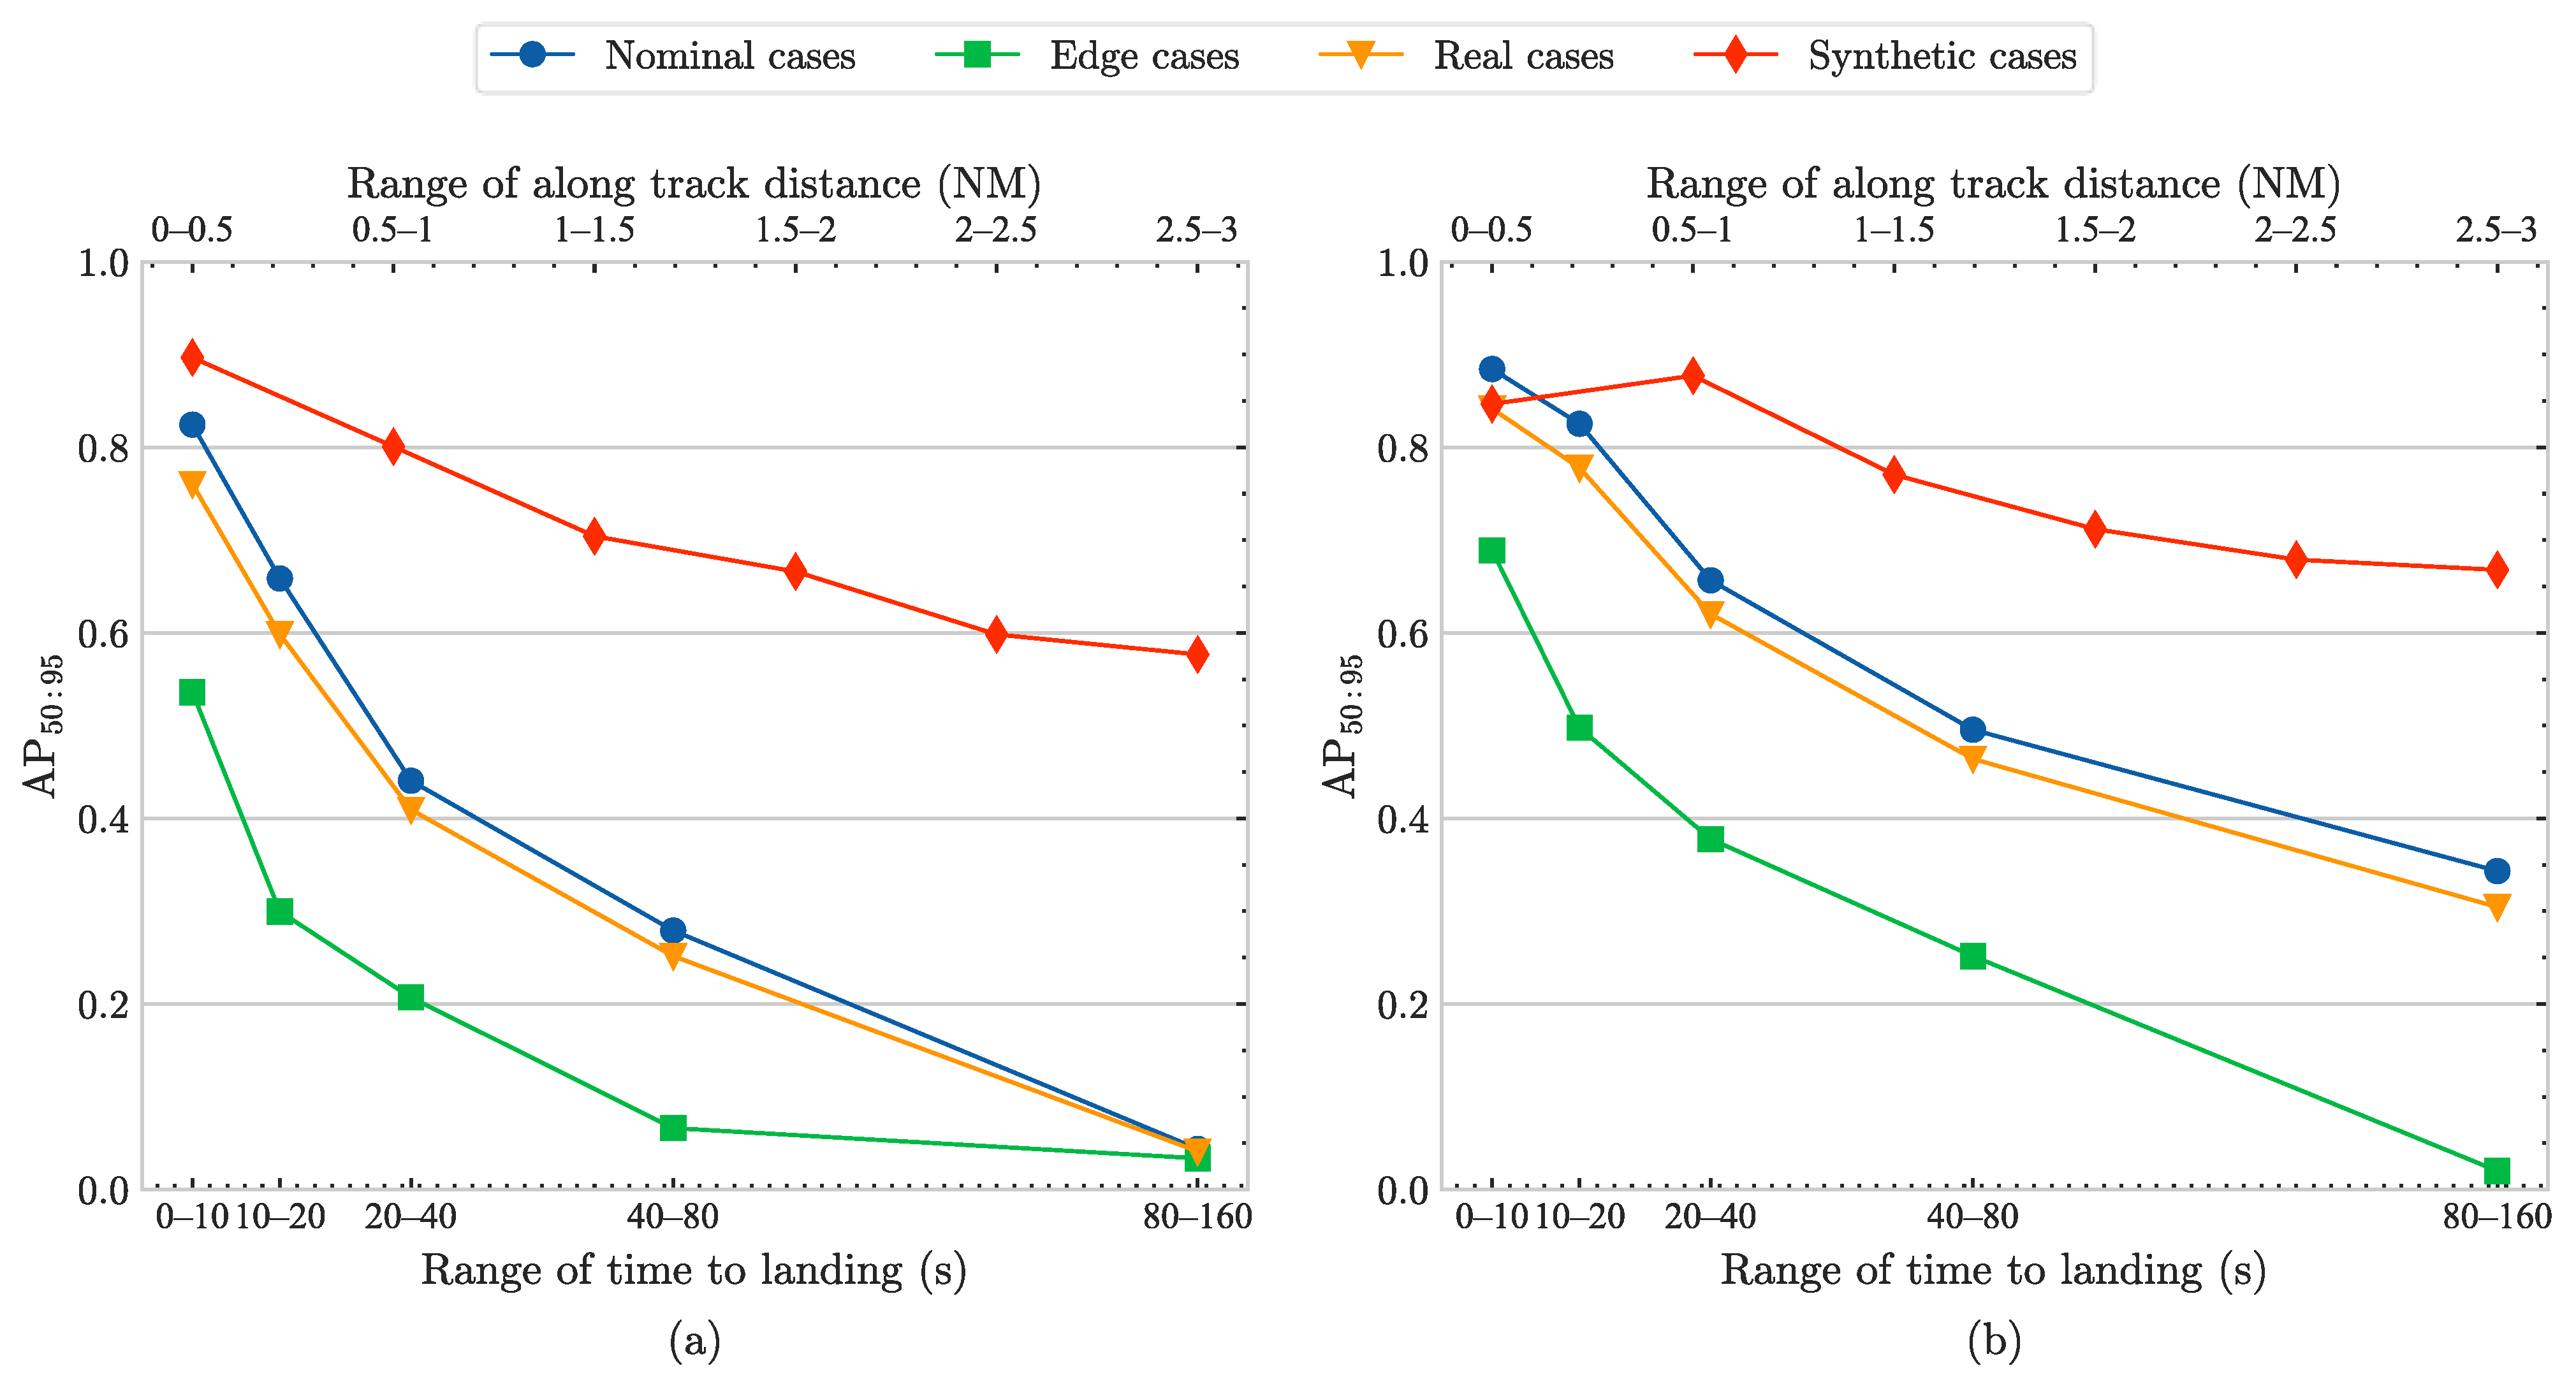
- Across all the test sets, the detection accuracy decreases rapidly as the time to landing increases and the along-track distance increases. When the time or distance is too long, the runway occupies too few pixels, reducing the likelihood of accurate detection. The detection accuracy on the synthetic test set is generally higher than on the real test sets, likely because the synthetic test set presents fewer challenging scenarios compared to the more complex real-world images in the real test sets.
- For the synthetic test set, the proposed model improves accuracy across all distance ranges except within the 0.0–0.5 NM range. The improvement is particularly pronounced at longer distance ranges, with accuracy increases of 13.5% and 15.8% in the 2.0–2.5 NM and 2.5–3.0 NM ranges, respectively.
- For all the real test sets, the proposed model improves accuracy across most conditions, except in the 80–160 s range for the real edge test set, where a slight decrease is observed. The proposed model shows significant improvements at longer time ranges, with accuracy increases of 77.6% and 683.3% in the 40–80 s and the 80–160 s ranges on the real nominal test set, which suggests that the proposed model is more effective for detecting runways at distant positions, enabling earlier detection during the initial landing phase.
4.6.3. Performance under Different Image Sizes
- With the training size kept at 640, and the test size increased to 1280, a significant accuracy improvement is observed across all the test sets. The values on the synthetic, real nominal, real edge, and overall real test sets are 0.785, 0.744, 0.517, and 0.707, with improvements of 3.3%, 21.8%, 25.2%, and 22.3%, respectively. Since the model size and scale remain unchanged, the parameter size stays at 3.106 M. However, the increased input resolution significantly raises the computational load, increasing FLOPs from 8.308 G to 33.232 G (an increase of 300.0%) and reducing FPS from 125.3 to 89.3 (a decrease of 28.7%). Furthermore, as retraining is not required, no additional training costs are incurred.
- Increasing both the training and test sizes to 1280 significantly improves the accuracy across all the test sets. The values on the synthetic, real nominal, real edge, and overall real test sets are 0.848, 0.750, 0.489, and 0.709, with improvements of 11.6%, 22.7%, 18.4%, and 22.7%, respectively. Compared to only increasing the test size, increasing both training and test size shows better performance on the synthetic, real nominal, and overall real test sets, though there is a slight accuracy decrease on the real edge test set. This might be due to the increased input size leading to further overfitting. Increasing the EDA probability may potentially alleviate this issue.
- When both the training and test sizes increase, the parameter size and computational load remain consistent with the configuration where only the test size is increased. The small differences in inference speed are due to experimental randomness. Moreover, setting the training size to 1280 significantly increases training costs due to the increased FLOPs. Specifically, the training time increased from 160.12 min to 346.58 min, representing a 116.45% rise. Therefore, the significant improvement in accuracy comes at the cost of a substantial increase in training time. However, considering that training is performed offline, such a trade-off is generally acceptable.
4.6.4. Performance under Different Quantization Precisions
- The proposed model meets real-time requirements across all the tested image sizes and quantization precisions. Under the least demanding conditions, with the smallest computational load (inference size 640 and FP16 quantization), the latency is 4.744 ms, and the FPS is 210.8. Under the most demanding conditions, with the largest computational load (inference size 1280 and FP32 quantization), the latency is 21.762 ms, and the FPS is 46.0.
- When the inference size remains constant, FP16 quantization effectively improves the inference speed while keeping accuracy basically unchanged or slightly decreased. For the input size of 640, FP16 quantization increases FPS by 36.5% with no significant change in accuracy (accurate to three decimal places). For the input size of 1280, FP16 quantization increases FPS by 41.1%, with a small accuracy reduction from 0.707 to 0.704, a decrease of only 0.4%.
- When quantization precision remains constant, increasing the input size significantly reduces the inference speed on the edge device. With FP16 quantization, increasing the input size from 640 to 1280 results in a 69.2% decrease in FPS. With FP32 quantization, the same increase in input size leads to a 70.2% decrease in FPS.
4.7. Experiment IV: Model Fine-Tuning and Detection Visualization
4.7.1. Performance Analysis of the Finetuned Proposed Model
- Under the fine-tuning EDA probability of 5%, fine-tuning the proposed model with the synthetic validation set results in accuracy degradation across all the test sets. The reason may be that the synthetic validation set is randomly extracted from the original synthetic training set, and the distributions are highly similar, leading to increased overfitting. The degradation is predictable and demonstrates the effectiveness of reserving the validation set.
- When fine-tuning using both the synthetic validation and synthetic test sets, the accuracy improves on the real nominal test set, while the accuracy on the real edge and overall real test sets decreases. However, compared to fine-tuning with only the synthetic validation set, there is a slight improvement across all the available test sets. This is due to the limited but effective diversity introduced by the synthetic test set, which includes image samples from different airports, runways, and landings.
- When fine-tuning with the synthetic validation and synthetic test sets and further including the real nominal test set, two strategies are employed: (a) hybrid strategy: all three datasets are used for fine-tuning simultaneously; (b) separate strategy: the model is first pre-finetuned on the synthetic validation and synthetic test sets, and the model weights are saved, followed by further fine-tuning the pre-finetuned model with the real nominal test set. In both cases, the accuracy on the real edge test set improves significantly. The improvements are attributed to the model encountering real-world images for the first time, allowing it to learn the unseen characteristics of real-world runway samples and thereby enhance generalization. However, fine-tuning using a separate strategy achieves higher accuracy. The reason may be that the distributions of the synthetic and real datasets do not interfere with each other, leading to better convergence and more stable training.
- When the fine-tuning EDA probability increases to 10%, the accuracy in all scenarios across all the test sets surpasses corresponding experiments under the 5% probability. Fine-tuning with both the synthetic validation and synthetic test sets yields the best performance on the real nominal and overall real test sets, achieving accuracies of 0.627 and 0.590, with improvements of 2.6% and 2.1%, respectively. When the real nominal test set is further included using the separate strategy for fine-tuning, the model achieves the best performance on the real edge test set, with an accuracy of 0.582, an improvement of 40.9%.
- The training times presented in Table 14 include both the pre-training time and the fine-tuning time. With a 5% EDA probability, the training times for each model are 192.77 min, 215.30 min, 234.30 min, and 235.39 min, representing increases of 20.39%, 34.46%, 46.33%, and 47.01%, respectively, compared to the 160.12 min of the pertained YOLO-RWY. When the EDA probability is increased to 10%, the training times increase by 22.59%, 38.36%, 51.74%, and 51.75%, respectively, slightly higher than with the 5% probability. Given the additional fine-tuning datasets and increased training epochs, increases in training costs are to be expected.
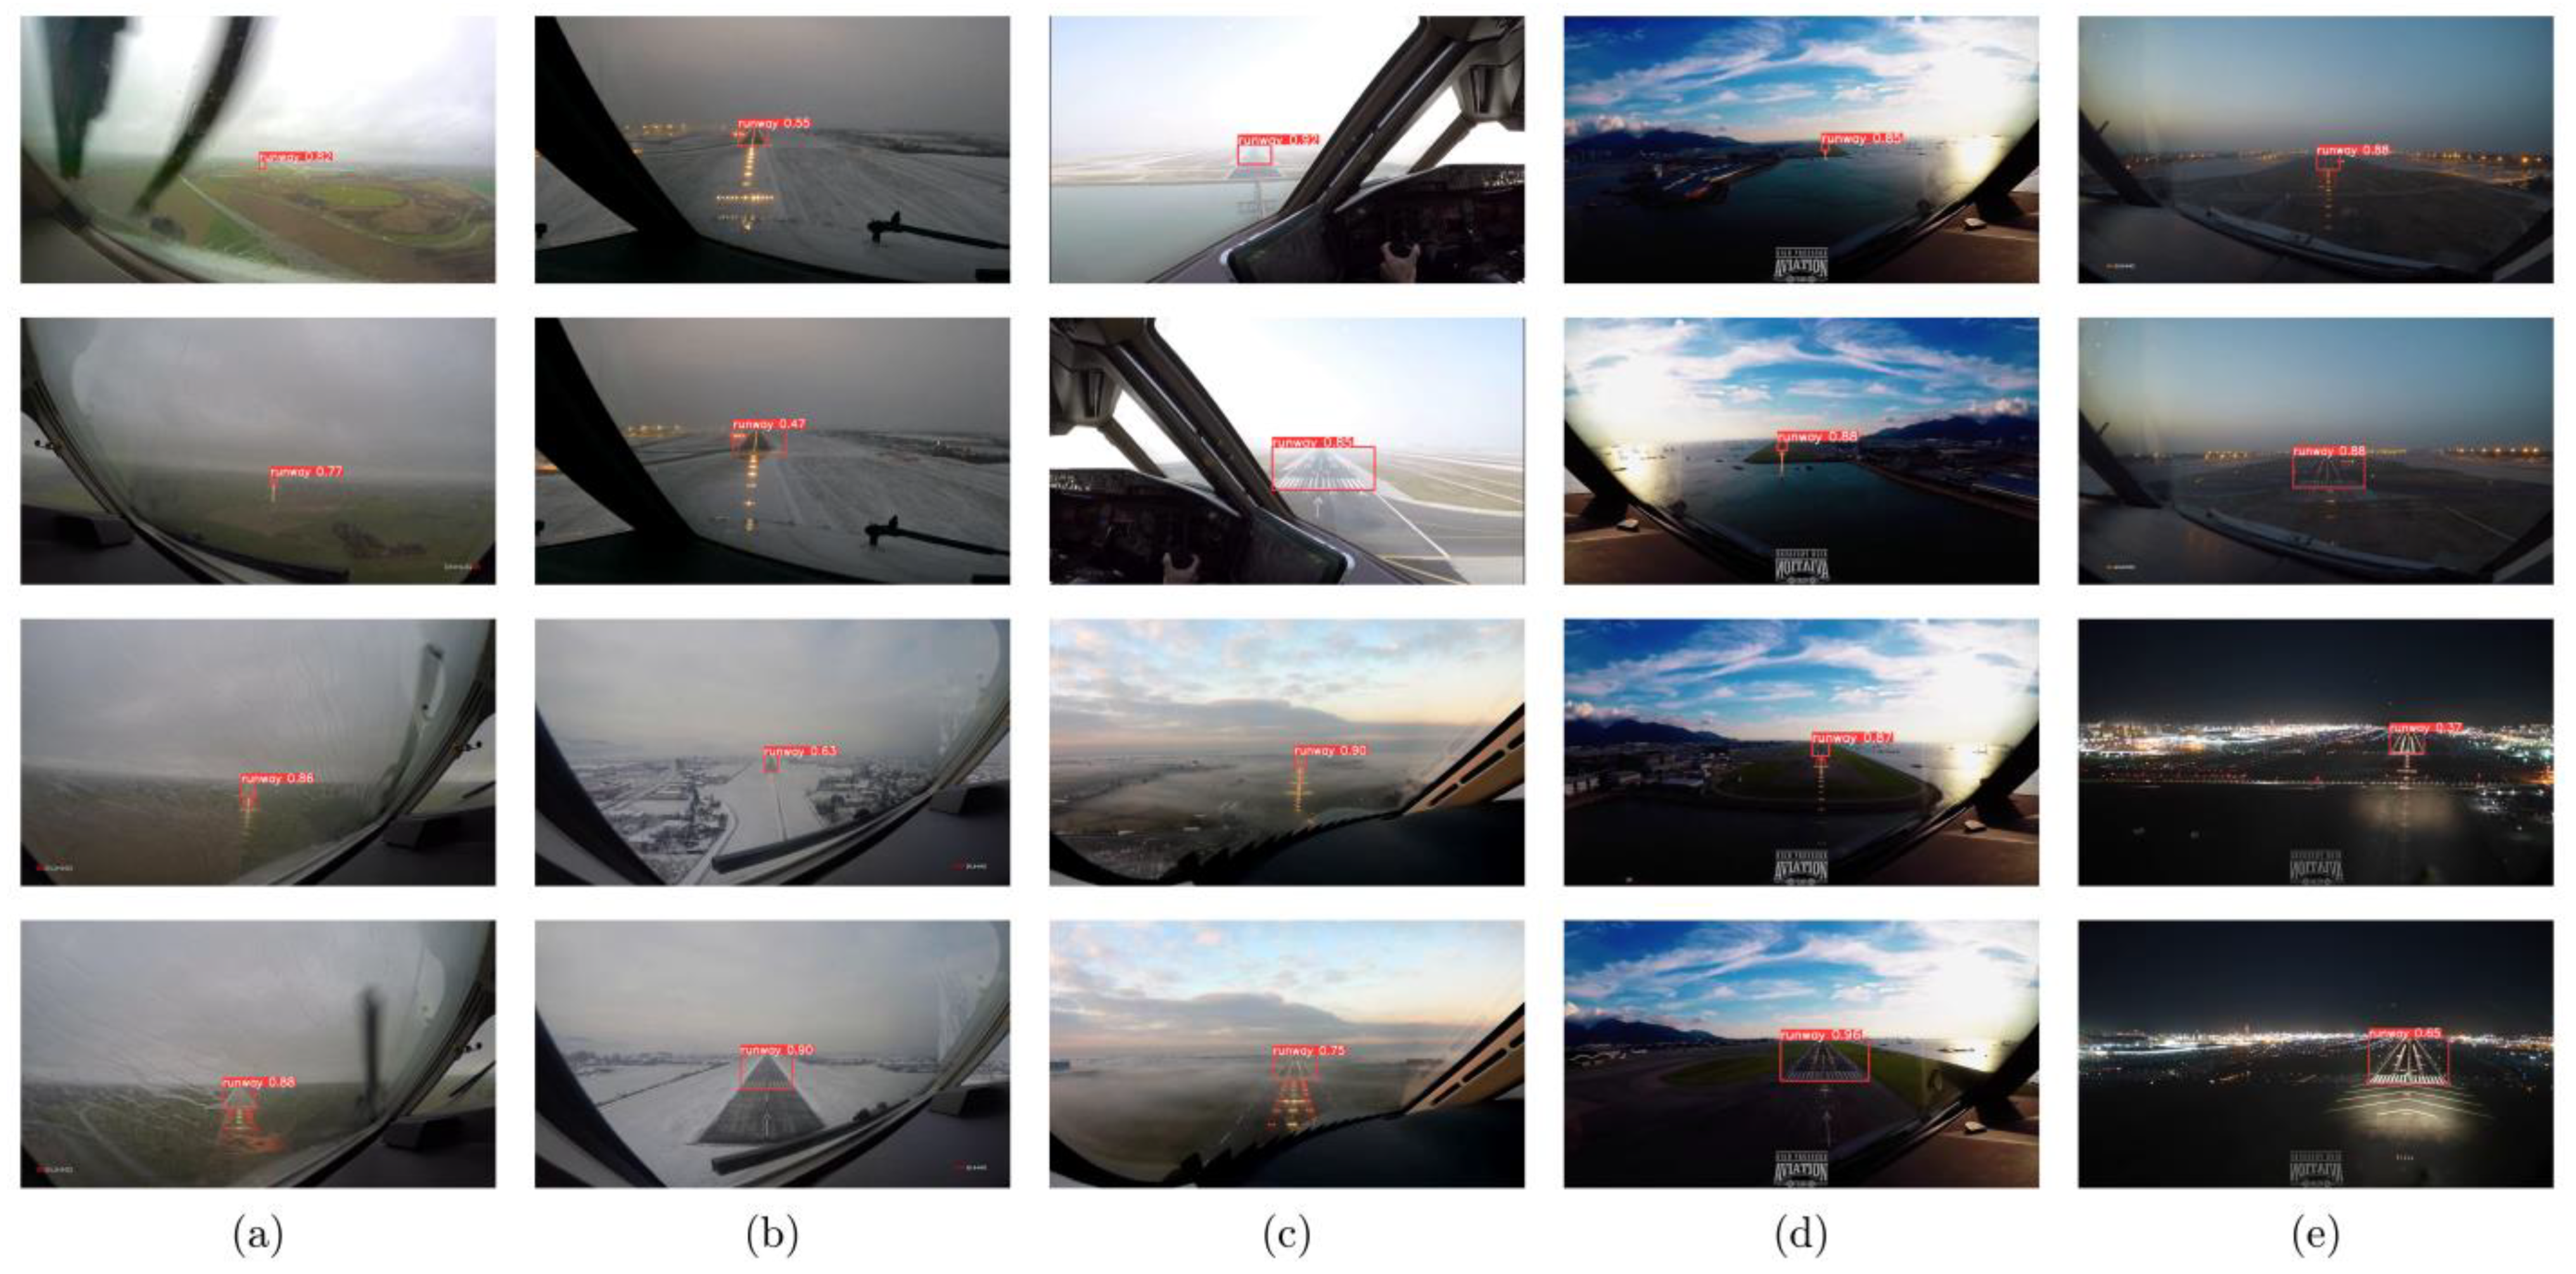
4.7.2. Visualizations of the Runway Detections
5. Conclusions
Author Contributions
Funding
Data Availability Statement
Conflicts of Interest
Appendix A
| Composition #1 | Composition #2 | Group | Transformation Methods |
|---|---|---|---|
| Compose | One of | Color | Random tone curve, Solarize, Posterize, Equalize, RGB shift, Random brightness contrast, Gauss noise, ISO noise, CLAHE, Channel shuffle, Invert image, Random gamma, To gray, To sepia, Downscale, Multiplicative noise, Fancy PCA, Color jitter, Sharpen, Emboss, Superpixels, Ringing overshoot, Unsharp mask, Pixel dropout, and Spatter. |
| One of | Blur | Blur, Motion blur, Median blur, Gaussian blur, Glass blur, Advanced blur, Defocus, and Zoom blur. | |
| One of | Geometric | Shift scale rotate, Elastic transform, Perspective, Affine, Piecewise affine, Vertical flip, Horizontal flip, Flip, Optical distortion, Grid distortion, Channel dropout. | |
| One of | Weather | Random rain, Random snow, Random fog, Random shadow, and Random sun flare. | |
| One of | Quality | Image compression (JPEG) and Image compression (WEBP). |

References
- Wang, Q.; Feng, W.; Zhao, H.; Liu, B.; Lyu, S. VALNet: Vision-Based Autonomous Landing with Airport Runway Instance Segmentation. Remote Sens. 2024, 16, 2161. [Google Scholar] [CrossRef]
- Chen, W.; Zhang, Z.; Yu, L.; Tai, Y. BARS: A Benchmark for Airport Runway Segmentation. Appl. Intell. 2023, 53, 20485–20498. [Google Scholar] [CrossRef]
- Brukarczyk, B.; Nowak, D.; Kot, P.; Rogalski, T.; Rzucidło, P. Fixed Wing Aircraft Automatic Landing with the Use of a Dedicated Ground Sign System. Aerospace 2021, 8, 167. [Google Scholar] [CrossRef]
- Liu, K.; Liu, N.; Chen, H.; Jiang, S.; Wang, T. Research on Recognition Model of Intelligent Airport Operation Landing Standard Based on Ground Meteorological Observation. In Proceedings of the 2021 IEEE 3rd International Conference on Civil Aviation Safety and Information Technology (ICCASIT), Changsha, China, 20–22 October 2021; pp. 412–416. [Google Scholar]
- Liu, X.; Xue, W.; Xu, X.; Zhao, M.; Qin, B. Research on Unmanned Aerial Vehicle (UAV) Visual Landing Guidance and Positioning Algorithms. Drones 2024, 8, 257. [Google Scholar] [CrossRef]
- Wang, Z.; Zhao, D.; Cao, Y. Visual Navigation Algorithm for Night Landing of Fixed-Wing Unmanned Aerial Vehicle. Aerospace 2022, 9, 615. [Google Scholar] [CrossRef]
- Chen, M.; Hu, Y. An Image-Based Runway Detection Method for Fixed-Wing Aircraft Based on Deep Neural Network. IET Image Process. 2024, 18, 1939–1949. [Google Scholar] [CrossRef]
- Shuaia, H.; Wang, J.; Wang, A.; Zhang, R.; Yang, X. Advances in Assuring Artificial Intelligence and Machine Learning Development Lifecycle and Their Applications in Aviation. In Proceedings of the 2023 5th International Academic Exchange Conference on Science and Technology Innovation (IAECST), Guangzhou, China, 8–10 December 2023; pp. 861–867. [Google Scholar]
- Akbar, J.; Shahzad, M.; Malik, M.I.; Ul-Hasan, A.; Shafait, F. Runway Detection and Localization in Aerial Images Using Deep Learning. In Proceedings of the 2019 Digital Image Computing: Techniques and Applications (DICTA), Perth, Australia, 2–4 December 2019; pp. 1–8. [Google Scholar]
- Marianandam, P.A.; Ghose, D. Vision Based Alignment to Runway during Approach for Landing of Fixed Wing UAVs. IFAC Proc. Vol. 2014, 47, 470–476. [Google Scholar] [CrossRef]
- Wu, W.; Xia, R.; Xiang, W.; Hui, B.; Chang, Z.; Liu, Y.; Zhang, Y. Recognition of Airport Runways in FLIR Images Based on Knowledge. IEEE Geosci. Remote Sens. Lett. 2014, 11, 1534–1538. [Google Scholar] [CrossRef]
- Meng, D.; Yun-feng, C.; Lin, G. A Method to Recognize and Track Runway in the Image Sequences Based on Template Matching. In Proceedings of the 2006 1st International Symposium on Systems and Control in Aerospace and Astronautics, Harbin, China, 19–21 January 2006; pp. 1218–1221. [Google Scholar]
- Tsapparellas, K.; Jelev, N.; Waters, J.; Brunswicker, S.; Mihaylova, L.S. Vision-Based Runway Detection and Landing for Unmanned Aerial Vehicle Enhanced Autonomy. In Proceedings of the 2023 IEEE International Conference on Mechatronics and Automation (ICMA), Harbin, China, 6–9 August 2023; pp. 239–246. [Google Scholar]
- Liu, W.; Tian, J.; Chen, X. RDA for Automatic Airport Recognition on FLIR Image. In Proceedings of the 2008 7th World Congress on Intelligent Control and Automation, Chongqing, China, 25–27 June 2008; pp. 5966–5969. [Google Scholar]
- Fan, Y.; Ding, M.; Cao, Y. Vision Algorithms for Fixed-Wing Unmanned Aerial Vehicle Landing System. Sci. China Technol. Sci. 2017, 60, 434–443. [Google Scholar] [CrossRef]
- Tang, G.; Ni, J.; Zhao, Y.; Gu, Y.; Cao, W. A Survey of Object Detection for UAVs Based on Deep Learning. Remote Sens. 2024, 16, 149. [Google Scholar] [CrossRef]
- Kucukayan, G.; Karacan, H. YOLO-IHD: Improved Real-Time Human Detection System for Indoor Drones. Sensors 2024, 24, 922. [Google Scholar] [CrossRef]
- Yue, M.; Zhang, L.; Huang, J.; Zhang, H. Lightweight and Efficient Tiny-Object Detection Based on Improved YOLOv8n for UAV Aerial Images. Drones 2024, 8, 276. [Google Scholar] [CrossRef]
- Qu, F.; Lin, Y.; Tian, L.; Du, Q.; Wu, H.; Liao, W. Lightweight Oriented Detector for Insulators in Drone Aerial Images. Drones 2024, 8, 294. [Google Scholar] [CrossRef]
- Zhai, X.; Huang, Z.; Li, T.; Liu, H.; Wang, S. YOLO-Drone: An Optimized YOLOv8 Network for Tiny UAV Object Detection. Electronics 2023, 12, 3664. [Google Scholar] [CrossRef]
- Wang, Q.; Wang, J.; Wang, X.; Wu, L.; Feng, K.; Wang, G. A YOLOv7-Based Method for Ship Detection in Videos of Drones. J. Mar. Sci. Eng. 2024, 12, 1180. [Google Scholar] [CrossRef]
- Abbas, A.; Zhang, Z.; Zheng, H.; Alami, M.M.; Alrefaei, A.F.; Abbas, Q.; Naqvi, S.A.H.; Rao, M.J.; Mosa, W.F.A.; Abbas, Q.; et al. Drones in Plant Disease Assessment, Efficient Monitoring, and Detection: A Way Forward to Smart Agriculture. Agronomy 2023, 13, 1524. [Google Scholar] [CrossRef]
- Pal, D.; Singh, A.; Saumya, S.; Das, S. Vision-Language Modeling with Regularized Spatial Transformer Networks for All Weather Crosswind Landing of Aircraft. arXiv 2024, arXiv:2405.05574. [Google Scholar]
- Dai, W.; Zhai, Z.; Wang, D.; Zu, Z.; Shen, S.; Lv, X.; Lu, S.; Wang, L. YOMO-Runwaynet: A Lightweight Fixed-Wing Aircraft Runway Detection Algorithm Combining YOLO and MobileRunwaynet. Drones 2024, 8, 330. [Google Scholar] [CrossRef]
- Li, C.; Wang, Y.; Zhao, Y.; Yuan, C.; Mao, R.; Lyu, P. An Enhanced Aircraft Carrier Runway Detection Method Based on Image Dehazing. Appl. Sci. 2024, 14, 5464. [Google Scholar] [CrossRef]
- Li, Y.; Angelov, P.; Yu, Z.; Pellicer, A.L.; Suri, N. Federated Adversarial Learning for Robust Autonomous Landing Runway Detection. arXiv 2024, arXiv:2406.15925. [Google Scholar]
- Ducoffe, M.; Carrere, M.; Féliers, L.; Gauffriau, A.; Mussot, V.; Pagetti, C.; Sammour, T. LARD—Landing Approach Runway Detection—Dataset for Vision Based Landing. arXiv 2023, arXiv:2304.09938. [Google Scholar]
- Chen, C.; Chen, S.; Hu, G.; Chen, B.; Chen, P.; Su, K. An Auto-Landing Strategy Based on Pan-Tilt Based Visual Servoing for Unmanned Aerial Vehicle in GNSS-Denied Environments. Aerosp. Sci. Technol. 2021, 116, 106891. [Google Scholar] [CrossRef]
- Xin, L.; Tang, Z.; Gai, W.; Liu, H. Vision-Based Autonomous Landing for the UAV: A Review. Aerospace 2022, 9, 634. [Google Scholar] [CrossRef]
- Pieczyński, D.; Ptak, B.; Kraft, M.; Piechocki, M.; Aszkowski, P. A Fast, Lightweight Deep Learning Vision Pipeline for Autonomous UAV Landing Support with Added Robustness. Eng. Appl. Artif. Intell. 2024, 131, 107864. [Google Scholar] [CrossRef]
- Liang, J.; Wang, S.; Wang, B. Online Motion Planning for Fixed-Wing Aircraft in Precise Automatic Landing on Mobile Platforms. Drones 2023, 7, 324. [Google Scholar] [CrossRef]
- Ma, N.; Weng, X.; Cao, Y.; Wu, L. Monocular-Vision-Based Precise Runway Detection Applied to State Estimation for Carrier-Based UAV Landing. Sensors 2022, 22, 8385. [Google Scholar] [CrossRef] [PubMed]
- Raviv, A.; Elboher, Y.Y.; Aluf-Medina, M.; Weiss, Y.L.; Cohen, O.; Assa, R.; Katz, G.; Kugler, H. Formal Verification of Object Detection. arXiv 2024, arXiv:2407.01295. [Google Scholar]
- Amit, R.A.; Mohan, C.K. A Robust Airport Runway Detection Network Based on R-CNN Using Remote Sensing Images. IEEE Aerosp. Electron. Syst. Mag. 2021, 36, 4–20. [Google Scholar] [CrossRef]
- Wang, X.; Gao, H.; Jia, Z.; Li, Z. BL-YOLOv8: An Improved Road Defect Detection Model Based on YOLOv8. Sensors 2023, 23, 8361. [Google Scholar] [CrossRef]
- Liu, S.; Qi, L.; Qin, H.; Shi, J.; Jia, J. Path Aggregation Network for Instance Segmentation. In Proceedings of the 2018 IEEE/CVF Conference on Computer Vision and Pattern Recognition, Salt Lake City, UT, USA, 18–23 June 2018; pp. 8759–8768. [Google Scholar]
- Buslaev, A.; Iglovikov, V.I.; Khvedchenya, E.; Parinov, A.; Druzhinin, M.; Kalinin, A.A. Albumentations: Fast and Flexible Image Augmentations. Information 2020, 11, 125. [Google Scholar] [CrossRef]
- Vidimlic, N.; Levin, A.; Loni, M.; Daneshtalab, M. Image Synthesisation and Data Augmentation for Safe Object Detection in Aircraft Auto-Landing System. In Proceedings of the 16th International Joint Conference on Computer Vision, Imaging and Computer Graphics Theory and Applications, Virtual Event, 8–10 February 2021; pp. 123–135. [Google Scholar]
- Lau, K.W.; Po, L.-M.; Rehman, Y.A.U. Large Separable Kernel Attention: Rethinking the Large Kernel Attention Design in CNN. Expert. Syst. Appl. 2024, 236, 121352. [Google Scholar] [CrossRef]
- Tan, M.; Pang, R.; Le, Q.V. EfficientDet: Scalable and Efficient Object Detection. arXiv 2020, arXiv:1911.09070. [Google Scholar]
- Zhang, Y.-F.; Ren, W.; Zhang, Z.; Jia, Z.; Wang, L.; Tan, T. Focal and Efficient IOU Loss for Accurate Bounding Box Regression. arXiv 2022, arXiv:2101.08158. [Google Scholar]
- Cohen, N.; Ducoffe, M.; Boumazouza, R.; Gabreau, C.; Pagetti, C.; Pucel, X.; Galametz, A. Verification for Object Detection—IBP IoU. arXiv 2024, arXiv:2403.08788. [Google Scholar]
- Redmon, J.; Farhadi, A. YOLOv3: An Incremental Improvement. arXiv 2018, arXiv:1804.02767. [Google Scholar]
- Li, C.; Li, L.; Jiang, H.; Weng, K.; Geng, Y.; Li, L.; Ke, Z.; Li, Q.; Cheng, M.; Nie, W.; et al. YOLOv6: A Single-Stage Object Detection Framework for Industrial Applications. arXiv 2022, arXiv:2209.02976. [Google Scholar]
- Wang, C.-Y.; Bochkovskiy, A.; Liao, H.-Y.M. YOLOv7: Trainable Bag-of-Freebies Sets New State-of-the-Art for Real-Time Object Detectors. arXiv 2022, arXiv:2207.02696. [Google Scholar]
- Liu, W.; Anguelov, D.; Erhan, D.; Szegedy, C.; Reed, S.; Fu, C.-Y.; Berg, A.C. SSD: Single Shot MultiBox Detector. In Proceedings of the European Conference on Computer Vision (ECCV), Amsterdam, The Netherlands, 11–14 October 2016; Leibe, B., Matas, J., Sebe, N., Welling, M., Eds.; pp. 21–37. [Google Scholar]
- Ren, S.; He, K.; Girshick, R.; Sun, J. Faster R-CNN: Towards Real-Time Object Detection with Region Proposal Networks. arXiv 2016, arXiv:1506.01497. [Google Scholar]
- Ouyang, D.; He, S.; Zhang, G.; Luo, M.; Guo, H.; Zhan, J.; Huang, Z. Efficient Multi-Scale Attention Module with Cross-Spatial Learning. In Proceedings of the ICASSP 2023—2023 IEEE International Conference on Acoustics, Speech and Signal Processing (ICASSP), Rhodes Island, Greece, 4–10 June 2023; pp. 1–5. [Google Scholar]
- Woo, S.; Park, J.; Lee, J.-Y.; Kweon, I.S. CBAM: Convolutional Block Attention Module. In Proceedings of the European Conference on Computer Vision (ECCV), Munich, Germany, 8–14 September 2018; pp. 3–19. [Google Scholar]
- Li, Y.; Hou, Q.; Zheng, Z.; Cheng, M.-M.; Yang, J.; Li, X. Large Selective Kernel Network for Remote Sensing Object Detection. In Proceedings of the 2023 IEEE/CVF International Conference on Computer Vision (ICCV), Paris, France, 1–6 October 2023; pp. 16748–16759. [Google Scholar]
- Wang, Q.; Wu, B.; Zhu, P.; Li, P.; Zuo, W.; Hu, Q. ECA-Net: Efficient Channel Attention for Deep Convolutional Neural Networks. In Proceedings of the 2020 IEEE/CVF Conference on Computer Vision and Pattern Recognition, Seattle, WA, USA, 13–19 June 2020; pp. 11534–11542. [Google Scholar]
- Liu, Y.; Shao, Z.; Hoffmann, N. Global Attention Mechanism: Retain Information to Enhance Channel-Spatial Interactions. arXiv 2021, arXiv:2112.05561. [Google Scholar]
- Hu, J.; Shen, L.; Albanie, S.; Sun, G.; Wu, E. Squeeze-and-Excitation Networks. arXiv 2019, arXiv:1709.01507. [Google Scholar]
- Huang, H.; Chen, Z.; Zou, Y.; Lu, M.; Chen, C.; Song, Y.; Zhang, H.; Yan, F. Channel Prior Convolutional Attention for Medical Image Segmentation. Comput. Biol. Med. 2024, 178, 108784. [Google Scholar] [CrossRef] [PubMed]
- Yang, G.; Lei, J.; Zhu, Z.; Cheng, S.; Feng, Z.; Liang, R. AFPN: Asymptotic Feature Pyramid Network for Object Detection. In Proceedings of the 2023 IEEE International Conference on Systems, Man, and Cybernetics (SMC), Honolulu, HI, USA, 1–4 October 2023; pp. 2184–2189. [Google Scholar]






| Task | Ref. | Dataset Type | Dataset | Contributions |
|---|---|---|---|---|
| Det | [6] | Simulated (FlightGear) | - | 1. Detection under low-light conditions at night; 2. Fusion of visible light and infrared images; 3. Improved Faster-RCNN runway detection model; 4. UAV relative pose estimation with respect to runway. |
| [5] | Simulated (Vega Prime) and real | - | 1. Enhanced YOLOX for coarse runway localization; 2. Precise runway line detection algorithm; 3. Vision-based localization and vision/inertial fusion navigation. | |
| [23] | Simulated (Prepar3D) | AIRport LAnding Dataset (AIRLAD) | 1. Synthesizing adverse weather using vision-language models; 2. Mitigating visual degradations using distillation models; 3. Image transformation under crosswind landings using RuSTaN; 4. Detecting runway elements in images using YOLOv8. | |
| [24] | Simulated (UE platform) and real | Aerovista Runway Dataset (ATD) | 1. Runway detection algorithm tailored for edge devices; 2. Combining YOLOv10 and MobileNetv3 for better performance; 3. Without the need for non-maximum suppression (NMS); 4. Runway keypoint detection and corresponding Wing loss. | |
| [25] | Simulated (Airsim) | - | 1. Vision-based landing for carrier-based UAVs (CUAV); 2. Image dehazing model based on CNN and Transformer; 3. Ultra-fast lane detection (UFLD) for runway line detection; 4. Random sample consensus (RANSAC) for outlier removal. | |
| [26] | Simulated (Google Earth Studio) and real | Landing Approach Runway Detection (LARD) | 1. Runway detection based on federated adversarial learning; 2. Enhanced data privacy and robustness against adversarial attacks; 3. Reduced communication using scale and shift deep features (SSF); 4. Fine-tuning based on lane detection vision transformer (ViT). | |
| Seg | [7] | Simulated (Microsoft Flight Simulator 2020) | FS2020 | 1. Real-time efficient runway feature extractor (ERFE); 2. Both semantic segmentation and feature line probability maps; 3. Feature line reconstruction using weighted regression; 4. Improved benchmark for evaluating feature line error. |
| [2] | Simulated (X-Plane 11) | Benchmark for airport runway segmentation (BARS) | 1. Semi-automatic annotation pipeline for runway images; 2. Smoothing postprocessing module (SPM) for smoothing masks; 3. Contour point constraint loss (CPCL) for smoothing contours; 4. Average smoothness (AS) metric to evaluate the smoothness. | |
| [1] | Simulated (X-Plane 11) and real | Runway Landing Dataset (RLD) | 1. Context enhancement module (CEM) for effective features; 2. Asymptotic feature pyramid network (AFPN) for semantic gaps; 3. Orientation adaptation module (OAM) for rotational information. |
| Dataset | Type | Resolutions | |||
|---|---|---|---|---|---|
| Training | Synthetic | 15 | 32 | 14,431 | 2448 × 2048 |
| Test | Synthetic | 40 | 79 | 2212 | 2448 × 2048 |
| Real nominal | 95 | 115 | 4023 | 1280 × 720, 1920 × 1080, 3840 × 2160 | |
| Real edge | 34 | 40 | 1811 | 1280 × 720, 1920 × 1080, 3840 × 2160 1 | |
| Total | - | 184 total (138 unique) | 266 | 18,454 | - |
| Phase | Parameter | Setup |
|---|---|---|
| Training and fine-tuning | Epochs | 300 |
| Epoch (warming up) | 3 | |
| Epoch (closing Mosaic) | Last 20 | |
| Batch size (per GPU) | 16 | |
| Workers (per GPU) | 8 | |
| Number of GPUs | 10 | |
| Optimizer | SGD | |
| Initial learning rate | 0.0125 | |
| Final learning rate | 0.0125 × 0.01 | |
| Momentum | 0.937 | |
| Weight decay | 0.0005 | |
| Image size 1 | 640 | |
| Test | Batch size | 64 |
| Number of GPUs | 1 | |
| NMS confidence | 0.001 | |
| NMS IoU | 0.6 | |
| Max detections | 8 | |
| Image size 2 | 640 |
| Model | Param. (M) | FLOPs (G) | FPS | ||||
|---|---|---|---|---|---|---|---|
| YOLOv3 | 0.684 | 0.492 | 0.233 | 0.448 | 61.524 | 58.861 | 83.9 |
| YOLOv6n | 0.722 | 0.524 | 0.219 | 0.473 | 4.301 | 5.495 | 70.9 |
| SSD | 0.670 | 0.530 | 0.244 | 0.482 | 24.386 | 87.541 | 65.8 |
| YOLOv7t | 0.687 | 0.524 | 0.316 | 0.488 | 6.015 | 6.551 | 103.6 |
| YOLOv5n | 0.706 | 0.540 | 0.302 | 0.499 | 1.765 | 2.088 | 100.1 |
| Faster RCNN | 0.719 | 0.566 | 0.286 | 0.517 | 41.348 | 158.276 | 32.7 |
| YOLOv8n | 0.754 | 0.586 | 0.348 | 0.545 | 3.011 | 8.194 | 135.0 |
| Proposed | 0.760 | 0.611 | 0.413 | 0.578 | 3.106 | 8.308 | 125.3 |
| Model | Param. (M) | FLOPs (G) | FPS | ||||
|---|---|---|---|---|---|---|---|
| YOLOv8n | 0.754 | 0.586 | 0.348 | 0.545 | 3.011 | 8.194 | 135.0 |
| YOLOv8n-EMA | 0.754 | 0.561 | 0.323 | 0.521 | 3.012 | 8.215 | 122.0 |
| YOLOv8n-CBAM | 0.758 | 0.568 | 0.340 | 0.528 | 3.077 | 8.247 | 132.8 |
| YOLOv8n-LSK | 0.756 | 0.569 | 0.338 | 0.529 | 3.130 | 8.288 | 125.0 |
| YOLOv8n-ECA | 0.753 | 0.576 | 0.338 | 0.535 | 3.011 | 8.196 | 131.0 |
| YOLOv8n-GAM | 0.759 | 0.583 | 0.342 | 0.541 | 4.651 | 9.506 | 130.9 |
| YOLOv8n-SE | 0.751 | 0.584 | 0.353 | 0.544 | 3.019 | 8.201 | 127.3 |
| YOLOv8n-CPCA | 0.760 | 0.588 | 0.358 | 0.549 | 3.138 | 8.425 | 126.7 |
| YOLOv8n-LSKA | 0.751 | 0.590 | 0.366 | 0.552 | 3.089 | 8.256 | 132.3 |
| Model | Param. (M) | FLOPs (G) | FPS | ||||
|---|---|---|---|---|---|---|---|
| YOLOv8n | 0.754 | 0.586 | 0.348 | 0.545 | 3.011 | 8.194 | 135.0 |
| YOLOv8n-AFPN | 0.761 | 0.574 | 0.333 | 0.532 | 4.667 | 15.641 | 101.9 |
| YOLOv8n-BiFPN | 0.758 | 0.591 | 0.365 | 0.553 | 3.027 | 8.247 | 135.4 |
| Model | EDA Prob. | Param. (M) | FLOPs (G) | FPS | (min) | ||||
|---|---|---|---|---|---|---|---|---|---|
| YOLOv8n | 0% | 0.754 | 0.586 | 0.348 | 0.545 | 3.011 | 8.194 | 135.0 | 140.42 |
| 1% | 0.746 | 0.596 | 0.368 | 0.558 | 3.011 | 8.194 | 129.1 | 146.67 | |
| 5% | 0.749 | 0.600 | 0.381 | 0.563 | 3.011 | 8.194 | 140.2 | 160.92 |
| Model | Module | Param. (M) | FLOPs (G) | FPS | (min) | |||||||
|---|---|---|---|---|---|---|---|---|---|---|---|---|
| LSKA | BiFPN | EIoU | EDA | |||||||||
| YOLOv8n | 0.754 | 0.586 | 0.348 | 0.545 | 3.011 | 8.194 | 135.0 | 140.42 | ||||
| √ | 0.751 | 0.590 | 0.366 | 0.552 | 3.089 | 8.256 | 132.3 | 141.50 | ||||
| √ | 0.758 | 0.591 | 0.365 | 0.553 | 3.027 | 8.247 | 135.4 | 141.12 | ||||
| √ | 0.757 | 0.572 | 0.338 | 0.532 | 3.011 | 8.194 | 132.4 | 139.33 | ||||
| √ | √ | 0.761 | 0.598 | 0.374 | 0.559 | 3.106 | 8.308 | 129.3 | 141.17 | |||
| √ | √ | 0.756 | 0.576 | 0.339 | 0.536 | 3.089 | 8.256 | 135.8 | 139.18 | |||
| √ | √ | 0.755 | 0.575 | 0.359 | 0.537 | 3.027 | 8.247 | 123.3 | 141.42 | |||
| Proposed (w/o EDA) 1 | √ | √ | √ | 0.762 | 0.600 | 0.393 | 0.563 | 3.106 | 8.308 | 131.4 | 141.53 | |
| Proposed | √ | √ | √ | √ | 0.760 | 0.611 | 0.413 | 0.578 | 3.106 | 8.308 | 125.3 | 160.12 |
| Model | Metric | Test Sets | |||
|---|---|---|---|---|---|
| YOLOv8n | - | 0.188 | 0.110 | 0.174 | |
| 0.621 | 0.461 | 0.268 | 0.432 | ||
| 0.813 | 0.784 | 0.439 | 0.715 | ||
| Proposed (w/o EDA) | - | 0.193 (+02.7%) | 0.149 (+35.5%) | 0.185 (+06.3%) | |
| 0.632 (+01.8%) | 0.473 (+02.6%) | 0.319 (+19.0%) | 0.450 (+04.2%) | ||
| 0.821 (+01.0%) | 0.799 (+01.9%) | 0.478 (+08.9%) | 0.735 (+02.8%) | ||
| Proposed | - | 0.205 (+09.0%) | 0.191 (+73.6%) | 0.201 (+15.5%) | |
| 0.634 (+02.1%) | 0.476 (+03.3%) | 0.306 (+14.2%) | 0.452 (+04.6%) | ||
| 0.817 (+00.5%) | 0.815 (+04.0%) | 0.521 (+18.7%) | 0.759 (+06.2%) | ||
| Model | Metric | Range of Along-Track Distance (NM) | |||||
|---|---|---|---|---|---|---|---|
| 0.0–0.5 | 0.5–1.0 | 1.0–1.5 | 1.5–2.0 | 2.0–2.5 | 2.5–3.0 | ||
| YOLOv8n | 0.897 | 0.801 | 0.704 | 0.666 | 0.598 | 0.577 | |
| Proposed | 0.847 (−05.6%) | 0.877 (+09.6%) | 0.770 (+09.4%) | 0.712 (+06.9%) | 0.679 (+13.5%) | 0.668 (+15.8%) | |
| Model | Metric | Range of Time to Landing (s) | ||||
|---|---|---|---|---|---|---|
| 0–10 | 10–20 | 20–40 | 40–80 | 80–160 | ||
| YOLOv8n | 0.824 | 0.659 | 0.441 | 0.279 | 0.044 | |
| 0.536 | 0.300 | 0.207 | 0.066 | 0.034 | ||
| 0.760 | 0.599 | 0.409 | 0.252 | 0.041 | ||
| Proposed | 0.884 (+07.3%) | 0.825 (+25.3%) | 0.657 (+49.0%) | 0.496 (+77.6%) | 0.343 (+683.3%) | |
| 0.689 (+28.5%) | 0.498 (+66.1%) | 0.378 (+82.4%) | 0.252 (+279.8%) | 0.020 (−40.4%) | ||
| 0.842 (+10.7%) | 0.778 (+29.9%) | 0.620 (+51.5%) | 0.464 (+84.4%) | 0.304 (+639.8%) | ||
| Model | Image Size | Param. (M) | FLOPs (G) | FPS | (min) | |||||
|---|---|---|---|---|---|---|---|---|---|---|
| Training | Test | |||||||||
| Proposed | 640 | 640 | 0.760 | 0.611 | 0.413 | 0.578 | 3.106 | 8.308 | 125.3 | 160.12 |
| 640 | 1280 | 0.785 (+03.3%) | 0.744 (+21.8%) | 0.517 (+25.2%) | 0.707 (+22.3%) | 3.106 (+00.0%) | 33.232 (+300.0%) | 89.3 (−28.7%) | 160.12 | |
| 1280 | 1280 | 0.848 (+11.6%) | 0.750 (+22.7%) | 0.489 (+18.4%) | 0.709 (+22.7%) | 3.106 (+00.0%) | 33.232 (+300.0%) | 90.9 (−27.5%) | 346.58 | |
| Model | Image Size | Quantization | Latency (ms) | FPS 1 | ||
|---|---|---|---|---|---|---|
| Training | Inference | |||||
| Proposed | 640 | 640 | FP16 | 0.578 | 4.744 | 210.8 |
| 640 | FP32 | 0.578 | 6.475 | 154.4 | ||
| 1280 | FP16 | 0.704 | 15.419 | 64.9 | ||
| 1280 | FP32 | 0.707 | 21.762 | 46.0 | ||
| Model | Fine-Tuning EDA Prob. | Fine-Tuning Datasets | Metrics | ||||||
|---|---|---|---|---|---|---|---|---|---|
| (min) 2 | |||||||||
| Proposed | - | - | - | - | 0.760 | 0.611 | 0.413 | 0.578 | 160.12 |
| 5% | √ | 0.712 (−6.3%) | 0.579 (−5.2%) | 0.362 (−12.3%) | 0.542 (−6.2%) | 192.77 | |||
| √ | √ | - | 0.615 (+0.7%) | 0.381 (−7.7%) | 0.576 (−0.3%) | 215.30 | |||
| √ | √ | √ | - | - | 0.557 (+34.9%) | - | 234.30 | ||
| √ | √ | √ 1 | - | - | 0.579 (+40.2%) | - | 235.39 | ||
| 10% | √ | 0.722 (−5.0%) | 0.584 (−4.4%) | 0.376 (−9.0%) | 0.549 (−5.0%) | 196.29 | |||
| √ | √ | - | 0.627 (+2.6%) | 0.401 (−2.9%) | 0.590 (+2.1%) | 221.55 | |||
| √ | √ | √ | - | - | 0.562 (+36.1%) | - | 242.97 | ||
| √ | √ | √ 1 | - | - | 0.582 (+40.9%) | - | 242.99 | ||
Disclaimer/Publisher’s Note: The statements, opinions and data contained in all publications are solely those of the individual author(s) and contributor(s) and not of MDPI and/or the editor(s). MDPI and/or the editor(s) disclaim responsibility for any injury to people or property resulting from any ideas, methods, instructions or products referred to in the content. |
© 2024 by the authors. Licensee MDPI, Basel, Switzerland. This article is an open access article distributed under the terms and conditions of the Creative Commons Attribution (CC BY) license (https://creativecommons.org/licenses/by/4.0/).
Share and Cite
Li, Y.; Xia, Y.; Zheng, G.; Guo, X.; Li, Q. YOLO-RWY: A Novel Runway Detection Model for Vision-Based Autonomous Landing of Fixed-Wing Unmanned Aerial Vehicles. Drones 2024, 8, 571. https://doi.org/10.3390/drones8100571
Li Y, Xia Y, Zheng G, Guo X, Li Q. YOLO-RWY: A Novel Runway Detection Model for Vision-Based Autonomous Landing of Fixed-Wing Unmanned Aerial Vehicles. Drones. 2024; 8(10):571. https://doi.org/10.3390/drones8100571
Chicago/Turabian StyleLi, Ye, Yu Xia, Guangji Zheng, Xiaoyang Guo, and Qingfeng Li. 2024. "YOLO-RWY: A Novel Runway Detection Model for Vision-Based Autonomous Landing of Fixed-Wing Unmanned Aerial Vehicles" Drones 8, no. 10: 571. https://doi.org/10.3390/drones8100571
APA StyleLi, Y., Xia, Y., Zheng, G., Guo, X., & Li, Q. (2024). YOLO-RWY: A Novel Runway Detection Model for Vision-Based Autonomous Landing of Fixed-Wing Unmanned Aerial Vehicles. Drones, 8(10), 571. https://doi.org/10.3390/drones8100571


