
Evaluation of Fissures and Cracks in Bridges by Applying Digital Image Capture Techniques Using an Unmanned Aerial Vehicle


Abstract
:1. Introduction
2. Literature Review
2.1. Structural Incidence and Severity of Cracks and Fissures
2.2. Crack Analysis in Structures
2.3. Photography within Damage Inspection
- (a)
- Image resolution: it depends on the resolution of the camera used. The higher the resolution, the greater the number of pixels, allowing a much better breakdown of its content. However, it is important to emphasize that not only the resolution or the high number of pixels are the relevant factors exclusively, but also the quality of the camera, the size of the sensor (better APS-C or full frame formats), and indeed the sensor resolution.
- (b)
- Light presence: to detect damage, the inspection must be carried out with the necessary amount of light since the perception of a camera is not the same as that of the human eye, where the acquired light provides unique photographic capabilities, such as the ability to digitally refocus the scene after exposure, extend the depth of field, and alter the viewpoint and perspective [15].
- (c)
- Camera-element distance: it defines the scale ratio in the image. The scale corresponds to the number of pixels in a unit of length (m, cm, mm, etc.). In scientific photography, one of the ways to define the scale is based on the known measurement within the image [16], which can be obtained from plans, inspection sheets, or other similar sources.
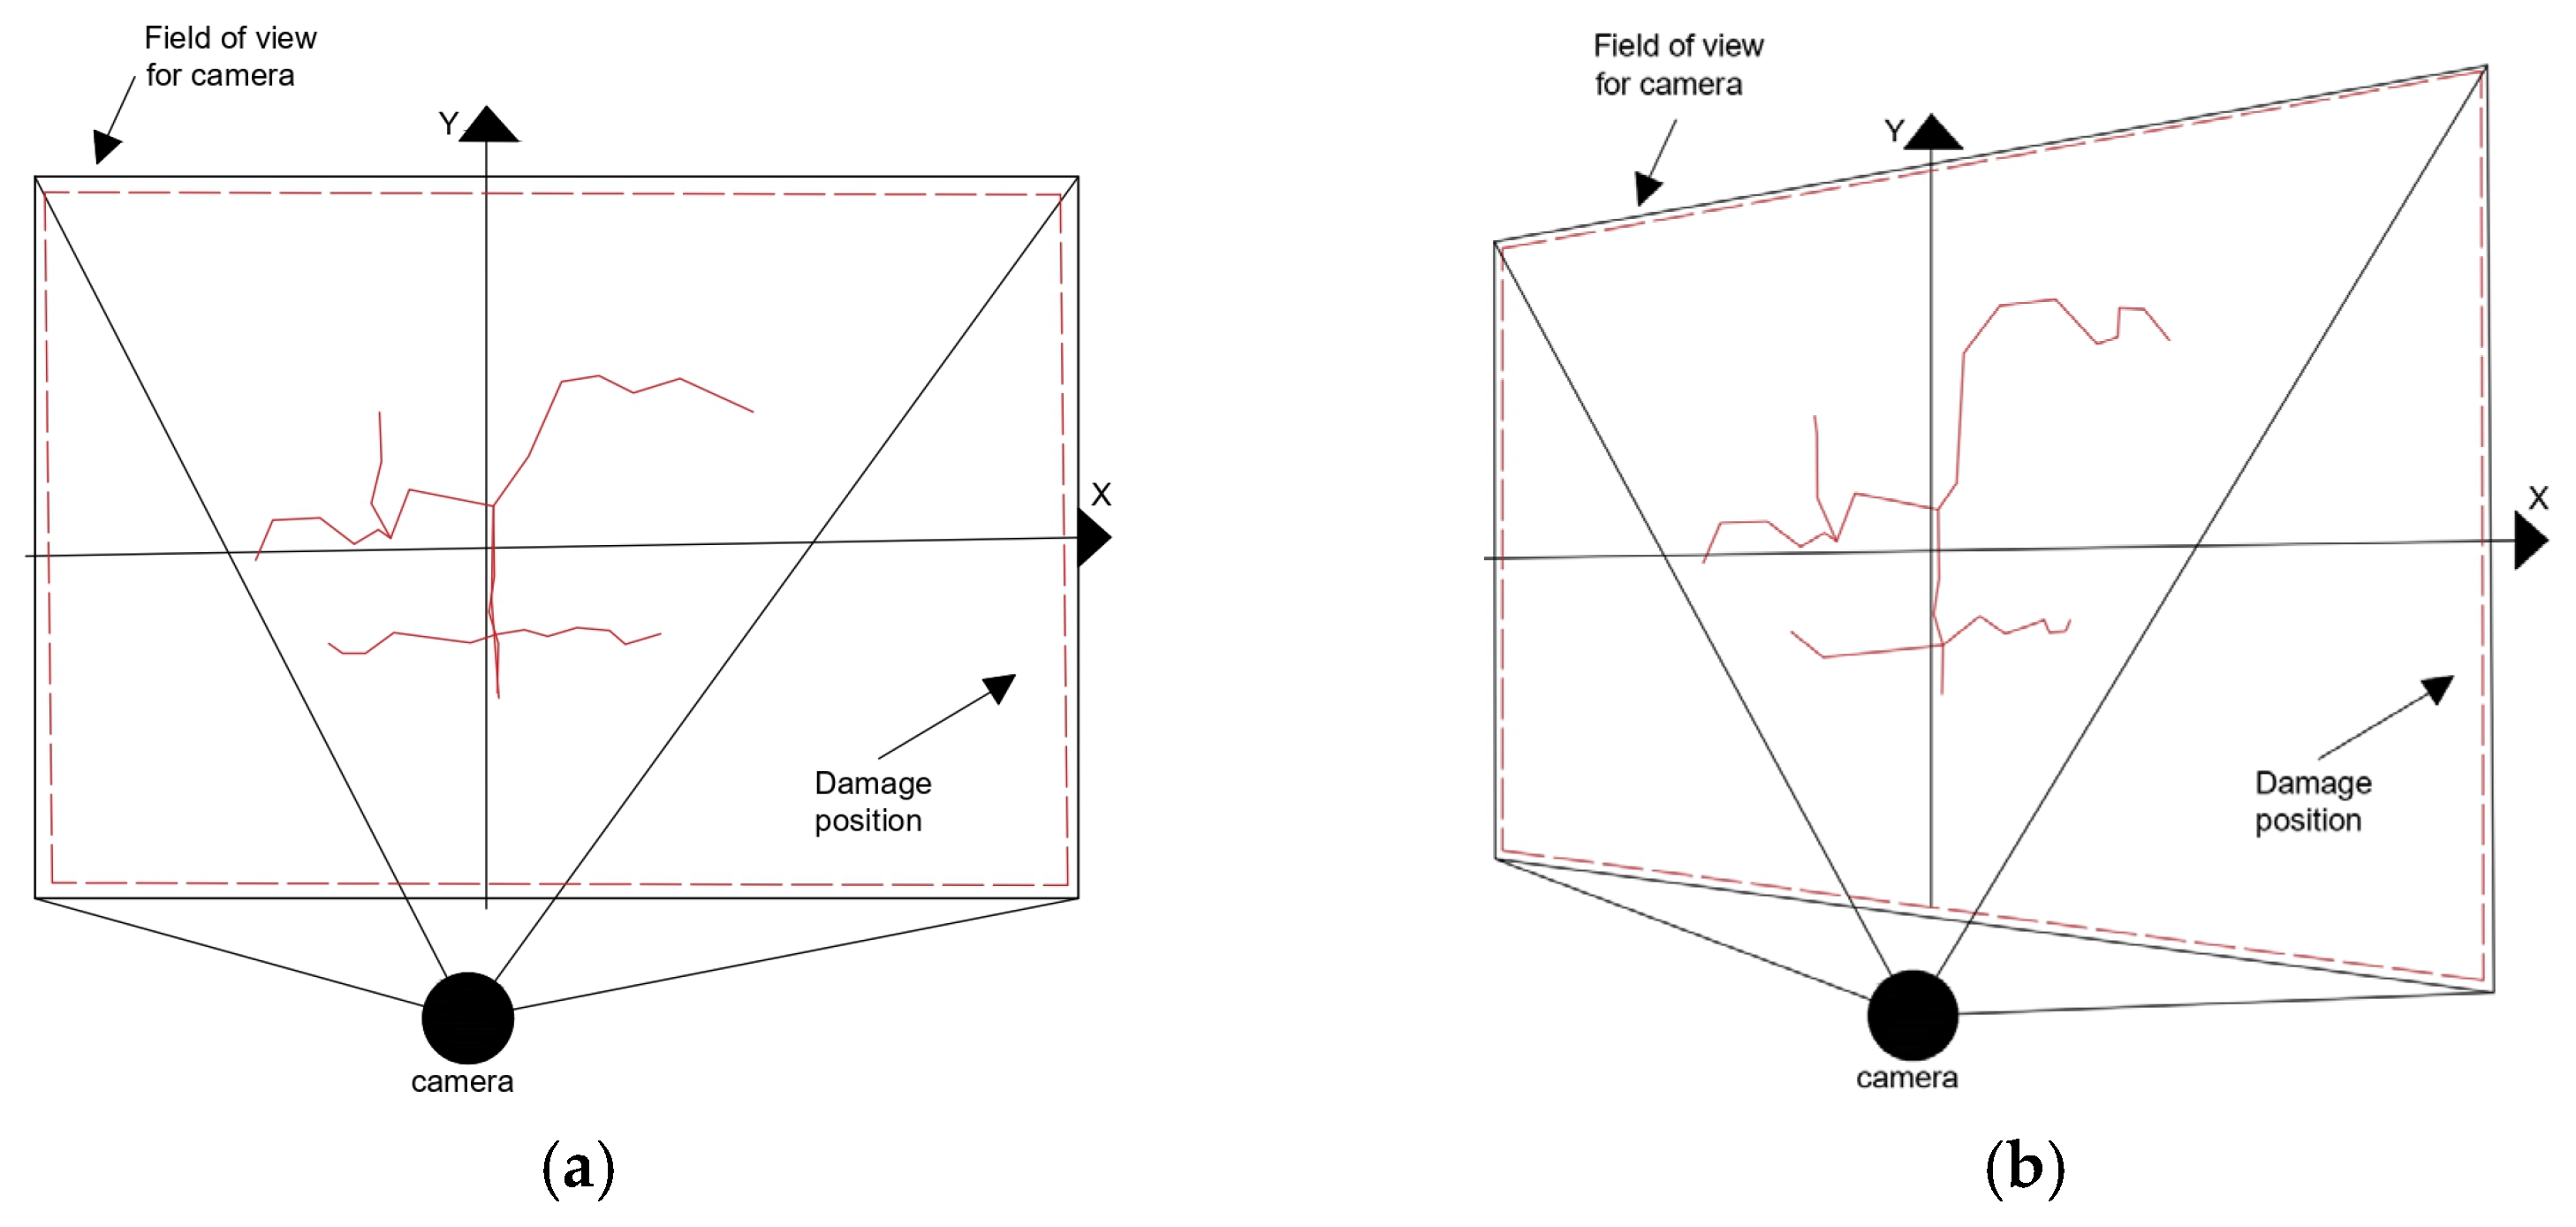
- (d)
- Camera angle: the distortion of measurements is not only determined by the camera angle but is also characterized by the radial and tangential distortion coefficients, which define the distortion model of a camera.
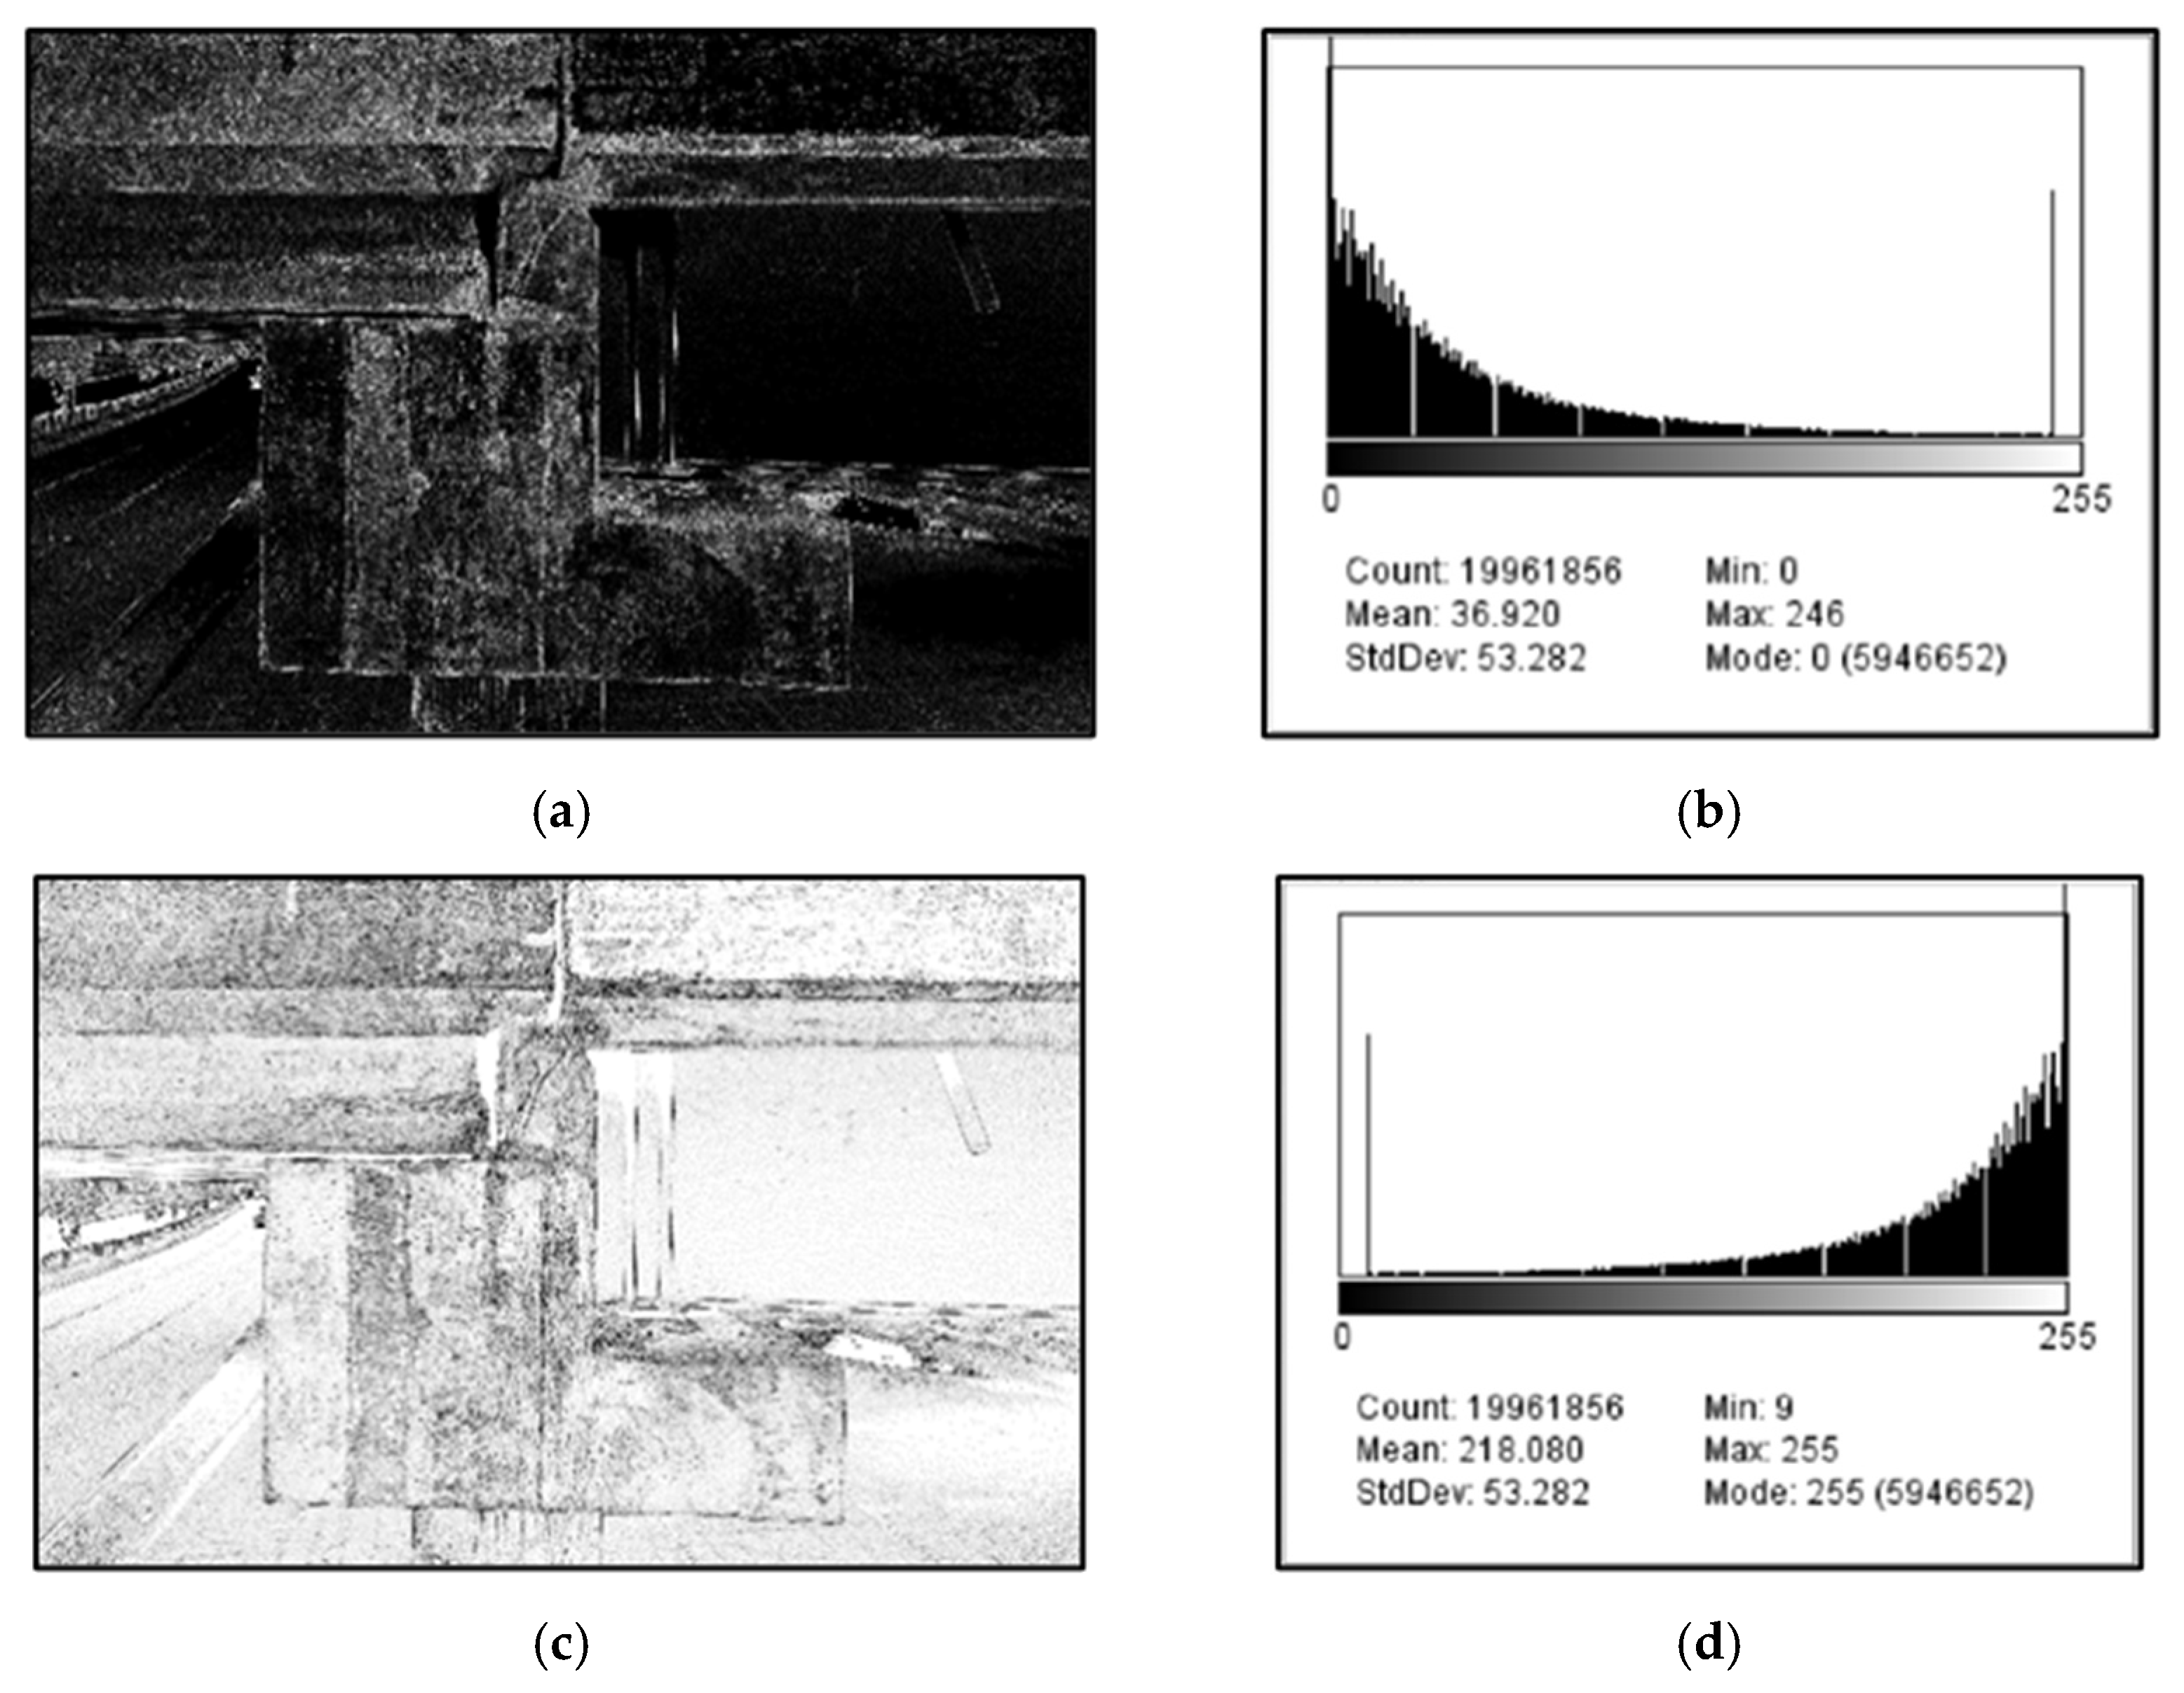
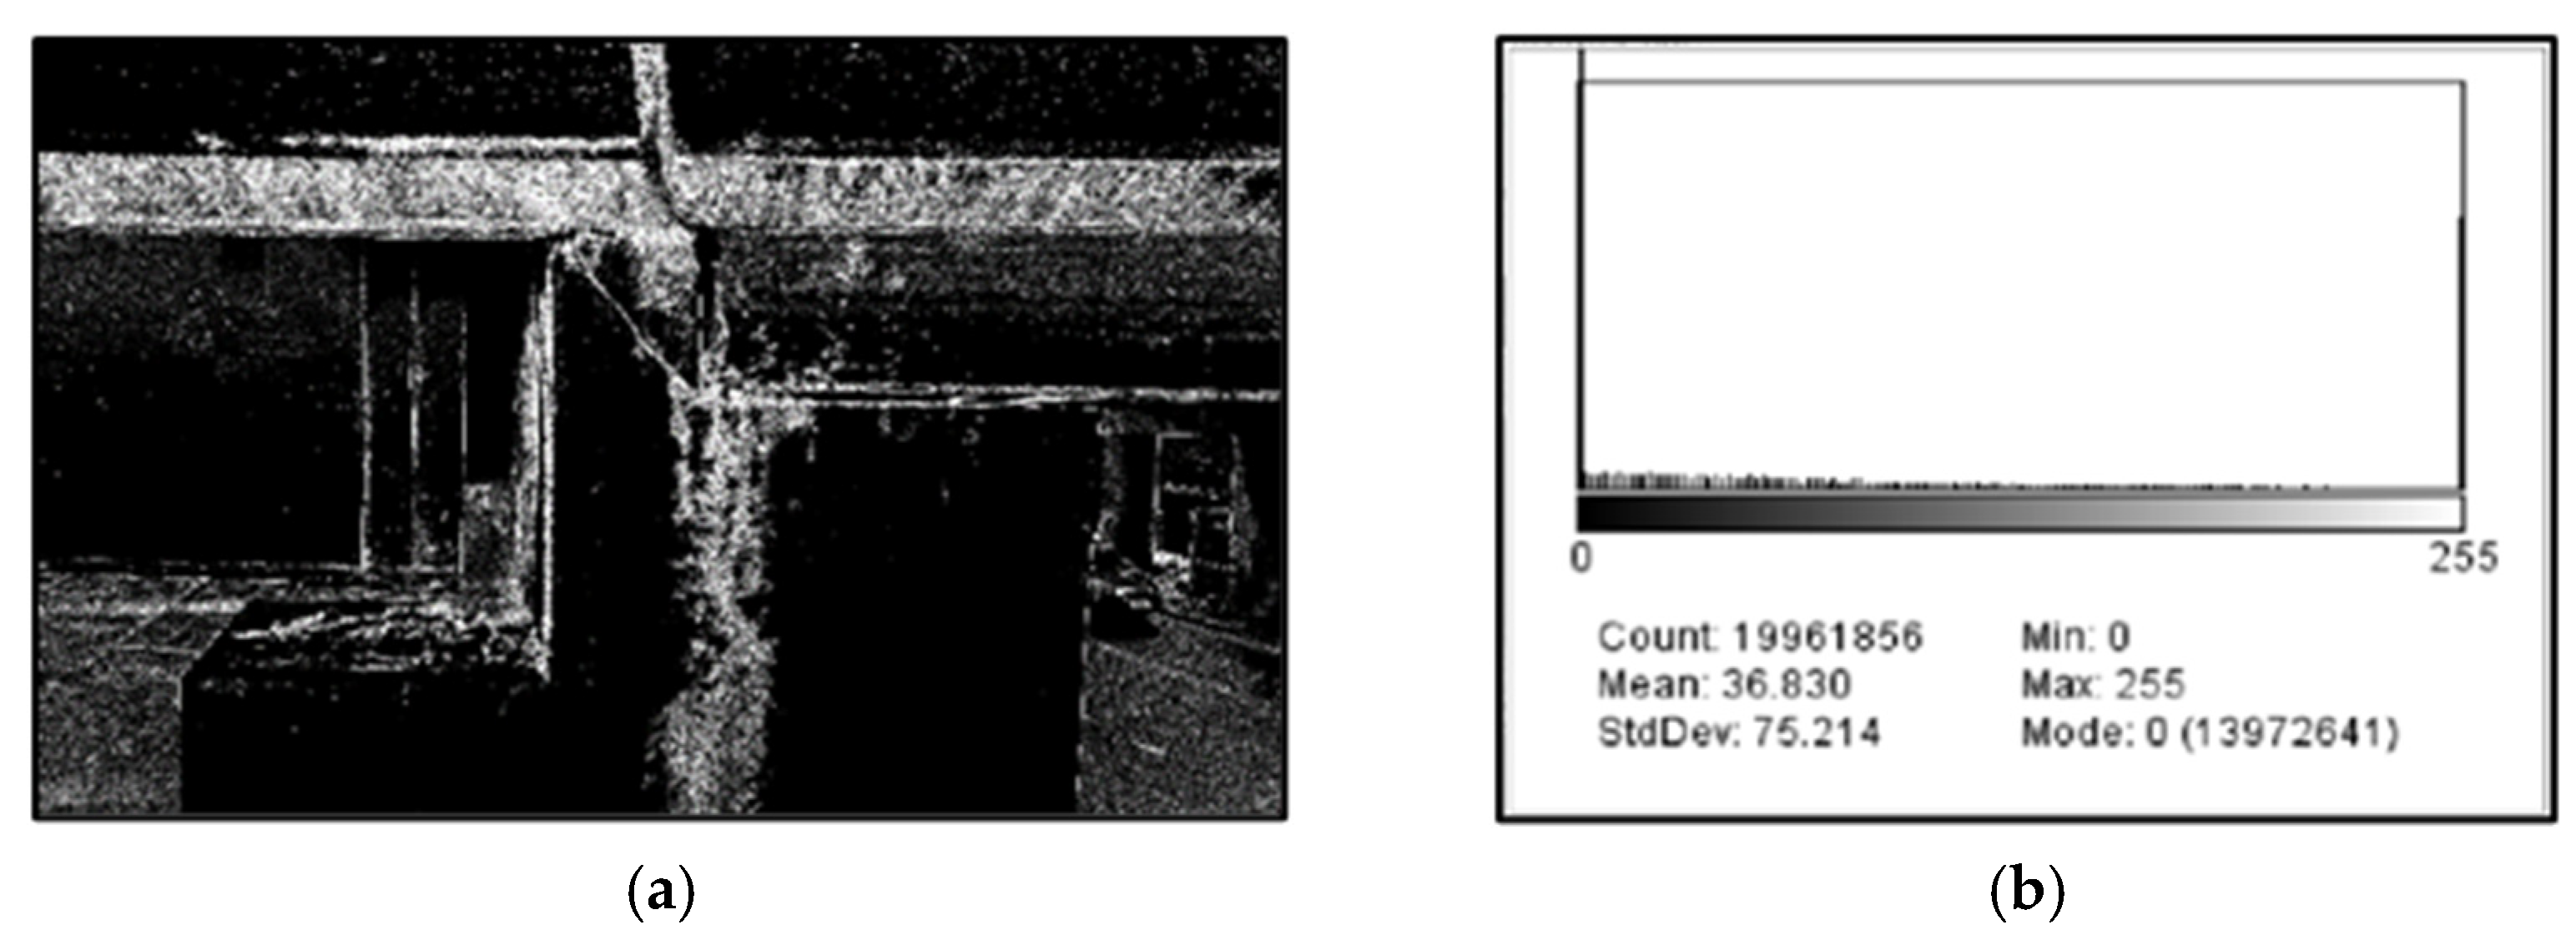
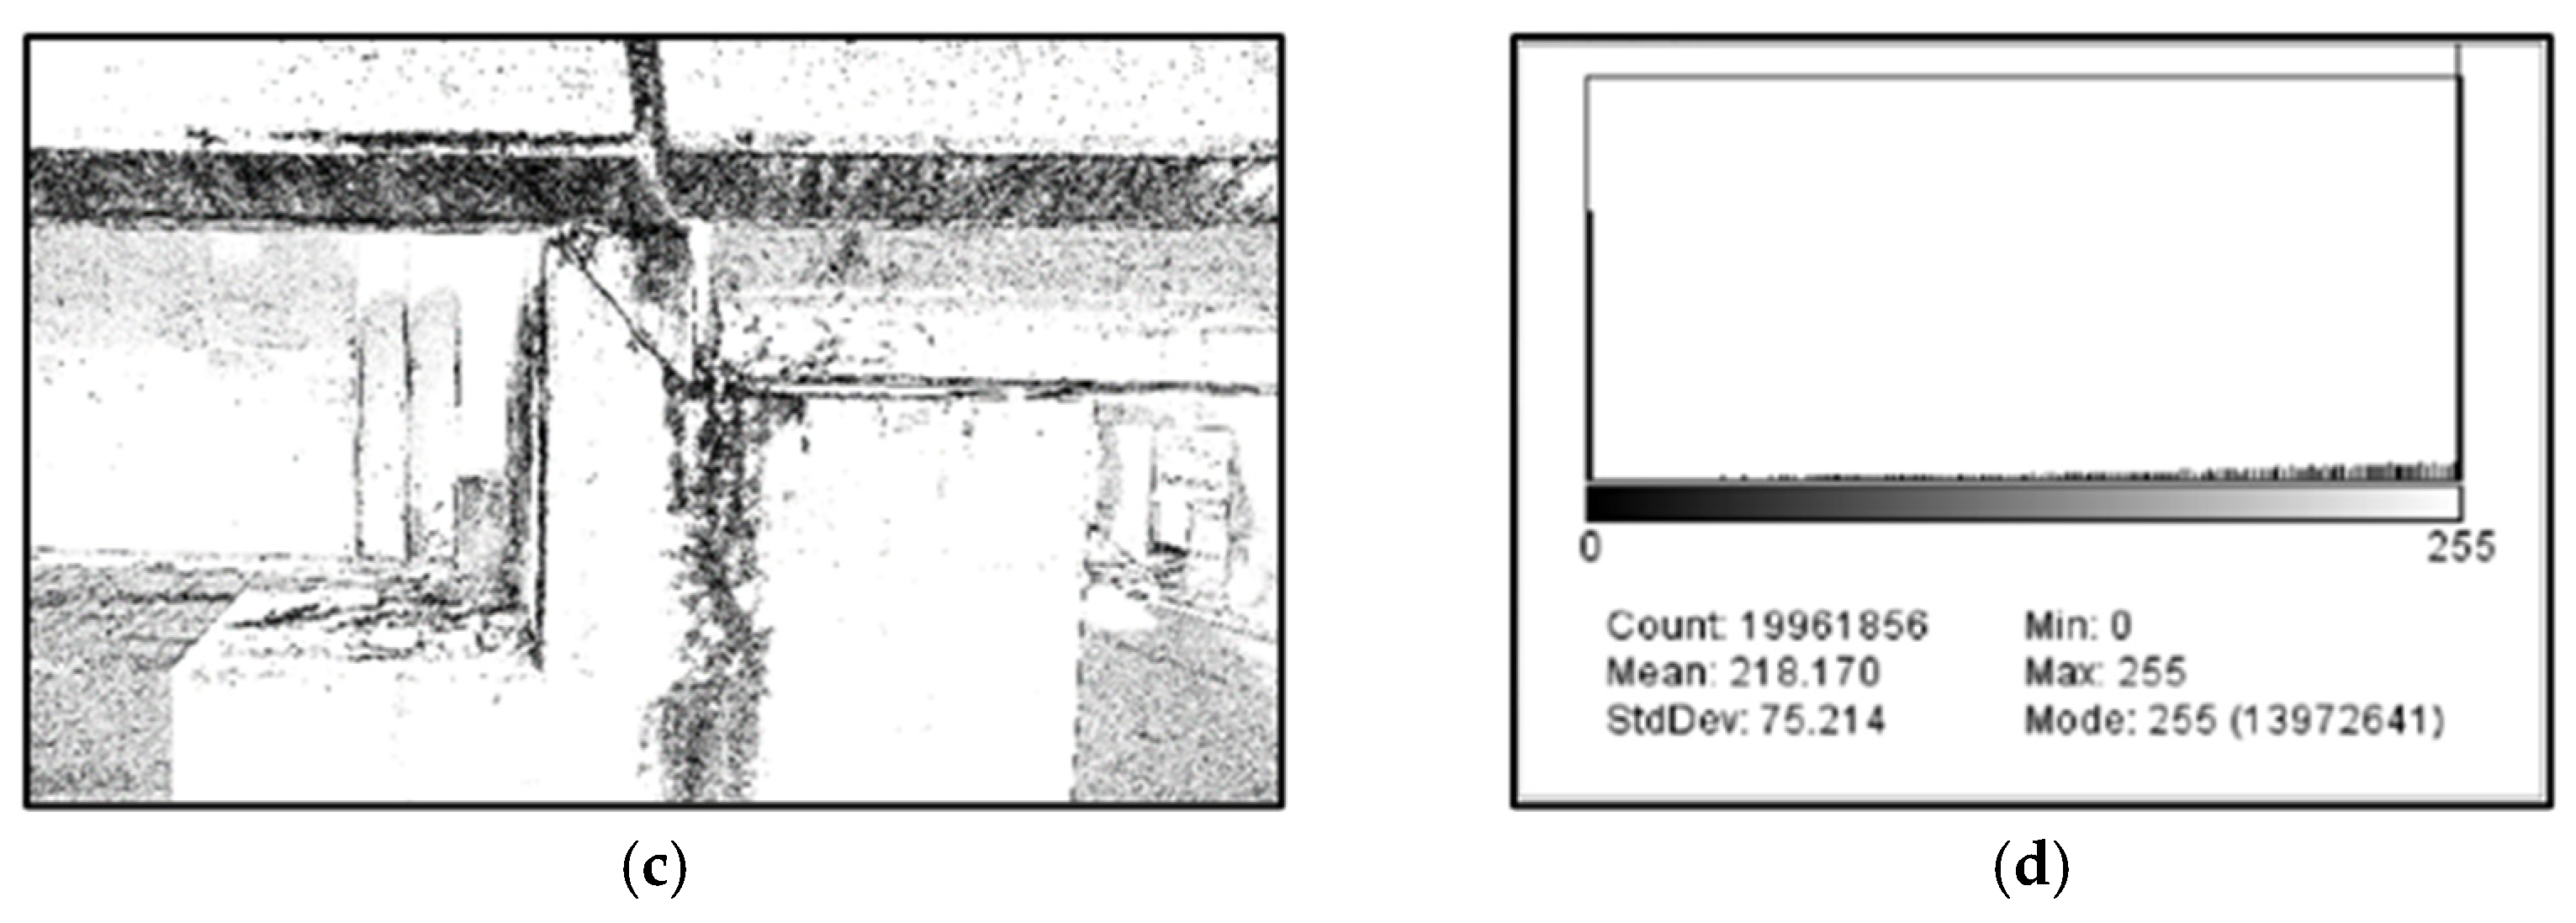
2.4. Techniques to Improve the Quality of a Grayscale Image
Grayscale
2.5. Edge Detection Technique
3. Research Method
3.1. Stage 1: Case Studies
3.2. Stage 2: UAV Selection and Flying
3.3. Stage 3: Analysis and Results
4. Analysis and Results
4.1. Case 1: Estero Nonguén Bridge (Small Bridge)
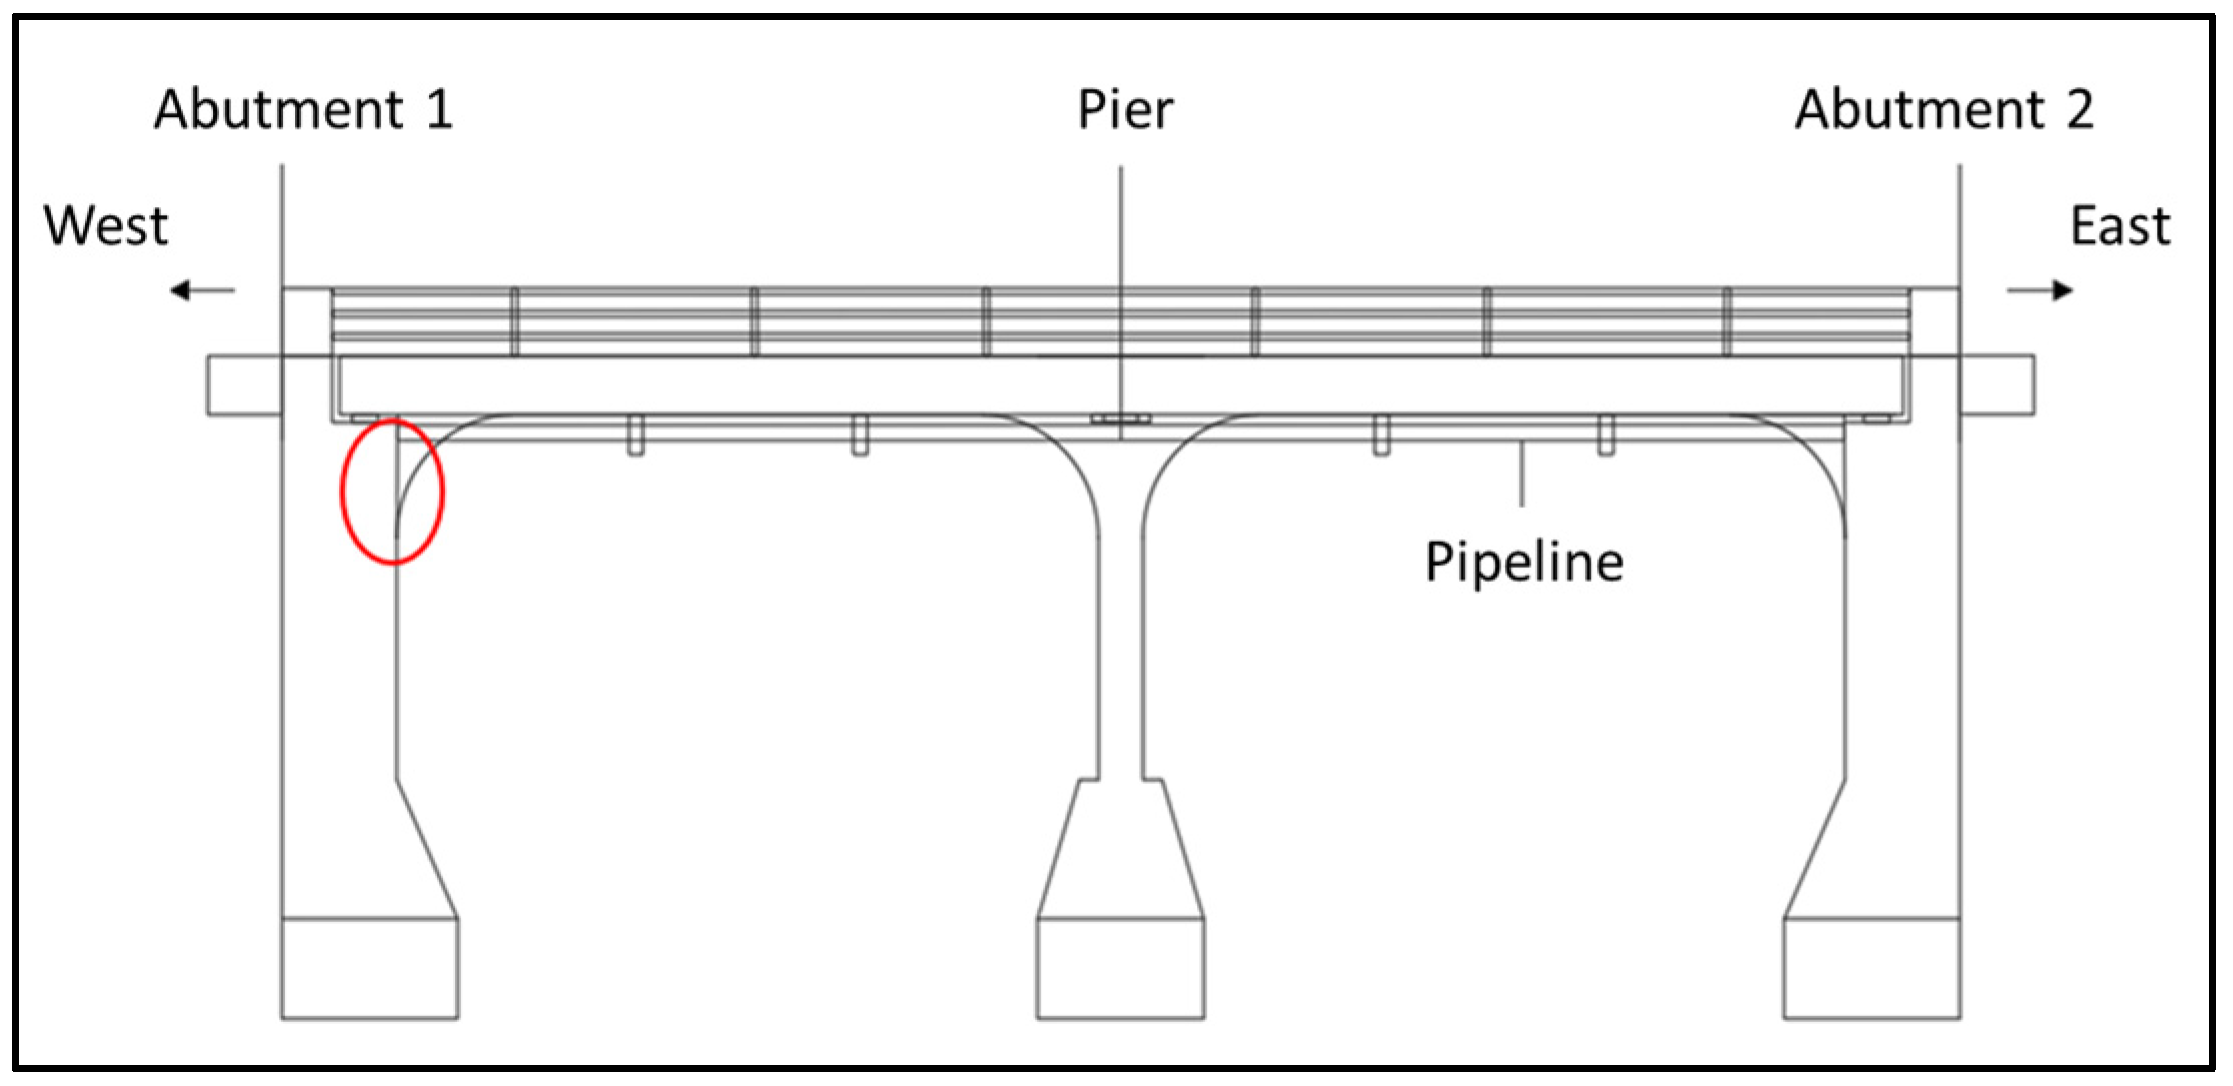
4.1.1. General Description
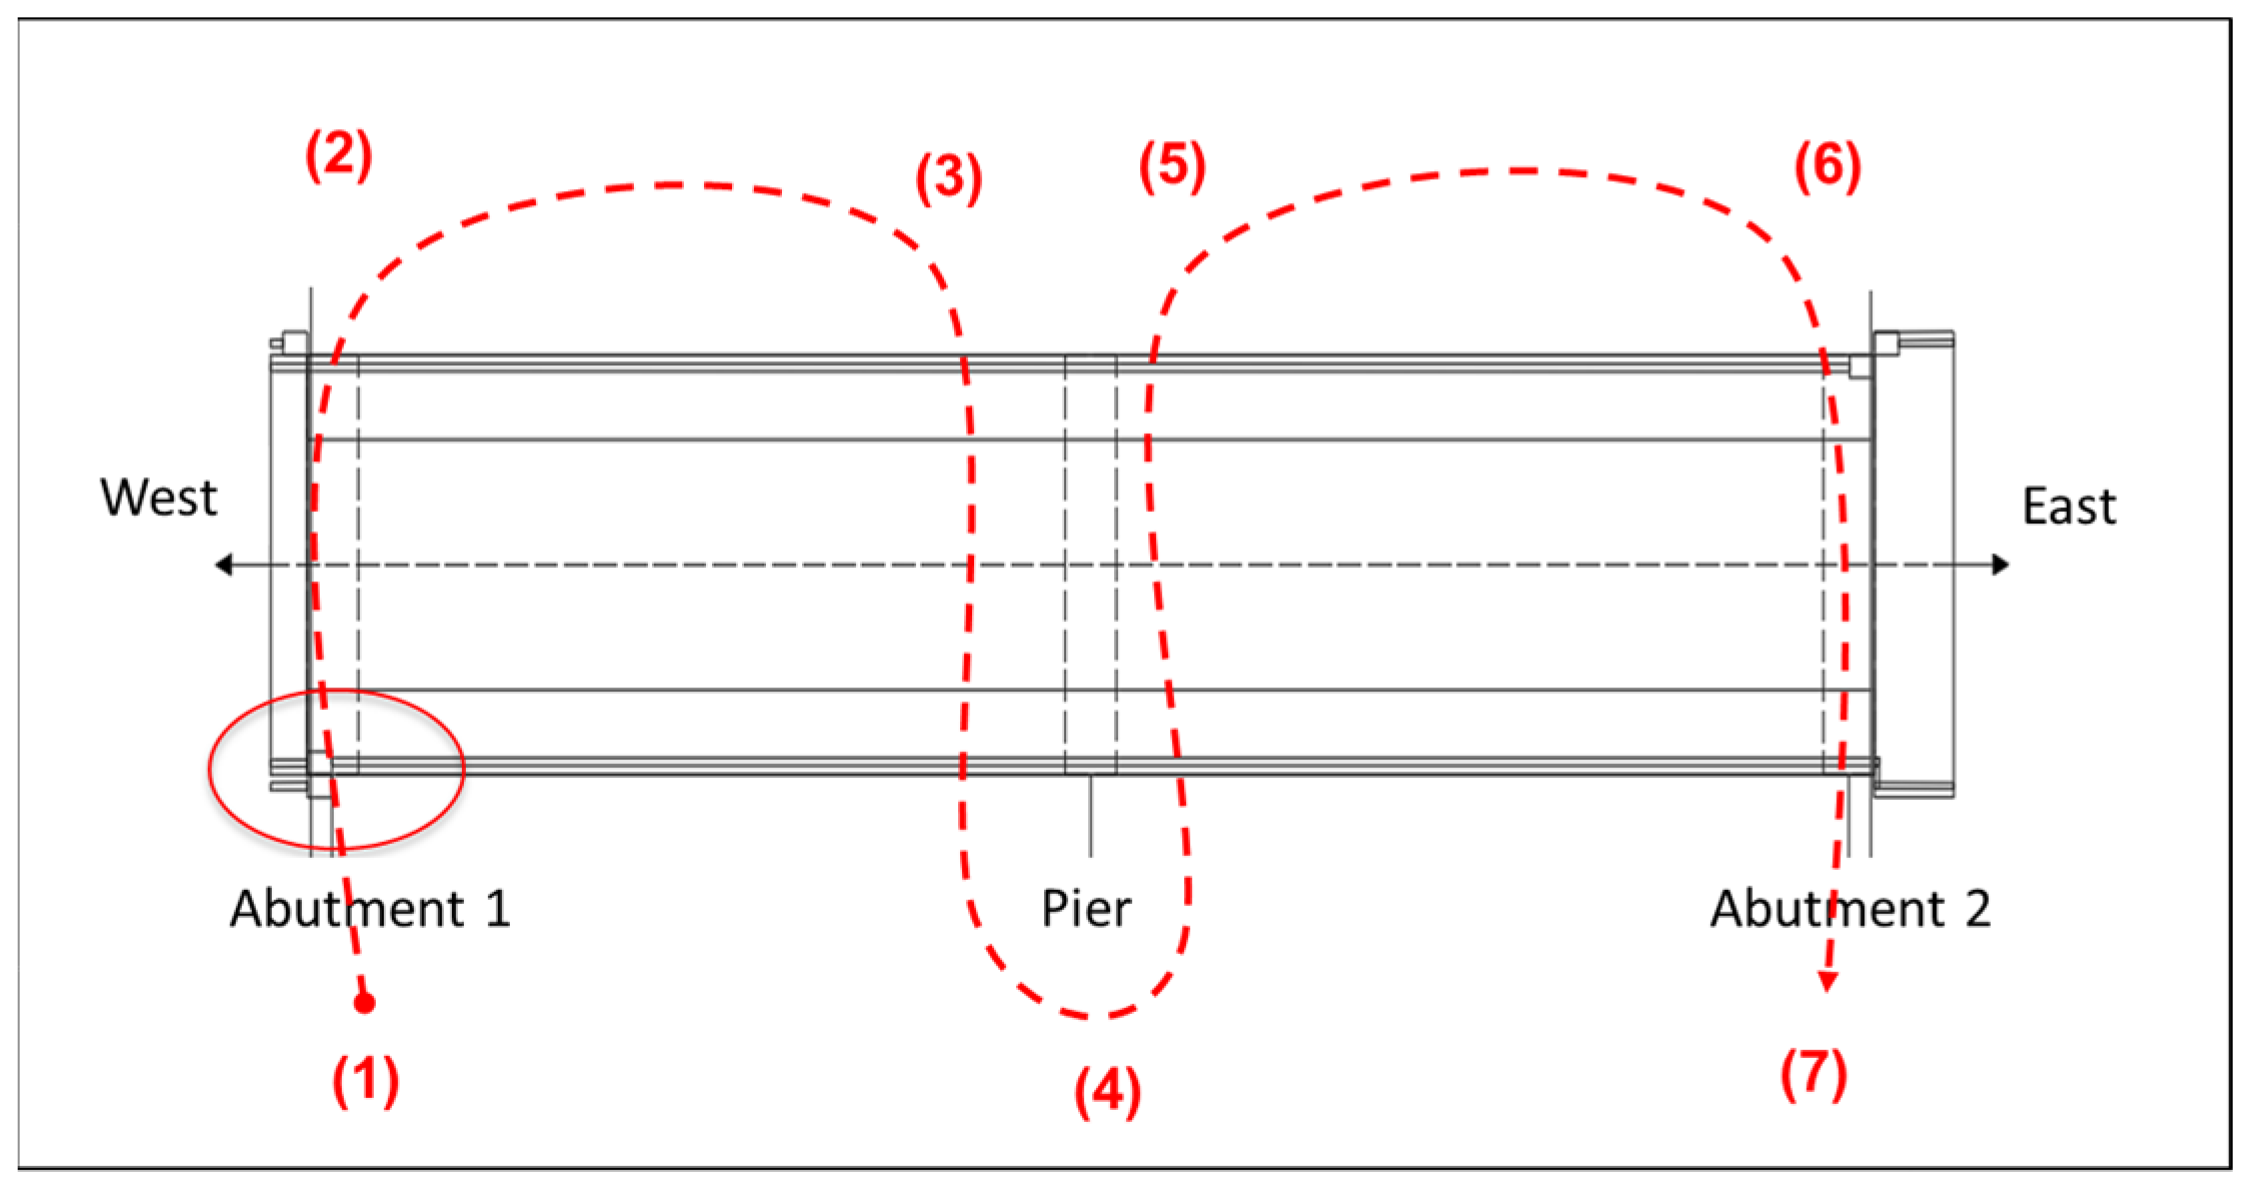
4.1.2. Flight Route
4.1.3. Photographic Record and Image Selection
4.1.4. Image Calibration
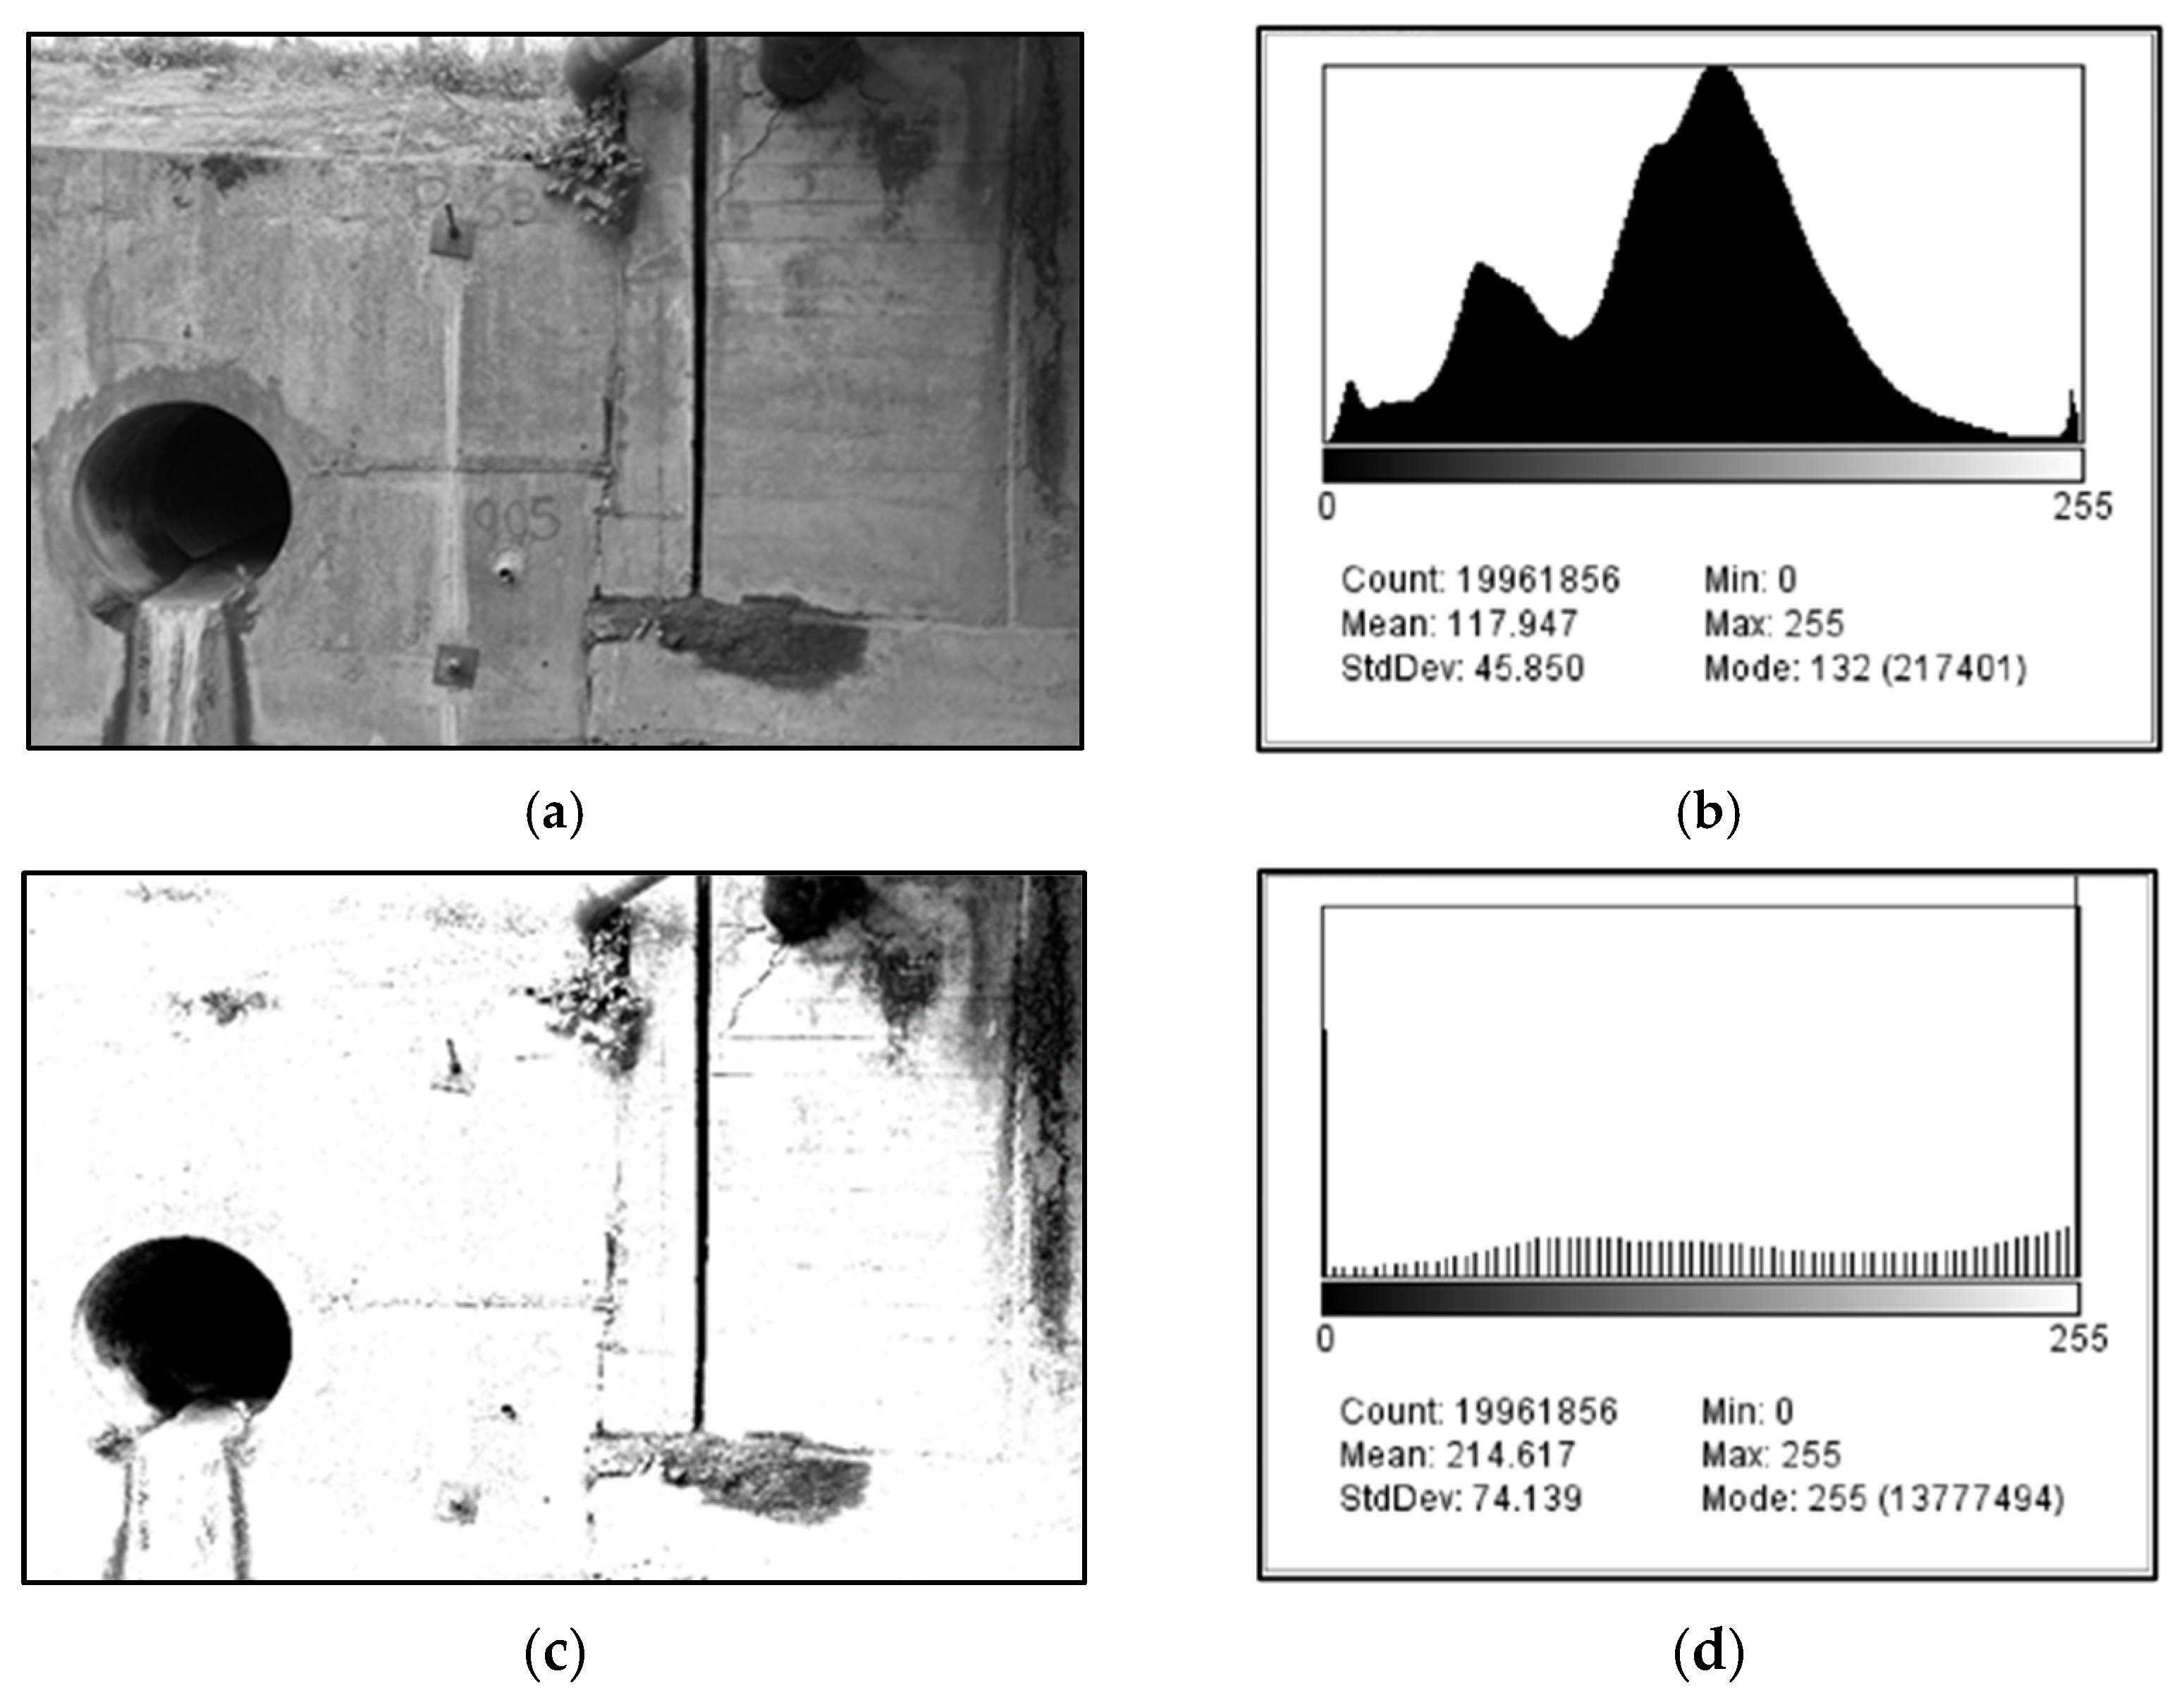
4.1.5. Grayscale Application
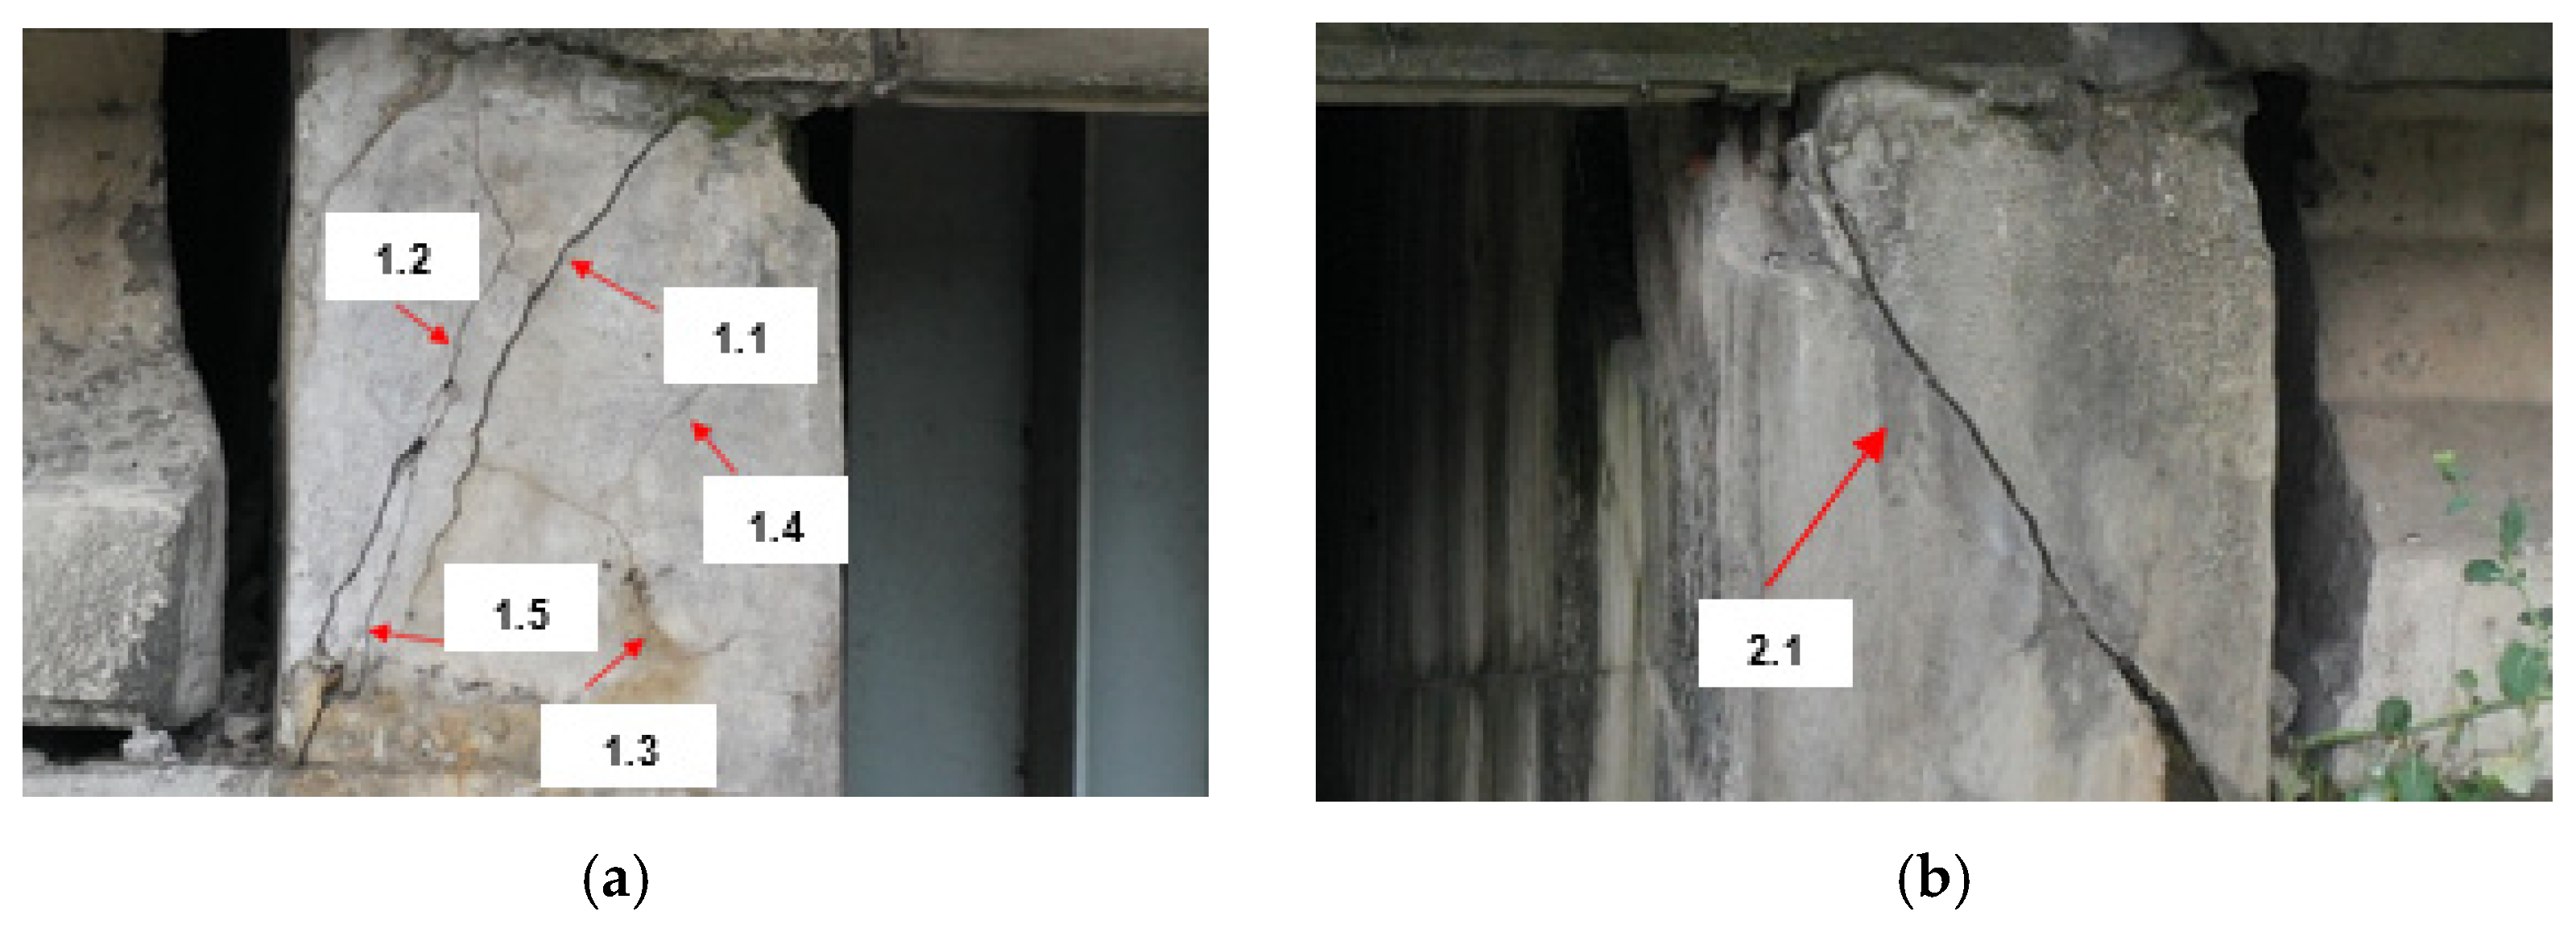
4.1.6. Application of Edge Detection Tool and Damage Description
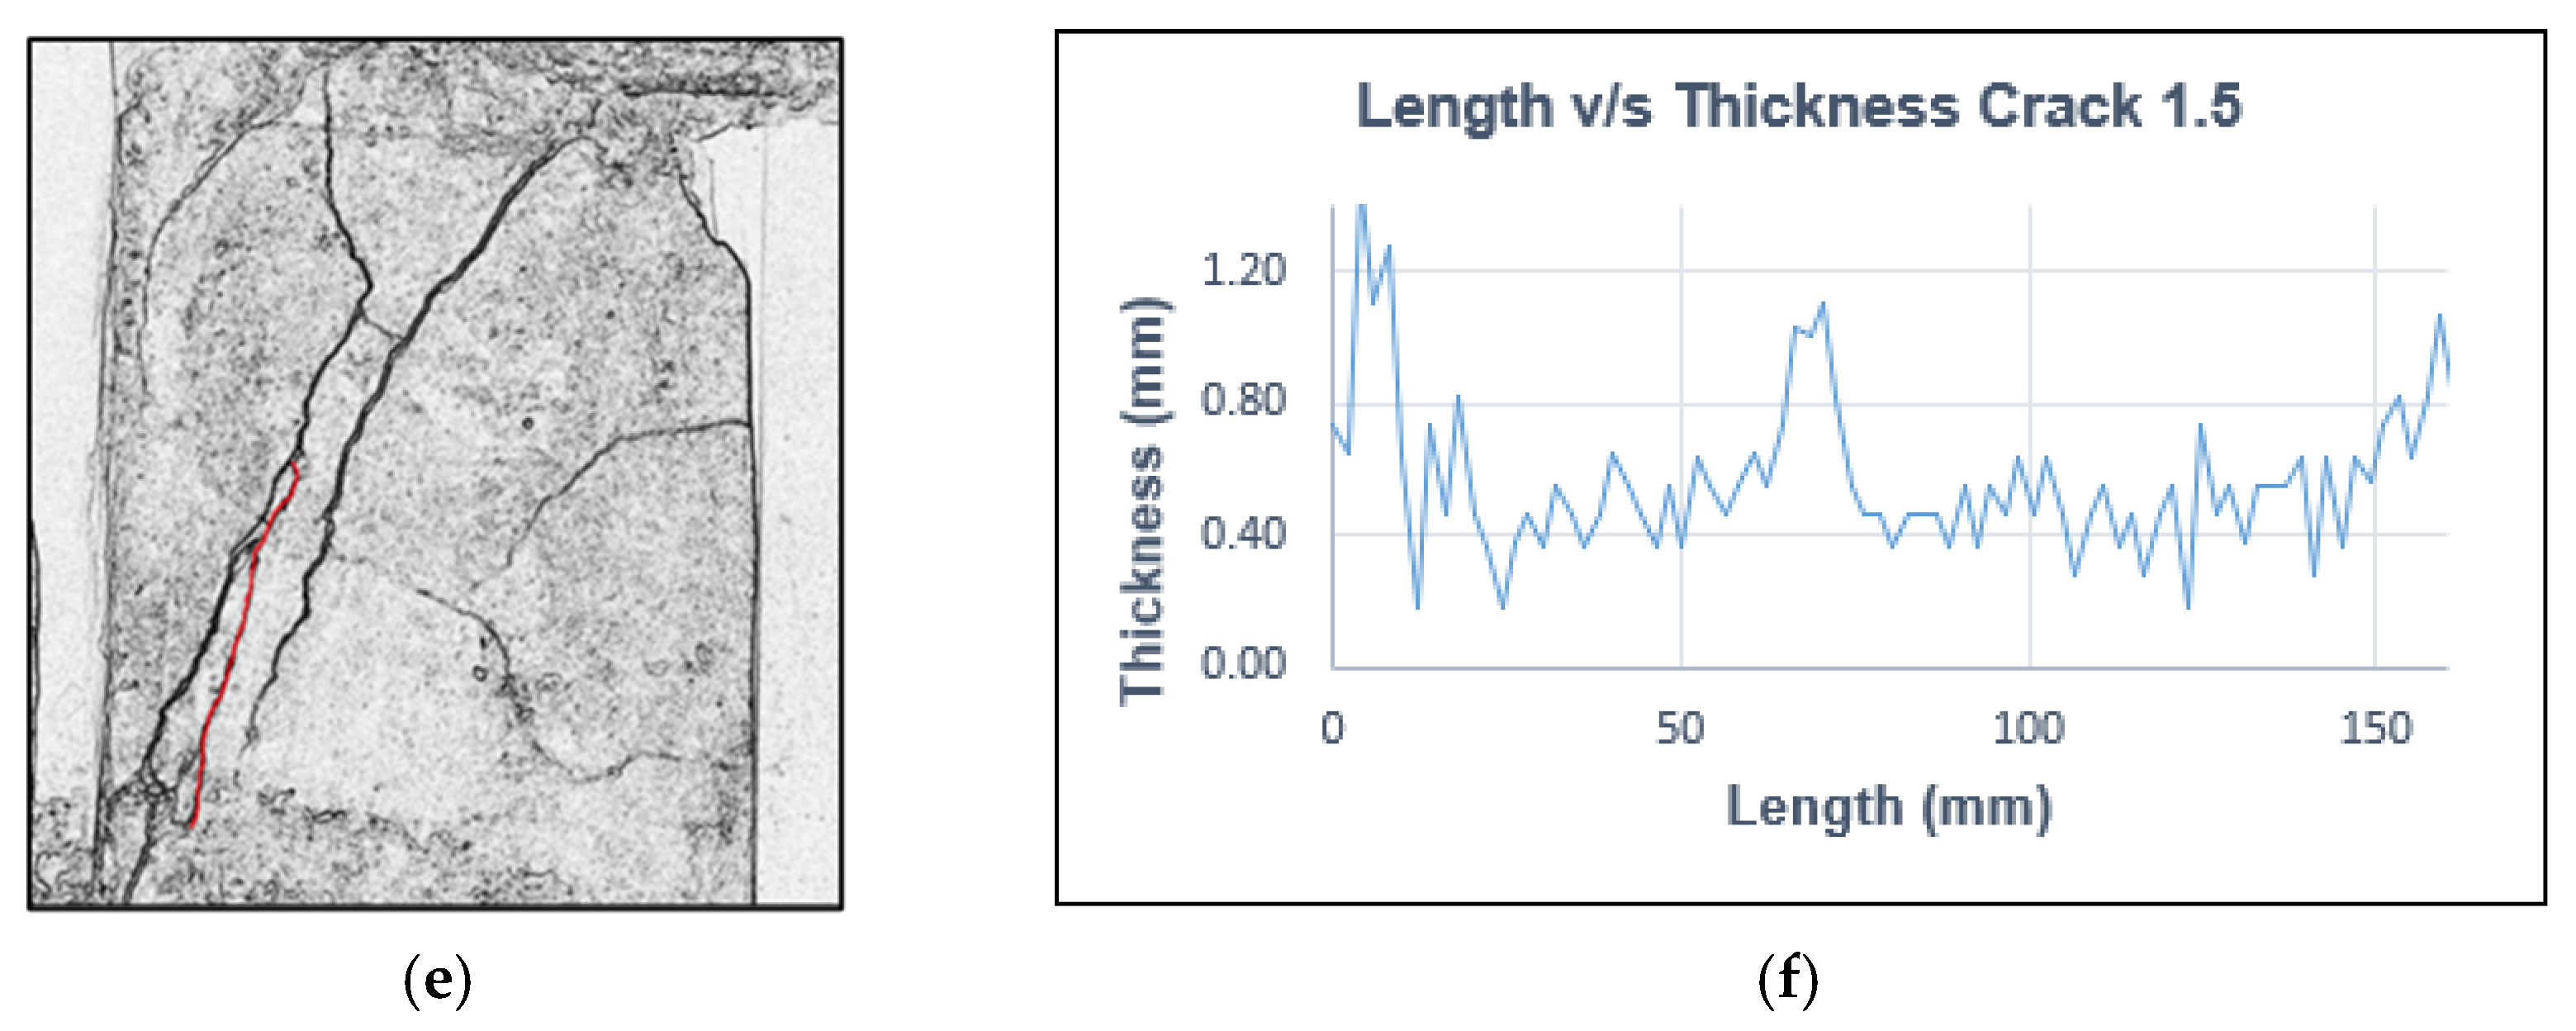
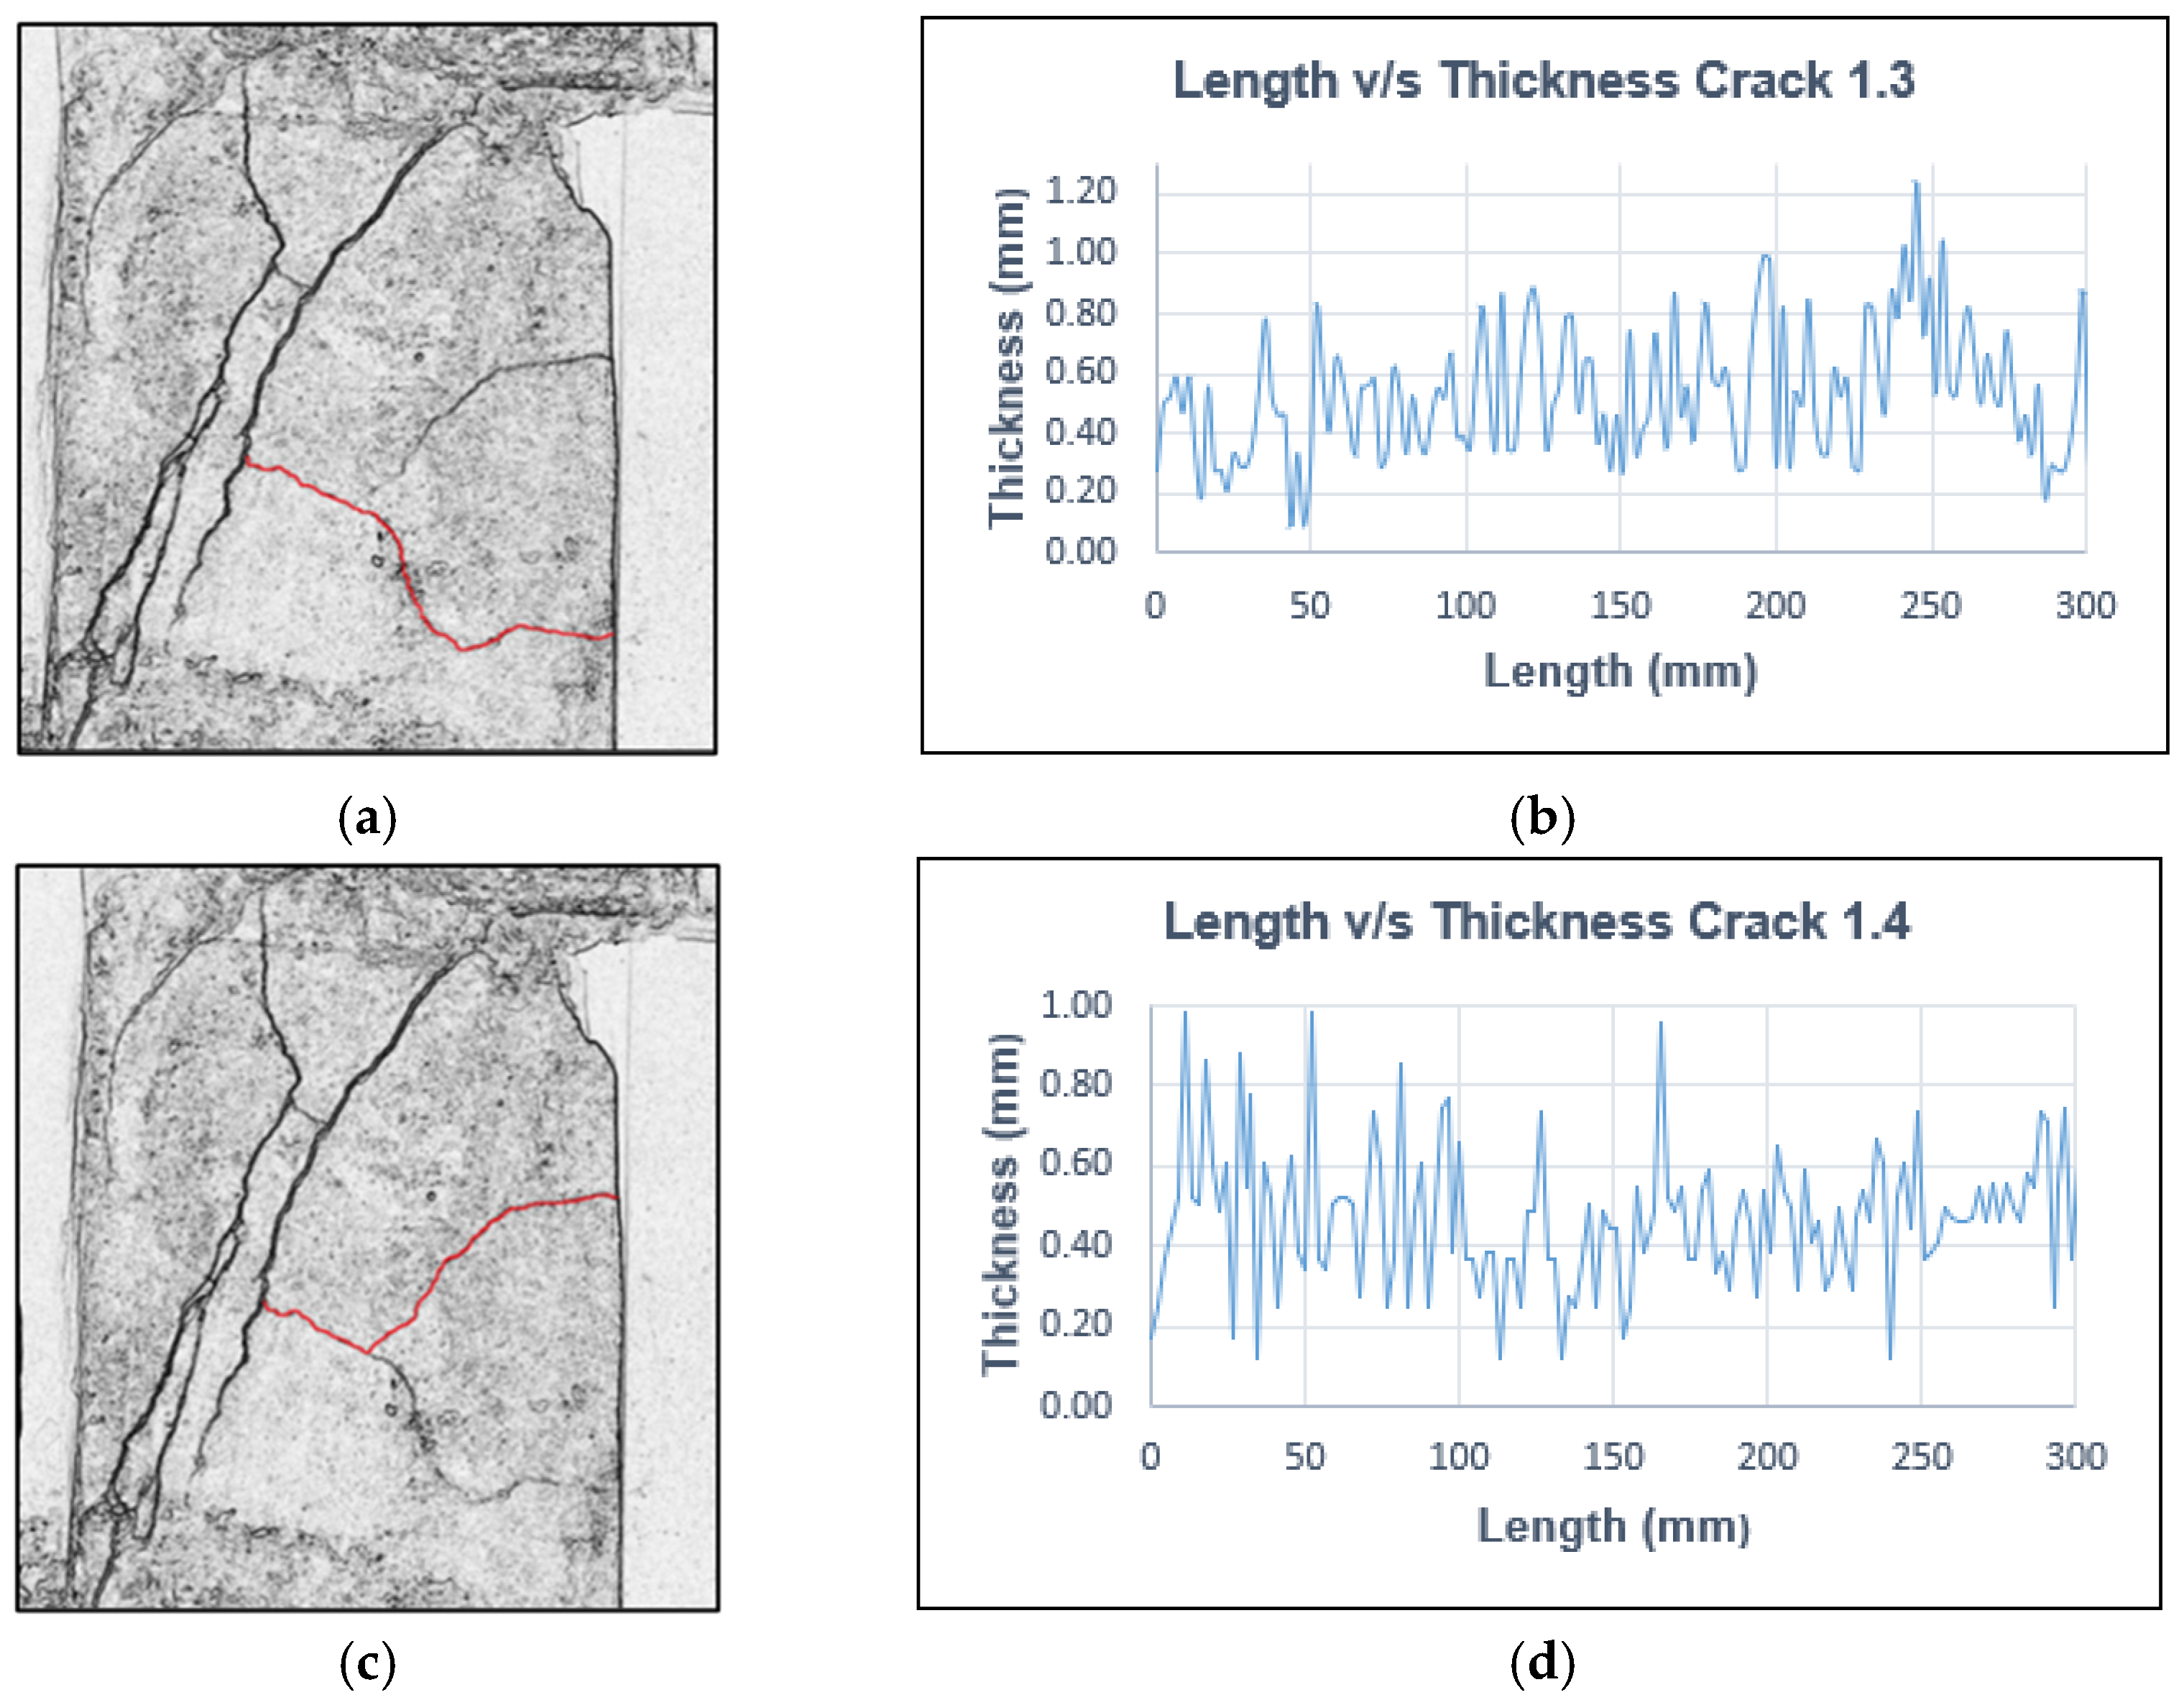
4.1.7. Length vs. Thickness Graph
4.2. Case 2: Llacolén Bridge (Large Bridge)
4.2.1. General Description
4.2.2. Flight Route
4.2.3. Photographic Record and Image Selection
4.2.4. Crack Numbering and Image Calibration
4.2.5. Grayscale Application
4.2.6. Application of Edge Detection Tool and Damage Description
4.2.7. Length vs. Thickness Graph
4.3. Validation of the Procedure Developed
5. Discussion
6. Conclusions
Author Contributions
Funding
Data Availability Statement
Acknowledgments
Conflicts of Interest
References
- Ruiz Esparza, G.; Callejo Silva, Ó.; Verdugo López, J. Manual Para Conservación de Puentes y Estructuras Similares, 1st ed.; Dirección General de Servicios Técnicos, Ed.; Secretaría de Comunicaciones y Transporte: Ciudad de México, Mexico, 2018. [Google Scholar]
- Feroz, S.; Abu Dabous, S. UAV-Based Remote Sensing Applications for Bridge Condition Assessment. Remote Sens. 2021, 13, 1809. [Google Scholar] [CrossRef]
- Peng, X.; Zhong, X.; Zhao, C.; Chen, A.; Zhang, T. A UAV-based machine vision method for bridge crack recognition and width quantification through hybrid feature learning. Constr. Build. Mater. 2021, 299, 123896. [Google Scholar] [CrossRef]
- Chilean Ministry of Public Works. Volumen N°7—Manual de Carreteras “Mantenimiento Vial”; Chilean Ministry of Public Works: Santiago, Chile, 2022; Volume 7.
- Valença, J.; Dias-da-Costa, D.; Júlio, E.; Araújo, H.; Costa, H. Automatic crack monitoring using photogrammetry and image processing. Measurement 2013, 46, 433–441. [Google Scholar] [CrossRef]
- Légeron, F.; Paultre, P.; Mazars, J. Damage Mechanics Modeling of Nonlinear Seismic Behavior of Concrete Structures. J. Struct. Eng. 2005, 131, 946–955. [Google Scholar] [CrossRef]
- Jeong, E.; Seo, J.; Wacker, J. Grayscale Drone Inspection Image Enhancement Framework for Advanced Bridge Defect Measurement. Transp. Res. Rec. J. Transp. Res. Board 2021, 2675, 603–612. [Google Scholar] [CrossRef]
- Forcael, E.; Ferrari, I.; Opazo-Vega, A.; Pulido-Arcas, J.A. Construction 4.0: A Literature Review. Sustainability 2020, 12, 9755. [Google Scholar] [CrossRef]
- Lattanzi, D.; Miller, G. Review of Robotic Infrastructure Inspection Systems. J. Infrastruct. Syst. 2017, 23, 1–16. [Google Scholar] [CrossRef]
- Kim, S.; Irizarry, J.; Costa, D.B. Field Test-Based UAS Operational Procedures and Considerations for Construction Safety Management: A Qualitative Exploratory Study. Int. J. Civ. Eng. 2020, 18, 919–933. [Google Scholar] [CrossRef]
- Ferreira, T.; Rasband, W. The ImageJ User Guide, 1st ed.; U.S. National Institutes of Health: Bethesda, MA, USA, 2012.
- Toirac Corral, J. Patología de la construcción: Grietas y fisuras en obras de hormigón; origen y prevención. Cienc. Soc. 2004, 29, 72–114. [Google Scholar] [CrossRef]
- Jeong, E.; Seo, J.; Wacker, J. Literature Review and Technical Survey on Bridge Inspection Using Unmanned Aerial Vehicles. J. Perform. Constr. Facil. 2020, 34, 04020113. [Google Scholar] [CrossRef]
- Seo, J.; Wacker, J.P.; Duque, L. Evaluating the Use of Drones for Timber Bridge Inspection; U.S. Department of Agriculture, Forest Service, Forest Products Laboratory: Madison, WI, USA, 2018.
- Ng, R.; Levoy, M.; Brédif, M.; Duval, G.; Horowitz, M.; Hanrahan, P. Light Field Photography with a Hand-Held Plenoptic Camera; Stanford Computer Graphics Laboratory: Palo Alto, CA, USA, 2005. [Google Scholar]
- Pereira, J. Digital Heritage. Available online: http://www.jpereira.net/gestion-de-color-articulos/mediciones-y-asignacion-de-escala-en-fotografias (accessed on 1 October 2023).
- Vincent, O.; Folorunso, O. A Descriptive Algorithm for Sobel Image Edge Detection. In Proceedings of the Informing Science & IT Education Conference (InSITE), Macon, CA, USA, 12–15 June 2009; Volume 40, pp. 97–107. [Google Scholar]
- Parker, J.R. Algorithms for Image Processing and Computer Vision, 2nd ed.; Wiley: Indianapolis, IN, USA, 2010; ISBN 978-0-470-64385-3. [Google Scholar]
- Kheradmand, A.; Milanfar, P. A General Framework for Regularized, Similarity-Based Image Restoration. IEEE Trans. Image Process. 2014, 23, 5136–5151. [Google Scholar] [CrossRef] [PubMed]
- Rashmi; Kumar, M.; Saxena, R. Algorithm and Technique on Various Edge Detection: A Survey. Signal Image Process. Int. J. 2013, 4, 65–75. [Google Scholar] [CrossRef]
- Lei, B.; Wang, N.; Xu, P.; Song, G. New Crack Detection Method for Bridge Inspection Using UAV Incorporating Image Processing. J. Aerosp. Eng. 2018, 31, 1–13. [Google Scholar] [CrossRef]
- Sarkar, K.; Shiuly, A.; Dhal, K.G. Revolutionizing concrete analysis: An in-depth survey of AI-powered insights with image-centric approaches on comprehensive quality control, advanced crack detection and concrete property exploration. Constr. Build. Mater. 2024, 411, 134212. [Google Scholar] [CrossRef]
- Basalamah, A. An Interactive Tool for Teaching the Central Limit Theorem to Engineering Students. Int. J. Adv. Comput. Sci. Appl. 2021, 12, 813–817. [Google Scholar] [CrossRef]
- Shapiro, S.S.; Wilk, M.B. An Analysis of Variance Test for Normality (Complete Samples). Biometrika 1965, 52, 591–611. [Google Scholar] [CrossRef]
- Khatun, N. Applications of Normality Test in Statistical Analysis. Open J. Stat. 2021, 11, 113–122. [Google Scholar] [CrossRef]
- Sultan, A.A.; Mashrei, M.A.; Washer, G.A. Utilization of Wilcoxon-Mann-Whitney statistics in assessing the reliability of nondestructive evaluation technologies. Structures 2020, 27, 780–787. [Google Scholar] [CrossRef]


| Fissures (<5 mm) and Cracks (>5 mm)—Do They Affect Structural Behavior? | |||
|---|---|---|---|
| Yes | Range | No | Range |
| At 45° in the web of beams or slabs, next to supports, or due to stresses (compression, bending, or shear) | <0.7 mm | Due to the settlement of the side wall of an abutment | >0.7 mm |
| Due to incorrect dimensioning of the element | >0.7 mm | Due to a lack of coating | <0.7 mm |
| Due to the pushing of one element on another | >0.7 mm | Due to hydraulic shrinkage | <0.7 mm |
| N° | Location (Element) | Length (cm) | Maximum Thickness (mm) | Average Thickness (mm) | Damage | Does It Affect Structurally? | Possible Cause | Estimated Severity |
|---|---|---|---|---|---|---|---|---|
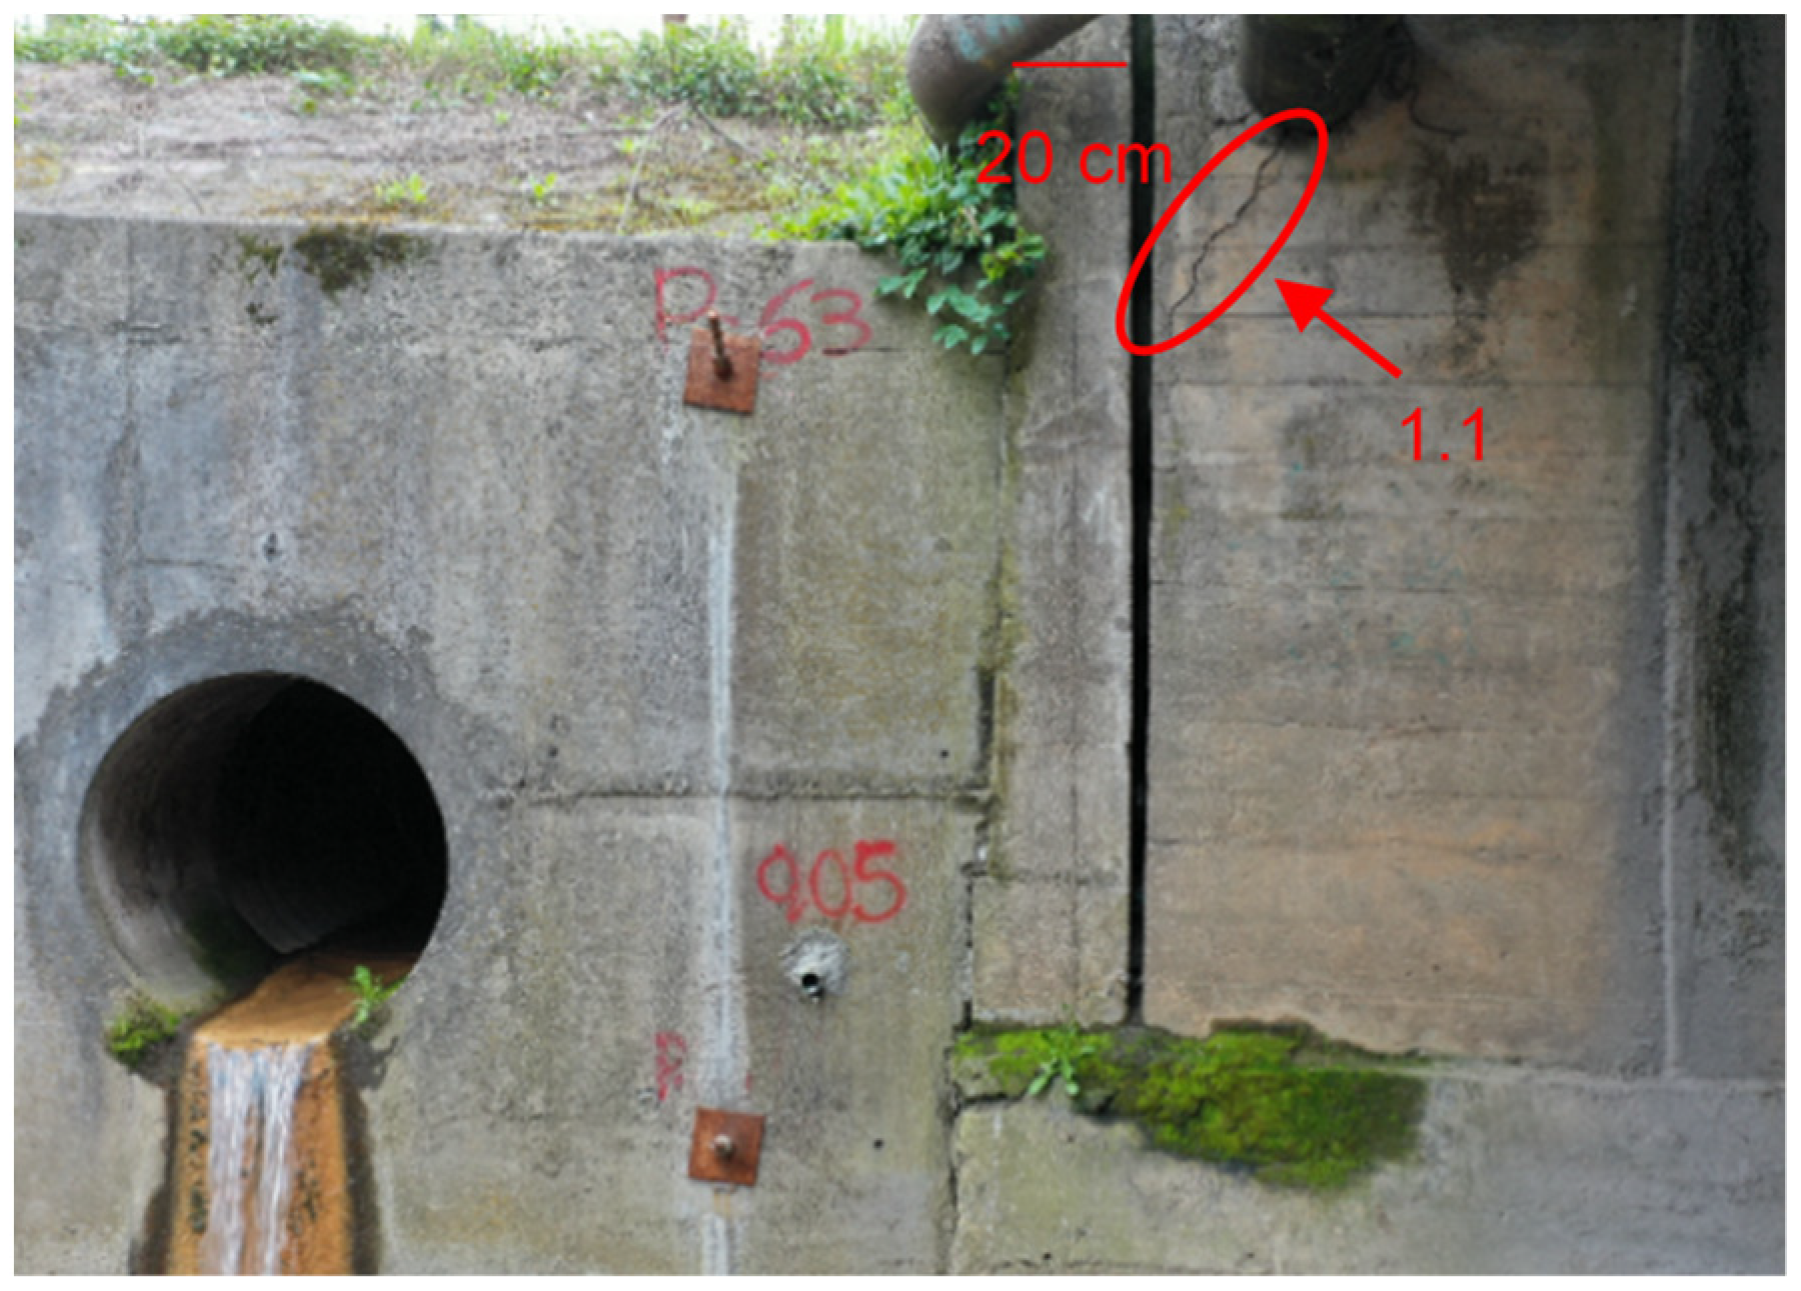
| 1.1 | Abutment 1 | 54.04 | 6.401 | 7.79 | Crack | Yes | Shear stress | Low |
| N° | Location (Element) | Length (cm) | Maximum Thickness (mm) | Average Thickness (mm) | Damage | Does It Affect Structurally? | Possible Cause | Estimated Severity |
|---|---|---|---|---|---|---|---|---|
| 1.1 | Header pier 1 East Sector | 42.49 | 3.67 | 1.69 | Fissure | Yes | Shear stress | High |
| 1.2 | Header pier 1 East Sector | 53.23 | 4.28 | 0.89 | Fissure | Yes | Shear stress | High |
| 1.3 | Header pier 1 East Sector | 31.72 | 1.23 | 0.53 | Fissure | Yes | Shear stress | High |
| 1.4 | Header pier 1 East Sector | 30.11 | 0.99 | 0.47 | Fissure | Yes | Shear stress | High |
| 1.5 | Header pier 1 East Sector | 16.92 | 1.48 | 0.59 | Fissure | Yes | Shear stress | High |
| 2.1 | Header pier 1 West Sector | 52.3 | 4.1 | 1.7 | Fissure | Yes | Shear stress | High |
| Crack | Thickness (mm) | Difference (Theoretical– Actual) | Length (mm) | Difference (Theoretical–Actual) | ||
|---|---|---|---|---|---|---|
| Theoretical | Actual | Theoretical | Actual | |||
| 1 | 3.053 | 3 | 0.053 | 331.032 | 330 | 1.032 |
| 2 | 1.973 | 2 | −0.027 | 189.570 | 190 | −0.430 |
| 3 | 2.993 | 3 | −0.007 | 917.560 | 920 | −2.440 |
| 4 | 1.949 | 2 | −0.051 | 326.640 | 330 | −3.360 |
| 5 | 1.017 | 1 | 0.017 | 201.318 | 200 | 1.318 |
| 6 | 1.984 | 2 | −0.016 | 79.300 | 80 | −0.700 |
| 7 | 3.139 | 3 | 0.139 | 940.600 | 920 | 20.600 |
| 8 | 2.015 | 2 | 0.015 | 758.000 | 730 | 28.400 |
| 9 | 2.982 | 3 | −0.018 | 562.000 | 558 | 4.000 |
| 10 | 3.067 | 3 | 0.067 | 737.000 | 740 | −3.000 |
| 11 | 3.984 | 4 | −0.016 | 300.180 | 300 | 0.180 |
| 12 | 2.951 | 3 | −0.049 | 232.340 | 230 | 2.340 |
| 13 | 3.892 | 4 | −0.108 | 230.190 | 230 | 0.190 |
| 14 | 1.963 | 2 | −0.037 | 277.900 | 280 | −2.100 |
| 15 | 0.984 | 1 | −0.016 | 448.500 | 450 | −1.500 |
| 16 | 2.906 | 3 | −0.094 | 121.500 | 120 | 1.500 |
| 17 | 1.033 | 1 | 0.033 | 360.700 | 360 | 0.700 |
| 18 | 2.012 | 2 | 0.012 | 995.700 | 1000 | −4.300 |
| 19 | 0.984 | 1 | −0.016 | 475.600 | 475 | 0.600 |
| 20 | 2.054 | 2 | 0.054 | 1211.800 | 1210 | 1.800 |
| 21 | 0.986 | 1 | −0.014 | 453.900 | 450 | 3.900 |
| 22 | 1.033 | 1 | 0.033 | 145.600 | 145 | 0.600 |
| 23 | 4.911 | 5 | −0.089 | 604.770 | 604 | 0.770 |
| 24 | 4.994 | 5 | −0.006 | 711.220 | 711 | 0.220 |
| 25 | 4.872 | 5 | −0.128 | 525.120 | 525 | 0.120 |
| 26 | 10.29 | 10 | 0.290 | 362.260 | 360 | 2.260 |
| 27 | 9.760 | 10 | −0.240 | 2796.640 | 2800 | −3.360 |
| 28 | 4.959 | 5 | −0.041 | 1899.680 | 2000 | −100.320 |
| 29 | 4.910 | 5 | −0.090 | 233.980 | 240 | −6.020 |
| 30 | 4.094 | 4 | 0.094 | 484.290 | 485 | −0.710 |
| Sample | Size (n) | Significance (α) | p-Values | Result |
|---|---|---|---|---|
| Thickness | 30 | 0.05 | 0.355 | Not possible to reject Ho |
| Length | 30 | 0.05 | 0.861 | Not possible to reject Ho |
| Advantages | Disadvantages |
|---|---|
| It prevents the worker from having to expose himself to dangerous situations. | Regulatory standards limit the use of this equipment. |
| It has a direct reading for sample collection without a human presence on the inspected element. | For greater efficiency of image analysis, inspection tasks should be performed preferably during the day or with sufficient light. |
| A low-cost UAV can establish a precise flight path to access hard-to-reach places instead of using expensive aerial or sea/river platforms or other means of access. | It means a cost for the client due to the need to hire a specialized service or train his employees. |
| Environmentally friendly due to less pollution, avoiding the movement of heavy equipment and workers. | The battery life in low-cost UAVs is limited for inspecting large bridges, so extra batteries would be required, which increases costs. |
| It reduces inspection times on larger structures. | The inspection procedure is dependent on weather conditions, which must be favorable (e.g., low wind speed). |
| It reduces operating costs as no other accessibility methods are required, and a smaller number of workers are required. | The larger the audiovisual material collected, the larger the information to transfer and manage, which demands an appropriate management system. |
Disclaimer/Publisher’s Note: The statements, opinions and data contained in all publications are solely those of the individual author(s) and contributor(s) and not of MDPI and/or the editor(s). MDPI and/or the editor(s) disclaim responsibility for any injury to people or property resulting from any ideas, methods, instructions or products referred to in the content. |
© 2023 by the authors. Licensee MDPI, Basel, Switzerland. This article is an open access article distributed under the terms and conditions of the Creative Commons Attribution (CC BY) license (https://creativecommons.org/licenses/by/4.0/).
Share and Cite
Forcael, E.; Román, O.; Stuardo, H.; Herrera, R.F.; Soto-Muñoz, J. Evaluation of Fissures and Cracks in Bridges by Applying Digital Image Capture Techniques Using an Unmanned Aerial Vehicle. Drones 2024, 8, 8. https://doi.org/10.3390/drones8010008
Forcael E, Román O, Stuardo H, Herrera RF, Soto-Muñoz J. Evaluation of Fissures and Cracks in Bridges by Applying Digital Image Capture Techniques Using an Unmanned Aerial Vehicle. Drones. 2024; 8(1):8. https://doi.org/10.3390/drones8010008
Chicago/Turabian StyleForcael, Eric, Oswal Román, Hayan Stuardo, Rodrigo F. Herrera, and Jaime Soto-Muñoz. 2024. "Evaluation of Fissures and Cracks in Bridges by Applying Digital Image Capture Techniques Using an Unmanned Aerial Vehicle" Drones 8, no. 1: 8. https://doi.org/10.3390/drones8010008
APA StyleForcael, E., Román, O., Stuardo, H., Herrera, R. F., & Soto-Muñoz, J. (2024). Evaluation of Fissures and Cracks in Bridges by Applying Digital Image Capture Techniques Using an Unmanned Aerial Vehicle. Drones, 8(1), 8. https://doi.org/10.3390/drones8010008