
Research on the Distributed Propeller Slipstream Effect of UAV Wing Based on the Actuator Disk Method


Abstract
:1. Introduction
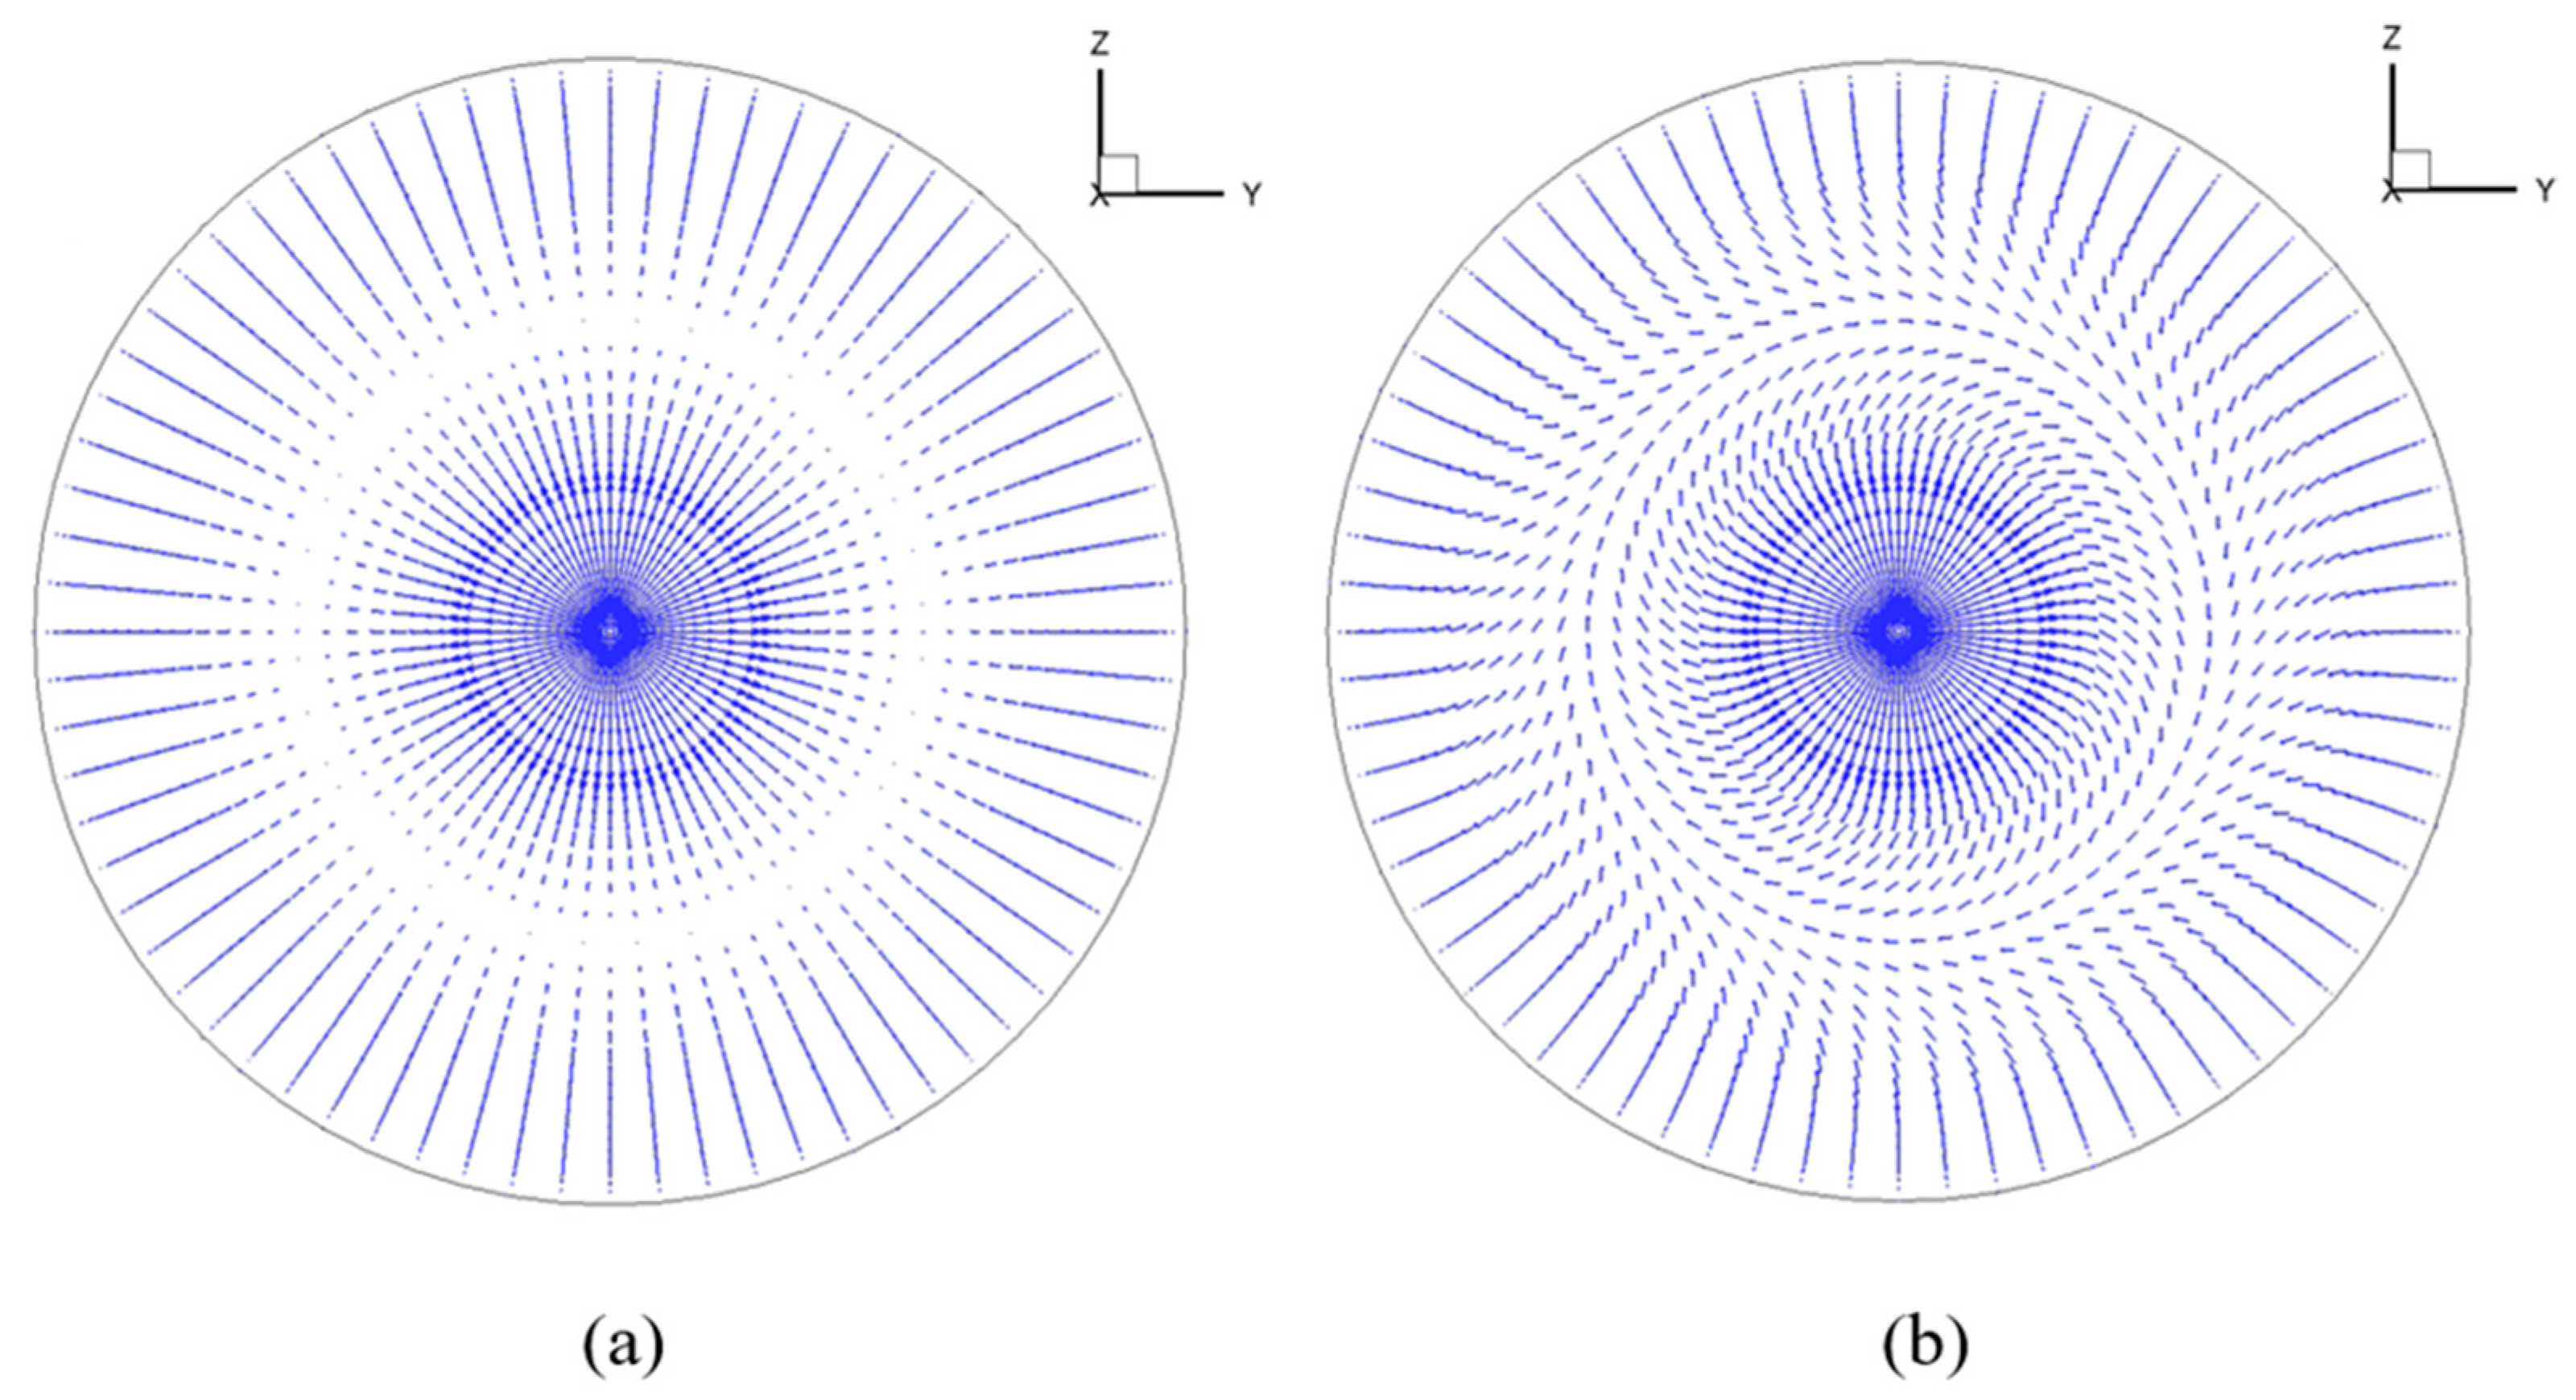
2. Actuator Disk Model
3. Analysis of Factors Affecting Slipstream Characteristics
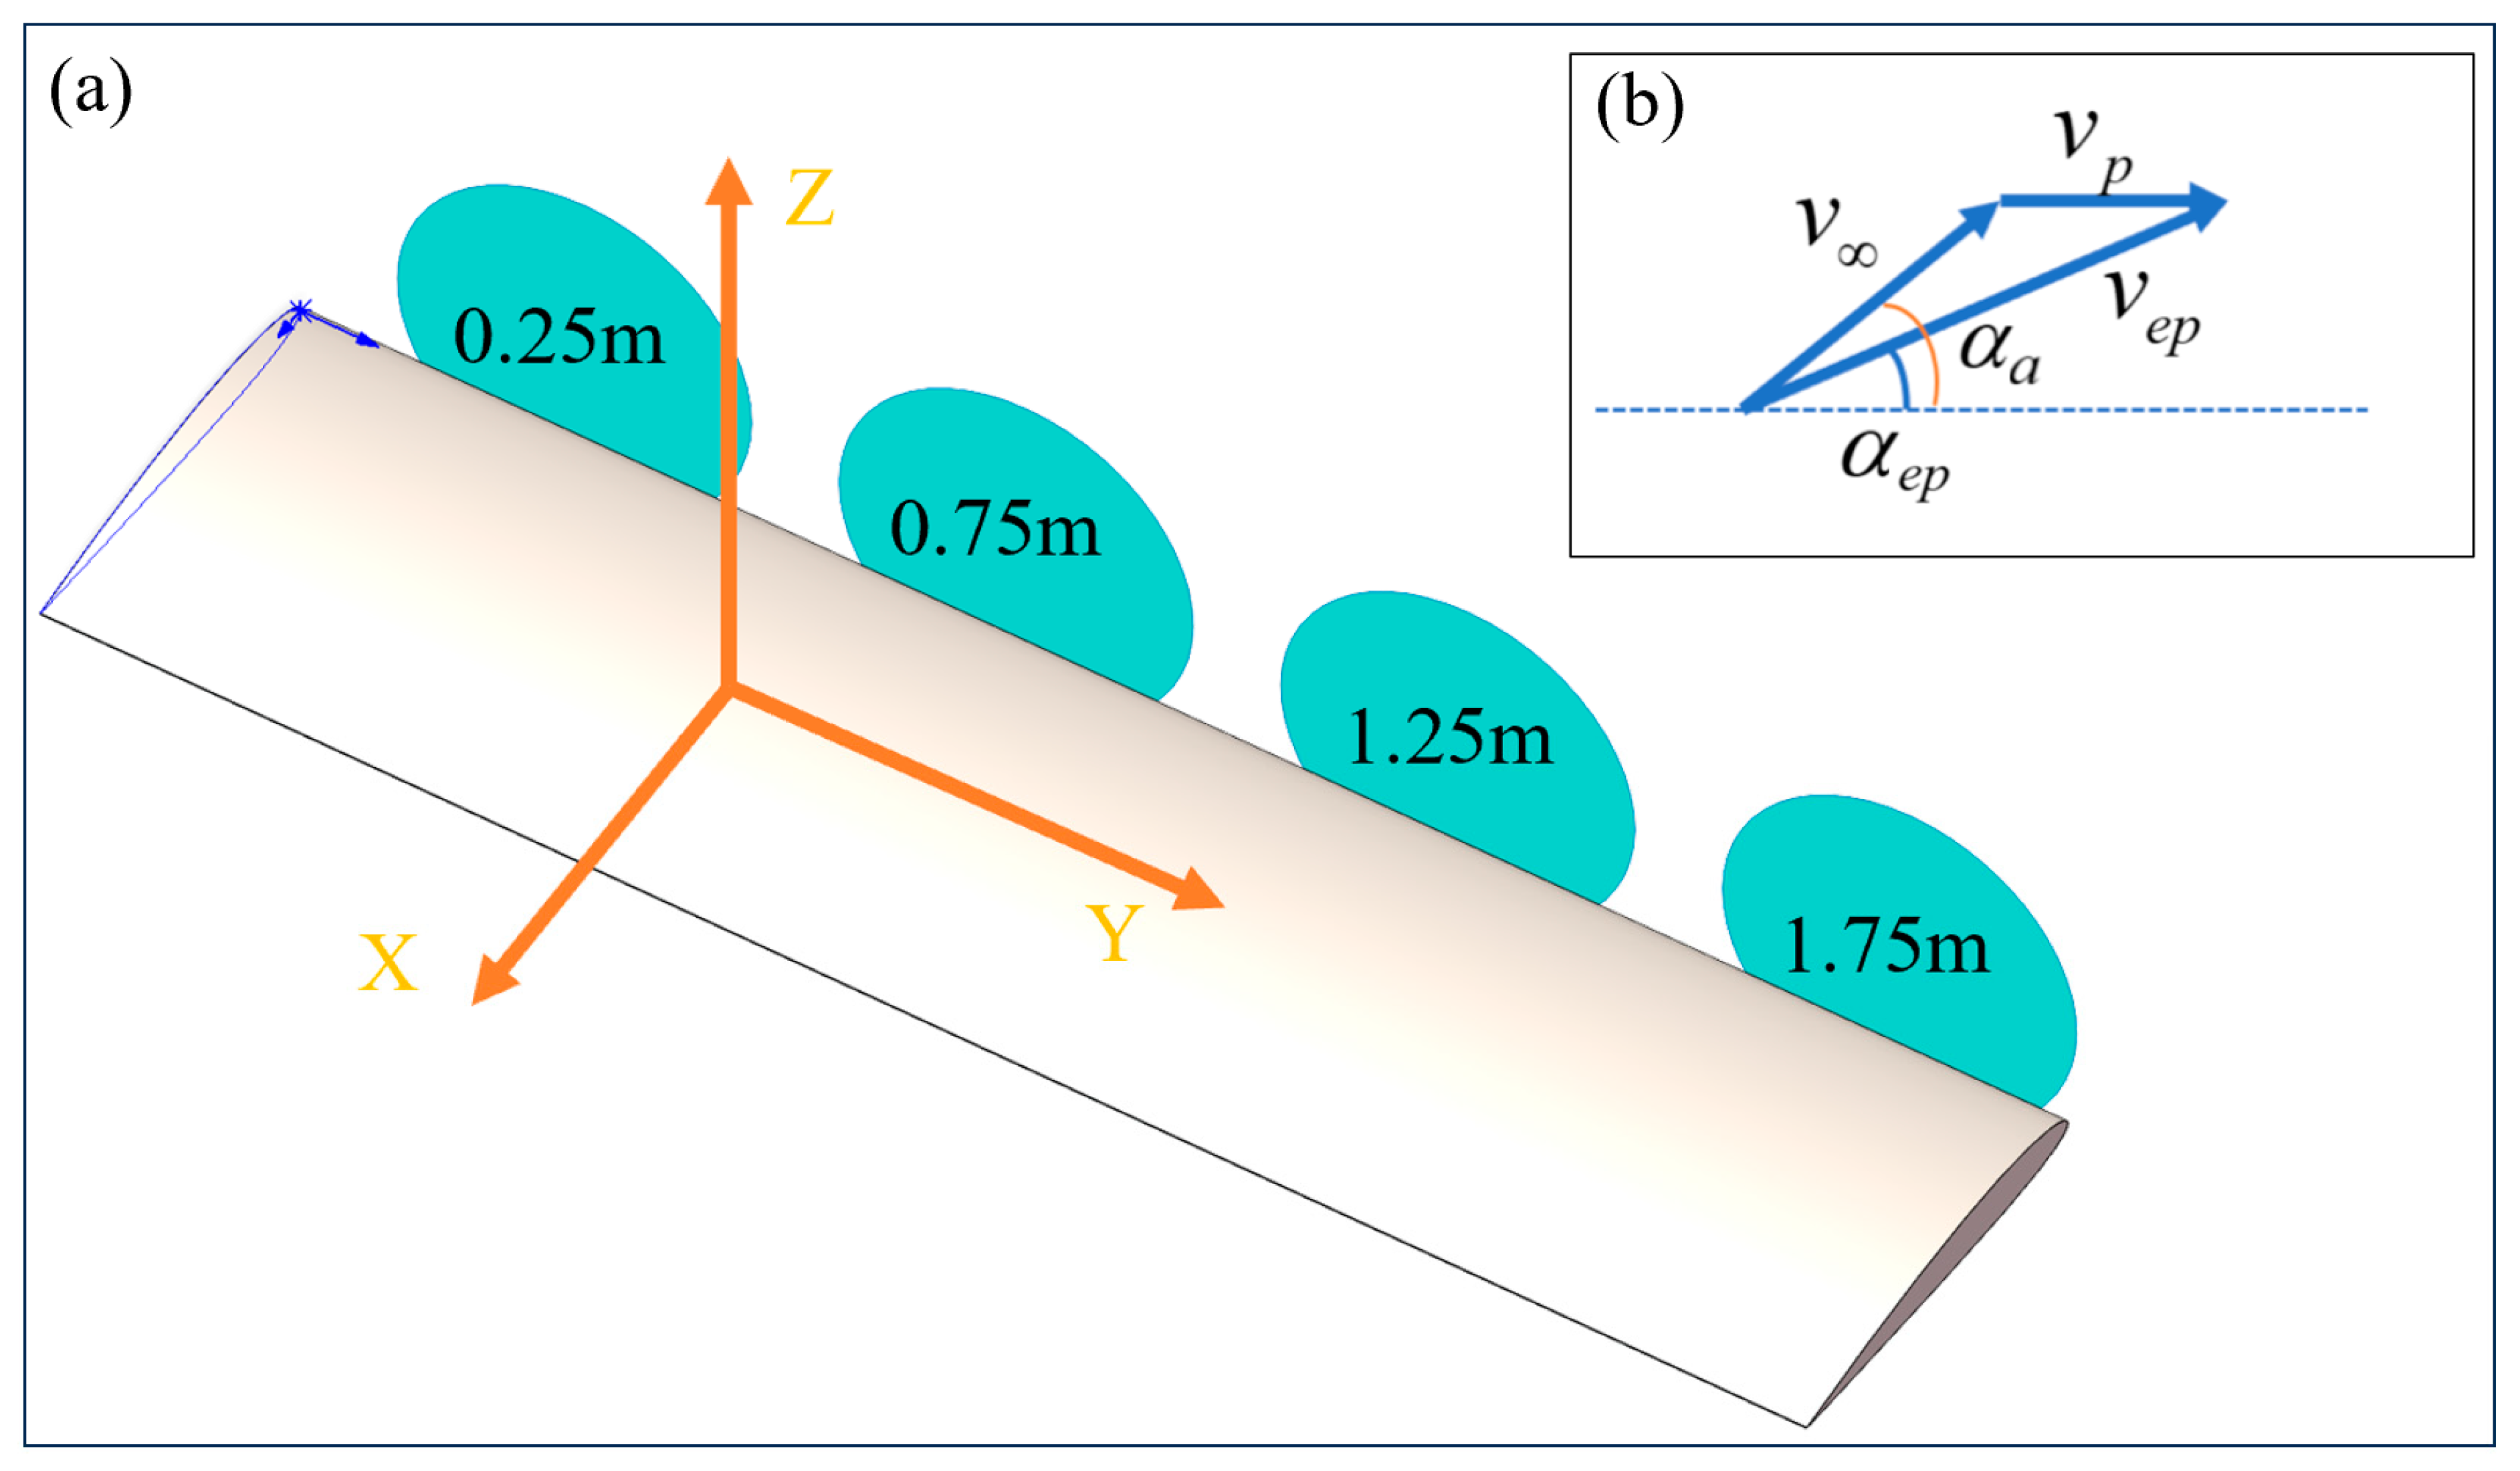
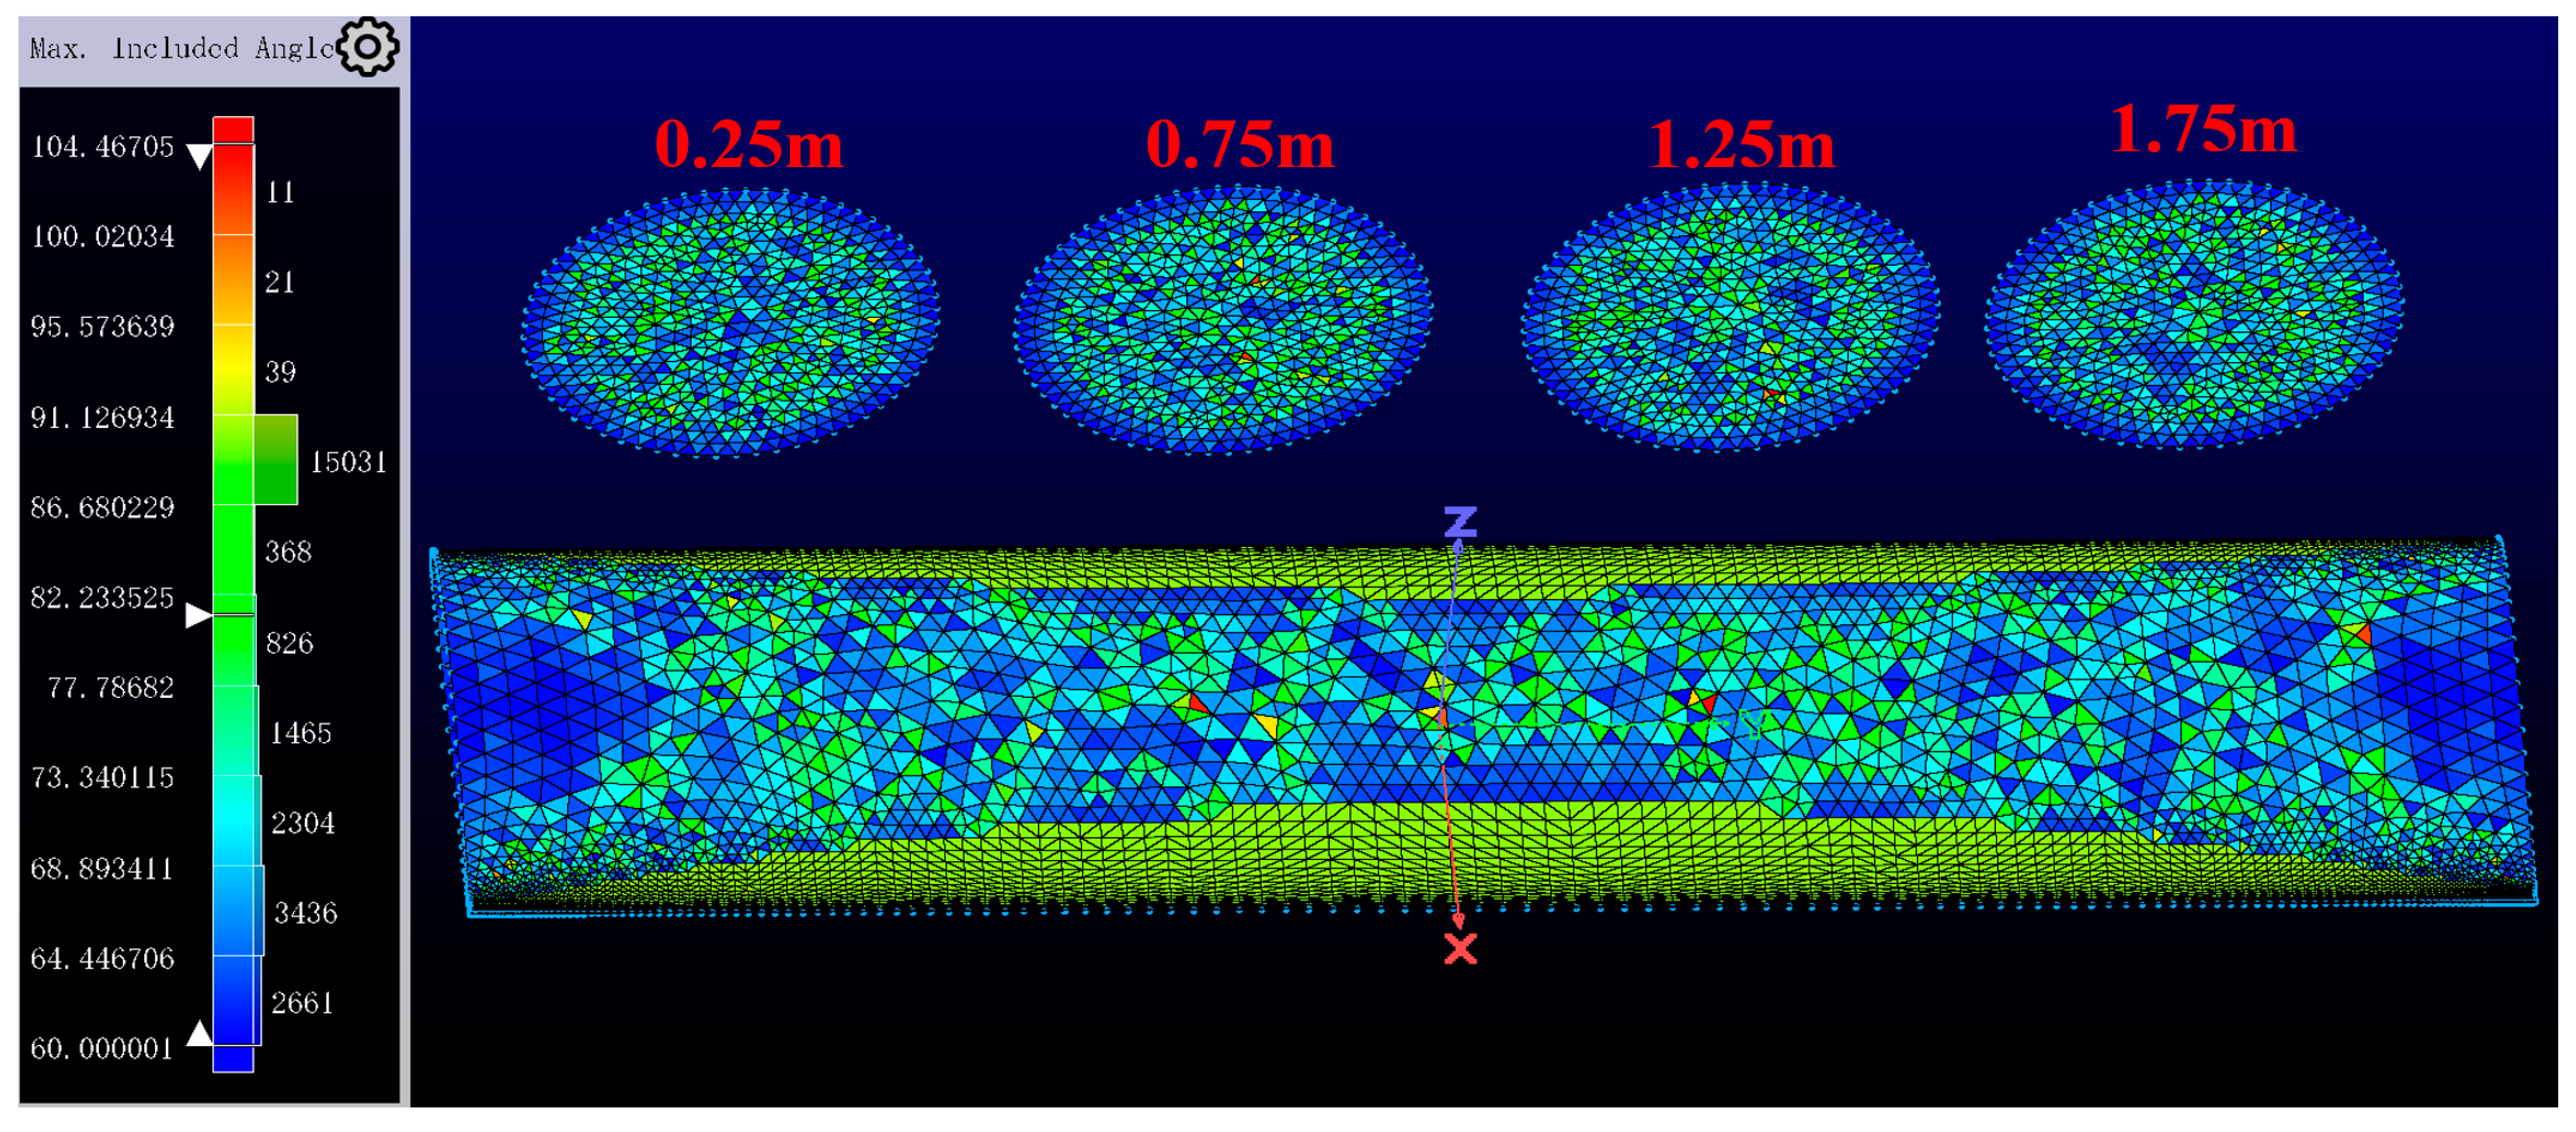
3.1. Introduction of the Propeller + Wing Model
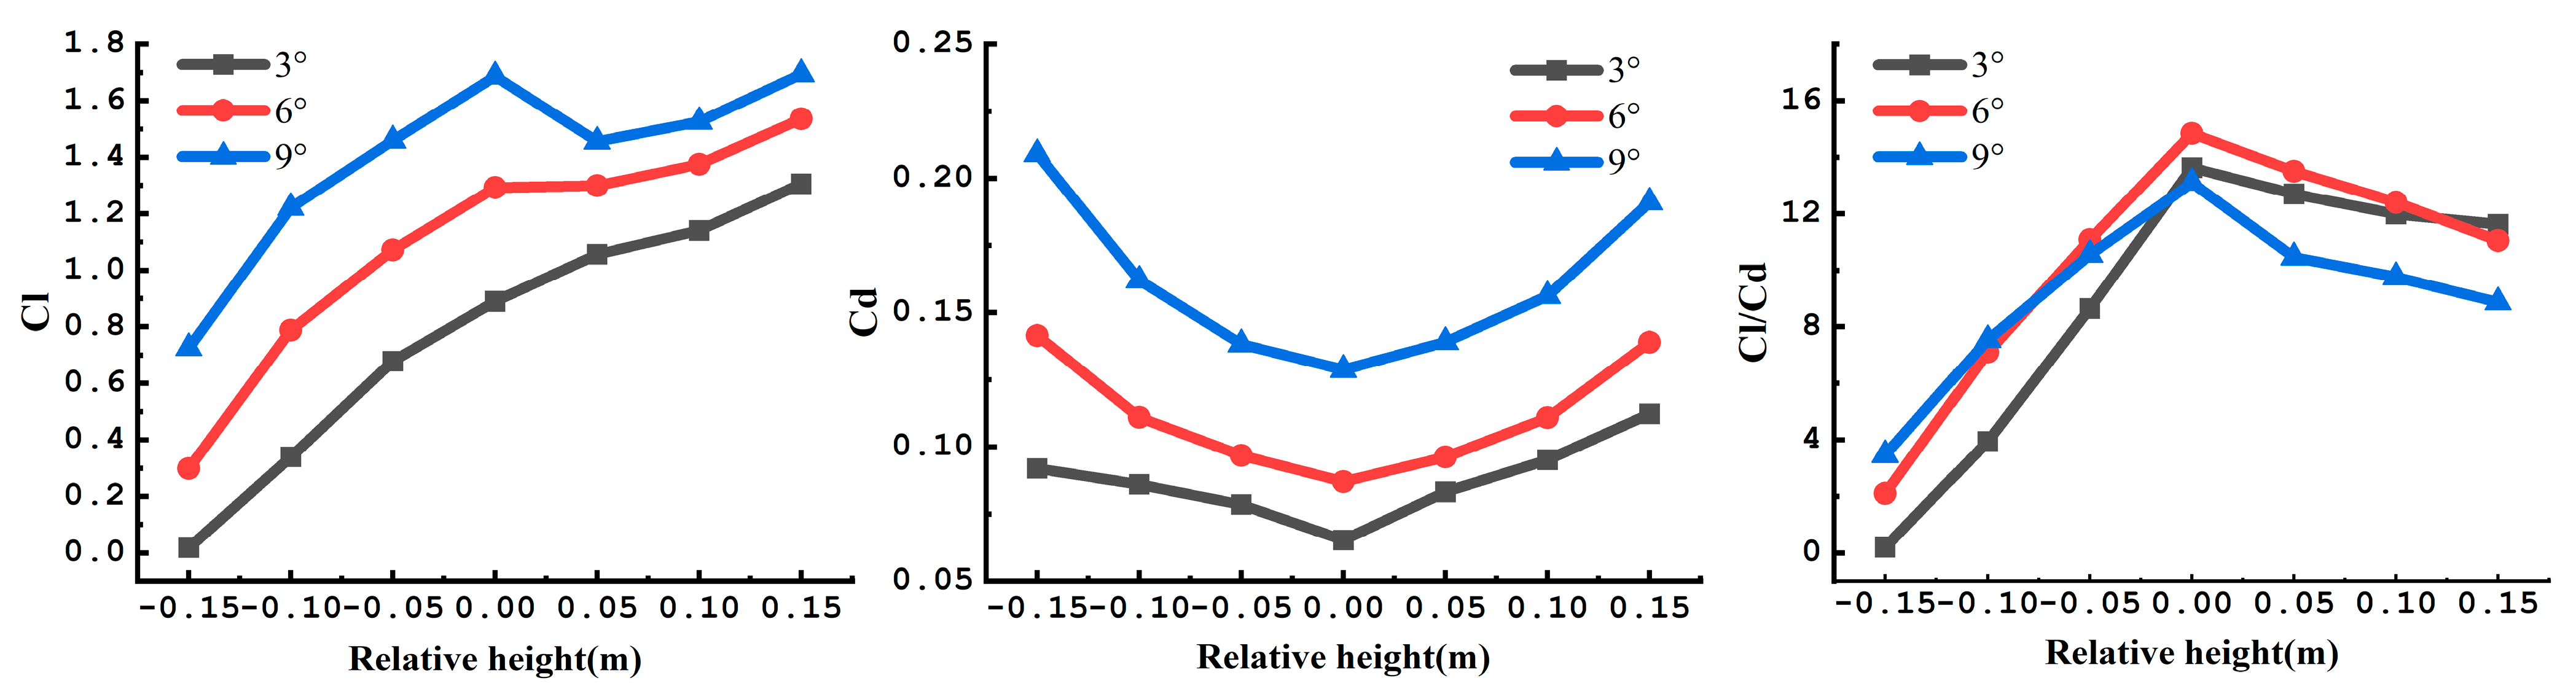
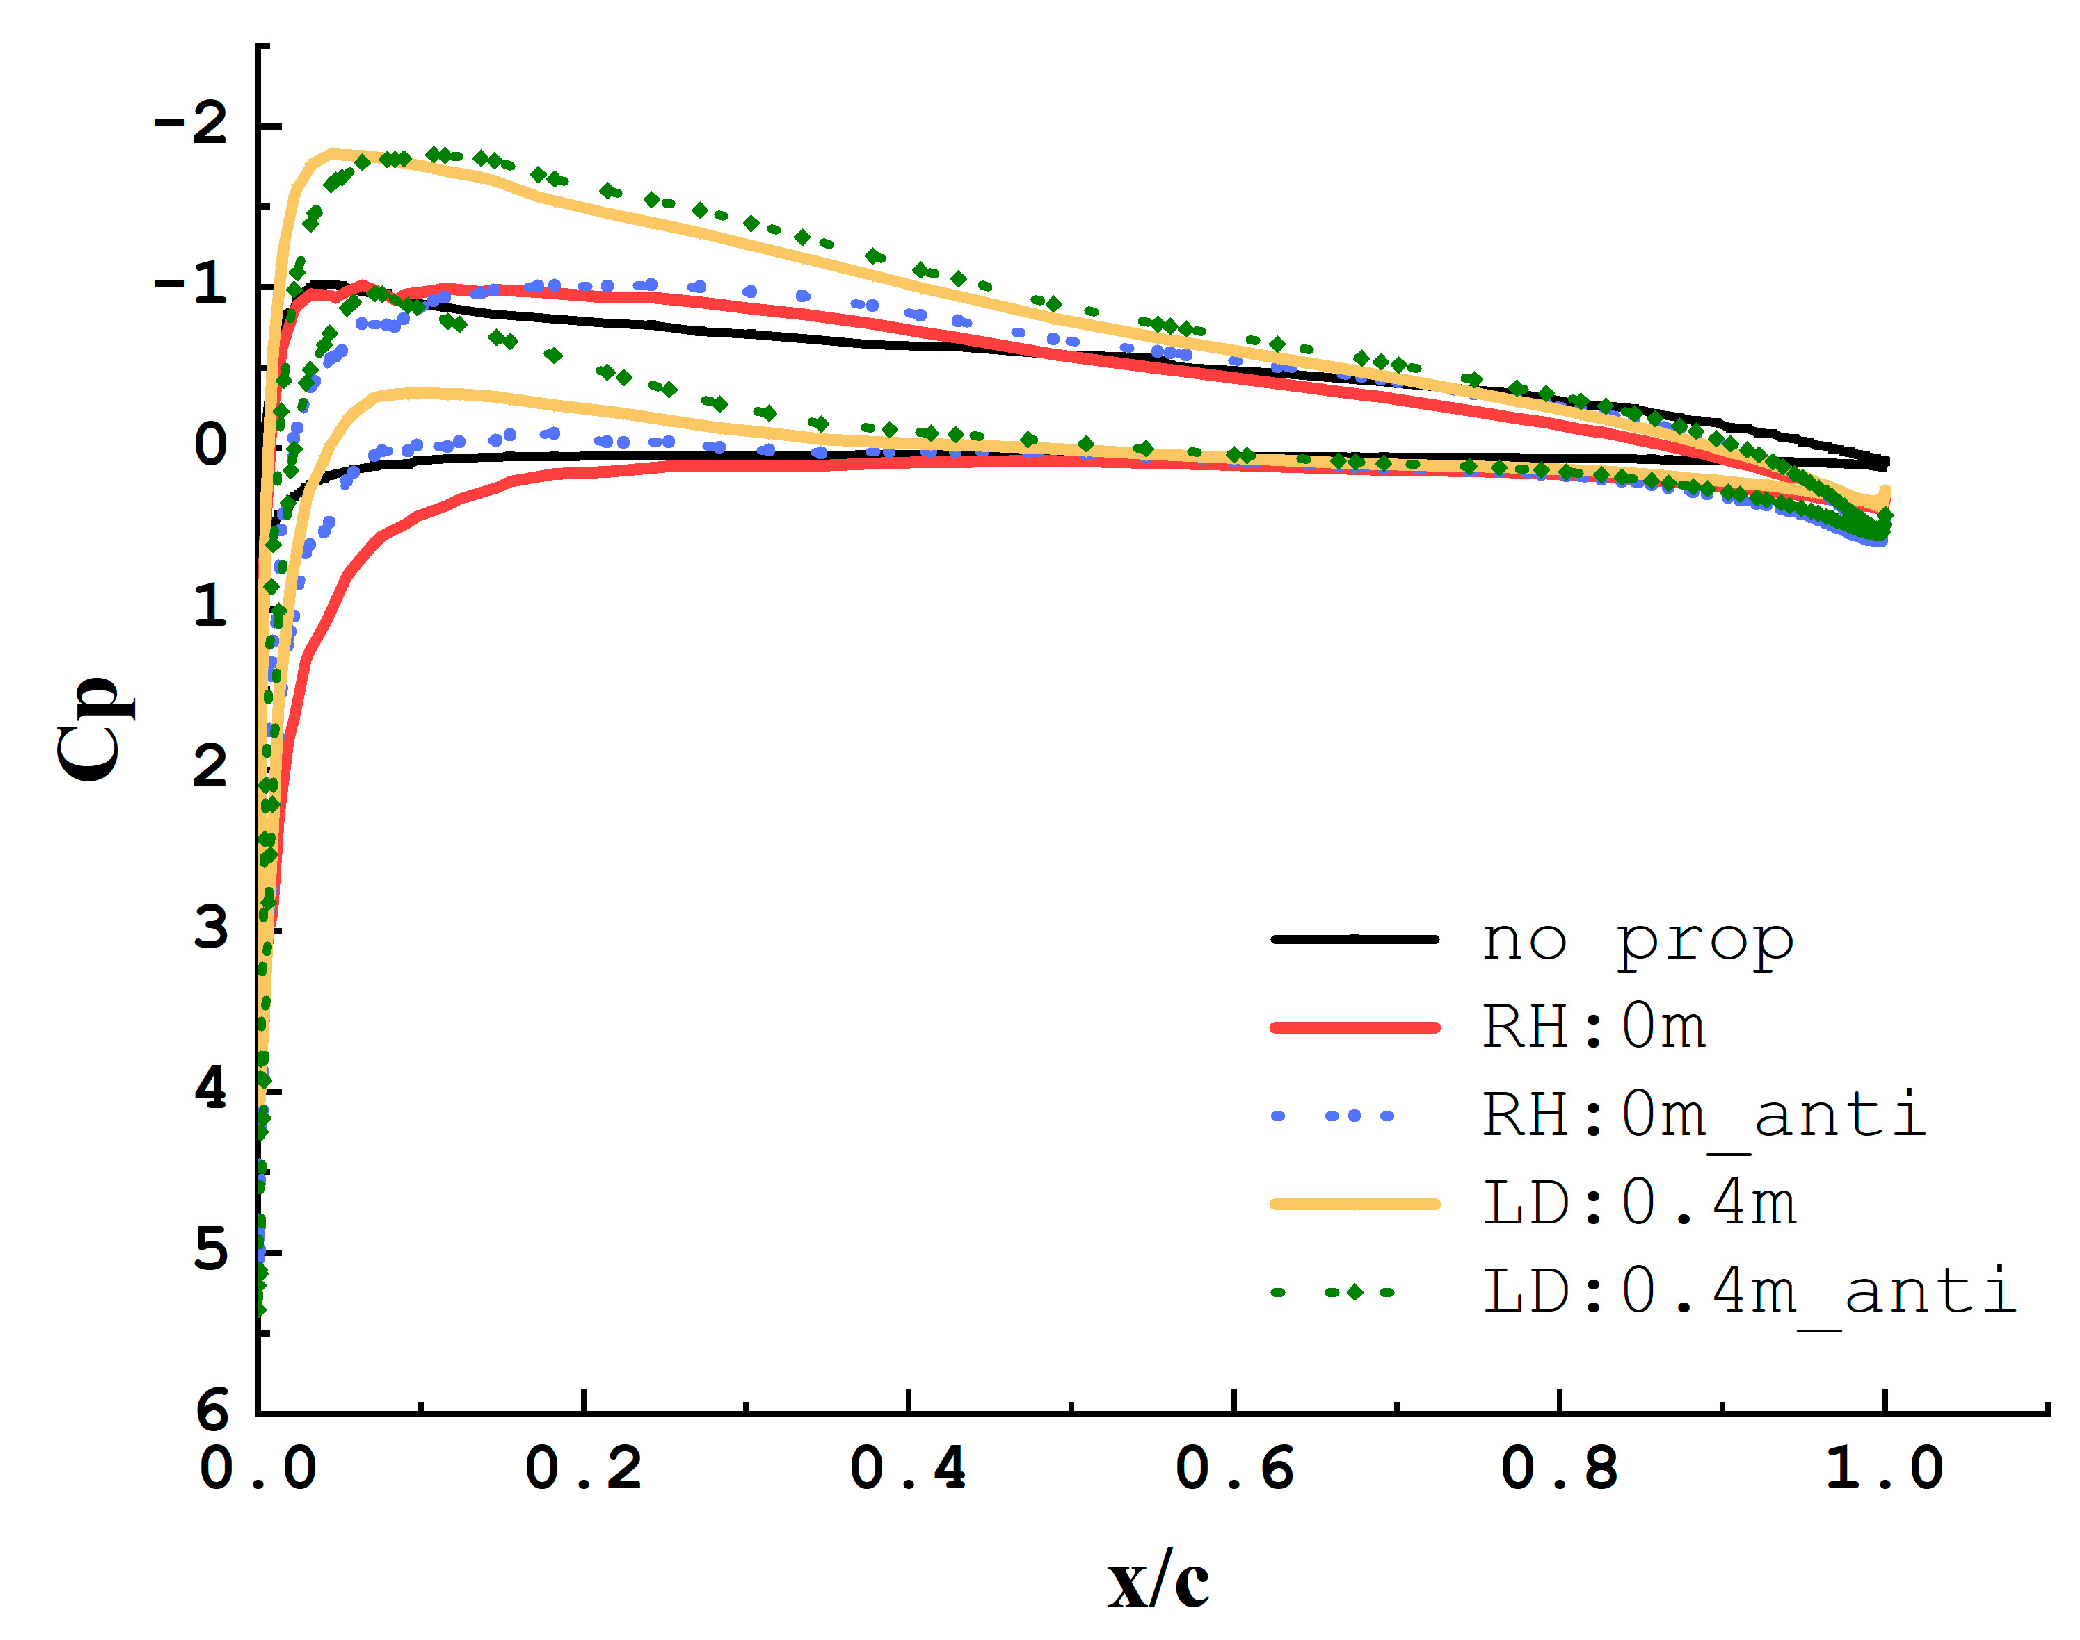
3.2. Relative Height of Propeller
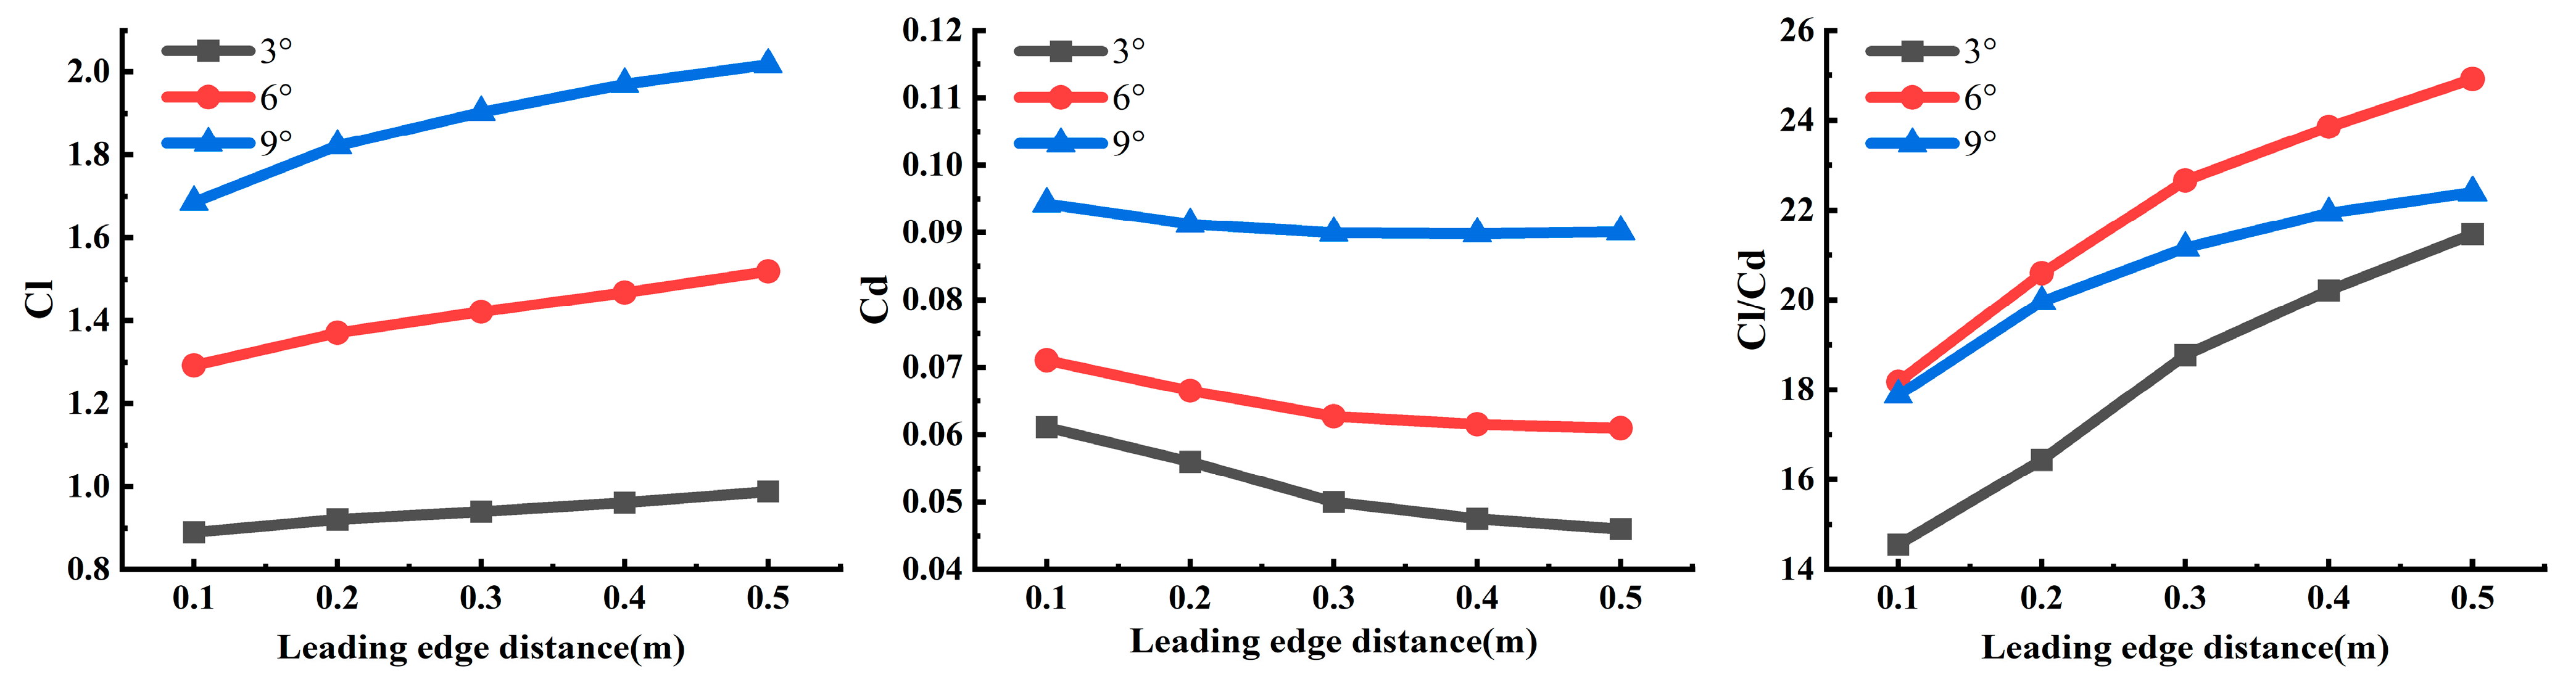
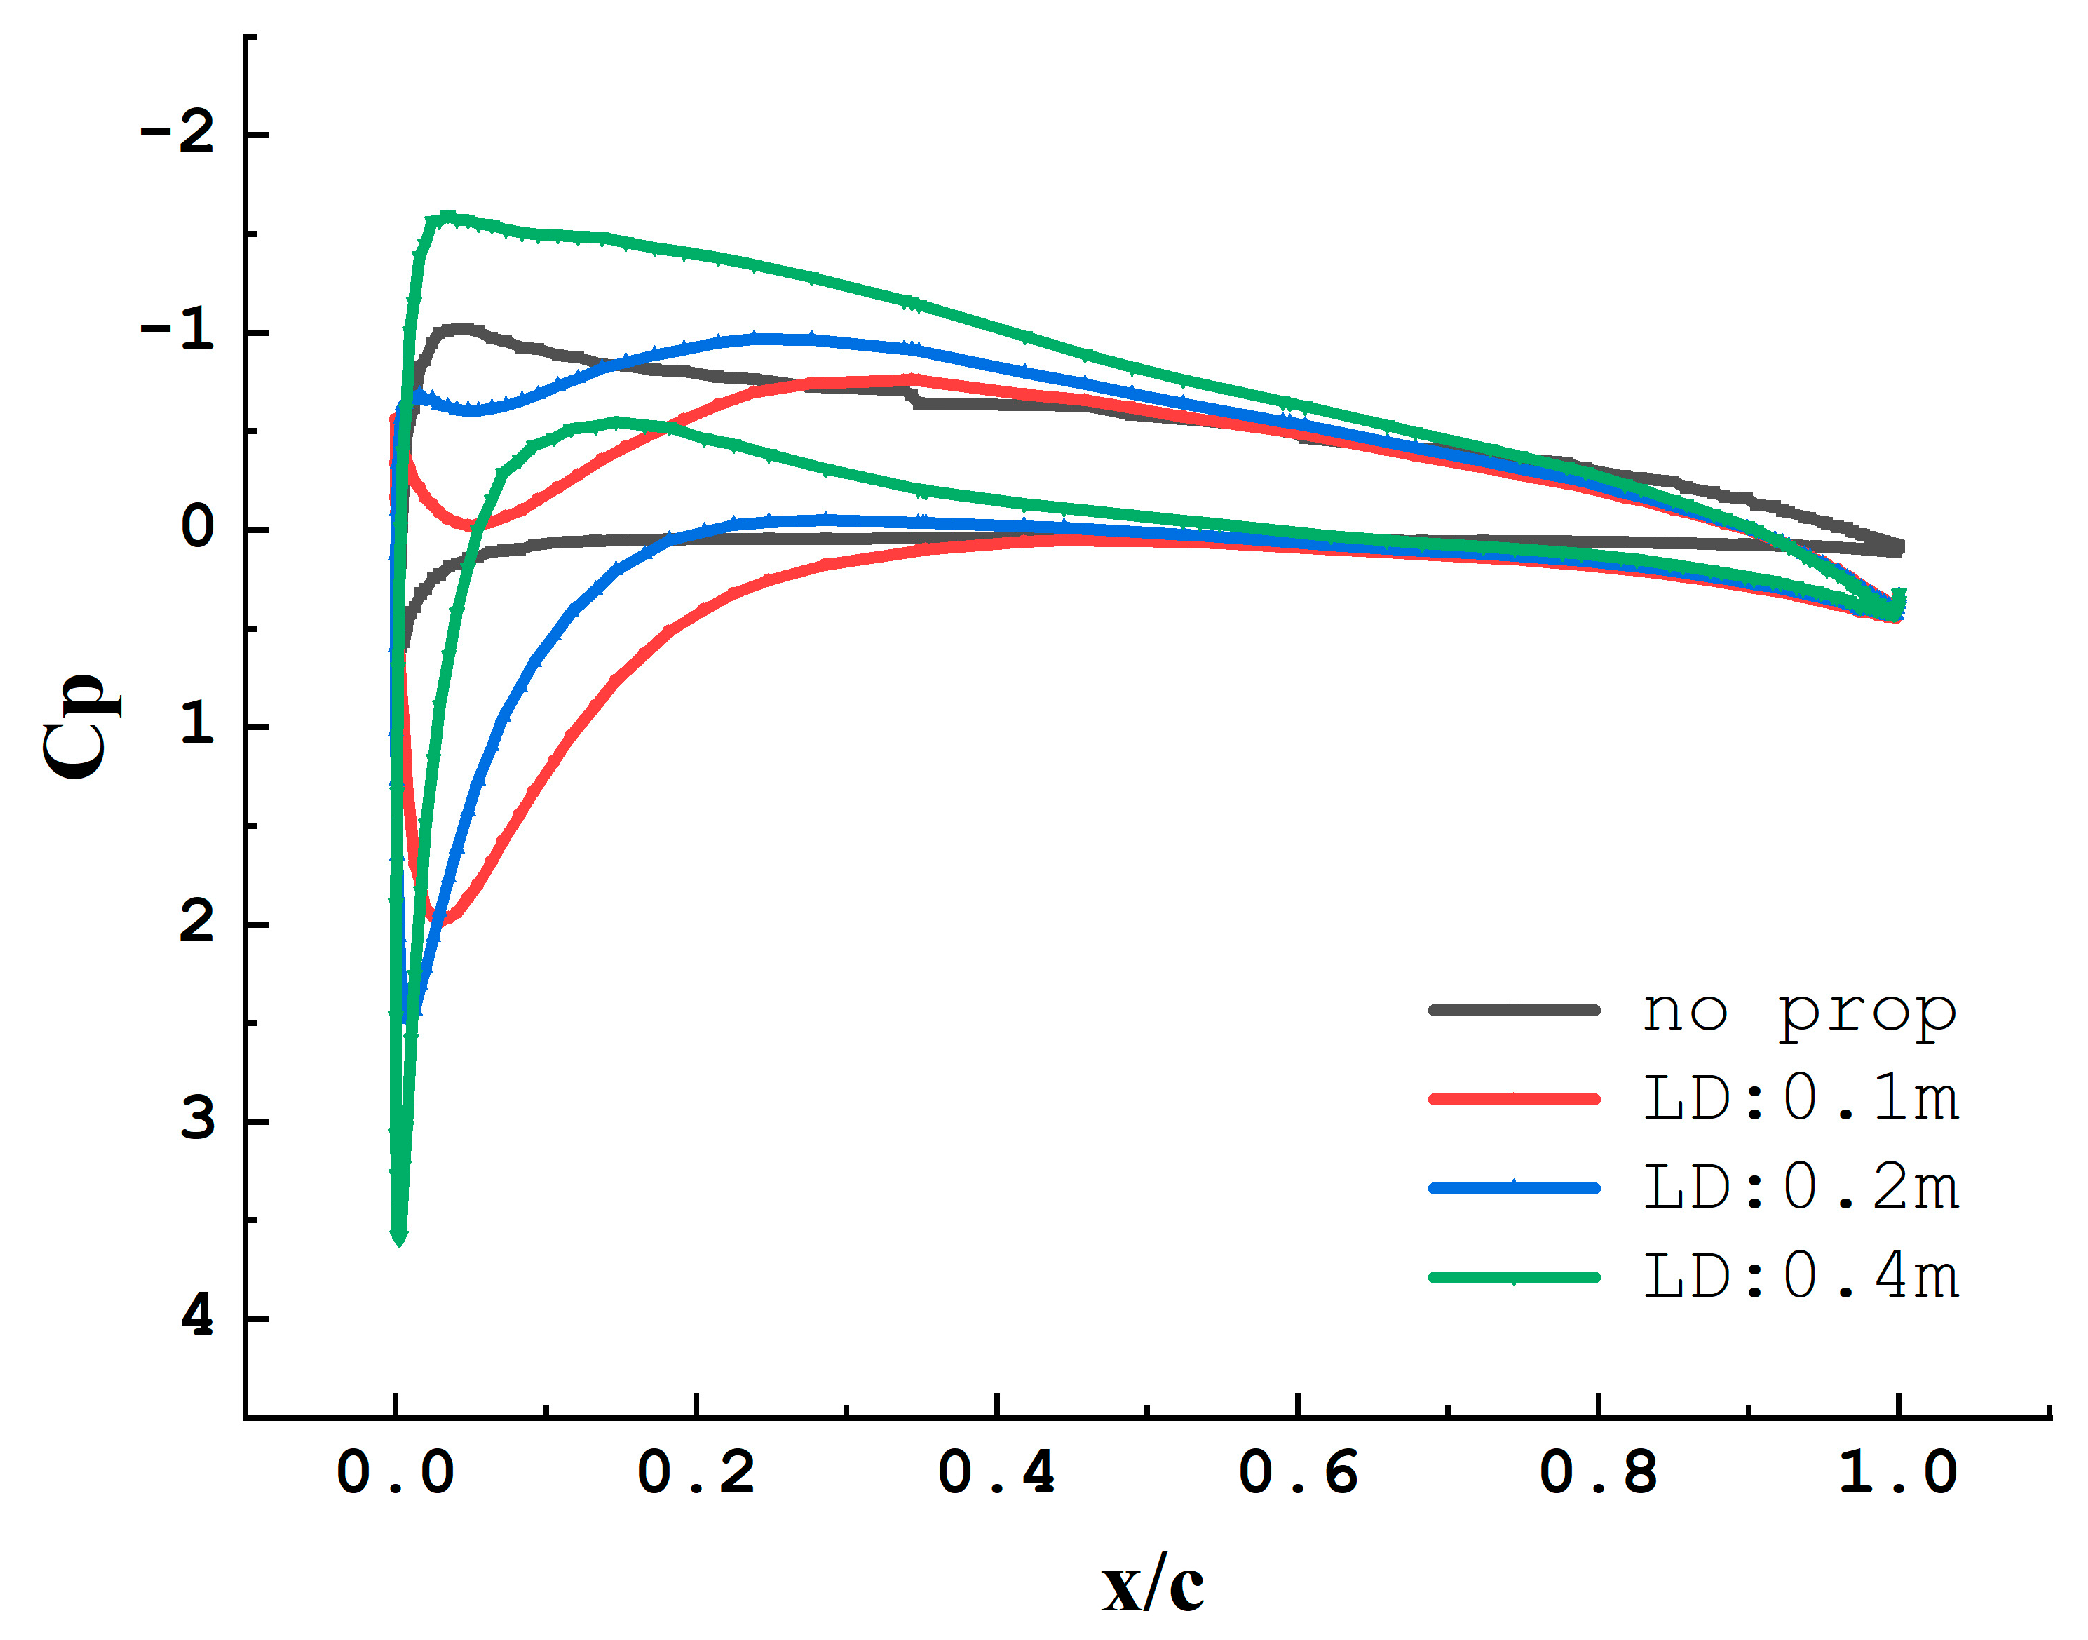
3.3. Distance between the Propeller and Wing Leading Edge
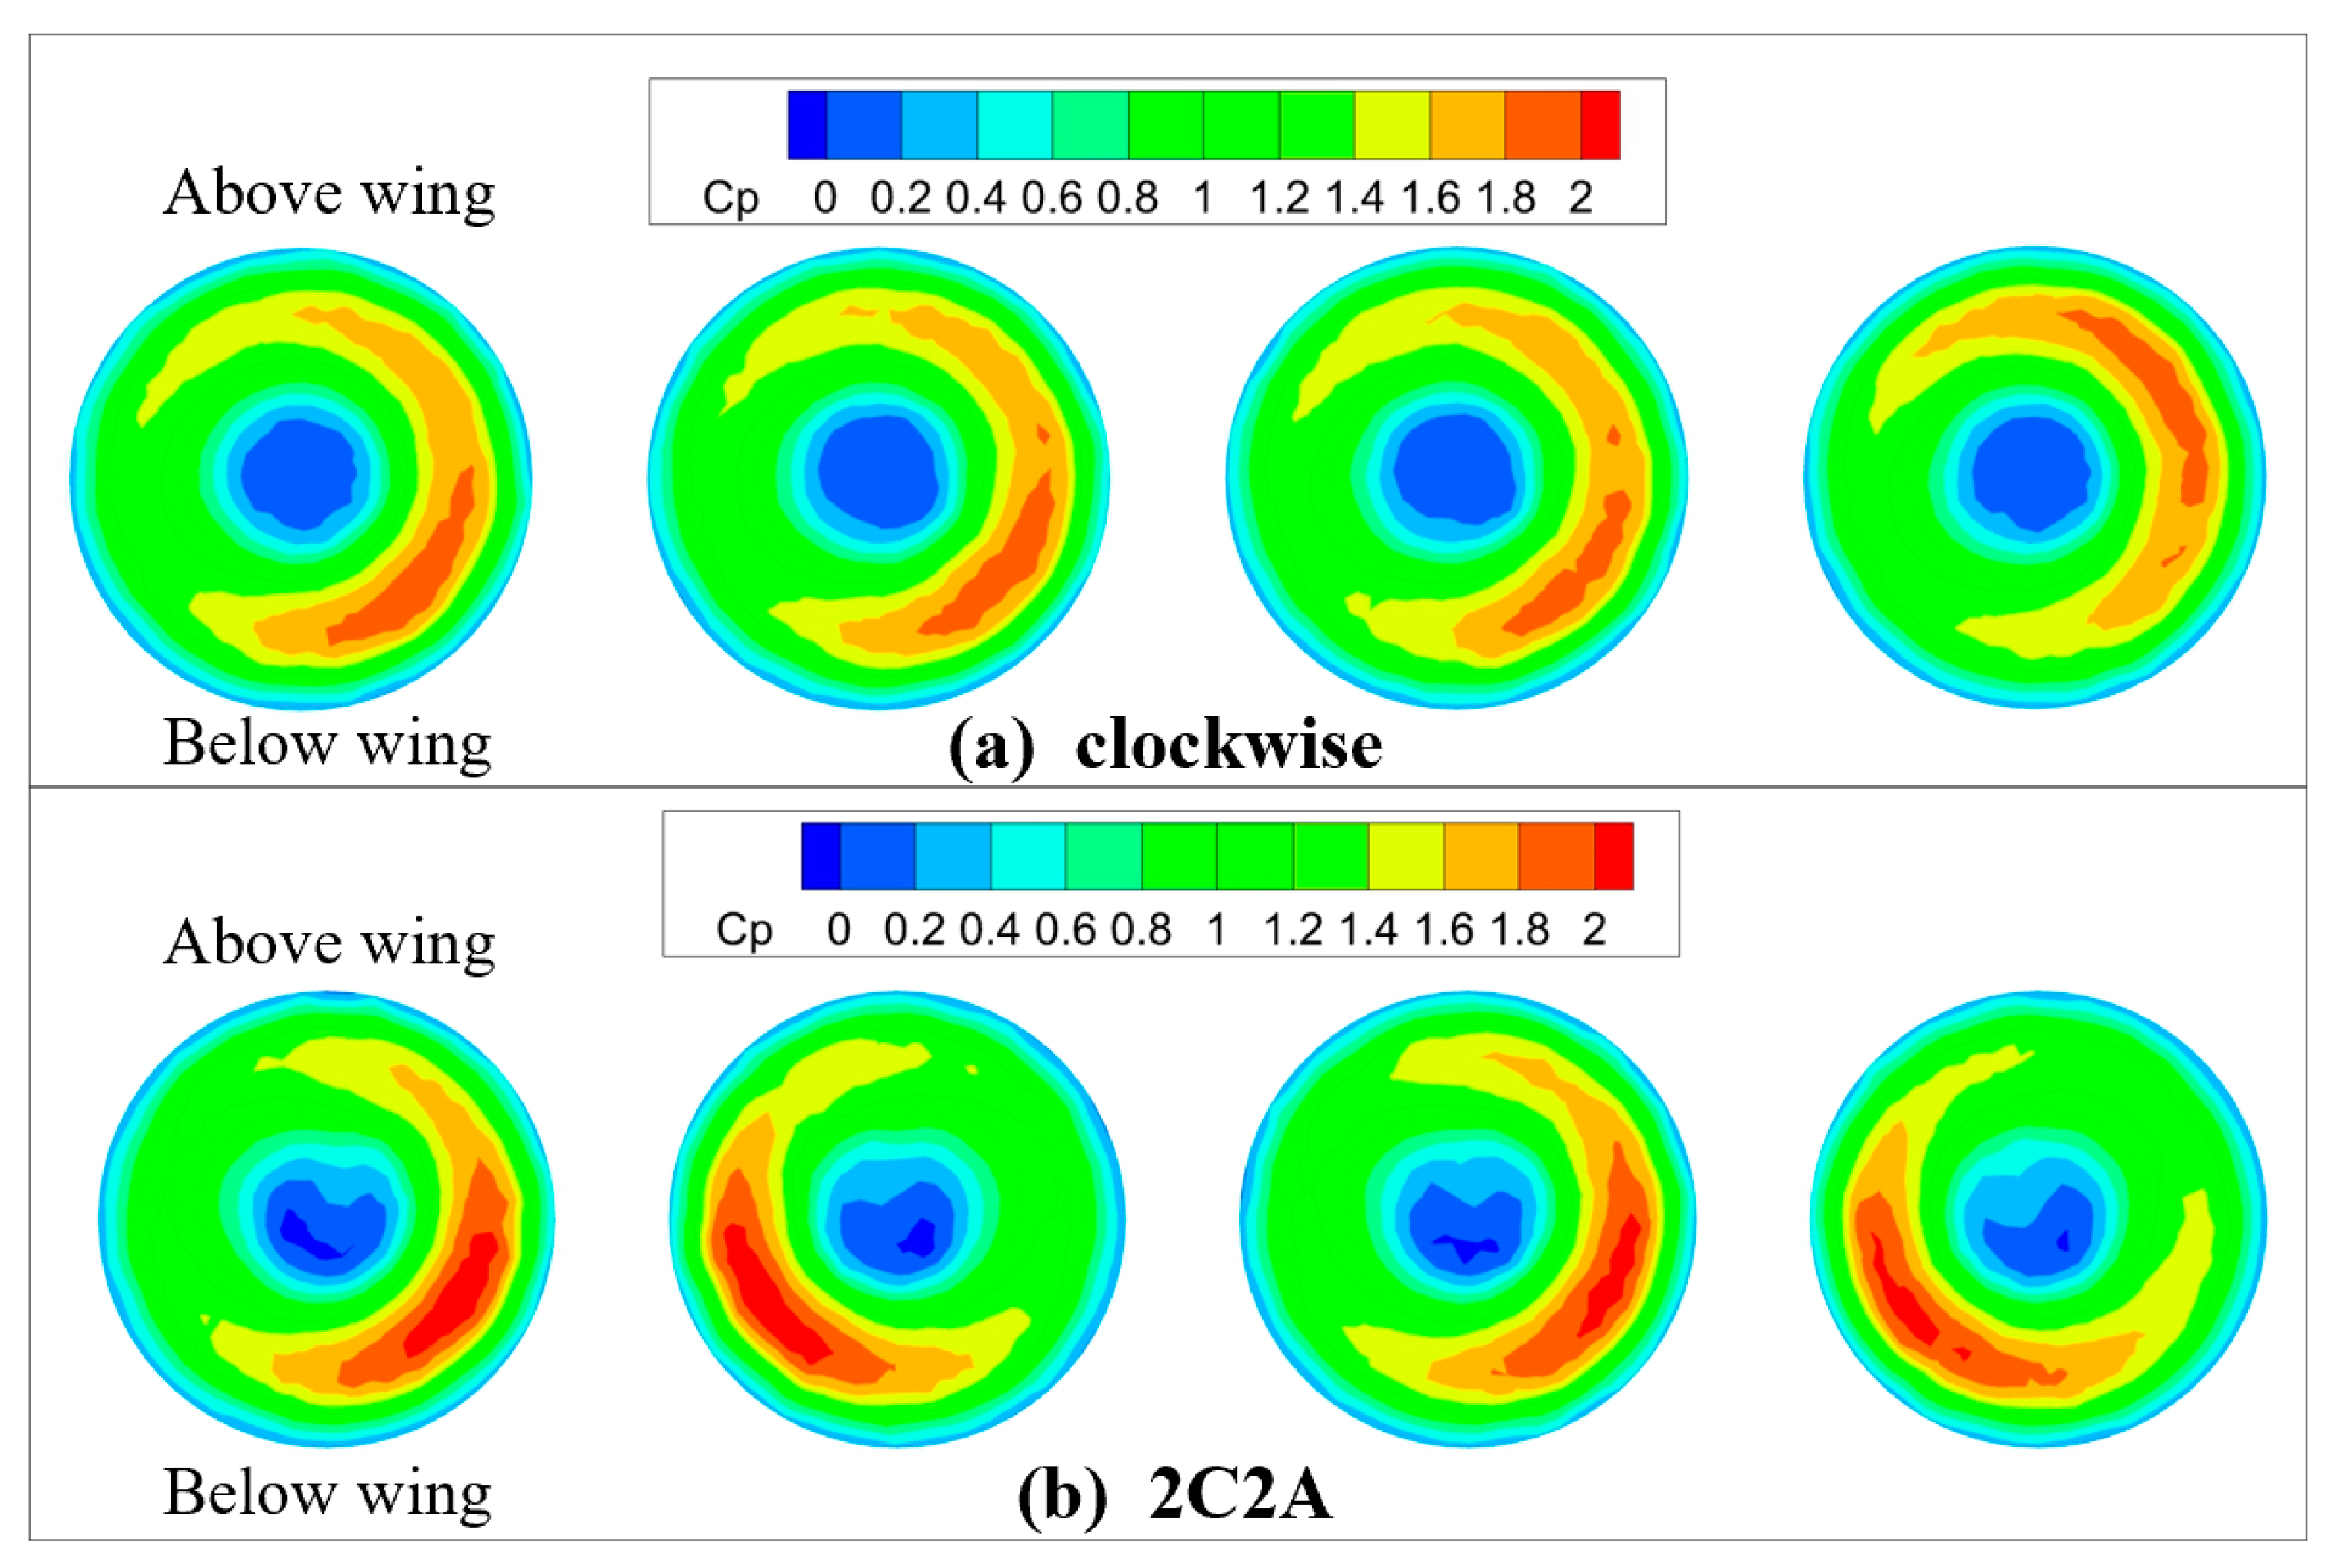
3.4. Rotating Direction
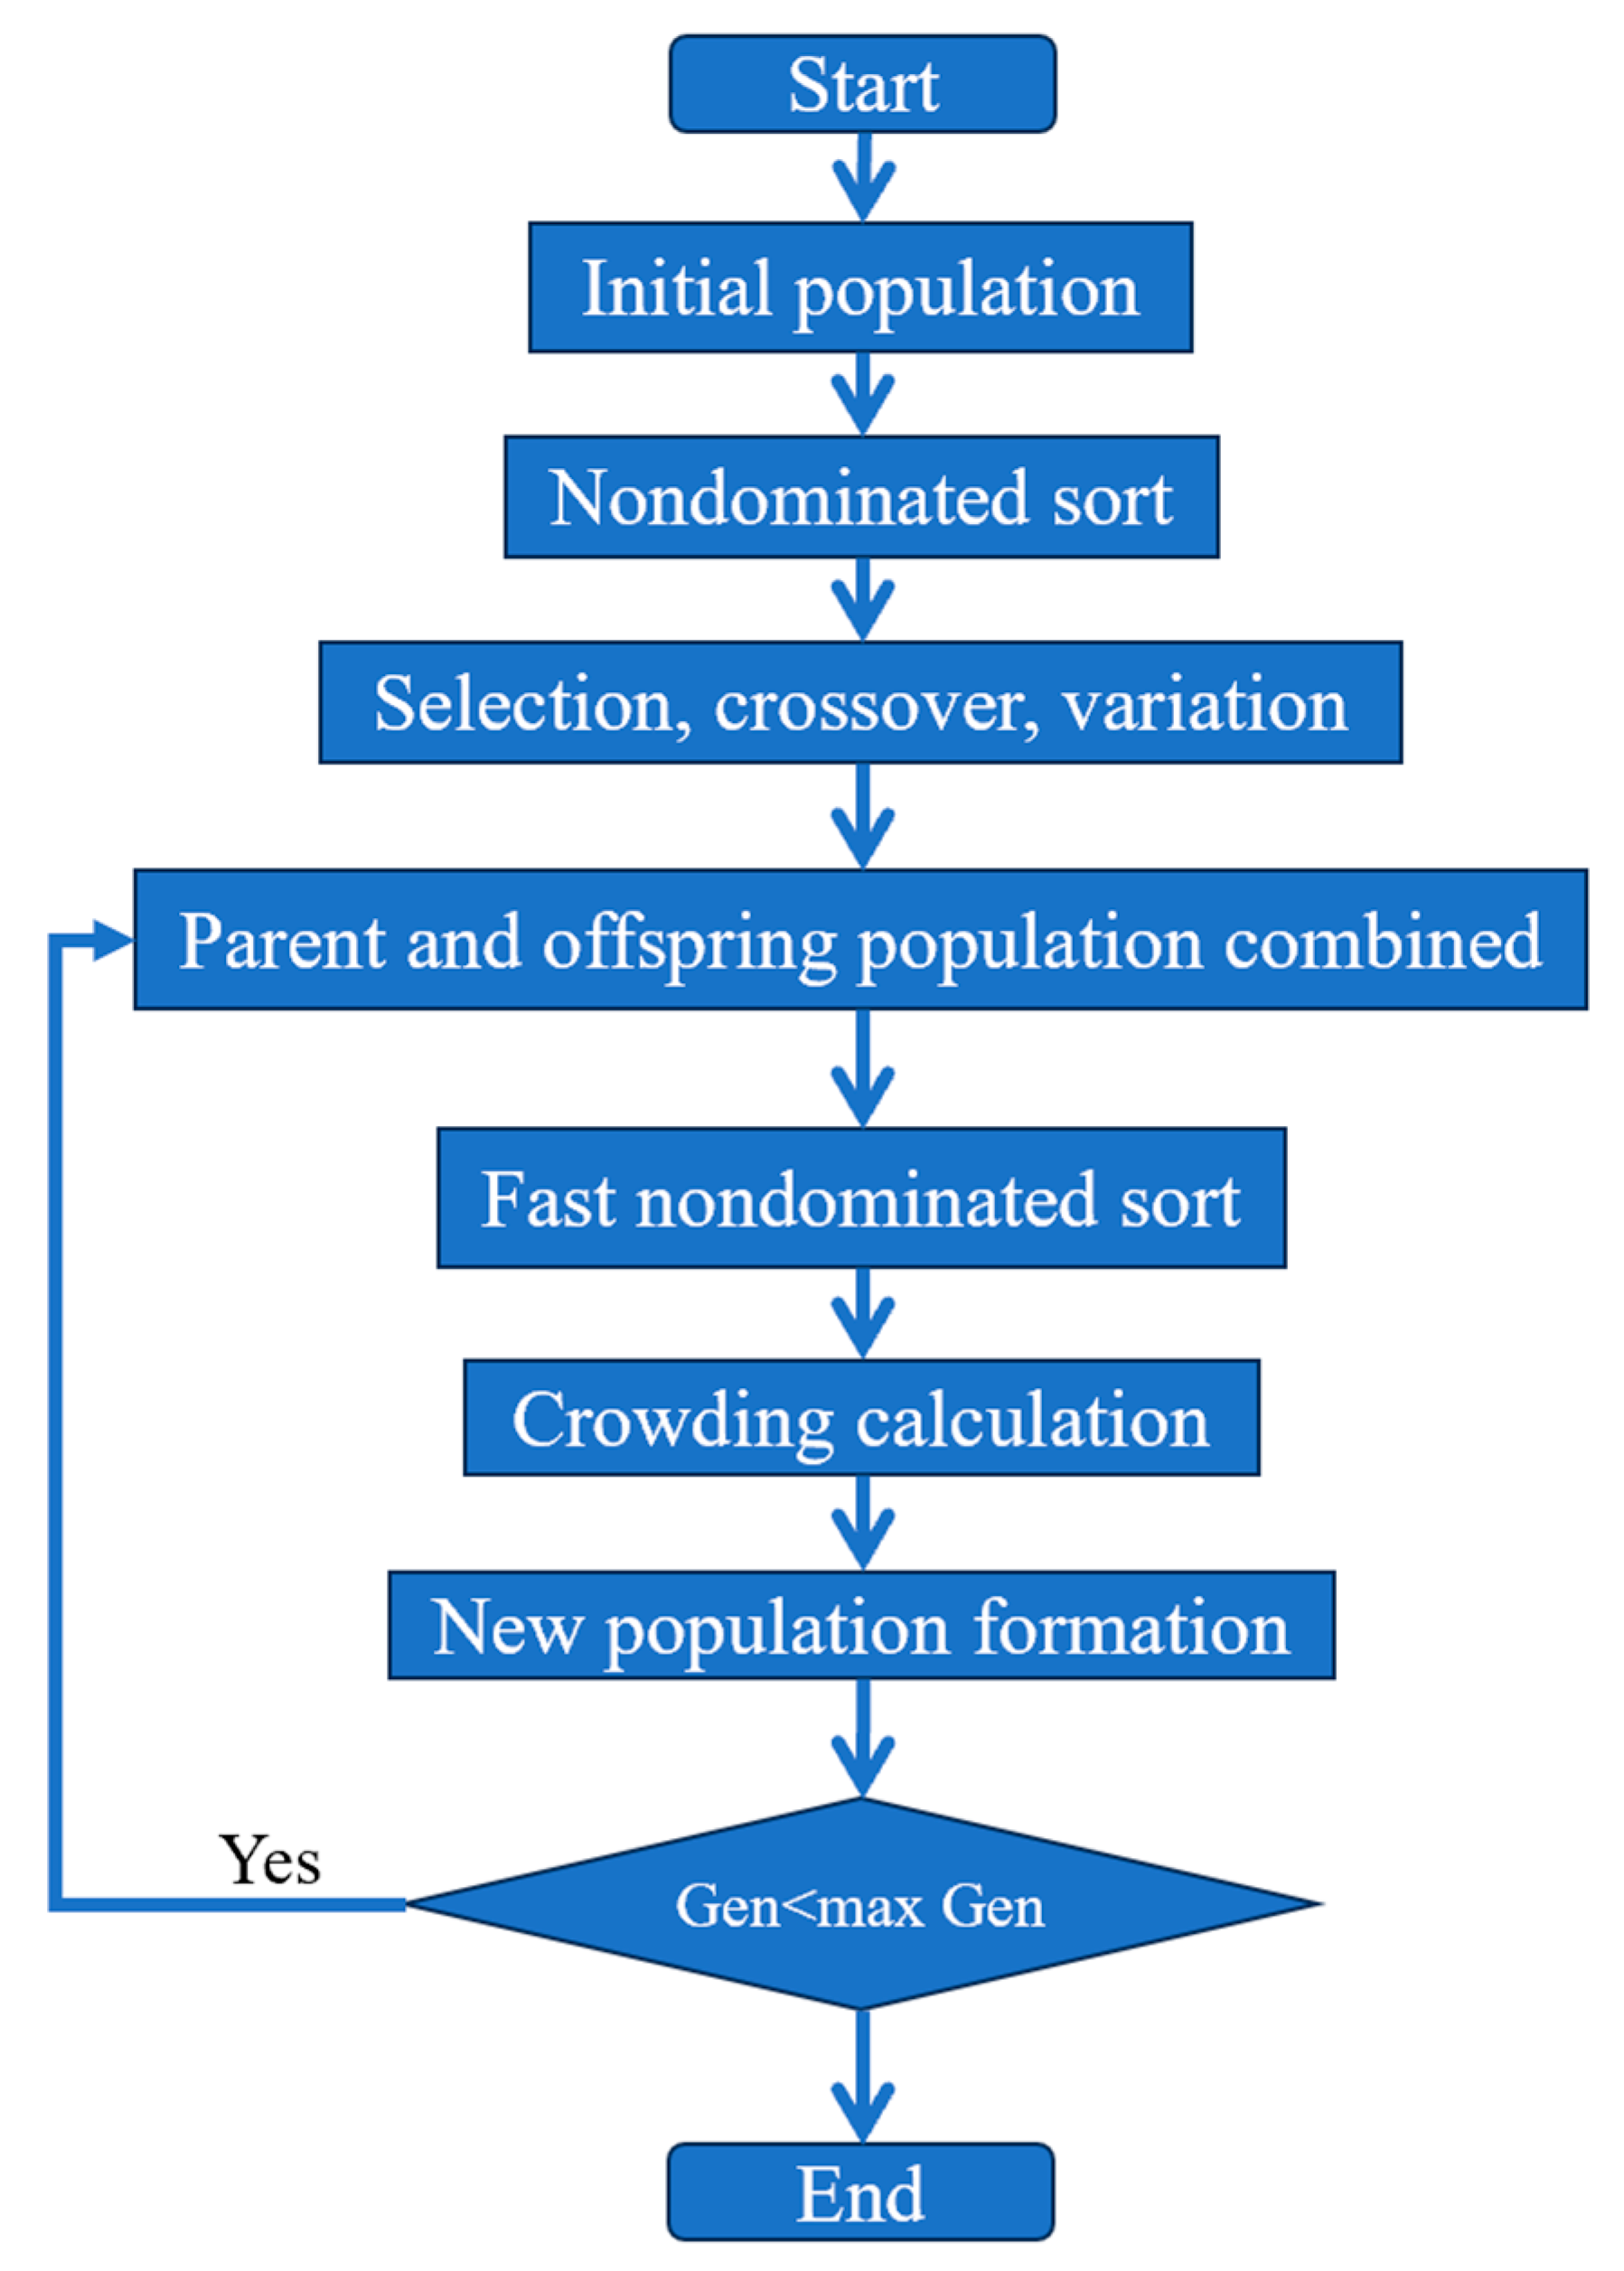
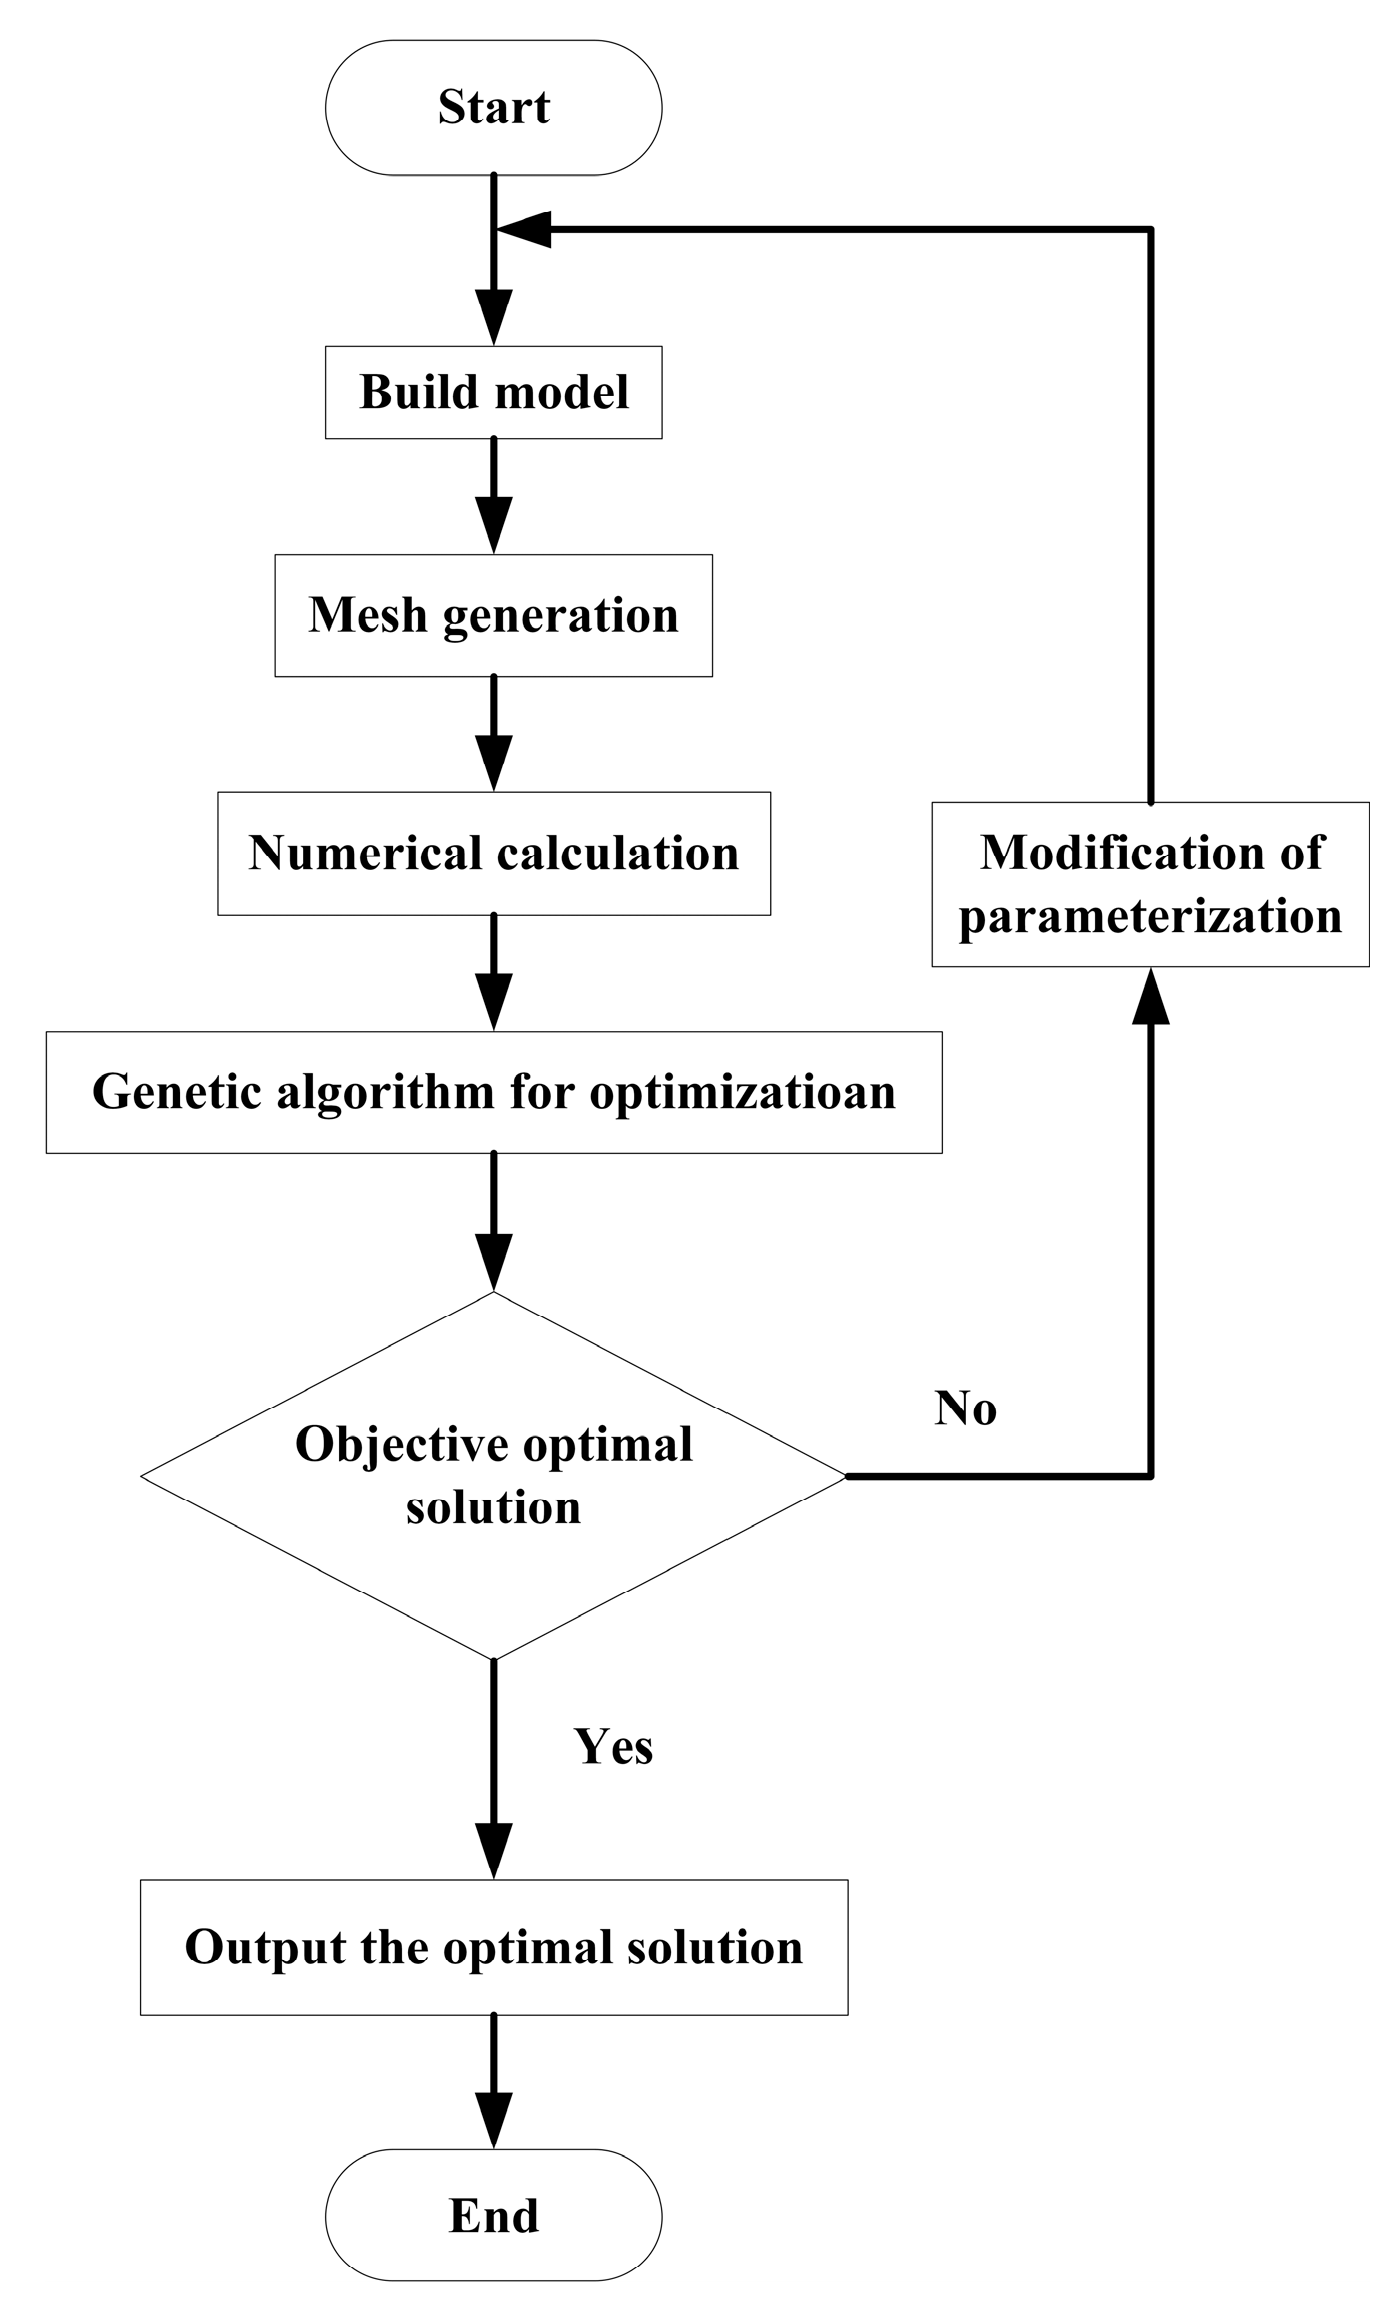
4. Genetic Algorithm Optimization
4.1. Optimization Introduction
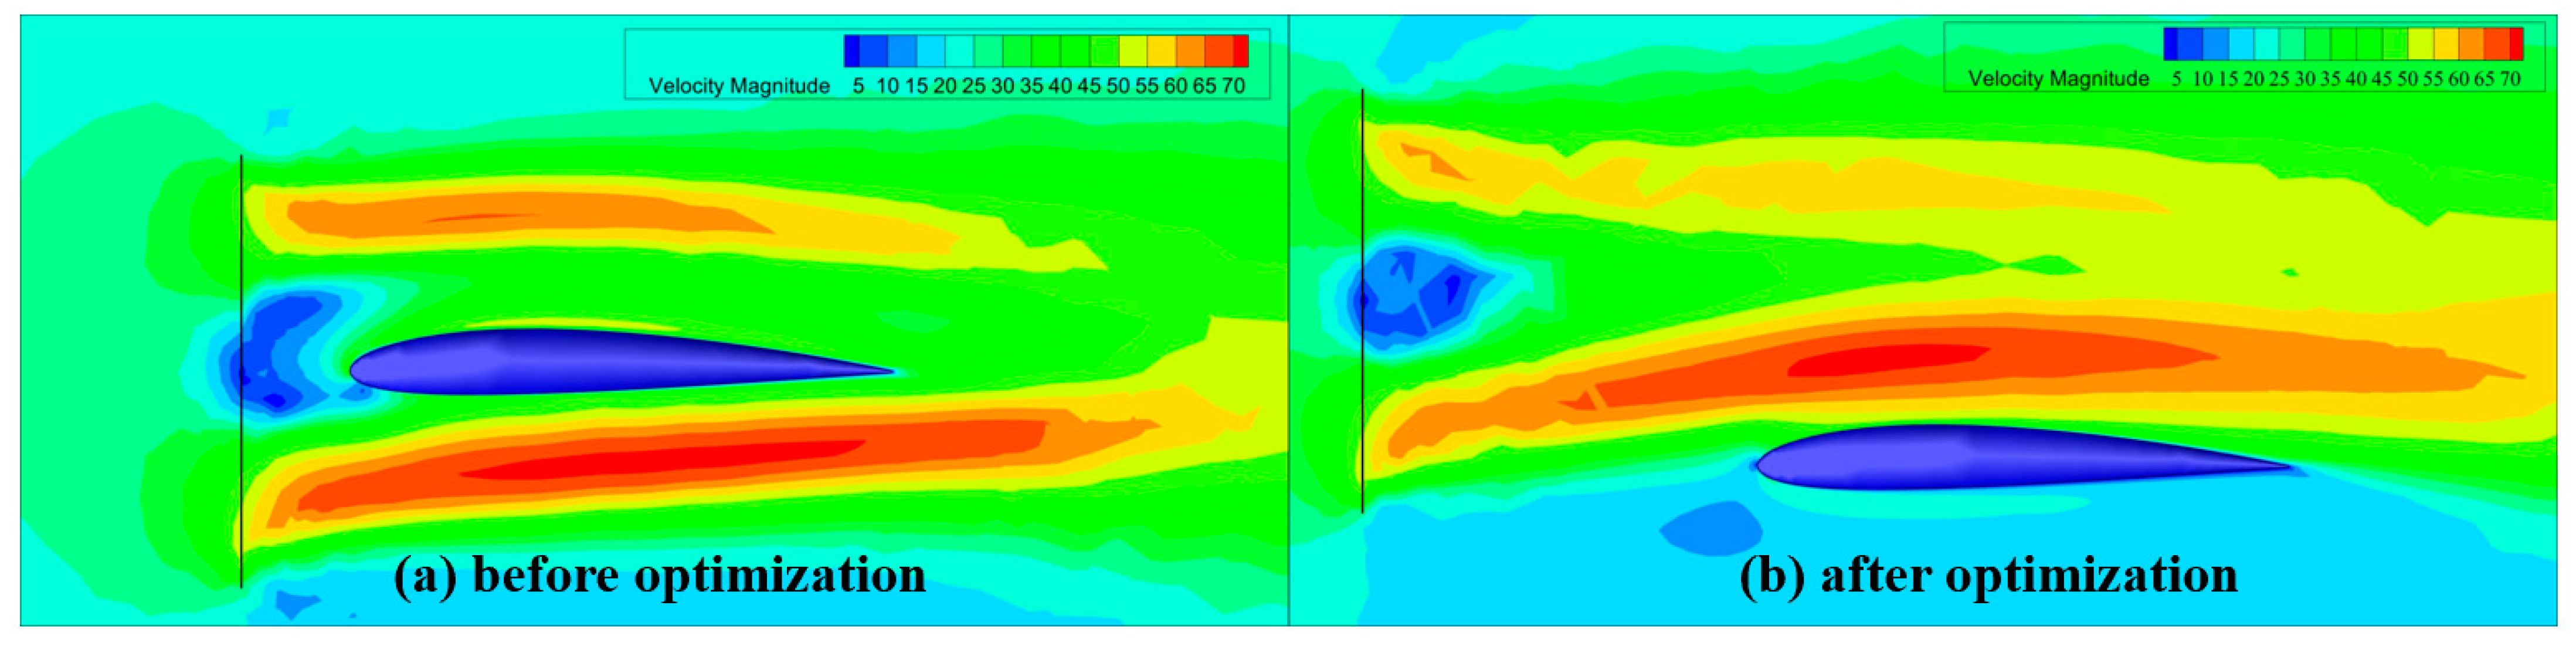
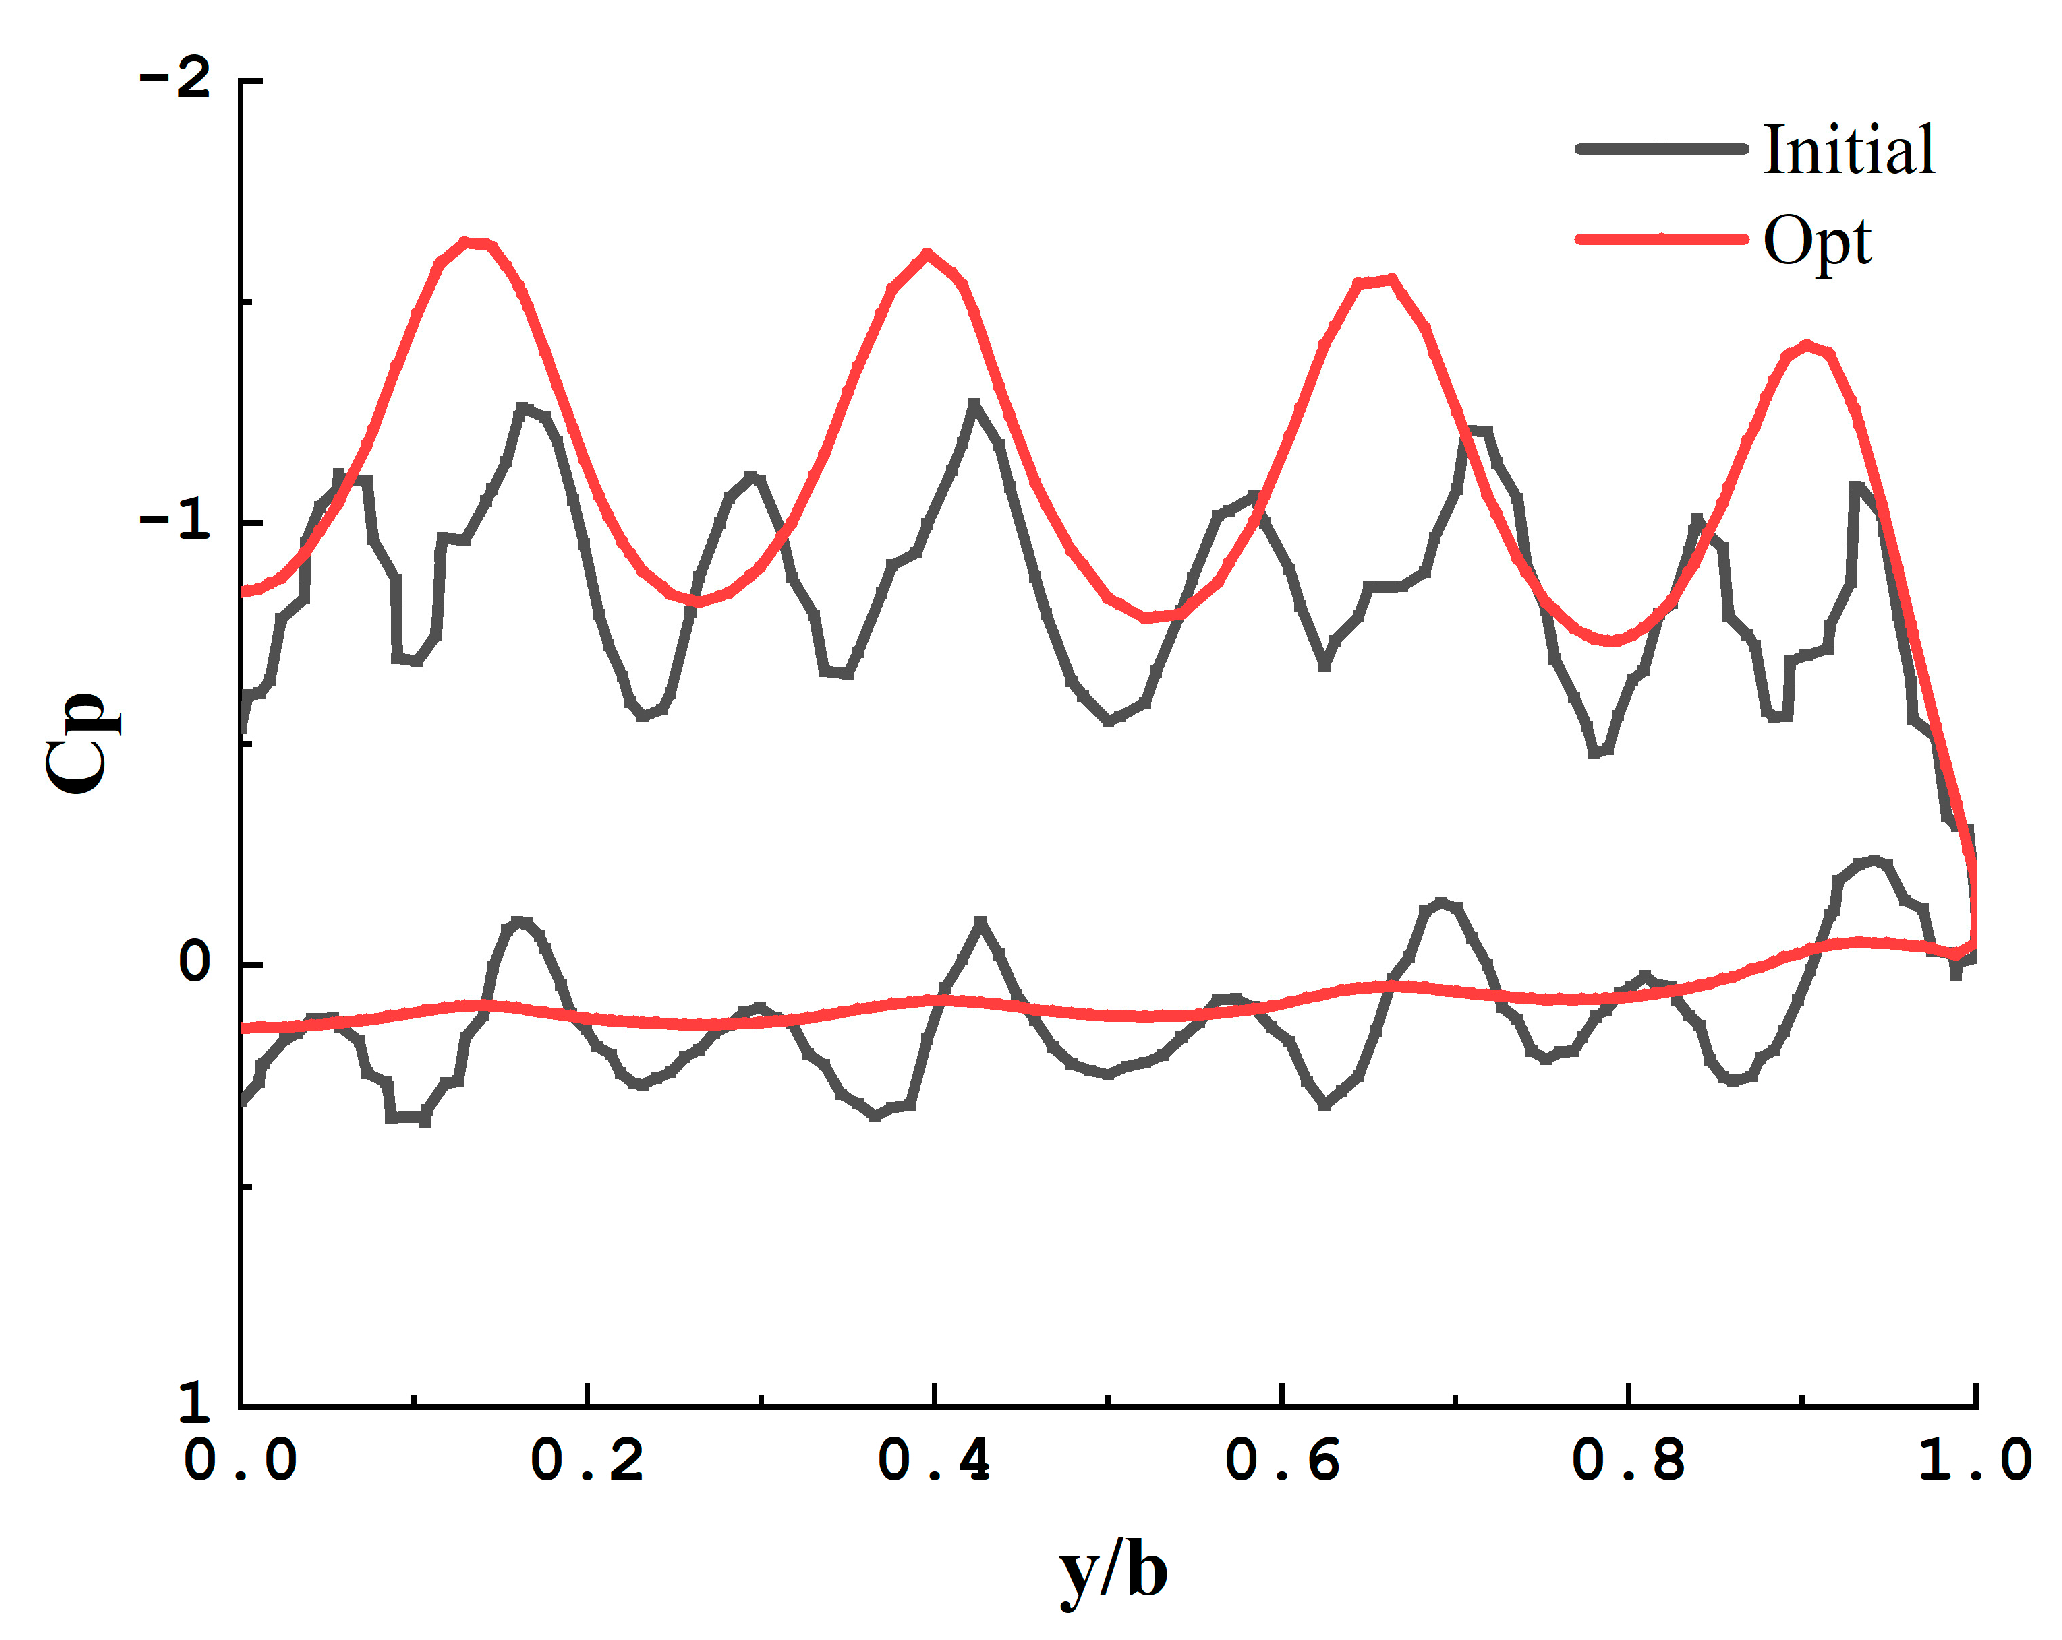
4.2. Analysis of Optimization Results
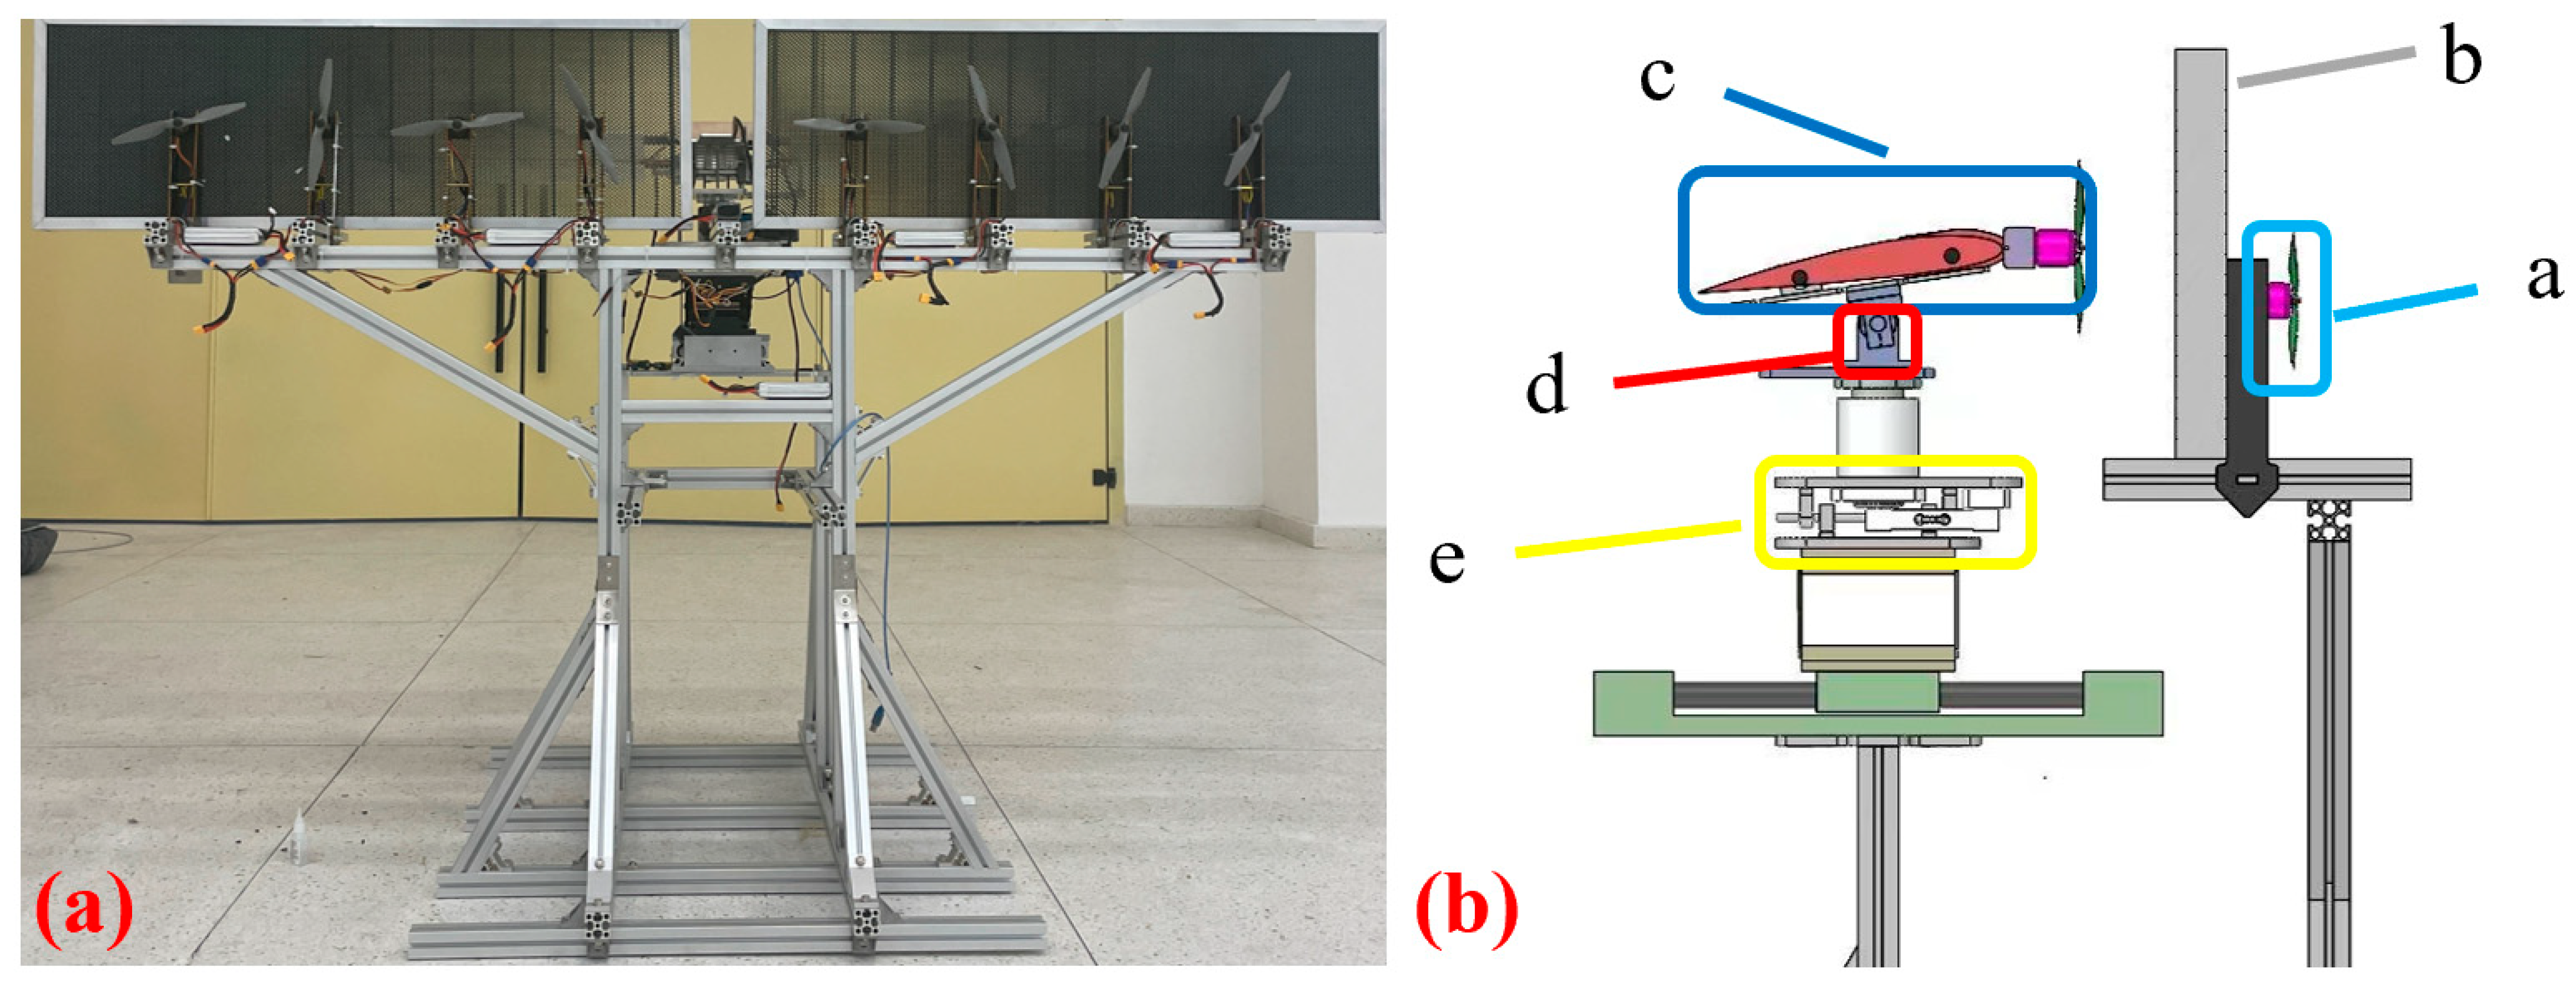
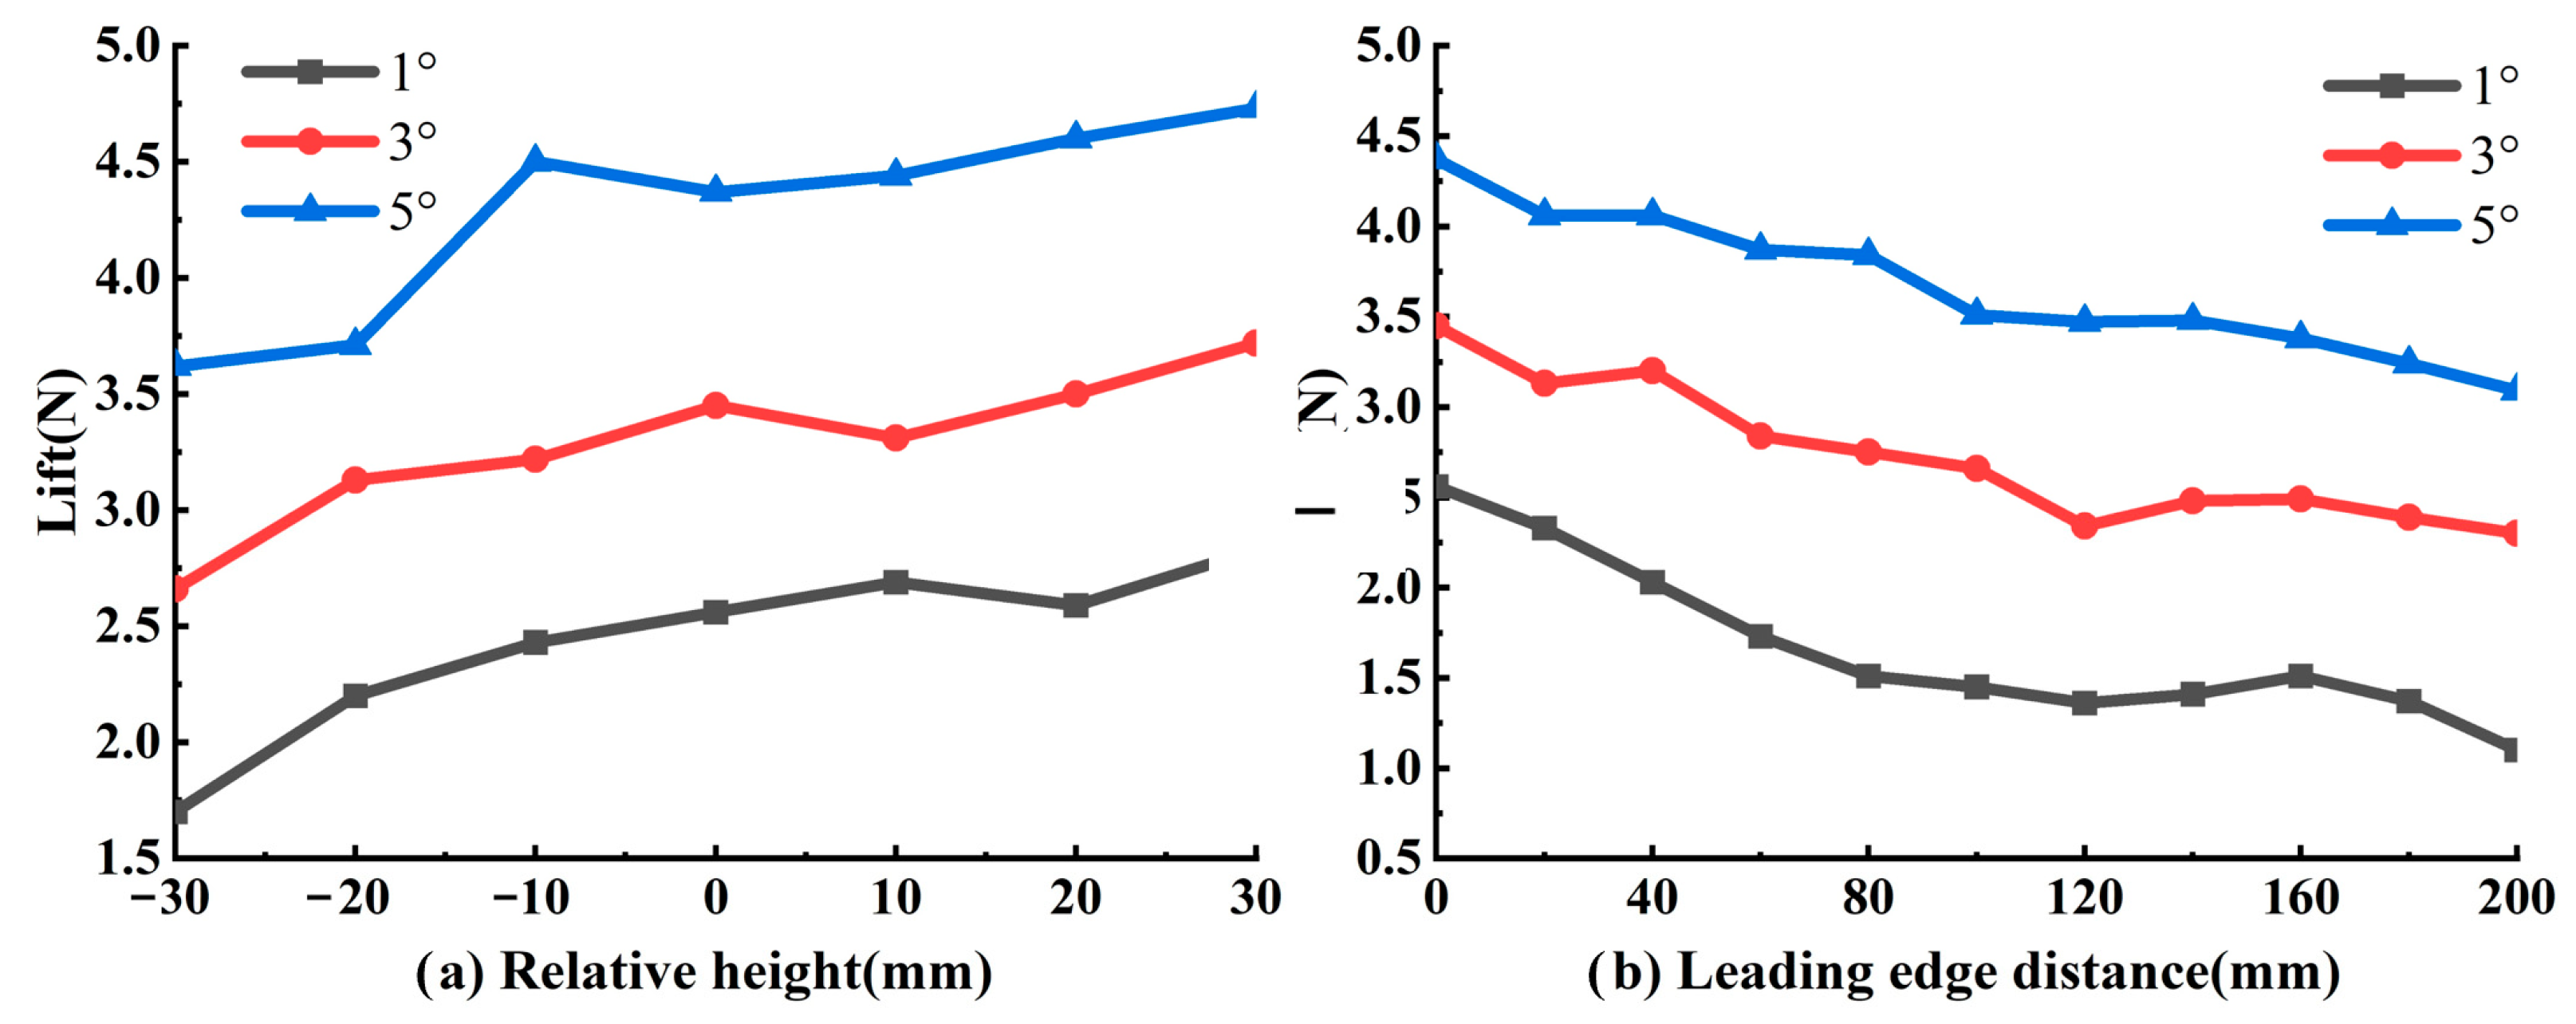
5. Experimental Verification
6. Conclusions
- (1)
- The actuator disk can better replace the propeller for the numerical simulation of the slipstream flow field, which can meet the requirements of distributed propeller optimization design under the aerodynamic effect of the slipstream.
- (2)
- Following the optimization of the distributed propeller layout, the UAV wing’s lift coefficient during the take-off phase has been significantly improved by 30.97%. The optimized aerodynamic layout proves to be more effective, and the lift/drag ratio of the wing is increased by 7.34%. This optimization is beneficial in boosting the drone’s payload capacity and extending its cruise time.
- (3)
- The test results confirm that an increase in the relative height of the propellers indeed amplifies the lift of the wing. In theory, variations in the leading-edge distance exert minimal influence on the wing lift. However, in practice, the presence of surrounding stationary air consistently attenuates the airflow behind the disk. Thus, an increase in the leading-edge distance weakens the slipstream’s lift effect on the wing.
Author Contributions
Funding
Data Availability Statement
Conflicts of Interest
References
- Patterson, M.D.; German, B. Conceptual design of electric aircraft with distributed propellers: Multidisciplinary analysis needs and aerodynamic modeling development. In Proceedings of the 52nd Aerospace Sciences Meeting, National Harbor, MD, USA, 13–17 January 2014; p. 0534. [Google Scholar]
- Moore, M.D. Misconceptions of electric aircraft and their emerging aviation markets. In Proceedings of the 52nd Aerospace Sciences Meeting, National Harbor, MD, USA, 13–17 January 2014; p. 0535. [Google Scholar]
- Borer, N.K.; Patterson, M.D.; Viken, J.K.; Moore, M.D.; Bevirt, J.; Stoll, A.M.; Gibson, A.R. Design and performance of the NASA SCEPTOR distributed electric propulsion flight demonstrator. In Proceedings of the 16th AIAA Aviation Technology, Integration, and Operations Conference, Washington, DC, USA, 13–17 June 2016; p. 3920. [Google Scholar]
- Patterson, M.D.; Derlaga, J.M.; Borer, N.K. High-lift propeller system configuration selection for NASA’s SCEPTOR distributed electric propulsion flight demonstrator. In Proceedings of the 16th AIAA Aviation Technology, Integration, and Operations Conference, Washington, DC, USA, 13–17 June 2016; p. 3922. [Google Scholar]
- Schnulo, S.L.; Chin, J.; Smith, A.; Paul-Dubois-Taine, A. Steady state thermal analyses of SCEPTOR X-57 wingtip propulsion. In Proceedings of the 17th AIAA Aviation Technology, Integration, and Operations Conference, Washington, DC, USA, 13–17 June 2016; p. 3783. [Google Scholar]
- Christie, R.J.; Dubois, A.; Derlaga, J.M. Cooling of Electric Motors Used for Propulsion on SCEPTOR.; AIAA: Reston, VA, USA, 2017. [Google Scholar]
- Kelei, W.; Zhou, Z.; Zhongyun, F.; Jiahao, G. Aerodynamic design of tractor propeller for high-performance distributed electric propulsion aircraft. Chin. J. Aeronaut. 2021, 34, 20–35. [Google Scholar]
- De Vries, R. Hybrid-Electric Aircraft with Over-the-Wing Distributed Propulsion: Aerodynamic Performance and Conceptual Design. Ph.D. Thesis, Delft University of Technology, Delft, The Netherlands, 2022. [Google Scholar]
- Patterson, M.D.; Borer, N.K. Approach considerations in aircraft with high-lift propeller systems. In Proceedings of the 17th AIAA Aviation Technology, Integration, and Operations Conference, Washington, DC, USA, 13–17 June 2016; p. 3782. [Google Scholar]
- Marcus, E.A.; de Vries, R.; Raju Kulkarni, A.; Veldhuis, L.L. Aerodynamic investigation of an over-the-wing propeller for distributed propulsion. In Proceedings of the 2018 AIAA Aerospace Sciences Meeting, Kissimmee, FL, USA, 8–12 January 2018; p. 2053. [Google Scholar]
- de Vries, R.; van Arnhem, N.; Sinnige, T.; Vos, R.; Veldhuis, L.L. Aerodynamic interaction between propellers of a distributed-propulsion system in forward flight. Aerosp. Sci. Technol. 2021, 118, 107009. [Google Scholar] [CrossRef]
- Sinnige, T.; van Arnhem, N.; Stokkermans, T.C.; Eitelberg, G.; Veldhuis, L.L. Wingtip-mounted propellers: Aerodynamic analysis of interaction effects and comparison with conventional layout. J. Aircr. 2019, 56, 295–312. [Google Scholar] [CrossRef]
- Lei, Y.; Yang, W.-J.; Huang, Y.-Y. Aerodynamic performance of distributed electric propulsion with wing interaction. J. Zhejiang Univ.-SCIENCE A 2022, 23, 27–39. [Google Scholar] [CrossRef]
- Zhang, X.; Zhang, W.; Weilin, L.; Zhang, X.; Tao, L. Experimental research on aero-propulsion coupling characteristics of a distributed electric propulsion aircraft. Chin. J. Aeronaut. 2023, 36, 201–212. [Google Scholar] [CrossRef]
- Cheng, Z.; Yang, Y.; Ye, B. Parameterization investigation on distributed electric propulsion aircraft aerodynamic characteristics. J. Phys. Conf. Ser. 2018, 2459, 012092. [Google Scholar] [CrossRef]
- Barakos, G.; Fitzgibbon, T.; Kusyumov, A.; Kusyumov, S.; Mikhailov, S. CFD simulation of helicopter rotor flow based on unsteady actuator disk model. Chin. J. Aeronaut. 2020, 33, 2313–2328. [Google Scholar] [CrossRef]
- Stuermer, A. Unsteady CFD simulations of propeller installation effects. In Proceedings of the 42nd AIAA/ASME/SAE/ASEE Joint Propulsion Conference & Exhibit, Sacramento, CA, USA, 9–12 July 2006; p. 4969. [Google Scholar]
- Stokkermans, T.C.; Van Arnhem, N.; Sinnige, T.; Veldhuis, L.L. Validation and comparison of RANS propeller modeling methods for tip-mounted applications. AIAA J. 2019, 57, 566–580. [Google Scholar] [CrossRef]
- Stoll, A.M.; Bevirt, J.; Moore, M.D.; Fredericks, W.J.; Borer, N.K. Drag reduction through distributed electric propulsion. In Proceedings of the 14th AIAA Aviation Technology, Integration, and Operations Conference, Los Angeles, CA, USA, 12–14 August 2013; p. 2851. [Google Scholar]
- Seo, Y.; Hong, Y.; Yee, K. Numerical investigation of wing–multiple propeller aerodynamic interaction using actuator disk method. Int. J. Aeronaut. Space Sci. 2022, 23, 805–822. [Google Scholar] [CrossRef]
- Hassib, E.M.; El-Desouky, A.I.; El-Kenawy, E.-S.M.; El-Ghamrawy, S.M. An imbalanced big data mining framework for improving optimization algorithms performance. IEEE Access 2019, 7, 170774–170795. [Google Scholar] [CrossRef]
- El-kenawy, E.-S.M.; Ibrahim, A.; Bailek, N.; Bouchouicha, K.; Hassan, M.A.; Jamei, M.; Al-Ansari, N. Sunshine duration measurements and predictions in Saharan Algeria region: An improved ensemble learning approach. Theor. Appl. Climatol. 2022, 147, 1015–1031. [Google Scholar] [CrossRef]
- Takieldeen, A.E.; El-kenawy, E.-S.M.; Hadwan, M.; Zaki, R.M. Dipper throated optimization algorithm for unconstrained function and feature selection. Comput. Mater. Contin. 2022, 72, 1465–1481. [Google Scholar] [CrossRef]
- Abdelhamid, A.A.; El-Kenawy, E.-S.M.; Alotaibi, B.; Amer, G.M.; Abdelkader, M.Y.; Ibrahim, A.; Eid, M.M. Robust speech emotion recognition using CNN+ LSTM based on stochastic fractal search optimization algorithm. IEEE Access 2022, 10, 49265–49284. [Google Scholar] [CrossRef]
- Xue, C.; Zhou, Z. Propeller-wing coupled aerodynamic design based on desired propeller slipstream. Aerosp. Sci. Technol. 2020, 97, 105556. [Google Scholar] [CrossRef]
- Clarke, M.A.; Erhard, R.M.; Smart, J.T.; Alonso, J. Aerodynamic optimization of wing-mounted propeller configurations for distributed electric propulsion architectures. In Proceedings of the AIAA Aviation 2021 Forum, Virtual Event, 2–6 August 2021; p. 2471. [Google Scholar]
- Le Chuiton, F. Actuator disc modelling for helicopter rotors. Aerosp. Sci. Technol. 2004, 8, 285–297. [Google Scholar] [CrossRef]
- Li, B.; Lu, H.; Deng, S. Validation of an actuator disk model for numerical simulation of propeller. Proc. Inst. Mech. Eng. Part G J. Aerosp. Eng. 2015, 229, 1454–1463. [Google Scholar] [CrossRef]
- Patterson, M.D. Conceptual Design of High-Lift Propeller Systems for Small Electric Aircraft. Ph.D. Thesis, Georgia Institute of Technology, Atlanta, GA, USA, 2016. [Google Scholar]
- Deb, K.; Agrawal, S.; Pratap, A.; Meyarivan, T. A fast elitist non-dominated sorting genetic algorithm for multi-objective optimization: NSGA-II. In Proceedings of the Parallel Problem Solving from Nature PPSN VI: 6th International Conference, Paris, France, 18–20 September 2000; pp. 849–858. [Google Scholar]
- Deb, K.; Goel, T. Controlled elitist non-dominated sorting genetic algorithms for better convergence. In Proceedings of the International Conference on Evolutionary Multi-Criterion Optimization, Leiden, The Netherlands, 20–24 March 2023; pp. 67–81. [Google Scholar]
- Deb, K.; Pratap, A.; Agarwal, S.; Meyarivan, T. A fast and elitist multiobjective genetic algorithm: NSGA-II. IEEE Trans. Evol. Comput. 2002, 6, 182–197. [Google Scholar] [CrossRef]


| Relative Radius | Local Blade Angle | c/R | Relative Thickness |
|---|---|---|---|
| 0.2 | 39.88° | 0.107 | 0.350 |
| 0.3 | 30.70° | 0.144 | 0.274 |
| 0.4 | 26.60° | 0.169 | 0.204 |
| 0.5 | 23.00° | 0.178 | 0.171 |
| 0.6 | 19.80° | 0.172 | 0.154 |
| 0.7 | 17.00° | 0.159 | 0.146 |
| 0.8 | 14.65° | 0.139 | 0.140 |
| 0.9 | 13.00° | 0.117 | 0.135 |
| 1.0 | 12.00° | 0.092 | 0.130 |
| Case | Relative Error, % | ||
|---|---|---|---|
| 1 | 0.0655 | 0.0639 | 2.43 |
| 2 | 0.0560 | 0.0538 | 3.93 |
| Number of Grids | Cl | Cd |
|---|---|---|
| 1 million | 0.8872 | 0.06092 |
| 1.5 million | 0.8896 | 0.06111 |
| 2 million | 0.8929 | 0.06188 |
| Attribute | Setup |
|---|---|
| Grid type | Tetrahedral unstructured mesh |
| Minimum mesh size | 0.65 mm |
| Grid number | 1,472,398 |
| Y+ | 1.0 |
| Angle of Attack/° | Case | Direction of Rotation | Cl | Cd |
|---|---|---|---|---|
| 3 | RH: −0.1 m | clockwise | 0.3391049 | 0.0860269 |
| 2C2A | 0.30233191 | 0.082231 | ||
| RH: 0 m | clockwise | 0.88957623 | 0.061112 | |
| 2C2A | 0.84635478 | 0.061083 | ||
| RH: 0.1 m | clockwise | 1.1407378 | 0.090186 | |
| 2C2A | 1.1460909 | 0.095574 | ||
| LD: 0.1 m | clockwise | 0.88957623 | 0.061112 | |
| 2C2A | 0.84635478 | 0.061083 | ||
| LD: 0.4 m | clockwise | 0.96076316 | 0.04753 | |
| 2C2A | 0.89923285 | 0.047207 | ||
| 6 | RH: −0.1 m | clockwise | 0.7882753 | 0.108963 |
| 2C2A | 0.75482708 | 0.105429 | ||
| RH: 0 m | clockwise | 1.2923487 | 0.071081 | |
| 2C2A | 1.2427707 | 0.071087 | ||
| RH: 0.1 m | clockwise | 1.375486 | 0.098888 | |
| 2C2A | 1.3825217 | 0.106183 | ||
| LD: 0.1 m | clockwise | 1.2923487 | 0.071081 | |
| 2C2A | 1.2427707 | 0.071087 | ||
| LD: 0.4 m | clockwise | 1.468224 | 0.080024 | |
| 2C2A | 1.4113702 | 0.079364 | ||
| 9 | RH: −0.1 m | clockwise | 1.2209848 | 0.142 |
| 2C2A | 1.1773036 | 0.13772 | ||
| RH: 0 m | clockwise | 1.6863144 | 0.085733 | |
| 2C2A | 1.629571 | 0.085745 | ||
| RH: 0.1 m | clockwise | 1.5740664 | 0.126201 | |
| 2C2A | 1.5249141 | 0.132127 | ||
| LD: 0.1 m | clockwise | 1.6863144 | 0.085733 | |
| 2C2A | 1.629571 | 0.085745 | ||
| LD: 0.4 m | clockwise | 1.9705575 | 0.089835 | |
| 2C2A | 1.9157836 | 0.089122 |
| Parameter | |
|---|---|
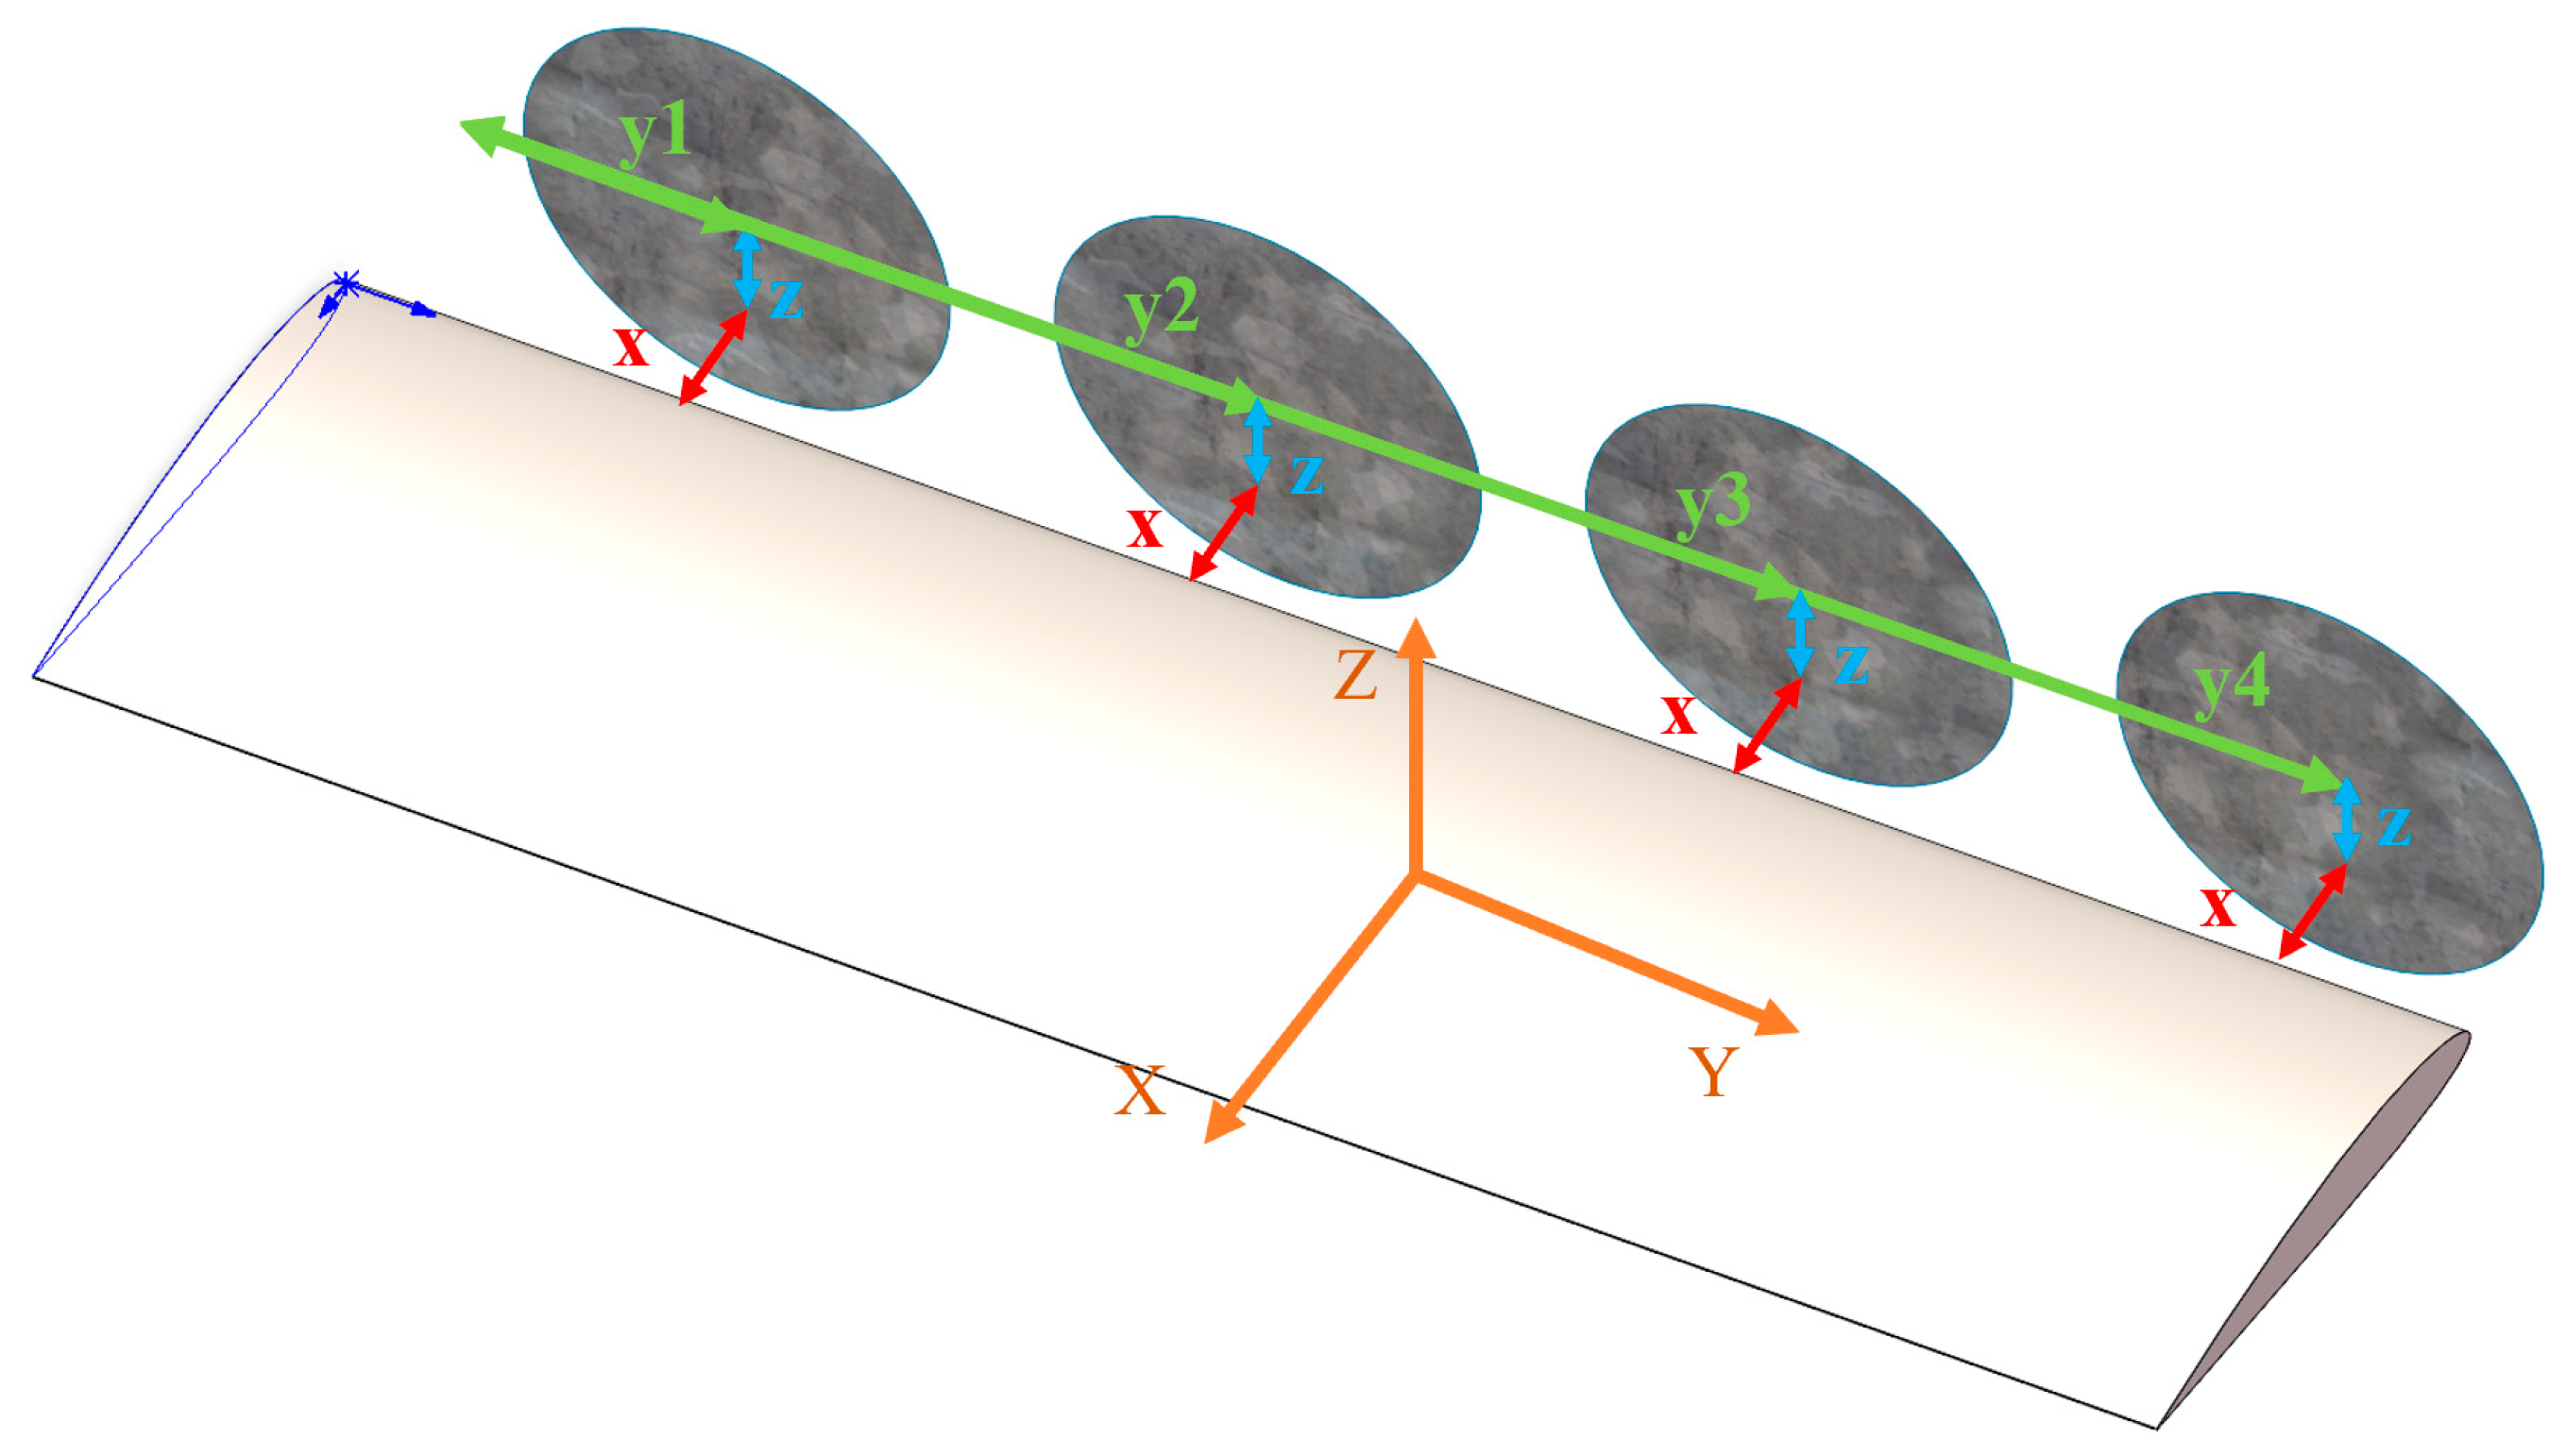
| Design variables (input of algorithm) | Relative height (“z”); Leading-edge distance (“x”); Propeller position in the y-direction(“y1”;“y2”;“y3”;“y4”) |
| Optimization objective (output of algorithm) | Lift coefficient; lift/drag ratio |
| Population size | 12 |
| Number of generations | 6 |
| x (m) | z (m) | y1 (m) | y2 (m) | y3 (m) | y4 (m) | |
|---|---|---|---|---|---|---|
| Before optimization | 0.1 | 0 | 0.25 | 0.75 | 1.25 | 1.75 |
| Optimized | 0.372 | 0.156 | 0.262 | 0.787 | 1.313 | 1.839 |
| Cl | Cd | Cl/Cd | |
|---|---|---|---|
| The initial | 0.88958 | 0.06531 | 13.62089 |
| The optimized | 1.165133 | 0.07969 | 14.62119 |
| Difference | 30.97% | 22.02% | 7.34% |
| Region | Components | Attributes and Functions |
|---|---|---|
| a | Eight 10-inch diameter propellers | Provide flow to simulate the test |
| b | Honeycomb plate | 7.5 mm aperture, retain the axial-induced speed of the front propellers, isolate the tangential induced speed, and provide uniform incoming flow |
| c | “Propeller + wing” model | / |
| d | Rotation area | Change the wing mounting angle |
| e | Sliding area | Change the height and the horizontal distance of the wing |
Disclaimer/Publisher’s Note: The statements, opinions and data contained in all publications are solely those of the individual author(s) and contributor(s) and not of MDPI and/or the editor(s). MDPI and/or the editor(s) disclaim responsibility for any injury to people or property resulting from any ideas, methods, instructions or products referred to in the content. |
© 2023 by the authors. Licensee MDPI, Basel, Switzerland. This article is an open access article distributed under the terms and conditions of the Creative Commons Attribution (CC BY) license (https://creativecommons.org/licenses/by/4.0/).
Share and Cite
Cao, M.; Liu, K.; Wang, C.; Wei, J.; Qin, Z. Research on the Distributed Propeller Slipstream Effect of UAV Wing Based on the Actuator Disk Method. Drones 2023, 7, 566. https://doi.org/10.3390/drones7090566
Cao M, Liu K, Wang C, Wei J, Qin Z. Research on the Distributed Propeller Slipstream Effect of UAV Wing Based on the Actuator Disk Method. Drones. 2023; 7(9):566. https://doi.org/10.3390/drones7090566
Chicago/Turabian StyleCao, Mingzhi, Kun Liu, Chunqiang Wang, Jingbo Wei, and Zijie Qin. 2023. "Research on the Distributed Propeller Slipstream Effect of UAV Wing Based on the Actuator Disk Method" Drones 7, no. 9: 566. https://doi.org/10.3390/drones7090566
APA StyleCao, M., Liu, K., Wang, C., Wei, J., & Qin, Z. (2023). Research on the Distributed Propeller Slipstream Effect of UAV Wing Based on the Actuator Disk Method. Drones, 7(9), 566. https://doi.org/10.3390/drones7090566