Article

Tassel-YOLO: A New High-Precision and Real-Time Method for Maize Tassel Detection and Counting Based on UAV Aerial Images

1
College of Information Engineering, Sichuan Agricultural University, Ya’an 625000, China
2
College of Mechatronics, Sichuan Agricultural University, Ya’an 625000, China
3
Sichuan Key Laboratory of Agricultural Information Engineering, Ya’an 625000, China
4
Ya’an Digital Agricultural Engineering Technology Research Center, Ya’an 625000, China
*
Author to whom correspondence should be addressed.
These authors contributed equally to this work.
Drones 2023, 7(8), 492; https://doi.org/10.3390/drones7080492
Submission received: 29 June 2023 / Revised: 20 July 2023 / Accepted: 24 July 2023 / Published: 27 July 2023

Abstract

:
Tassel is an important part of the maize plant. The automatic detection and counting of tassels using unmanned aerial vehicle (UAV) imagery can promote the development of intelligent maize planting. However, the actual maize field situation is complex, and the speed and accuracy of the existing algorithms are difficult to meet the needs of real-time detection. To solve this problem, this study constructed a large high-quality maize tassel dataset, which contains information from more than 40,000 tassel images at the tasseling stage. Using YOLOv7 as the original model, a Tassel-YOLO model for the task of maize tassel detection is proposed. Our model adds a global attention mechanism, adopts GSConv convolution and a VoVGSCSP module in the neck part, and improves the loss function to a SIoU loss function. For the tassel detection task, the [email protected] of Tassel-YOLO reaches 96.14%, with an average prediction time of 13.5 ms. Compared with YOLOv7, the model parameters and computation cost are reduced by 4.11 M and 11.4 G, respectively. The counting accuracy has been improved to 97.55%. Experimental results show that the overall performance of Tassel-YOLO is better than other mainstream object detection algorithms. Therefore, Tassel-YOLO represents an effective exploration of the YOLO network architecture, as it satisfactorily meets the requirements of real-time detection and presents a novel solution for maize tassel detection based on UAV aerial images.

1. Introduction

As one of the four major crops, maize has been a primary staple food for humans for a long time. According to the statistical data from the United States Department of Agriculture, the global maize production in 2022 was 1,147,522,000 metric tons [1]. The economic benefits of maize directly affect national food security and agricultural production development. During the growth process of maize, the tassel is one of its important reproductive organs and a significant component of the maize plant. The accurate measurement and detection of its quantity and morphology play a crucial role in evaluating maize yields and selecting varieties. The traditional method for detecting maize tassels relies mainly on manual inspection. However, the actual conditions in maize fields are characterized by complexity, where challenges commonly arise during the detection process, including tassel overlapping, variations in tassel size and shape, changes in tassel posture due to environmental factors, and difficulties in identification caused by low light intensity [2]. Manual methods exhibit low efficiency and are prone to errors, and are thus incapable of meeting the demands for large-scale and efficient maize yield assessment. Therefore, an intelligent and efficient method for detecting maize tassels is needed to promote the development of the maize industry towards precision and automation.
Object detection is an important task in the field of computer vision. With the development of deep learning, significant progress has been made in object detection techniques, which has promoted the widespread application of artificial intelligence technology. In 2023, Chen et al. improved the attention mechanism and loss function based on YOLOv7 to reduce information diffusion and amplify global interactive representation in the model. The improved model improves [email protected] to 95.1% in the task of wetland bird detection [3]. Zhao et al. proposed a multi-scale UAV image object detection model called MS-YOLOv7, which combines the Swin Transformer unit and integrates a new pyramid pooling module called SPPFS into the network. Compared with the original model YOLOv7, MS-YOLOv7 has an mAP improvement of 6%, which improves the performance of object detection in UAV aerial imaging [4].
In recent years, many researchers have applied deep learning and computer vision techniques to the detection of maize tassels. In 2020, Zou et al. established the maize tassel detection and counting dataset and proposed the TasselNet model reconstructed with ResNet34 as the backbone network, achieving promising counting performance [5]. Liu et al. created a dataset using images of different resolutions collected using drones, smartphones, and independent datasets and evaluated the accuracy of detecting maize tassels using an improved Faster R-CNN algorithm [6]. In 2021, Ji et al. proposed a coarse-to-fine mechanism for detecting maize tassels, which was implemented through continuous image acquisition and applied to a large area, providing new ideas for tassel detection [7]. Mirnezami et al. captured close-up images of maize tassels and utilized a deep learning algorithm for tassel detection, classification, and segmentation. Then, they employed image processing techniques to crop the main spikelets of the tassel for tracking reproductive development [8]. Falahat et al. proposed a maize tassel detection and counting technique based on an improved YOLOv5n network, which includes applying an attention mechanism to the backbone and using deep convolution at the neck to enable the model to learn more complex features and to better detect tassels; the improved model increased the [email protected] by 6.67% [9]. The work of the aforementioned researchers has, to some extent, propelled the intelligent development of agriculture, as it has presented their insights in various aspects such as datasets, detection methods, and algorithm optimization. However, the actual situation in maize fields is complex, and a more precise, lightweight, and faster model has always been the pursuit of object detection. Therefore, there is still room for improvement in the current maize tassel detection work.
This paper presents a large and high-quality dataset containing over 40,000 individual images of maize tassels at the tasseling stage for the purpose of tassel detection. The dataset comprises diverse tassel states, including overlapping, varied poses, and low-lighting conditions. We applied the fast and accurate features of YOLOv7 to the detection of maize tassels and incorporated the global attention mechanism into its neck part [10]. In addition, we adopted GSConv lightweight convolution and a VoVGSCSP module and improved the loss function to SIoU [11], proposing a novel model named Tassel-YOLO. The experimental results demonstrate that the Tassel-YOLO has achieved favorable performance in terms of detection, counting, and inference speed, validating the effectiveness of the model in the task of maize tassel detection.

2. Related Work

2.1. YOLO Model

The YOLO (You Only Look Once) series algorithms are a typical type of one-stage object detection algorithms that combine classification and object localization regression problems using anchor boxes, achieving high efficiency, flexibility, and good generalization performance, as illustrated in Figure 1 [12]. The YOLO series algorithms represent a milestone in the history of one-stage object detection, and their subsequent improved versions have further enhanced detection performance. The YOLOv7 algorithm, proposed by Chien-Yao Wang et al. in July 2022, has achieved favorable results in terms of both speed and accuracy and is currently one of the mainstream object detection algorithms [13]. Considering the high density of maize planting and the requirement for real-time detection, we have chosen the advanced YOLOv7 model for experiments.

2.2. Global Attention Mechanism

In computer vision, the attention mechanism is a technique that mimics the human visual system by learning and adaptively selecting feature regions relevant to the current task, thus enhancing the feature extraction ability of the model in complex backgrounds [14]. The Global Attention Mechanism (GAM), proposed by Yichao Liu et al. in 2021, consists of channel attention and spatial attention, as shown in Figure 2 [10]. The channel-attention submodule calculates the importance of each channel of the input image through the network [15], thereby improving the feature representation ability, while the spatial-attention submodule accurately analyzes the spatial data of the image, helping the machine to understand the content and spatial structure of the visual image [16]. The GAM introduces multi-layer perceptrons and three-dimensional convolutional spatial and channel-attention submodules, reducing information dispersion and amplifying global interaction representation, thereby improving the overall performance of the model. However, this also leads to the disadvantage of high computational complexity.
The main process of the channel-attention submodule is illustrated in Figure 3. For the input feature map, the first step is to perform dimension transformation, utilizing a 3D arrangement to retain information across three dimensions. The dimension-transformed feature map is then fed into a two-layer Multi-Layer Perceptron (MLP) with a reduction ratio of r, implemented as an encoder–decoder structure. The output of the MLP processing is transformed back to the original dimensions and finally passed through a Sigmoid function to obtain the final output.
The main process of the spatial-attention submodule is illustrated in Figure 4. The input feature map is initially subjected to a 7 × 7 convolution operation to reduce the number of channels, employing the same reduction ratio r as the channel attention, to facilitate spatial information fusion. Subsequently, a convolution operation with a kernel size of 7 is applied to maintain consistency in the number of channels. Finally, the output is obtained by applying a Sigmoid function. In this process, to prevent information loss and further preserve feature maps, the max pooling operation is excluded.
In this study, we additionally utilized the SE attention mechanism and the CBAM attention mechanism for performance comparison. The SE attention mechanism operates by sequentially applying squeeze and excitation operations to the input feature maps, enabling the model to learn the relationships among different channels of the output feature map and obtain weights for individual channels [17]. These weights are then multiplied with the original feature maps to derive the final features. This mechanism allows the model to focus more on the features of channels with higher information content. The advantage of the SE attention mechanism lies in its high computational efficiency and its applicability to networks of various scales. However, the SE attention mechanism only considers the feature relationships in the channel dimension and may not be able to finely adjust the information in the spatial dimension. Similar to the GAM module, CBAM consists of a channel-attention submodule and a spatial-attention submodule [18]. Upon the input of the feature maps, it first undergoes channel attention. This involves performing global average pooling and global maximum pooling based on the width and height of the feature maps, followed by a multi-layer perceptron to obtain attention weights for the channels. These weights are then normalized using the sigmoid function to obtain normalized attention weights. Finally, the original input feature maps are channel-wise weighted through element-wise multiplication and added to the original input feature maps, completing the re-calibration of the original features with channel attention. The advantage of the CBAM attention mechanism is the ability to effectively extract relevant features in both spatial and channel dimensions, thereby enhancing the network’s attention to target regions. However, CBAM has a relatively high demand for computational resources, which may increase the computational complexity of the network and result in performance bottlenecks for large-scale networks and high-resolution images.

2.3. Gsconv

Typically, the design of lightweight networks tends to favor the use of Depthwise Separable Convolutions (DSC), which offer high computational efficiency [19]. However, during computation, DSC separates channel information from the input image, leading to a significant reduction in the feature extraction and fusion capabilities of DSC. To address this issue, this paper draws on related research on lightweight networks and introduces a hybrid convolution method called GSConv [20]. Compared with the regular convolution, the advantage of GSConv lies in preserving the hidden connections between channels to the maximum extent while maintaining a low time complexity, reducing information loss, and accelerating the computation speed. As a result, it achieves the unified solution of standard convolution (SC) and DSC. However, the disadvantage is that it may cause certain information loss.
The GSconv module is primarily composed of the Conv module, DWConv module, Concat module, and Shuffle module. As shown in Figure 5, let the number of channels in the input feature map be C1. Deep depthwise separable convolution is applied to half of the channels, while regular convolution is applied to the other half. The outputs of both convolutions are concatenated for feature fusion. Subsequently, the information generated by SC is permeated through shuffle to various parts of the information generated by DSC. Finally, the output channel number in the feature map is C2. The mathematical expression of the GSconv module is given by Equation (1).
X o u t = f s h u f f l e ( c a t ( f c o n v X i n , f d s c ( f c o n v ( X i n ) ) ) )

3. Methods

3.1. Tassel-YOLO Model Architecture

As one of the current mainstream object detection algorithms, YOLOv7 has achieved favorable results in terms of both speed and accuracy. Considering the high density of maize planting and the requirement for real-time detection, we chose YOLOv7 as the base model for our study. The design philosophy of YOLOv7 is similar to those of YOLOv4 and YOLOv5 [21], in which the size of the input images will be compressed to the same size before being fed into the network. In the backbone part, the CBS module, ELAN module, and MP module are employed for feature extraction. The neck part mainly consists of a Path Aggregation Feature Pyramid Network (PAFPN) structure and an SPPCSP module, where the SPPCSP module includes a concatenation operation after the SPP module to fuse the feature maps before the SPP module, enriching the feature information [22]. The network performs bidirectional fusion in both top-down and bottom-up directions to accelerate the information interaction across different layers, thus achieving the efficient fusion of features at different levels, and outputting three feature maps with different shapes. Finally, the feature maps are fed into the head part to obtain prediction results.
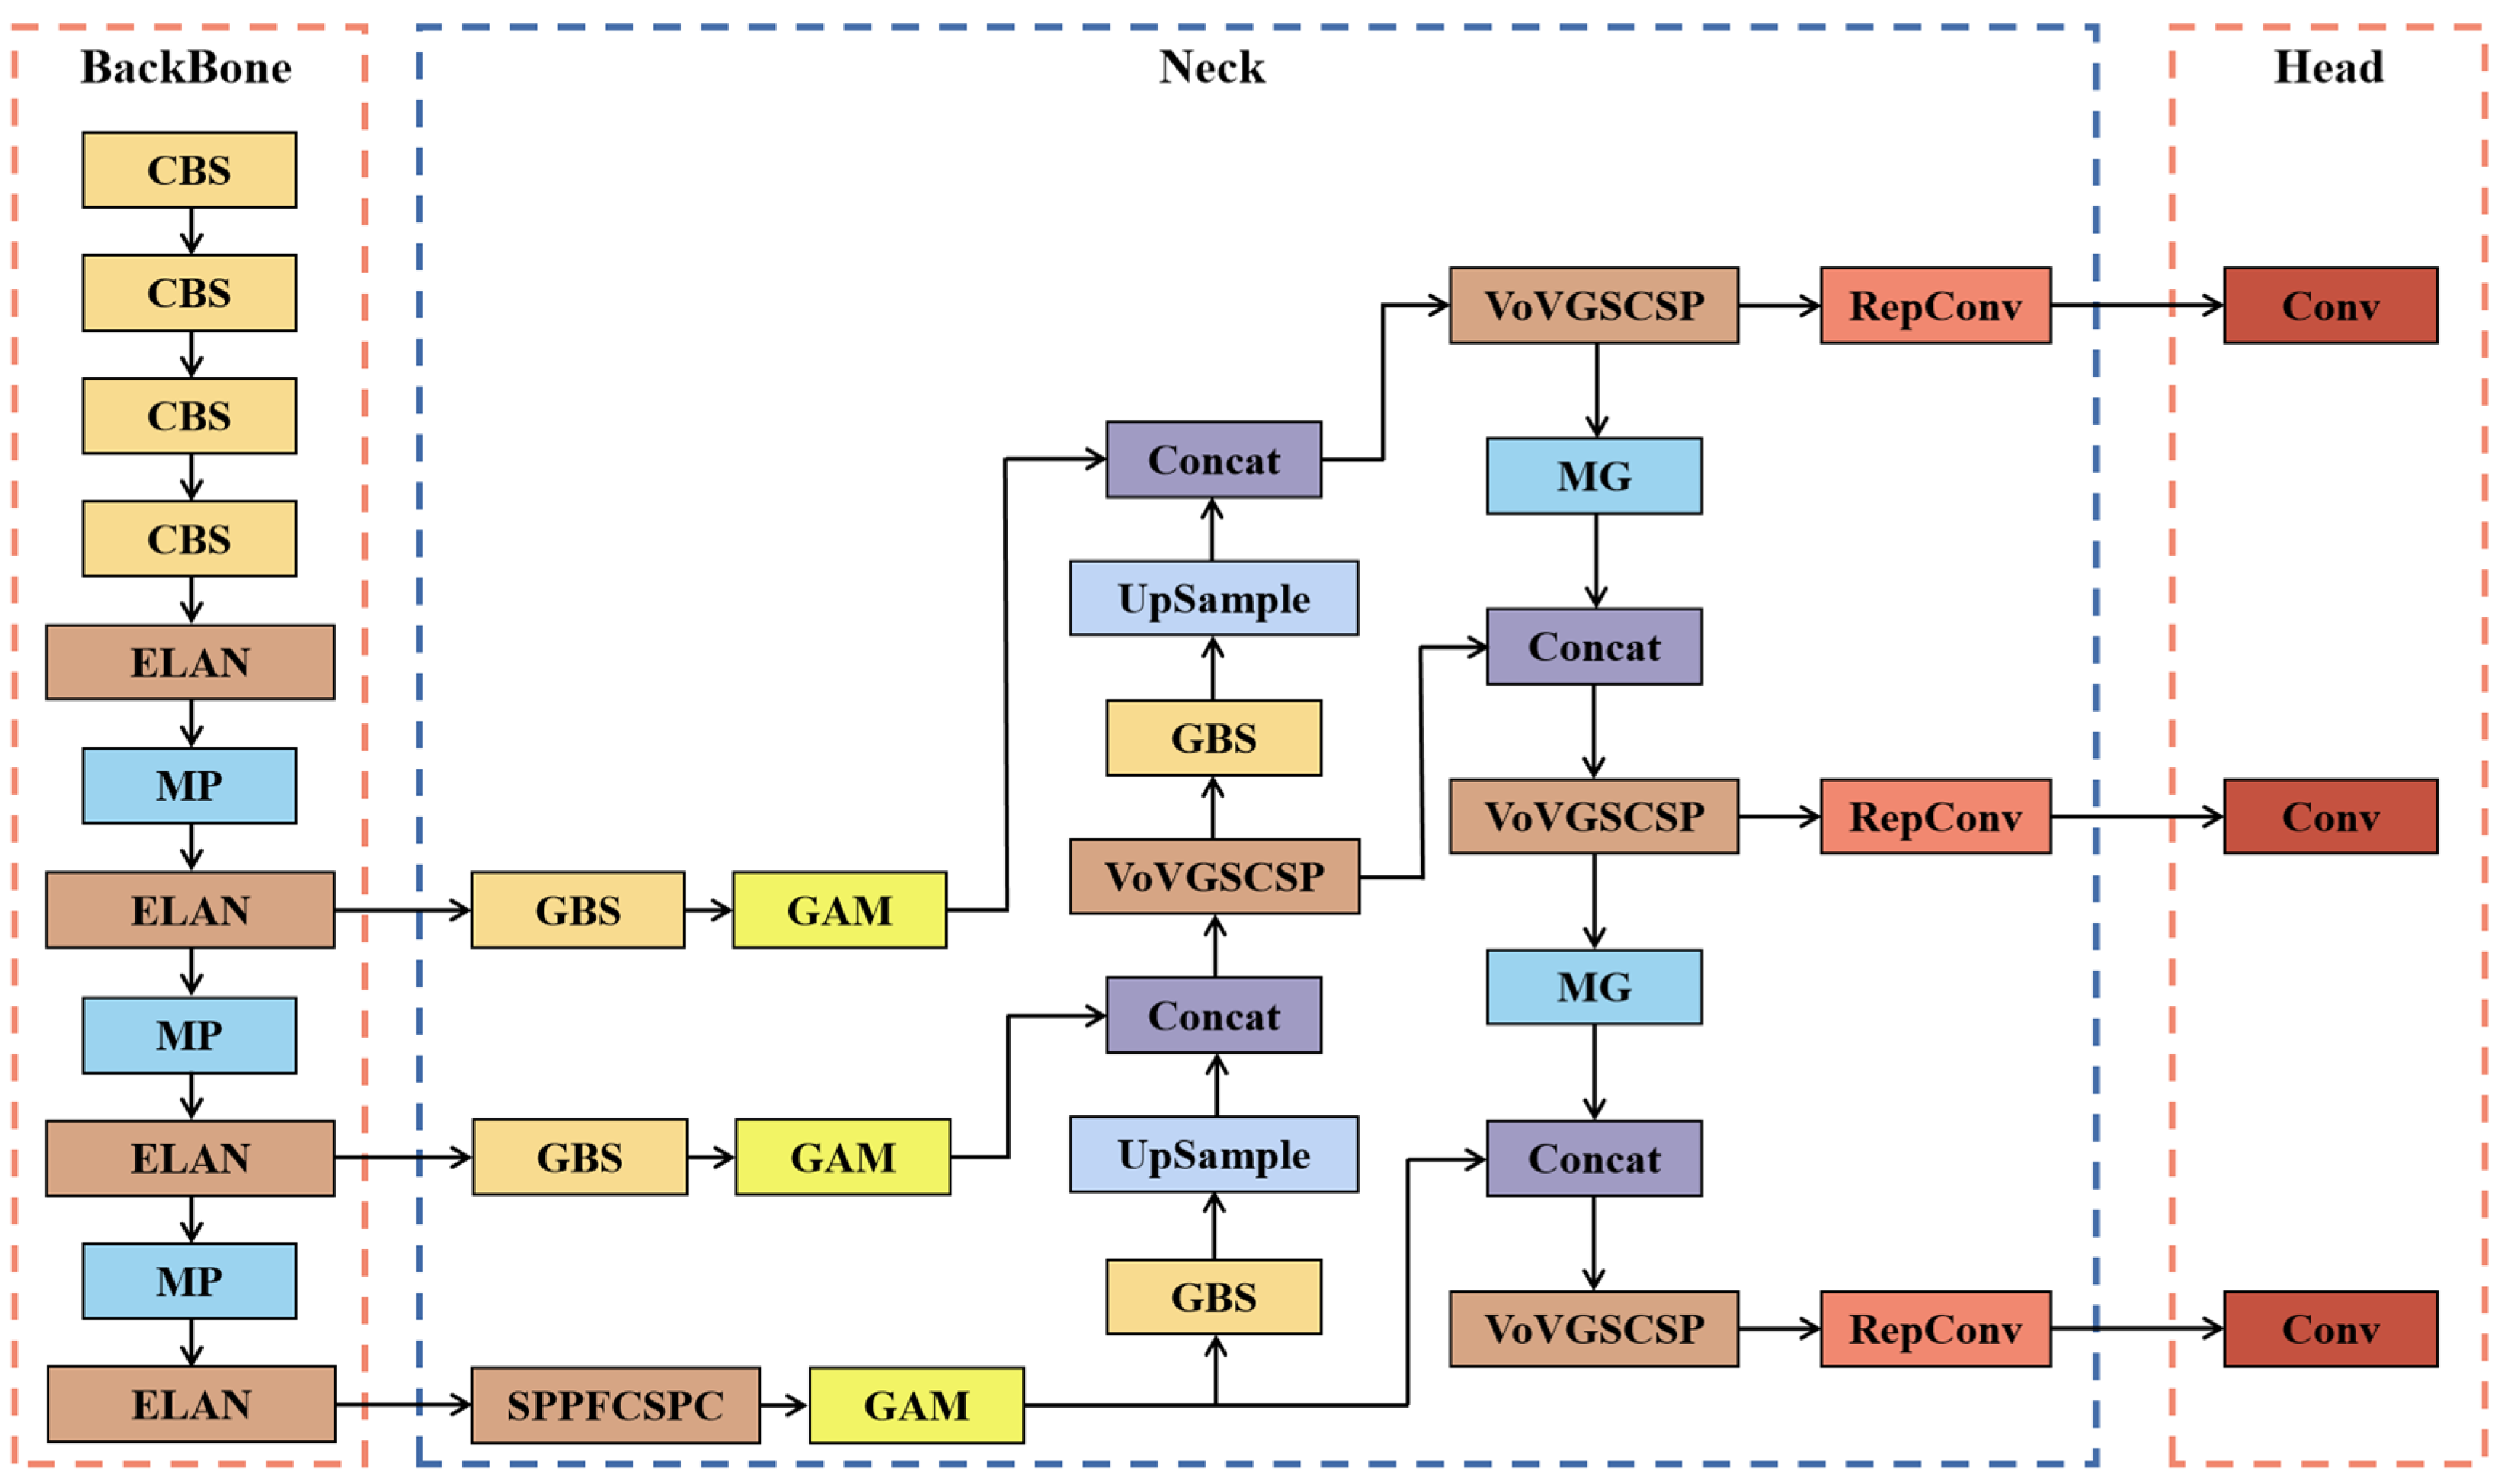
Tassel-YOLO is an improved model based on YOLOv7 for the task of maize tassel detection, and its specific structure is shown in Figure 6. The basic framework of Tassel-YOLO can be divided into four parts: Input, Backbone, Neck, and Head.
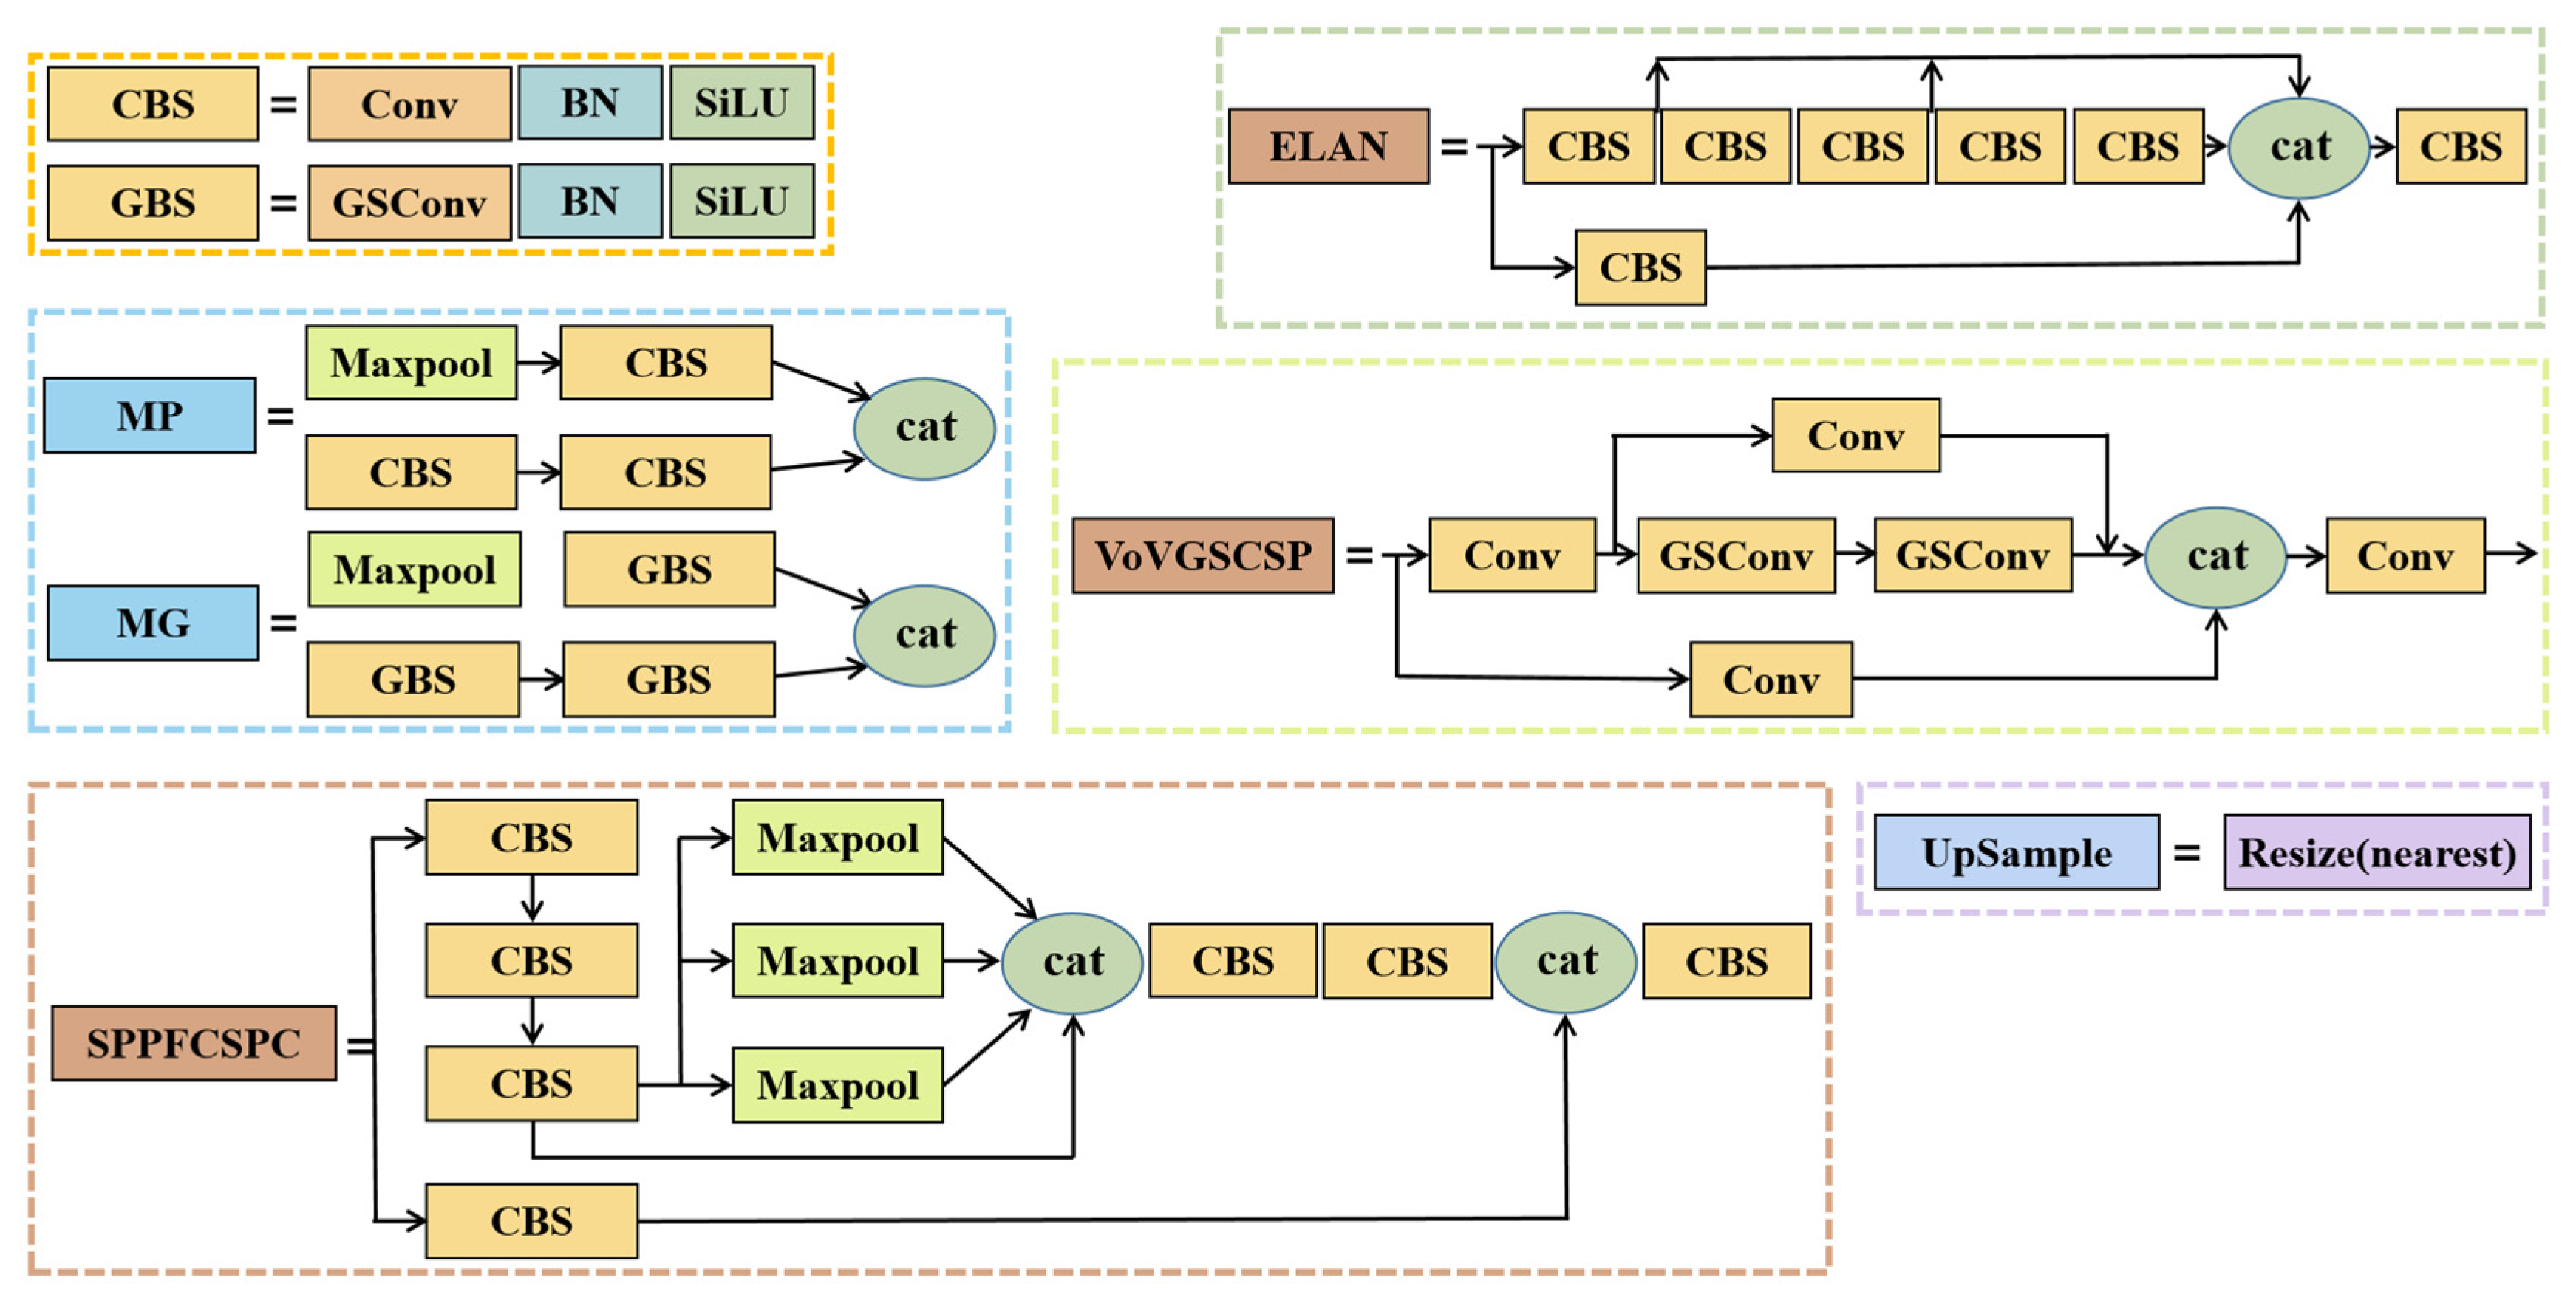
The input section of the Tassel-YOLO network is mainly responsible for image scaling, data augmentation, adaptive anchor calculation, and adaptive image scaling. The default input image size is 640 × 640 × 3. The backbone section consists of CBS modules, ELAN modules, and MP modules. The CBS module includes convolutional layers, batch normalization (BN) layers, and SiLU activation functions. The input image first passes through four CBS modules, and then alternates through four ELAN modules and three MP modules to achieve feature extraction. Due to the large computational resources consumed by traditional convolutional algorithms, which are not conducive to the lightweight deployment of the model, in the neck section of the network, we replaced the ordinary convolutional layers originally in the neck section of YOLOv7 with lightweight GSConv convolutional layers, effectively reducing the model’s parameters and computational complexity. Our experiments indicate that using GSConv throughout the entire network significantly increases the network depth and reduces the model’s inference speed. Therefore, it is a better choice to use GSConv only at the neck, where the channel information dimension is the largest and the spatial information dimension is the smallest [23]. The original CBS module is replaced by the new GBS module, which consists of GSConv convolutional layers, batch normalization layers, and SiLU activation functions. Using the same improvement method, we improved the CBS module in the original MP module to the GBS module, forming the new MG module. In the feature fusion stage, we introduced the VoVGSCSP module to replace the ELAN-W module in the original model, whose structure is shown in Figure 7. VoVGSCSP is an improvement on the GSConv, where the input feature map is divided into two parts based on the channel number. One part extracts features through the cross structure of Conv and GSConv, while the other part is convolved through a single Conv, acting as a residual connection [20]. Finally, the two parts are fused and connected to the output through Conv convolution. The special structure of VoVGSCSP can easily change the dimension and achieve feature dimensionality reduction, reducing computation. VoVGSCSP has a stronger nonlinear representation than ELAN-W, improving learning efficiency and solving the problems of gradient vanishing and exploding.
To further improve the accuracy of the model, we added the GAM module to the neck part of Tassel-YOLO, with the specific added position shown in Figure 6. The GAM is a type of global attention mechanism that introduces multi-layer perceptron and three-dimensional convolutional spatial-attention and channel-attention submodules. By emphasizing global information related to tassels and reducing information dispersion, the ability of the network to extract tassel features is enhanced, enabling the successful detection of tassels in various environments. In the head part of Tassel-YOLO, we employed the RepConv structure before the head, which was inspired by RepVGG. During training, special residual structures were introduced to assist in training, while in actual prediction, the complex residual structures could be equivalently simplified to a regular convolution, thereby reducing the complexity of the network without compromising its prediction performance. Figure 6 provides a detailed illustration of the network architecture of Tassel-YOLO, while Figure 7 shows the specific composition of the main modules in the network.

3.2. Siou Loss Function

In machine learning, the definition of the loss function plays a crucial role. As a form of penalty, it needs to be minimized during training. The smaller the value of the loss function, the closer the model’s predicted results are to the true results, indicating the better performance of the model. In the field of object detection, traditional IoU losses such as DIoU, CIoU, and GIoU only consider distance, overlap area, and aspect ratio information, while ignoring factors such as shape, angle, and proportion [24]. Therefore, there is a slight overlap between the predicted and target bounding boxes, and the convergence speed is slow [25]. The SIoU loss function has been improved in this aspect by incorporating various penalty terms [11]. Tassel-YOLO adopts the SIoU loss function, and experiments show that SIoU effectively improves the training speed and inference accuracy. The SIoU loss function consists of four components: angle loss, distance loss, shape loss, and IoU loss.

3.2.1. Angle Cost

The angle cost is primarily used to assist in calculating the distance between two bounding boxes and its relationship graph is illustrated in Figure 8a. The definition of angular loss is given by Equation (2).
Λ = 1 2 × s i n 2 arcsin c h σ π 4
where c h represents the difference in height between the predicted box and the ground truth box along the y-axis, and σ represents the Euclidean distance between the predicted box and the ground truth box center points. Their respective definitions are given in Equations (3) and (4):
c h = max b c y g t , b c y min b c y g t , b c y
σ = ( b c x g t b c x ) 2 + ( b c y g t b c y ) 2
where ( b c x g t , b c y g t ) and ( b c x , b c y ) represent the centroid coordinates of the ground truth box and the center coordinates of the predicted box, respectively.

3.2.2. Distance Cost

Given the definition of angle cost provided above, the distance cost is redefined as follows:
Δ = t = x , y 1 e γ ρ t = 2 e γ ρ x e γ ρ y  
ρ x = ( b c x g t b c x c w ) 2 , ρ y = ( b c y g t b c y c h ) 2 , γ = 2 Λ
where c w represents the distance difference between the predicted box and the ground truth box along the x-axis, and γ is associated with the angle loss between the two bounding boxes. It can be observed that the contribution of the distance cost decreases when α 0 ; conversely, the contribution of the distance cost increases when α π 4 .

3.2.3. Shape Cost

The shape cost between two bounding boxes is defined as Equation (7).
Ω = t = w , h ( 1 e w t ) θ
w w = | w w g t | m a x ( w , w g t ) , w h = | h h g t | m a x ( h , h g t )
where w and h represent the width and height of the predicted bounding box, w g t and h g t represent the width and height of the ground truth bounding box, and θ controls the degree of emphasis on the shape cost.

3.2.4. IoU Cost

The definition of the IoU cost is given by Equation (9).
I o U = | B B G T | | B B G T |
The equation indicates that the value of IoU is equal to the ratio of the intersection area between the ground truth box and the predicted box to the union area of the two boxes, as shown in Figure 8b.

3.2.5. SIoU Cost

In conclusion, the SIoU loss is defined as shown in Equation (10). Where I o U represents the IoU cost, Δ represents the distance cost, and Ω represents the shape cost.
L o s s S I o U = 1 I o U + + Ω 2

4. Experimental Material

4.1. The Establishment of the Dataset

The growth stages of the maize tassel include multiple periods such as the tasseling stage, the reproductive stage, and the flowering stage. Among them, the tassel in the tasseling stage appears radial in the aerial image, and in maize fields with higher planting density, the image features of the maize tassel in the tasseling stage are the most obvious and easiest to be manually labeled. Therefore, in our study, the two data collections of the dataset were both completed during the tasseling stage. The dataset used in this study was collected from the maize field located at the Modern Agricultural Research and Development Base of Sichuan Agricultural University in Chengdu, Sichuan Province, China. In June and July 2022, RGB video frame data were captured via an onboard camera of the DJI Mavic drone during two aerial surveys at heights of 5 m and 10 m above ground level. The drone was equipped with a 12-megapixel camera, and the filming path was manually set. The specifications of the video are detailed in Table 1.
The RGB video frames were converted into image frames using the OpenCV library. Every 48 frames, one image frame was captured, and after removing images that did not meet the requirements and performing image segmentation, a total of 960 original datasets with a resolution of 1920 × 1080 were obtained. It should be noted that during the detection phase, the image size will be resized to 640 × 640. After testing, using the OpenCV library to resize a 12 MP and a 1920 × 1080-sized image to 640 × 640 resulted in output images with processing times of 0.812 milliseconds and 0.484 milliseconds, respectively. This indicates that the time required to adjust the image size is very small for images of different resolutions, which meets the real-time detection time requirements. We preprocessed the acquired original dataset using various image preprocessing techniques, including brightness enhancement, contrast enhancement, and image segmentation. Image preprocessing can highlight the features of the images, enable the network to learn more detailed features, and improve the accuracy and speed of the model. Four workers used the graphical image annotation tool LabelImg to draw bounding boxes around the maize tassels in the images [26], with all the pixels of the maize tassels contained within the rectangular boundary. Maize tassels that are indistinguishable by the human eye and have an occlusion area larger than 90% were not labeled. Finally, we obtained a raw dataset consisting of 960 images containing 41,232 maize tassels. To improve the training performance of our model, we performed data augmentation on the dataset.

4.2. Data Augmentation

Data augmentation is a technique in deep learning that expands the original dataset by generating new training data from existing data [27]. In this study, to simulate the real-world environment and enable the network to learn more features, data augmentation was applied to the original dataset. Traditional geometric transformations (rotation, scaling, etc.) and color transformations (color jittering, contrast enhancement, etc.) were used in this experiment [28]. In addition, two multi-image fusion methods, Mosaic and Mixup [21], were employed.
Mosaic was proposed in the YOLOv4 paper, and its principle is as follows: First, four images are randomly selected from the dataset and subjected to data augmentation operations such as flipping, scaling, and color-space transformation. The resulting images are then placed in the upper-left, upper-right, lower-left, and lower-right positions of a larger image with a specified size. Based on the transformation applied to each image, the mapping is correspondingly applied to the image labels. Finally, the large image is stitched together according to the specified coordinates, and the resulting image is used for model training. Mosaic data augmentation can enhance model robustness, augment training data diversity, and alleviate overfitting, leading to improved model performance and generalization capability. The specific process of Mosaic is illustrated in Figure 9.
The process of Mixup involves randomly selecting two samples from the training set and performing a simple random weighted sum on them, while the labels of the samples are correspondingly weighted [29]. Assuming batchx1 is a batch of samples and batchy1 is the corresponding labels, batchx2 is another batch of samples and batchy2 is the corresponding labels. λ is the mixing parameter calculated from the Beta distribution with parameters α and β, and the principal formula of Mixup is obtained accordingly.
λ = B e t a α , β
m i x e d _ b a t c h x = λ × b a t c h x 1 + 1 λ × b a t c h x 2
m i x e d _ b a t c h y = λ × b a t c h y 1 + 1 λ × b a t c h y 2
The term Beta refers to the Beta distribution, mixed_batchx refers to the mixed batch samples, and mixed_batchy refers to the corresponding labels. Mixup data augmentation increases the diversity of the training set by performing linear interpolation between different images and labels to generate new training data.
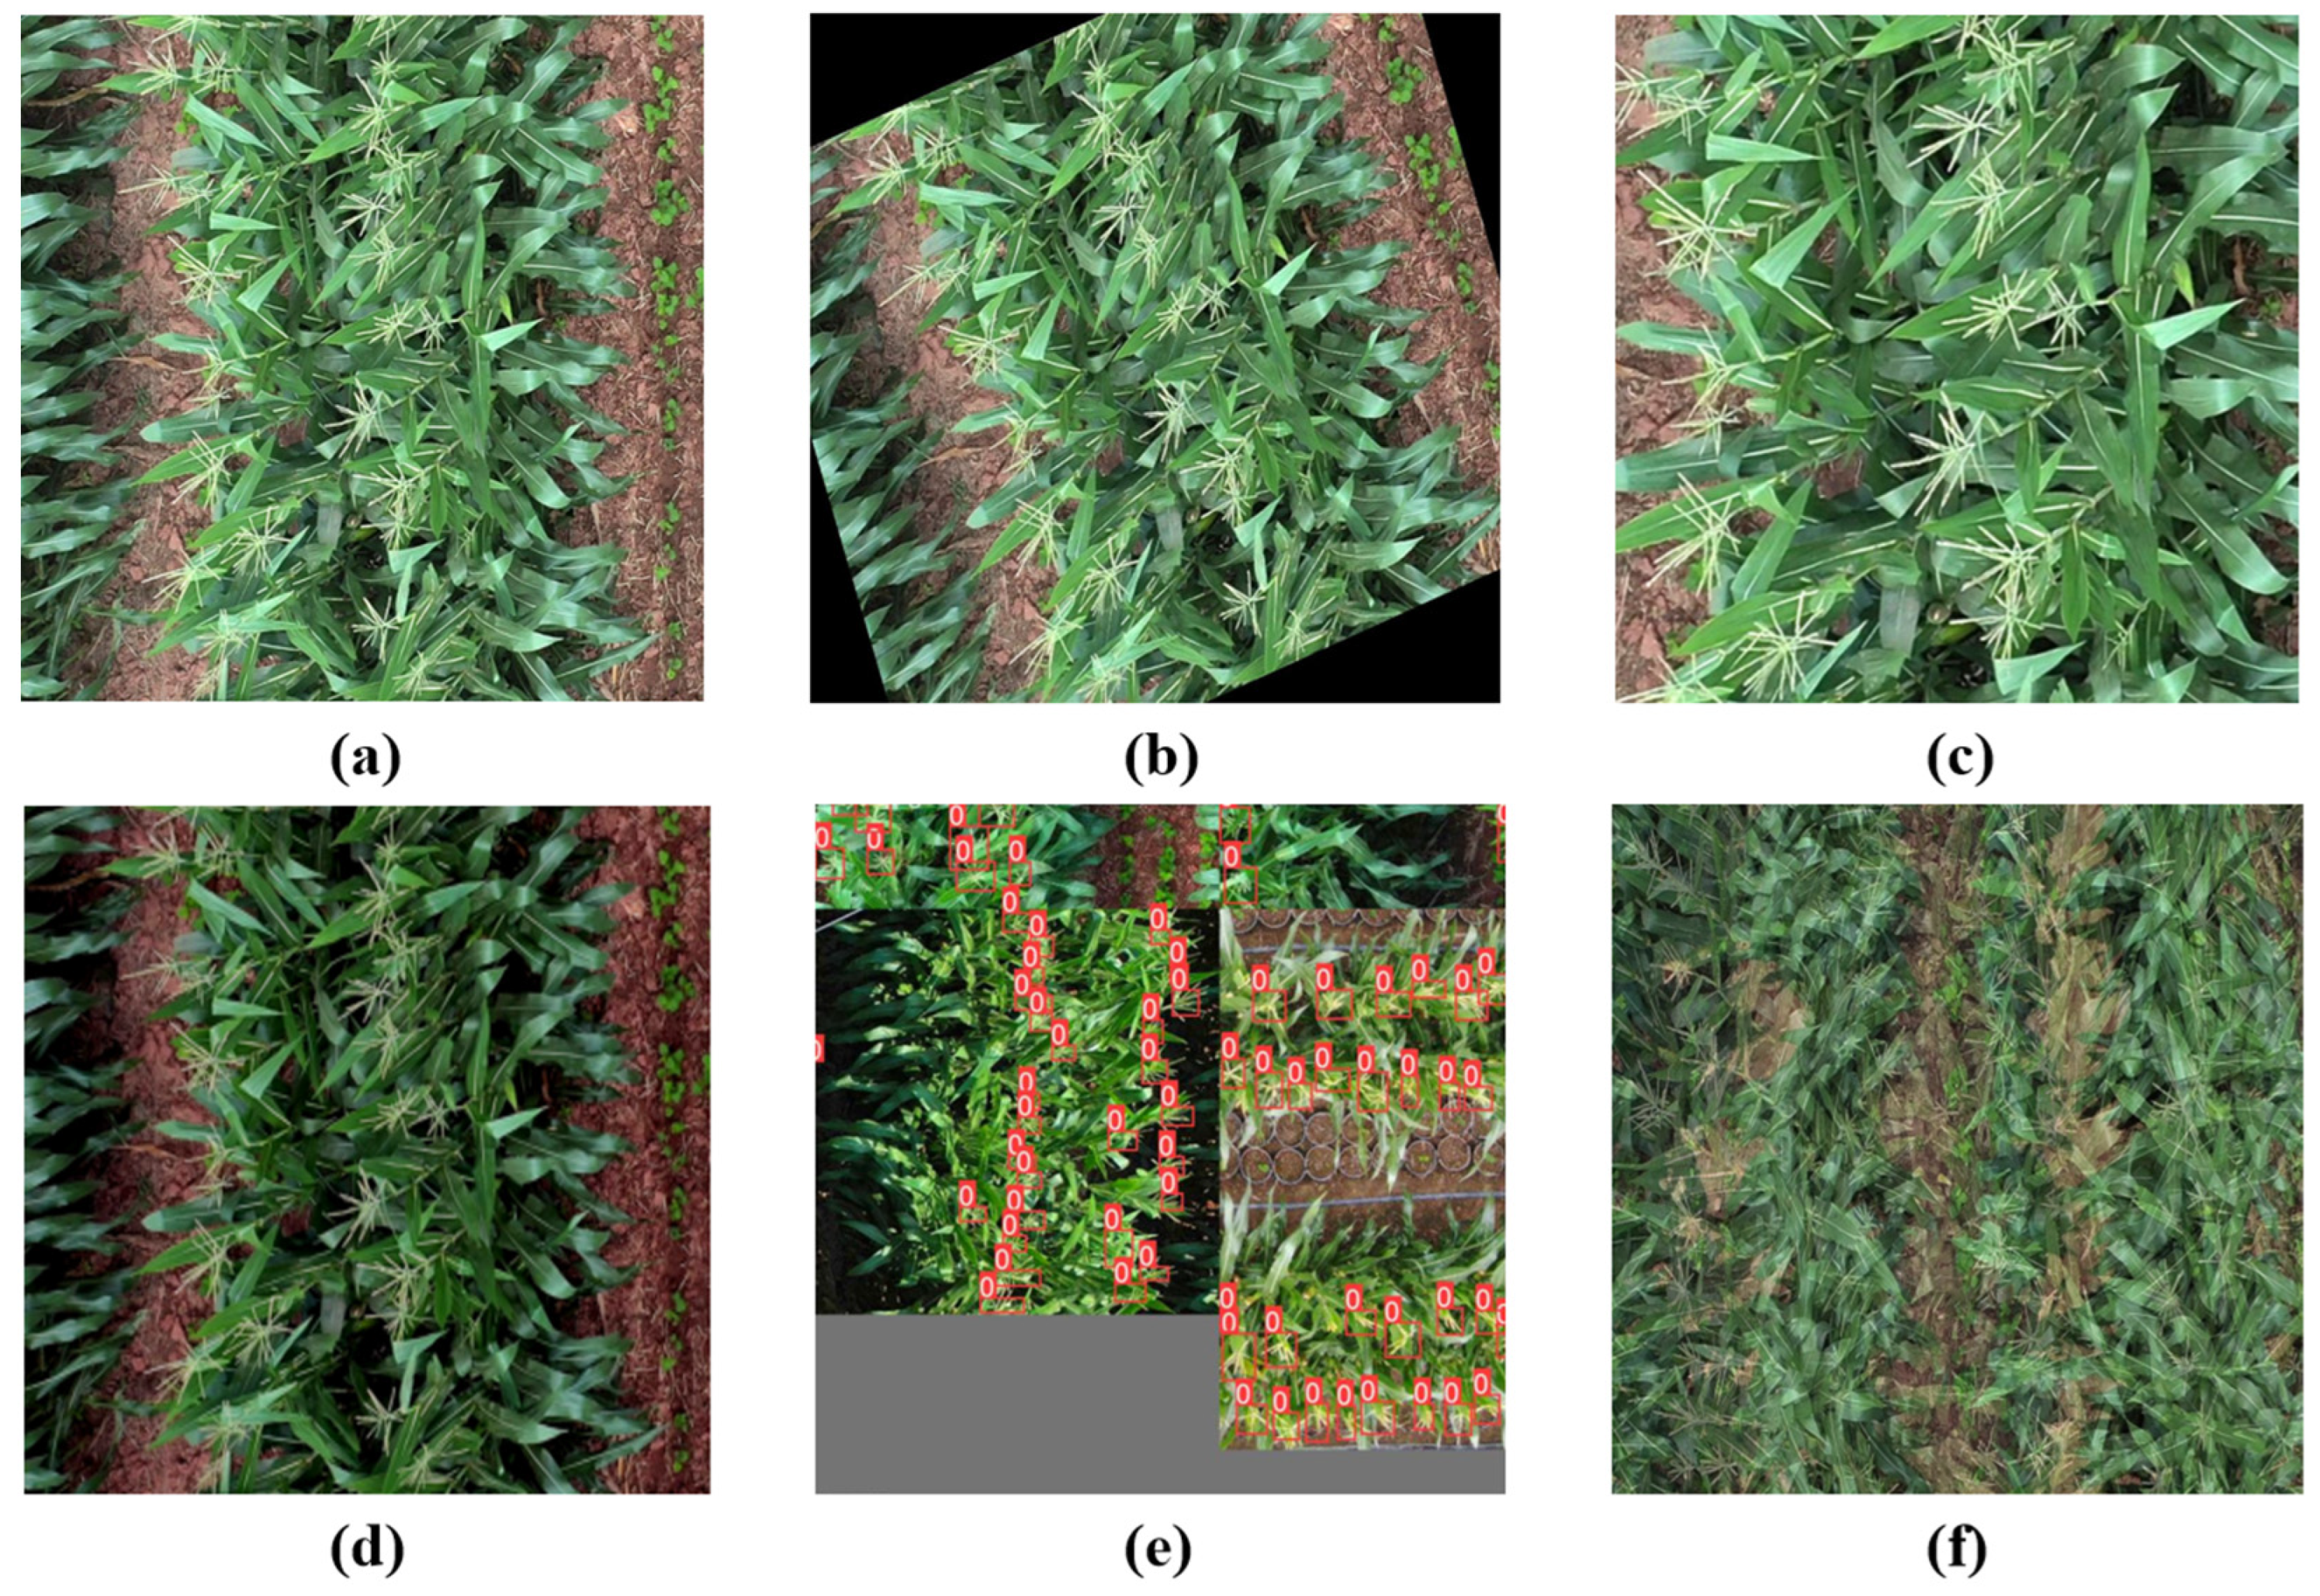
By employing offline augmentation, the dataset was expanded to a total of 1848 images. In the experiment, we randomly partitioned the dataset into training, testing, and validation sets, following an 8:1:1 ratio. The effects of the relevant data augmentation are shown in Figure 10.

5. Experiment Results

5.1. Experimental Platform and Evaluation Indicators

The experiments in this paper were conducted on a computer running an Ubuntu 18.04.5 operating system, with an NVIDIA GeForce RTX 3090 24G GPU and a 15-core Intel(R) Xeon(R) Platinum 8358P CPU @ 2.60GHz. The software environment includes PyTorch 1.8.1, Python 3.8, and Cuda 11.1. For the object detection model, the input size of the images in this study was uniformly set to 640 × 640. The other main parameters were as follows: the initial learning rate was set to 0.01, the momentum was 0.937, the optimizer adopted SGD [30], the weight decay value was 0.0005, the batch size was 8, and the maximum number of iterations was set to 200 rounds.
In this experiment, we evaluated the performance of the algorithm using a series of metrics. Floating Point Operations (FLOPs) were used to measure the complexity of the model, while Frames Per Second (FPS) served as an indicator of detection speed, representing how many images the model can detect per second. To assess the accuracy of tassel detection, relevant metrics were employed for evaluation, with the specific formula as follows:
P = T P T P + F P × 100 %
R = T P T P + F N × 100 %
where TP represents true positives, FP represents false positives, FN represents false negatives, and P represents precision, which refers to the probability that the model correctly detects maize tassels among the objects detected. R represents recall, which measures the ability of the model to detect all the correct maize tassels. F1_Score represents the combined performance of P and R, defined as Equation (16):
F 1 = 2 P R P + R × 100 %
AP stands for average precision, which is obtained by integrating the Precision–Recall curve. The AP value is used to evaluate the performance of a model in each class. mAP stands for mean average precision, which represents the average value of AP across all classes. In this study, since there is only one class for maize tassel, therefore n = 1 and A P = m A P ; the specific formula is as follows:
A P = 0 1 P R d R × 100 %
m A P = 1 n i = 1 n A P i × 100 %
To evaluate the performance of the algorithm in terms of counting accuracy, we denote the ground truth of the number of maize tassels as the Number of Manual Counts (NMC) and the counted value by the algorithm as the Number of Algorithm Counts (NAC) [31]. We define CA as the Counting Accuracy, and MRE as the Mean Relative Error [32], as defined in Equations (19) and (20), respectively.
C A = min ( N M C , N A C ) max ( N M C , N A C )
M R E = 1 n i = 1 n | N A C N M C | N M C

5.2. Training Comparison with Other Models

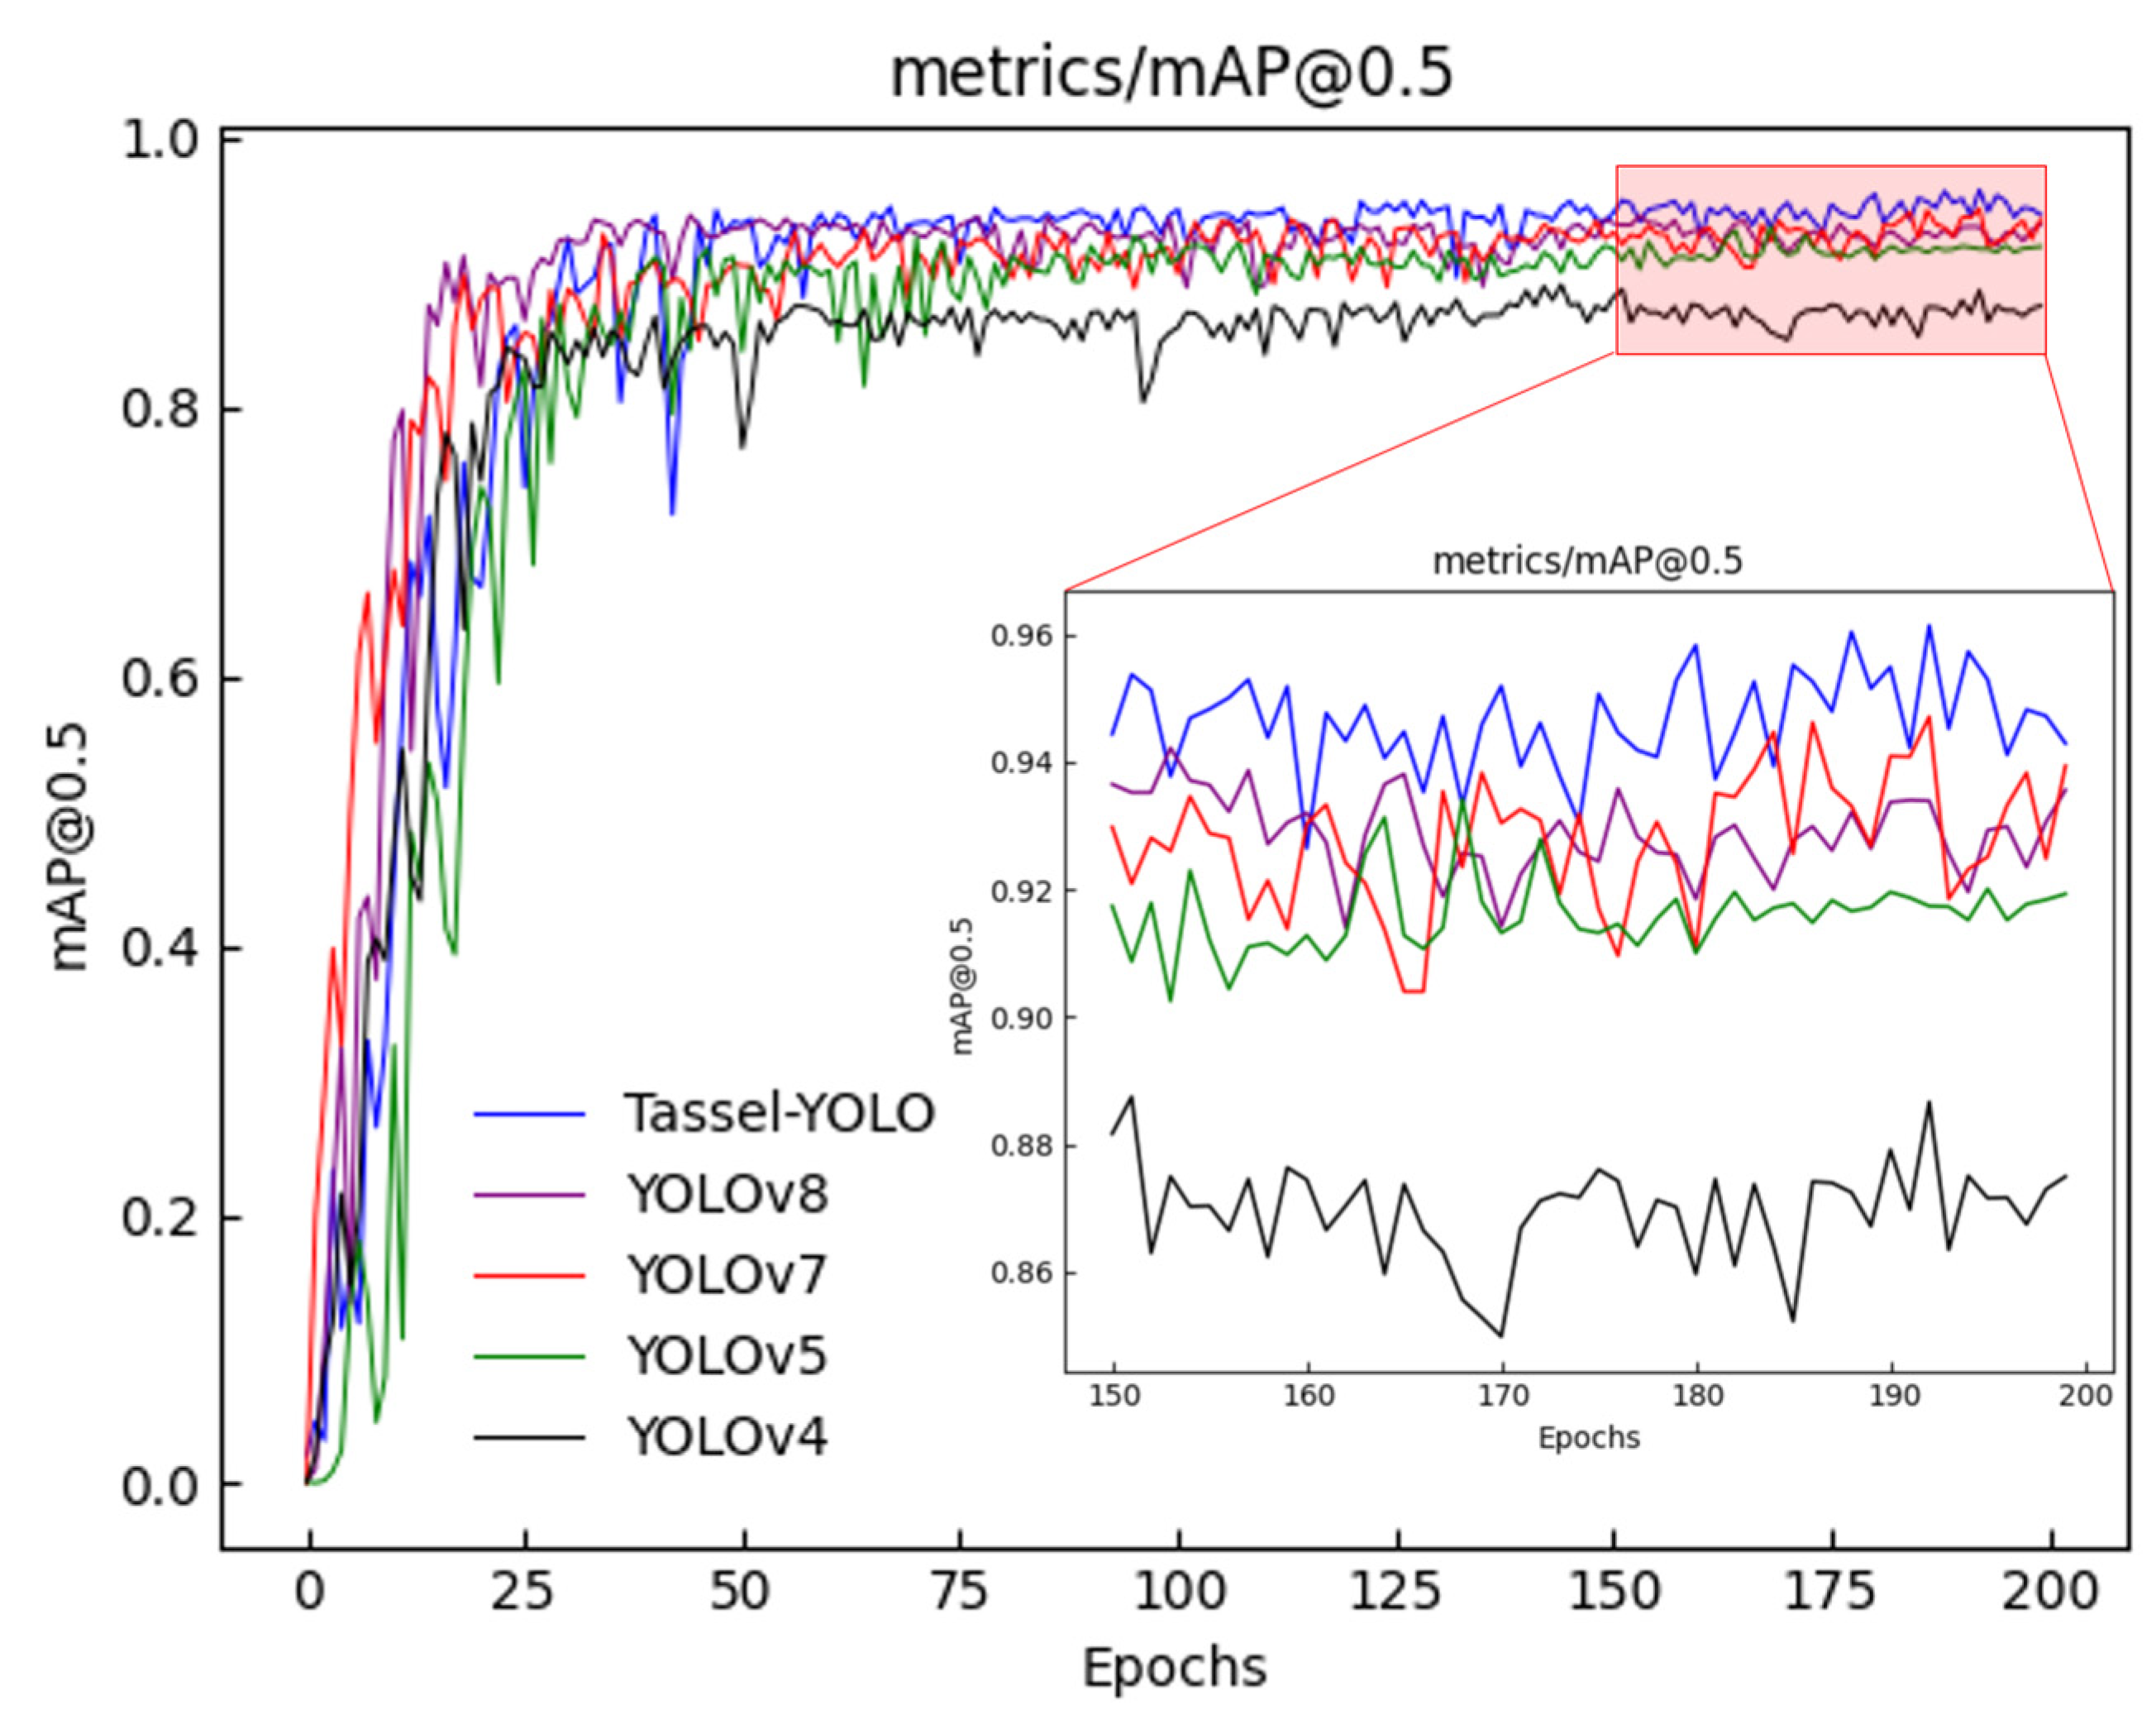
To evaluate the performance of the Tassel-YOLO network, a series of experiments were designed and conducted for validation. The selected comparative networks included YOLOv8, YOLOv7, YOLOv5, and YOLOv4 [33]. The evaluation of model training effectiveness was based on the mean average precision at an intersection over union (IoU) threshold of 0.5 ([email protected]), which served as the evaluation metric. Based on experimental data, a line graph, as shown in Figure 11, was plotted. It can be observed from the graph that as the number of training epochs increases, the [email protected] of various YOLO models gradually increases, reaching its upper limit at around 40 epochs, and the curve stabilizes. It can be observed that Tassel-YOLO achieves significantly higher accuracy compared with other models. Table 2 presents a comparison of experimental results among different models. Tassel-YOLO outperforms the original model YOLOv7, with an improvement of 1.43% in the [email protected] and 1.15% in the F1 score. In addition, FPS, Precision, and Recall values also show corresponding improvements. The detection accuracy of YOLOv8 is slightly inferior to YOLOv7 but superior to YOLOv5. YOLOv8 shows a rapid increase in [email protected] during the early stages of training, but it plateaus around the 40th epoch. YOLOv5 demonstrates the highest detection speed, but its [email protected] is relatively lower. YOLOv4 lags behind other models in both accuracy and inference speed. Overall, Tassel-YOLO demonstrates excellent performance in the maize tassel detection task, indicating the effectiveness of our model in the experiments.

5.3. Counting and Detection Results

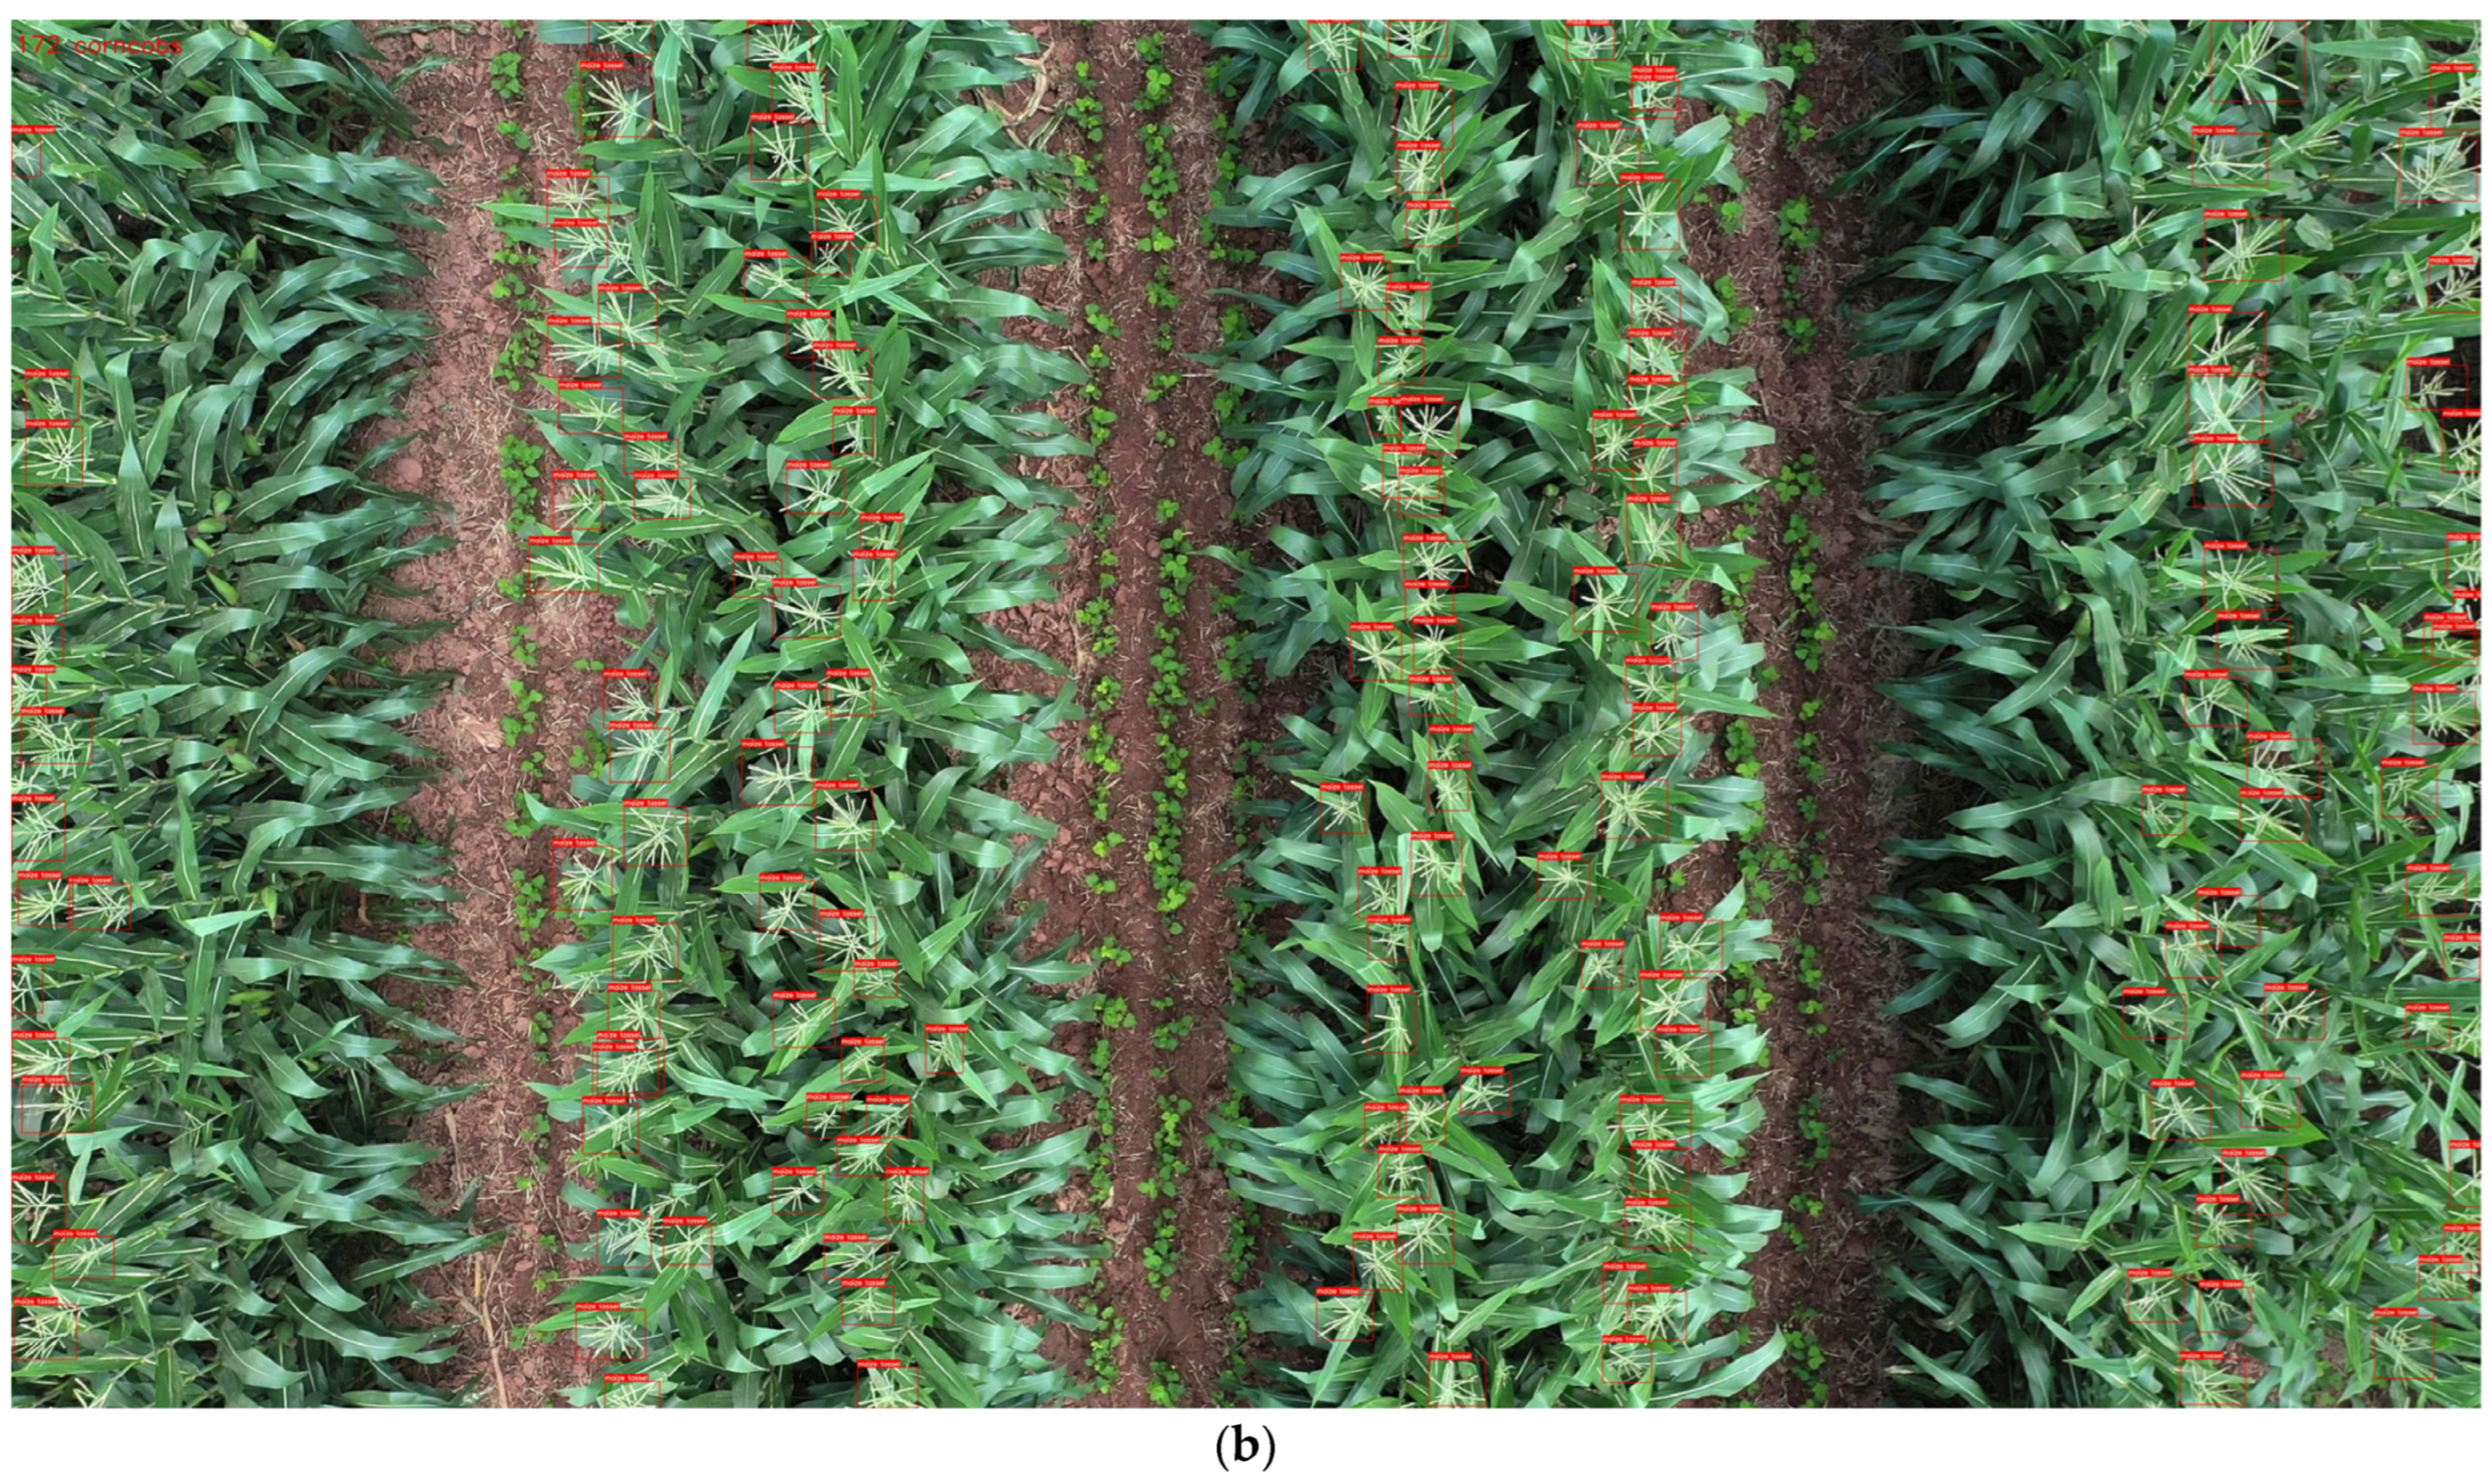
We selected images of maize tassels of varying scales in the test set to simulate images captured by drones at different flying altitudes, in order to evaluate the detection and counting capabilities of different models. It should be noted that a multi-scale training method was adopted during the training process, which resulted in good detection training and performance for maize tassels of different sizes. We conducted four groups of experiments based on the different scales of tassels in the test images, with tassel count distribution ranges of 11~52, 54~96, 102~146, and 149~189, respectively, to simulate the effects of drone imaging at different heights. Each group of experiments consisted of 10 test images. Firstly, the true count of maize tassels on each image was obtained through manual counting and then inputted into different network models to obtain detection and counting results [34]. Table 3 presents the experimental results of the counting performance evaluations for different models. Compared with other YOLO models, Tassel-YOLO exhibits the best counting performance with an average accuracy of 97.55% and the lowest MRE value, indicating lower counting errors compared with other models. It can be observed that as the scale of tassels in the image decreases, the counting accuracy increases. We attribute this to the fact that the tassels in the training images are generally small, which leads to better recognition performance of smaller tassels by the model [33]. Figure 12 displays the partial detection results of the Tassel-YOLO model. It should be noted that Figure 12a,b both show the detection of tassels in a single image captured, with the difference being that the tassels in Figure 12a are larger in size than those in Figure 12b. Note that the image in Figure 12b is not a fusion image of the image in Figure 12a. As shown in the figure, the majority of the maize tassels in the images are accurately detected and assigned high confidence scores, while a few tassels were not recognized due to irregular shapes, large areas occluded by leaves, and significant overlap between adjacent tassels.

5.4. Contrast Experiment Results of Introducing Attention Mechanism

To evaluate the effectiveness of the GAM module, we conducted comparative experiments using the SE attention mechanism and the CBAM attention mechanism. We incorporated three different attention mechanisms at the same locations for experimentation, resulting in models named GAM-YOLOv7, SE-YOLOv7, and CBAM-YOLOv7, as shown in Table 4. It can be observed that compared with the original model, both SE-YOLOv7 and CBAM-YOLOv7 exhibit an increase in model parameters. However, CBAM-YOLOv7 achieves an [email protected] of 94.83%, which is higher than SE-YOLOv7 and the original model. We believe this is because, compared with the SE module, the CBAM module incorporates spatial-attention submodules and an additional parallel max pooling layer in its channel-attention submodule. This augmentation of information encoding enhances the comprehensiveness of the obtained information, leading to improved performance [18].
GAM-YOLOv7 achieved the highest accuracy with an [email protected] of 95.84%, surpassing CBAM-YOLOv7 and the original model by 1.01% and 1.13%, respectively. We attribute this improvement to the fact that compared with the CBAM module, the GAM module considers the importance of cross-dimensional interactions, enhances the interaction between channels and spatial dimensions, and preserves cross-dimensional information. The GAM incorporates attention mechanisms that capture important features across all three dimensions, which inevitably leads to an increase in model parameters. Compared with the original model, the FLOPs and parameters increased by 8.3 G and 7.5 M, respectively. Therefore, it is necessary to pursue lightweight improvements in the model.

5.5. Ablation Experiment

In order to further demonstrate the effectiveness of the proposed enhancement method on the Tassel-YOLO model, we conducted ablation experiments using YOLOv7 as the baseline model. As shown in Table 5, YOLOv7 + GAM represents a model that is obtained by incorporating the GAM module into the YOLOv7 model. It can be observed that adding the GAM module can effectively improve model accuracy, with [email protected] and F1 scores increasing by 1.13% and 0.82%, respectively, compared with YOLOv7, making the model more attentive to the tassel regions in the images. However, the model parameters and inference time increased accordingly. YOLOv7 + Slim Neck refers to the incorporation of GSConv lightweight convolution and a VoVGSCSP module into the neck section of YOLOv7. GSConv provides similar computational effectiveness as regular convolution while reducing the model’s parameters [20]. The VoVGSCSP module enhances the model’s nonlinear function expression capability, improving inference speed and detection accuracy without increasing computational cost. Compared with YOLOv7, YOLOv7 + Slim Neck reduces flops and the number of parameters by 20.3 G and 9.79 M, respectively, decreases inference time by 2.2 ms, and increases [email protected] by 0.5%. Changing the loss function to SIoU does not significantly affect model parameters or inference speed but increases [email protected] by 0.21%. Additionally, in experiments, SIoU was found to accelerate model convergence during training and shorten training time. The Tassel-YOLO model integrates the above improvements and achieves excellent performance in the task of maize tassel detection. Compared with YOLOv7, Tassel-YOLO demonstrates a higher detection accuracy, with an increase of 1.43% in [email protected] and 1.15% in F1 score. In terms of model lightweighting, Tassel-YOLO reduces FLOPs by 11.4 G and Parameters by 4.11 M, resulting in faster inference speed and facilitating lightweight deployment in practical applications. Overall, Tassel-YOLO achieves a balance between high accuracy and model lightweighting, making our improvements worthwhile.

6. Conclusions and Future Work

This study applies deep learning to the process of maize tassel detection and counting. Firstly, a high-quality dataset of aerial images of maize tassels at the tasseling stage was constructed by preprocessing aerial video data captured by unmanned aerial vehicles. To address the current challenges of low accuracy and slow inference speeds in tassel detection, we propose the Tassel-YOLO network model, achieved by improving the original YOLOv7 model. GSConv convolution is used in the neck part of the network to effectively reduce the model’s parameters. The original ELAN-W module is improved to the VoVGSCSP module, enhancing the network’s nonlinear expression ability. A GAM module is added to the neck part, introducing multi-layer perceptrons and convolutional spatial attention with the three-dimensional arrangement and channel-attention submodules, which enhances the network’s ability to extract tassel features. Furthermore, Tassel-YOLO employs an efficient loss function SIoU, which comprehensively constructs penalty factors, resulting in improved training speeds and inference accuracies. For the task of maize tassel detection, Tassel-YOLO achieves an [email protected] of 96.14%, an F1 score of 93.18%, and a counting accuracy of 97.55%, showing significant performance improvement compared with the original YOLOv7. Our model can detect one image in only 13.5 ms, and the number of FLOPs and parameters have been reduced to 91.8 G and 32.37 M, respectively. Therefore, it can be directly deployed on embedded devices of UAV for real-time detection. The output information, including detected images, counting results, etc., can be transmitted to the control platform or server for further data analysis. In summary, Tassel-YOLO represents an effective exploration of the YOLO network architecture and can meet the practical needs of application. It has a certain value for the actual application in corn cultivation, providing new insights for related intelligent agricultural production.
Our study has achieved certain accomplishments, but there is still some work that needs to be improved and supplemented in the future.
  • This study focuses on the research and development of real-time detection tasks for maize tassels. In the future, as more data become available for various plant species and quantities, we will continue to optimize Tassel-YOLO and apply our model to broader fields, such as wheatear detection and ears of millet detection.
  • Hyperspectral images can provide richer spectral information, and using hyperspectral images for tassel detection can provide more comprehensive and accurate data support. This is also a future research direction worth exploring.
  • During the growth process of maize, which includes multiple growth stages, this study only investigated the detection and counting of the tasseling stage. In the future, we will experimentally analyze images from other growth stages to obtain a more comprehensive assessment of maize quantity.
  • This study achieved the counting of tassels at a local position of a field represented by a single image. However, calculating the tassel count of the entire maize field through image overlap also has certain research significance.

Author Contributions

Conceptualization, H.P. and X.C.; methodology, H.P., X.C. and Y.Y.; software, Y.Y. and R.T.; validation, H.P., X.C. and J.L.; formal analysis, J.M. and Y.W.; investigation, H.P. and J.L.; resources, R.T. and J.M.; data curation, H.P., J.M. and R.T.; writing—original draft preparation, H.P., X.C. and Y.Y.; writing—review and editing, H.P. and X.C.; visualization, Y.Y. and R.T.; supervision, J.M.; project administration, X.C.; funding acquisition, J.M. All authors have read and agreed to the published version of the manuscript.

Funding

This work was supported by the Key Technology Research Project of the Sichuan Science and Technology Department under Grant 22ZDYF0095.

Data Availability Statement

The data used to support the findings of this study are available from the corresponding author upon request.

Acknowledgments

The author would like to thank the College of Agriculture at Sichuan Agricultural University for providing the dataset and the Key Technology Research Project of the Science and Technology Department of Sichuan Province for the financial support.

Conflicts of Interest

The authors declare no conflict of interest.

References

  1. U.S. Department of Agriculture. Website of Foreign Agriculture Service. Available online: https://ipad.fas.usda.gov/cropexplorer/cropview/commodityView.aspx?cropid=0440000 (accessed on 10 April 2023).
  2. Wang, B.; Yang, G.; Yang, H.; Gu, J.; Xu, S.; Zhao, D.; Xu, B. Multiscale Maize Tassel Identification Based on Improved RetinaNet Model and UAV Images. Remote Sens. 2023, 15, 2530. [Google Scholar] [CrossRef]
  3. Chen, X.; Pu, H.; He, Y.; Lai, M.; Zhang, D.; Chen, J.; Pu, H. An Efficient Method for Monitoring Birds Based on Object Detection and Multi-Object Tracking Networks. Animals 2023, 13, 1713. [Google Scholar] [CrossRef] [PubMed]
  4. Zhao, L.; Zhu, M. MS-YOLOv7:YOLOv7 Based on Multi-Scale for Object Detection on UAV Aerial Photography. Drones 2023, 7, 188. [Google Scholar] [CrossRef]
  5. Zou, H.; Lu, H.; Li, Y.; Liu, L.; Cao, Z. Maize tassels detection: A benchmark of the state of the art. Plant Methods 2020, 16, 108. [Google Scholar] [CrossRef] [PubMed]
  6. Liu, Y.; Cen, C.; Che, Y.; Ke, R.; Ma, Y.; Ma, Y. Detection of Maize Tassels from UAV RGB Imagery with Faster R-CNN. Remote Sens. 2020, 12, 338. [Google Scholar] [CrossRef] [Green Version]
  7. Ji, M.; Yang, Y.; Zheng, Y.; Zhu, Q.; Huang, M.; Guo, Y. In-field automatic detection of maize tassels using computer vision. Inf. Process. Agric. 2021, 8, 87–95. [Google Scholar] [CrossRef]
  8. Mirnezami, S.V.; Srinivasan, S.; Zhou, Y.; Schnable, P.S.; Ganapathysubramanian, B. Detection of the Progression of Anthesis in Field-Grown Maize Tassels: A Case Study. Plant Phenomics 2021, 2021, 4238701. [Google Scholar] [CrossRef]
  9. Falahat, S.; Karami, A. Maize tassel detection and counting using a YOLOv5-based model. Multimed. Tools Appl. 2022, 82, 19521–19538. [Google Scholar] [CrossRef]
  10. Liu, Y.; Shao, Z.; Hoffmann, N. Global Attention Mechanism: Retain Information to Enhance Channel-Spatial Interactions. arXiv 2021, arXiv:2112.05561. [Google Scholar]
  11. Gevorgyan, Z. SIoU Loss: More Powerful Learning for Bounding Box Regression. arXiv 2022, arXiv:2205.12740. [Google Scholar]
  12. Redmon, J.; Divvala, S.; Girshick, R.; Farhadi, A. You Only Look Once: Unified, Real-Time Object Detection. In Proceedings of the IEEE Conference on Computer Vision and Pattern Recognition, Las Vegas, NV, USA, 26 June–1 July 2016; pp. 779–788. [Google Scholar]
  13. Wang, C.-Y.; Bochkovskiy, A.; Liao, H.-Y.M. YOLOv7: Trainable bag-of-freebies sets new state-of-the-art for real-time object detectors. arXiv 2022, arXiv:2207.02696. [Google Scholar] [CrossRef]
  14. Mnih, V.; Heess, N.; Graves, A.; Kavukcuoglu, K. Recurrent Models of Visual Attention. arXiv 2014, arXiv:1406.6247. [Google Scholar]
  15. Wang, Q.; Wu, B.; Zhu, P.; Li, P.; Zuo, W.; Hu, Q. ECA-Net: Efficient Channel Attention for Deep Convolutional Neural Networks. In Proceedings of the IEEE/CVF Conference on Computer Vision and Pattern Recognition, Seattle, WA, USA, 13–19 June 2020; pp. 11534–11542. [Google Scholar]
  16. Wang, H.; Fan, Y.; Wang, Z.; Jiao, L.; Schiele, B. Parameter-Free Spatial Attention Network for Person Re-Identification. arXiv 2018, arXiv:1811.12150. [Google Scholar]
  17. Hu, J.; Shen, L.; Albanie, S.; Sun, G.; Wu, E. Squeeze-and-Excitation Networks. arXiv 2019, arXiv:1709.01507. [Google Scholar]
  18. Woo, S.; Park, J.; Lee, J.-Y.; Kweon, I.S. CBAM: Convolutional Block Attention Module. In Proceedings of the European Conference on Computer Vision (ECCV), Munich, Germany, 8–14 September 2018; pp. 3–19. [Google Scholar]
  19. Howard, A.G.; Zhu, M.; Chen, B.; Kalenichenko, D.; Wang, W.; Weyand, T.; Andreetto, M.; Adam, H. MobileNets: Efficient Convolutional Neural Networks for Mobile Vision Applications. arXiv 2017, arXiv:1704.04861. [Google Scholar]
  20. Li, H.; Li, J.; Wei, H.; Liu, Z.; Zhan, Z.; Ren, Q. Slim-neck by GSConv: A better design paradigm of detector architectures for autonomous vehicles. arXiv 2022, arXiv:2206.02424. [Google Scholar]
  21. Bochkovskiy, A.; Wang, C.-Y.; Liao, H.-Y.M. YOLOv4: Optimal Speed and Accuracy of Object Detection. arXiv 2020, arXiv:2004.10934. [Google Scholar]
  22. Liu, W.; Quijano, K.; Crawford, M.M. YOLOv5-Tassel: Detecting Tassels in RGB UAV Imagery With Improved YOLOv5 Based on Transfer Learning. IEEE J. Sel. Top. Appl. Earth Obs. Remote Sens. 2022, 15, 8085–8094. [Google Scholar] [CrossRef]
  23. Ye, M.; Wang, H.; Xiao, H. Light-YOLOv5: A Lightweight Algorithm for Improved YOLOv5 in PCB Defect Detection. In Proceedings of the 2023 IEEE 2nd International Conference on Electrical Engineering, Big Data and Algorithms (EEBDA), Changchun, China, 24–26 February 2023; pp. 523–528. [Google Scholar] [CrossRef]
  24. Du, S.; Zhang, B.; Zhang, P.; Xiang, P. An Improved Bounding Box Regression Loss Function Based on CIOU Loss for Multi-scale Object Detection. In Proceedings of the 2021 IEEE 2nd International Conference on Pattern Recognition and Machine Learning (PRML), Chengdu, China, 16–18 July 2021; pp. 92–98. [Google Scholar] [CrossRef]
  25. Wang, Y.; Wang, H.; Xin, Z. Efficient Detection Model of Steel Strip Surface Defects Based on YOLO-V7. IEEE Access 2022, 10, 133936–133944. [Google Scholar] [CrossRef]
  26. Tzutalin, D.L. Git Code. 2015. Available online: https://github.com/tzutalin/labelImg (accessed on 10 April 2023).
  27. Kumar, T.; Turab, M.; Raj, K.; Mileo, A.; Brennan, R.; Bendechache, M. Advanced Data Augmentation Approaches: A Comprehensive Survey and Future directions. arXiv 2023, arXiv:2301.02830. [Google Scholar]
  28. Jiang, W.; Zhang, K.; Wang, N.; Yu, M. MeshCut data augmentation for deep learning in computer vision. PLoS ONE 2020, 15, e0243613. [Google Scholar] [CrossRef] [PubMed]
  29. Zhang, H.; Cisse, M.; Dauphin, Y.N.; Lopez-Paz, D. mixup: Beyond Empirical Risk Minimization. arXiv 2018, arXiv:1710.09412. [Google Scholar]
  30. Robbins, H.; Monro, S. A Stochastic Approximation Method. Ann. Math. Stat. 1951, 22, 400–407. [Google Scholar] [CrossRef]
  31. Cao, L.; Xiao, Z.; Liao, X.; Yao, Y.; Wu, K.; Mu, J.; Pu, H. Automated Chicken Counting in Surveillance Camera Environments Based on the Point Supervision Algorithm: LC-DenseFCN. Agriculture 2021, 11, 493. [Google Scholar] [CrossRef]
  32. Foss, T.; Myrtveit, I.; Stensrud, E. MRE and heteroscedasticity: An empirical validation of the assumption of homoscedasticity of the magnitude of relative error. In Proceedings of the ESCOM, 12th European Software Control And Metrics Conference, Maastricht, The Netherlands, 2–4 April 2001; pp. 157–164. [Google Scholar]
  33. Terven, J.; Cordova-Esparza, D. A Comprehensive Review of YOLO: From YOLOv1 to YOLOv8 and Beyond. arXiv 2023, arXiv:2304.00501. [Google Scholar]
  34. Kumar, A.; Taparia, M.; Rajalakshmi, P.; Guo, W.; Naik, B.; Marathi, B.; Desai, U.B. UAV Based Remote Sensing for Tassel Detection and Growth Stage Estimation of Maize Crop Using Multispectral Images. In Proceedings of the IGARSS 2020-2020 IEEE International Geoscience and Remote Sensing Symposium, Waikoloa, HI, USA, 26 September–2 October 2020; pp. 1588–1591. [Google Scholar] [CrossRef]
Figure 1. YOLO Model rationale.
Drones 07 00492 g001
Figure 2. The overview of GAM.
Drones 07 00492 g002
Figure 3. Channel-attention submodule.
Drones 07 00492 g003
Figure 4. Spatial-attention submodule.
Drones 07 00492 g004
Figure 5. The structure diagram of the GSConv.
Drones 07 00492 g005
Figure 6. The architecture of Tassel-YOLO.
Drones 07 00492 g006
Figure 7. The architecture of several key modules in the Tassel-YOLO network.
Drones 07 00492 g007
Figure 8. Ground truth and bounding box relationship diagram. (a) Angle cost; (b) IoU cost.
Drones 07 00492 g008
Figure 9. Mosaic data augmentation schematic diagram.
Drones 07 00492 g009
Figure 10. Some effects of data augmentation methods. (a) Original image; (b) Rotation; (c) Equal scaling; (d) Color dithering; (e) Mosaic; (f) Mix up.
Drones 07 00492 g010
Figure 11. The training result of different YOLO models.
Drones 07 00492 g011
Figure 12. The results of maize tassel detection by Tassel-YOLO. (a) The detection performance of maize tassels at different sizes; (b) Overall image detection performance.
Drones 07 00492 g012aDrones 07 00492 g012b
Table 1. Video Capture Conditions.
DateWeatherDeviceResolutionFPSImage Sensor
16 June 2022SunnyDJI Mavic drone12 MP24@1080P1-inch CMOS
2 July 2022SunnyDJI Mavic drone12 MP24@1080P1-inch CMOS
Table 2. The comparison of several detectors in our experiments.
Model[email protected]PrecisionRecallF1FPS
YOLOv489.10%88.01%85.92%86.95%55
YOLOv593.42%91.23%89.13%90.17%86
YOLOv794.71%92.32%91.74%92.03%69
YOLOv894.26%92.14%92.92%92.53%75
Tassel-YOLO96.14%93.16%93.21%93.18%74
Table 3. Counting effect evaluation experiment.
Tassel-YOLOYOLOv8YOLOv7YOLOv5YOLOv4
GroupNMCNACCAMRE (%)NACCAMRE (%)NACCAMRE (%)NACCAMRE (%)NACCAMRE (%)
138036896.8%0.3235994.5%0.5536495.8%0.4235894.2%0.5834791.3%0.87
279177197.5%0.2575695.6%0.4476396.5%0.3575495.3%0.4772992.2%0.78
31248122197.8%0.22121197.0%0.30120996.9%0.31119395.6%0.44115892.8%0.72
41682165098.1%0.19163997.4%0.26163397.1%0.29161596.0%0.40156993.3%0.67
Table 4. Comparative experiments on attention mechanisms.
Attention MechanismPrecisionRecallF1[email protected]FLOPsParameters
SECBAMGAM
×××92.32%91.74%92.03%94.71%103.2 G36.48 M
××92.92%89.48%91.17%94.33%103.3 G36.62 M
××93.57%91.24%92.39%94.83%103.9 G37.63 M
××92.84%92.86%92.85%95.84%111.5 G43.98 M
Table 5. Ablation Experiment of Tassel-YOLO on our dataset.
Methods[email protected]F1FLOPsParametersInference Time (ms)
YOLOv794.71%92.03%103.2 G36.48 M14.5
YOLOv7 + GAM95.84%92.85%111.5 G43.98 M15.6
YOLOv7 + Slim Neck95.21%91.87%82.9 G26.69 M12.3
YOLOv7 + SIoU94.92%92.16%103.2 G36.48 M14.5
Tassel-YOLO96.14%93.18%91.8 G32.37 M13.5
Disclaimer/Publisher’s Note: The statements, opinions and data contained in all publications are solely those of the individual author(s) and contributor(s) and not of MDPI and/or the editor(s). MDPI and/or the editor(s) disclaim responsibility for any injury to people or property resulting from any ideas, methods, instructions or products referred to in the content.