Article

UAV Communication Recovery under Meteorological Conditions

1
School of Information Engineering, Chang’an University, Xi’an 710064, China
2
Department of Electrical and Computer Engineering, University of Victoria, Victoria, BC V8P 5C2, Canada
*
Author to whom correspondence should be addressed.
Drones 2023, 7(7), 423; https://doi.org/10.3390/drones7070423
Submission received: 6 May 2023 / Revised: 17 June 2023 / Accepted: 21 June 2023 / Published: 26 June 2023
(This article belongs to the Special Issue Advances of Unmanned Aerial Vehicle Communication)

Abstract

:
Our study proposes a UAV communications recovery strategy under meteorological conditions based on a ray tracing simulation of excessive path loss in four distinct three-dimensional (3D) urban environments. We start by reviewing the air-to-ground propagation loss model under meteorological conditions, as well as the specific attenuation of rain, fog, and snow, and we propose a new expression for line-of-sight (LoS) probability. Using the two frequency bands of 28 GHz and 71 GHz, we investigate the impact of specific attenuation caused by different weather conditions and analyze the relationship between the radius of the UAV coverage area and the elevation angle. Furthermore, we investigate the effects of the rainfall rate, liquid water density, and snowfall rate on the maximum coverage area and optimal height of the UAV. Eventually, we propose a strategy that involves compensating for the maximum path loss and adjusting the UAV’s position to recover the coverage of the UAV to ground users. Our results show that rain has the greatest impact on the UAV’s coverage area and optimum height among the three types of weather conditions. For various weather conditions, relative to Region 1, the percentage reduction in the maximum coverage radius of Region 2 to Region 4 increases gradually, and the extent of each increase is approximately 10%. Moreover, after adding the compensated path loss, the coverage radius of the UAV in the four regions is restored to a value slightly larger than that before the rain. In addition, rain caused the greatest reduction in UAV coverage for suburban environments and the lowest for high-rise urban environments.

1. Introduction

In recent years, with the reduction in manufacturing costs, unmanned aerial vehicles (UAVs) have appeared in many applications. In the civil field, UAVs are widely used in aerial photography [1,2], smart agriculture [3,4], express transportation [5,6], disaster relief [7], observing wild animals [8], etc. In addition, due to the advantages of flexible and rapid deployment, UAVs are also suitable for various applications in fifth-generation (5G) and beyond wireless communications. In cellular networks, UAVs can play two distinct roles: cellular-connected UAVs and UAV-assisted wireless communications [9]. The former treats the UAV as an aerial user accessing the cellular network for sky-based communication, while the latter utilizes the UAV as an aerial communication platform, acting as a base station (BS) or relay to provide data access from above. For example, the UAV in Ref. [10] is used as an air base station (ABS), and in Refs. [11,12], the UAVs act as relays. This paper primarily focuses on UAVs serving as ABS.
UAVs, when utilized as aerial base stations, can provide temporary communication services following natural disasters such as earthquakes, mudslides, floods, and forest fires. Furthermore, during civil emergencies such as power outages, UAVs can enable rapid communications and service restoration due to their high mobility and flexibility. However, common weather conditions, including rain, fog, and snow, cause the specific attenuation of electromagnetic waves [13,14,15], leading to reduced communications coverage between the UAV and ground users [16]. We believe that studying how to restore UAV–ground user communication coverage under various weather conditions to levels comparable to those in clear weather is a valuable endeavor.
Several studies have explored the use of UAVs in communication with ground users. For instance, A. Al-Hourani et al. [17] proposed an analytical method to optimize the heights of low-altitude platforms (LAP) for maximum terrestrial radio coverage. Similarly, M. Mozaffari et al. investigated the optimal height of a single drone small cell (DSC) for maximum coverage and minimum transmission power in [18]. In the case of two DSCs, the authors analyzed the effect of the distance between them on the coverage area, accounting for both no-interference and full-interference scenarios, and derived the optimal distance for maximum coverage.
Furthermore, in [19], A. M. Hayajneh et al. explored the use of drone-based small cellular networks (DSCNs) to restore or fill coverage gaps in terrestrial cellular networks due to natural or man-made disasters. In another study, Zhang et al. investigated a downlink communication scenario in which a UAV base station (UBS) assists a ground base station (GBS) in providing services. Using stochastic geometry, they derived an explicit expression for the overall coverage probability [20]. In a cellular network with UAVs serving as base stations, Q. Zhu et al. addressed the coverage recovery problem when one or more UAVs go offline due to energy replenishment or extreme environments [21]. The authors analyzed the relationship between the coverage radius, UAV height, and transmission power to mitigate the impact of offline UAVs.
It is worth noting that the line-of-sight (LoS) probability expressions involved in the research of communication recovery in Refs. [19,20,21] are all based on Ref. [17]. The LoS probability expression in Ref. [17] is based on the assumption of evenly spaced buildings. This may not be appropriate in real urban environments, where buildings tend to be more randomly distributed. The communication recovery method proposed in this paper is based on our own proposed LoS probability expression under real urban environments. This is the first difference between this paper and the aforementioned three references. Secondly, this paper places an emphasis on the communication coverage of UAVs, which is intricately linked to the distance between the UAV and ground users. Consequently, we employ an allowable path loss threshold to dynamically adjust the UAV’s position. In comparison to the signal-to-noise ratio (SNR) threshold outlined in Ref. [21], our approach streamlines certain calculation steps for improved efficiency. Thirdly, this paper takes into account the recovery of the coverage of the UAV across diverse weather conditions. Thus, our study aims to fill a gap by examining the effects of various weather conditions on UAV coverage, which are not considered in the three mentioned references.
Moreover, some studies have explored the specific attenuation of rain, fog, or snow in communication systems. For instance, Refs. [22,23,24] examine the impact of rain-specific attenuation on traditional or satellite communications. Fog-specific attenuation is primarily investigated in the context of optical communication, as seen in the literature [25,26,27,28]. Additionally, Refs. [29,30] study the attenuation caused by snow in wireless communications. Nonetheless, limited research has been conducted on the effects of various weather conditions on communication between UAVs and ground users. This paper presents a strategy to restore communication coverage between UAVs and ground users under rain, fog, or snow conditions considering two frequencies (28 GHz and 71 GHz). The reason that we focused on these two frequencies is that they are critical and representative frequency bands adopted by future wireless communication systems such as 5G and beyond [31]. Numerical results demonstrate that, under different weather conditions, the UAV–ground communication coverage can be effectively restored to a level comparable to that of a clear day through compensated path loss and UAV height adjustment. In this paper, we summarize our contributions in the following aspects.
(1)
Drawing on ray tracing simulation data from previous work, we provide a new LoS probability expression for four distinct 3D urban environments.
(2)
Using the selected four 3D urban environments, we conduct ray tracing simulations and obtain excessive path loss data for these environments, considering one, two, and three reflections.
(3)
We present expressions and associated parameters that illustrate the relationships between the coverage area, optimal UAV height, and compensated path loss in relation to the rainfall rate, liquid water density, and snowfall rate across four urban environments at two distinct frequencies (28 GHz and 71 GHz).
(4)
We propose an algorithm for UAVs to restore communication with ground users under varying weather conditions and analyze the time required for communication recovery.
The remainder of this paper is structured as follows. Section 2 presents the system model. Section 3 provides the methods. In Section 4, we propose a UAV communication recovery strategy to address the challenges posed by adverse weather conditions for UAV communications and give the results. Lastly, Section 5 provides the concluding remarks.

2. System Model

We incorporate specific attenuation into the air-to-ground (A2G) propagation loss model from [17]. The propagation model for communications between a UAV and ground users under various weather conditions can be represented as
P L max = P L o S ( θ ) × P L L o S + 1 P L o S ( θ )   ×   P L N L o S   +   ( β + γ ) d 1000 ,
where d denotes the distance between the UAV and the receiver in meters. The above model consists of three critical components: the LoS probability expression ( P L o S ( θ ) ), the propagation path loss from the UAV to a ground receiver in LoS or non-line-of-sight (NLoS) conditions ( P L L o S or P L N L o S ), and the specific attenuation caused by weather and gas ( γ and β ). We discuss these three components in detail in the following subsections.

2.1. Line-of-Sight Probability

In UAV communications with ground users, LoS links can be obstructed by ground obstacles such as buildings, trees, vehicles, pedestrians, and other impediments. Our previous research conducted ray tracing simulations for four distinct urban environments in New York City [32], yielding LoS probability data for UAV–ground user communications, as depicted in Figure 1. The four solid lines in Figure 1 represent the fitting curves, with the corresponding LoS probability equation
P L o S ( θ )   =   i · sin ( j θ   +   k )   +   l · sin ( m θ   +   n ) ,   0     θ     70 ,
where θ is the elevation angle of the UAV, and i, j, k, l, m, n are the fitting parameters. These parameters for the four urban environments are shown in Table 1.
Additionally, the selected four rectangular-shaped environmental regions in New York City in our previous work are suburban, urban, dense urban, and high-rise urban. The average building heights of the four selected regions are 6.5 m, 12.2 m, 22.7 m, and 55.0 m, respectively. The ratios of the land area covered by buildings to the total land area are 0.26, 0.43, 0.94, and 0.78, respectively. The average numbers of buildings per unit area (square kilometer) are 2582.7, 1100.9, 2243.9, and 844.0, respectively.

2.2. Excessive Path Loss

Excess path loss refers to the signal degradation beyond the free-space path loss, characterized by a Gaussian distribution [33,34,35]. The additional losses arise due to the scattering or reflection of electromagnetic waves when they interact with obstacles such as buildings, trees, and other obstructions on the ground. In this study, we focus on the average value of the additional path loss rather than its stochastic nature, as discussed in [17].
To determine the excessive path loss in the four selected regions, we employed MATLAB’s Communications Toolbox to perform ray tracing simulations at two distinct frequencies, 28 GHz and 71 GHz. Specifically, the ray tracing simulation platform (PC) is equipped with an Intel® Core™ i7-11700F Processor (2.50 GHz) and 16 GB of RAM. In MATLAB, the command to initiate the ray tracing model is expressed as raytrace(tx, rx), where tx and rx represent predefined transmitter and receiver site objectives, respectively [32].
We use a site viewer object to display transmitter and receiver sites, as well as visualizations of ray propagation. We have employed omnidirectional antennas at both transmitter and receiver ends. It is worth mentioning that, in many practical cases, omnidirectional antennas are used for A2G communications due to their ability to radiate the signal uniformly in all directions. This allows for broader coverage and facilitates communication with aircraft regardless of their position or trajectory. Omnidirectional antennas are particularly suitable when the primary objective is to provide widespread coverage to a large area or a fleet of aircraft. By default, the site viewer presents a 3D view of the globe with geographic coordinates. For our simulation, the terrain and building data defined within the site viewer are based on the Open Street Map (OSM) file. We utilized the shooting and bouncing rays (SBR) method, allowing for up to three reflections, to create the ray tracing model. The interaction types within the SBR method encompass reflection effects but exclude diffraction, refraction, or scattering effects. In our ray tracing simulation, both building and terrain materials are designated as concrete due to its widespread usage in urban settings.
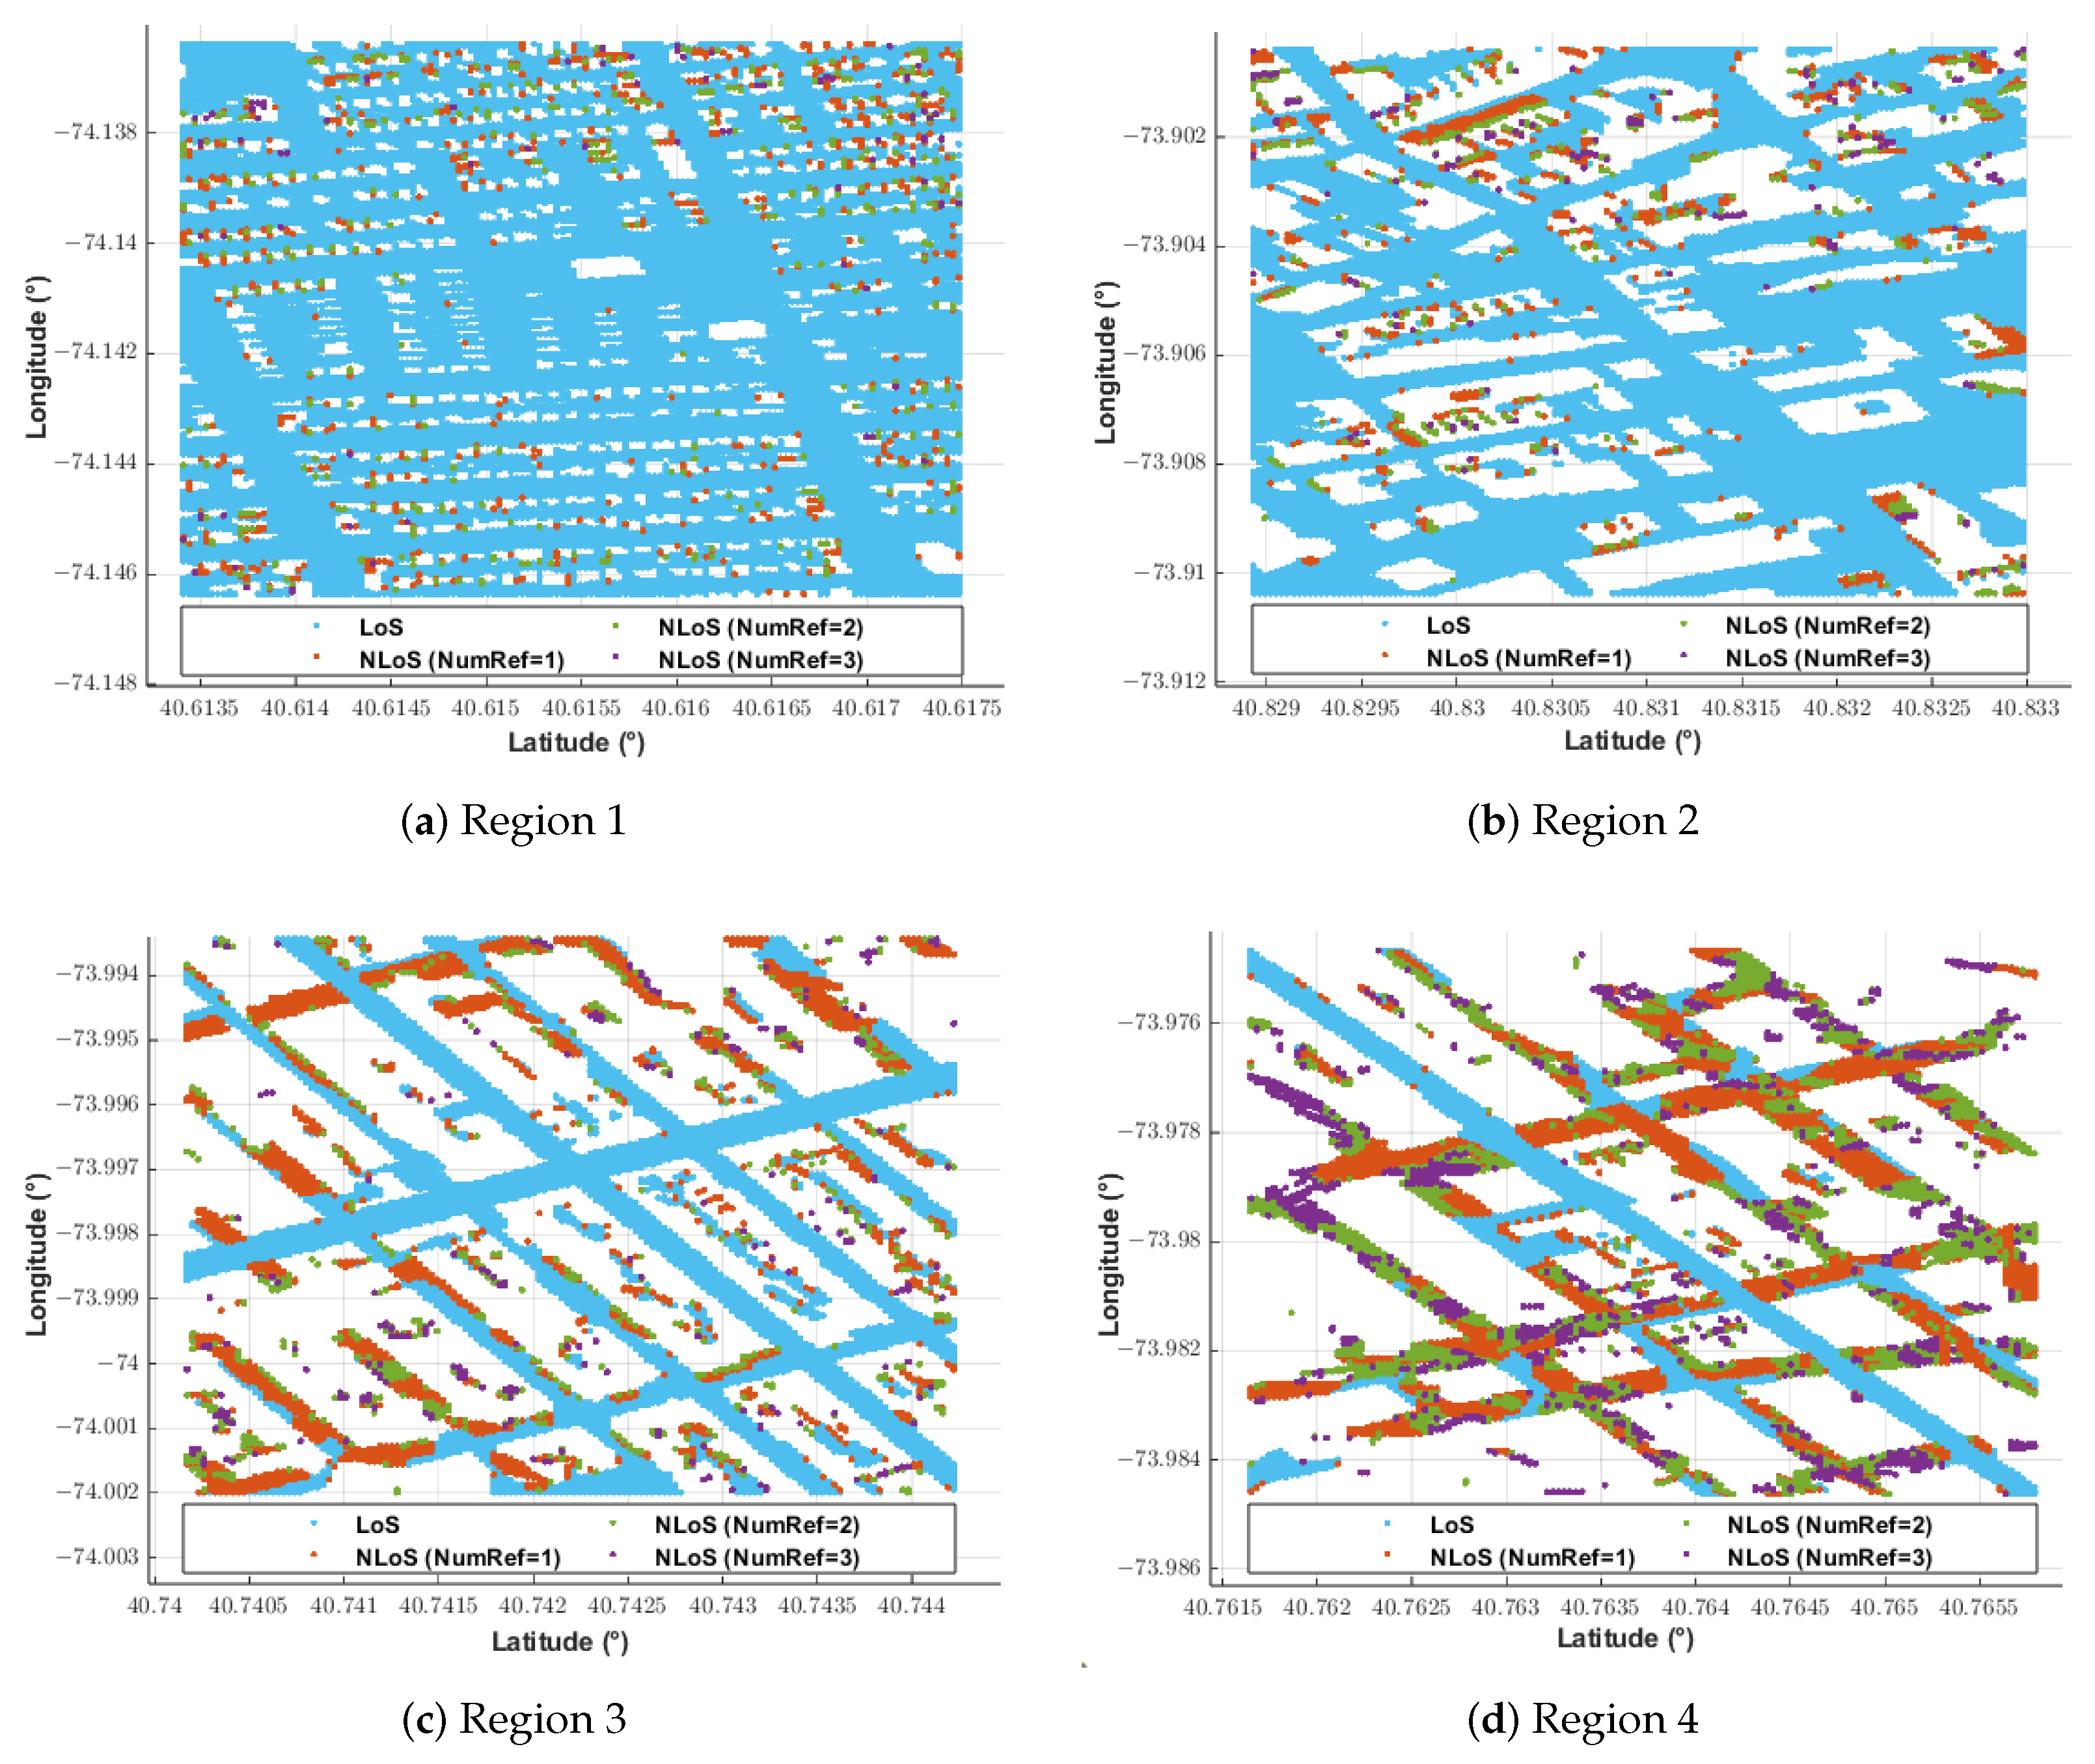
The four selected rectangular regions have dimensions of approximately 840 m in length and 450 m in width. To maintain simulation consistency, we employ the same UAV deployment scheme across all four regions. For example, in one region, the UAV’s projected coordinates on the ground are positioned at the center of the rectangle, with a height of 300 m. Taking into account an equal number of receivers per unit area, we distribute a specific number of receivers uniformly on the ground within the four regions. The quantities of the ground receivers in these regions are 24,947, 19,543, 12,144, and 11,209, respectively. The declining number of ground receivers across the regions is due to our selection of suburban, urban, dense urban, and high-rise urban environments. As the ratio of the building area to the total area within each region increases, the number of accommodated users on the ground decreases. Furthermore, the transmitter has an output power of 10 watts (40 dBm), and both the transmitter and receiver antennas are isotropic. Figure 2 displays the LoS and NLoS points, along with varying reflection numbers, at a 28 GHz carrier frequency across the four regions. It is important to note that we differentiate these reflection points based on the reflection number of the first ray that reaches the receiver.
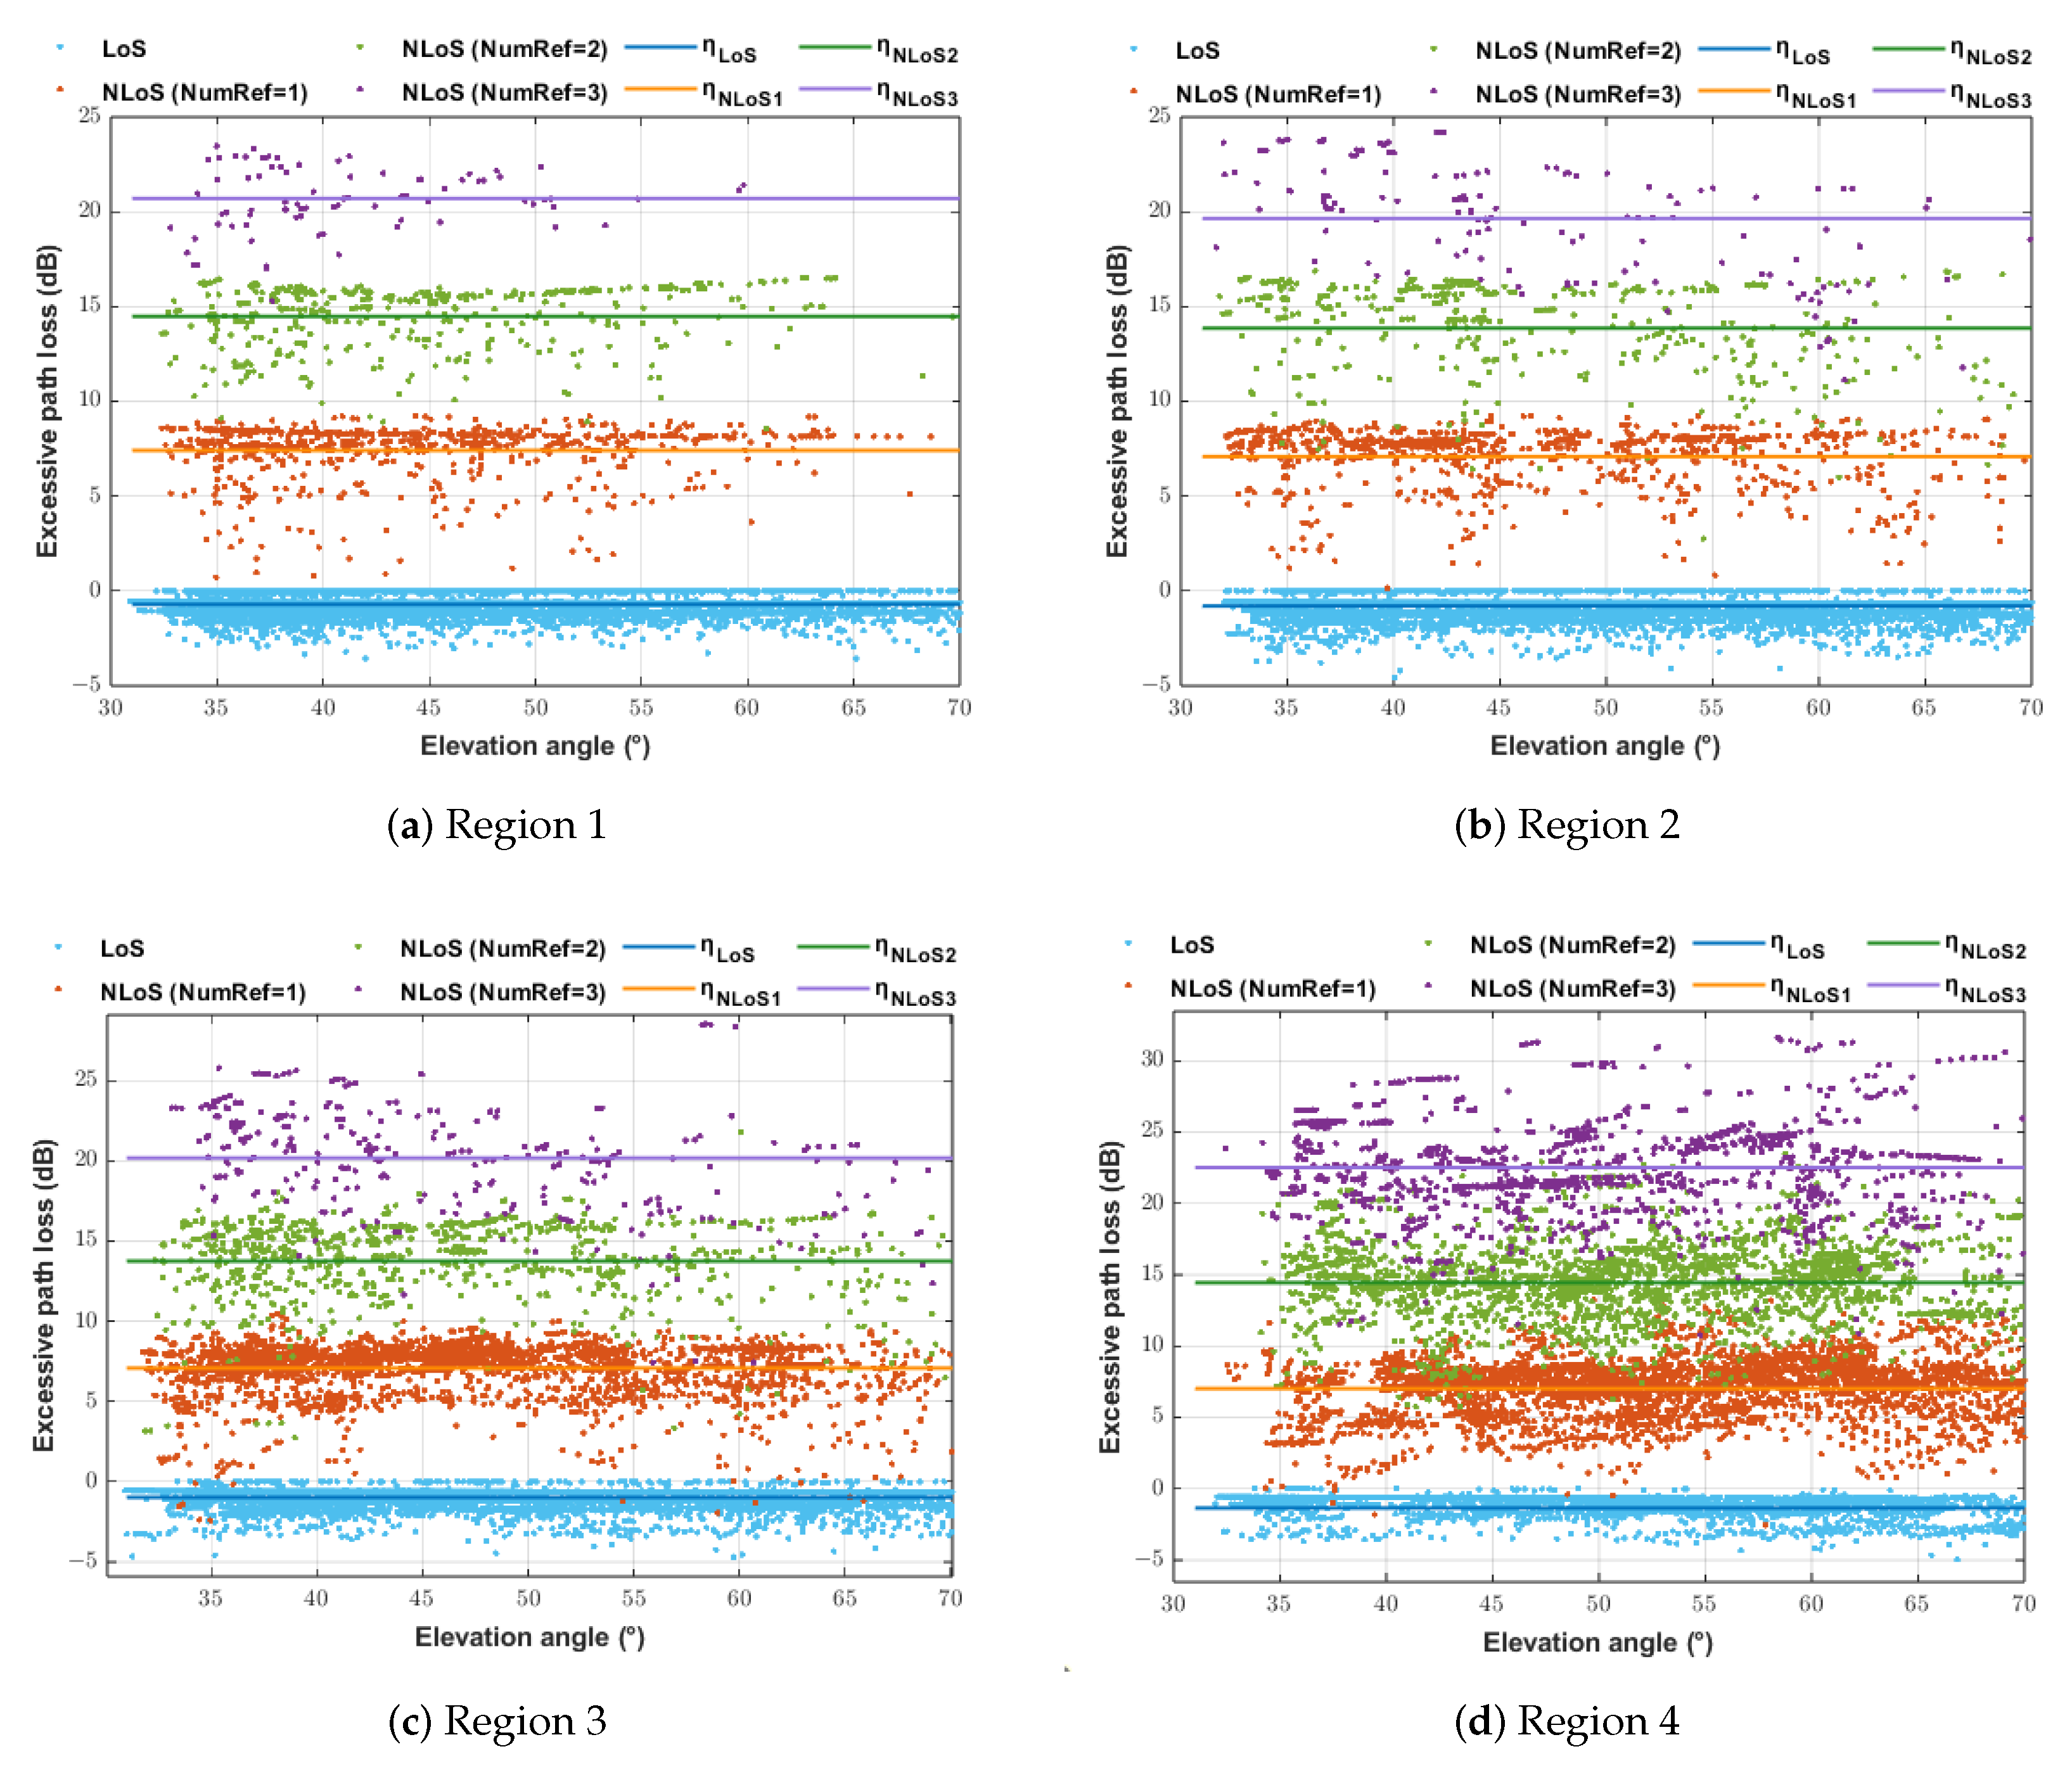
Based on Equation (3) from [17], we compute the excessive path loss η for each receiver across four regions. In Equation (3), PL n and FSPL n represent the total path loss and free-space path loss between the UAV and the nth receiver, respectively. Furthermore, we use η L o S and η N L o S to denote the mean values of excessive path loss between the UAV and receivers in LoS or NLoS conditions within each region. Specifically, we employ η N L o S 1 , η N L o S 2 , and η N L o S 3 to represent the mean values of excessive path loss between the UAV and receivers for varying reflection counts.
η n = PL n     FSPL n .
For a carrier frequency of 28 GHz, Figure 3 illustrates the calculated excessive path loss for each receiver (discrete points) against the UAV’s elevation angle in the four regions. Solid lines with distinct colors represent the average values of excessive path loss between the UAV and receivers in various communication states (LoS or NLoS with different reflection counts). Table 2 summarizes the mean values of different types of excessive path loss ( η L o S , η N L o S 1 , η N L o S 2 , and η N L o S 3 ) at carrier frequencies of 28 GHz and 71 GHz across the four regions. The path loss between the UAV and receivers in different states (LoS or NLoS) can be calculated using Equation (4) from [17], where d represents the distance in meters from the UAV to a ground receiver, and λ denotes the wavelength in meters.
P L L o S   =   20 log ( 4 π d λ )   +   η L o S , P L N L o S   =   20 log ( 4 π d λ )   +   η N L o S , η N L o S   =   η N L o S 1 ,   η N L o S 2 ,   η N L o S 3 .
By substituting Equations (2) and (4) into Equation (1), we derive the propagation model of UAV–ground user communications as a function of the UAV elevation angle under various weather conditions, as shown in Equation (5).
P L max   =   [ i · sin ( j θ   +   k )   +   l · sin ( m θ   +   n ) ]   ×   η L o S     η N L o S   +   20 log d   +   20 log 4 π λ +   η N L o S   +   ( β   +   γ ) d 1000 ,   0     θ     70 η N L o S   =   η N L o S 1 ,   η N L o S 2 ,   η N L o S 3 .

2.3. Specific Attenuation Model for Rain, Fog, Snow, and Gases

We provide a brief overview of the specific attenuation of electromagnetic wave signals caused by various weather conditions, including rain, fog, and snow, as well as atmospheric attenuation. This topic has been discussed in detail in our previous work [16].

2.3.1. Rain

Using the International Telecommunication Union (ITU) model, the specific attenuation due to rainfall is denoted as γ rain (dB/km) and it is related to the power law of the rainfall rate R rain (mm/h). It is written as [13]
γ rain = k R rain α ( dB / km ) ,
where k and α are determined by a series of coefficients provided by the ITU. Generally, R rain ranges from 0 to 100 mm/h.

2.3.2. Fog

Fog, as another common meteorological phenomenon, can significantly impact UAV communications and flights. Based on the ITU model, the specific attenuation caused by fog, γ fog , can be described as [14]
γ fog = K l R fog ( dB / km ) ,
where K l represents the attenuation per kilometer with unit liquid water density, in units of (dB/km)/(g/m3), and R fog denotes the liquid water density (LWD) in g/m3. In this study, we focus on the LWD range of 0.05–0.5 g/m3.

2.3.3. Snow

The specific attenuation caused by snow is derived from the model presented in [15], as shown in Equation (8). Snow can be classified into dry and wet snow based on its specific liquid content [36]. This paper only considers the model for dry snow, with a default ambient temperature of 0 degrees Celsius.
γ snow = 0.00349 R snow 1.6 λ c m 4 + 0.00224 R snow λ c m ( dB / km ) ,
where R snow represents the snowfall rate in mm/h, typically ranging within 0–10 mm/h, and λ c m denotes the wavelength in centimeters.

2.3.4. Gas

Considering the presence of oxygen, nitrogen, rare gases, and water vapor in the air, which absorb radio waves and cause atmospheric attenuation, it is essential to incorporate this effect into the free-space path loss model to determine the propagation attenuation of electromagnetic waves in a standard atmosphere. According to [37], the atmospheric attenuation β can be calculated as
β =   β o   +   β w = 0.1820 f GHz N Oxygen ( f GHz )   +   N Water Vapor ( f GHz ) ,
where β o and β w represent the specific attenuation (dB/km) due to dry air (oxygen and pressure-induced nitrogen) and water vapor, respectively. Furthermore, N Oxygen ( f GHz ) and N Water Vapor ( f GHz ) denote the imaginary components of the frequency-dependent complex refractivities for oxygen and water vapor, respectively [37].

3. Methods

In this section, we evaluate the impact of meteorological conditions on UAV–ground communications in four selected regions from the coverage radii of UAVs. The evaluation is based on the derived implicit function of the coverage radius of the UAV with respect to the elevation angle. Firstly, we analyze the relationship between the coverage radius of the UAV and the elevation angle under the influence of the atmosphere only, based on excessive path losses with different numbers of reflections. We then examine the effect of specific attenuation due to rain, fog, and dry snow and analyze the relationship between the UAV coverage radius and the elevation angle. At the same time, we give the numerical results of the coverage radius of the UAV under different weather conditions in the four selected regions, and the results are quantitatively analyzed and discussed. Moreover, we give the numerical results of the UAV coverage area, optimal height, and compensated path loss under different rainfall rates, liquid water densities, and snowfall rates, respectively. Finally, we quantitatively analyze and discuss these results.
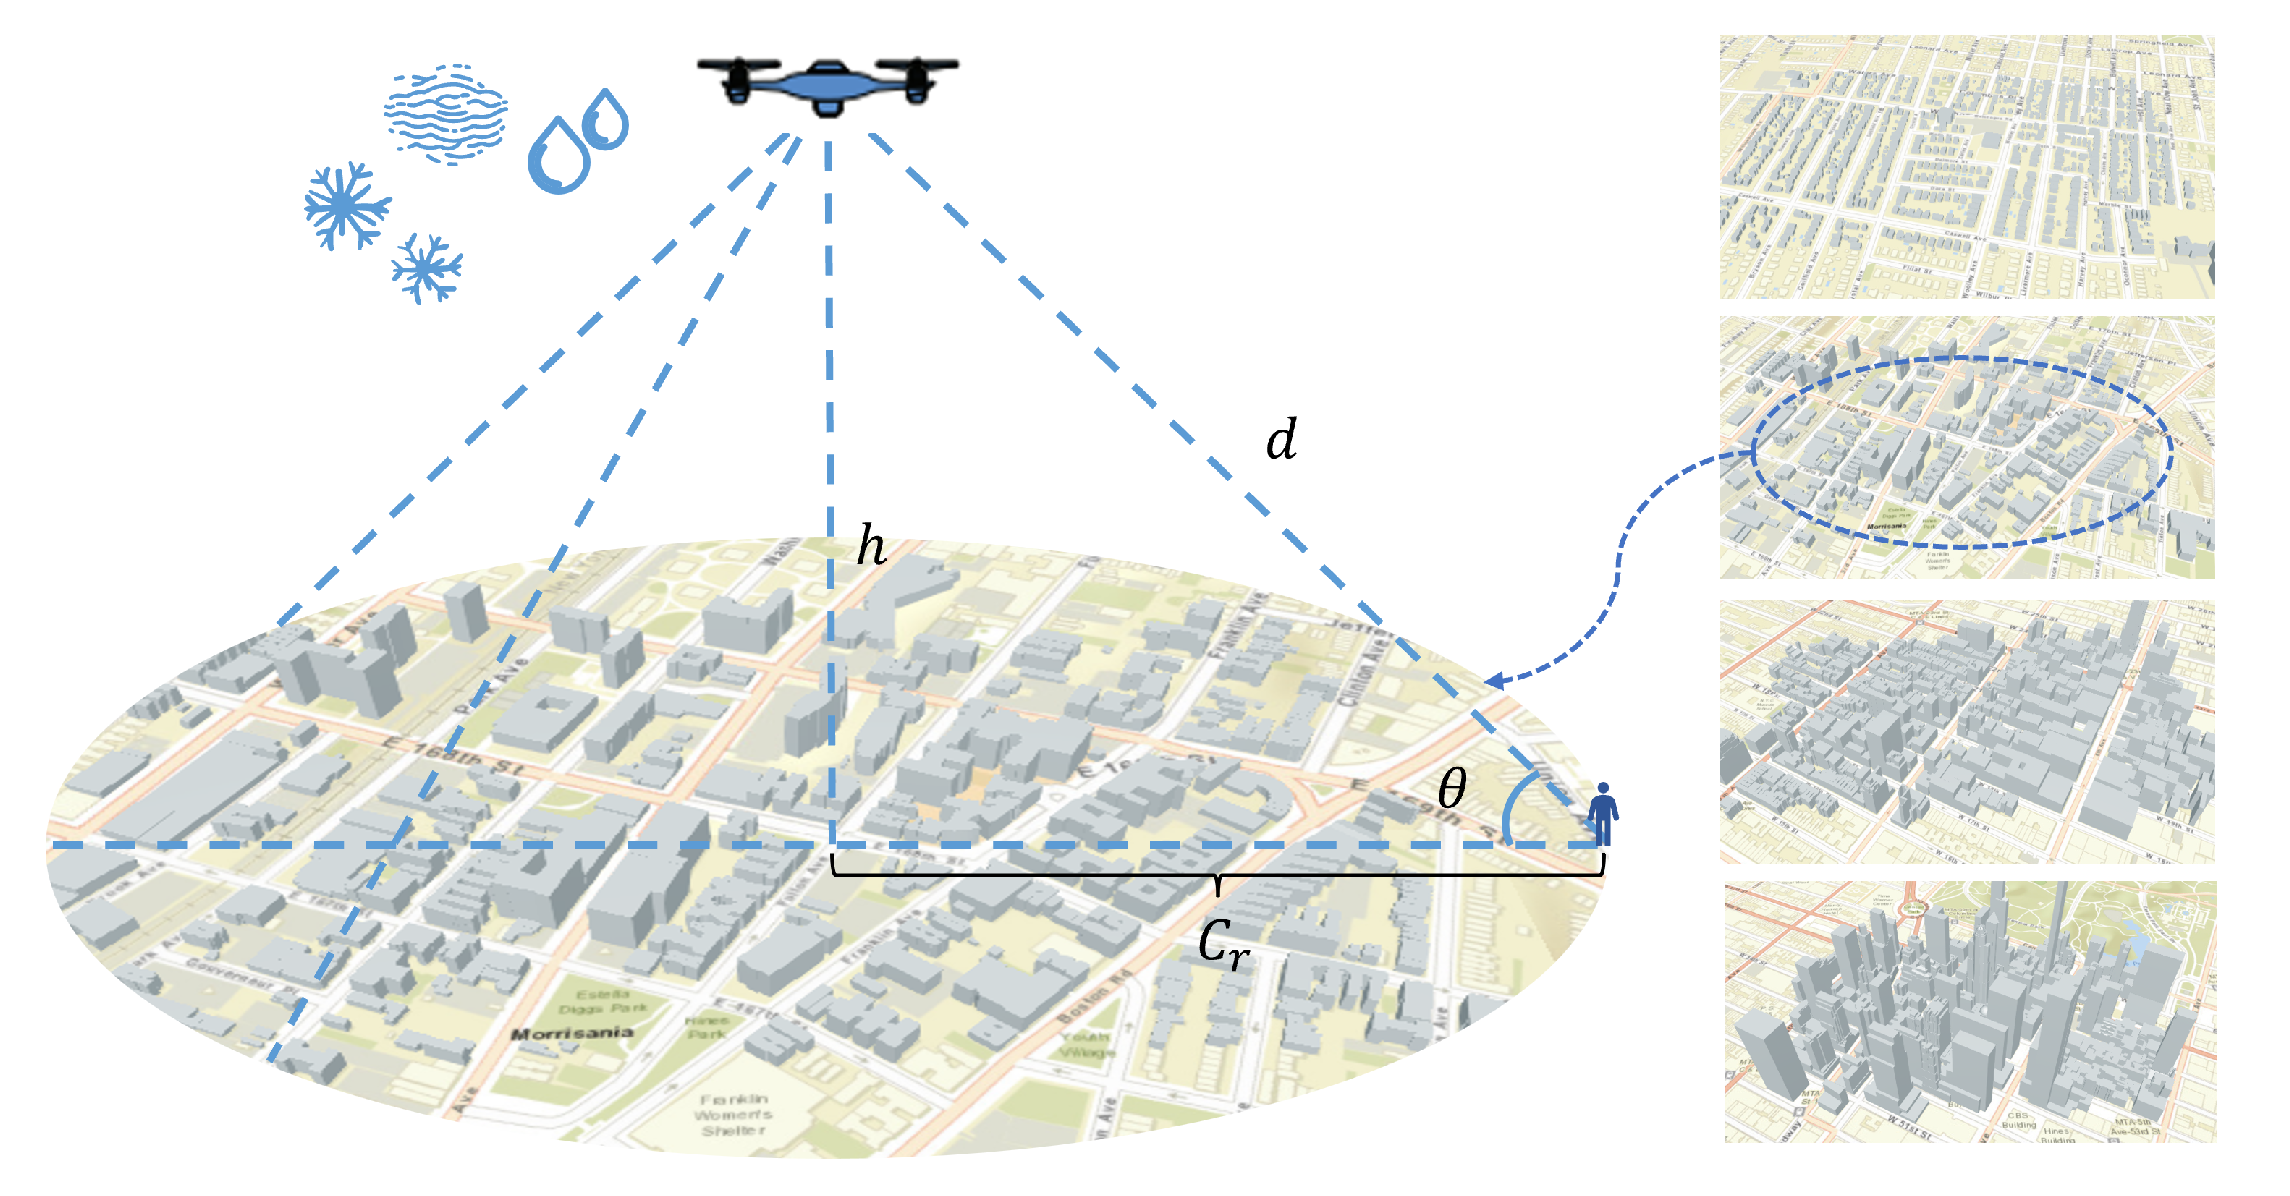
From the geometric relationship between the UAV and a ground user in one of the four selected regions, as shown in Figure 4, the distance between the UAV and ground user can be calculated as d = C r · sec θ . Since we need to explore the relationship between the coverage radius ( C r , in m) and elevation angle ( θ , in degree) of the UAV under the influence of different weather in the four regions, based on Equation (5), we give the implicit function of the coverage radius of the UAV with respect to the elevation angle, as shown in Equation (10).
P L max   =   [ i · sin ( j θ   +   k )   +   l · sin ( m θ   +   n ) ]   ×   η L o S     η N L o S   +   20 log ( C r · sec θ ) +   20 log 4 π λ   +   η N L o S   +   ( β   +   γ ) ( C r · sec θ ) 1000 ,   0     θ     70 ,
where P L max represents the maximum allowable path loss, and its value is set to 114 dB [17], and η N L o S   =   η N L o S 1 ,   η N L o S 2 ,   η N L o S 3 , γ   =   γ rain ,   γ fog ,   γ snow .

3.1. UAV Coverage Radius with Elevation Angle Considering Gaseous Attenuation Only

In this section, we analyze the relationship between the coverage radius of the UAV and the UAV elevation angle under the influence of the atmosphere only. We remove the specific attenuation of weather ( γ ) in Equation (10), and then the corresponding implicit function of the coverage radius of the UAV with respect to the elevation angle under the influence of the atmosphere only can be obtained. The ambient temperature is assumed to be 15 degrees Celsius.
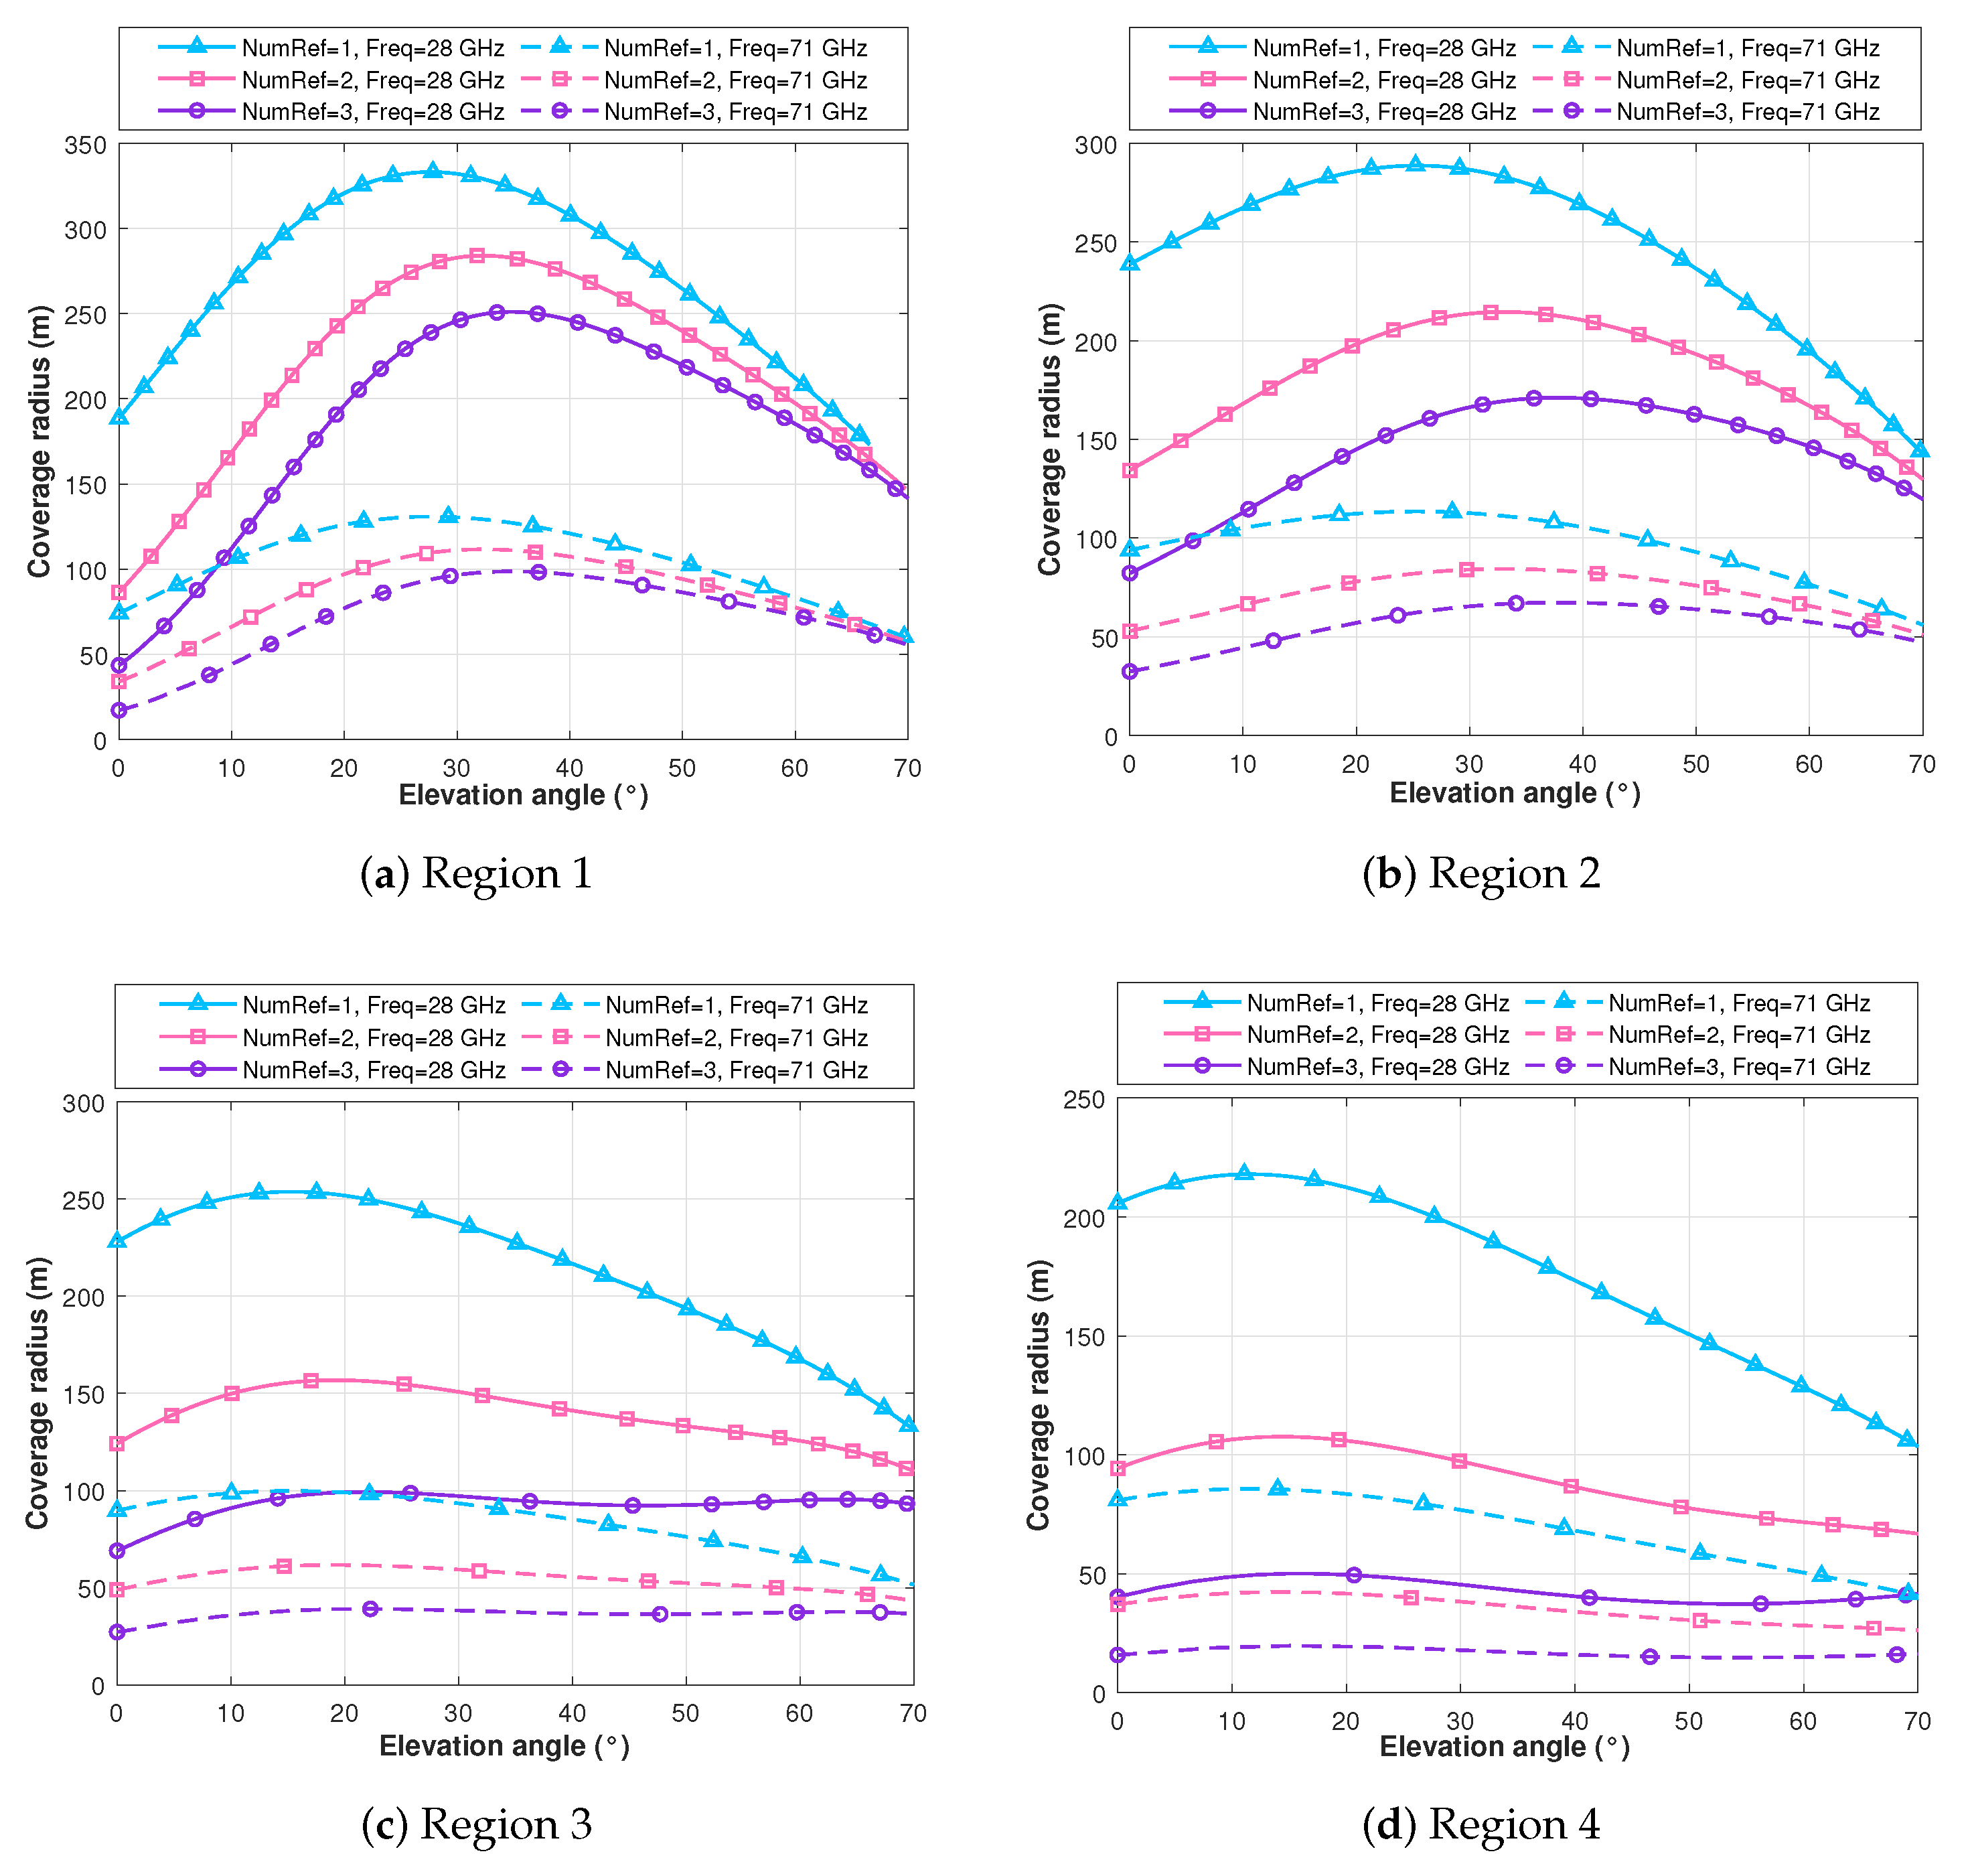
The UAV coverage radius and the elevation angle in four distinct regions, considering gas-only environments, are depicted in Figure 5. We can observe the following trends. First, the coverage radius of the UAV operating at 28 GHz (solid line) is generally larger than that at 71 GHz (dashed line) under the same number of reflections in each region. Second, for a given frequency, the coverage radius of the UAV decreases as the number of reflections increases. Lastly, the coverage radius of the UAV in the four selected regions (suburban, urban, dense urban, and high-rise urban) decreases sequentially. Specifically, based on Figure 5, we summarize the maximum coverage radius of the UAV in Table 3. By analyzing these maximum coverage radius data, we find some interesting regularities. For example, in Region 1, under the two frequency conditions, the maximum coverage radius based on two reflections is reduced by 15% compared with that of one reflection, and the maximum coverage radius based on three reflections is reduced by 25% compared with that of one reflection. The reduction percentages of the maximum coverage radius based on two and three reflections compared to that of one reflection in the four regions are summarized in Table 4. It can be seen that the reduction percentage of the maximum coverage radius for different numbers of reflections compared to one reflection is independent of the frequency from Table 4. In addition, under the two frequency conditions, compared with the maximum coverage radius based on one reflection in Region 1, the reduction percentages in the other three regions are 13%, 24%, and 35%, respectively.

3.2. UAV Coverage Radius with Elevation Angle under Different Weather Conditions

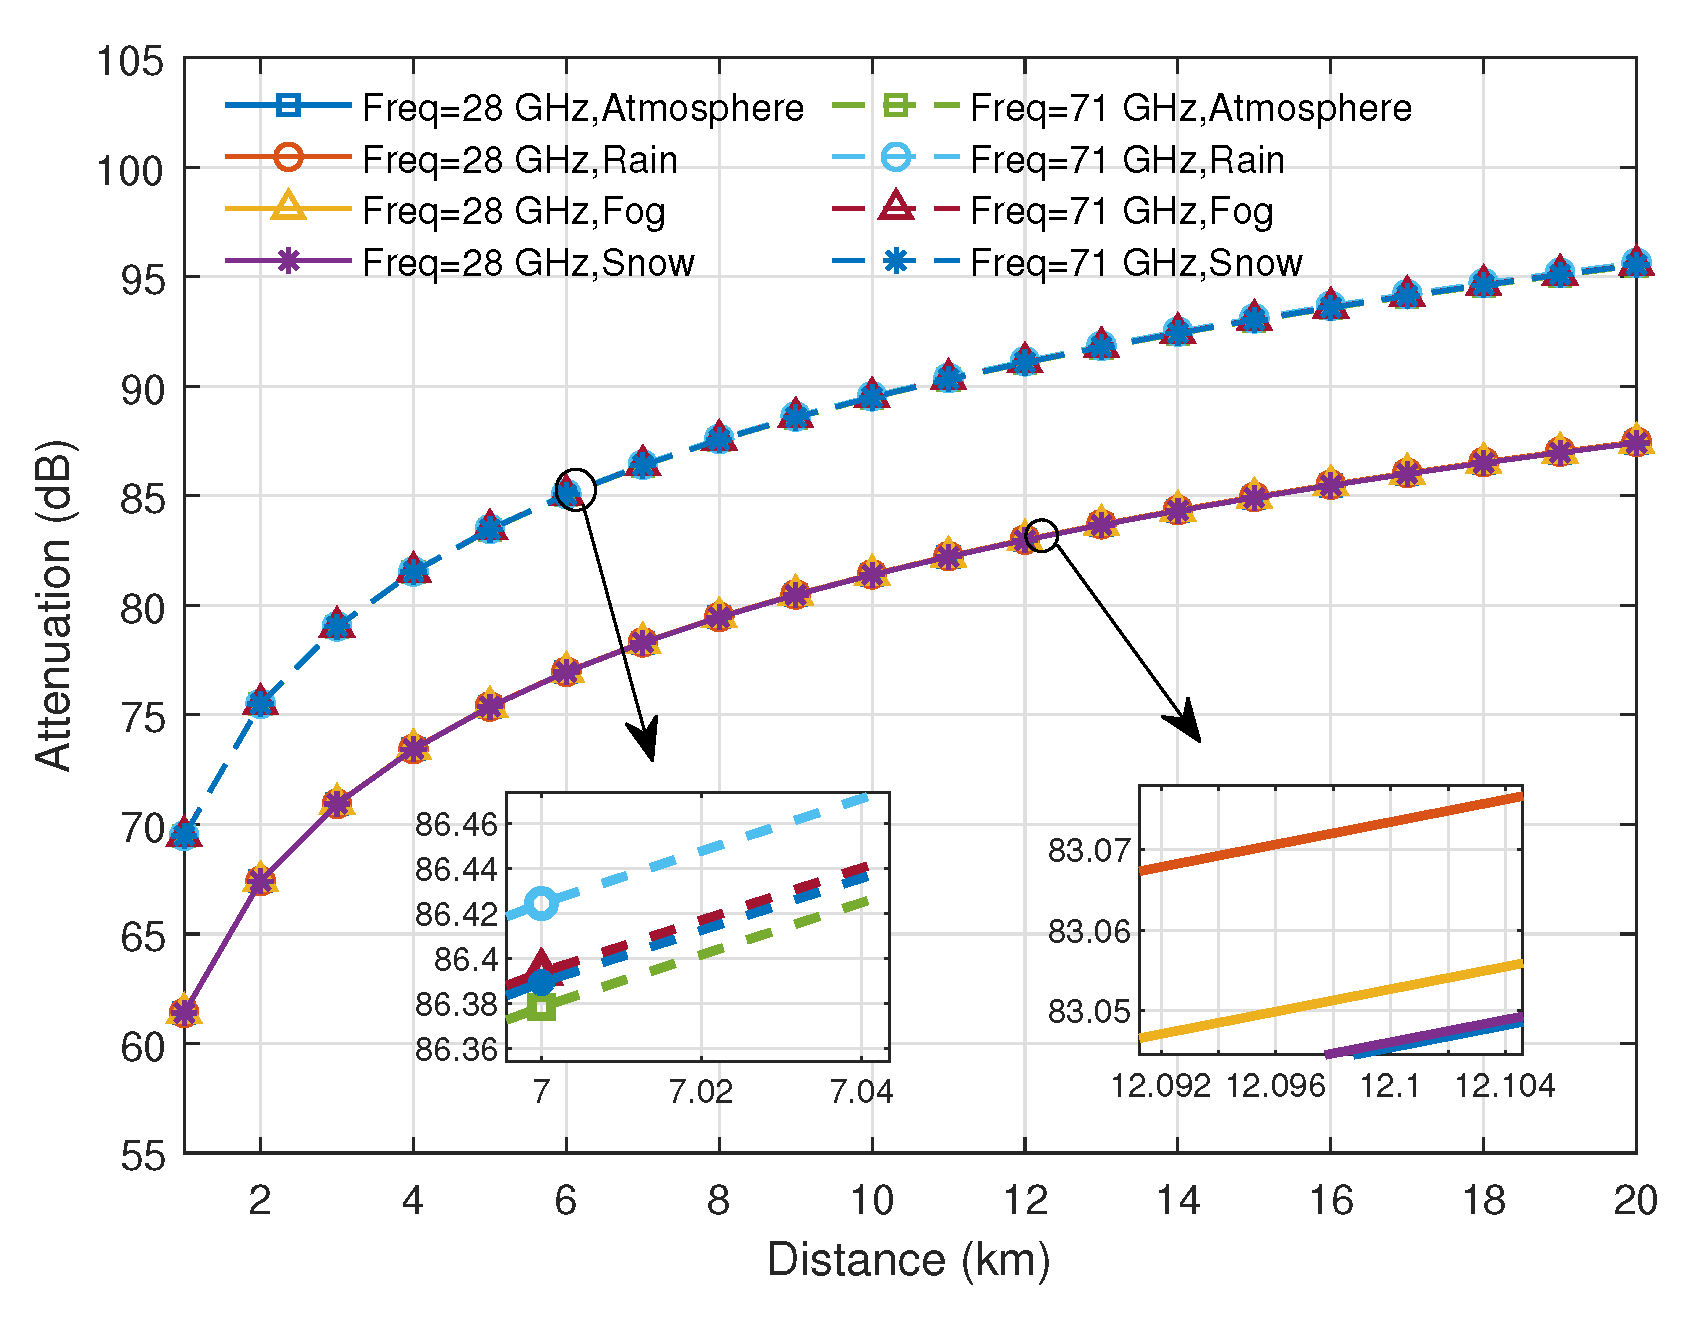
In this subsection, we analyze the impact of specific attenuation due to rain, fog, dry snow, and gas on the communications between the UAV and ground receivers. For simplicity, we only consider the case of η N L o S   =   η N L o S 1 in Equation (10); then, we can obtain the corresponding implicit function of the maximum coverage radius of the UAV with respect to the elevation angle. The rainfall rate ( R rain ), liquid water density ( R fog ), and snowfall rate ( R snow ) are set as 12.5 mm/h, 0.5 g / m 3 , and 5 mm/h, respectively. The relationships between the UAV coverage radius and the elevation angle under rain, fog, and dry snow in the four regions are shown in Figure 6. In addition, for convenience of comparison, we add the relationship curves between the coverage radius and elevation angle of the UAV when there are only atmospheric conditions. As shown in Figure 6, the coverage radius of the UAV at the frequency of 28 GHz is greater than that at the frequency of 71 GHz in all four regions. Furthermore, the relationship between the UAV coverage radius under different weather conditions is C r gas   >   C r snow   >   C r fog   >   C r rain , where C r denotes the UAV coverage radius. It can be seen that under different weather conditions, rain has the greatest impact on the coverage radius of the UAV, which is due to the different degrees of attenuation of the propagation signal by the several weather models that we introduce. Based on our previous work [16], the attenuation of the propagated signal caused by different weather conditions at the two frequencies of 28 GHz and 71 GHz is compared, as shown in Figure 7. We can see that the degree of attenuation of the propagation signal by rain is the largest among the three types of weather from Figure 7.
Specifically, the maximum UAV coverage radius data under different weather conditions in the four regions are summarized in Table 5. Based on these maximum coverage radius data, the percentage reductions in the maximum coverage radius for different weather conditions relative to atmospheric conditions are summarized in Table 6. We found that the percentage reduction in the coverage radius under different weather conditions was generally greater at 71 GHz than at 28 GHz in the four regions. At the same time, we summarize the percentage reductions in the maximum coverage radius for Regions 2 to 3 under snow, fog, and rain conditions relative to Region 1 in Table 7. Based on the data in this table, we find that under various weather conditions, relative to Region 1, the percentage reduction in the maximum coverage radius of Region 2 to Region 4 increases gradually, and the extent of each increase is approximately 10%. In addition, the difference caused by different frequencies in the percentage reduction in the coverage radius is very small, and the coverage radius reduction percentage at 71 GHz is approximately 1% smaller than that at 28 GHz in Table 7.
It is worth noting that for each weather condition and frequency, there is a maximum UAV coverage radius at a certain elevation angle, which we refer to as the optimal elevation angle. The height of the UAV also becomes the optimal height at this angle. Specifically, for rain, the maximum UAV coverage radius can be found for each rainfall rate ( R rain ), as well as the corresponding UAV optimal elevation angle and optimal height. Similarly, for fog and snow, the maximum UAV coverage radius can be found for each liquid water density ( R fog ) and each snowfall rate ( R snow ). In the next subsection, we discuss the impacts of the rainfall rate, liquid water density, and snowfall rate on various aspects of UAV–ground communications.

3.3. The Impacts of R rain , R fog , and R snow on UAV–Ground Communications

In this subsection, we analyze the influence of the rainfall rate, liquid water density, and snowfall rate on the maximum coverage area and the optimal height of the UAV, respectively. Then, we introduce the concept of compensated path loss and give its calculation method. The subsection is divided into three parts.

3.3.1. Influence of R rain , R fog , and R snow on the Maximum Coverage Area of the UAV

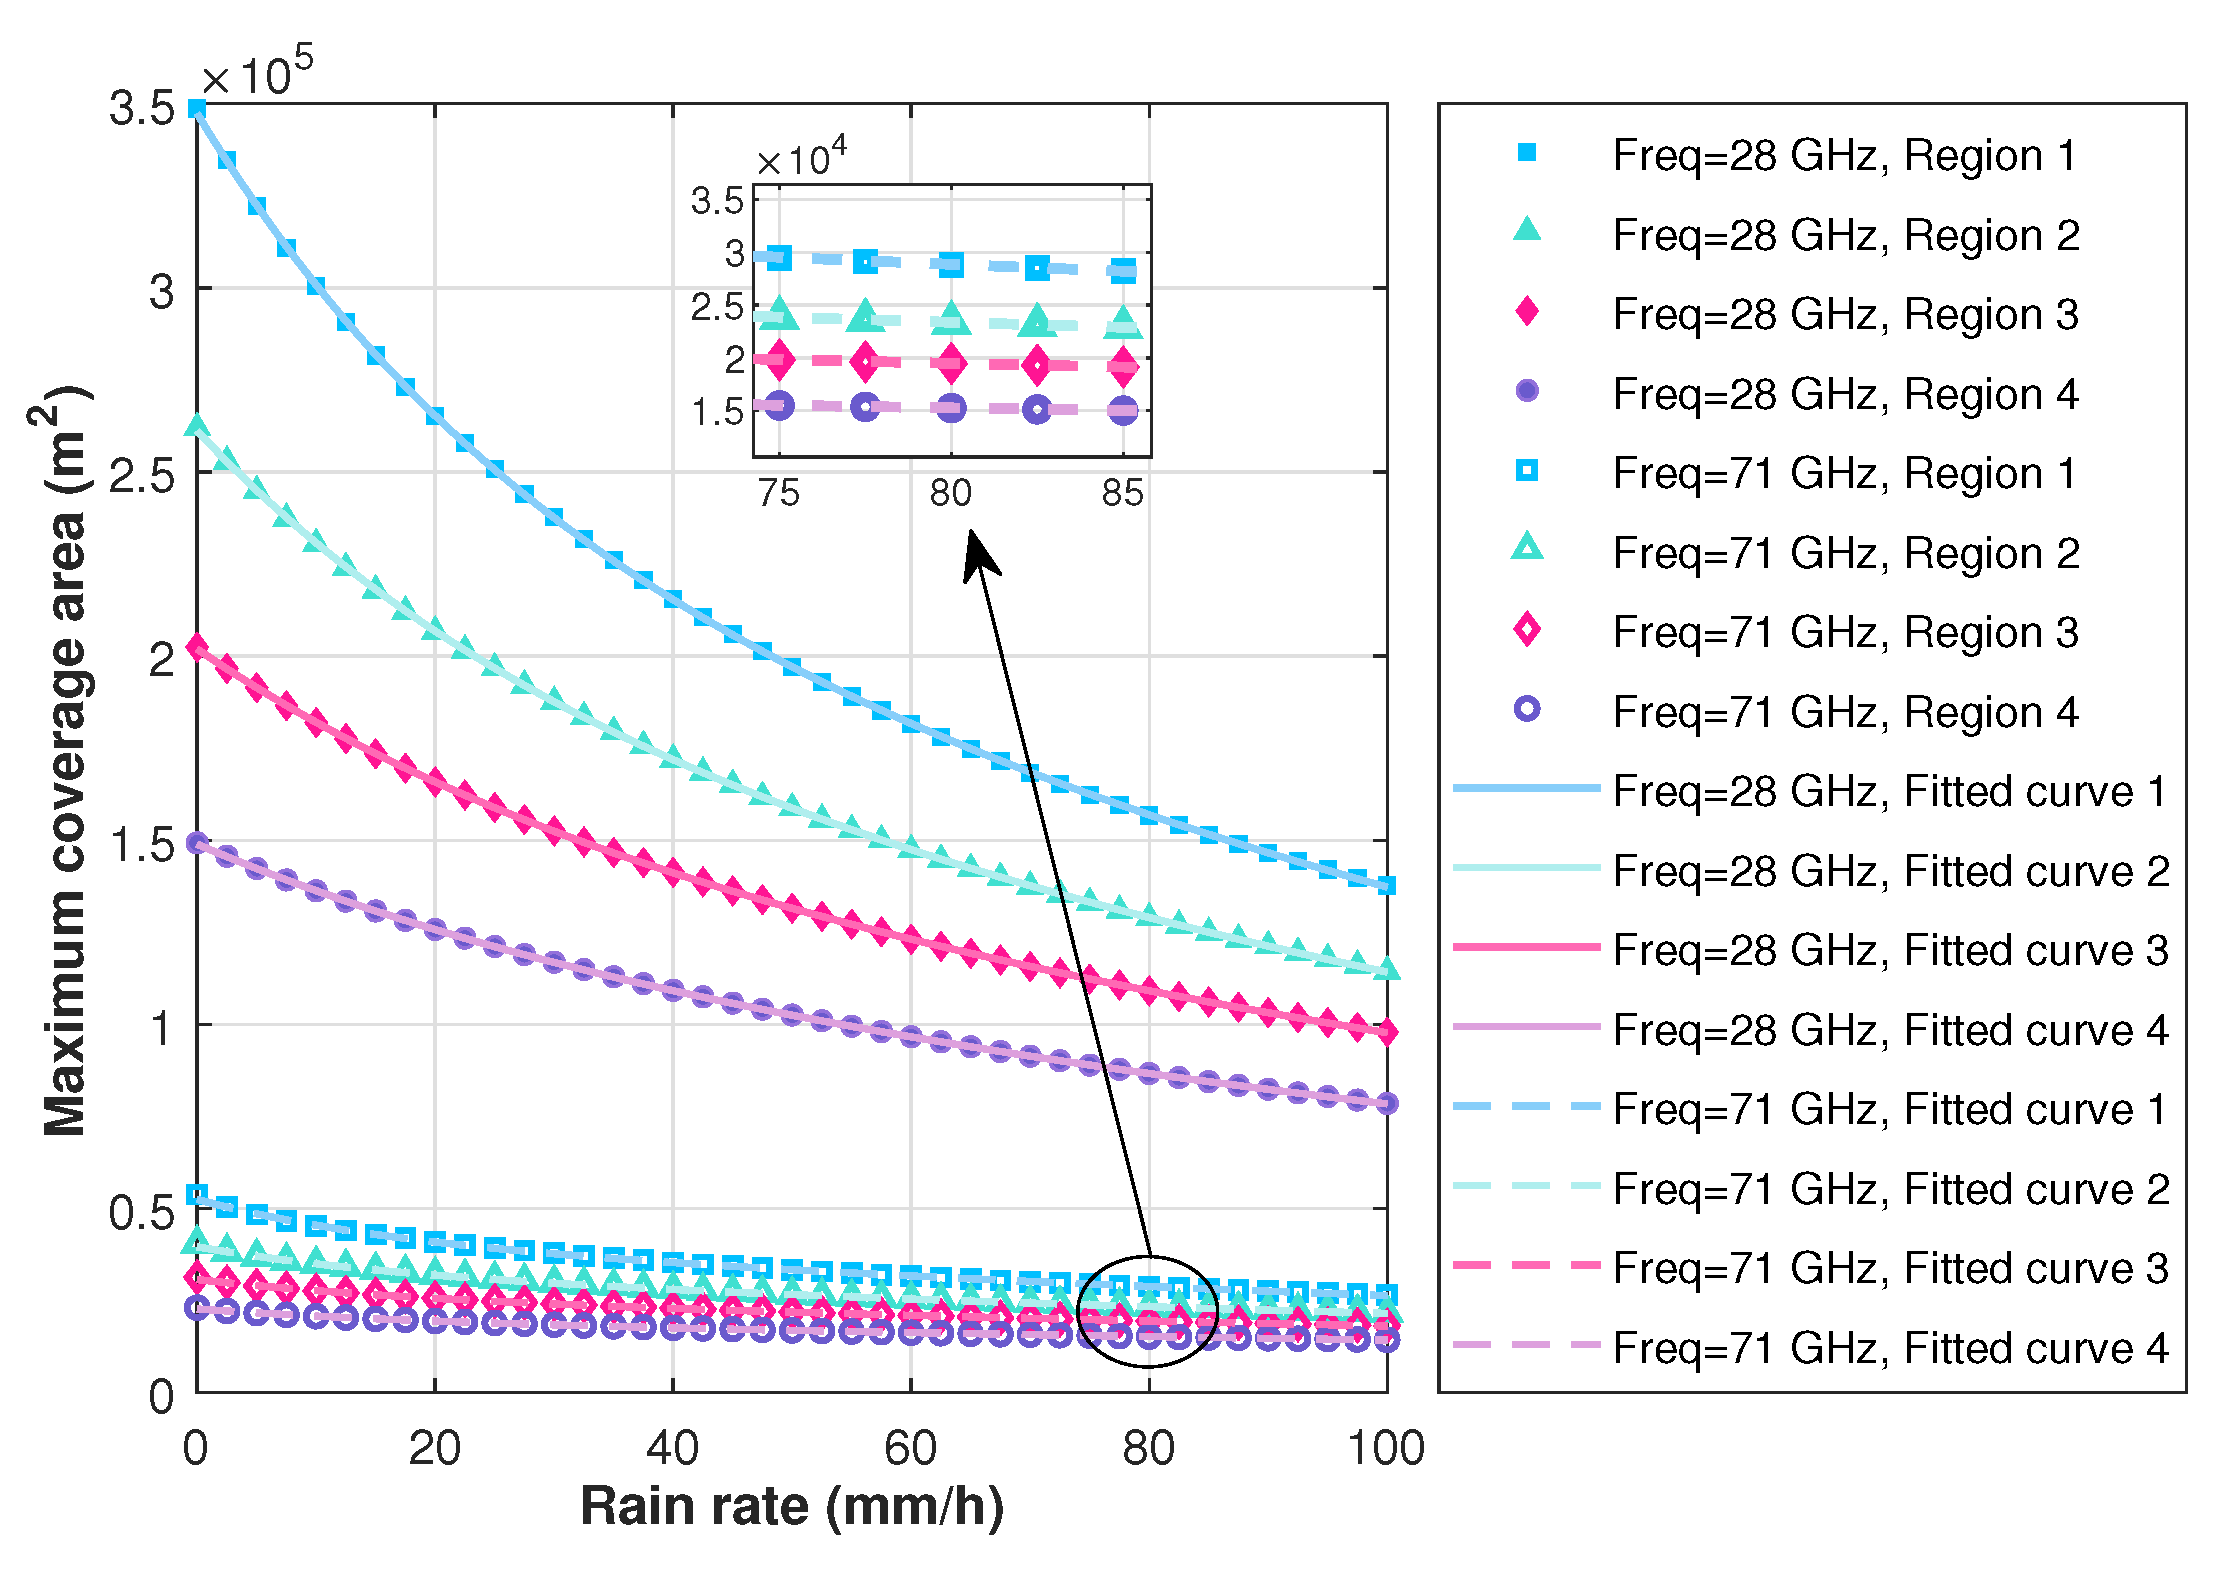
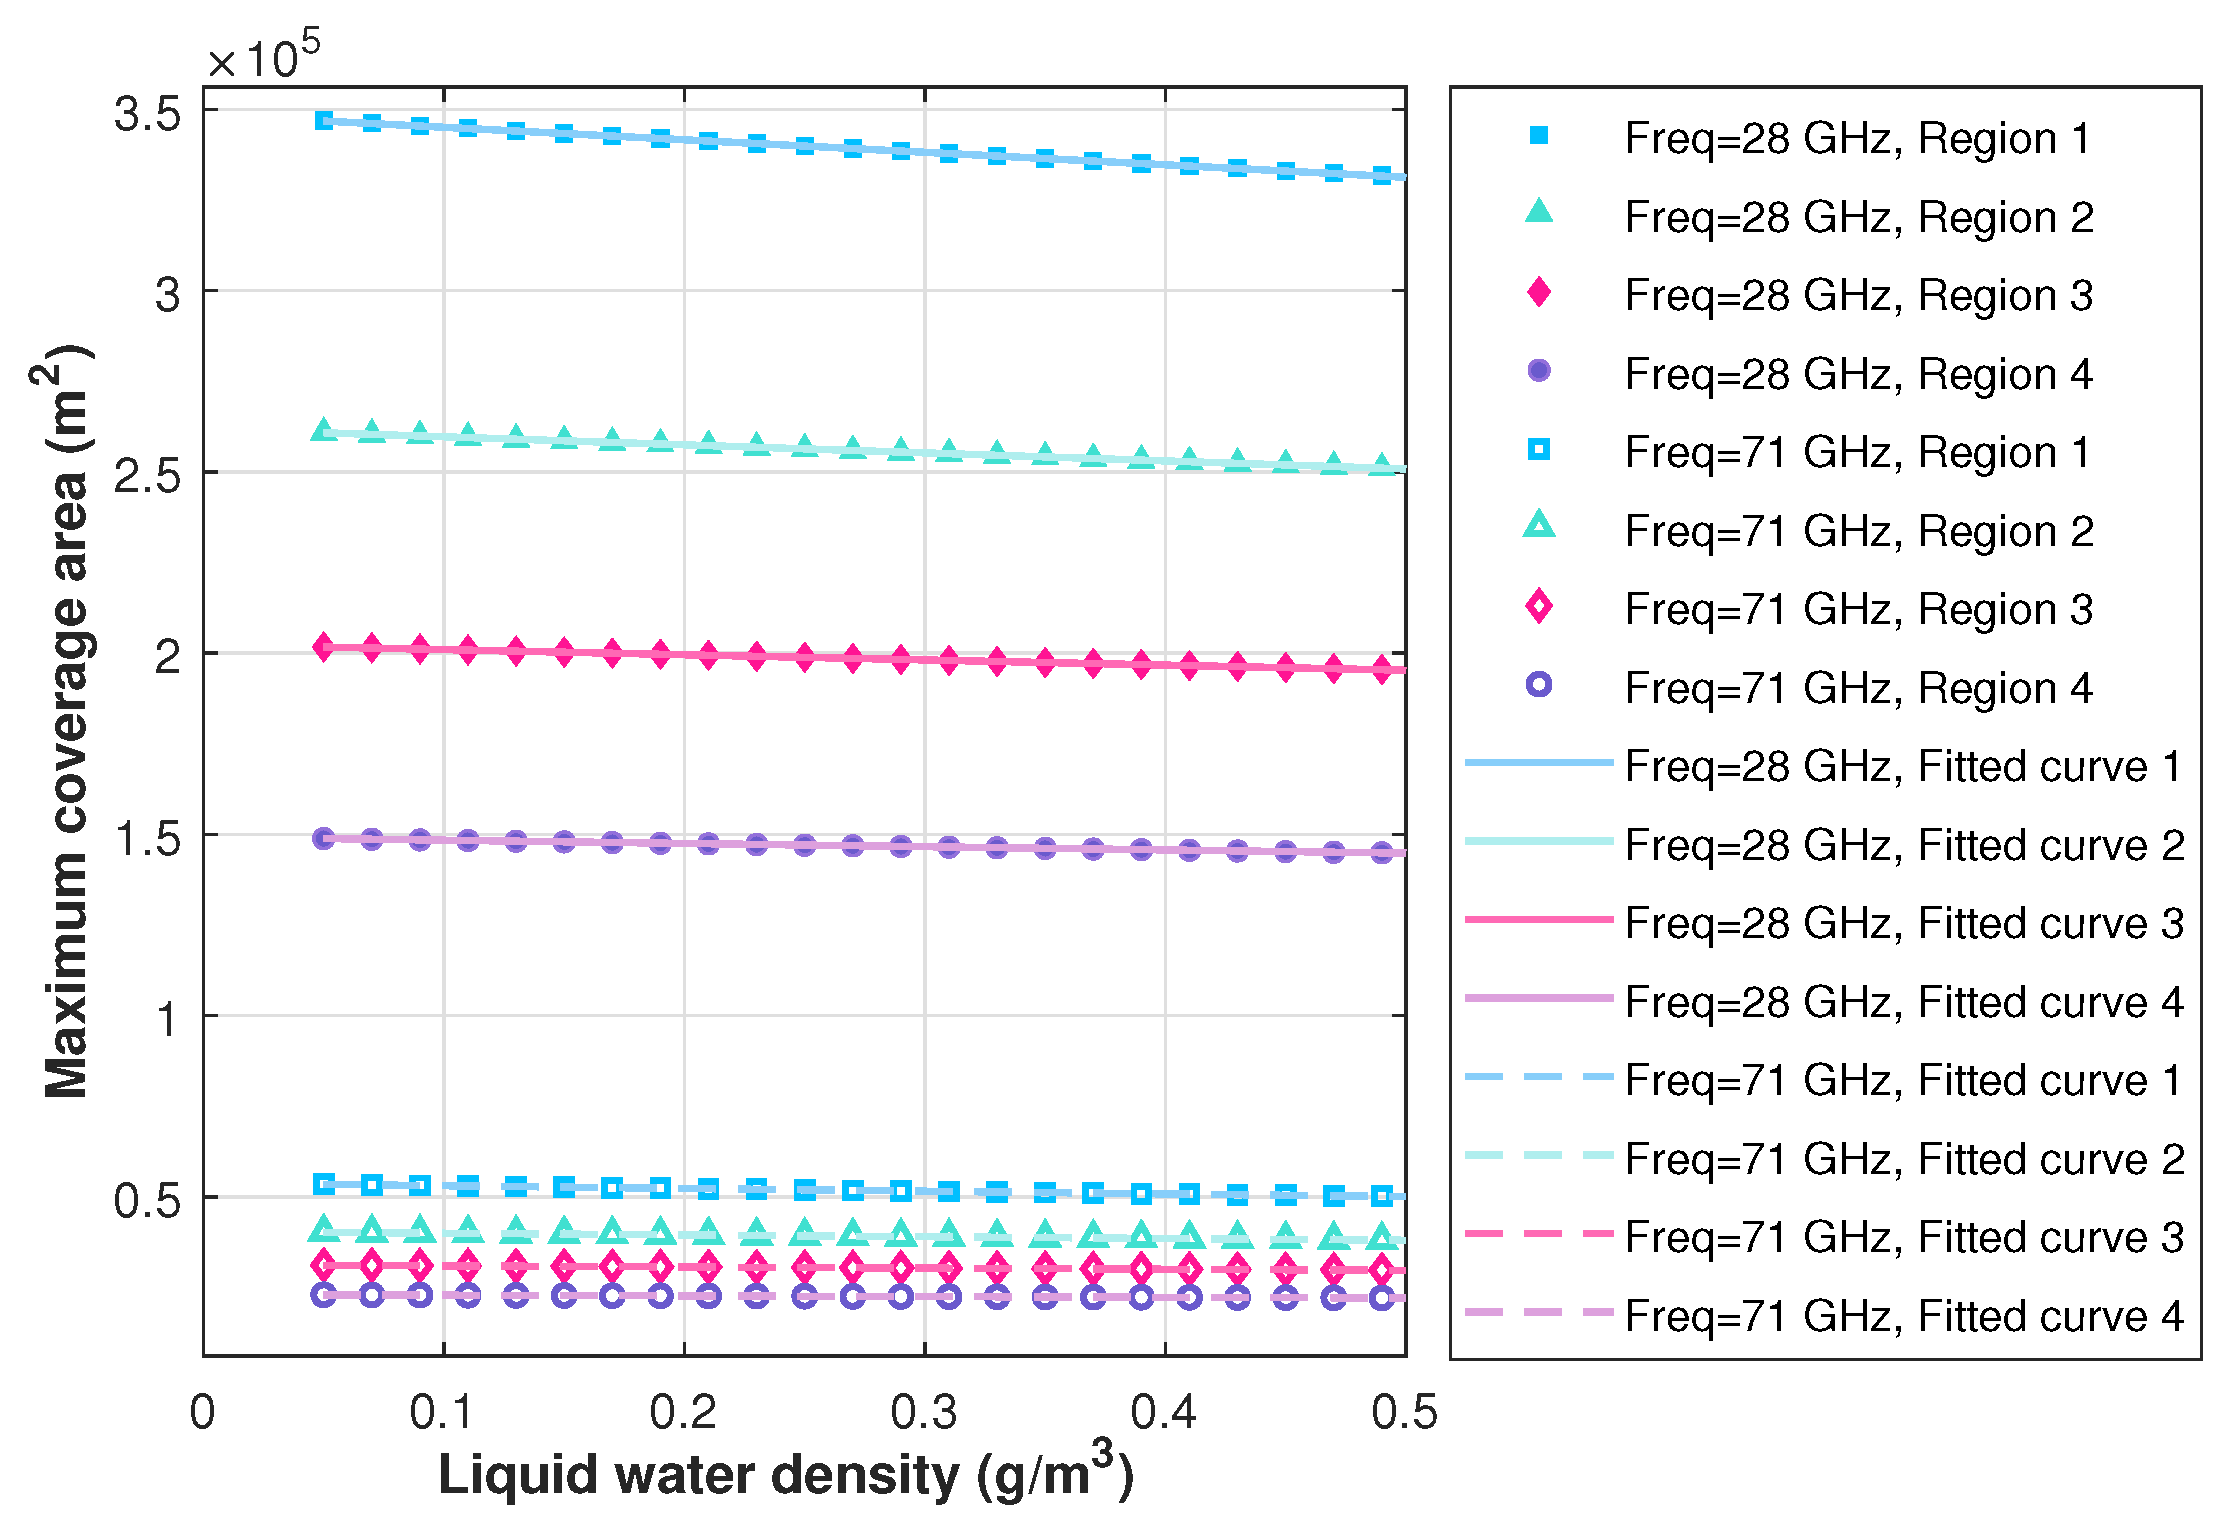
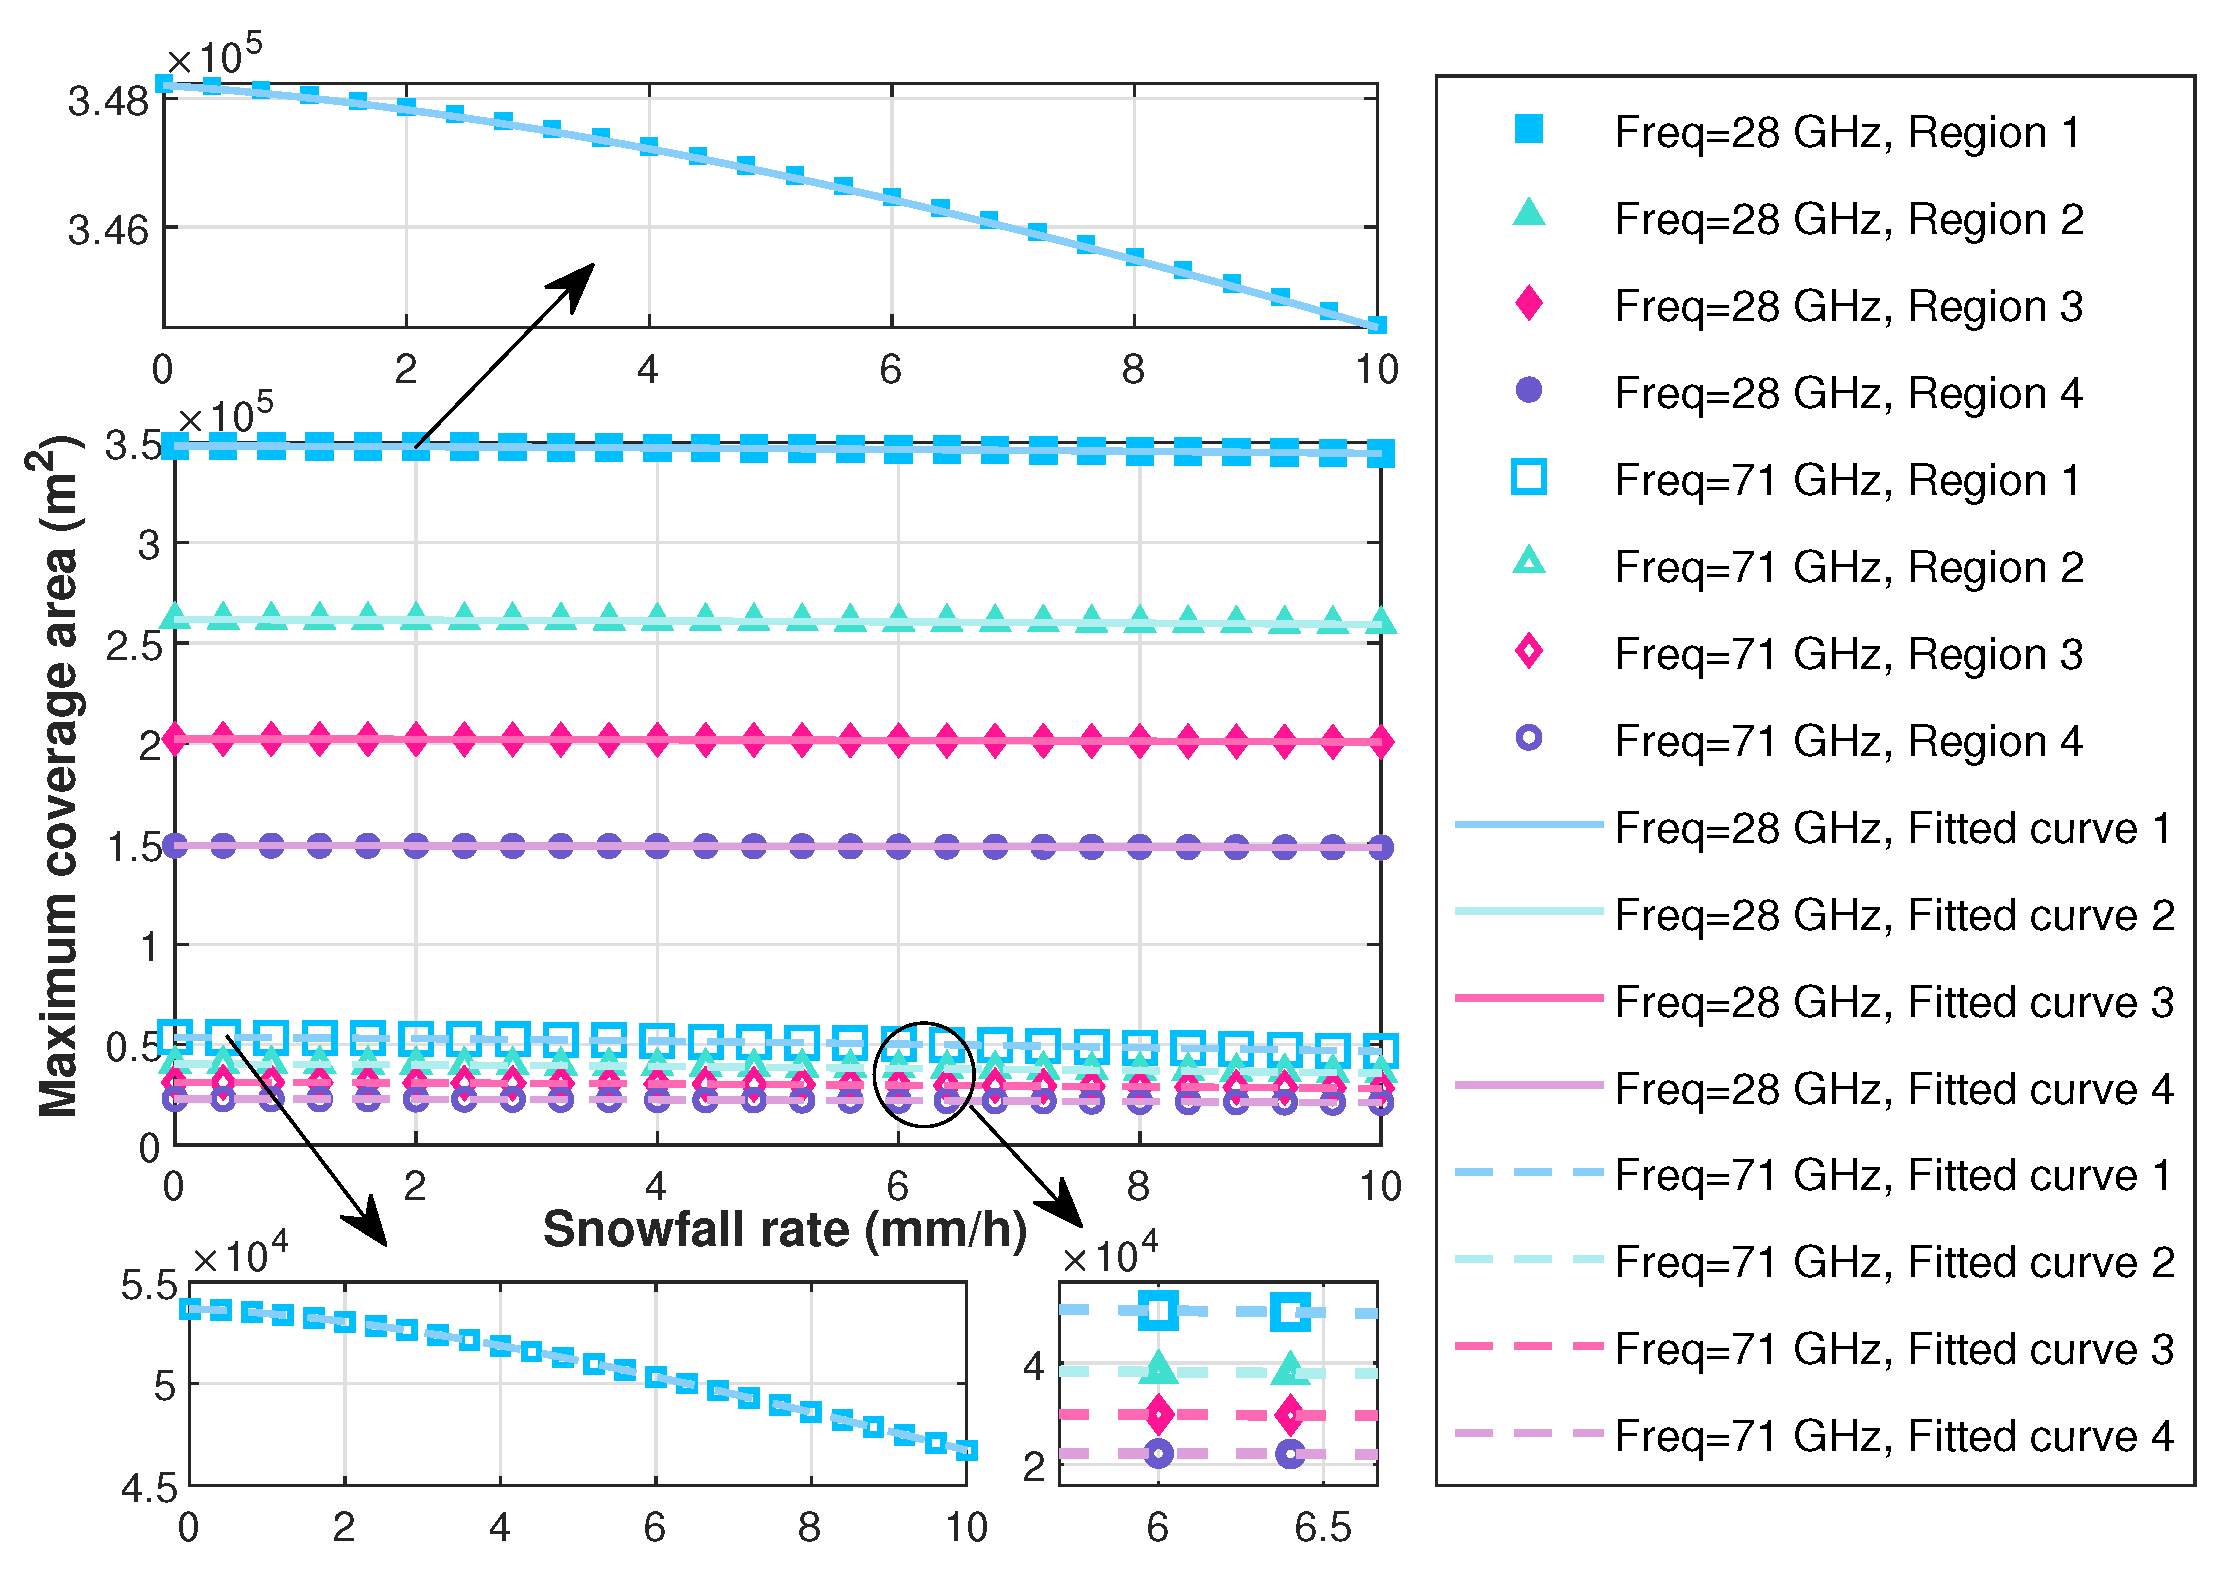
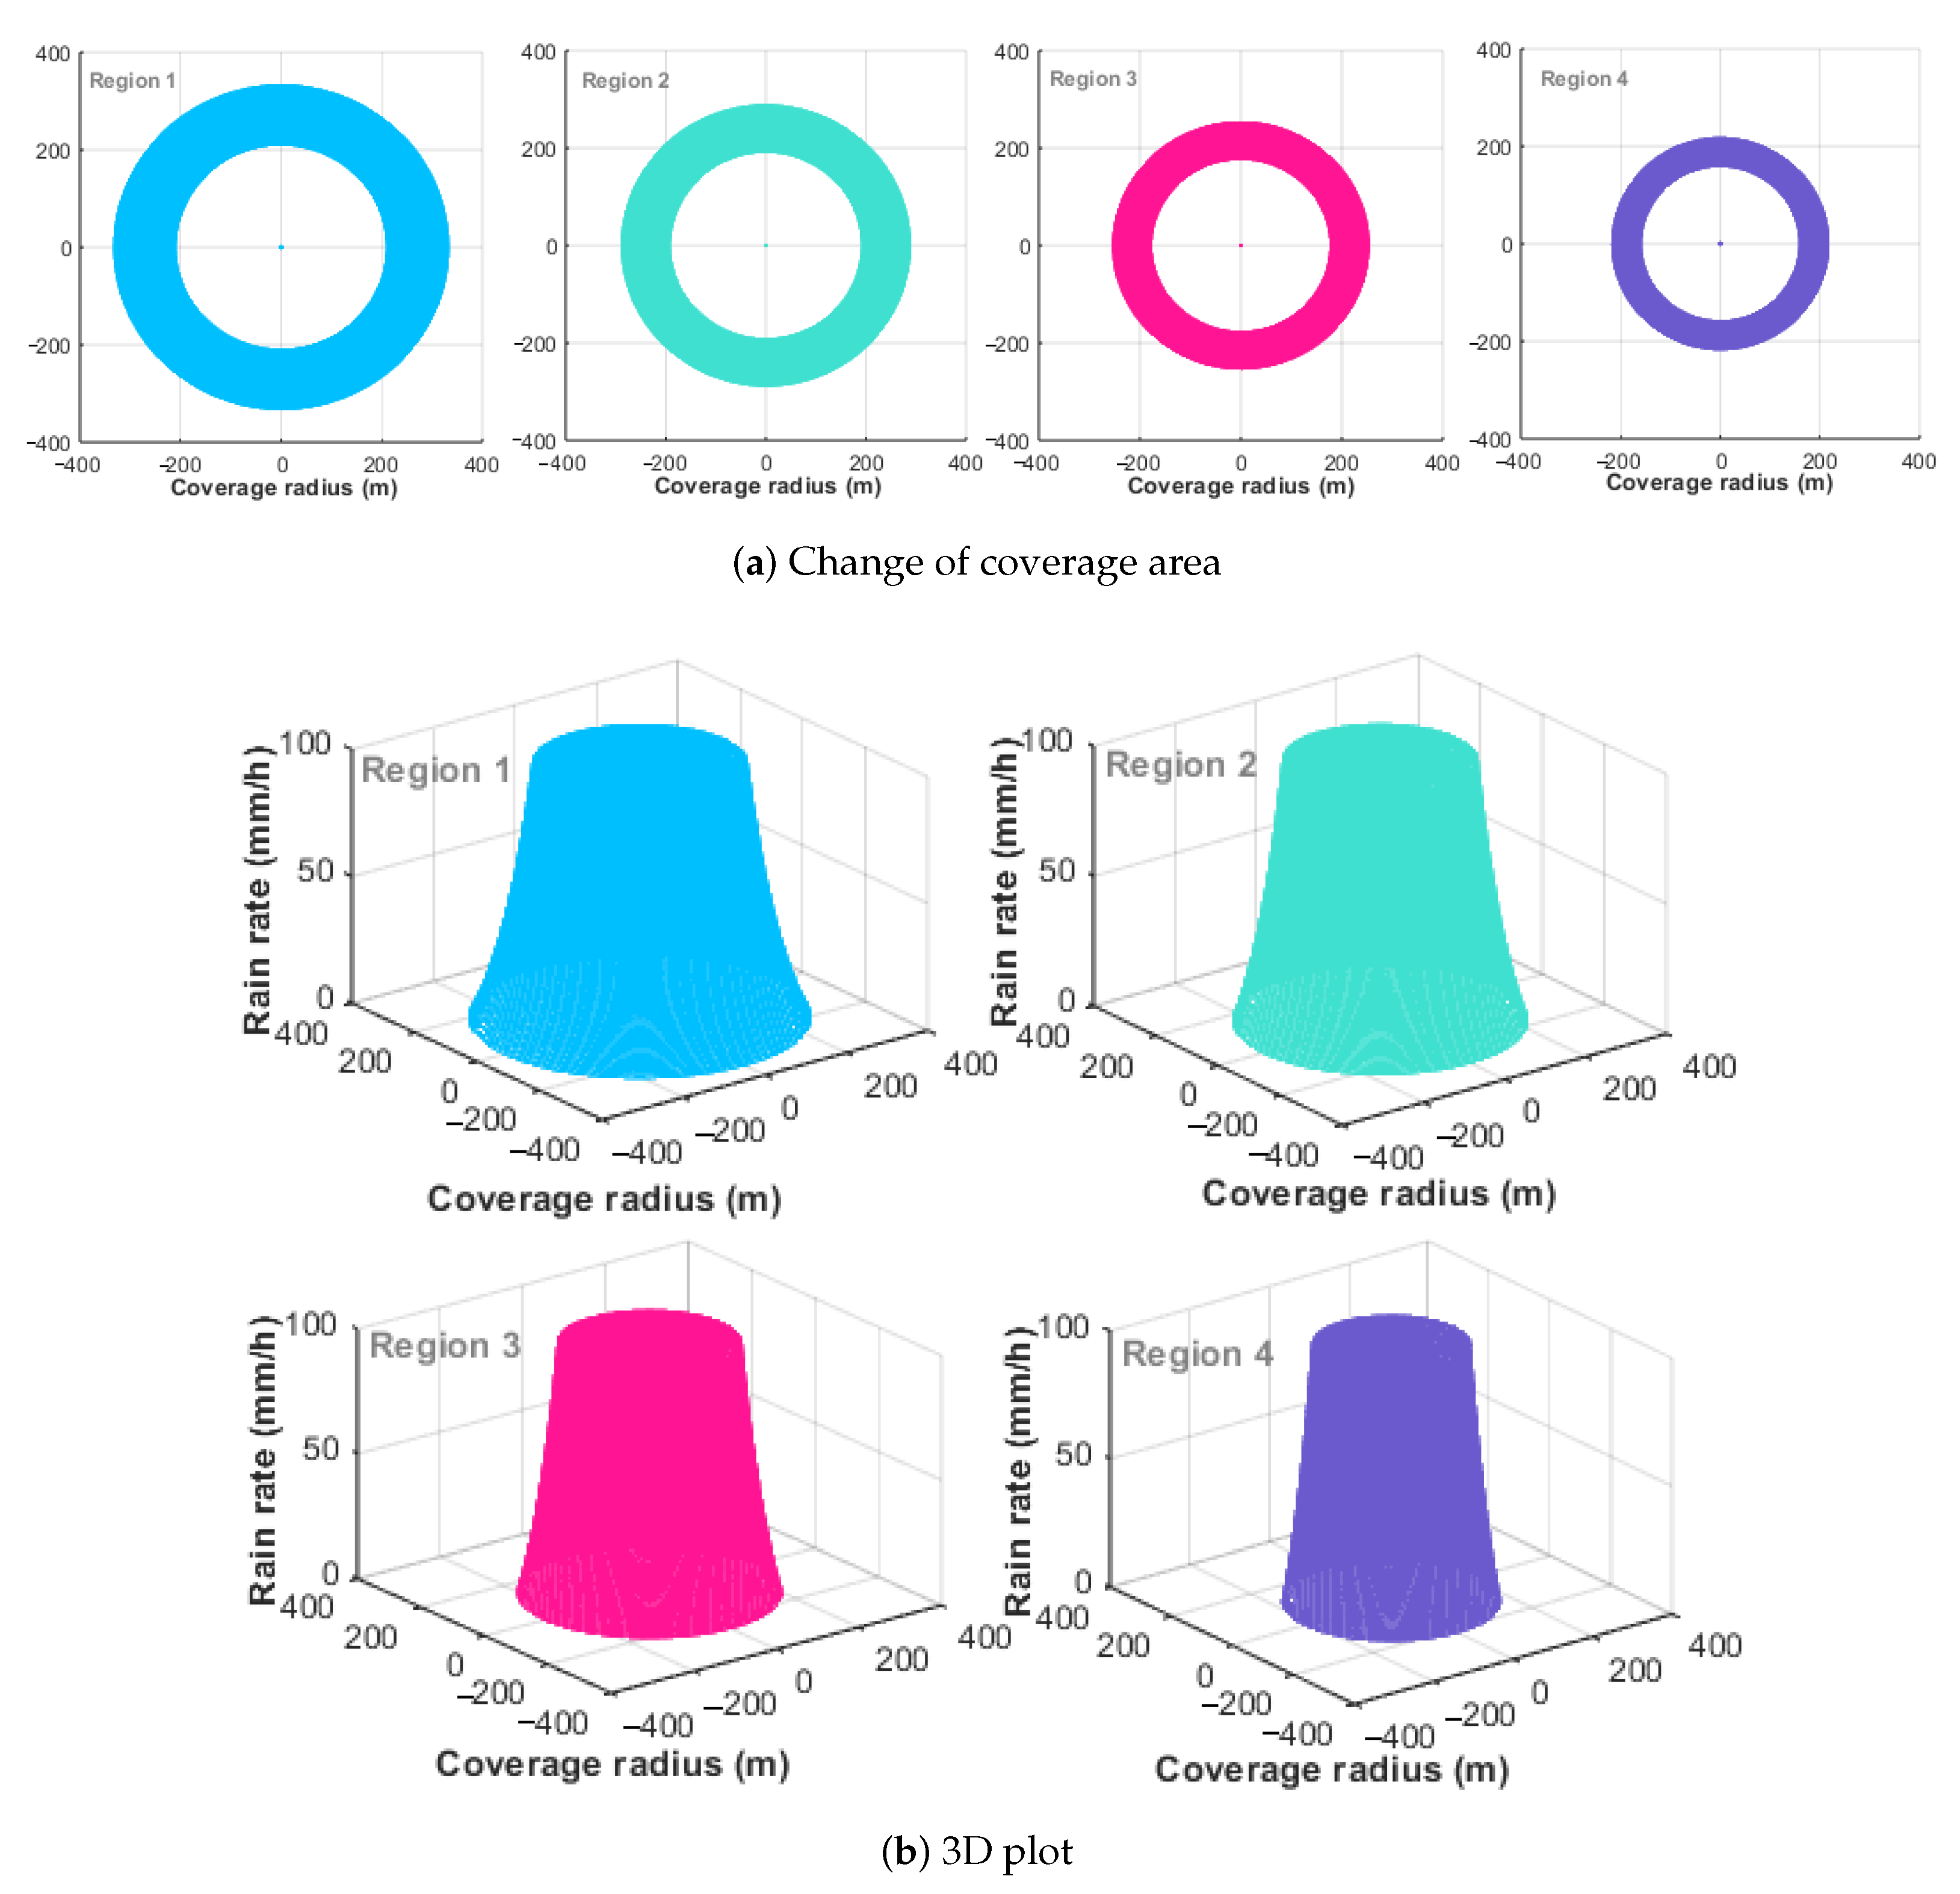
The relationships between the UAV maximum coverage area and the rainfall rate, the liquid water density, and the snowfall rate in the four regions are illustrated in Figure 8, Figure 9, and Figure 10, respectively. Each discrete marker point represents the UAV’s maximum coverage area calculated based on the corresponding rainfall rate, liquid water density, and snowfall rate, respectively. Moreover, the solid and dashed lines show the fitting curves for the frequencies of 28 GHz and 71 GHz, respectively. Additionally, to visually demonstrate the impact of the rainfall rate on the UAV coverage area, we present the change in the maximum coverage area of the UAV caused by the rainfall rate and its 3D plot in the four regions at a frequency of 28 GHz, as shown in Figure 11. These figures reveal that the maximum coverage area of the UAV in each region decreases as the rainfall rate, the liquid water density, or the snowfall rate increases. Additionally, it is evident that the coverage areas of the UAV at 28 GHz are larger than those at 71 GHz in all four regions. Moreover, the extent of the decrease in the maximum coverage area of the UAV for each region is summarized in Table 8.
Based on Table 8, we found that in the four regions, for rain, the reduction in the coverage area at 28 GHz is 18,3640, 128,676, 91,418, and 62,006 m2 larger than that at 71 GHz, respectively. For fog, the reduction in the coverage area at 28 GHz is 12,149, 7802, 4999, and 3142 m2 larger than that at 71 GHz, respectively. Meanwhile, for snow, the reduction in the coverage area at 28 GHz is 3369, 2136, 1424, and 918 m2 smaller than that at 71 GHz, respectively. Therefore, when the frequency is 28 GHz, rain and snow have the largest and smallest effects on the UAV’s coverage area, respectively. When the frequency is 71 GHz, rain and fog have the largest and smallest effects on the coverage area of the UAV, respectively.
In contrast to the significant impact of the rainfall rate on the maximum coverage area of the UAV, the effects of the liquid water density and snowfall rate are less pronounced. By closely examining and comparing Figure 8, Figure 9 and Figure 10, we observe that the maximum coverage area of the UAV decreases exponentially with the rainfall rate and snowfall rate in Figure 8 and Figure 10. However, the maximum coverage area of the UAV in Figure 9 exhibits a linear decreasing trend with respect to the density of liquid water. The expressions derived for the fitted curves in these three figures are discussed in Section 4.1.

3.3.2. Effects of R rain , R fog , and R snow on the Optimal Height of the UAV

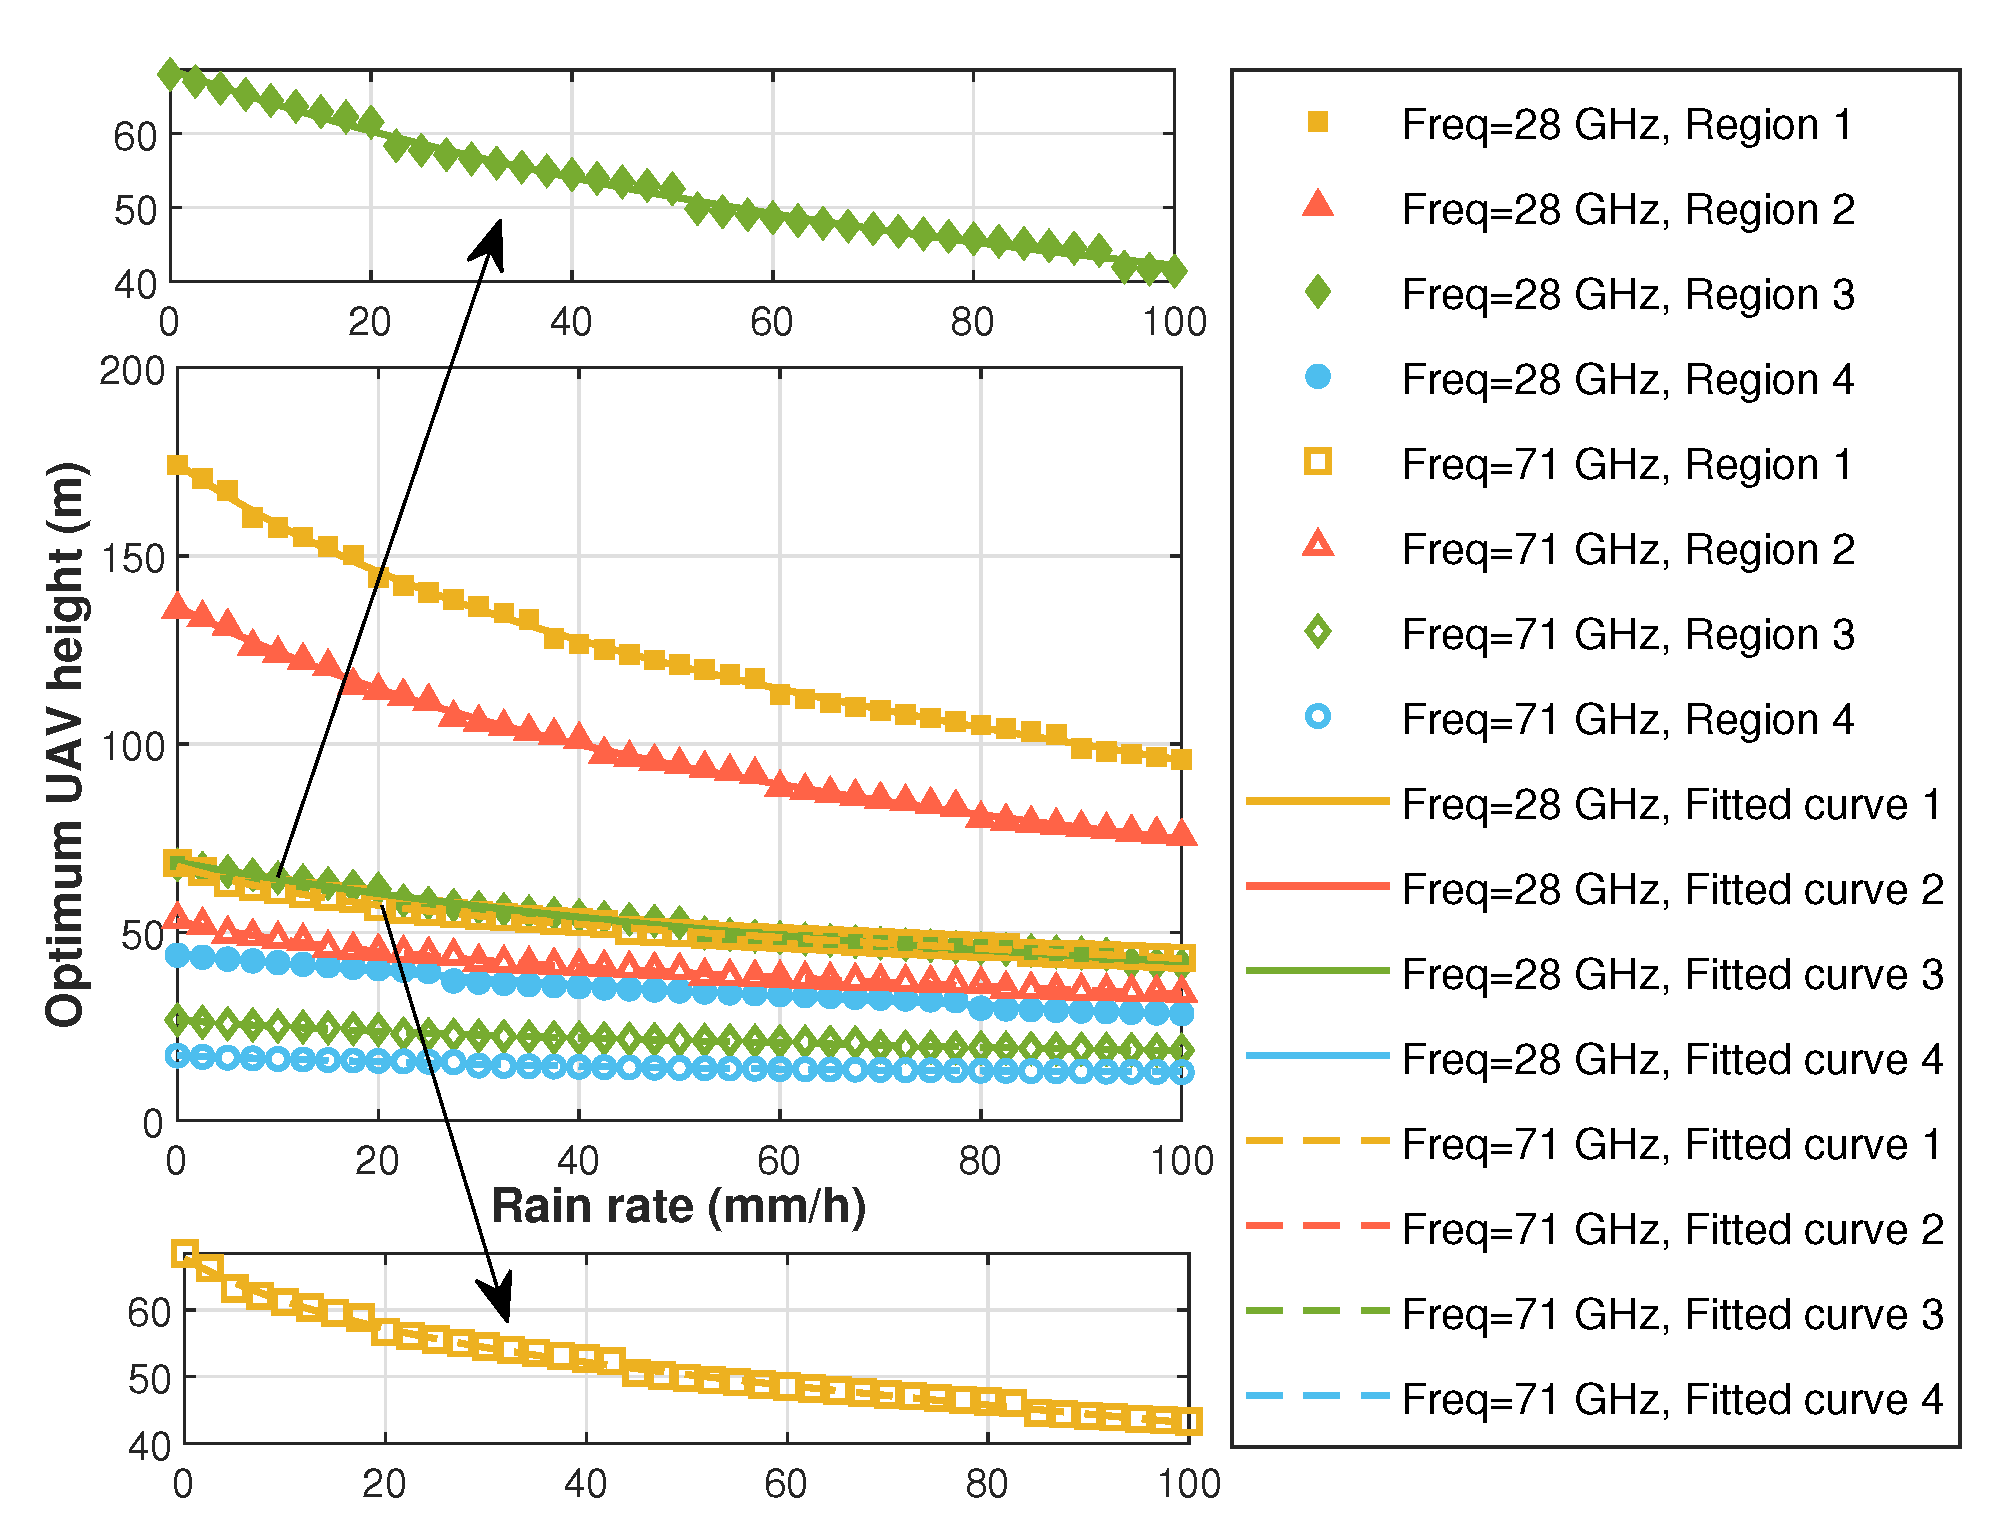
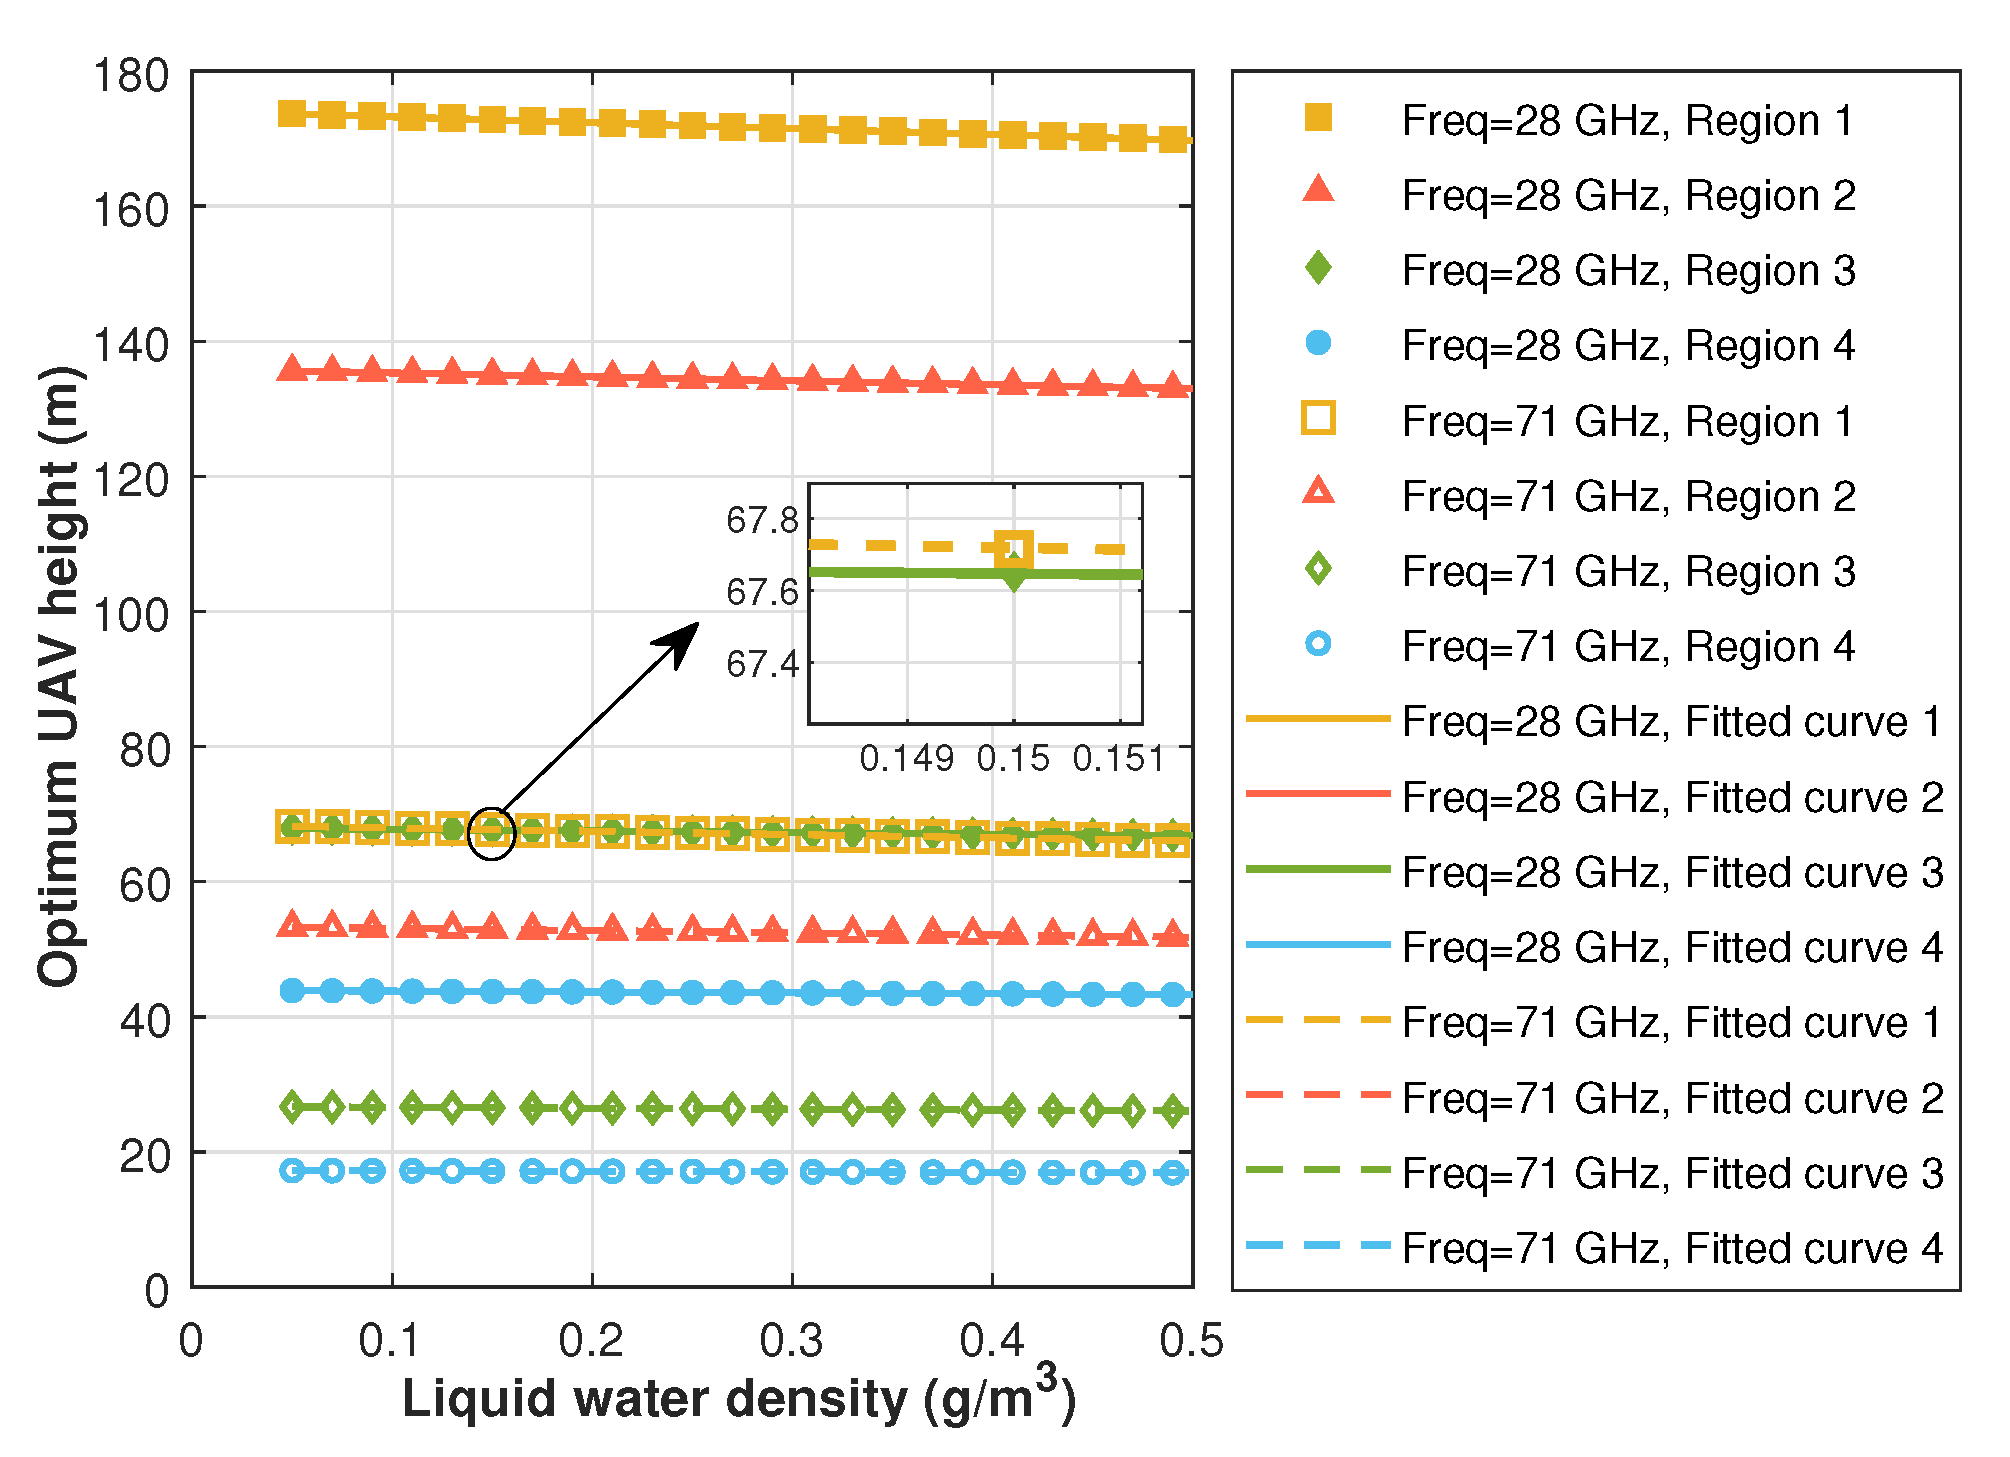
The relationships between the UAV’s optimal height and the rainfall rate, liquid water density, and snowfall rate in the four regions are illustrated in Figure 12, Figure 13, and Figure 14, respectively. In these figures, each discrete marker point represents the optimal height of the UAV calculated based on the respective rainfall rate, liquid water density, or snowfall rate. The solid and dashed lines indicate the fitting curves for the frequencies of 28 GHz and 71 GHz, respectively.
The extents of the decrease in the optimal height of the UAV due to increases in rainfall rate, liquid water density, and snowfall rate are summarized in Table 9. It can be seen from the three figures (Figure 12, Figure 13 and Figure 14) and Table 9 that when the frequency is 28 GHz, the decreases in the optimal heights of the UAV in the four regions due to rain, fog, and snow are over 15 m, 0.6 m, and 0.1 m, respectively. When the frequency is 71 GHz, the decreases in the optimal height of the UAV in the four regions due to rain, fog, and snow are over 4 m, 0.3 m, and 0.7 m, respectively. Therefore, when the frequency is 28 GHz, rain and snow have the largest and smallest effects on the UAV’s optimal height, respectively. When the frequency is 71 GHz, rain and fog have the largest and smallest effects on the optimal height of the UAV, respectively.

3.3.3. Compensated Path Loss in UAV–Ground Communications

In this section, we explain the compensated path loss, which is denoted by P L c p s . Based on Equation (10), we observe that introducing the specific attenuation of one type of weather (rain, fog, or snow) leads to an increase in transmission loss compared to only considering atmospheric conditions. We compensate for the propagation loss due to rain by increasing the value of P L max on the left side of the equation, as shown in Equation (11). The compensated path loss can be calculated using Equation (12), where C r gas denotes the maximum coverage radius of the UAV under atmospheric conditions only, and H o p t gas represents the corresponding optimal UAV height.  
P L max   +   P L c p s =   [ i · sin ( j θ   +   k )   +   l · sin ( m θ   +   n ) ]   ×   η L o S     η N L o S 1   +   20 log d +   20 log 4 π λ   +   η N L o S 1   +   ( β   +   γ ) d 1000 ,   0     θ     70 .
P L c p s   =   γ   ×   C r gas 2   +   H o p t gas 2   ×   0.001 .
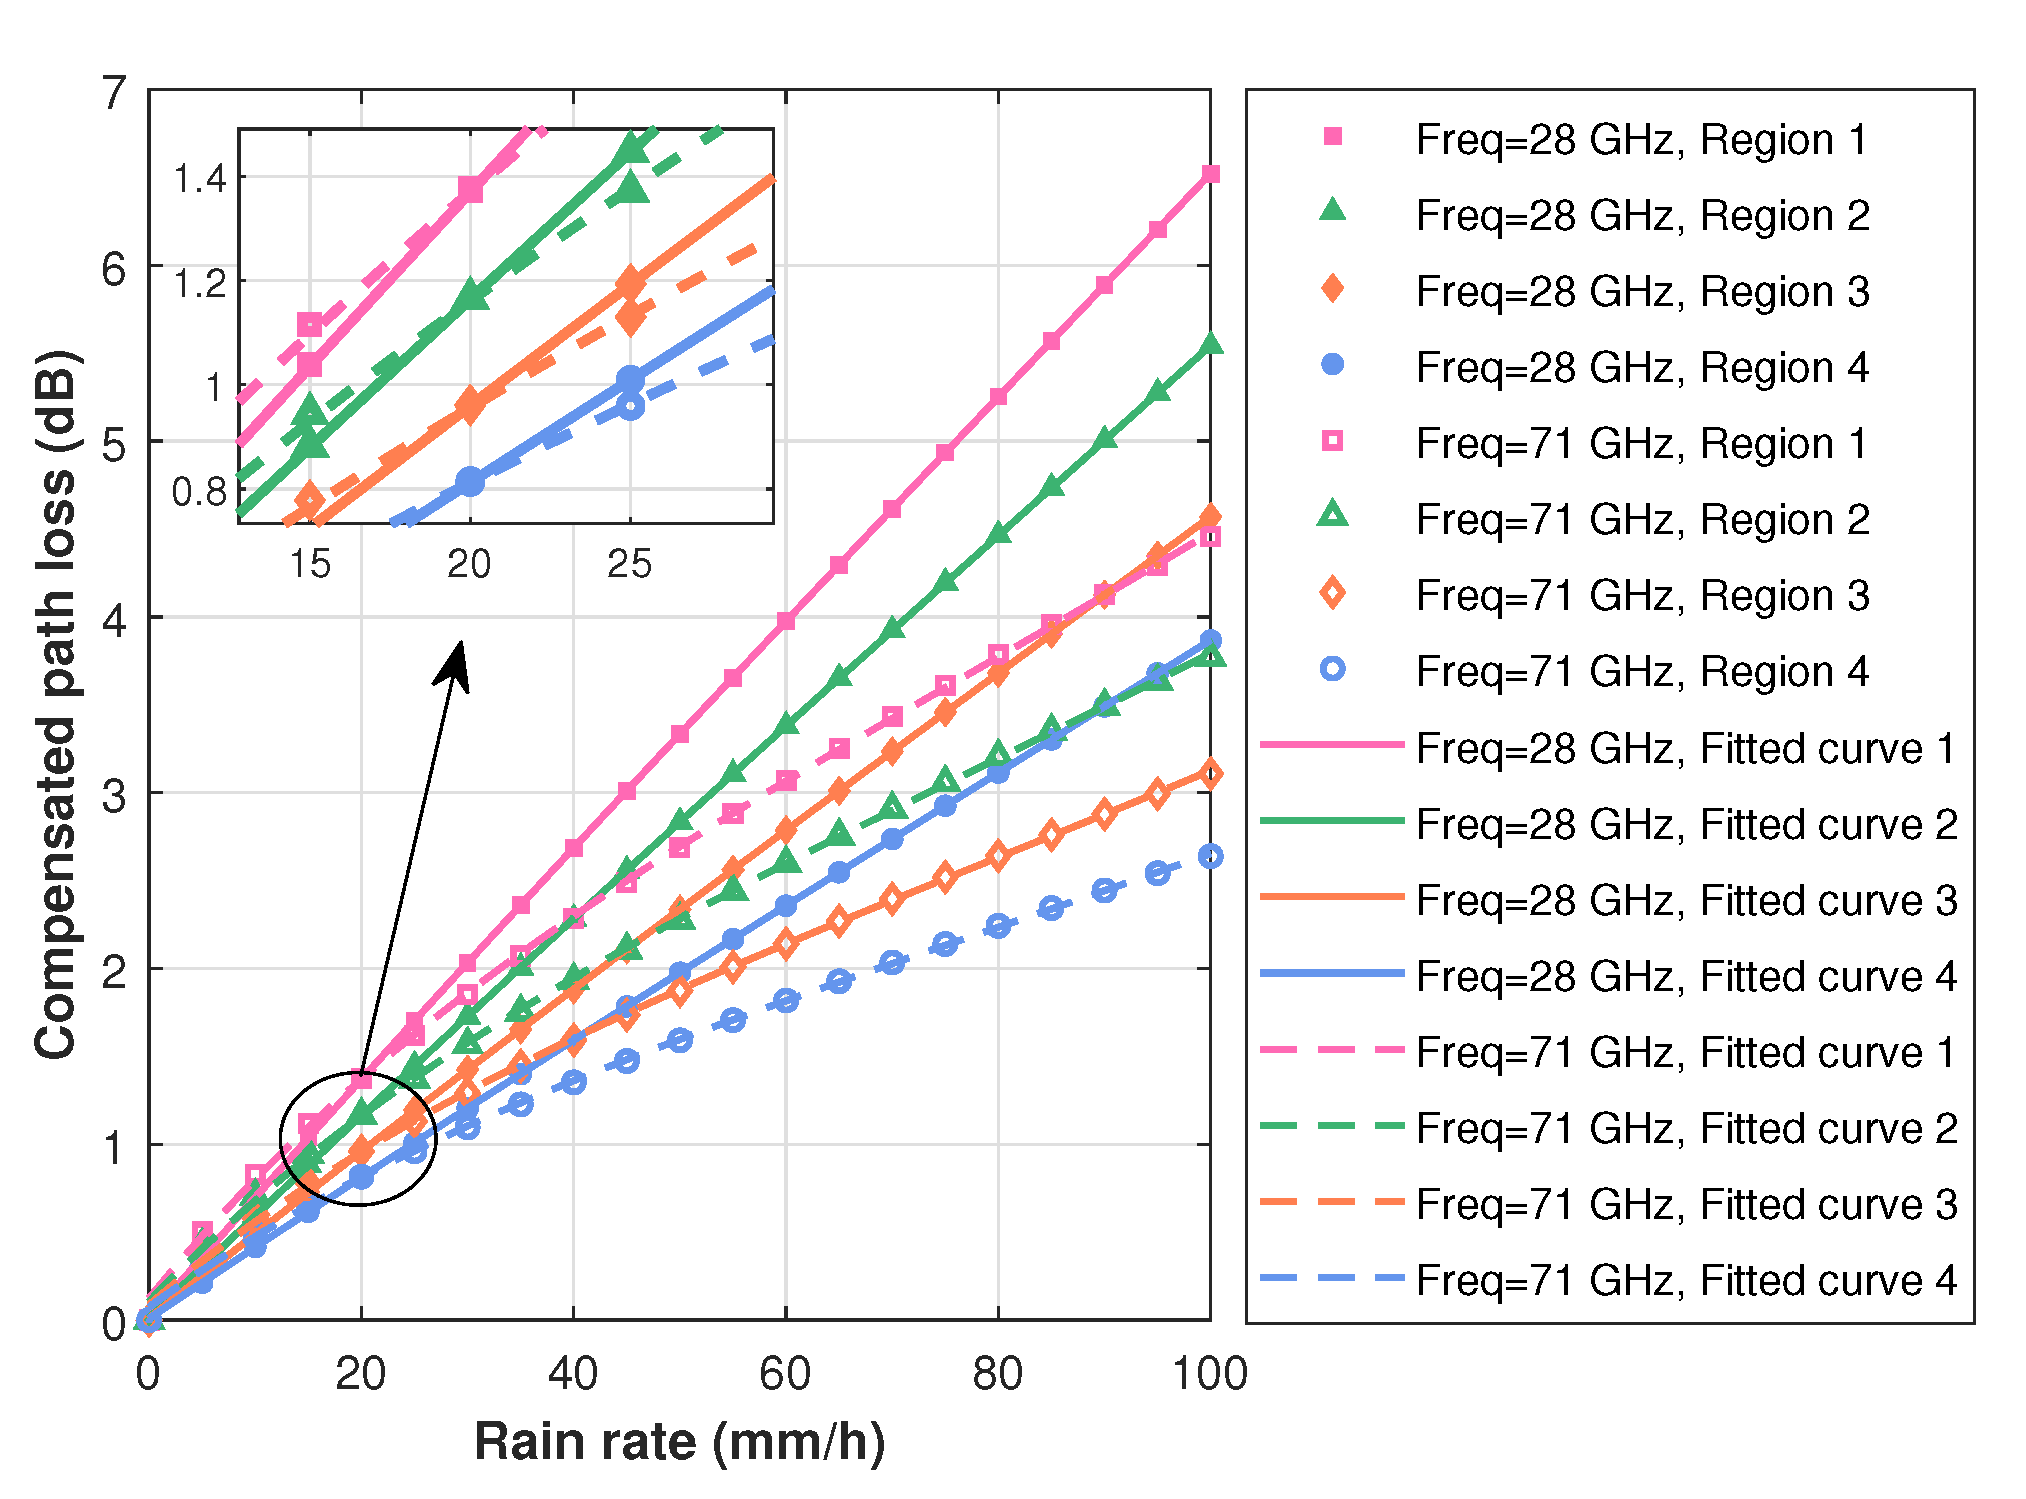
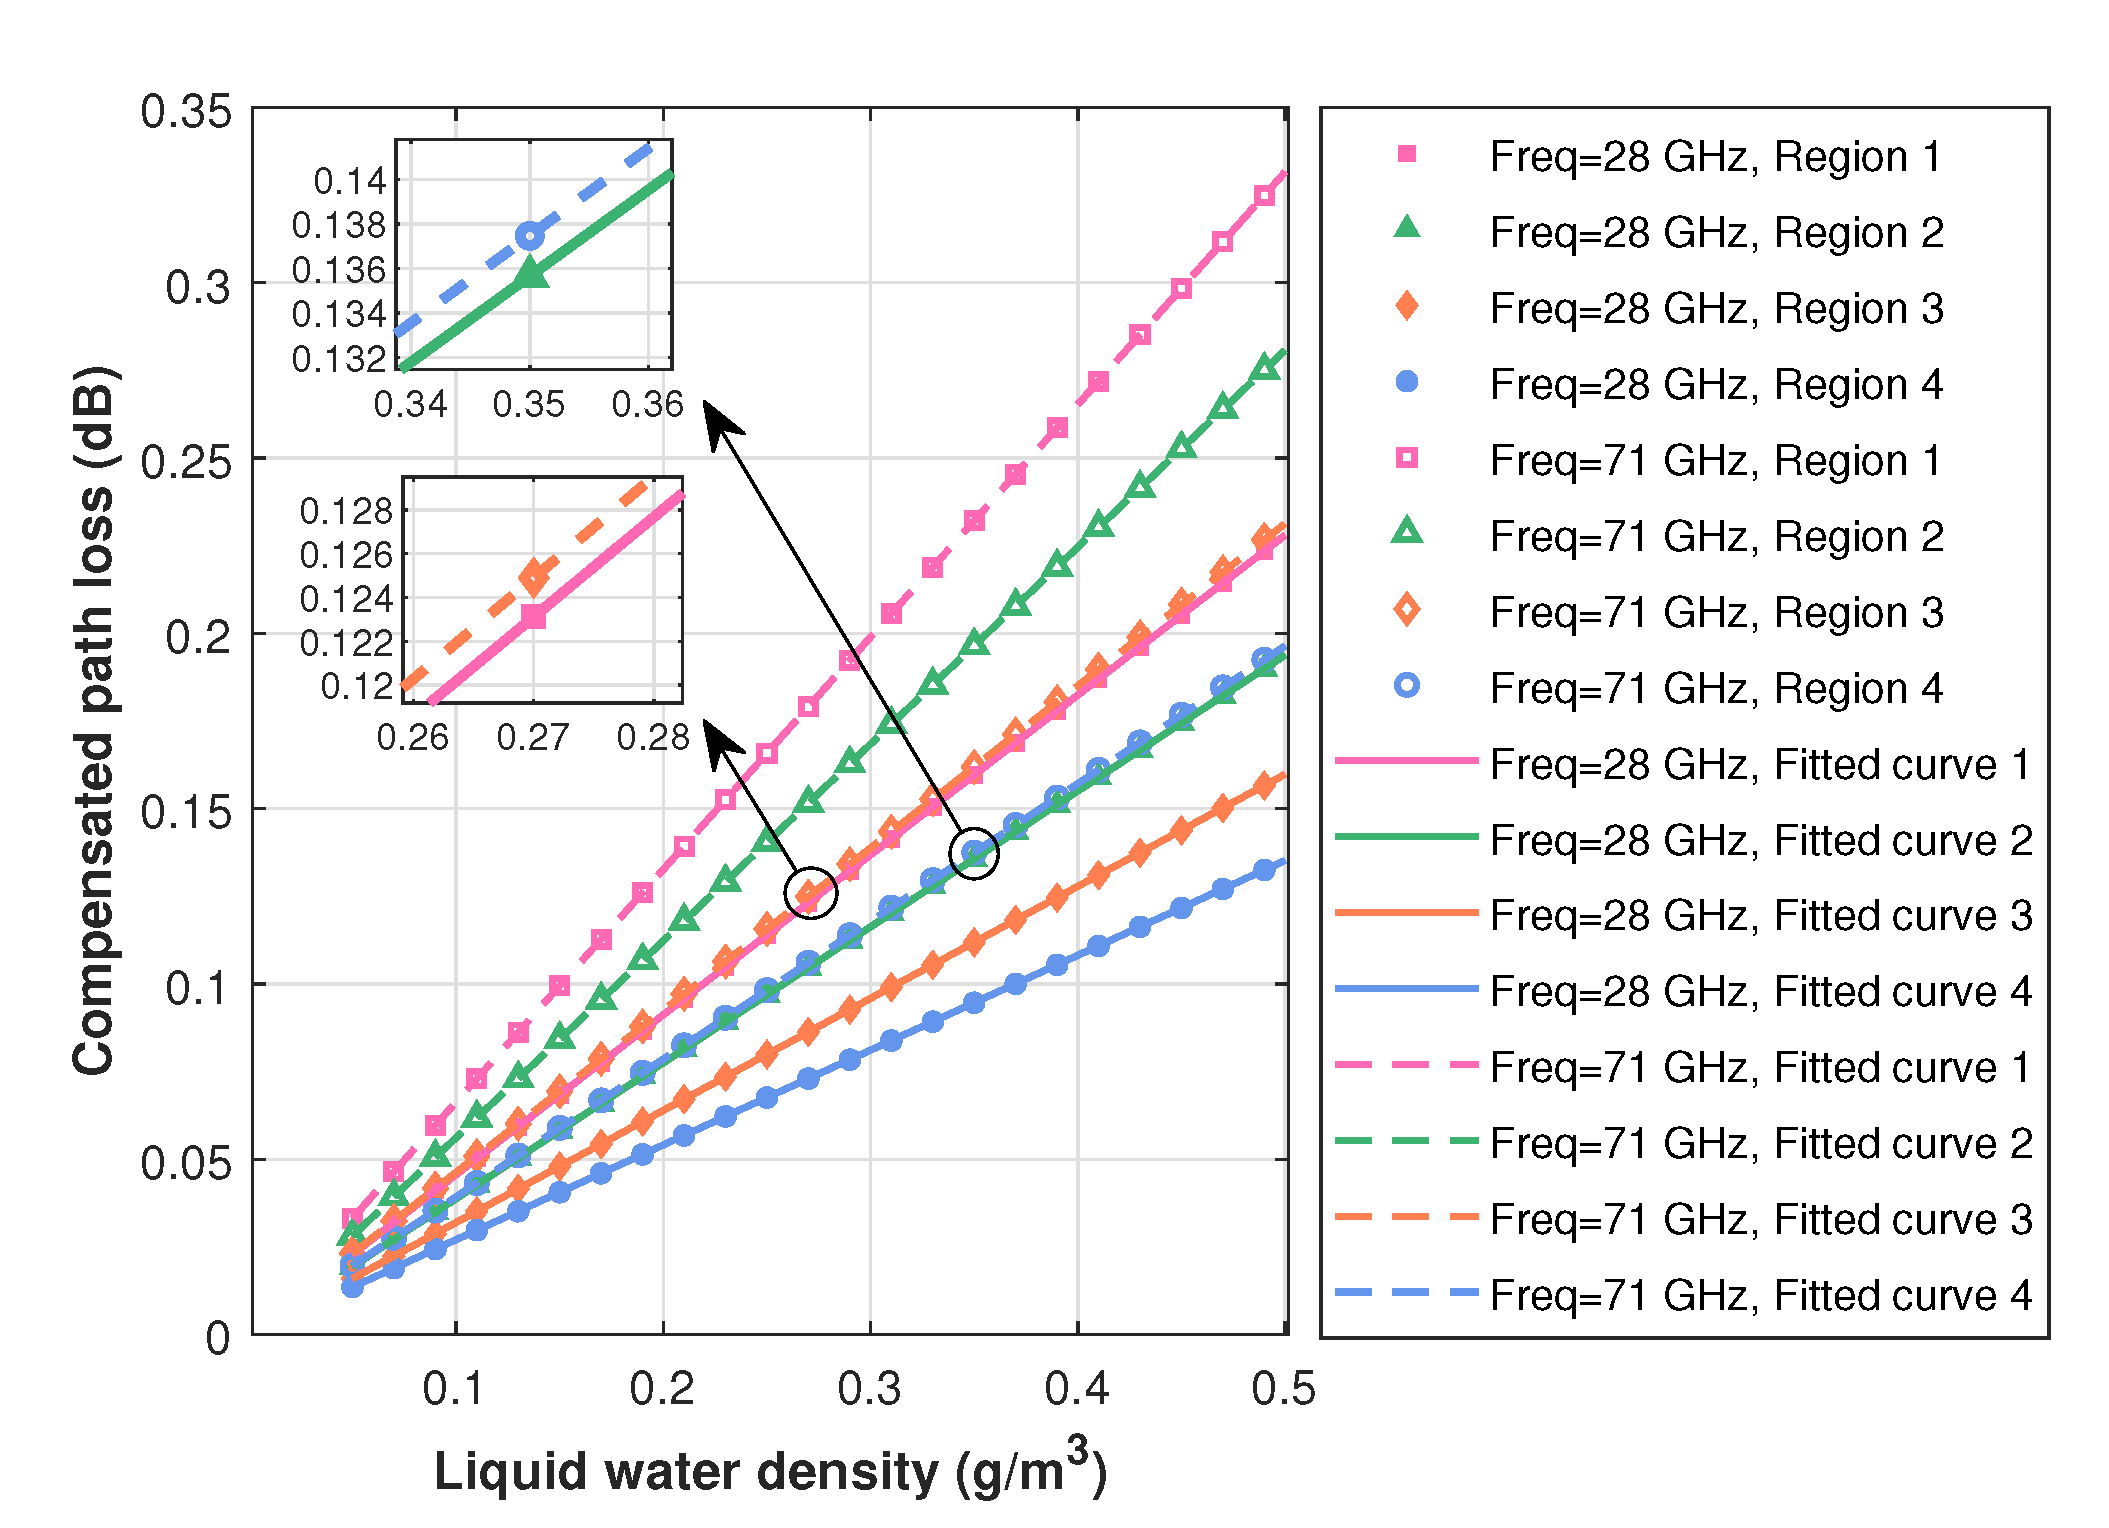
Based on Equation (12), the relationships between the calculated compensated path loss ( P L c p s ) and the rainfall rate, liquid water density, and snowfall rate in the four regions are illustrated in Figure 15, Figure 16, and Figure 17, respectively. In these three figures, each discrete marker point represents the compensated path loss value calculated based on each corresponding rainfall rate, liquid water density, or snowfall rate. The solid line and dashed line depict the fitting curves for the frequencies of 28 GHz and 71 GHz, respectively. From the three figures, we can find that the compensated path loss increases with the rainfall rate, liquid water density, and snowfall rate. The extents of the increases in the compensated path loss are summarized in Table 10. It can be seen from the three figures (Figure 15, Figure 16 and Figure 17) and Table 10 that when the frequency is 28 GHz, the increases in the compensated path loss in the four regions due to rain, fog, and snow are over 3 dB, 0.1 dB, and 0.02 dB, respectively. When the frequency is 71 GHz, the increases in the compensated path loss in the four regions due to rain, fog, and snow are over 2 dB, 0.1 dB, and 0.3 dB, respectively. Therefore, when the frequency is 28 GHz, the increase in the compensated path loss caused by rain and snow is the largest and the smallest, respectively. When the frequency is 71 GHz, the increase in the compensated path loss caused by rain and fog is the largest and the smallest, respectively.

4. UAV Communication Recovery Strategy with Results

In this section, we first summarize the expressions for the fitted curves of the UAV’s maximum coverage area ( S m a x ), optimal height ( H o p t ), and compensated path loss ( P L c p s ) along with their corresponding fitting parameters. Then, based on these expressions, we propose an algorithm to restore communications between the UAV and ground users under various meteorological conditions. Finally, we give some results regarding the recovery coverage of the UAV under different weather conditions in the four regions and present a discussion.

4.1. Fitted Curve Expressions for UAV’s Maximum Coverage Area ( S m a x ), Optimal Height ( H o p t ), and Compensated Path Loss ( P L c p s )

In this subsection, we present the expressions for the fitted curves of the UAV’s maximum coverage area ( S m a x ), optimal height ( H o p t ), and compensated path loss ( P L c p s ) along with their corresponding fitting parameters, as summarized in Table 11. For the convenience of readers, we use blue, purple, and pink to distinguish the fitting parameters corresponding to S m a x , H o p t , and P L c p s . The relationships between the rainfall rate ( R rain ), the maximum coverage area of the UAV ( S m a x ), the optimal height ( H o p t ), and the compensated path loss ( P L c p s ) can be modeled using an exponential formula, with a, b, c, and d as fitting parameters. For fog conditions, a simple linear expression suffices to describe the relationships between the liquid water density ( R fog ) and S m a x , H o p t , P L c p s , where p and q represent the fitting parameters. The relationships between the snowfall rate ( R snow ) and S m a x and H o p t can be described using the same exponential expression as in the rainfall case. Meanwhile, the relationship between the snowfall rate and P L c p s can be modeled using a formula similar to a Fourier expansion, with t, u, v, and w as fitting parameters.

4.2. UAV Communication Recovery Algorithm under Meteorological Conditions

We propose an algorithm as shown in Algorithm 1 to restore communications between the UAV and ground users under various meteorological conditions.
Algorithm 1 UAV Recovery Communications Strategy under Meteorological Conditions
    Input: region type, carrier frequency  f c , height of the UAV h, parameters of LoS probability expression (i, j, k, l, m, n), excessive path loss ( η L o S , η N L o S 1 ), maximum path loss  P L m a x , rainfall rate  γ rain , liquid water density  γ fog , snowfall rate  γ snow
    Output: maximum coverage area S m a x , current height of the UAV
1:
if weather is ideal then
2:
   keep supervising the weather and obtaining the maximum coverage radius ( C r gas ) and the corresponding optimal height ( H o p t gas ) of the UAV;
3:
   if  h     H o p t gas  then
4:
     update the height of the UAV (h) to the value of H o p t gas ;
5:
   end if
6:
end if
7:
calculate the specific attenuation of rain ( R rain ), fog ( R fog ) or snow ( R snow );
8:
calculate the maximum coverage radius ( C r rain , C r fog or C r snow ) and the corresponding optimal height ( H o p t rain , H o p t fog or H o p t snow ) of the UAV;
9:
calculate the compensated path loss ( P L c p s r a i n , P L c p s f o g or P L c p s s n o w );
10:
update the value of P L m a x to P L m a x   +   P L c p s ;
11:
obtain the maximum coverage radius ( C r rain , C r fog or C r snow ) and the optimal height ( H o p t rain , H o p t fog or H o p t snow ) after the UAV communications are recovered;
12:
calculate the corresponding maximum coverage area S m a x ;
13:
if ( H o p t rain     H o p t rain ) ∨ ( H o p t fog     H o p t fog ) ∨ ( H o p t snow     H o p t snow ) then
14:
   update the height of the UAV to H o p t rain , H o p t fog or H o p t snow .
15:
end if

4.3. Results of UAV Coverage Recovery

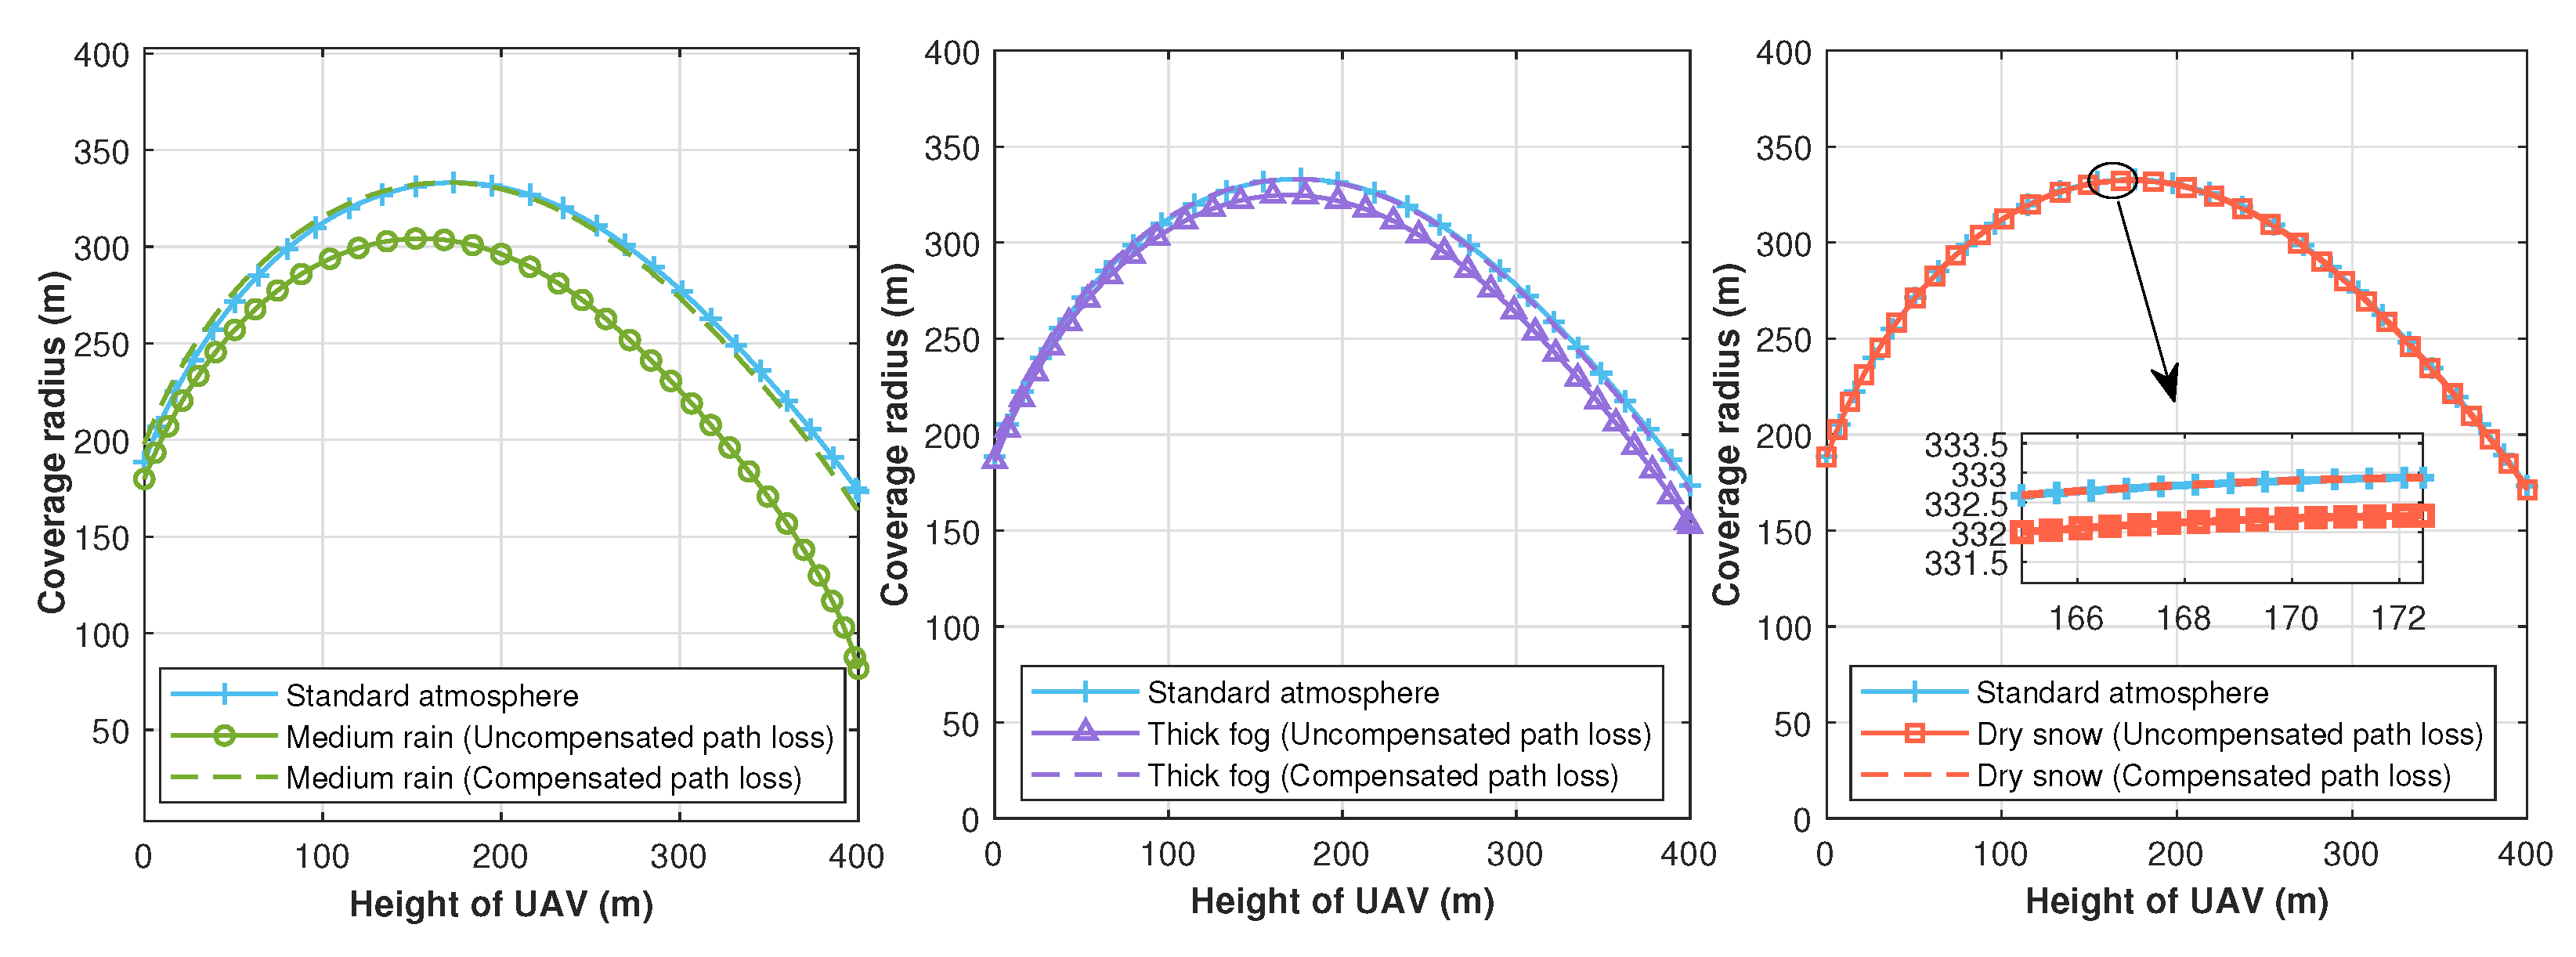
By adding the corresponding compensated path loss ( P L c p s ) to the initial P L max , which can be achieved by increasing the UAV’s transmit power, the maximum coverage radius during UAV–ground communications in rainy conditions can be restored to the coverage radius experienced under atmospheric conditions without rain, as shown in Figure 18.
In addition, Figure 18 demonstrates that, under various weather conditions, compensating for the maximum path loss fully restores the UAV’s coverage radius to the radius without these weather conditions (indicated by the dashed line in Figure 18). Furthermore, when compensating for the maximum path loss to restore communications, the drone’s height must also be adjusted accordingly. Further, the coverage area and the corresponding coverage radius of the UAV in the four regions with a frequency of 28 GHz before the rain, during the rain, and after the restoration of communications are shown in Figure 19. It can be seen from this figure that the rainfall causes the coverage radius of the UAV to decrease by 28.9 m, 21.7 m, 16.0 m, and 11.9 m in the four areas, respectively. The corresponding reduced coverage areas of the four regions are 2623.9, 1479.3, 804.2, and 444.9 m 2 , respectively. Therefore, the reduction in the coverage in the four regions is decreasing in order, i.e., the reduction in coverage is most obvious in the suburban environment and least obvious in high-rise urban environments. By adding the compensated path loss, the coverage radius of the UAV in the four regions is restored to slightly larger values than before the rain.
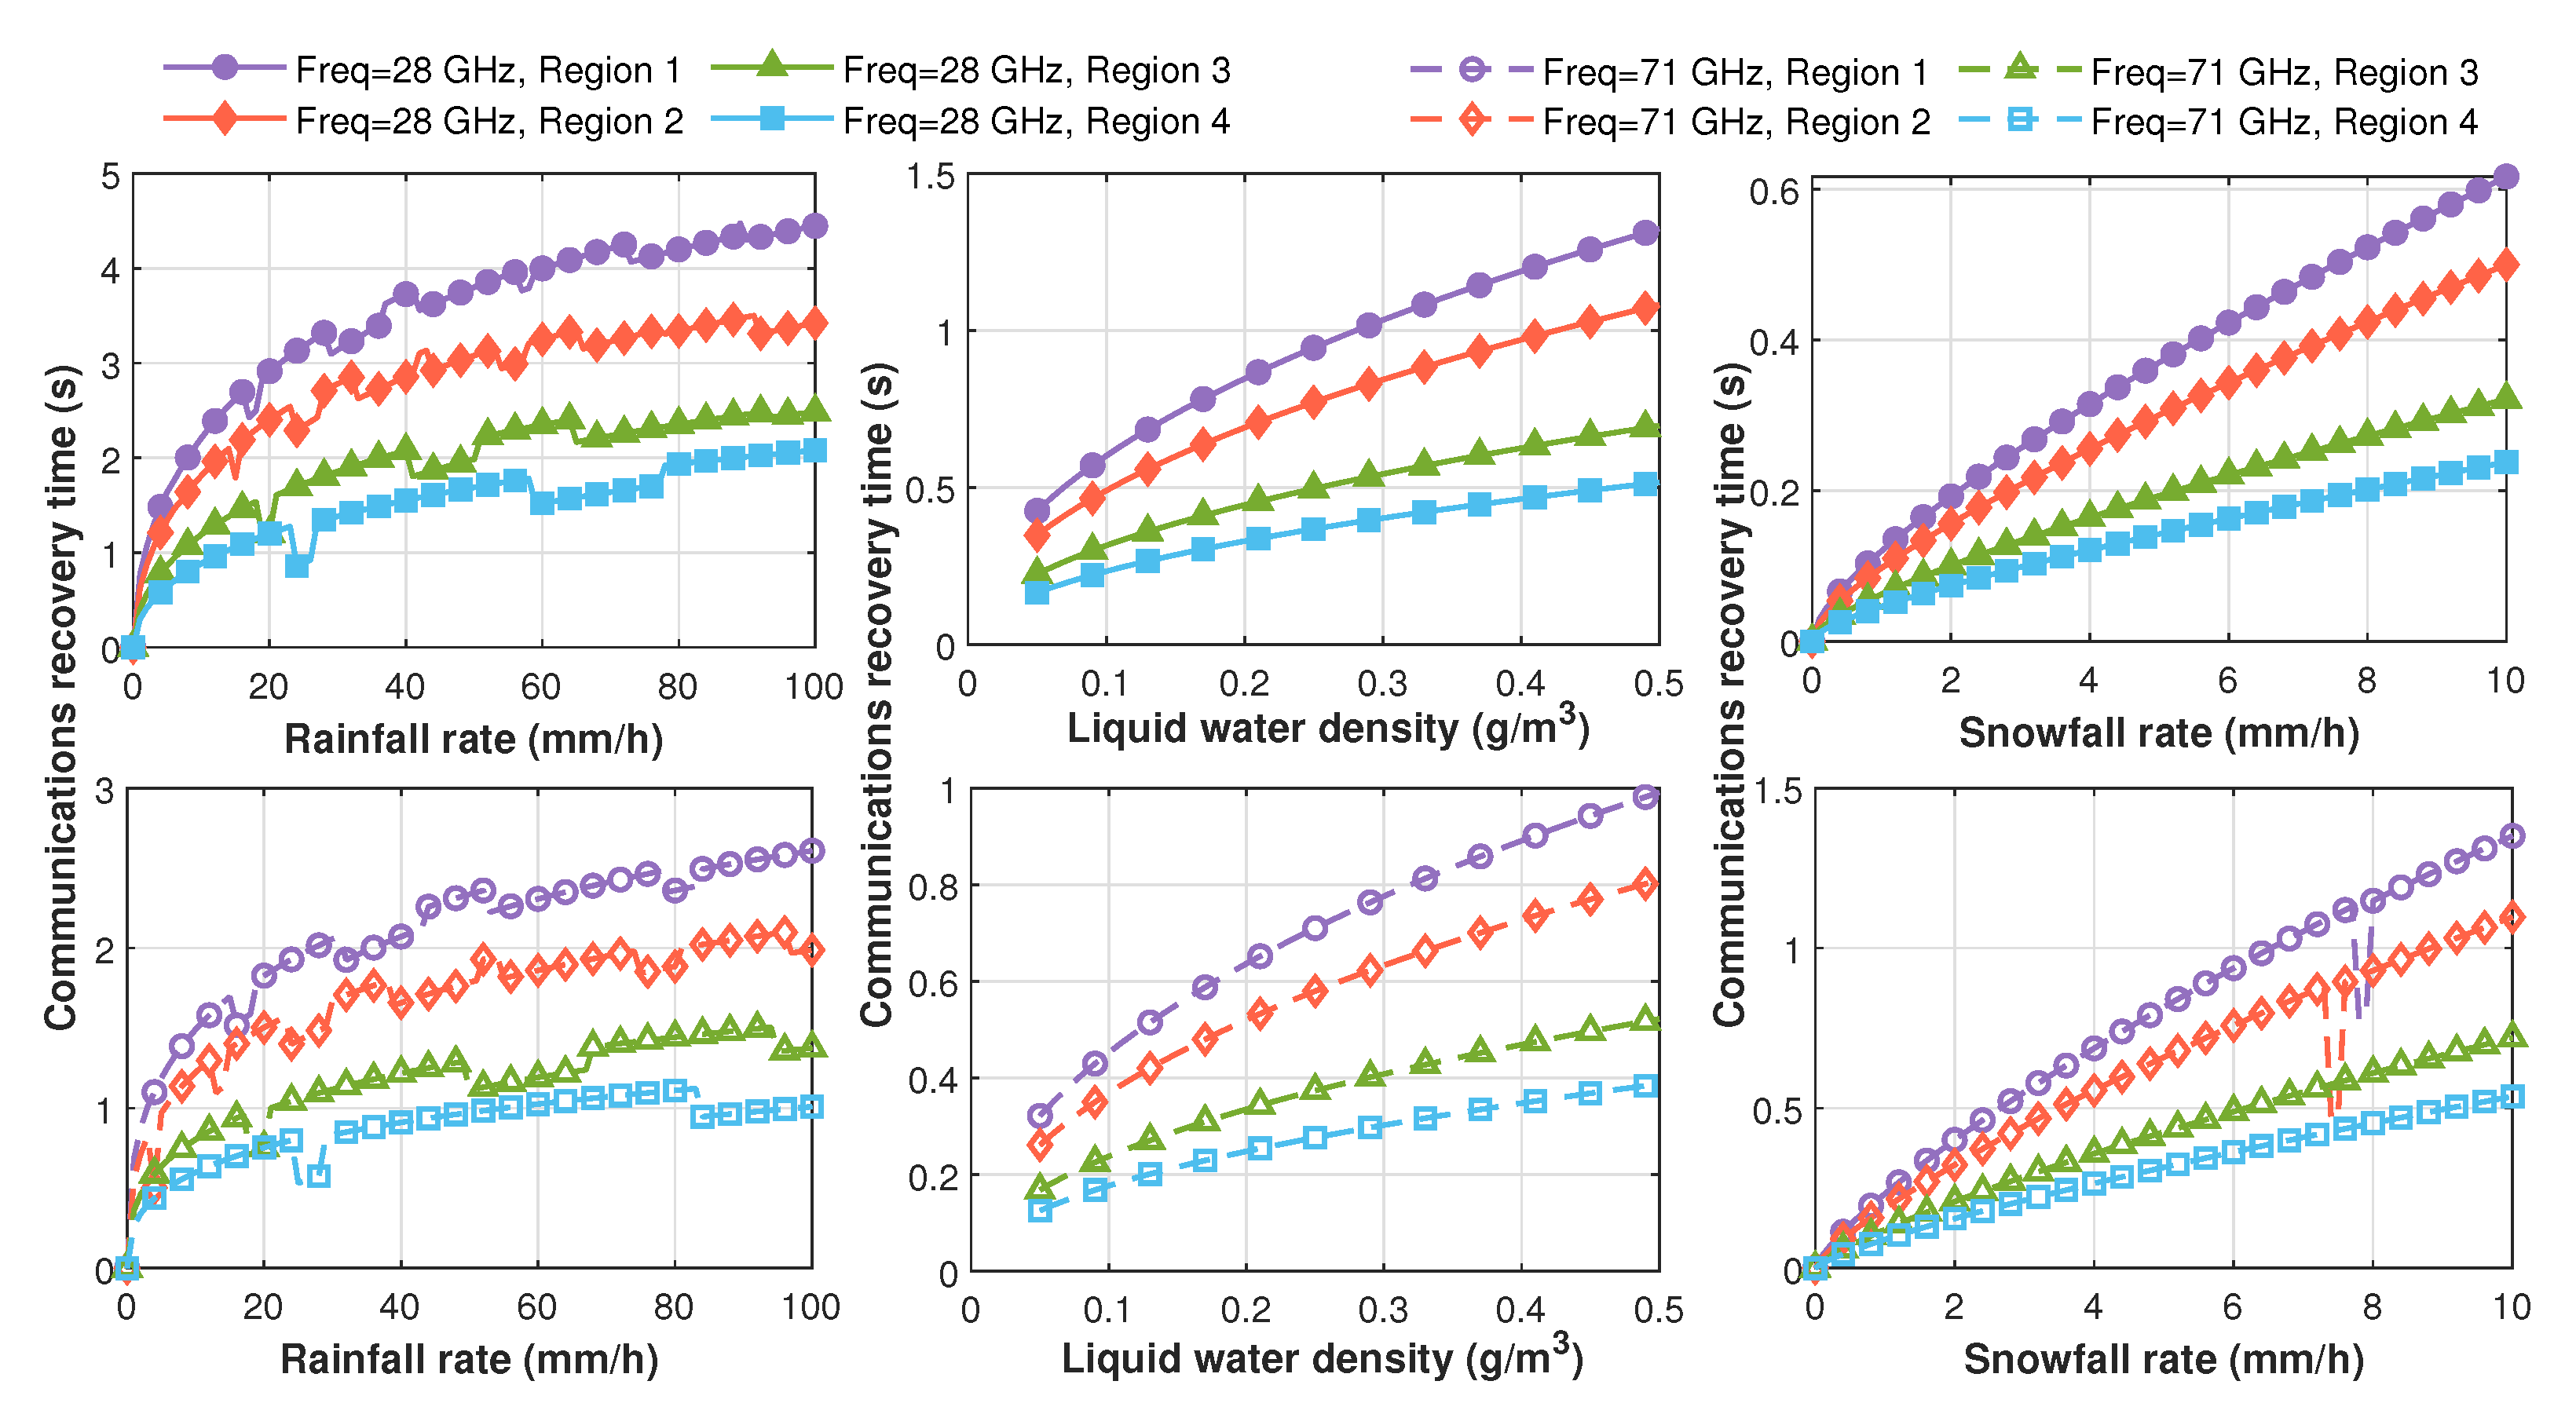
The UAV’s acceleration (deceleration) is assumed to be 10 m per square second. We present the required recovery time for communications under different rainfall rates ( R rain ), liquid water densities ( R fog ), and snowfall rates ( R snow ) in Figure 20. The figure illustrates that higher frequencies result in shorter recovery times under identical weather conditions. When the frequency is 28 GHz, the relationship between the recovery time and weather conditions is T m a x rain     >     T m a x fog   >   T m a x snow . At 71 GHz, the relationship between the recovery time and weather conditions in the same area becomes T m a x rain   >   T m a x snow   >   T m a x fog , where T m a x represents the maximum recovery time. Specifically, the maximum recovery times for rain, fog, and snow in the four regions are over 2.0 s, 0.5 s, and 0.2 s when the frequency is 28 GHz. When the frequency is 71 GHz, the maximum recovery times for rain, fog, and snow in the four regions are over 1.0 s, 0.3 s, and 0.5 s, respectively.

5. Conclusions

This paper proposes a communications recovery strategy for a UAV under meteorological conditions. According to our numerical results, we obtained several conclusions with regard to the communications of the UAV under different weather conditions in four regions. First of all, the percentage reduction in the maximum coverage radius for double or triple reflections compared to one reflection is independent of the frequency when only the atmosphere is considered. Secondly, when considering various weather conditions, relative to Region 1 (suburban), the percentage reduction in the maximum coverage radius of Region 2 to Region 4 (urban, dense urban, and high-rise urban) increases gradually, and the extent of each increase is around 10%.
Thirdly, based on the condition of the maximum rainfall rate of 100 mm/h, when the frequency is 28 GHz or 71 GHz, the degree of reduction in the coverage area and the optimal altitude of the UAV due to rainfall are the largest among the three weather conditions. When the maximum liquid water density and snowfall rate are set as 0.5 g/m 3 and 10 mm/h, respectively, snow has the smallest effect on the coverage area and optimal height of the UAV when the frequency is 28 GHz, while fog has the least influence on these parameters when the frequency is 71 GHz. This reflects the greater attenuation of the signal at higher frequencies in heavy snow ( R snow   =   10 mm/h) compared to thick fog ( R fog   =   0.5 g/m3). Lastly, when it rains, the reduction in coverage in the four regions is decreasing in order. The reduction in the coverage area in the suburban environment is the largest (2623.9 m2), while it is the smallest (444.9 m2) in high-rise urban environments. Therefore, the corresponding time required to restore communication increases in the four regions.
Regarding the limitations of this work, our ray tracing simulation platform does not take into account scattering and diffraction, and the attenuation models that we use for different weather conditions are not up-to-date models. Therefore, in future research work, we will consider using a more accurate ray tracing simulation platform for simulation, and, secondly, we will study and compare the differences in signal propagation attenuation between existing weather attenuation models. In addition, federated learning can be utilized to optimize the UAV trajectory planning when extreme weather conditions occur [38].

Author Contributions

Conceptualization, M.S.; methodology, M.S. and Y.H.; software, M.S.; validation, Y.H.; formal analysis, M.S.; writing—original draft preparation, M.S. and Y.H.; writing—review and editing, Y.H., X.D., Z.L. and T.L.; visualization, M.S.; supervision, X.D., Z.L. and T.L. All authors have read and agreed to the published version of the manuscript.

Funding

The work of M.S. and Z.L. was supported in part by the Natural Science Basic Research Project in Shaanxi Province of China under Grants 2020JM-242 and 2021JM-185, and in part by the National Natural Science Foundation of China under Grant 61871314. The work of Y.H., X.D., and T.L. was supported by the Natural Sciences and Engineering Research Council of Canada (NSERC) under grant RGPIN-2018-03778.

Institutional Review Board Statement

Not applicable.

Informed Consent Statement

Not applicable.

Data Availability Statement

Not applicable.

Acknowledgments

The authors would like to thank the editors, associate editors, and anonymous reviewers for their helpful comments and advice to improve the content and quality of this paper.

Conflicts of Interest

The authors declare no conflict of interest.

References

  1. Dimitrov, K.; Damyanov, I.; Saliev, D.; Valkovski, T. Pasture Research Using Aerial Photography and Photogrammetry. In Proceedings of the National Conference with International Participation (TELECOM), Sofia, Bulgaria, 28–29 October 2021; pp. 121–124. [Google Scholar]
  2. Flores, D.A.; Saito, C.; Paredes, J.A.; Trujillano, F. Aerial photography for 3D reconstruction in the Peruvian Highlands through a fixed-wing UAV system. In Proceedings of the IEEE International Conference on Mechatronics (ICM), Churchill, VIC, Australia, 13–15 February 2017; pp. 388–392. [Google Scholar]
  3. Jawad, A.M.; Jawad, H.M.; Nordin, R.; Gharghan, S.K.; Abdullah, N.F.; Abu-Alshaeer, M.J. Wireless Power Transfer With Magnetic Resonator Coupling and Sleep/Active Strategy for a Drone Charging Station in Smart Agriculture. IEEE Access 2019, 7, 139839–139851. [Google Scholar] [CrossRef]
  4. Jawad, H.M.; Jawad, A.M.; Nordin, R.; Gharghan, S.K.; Abdullah, N.F.; Ismail, M.; Abu-Alshaeer, M.J. Accurate Empirical Path-Loss Model Based on Particle Swarm Optimization for Wireless Sensor Networks in Smart Agriculture. IEEE Sens. J. 2020, 20, 552–561. [Google Scholar] [CrossRef]
  5. Bai, Z.; Feng, Q.; Qiu, Y. Design and Research of UAV For Campus Express Delivery. In Proceedings of the International Conference on Intelligent Design (ICID), Xi’an, China, 19 October 2021; pp. 208–213. [Google Scholar]
  6. Feng, K.; Li, W.; Ge, S.; Pan, F. Packages delivery based on marker detection for UAVs. In Proceedings of the Chinese Control And Decision Conference (CCDC), Hefei, China, 22–24 August 2020; pp. 2094–2099. [Google Scholar]
  7. Cardoso, E.; Natalino, C.; Alfaia, R.; Souto, A.; Araújo, J.; Francês, C.R.L.; Chiaraviglio, L.; Monti, P. A Heuristic Approach for the Design of UAV-Based Disaster Relief in Optical Metro Networks. In Proceedings of the International Conference on Transparent Optical Networks (ICTON), Bari, Italy, 19–23 July 2020; pp. 1–5. [Google Scholar]
  8. Li, X.; Huang, H.; Savkin, A.V. Autonomous Navigation of an Aerial Drone to Observe a Group of Wild Animals With Reduced Visual Disturbance. IEEE Syst. J. 2022, 16, 3339–3348. [Google Scholar] [CrossRef]
  9. Zeng, Y.; Wu, Q.; Zhang, R. Accessing from the Sky: A Tutorial on UAV Communications for 5G and Beyond. Proc. IEEE Mag. 2019, 107, 2327–2375. [Google Scholar] [CrossRef] [Green Version]
  10. Kang, H.; Joung, J.; Ahn, J.; Kang, J. Secrecy-Aware Altitude Optimization for Quasi-Static UAV Base Station Without Eavesdropper Location Information. IEEE Commun. Lett. 2019, 23, 851–854. [Google Scholar] [CrossRef]
  11. Fawaz, W. Effect of non-cooperative vehicles on path connectivity in vehicular networks: A theoretical analysis and UAV-based remedy. Veh. Commun. 2018, 11, 12–19. [Google Scholar] [CrossRef]
  12. Hassan, M.A.; Javed, A.R.; Hassan, T.; Band, S.S.; Sitharthan, R.; Rizwan, M. Reinforcing Communication on the Internet of Aerial Vehicles. IEEE Trans. Green Commun. Netw. 2022, 6, 1288–1297. [Google Scholar] [CrossRef]
  13. ITU-R. P.838-3; Specific Attenuation Model for Rain for Use in Prediction Methods. ITU-R: Geneva, Switzerland, 2005.
  14. ITU-R. P.840-8; Attenuation due to Clouds and Fog. ITU-R: Geneva, Switzerland, 2019.
  15. Oguchi, T. Electromagnetic Wave Propagation and Scattering in Rain and Other Hydrometeors. Proc. IEEE Mag. 1983, 71, 1029–1078. [Google Scholar] [CrossRef]
  16. Song, M.; Huo, Y.; Lu, T.; Dong, X.; Liang, Z. Meteorologically Introduced Impacts on Aerial Channels and UAV Communications. In Proceedings of the IEEE Vehicular Technology Conference, Victoria, BC, Canada, 18 November–16 December 2020; pp. 1–5. [Google Scholar]
  17. Al-Hourani, A.; Kandeepan, S.; Lardner, S. Optimal LAP Altitude for Maximum Coverage. IEEE Wirel. Commun. Lett. 2014, 3, 569–572. [Google Scholar] [CrossRef] [Green Version]
  18. Mozaffari, M.; Saad, W.; Bennis, M.; Debbah, M. Drone Small Cells in the Clouds: Design, Deployment and Performance Analysis. In Proceedings of the IEEE Global Communications Conference, San Diego, CA, USA, 6–10 December 2015; pp. 1–6. [Google Scholar]
  19. Hayajneh, A.M.; Zaidi, S.A.R.; McLernon, D.C.; Renzo, M.; Ghogho, M. Performance Analysis of UAV Enabled Disaster Recovery Networks: A Stochastic Geometric Framework Based on Cluster Processes. IEEE Access 2018, 6, 26215–26230. [Google Scholar] [CrossRef]
  20. Zhang, Y.; Cai, Y.; Zhang, J. Downlink Coverage Performance Analysis of UAV Assisted Terrestrial Cellular Networks. In Proceedings of the IEEE International Conference on Communication Technology, Xi’an, China, 16–19 October 2019; pp. 551–555. [Google Scholar]
  21. Zhu, Q.; Zheng, J. Coverage Recovery Analysis of UAV Base Station Networks. In Proceedings of the IEEE Global Communications Conference, Taipei, Taiwan, 7–11 December 2020; pp. 1–6. [Google Scholar]
  22. Nandi, S.; Nandi, D. Comparative study of rain attenuation effects for the design of 5G millimeter wave communication between tropical and temperate region. In Proceedings of the Devices for Integrated Circuit, Kalyani, India, 23–24 March 2017; pp. 747–750. [Google Scholar]
  23. Ulaganathen, K.; Rafiqul, I.M.; Abdullah, K.; Rahman, T.A. Specific Rain Attenuation Analysis And Modeling For 5G Communication. In Proceedings of the International Conference on Computer and Communication Engineering, Kuala Lumpur, Malaysia, 19–20 September 2018; pp. 1–4. [Google Scholar]
  24. Wang, J.; Wang, L.; Xu, M. Rain Attenuation Analysis of Ka Band Ship-borne Satellite Communication Station In Indian Ocean and Pacific Ocean. In Proceedings of the IEEE International Conference on Information Communication and Signal Processing, Shanghai, China, 12–15 September 2020; pp. 385–388. [Google Scholar]
  25. Esmail, M.A.; Fathallah, H. Improved wavelength independent empirical model for Fog attenuation in FSO communication systems. In Proceedings of the International Conference on Information and Communication Systems, Irbid, Jordan, 5–7 April 2016; pp. 196–200. [Google Scholar]
  26. Kesarwani, A.; Kaur, S.; Kaur, M.; Vohra, P.S. Performance Analysis of FSO Link under Different Conditions of Fog in Delhi, India. In Proceedings of the IEEE International Conference on Power Electronics, Intelligent Control and Energy Systems, Delhi, India, 22–24 October 2018; pp. 958–961. [Google Scholar]
  27. Tian, X.; Miao, Z.; Han, X.; Lu, F. Sea Fog Attenuation Analysis of White-LED Light Sources for Maritime VLC. In Proceedings of the IEEE International Conference on Computational Electromagnetics, Shanghai, China, 20–22 March 2019; pp. 1–3. [Google Scholar]
  28. Verma, D.; Prince, S. Experimental Study of Fog Effect on Wireless Optical Communication Channel for Visible Wavelengths. In Proceedings of the International Conference on Communication and Signal Processing, Chennai, India, 28–30 July 2020; pp. 902–904. [Google Scholar]
  29. Seker, S.S.; Ceran, S.G.; Cerezci, L.O.; Citkaya, A.Y. Attenuation of vegetation and snow on RF wireless communication. In Proceedings of the International Review of Progress in Applied Computational Electromagnetics, Williamsburg, VA, USA, 22–26 March 2015; pp. 1–2. [Google Scholar]
  30. Amarasinghe, Y.; Zhang, W.; Zhang, R.; Mittleman, D.M.; Ma, J. Attenuation of Terahertz Waves by Wet Snow, Dry Snow and Rain. In Proceedings of the IEEE International Conference on Plasma Science, Singapore, 6–10 December 2020; p. 216. [Google Scholar]
  31. Chen, W.; Montojo, J.; Lee, J.; Shafi, M.; Kim, Y. The Standardization of 5G-Advanced in 3GPP. IEEE Commun. Mag. 2022, 60, 98–104. [Google Scholar] [CrossRef]
  32. Song, M.; Huo, Y.; Liang, Z.; Dong, X.; Lu, T. Air-to-Ground Large-Scale Channel Characterization by Ray Tracing. IEEE Access 2022, 10, 125930–125941. [Google Scholar] [CrossRef]
  33. Al-Hourani, A.; Kandeepan, S.; Jamalipour, A. Modeling Air-to-Ground Path Loss for Low Altitude Platforms in Urban Environments. In Proceedings of the IEEE Global Communications Conference, Austin, TX, USA, 8–12 December 2014; pp. 2898–2904. [Google Scholar]
  34. Feng, Q.; McGeehan, J.; Tameh, E.K.; Nix, A.R. Path Loss Models for Air-to-Ground Radio Channels in Urban Environments. In Proceedings of the IEEE Vehicular Technology Conference, Melbourne, VIC, Australia, 7–10 May 2006; pp. 2901–2905. [Google Scholar]
  35. Holis, J.; Pechac, P. Elevation Dependent Shadowing Model for Mobile Communications via High Altitude Platforms in Built-Up Areas. IEEE Trans. Antennas Propag. 2008, 56, 1078–1084. [Google Scholar] [CrossRef]
  36. Koch, F.; Prasch, M.; Schmid, L.; Schweizer, J.; Mauser, W. Measuring snow liquid water content with low-cost GPS receivers. Sensors 2014, 14, 20975–20999. [Google Scholar] [CrossRef] [Green Version]
  37. ITU-R. P.676-12; Attenuation by Atmospheric Gases and Related Effects. ITU-R: Geneva, Switzerland, 2019.
  38. Rahman, S.A.; Tout, H.; Talhi, C.; Mourad, A. Internet of Things Intrusion Detection: Centralized, On-Device, or Federated Learning? IEEE Netw. 2020, 34, 310–317. [Google Scholar] [CrossRef]
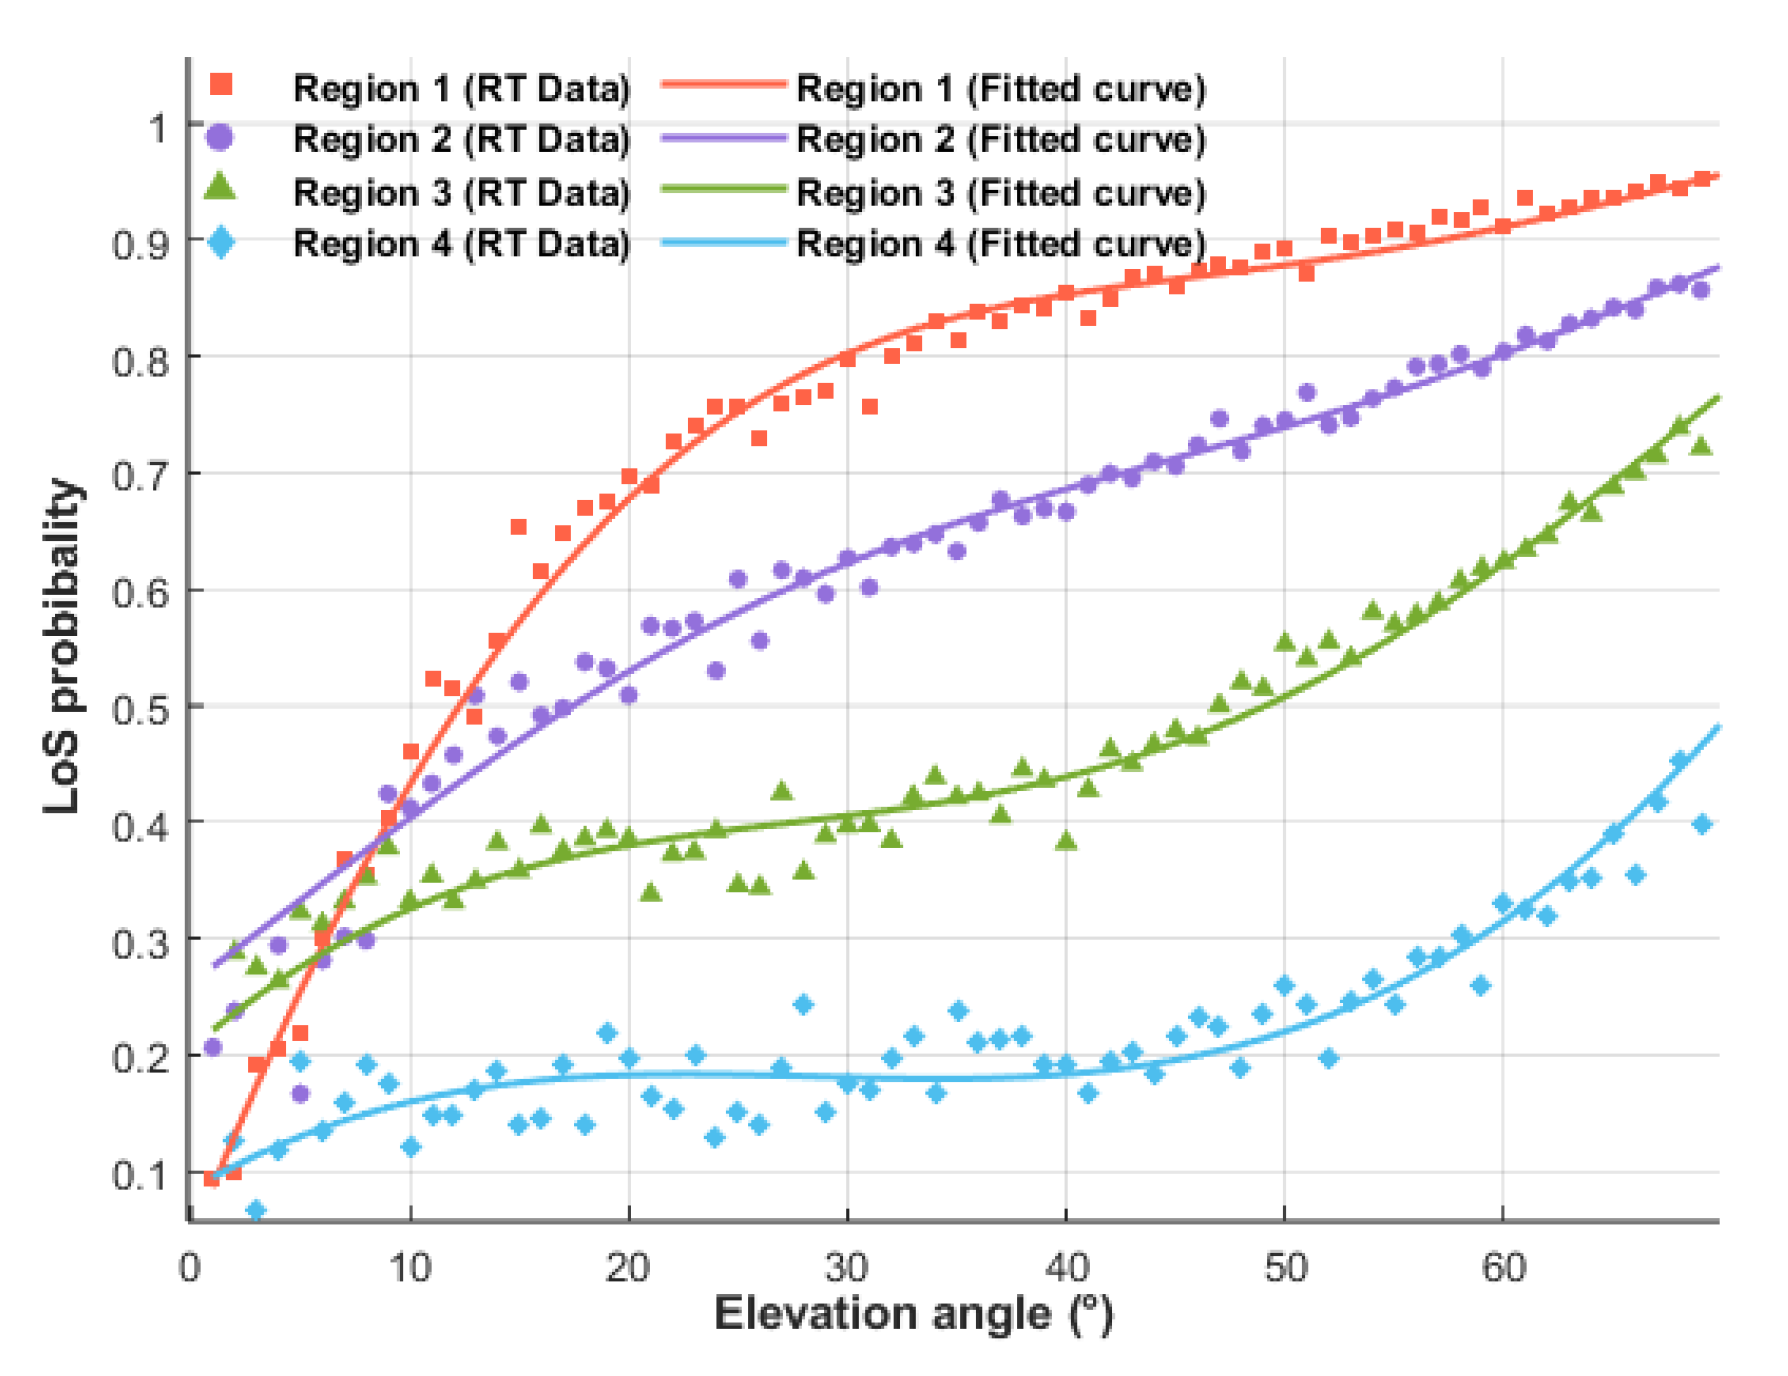
Figure 1. LoS probability in four representative urban environments.
Drones 07 00423 g001
Figure 2. LoS points and NLoS points with different numbers of reflections in four regions (Freq = 28 GHz).
Drones 07 00423 g002
Figure 3. Excessive path loss versus elevation angle of the UAV in four regions (Freq = 28 GHz).
Drones 07 00423 g003
Figure 4. The geometric relationship between the UAV and a ground user in Region 2.
Drones 07 00423 g004
Figure 5. UAV coverage radius versus elevation angle under gases in four regions.
Drones 07 00423 g005
Figure 6. UAV coverage radius versus elevation angle under different weather conditions in four regions.
Drones 07 00423 g006
Figure 7. Propagation attenuation under different weather conditions.
Drones 07 00423 g007
Figure 8. UAV maximum coverage area versus rainfall rate in four regions.
Drones 07 00423 g008
Figure 9. UAV maximum coverage area versus liquid water density in four regions.
Drones 07 00423 g009
Figure 10. UAV maximum coverage area versus snowfall rate in four regions.
Drones 07 00423 g010
Figure 11. The change in the maximum coverage area of the UAV caused by the rainfall rate and its 3D plot in four regions (Freq = 28 GHz).
Drones 07 00423 g011
Figure 12. UAV optimal height versus rainfall rate in four regions.
Drones 07 00423 g012
Figure 13. UAV optimal height versus liquid water density in four regions.
Drones 07 00423 g013
Figure 14. UAV optimal height versus snowfall rate in four regions.
Drones 07 00423 g014
Figure 15. Compensated path loss versus rainfall rate in four regions.
Drones 07 00423 g015
Figure 16. Compensated path loss versus liquid water density in four regions.
Drones 07 00423 g016
Figure 17. Compensated path loss versus snowfall rate in four regions.
Drones 07 00423 g017
Figure 18. The coverage radius versus height after compensating for the P L max under different weather conditions (Region 1, Freq = 28 GHz).
Drones 07 00423 g018
Figure 19. UAV coverage area and corresponding radius (a) before the rain, (b) during the rain, and (c) after the communication is restored in four regions.
Drones 07 00423 g019
Figure 20. Time required for the UAV to recover communications under different meteorological conditions.
Drones 07 00423 g020
Table 1. The parameters of the fitted curves in four regions.
Regions/Parametersijklmn
Region 14.9830.03925−0.74424.0770.043852.148
Region 20.98330.012130.28670.033890.09113−0.5077
Region 31.7180.0317−0.35071.1320.043412.362
Region 43.6590.006567−0.13540.68150.035972.128
Table 2. The mean value of excessive path loss in four regions.
RegionsFrequency η L o S η N L o S 1 η N L o S 2 η N L o S 3
Region 128 GHz−0.71087.410014.486020.6935
Region 171 GHz−0.71027.415414.493520.7025
Region 228 GHz−0.80057.087313.862619.6476
Region 271 GHz−0.79987.092413.869619.6561
Region 328 GHz−0.98337.083413.740520.1763
Region 371 GHz−0.98257.088713.747620.1849
Region 428 GHz−1.34967.030014.438622.5115
Region 471 GHz−1.34867.035714.445922.5205
Table 3. The maximum coverage radius (in m) of the UAV under different reflection numbers in the four regions only considering the atmosphere.
RegionsNumRef28 GHz71 GHz
Region 11333.1130.9
2284.0111.6
3251.098.7
Region 21288.7113.5
2214.684.4
3171.167.3
Region 31253.899.8
2156.861.7
399.339.1
Region 41218.085.7
2107.642.4
350.119.8
Table 4. Percentage reduction in maximum coverage radius for double and triple reflections relative to single reflection.
RegionsRegion 1Region 2Region 3Region 4
NumRef23232323
28 GHz15%25%26%41%38%61%51%77%
71 GHz15%25%26%41%38%61%51%77%
Table 5. The maximum coverage radius (in m) of the UAV under different weather conditions in the four regions.
RegionsWeather28 GHz71 GHz
Region 1gas333.1130.9
snow332.3127.6
fog324.8126.3
rain304.2118.4
Region 2gas288.7113.5
snow288.1111.0
fog282.6110.1
rain267.0104.1
Region 3gas253.899.8
snow253.498.0
fog249.397.3
rain237.892.8
Region 4gas218.085.7
snow217.784.4
fog214.783.9
rain206.180.6
Table 6. Percentage reduction in maximum coverage radius for different weather conditions relative to atmospheric conditions.
RegionsWeather28 GHz71 GHz
Region 1snow0.24%2.52%
fog2.49%3.51%
rain8.68%9.55%
Region 2snow0.21%2.20%
fog2.11%3.00%
rain7.52%8.28%
Region 3snow0.16%1.80%
fog1.77%2.51%
rain6.30%7.01%
Region 4snow0.14%1.52%
fog1.51%2.10%
rain5.46%5.95%
Table 7. Percentage reduction in maximum coverage radius in snow, fog, and rain conditions for Regions 2 to 4 relative to Region 1.
Region 1 WeatherRegions 2–428 GHz71 GHz
Region 1 SnowRegion 213.30%13.01%
Region 323.74%23.20%
Region 434.49%33.86%
Region 1 FogRegion 212.99%12.83%
Region 323.25%22.96%
Region 433.90%33.57%
Region 1 RainRegion 212.23%12.08%
Region 321.83%21.62%
Region 432.25%31.93%
Table 8. The extent of decrease in the maximum coverage area (in m2) due to increases in rainfall rate, liquid water density, and snowfall rate.
WeatherRegions28 GHz71 GHz
Rain ( 0 < R rain < 100 mm/h)Region 1210,92027,280
Region 2147,49018,814
Region 3104,52013,102
Region 470,7408735
Fog ( 0.05 < R fog < 0.5   g / m 3 )Region 115,5303381
Region 299912189
Region 364101411
Region 44028886
Snow ( 0 < R snow < 10 mm/h)Region 138357204
Region 224004536
Region 315312955
Region 49561874
Table 9. The extent of decrease in the optimal height (in m) due to increases in rainfall rate, liquid water density, and snowfall rate.
WeatherRegions28 GHz71 GHz
Rain ( 0 < R rain < 100 mm/h)Region 178.2925.17
Region 260.3119.52
Region 326.618.05
Region 415.504.39
Fog ( 0.05 < R fog < 0.5   g / m 3 )Region 13.932.19
Region 22.621.47
Region 31.090.61
Region 40.600.34
Snow ( 0 < R snow < 10 mm/h)Region 10.966.33
Region 20.624.45
Region 30.261.30
Region 40.140.72
Table 10. The extent of increase in the compensated path loss (in dB) due to increases in rainfall rate, liquid water density, and snowfall rate.
WeatherRegions28 GHz71 GHz
Rain ( 0 < R rain < 100 mm/h)Region 16.52024.4548
Region 25.54173.7718
Region 34.56893.1075
Region 43.86572.6386
Fog ( 0.05 < R fog < 0.5   g / m 3 )Region 10.20520.2984
Region 20.17440.2527
Region 30.14380.2082
Region 40.12170.1767
Snow ( 0 < R snow < 10 mm/h)Region 10.04750.6545
Region 20.04040.5542
Region 30.03330.4566
Region 40.02820.3878
Table 11. The fitting curves’ expressions and related parameters of the UAV’s maximum coverage area ( S m a x ), optimal height ( H o p t ), and compensated path loss ( P L c p s ).
28 GHz71 GHz
R
A
I
N
S m a x ( R rain ) = a e b · R rain
+ c e d · R rain
abcdabcd
Region 1 1.035 × 10 5 −0.03771 2.438 × 10 5 −0.005918 1.156 × 10 4 −0.0607 4.095 × 10 4 −0.004412
Region 2 7.066 × 10 4 −0.03437 1.905 × 10 5 −0.0053177675−0.05787 3.195 × 10 4 −0.003948
Region 3 4.882 × 10 4 −0.03046 1.531 × 10 5 −0.0047285078−0.05494 2.568 × 10 4 −0.003493
Region 4 3.224 × 10 4 −0.02767 1.167 × 10 5 −0.0042373245−0.05292 1.951 × 10 4 −0.003107
H o p t ( R rain ) Region 132.78−0.03935141.7−0.0039859.693−0.0650557.9−0.002959
Region 237.9−0.0270498.54−0.0030957.755−0.0602345.27−0.002984
Region 321.71−0.0176146.9−0.0019832.649−0.0561224.12−0.002662
Region 43.398−0.0378641.02−0.003739.131−0.013028.1840.002519
P L c p s ( R rain ) Region 17.1210.003872−7.108−0.0058382.3260.006901−2.202−0.02634
Region 26.0520.003872−6.041−0.0058381.970.006901−1.864−0.02634
Region 34.990.003872−4.981−0.0058381.6230.006901−1.536−0.02634
Region 44.2220.003872−4.214−0.0058381.3780.006901−1.304−0.02634
F
O
G
S m a x ( R fog ) = p · R f o g
+ q
pqpq
Region 1 3.45 × 10 4 3.485 × 10 5 −7516 5.384 × 10 4
Region 2 2.22 × 10 4 2.619 × 10 5 −4858 4.048 × 10 4
Region 3 1.425 × 10 4 2.024 × 10 5 −3132 3.131 × 10 4
Region 4−8954 1.493 × 10 5 −1964 2.31 × 10 4
H o p t ( R fog ) Region 1−8.738174.1−4.87168.45
Region 2−5.827135.9−3.25953.42
Region 3−2.41868.01−1.35726.75
Region 4−1.32943.95−0.743617.29
P L c p s ( R fog ) Region 10.456 4.354 × 10 17 0.6632 7.413 × 10 17
Region 20.3876 3.765 × 10 17 0.5615 6.001 × 10 17
Region 30.3196 3.53 × 10 17 0.4626 5.648 × 10 17
Region 40.2704 2.765 × 10 17 0.3928 4.648 × 10 17
S
N
O
W
S m a x ( R snow ) = a e b · R snow
+ c e d · R snow
abcdabcd
Region 1 3.546 × 10 5 −0.002266−6398−0.1061 6.185 × 10 4 −0.02496−8169−0.1723
Region 2 2.653 × 10 5 −0.001847−3609−0.1137 4.635 × 10 4 −0.02233−5959−0.1578
Region 3 2.046 × 10 5 −0.001526−2312−0.113 3.576 × 10 4 −0.01966−4513−0.1416
Region 4 1.508 × 10 5 −0.001349−1633−0.1051 2.653 × 10 4 −0.01796−3467−0.1256
H o p t ( R snow ) Region 1176.4−0.001107−1.457−0.112672.51−0.01362−3.481−0.308
Region 2136.7−0.000922−0.927−0.113756.12−0.01328−2.758−0.3517
Region 368.37−0.0007619−0.3853−0.112928.48−0.009671−1.751−0.1414
Region 444.18−0.0006713−0.2371−0.10518.44−0.008801−1.163−0.1262
P L c p s ( R snow )
= t + u · cos ( w · R snow )
+ v · sin ( w · R snow )
tuvwtuvw
Region 10.06636−0.066590.016520.10480.9253−0.929410.14890.1118
Region 20.0564−0.05660.014040.10480.7835−0.78710.12610.1118
Region 30.0465−0.046670.011580.10480.6456−0.64850.10390.1118
Region 40.03935−0.039490.0097950.10480.5482−0.55070.088220.1118
Disclaimer/Publisher’s Note: The statements, opinions and data contained in all publications are solely those of the individual author(s) and contributor(s) and not of MDPI and/or the editor(s). MDPI and/or the editor(s) disclaim responsibility for any injury to people or property resulting from any ideas, methods, instructions or products referred to in the content.