


Noise Impact Assessment of UAS Operation in Urbanised Areas: Field Measurements and a Simulation


Abstract
:1. Introduction
1.1. Theory of Sound and Rotor Noise
1.1.1. Equations
1.1.2. Rotational Propeller Noise
1.2. Literature Review
2. Materials and Methods
- − Sea level atmospheric pressure of 1013.25 hPa;
- − Ambient temperature of 20 °C (ISA may be used);
- − Relative humidity of 65%;
- − Zero wind.
2.1. Measurement Devices
2.2. Evaluated UAVs
2.3. Methodology
2.4. Calibration
3. Results
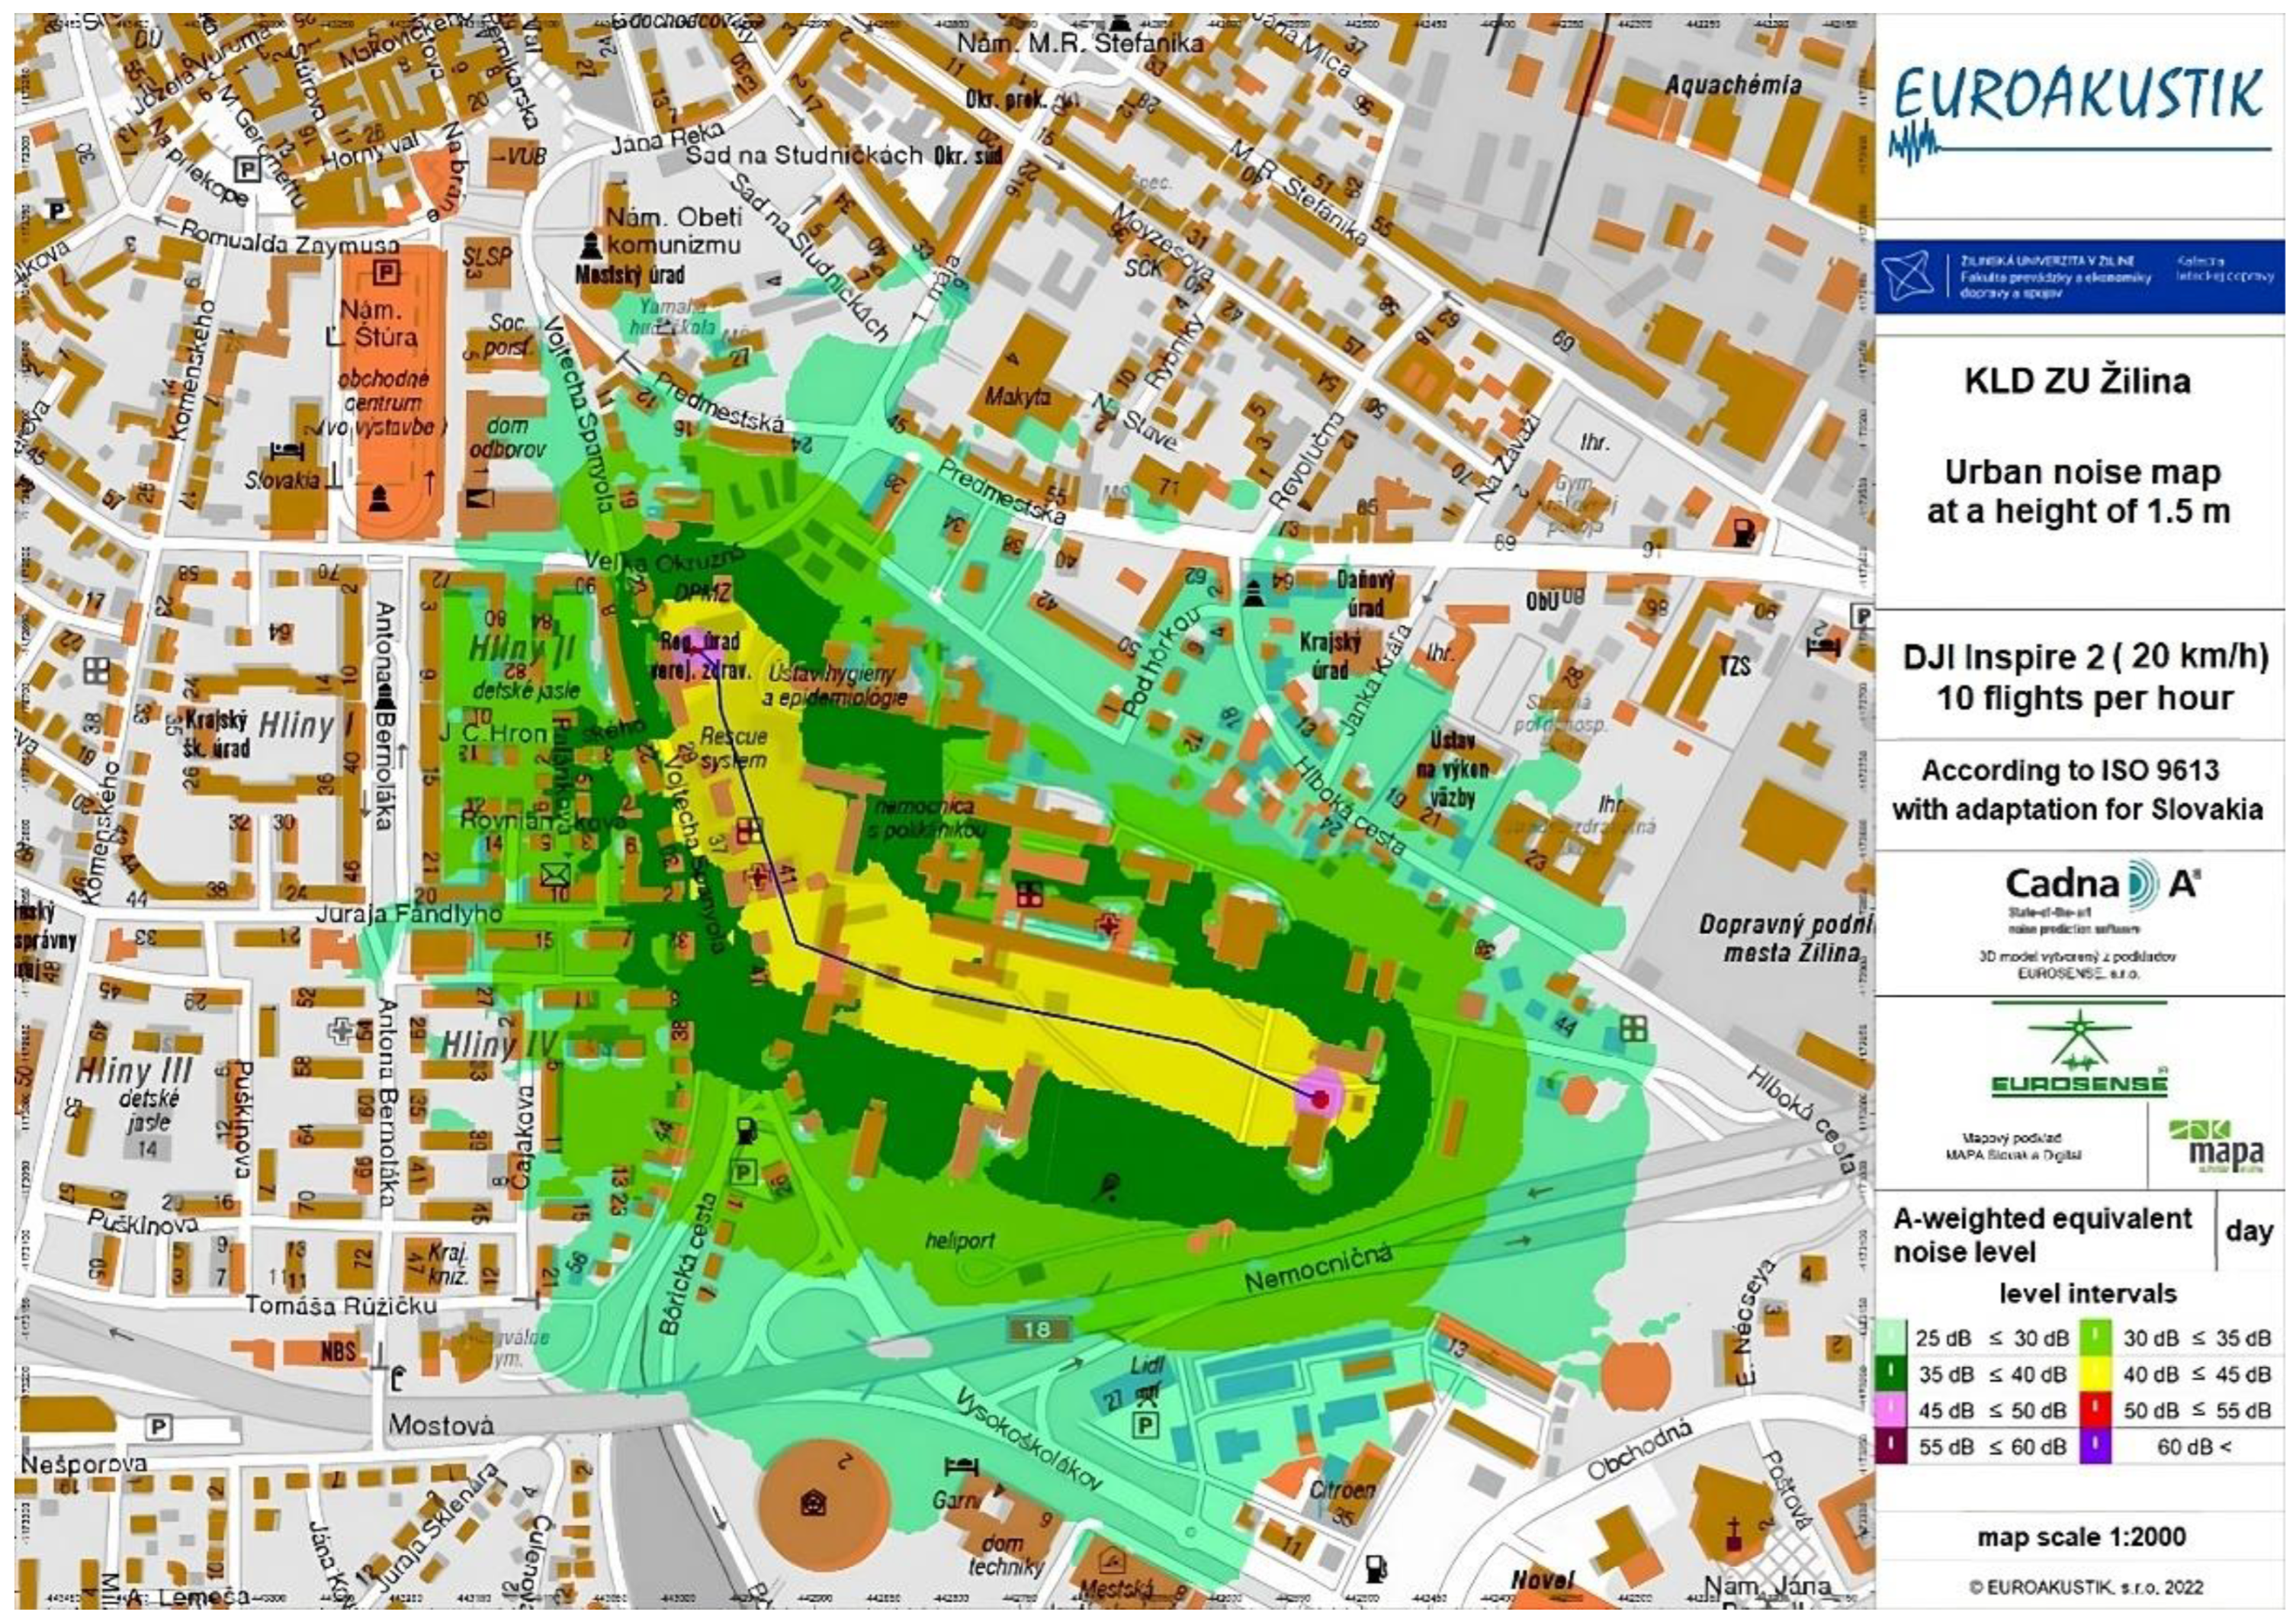
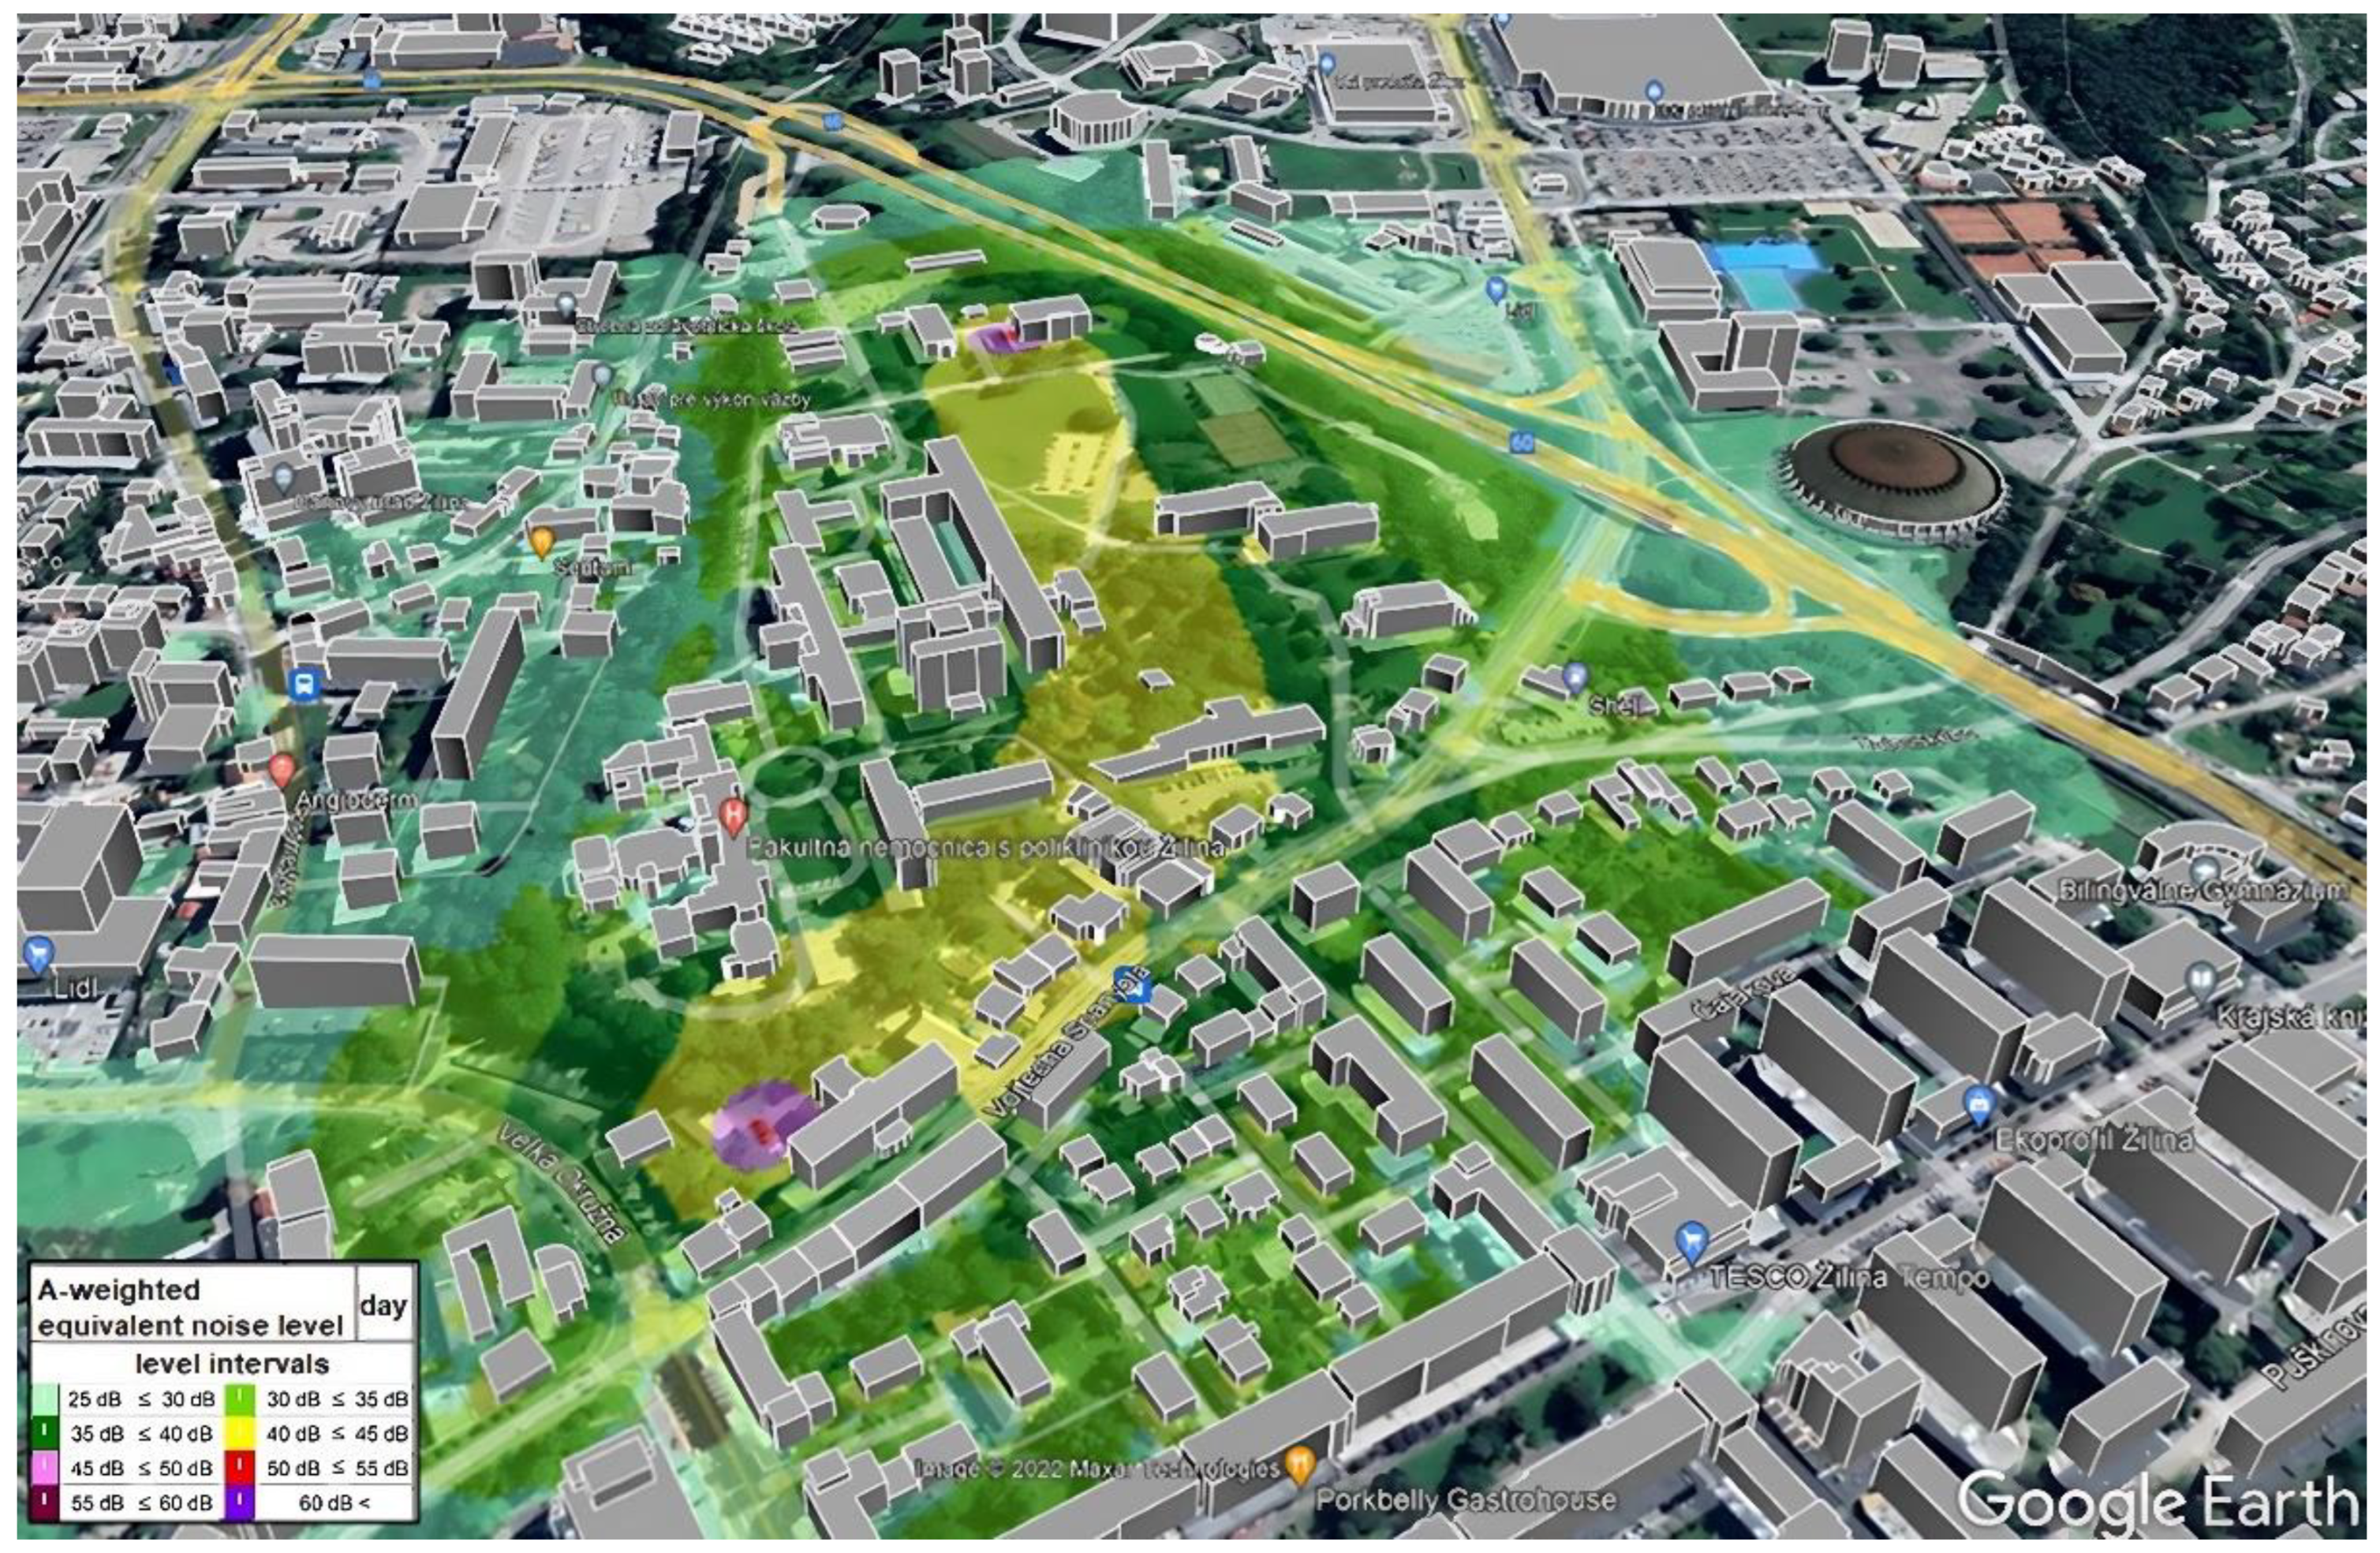
Simulation for Zilina Case Study
4. Conclusions
Author Contributions
Funding
Institutional Review Board Statement
Informed Consent Statement
Data Availability Statement
Conflicts of Interest
Abbreviations
| Abbreviations | |
| AGL | Above ground level |
| EU | European Union |
| ISA | International standard atmosphere |
| ISO | International Organization for Standardization |
| PC | Computer |
| PWL | Sound power level |
| RMS | Root mean square |
| RPM | Revolutions per minute |
| SPL | Sound pressure level |
| UAS | Unmanned aircraft system |
| UAV | Unmanned aerial vehicle |
| List of symbols | |
| λ | Wavelength |
| f | Frequency |
| Hz | Hertz |
| c | Phase velocity |
| dB | Decibel |
| W | Watt |
| m | Meter |
| Pa | Pascal |
| Prms | Root mean square pressure |
| ρ | Density |
| LAeq | A-weighted equivalent continuous sound level |
| LWA | A-weighted sound power level |
| LW | Sound power level |
| Lp | Sound pressure level |
References
- Marte, J.E.A.; Kurtz, D.W. A Review of Aerodynamic Noise from Propellers, Rotors, and Lift Fans, 1st ed.; NASA: Pasadena, CA, USA, 1970; pp. 11–47. [Google Scholar]
- Sound_Theory: Acoustics. Available online: https://acoustics.no/sound-measurement/sound-theory (accessed on 9 January 2023).
- ISO 3744:2010; Acoustics—Determination of Sound Power Levels and Sound Energy Levels of Noise Sources Using Sound Pressure—Engineering Methods for an Essentially Free Field over a Reflecting Plane. ISO: Geneva, Switzerland, 2015. Available online: https://www.iso.org/standard/52055.html (accessed on 9 January 2023).
- Longhurst, R.S. Geometrical and Physical Optics; Wiley: New York, NY, USA, 1967. [Google Scholar]
- Leslie, A.; Wong, K.C.; Auld, D. Broadband noise reduction on a mini-UAV propeller. In Proceedings of the 14th AIAA/CEAS Aeroacoustics Conference (29th AIAA Aeroacoustics Conference), Vancouver, BC, Canada, 5–7 May 2008. [Google Scholar]
- Massey, K.; Gaeta, R. Noise measurements of tactical UAVs. In Proceedings of the 16th AIAA/CEAS Aeroacoustics Conference, Stockholm, Sweden, 7–9 June 2010. [Google Scholar]
- Sinibaldi, G.; Marino, L. Experimental analysis on the noise of propellers for small UAV. Appl. Acoust. 2013, 74, 79–88. [Google Scholar] [CrossRef]
- Kloet, N.; Watkins, S.; Clothier, R. Acoustic signature measurement of small multi-rotor Unmanned Aircraft Systems. Int. J. Micro Air Veh. 2017, 9, 3–14. [Google Scholar] [CrossRef]
- Papa, U.; Del Core, G.; Giordano, G. Determination of sound power levels of a small UAS during flight operations. In Proceedings of the 45th International Congress and Exposition on Noise Control Engineering (INTER-NOISE): Towards a Quieter Future, Hamburg, Germany, 21–24 August 2016; pp. 216–226. [Google Scholar]
- Heydari, M.; Sadat, H.; Singh, R. A computational study on the aeroacoustics of a multi-rotor unmanned aerial system. Appl. Sci. 2021, 11, 9732. [Google Scholar] [CrossRef]
- Cussen, K.; Garruccio, S.; Kennedy, J. UAV noise emission—A combined experimental and numerical assessment. Acoustics 2022, 4, 297–312. [Google Scholar] [CrossRef]
- Senzig, D.A.; Marsan, M. UAS Noise Certification. In Proceedings of the Inter-Noise 2018 Impact of Noise Control Engineering Conference, Chicago, IL, USA, 6–29 August 2018. [Google Scholar]
- Siljak, H.; Kennedy, J.; Byrne, S.; Einicke, K. Noise mitigation of UAV operations through a complex networks approach. In Proceedings of the INTER-NOISE and NOISE-CON Congress and Conference Proceedings, Glasgow, Scotland, 21–24 August 2022. [Google Scholar]
- Roger, M.; Moreau, S. Tonal-noise assessment of quadrotor-type UAV using source-mode expansions. Acoustics 2020, 2, 674–690. [Google Scholar] [CrossRef]
- Kim, D.H.; Park, C.H.; Moon, Y.J. Aerodynamic analyses on the steady and unsteady loading-noise sources of drone propellers. Int. J. Aeronaut. Space Sci. 2019, 20, 611–619. [Google Scholar] [CrossRef]
- Schäffer, B.; Pieren, R.; Heutschi, K.; Wunderli, J.M.; Becker, S. Drone noise emission characteristics and noise effects on humans—A systematic review. Int. J. Environ. Res. Public Health 2021, 18, 5940. [Google Scholar] [CrossRef] [PubMed]
- Park, C.H.; Kim, D.H.; Moon, Y.J. Computational study on the steady loading noise of drone propellers: Noise source modeling with the lattice Boltzmann method. Int. J. Aeronaut. Space Sci. 2019, 20, 858–869. [Google Scholar] [CrossRef]
- Roy, M. Evaluation of Environmental Noise in urban areas: A noise pollution assessment approach. Med. Agric. Environ. Sci. 2022, 2, 21–40. [Google Scholar] [CrossRef]
- Ramos-Romero, C.; Green, N.; Roberts, S.; Clark, C.; Torija, A.J. Requirements for drone operations to minimise community noise impact. Int. J. Environ. Res. Public Health 2022, 19, 9299. [Google Scholar] [CrossRef] [PubMed]
- Alkmim, M.; Cardenuto, J.; Tengan, E.; Dietzen, T.; Van Waterschoot, T.; Cuenca, J.; De Ryck, L.; Desmet, W. Drone noise directivity and psychoacoustic evaluation using a hemispherical microphone array. J. Acoust. Soc. Am. 2022, 152, 2735–2745. [Google Scholar] [CrossRef] [PubMed]
- Bian, H.; Tan, Q.; Zhong, S.; Zhang, X. Assessment of UAM and drone noise impact on the environment based on virtual flights. Aerosp. Sci. Technol. 2021, 118, 106996. [Google Scholar] [CrossRef]
- Treichel, J.; Foerster, J.; Lieb, J.; Volkert, A. Anwendbarkeit der ISO 3744 Zur Ermittlung von Drohnengeräuschen/applicability of ISO standard 3744 for the determination of drone noise. Lärmbekämpfung 2023, 18, 50–54. [Google Scholar] [CrossRef]
- Kennedy, J.; Garruccio, S.; Cussen, K. Modelling and mitigation of drone noise. Vibroeng. Procedia 2021, 37, 60–65. [Google Scholar] [CrossRef]
- DACUS Research; Deliverable VALR D4.2: Brussels, Belgium. 2022. Available online: https://dacus-research.eu/wp-content/uploads/2022/10/DACUS-VALR-D4.2_00.01.01-1.pdf (accessed on 15 April 2023).
- ICAO. Doc 9501 Environmental Technical Manual. Procedures for the Noise Certification of Aircraft, 3rd ed.; ICAO: Montreal, QC, Canada, 2018; Volume 3. [Google Scholar]
- Sound Analyser NOR118. Available online: https://www.norsonic.asia/product/nor118 (accessed on 15 January 2023).
- Sound Analyser NOR140. Available online: https://web2.norsonic.com/product_single/soundanalyser-nor140 (accessed on 15 January 2023).
- Sound Level Meter-Analyser NOR145. Available online: https://web2.norsonic.com/product_single/sound-level-meter-nor145 (accessed on 15 January 2023).
- DJI Store—Official Store for DJI Drones, Gimbals and Accessories (Europe). Available online: https://store.dji.com (accessed on 15 January 2023).
- Kamenický, M.; (Euroakustik Ltd, Bratislava, Slovakia); Bujna, E.; (University of Zilina). Personal communication, 2022.


| DJI Mavic 2 Pro | DJI Inspire 2 | |
|---|---|---|
| Take-off weight (g) Dimensions with unfolded propellers (mm) Max speed (km/h) | 907 | 3440 |
| 322 × 242 × 84 | 605 × 605 × 300 | |
| 72 | 108 | |
| Weight category | C1 | C2 |
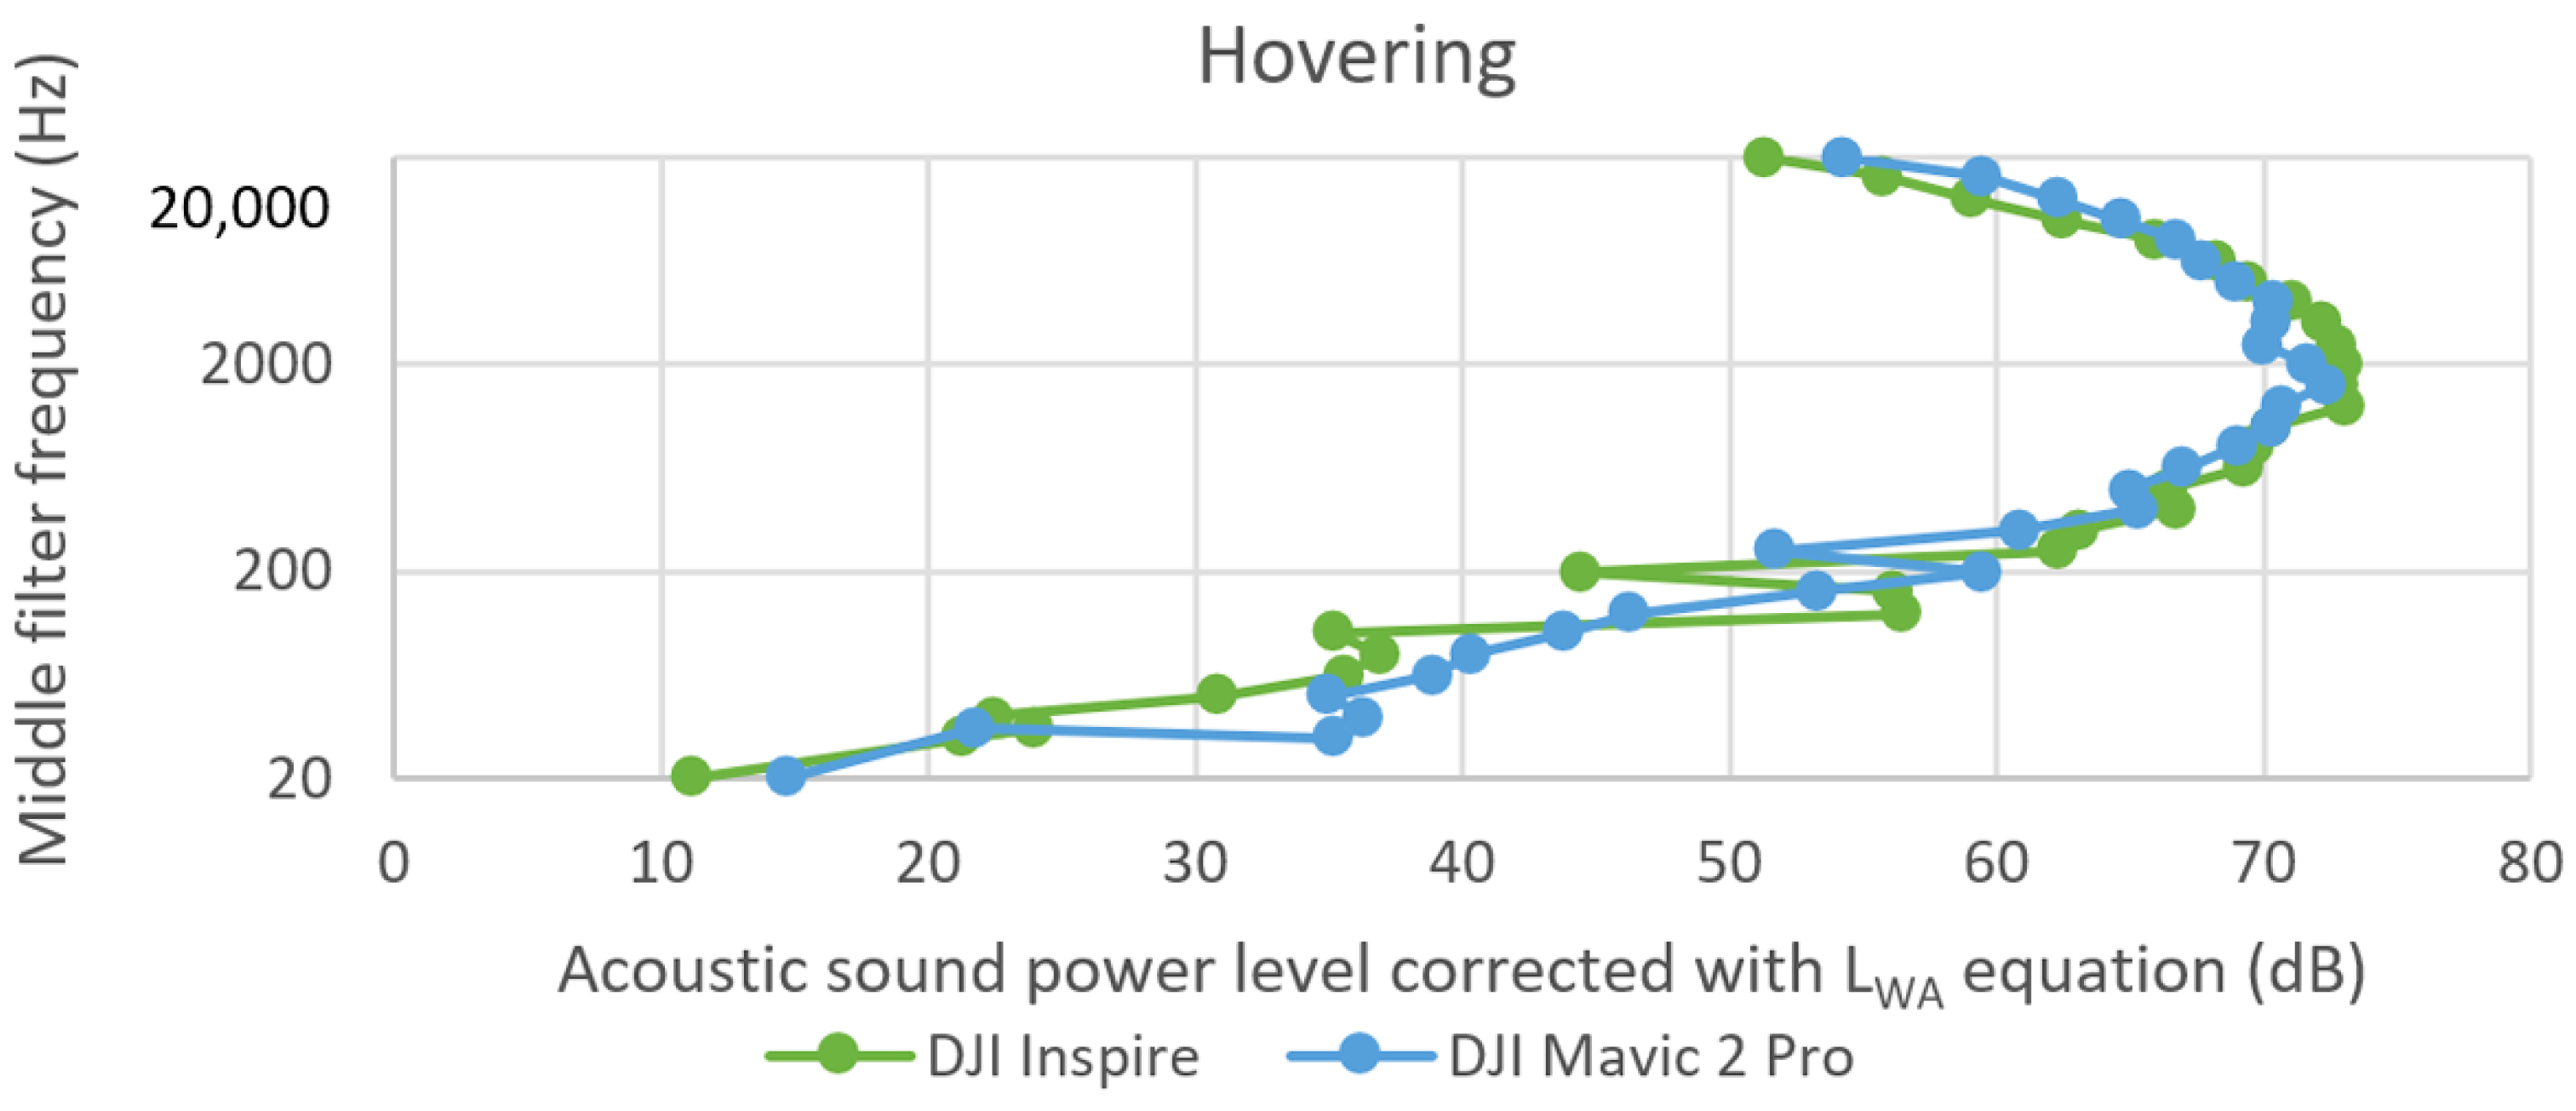
| Acoustic Sound Power Level Corrected with LWA Equation (dB) | ||||
|---|---|---|---|---|
| Middle Filter Frequency (Hz) | 5 kmh−1 | 10 kmh−1 | 20 kmh−1 | Hovering |
| 20 | 13.9 | 6.4 | 9.3 | 11.2 |
| 40 | 24.9 | 23.6 | 22.0 | 22.5 |
| 80 | 40.3 | 40.7 | 44.1 | 36.9 |
| 160 | 65.1 | 65.5 | 71.9 | 56.2 |
| 315 | 75.6 | 76.4 | 80.2 | 63.1 |
| 630 | 78.2 | 81.8 | 81.7 | 69.2 |
| 1250 | 83.0 | 83.9 | 85.3 | 73.1 |
| 2500 | 83.5 | 83.8 | 85.6 | 72.7 |
| 5000 | 79.9 | 82.6 | 84.4 | 69.5 |
| 10,000 | 71.6 | 75.3 | 77.3 | 62.5 |
| 20,000 | 58.8 | 64.2 | 67.6 | 51.3 |
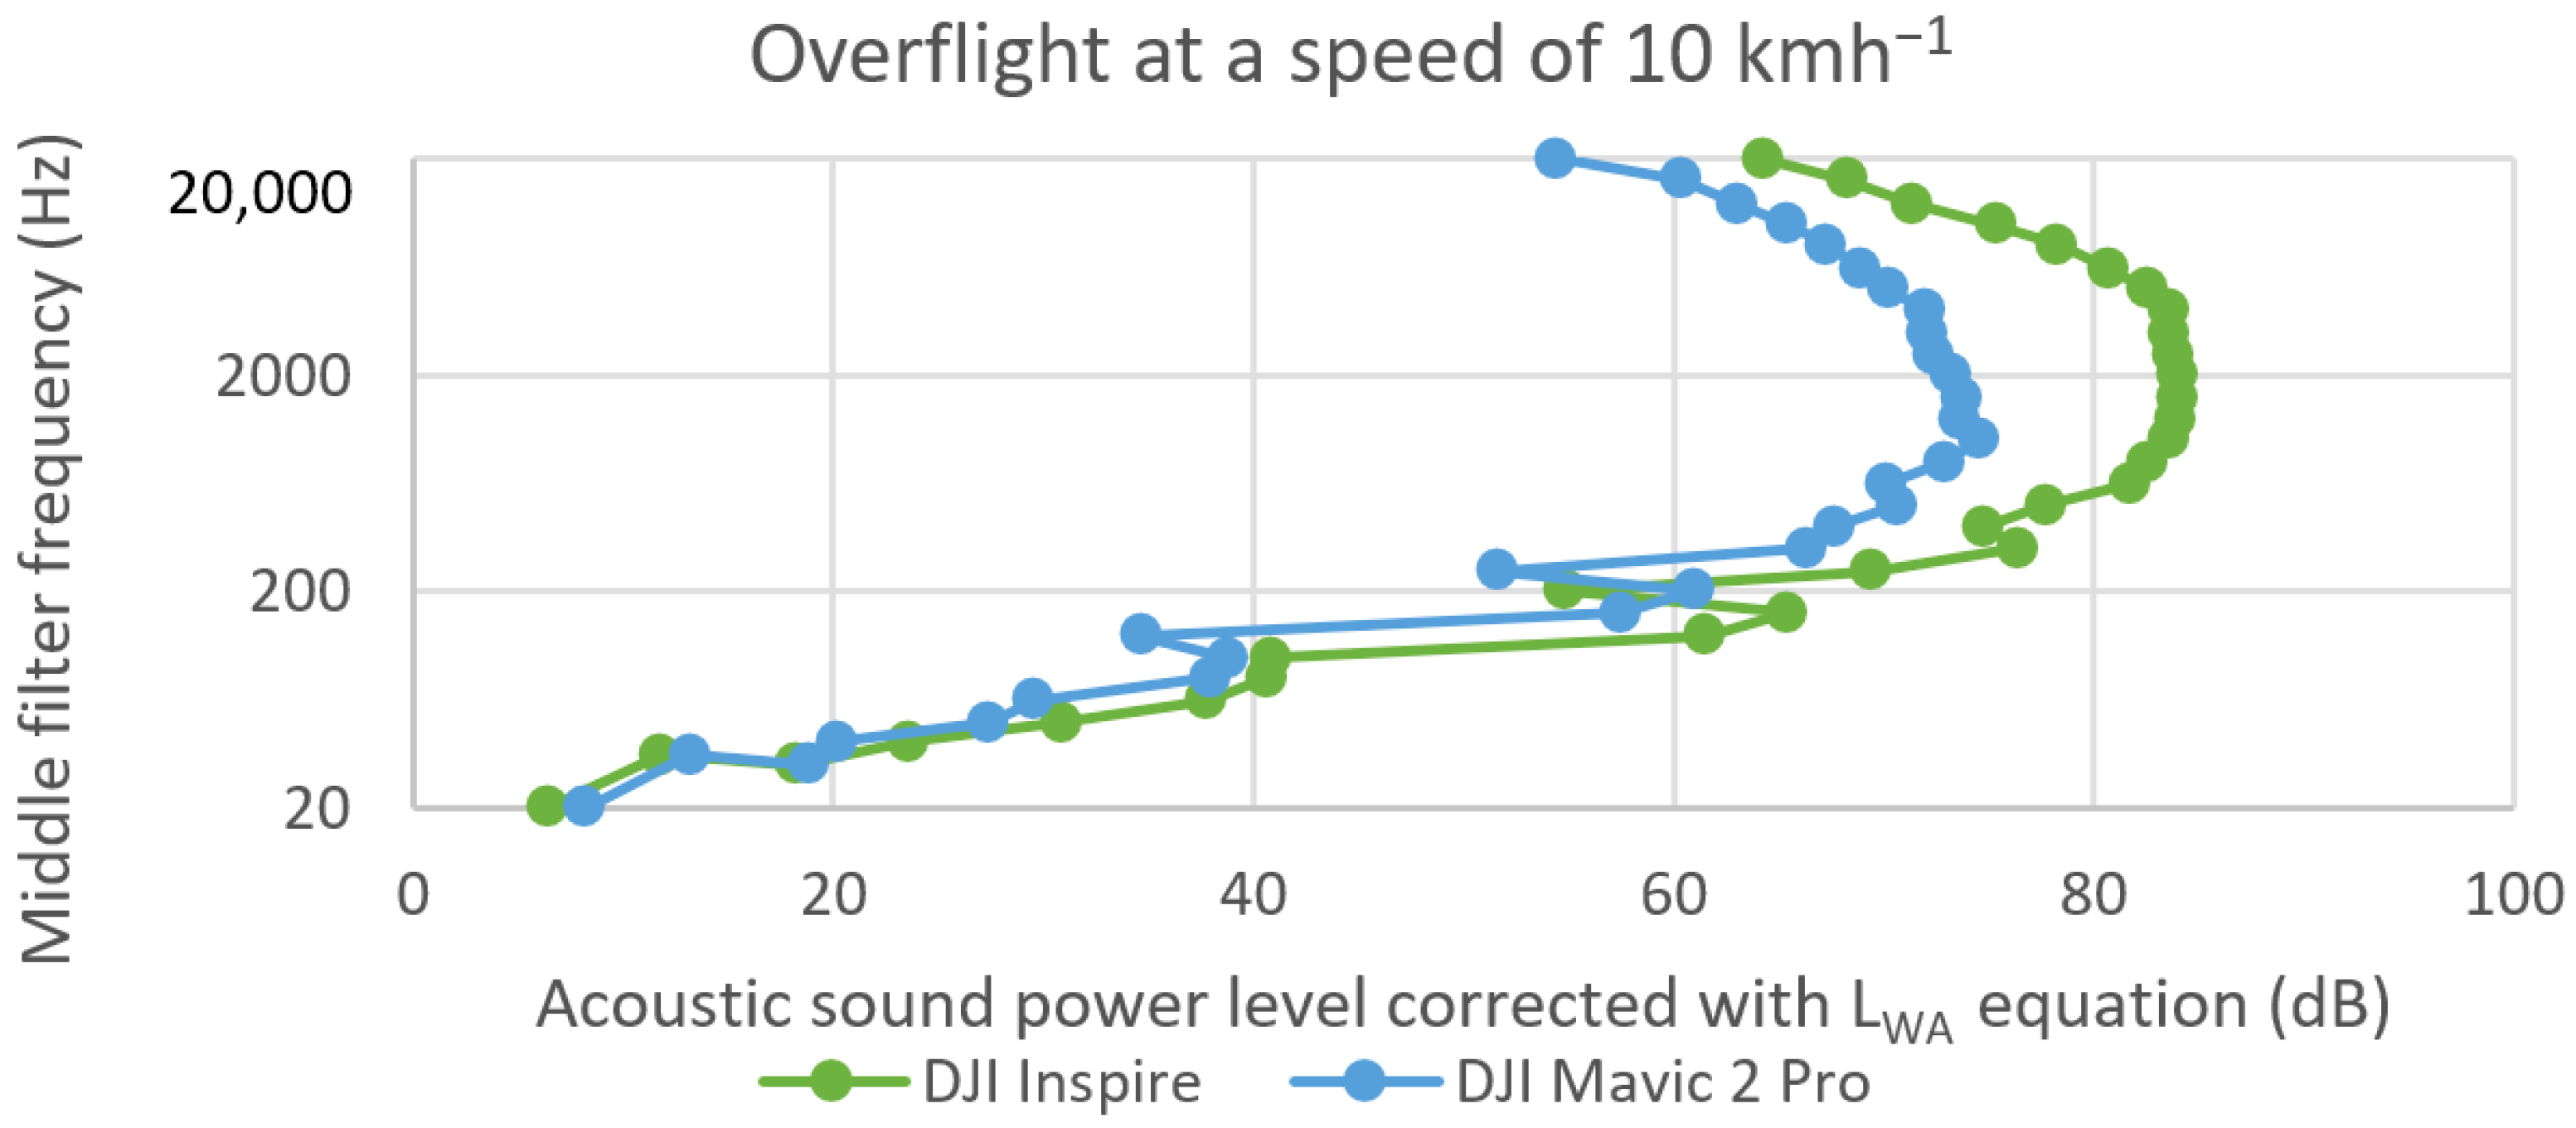
| Acoustic Sound Power Level Corrected with LWA Equation (dB) | ||||
|---|---|---|---|---|
| Middle Filter Frequency (Hz) | 5 kmh−1 | 10 kmh−1 | 20 kmh−1 | Hovering |
| 20 | 8.4 | 8.2 | 13.2 | 14.7 |
| 40 | 21.4 | 20.2 | 24.8 | 36.3 |
| 80 | 33.9 | 38.0 | 39.3 | 40.3 |
| 160 | 53.0 | 57.6 | 63.9 | 53.3 |
| 315 | 64.1 | 66.4 | 67.8 | 60.9 |
| 630 | 66.5 | 70.2 | 73.7 | 67.0 |
| 1250 | 70.0 | 73.6 | 76.1 | 70.7 |
| 2500 | 68.6 | 72.4 | 75.1 | 70.0 |
| 5000 | 67.8 | 70.3 | 73.7 | 68.9 |
| 10,000 | 65.0 | 65.5 | 67.7 | 64.7 |
| 20,000 | 55.8 | 54.5 | 55.8 | 54.2 |
Disclaimer/Publisher’s Note: The statements, opinions and data contained in all publications are solely those of the individual author(s) and contributor(s) and not of MDPI and/or the editor(s). MDPI and/or the editor(s) disclaim responsibility for any injury to people or property resulting from any ideas, methods, instructions or products referred to in the content. |
© 2023 by the authors. Licensee MDPI, Basel, Switzerland. This article is an open access article distributed under the terms and conditions of the Creative Commons Attribution (CC BY) license (https://creativecommons.org/licenses/by/4.0/).
Share and Cite
Škultéty, F.; Bujna, E.; Janovec, M.; Kandera, B. Noise Impact Assessment of UAS Operation in Urbanised Areas: Field Measurements and a Simulation. Drones 2023, 7, 314. https://doi.org/10.3390/drones7050314
Škultéty F, Bujna E, Janovec M, Kandera B. Noise Impact Assessment of UAS Operation in Urbanised Areas: Field Measurements and a Simulation. Drones. 2023; 7(5):314. https://doi.org/10.3390/drones7050314
Chicago/Turabian StyleŠkultéty, Filip, Erik Bujna, Michal Janovec, and Branislav Kandera. 2023. "Noise Impact Assessment of UAS Operation in Urbanised Areas: Field Measurements and a Simulation" Drones 7, no. 5: 314. https://doi.org/10.3390/drones7050314
APA StyleŠkultéty, F., Bujna, E., Janovec, M., & Kandera, B. (2023). Noise Impact Assessment of UAS Operation in Urbanised Areas: Field Measurements and a Simulation. Drones, 7(5), 314. https://doi.org/10.3390/drones7050314