Article

High-Precision Mapping of Soil Organic Matter Based on UAV Imagery Using Machine Learning Algorithms

1
Research Center of Information Technology, Beijing Academy of Agriculture and Forestry Sciences, Beijing 100097, China
2
College of Resources Environment and Tourism, Capital Normal University, Beijing 100048, China
3
Department of Plant Sciences, University of Tennessee, Knoxville, TN 37996, USA
4
Department of Environmental and Geosciences, Sam Houston State University, Huntsville, TX 77340, USA
5
College of Information and Electrical Engineering, China Agricultural University, Beijing 100083, China
6
School of Surveying and Land Information Engineering, Henan Polytechnic University, Jiaozuo 454000, China
*
Authors to whom correspondence should be addressed.
Drones 2023, 7(5), 290; https://doi.org/10.3390/drones7050290
Submission received: 6 April 2023 / Revised: 23 April 2023 / Accepted: 24 April 2023 / Published: 26 April 2023

Abstract

:
Soil organic matter (SOM) is a critical indicator of soil nutrient levels, and the precise mapping of its spatial distribution through remote sensing is essential for soil regulation, precise fertilization, and scientific management and protection. This information can offer decision support to agricultural management departments and various agricultural producers. In this paper, two new soil indices, NLIrededge2 and GDVIrededge2, were proposed based on the sensitive spectral response characteristics of SOM in Northeast China. Nine parameters suitable for SOM mapping and modeling were determined using the competitive adaptive reweighted sampling (CARS) method, combined with spectrum reflectance, mathematical transformations of reflectance, vegetation indices, and so on. Then, utilizing unmanned aerial vehicle (UAV)-based multispectral images with centimeter-level resolution, a random forest machine learning algorithm was used to construct the inversion model of SOM and mapping SOM in the study area. The results showed that the random forest algorithm performed best for estimating SOM (R2 = 0.91, RMSE = 0.95, MBE = 0.49, and RPIQ = 3.25) when compared with other machine learning algorithms such as support vector regression (SVR), elastic net, Bayesian ridge, and linear regression. The findings indicated a negative correlation between SOM content and altitude. The study concluded that the SOM modeling and mapping results could meet the needs of farmers to obtain basic information and provide a reference for UAVs to monitor SOM.

1. Introduction

Soil organic matter (SOM) is a crucial factor for crop growth as it provides essential nutrients for plants and maintaining the soil environment [1]. By obtaining accurate spatial distribution information of SOM and creating high-precision maps, farmers can make informed decisions about soil management. Additionally, this information can provide accurate fertilization recommendations for family farms, farmers’ cooperatives, and leading enterprises, benefiting a wide range of agricultural producers. The rapid and precise mapping of SOM, therefore, holds significant practical applications.
In recent years, with the rapid development of intelligent agriculture and ecological agriculture in China, agricultural producers and operators have an urgent need for accurate fertilization, fertilization optimization, and environmental protection. Government departments have also started to pay more and more attention to soil protection, actively carry out national soil surveys, and put forward the strategy of black land protection in Northeast China. Therefore, it is urgent to obtain the content of SOM on the plot scale quickly and accurately.
At present, the mapping of SOM mainly depends on field samples and laboratory chemical analysis [2,3]. The measurement of the organic matter content of field samples is very accurate, but the manpower costs and testing costs are high, and the timeliness is poor. Field observations can only provide information on the SOM content at the specific observation site, leaving the organic matter content outside the site to be estimated through the use of spatial interpolation techniques. This allows for the creation of a spatial map of SOM content indirectly [4,5,6].
Remote sensing technology is an effective and economical means of acquiring spatial information [7,8]. In recent years, satellite-to-ground remote sensing technology has experienced rapid development, becoming another technical means for mapping the spatial distribution of SOM. Currently, remote sensing is mainly utilized for large-scale spatial mapping of SOM both domestically and internationally [9]. The mechanism for inverting SOM from remote sensing has been widely studied [8,9,10,11], as SOM displays a pronounced spectral response in the visible and near-infrared bands, particularly in the 600 nm~800 nm range [12]. Furthermore, there is a substantial negative correlation between organic matter content and spectral values in this band, as supported by research [12,13]. There are five primary methods for monitoring SOM using remote sensing techniques. (1) Remote sensing inversion method based on hyperspectral data by portable field spectroradiometer. It can be determined in the laboratory or directly in the field [2,3]. (2) Remote sensing inversion based on multispectral images. Landsat, Sentinel-2, Gaofen-1 (GF-1), Satellite Pour l’Observation de la Terre (SPOT), Moderate Resolution Imaging Spectroradiometer (MODIS), and other medium resolution multispectral satellite remote sensing images [4,14,15,16] are mostly used. (3) Remote sensing inversion based on hyperspectral images. Two platforms are available for this method, satellite hyperspectral and airborne hyperspectral [17,18]. Satellite hyperspectral has been a popular approach over the past decades; however, due to the limited data availability and reduced spatial resolution, challenges remain for this approach, specifically, satellite-based multispectral mapping cannot meet the actual needs for SOM mapping because of the lower spatial resolution [19,20,21]. (4) Remote sensing inversion method based on satellite radar remote sensing image. Most of the studies [22,23] use radar satellite remote sensing images such as Sentinel-1 [24,25]. (5) Remote sensing inversion based on multi-source data fusion [12,13,26]. Multi-source data fusion is an approach that fuses more than a single data source, typically, ground measurements, multispectral, hyperspectral, and radar data are the most used data sources. The data of the ground spectrometer is easy to obtain and the inversion accuracy is high, but the spectrometer can only cover a limited point scale. This method requires a large number of field sampling points, which is time-consuming and labor-consuming. Multispectral satellites have rich data sources, low cost, and high efficiency, but the spatial resolution is general and the inversion accuracy is limited. This method is suitable for large-scale monitoring and evaluation, but cannot meet the inversion of SOM on the plot scale [27,28]. Hyperspectral images and radar images are difficult to obtain, and they are also expensive; therefore, we have quite limited data sources, which greatly limits their application. Overall, the multi-source data fusion method is still under development, and the accuracy and efficiency cannot be guaranteed stably [29,30].
The overall objective of this study is to map SOM over a large area, and to this end, multispectral remote sensing is more suitable for large-scale spatial mapping of SOM, with low cost and strong timeliness; however, the mapping accuracy and efficiency need to be improved [31,32]. High spatial resolution SOM mapping at the plot scale is needed for soil precision regulation and precision fertilization. Unmanned aerial vehicle (UAV) remote sensing [33,34] is flexible and can not only obtain centimeter-level high spatial resolution remote sensing images, but also has a low cost, and can provide data sources for high-precision mapping of SOM on the plot scale [35,36,37]. However, the research on SOM retrieval based on UAVs is understudied.
Conventional classification algorithms, such as supervised and unsupervised classification, are simple but have low mapping accuracy. However, precision agriculture and intelligent ecological industries require high-precision mapping. In recent years, machine learning algorithms have undergone constant updates with the rapid development of global intelligent technology [36]. As a result, the reliability, accuracy, and robustness of these algorithms and models have greatly improved. With intelligent learning capabilities, machine learning algorithms can achieve high-precision remote sensing mapping. Popular machine learning algorithms include random forest regression (RFR), support vector regression (SVR), artificial neural network (ANN), elastic net regression (EN), multilayer perceptron (MLP), boosted regression tree (BRT), K neighbors regression (KNR), radial basis function (RBF), and more [11,36,38]. The trend is to not only use a single machine learning algorithm for self-help learning but also integrate various algorithms for comprehensive learning. Machine learning algorithms have been widely used in agricultural and ecological fields based on UAV remote sensing technology [11]. Their main applications include crop identification, forest identification, inversion of key vegetation growth parameters, pest monitoring, disaster assessment, and prediction.
In this study, based on multispectral images with a spatial resolution of 1.5 cm obtained by UAV on 29 October 2021, the spectral characteristics of SOM were analyzed. New soil indices were proposed based on the sensitive spectral response characteristics of SOM. The soil indices were constructed, competitive adaptive reweighted sampling (CARS) was performed to select the suitable parameters, and the random forest machine learning algorithm was used to construct the inversion model of SOM. The results provide a reference for UAV remote sensing to monitor SOM. The paper includes three sections: Section 2 explains the multispectral data collected from UAV and spectral characteristic indices developed for the SOM mapping objectives; Section 3 presents the results of the SOM mapping from the methods; Section 4 discusses the results and work that remains to be carried out.

2. Methods

2.1. Study Area

The study area is located in the heart of Songnen Plain in Suihua City (125°34′2″–125°34′9″ E, 45°58′16″–45°58′20″ N), Heilongjiang Province, Northeast China (Figure 1), which is the chernozem region, according to the World Reference Base for Soil Resources (WRB, 2015) [39]. The region is a crucial food production base in the mid-temperate continental monsoon climate zone and has favorable natural conditions for crop growth. The annual average air temperature in the study area is 3.3 °C, and the annual average rainfall is approximately 543.5 mm [39]. The terrain of the study area is predominantly flat, with the northwest having a higher elevation than the southeast, ranging from 230.42 m to 234.79 m. The region is recognized for its first-class cold black soil, consisting mainly of chernozem and meadow soil, which is highly fertile and suitable for farming. Due to its vast territory, the area is rich in resources and features diverse characteristics. The main crops in the region include corn, soybeans, and rice, which are cultivated annually [40,41].
Remote sensing inversion of SOM is influenced by various factors, such as soil type, soil water content, soil surface cover (vegetation, crop straw, etc.), and tillage methods. To eliminate the interference of these factors, this study conducted SOM remote sensing inversion and mapping on the plot scale. The study area had the same soil type (chernozem), last season crop type (corn), tillage method (machine operation), and crop ripening system (one crop a year). The research was conducted during the bare soil period following crop harvest, the tillage layer had been plowed and the soil surface was left uncovered, as illustrated in Figure 1. Furthermore, there were no occurrences of floods or droughts before the study period, and soil water content showed minimal variation.

2.2. Data

2.2.1. Acquisition and Processing of Soil Data

To map the SOM with remote sensing, 40 sites with uniform spatial distribution for soil sampling in the study area were selected for spectral analysis. First of all, a handheld GPS unit (Trimble Juno 3D) was used to record the coordinates of the sites of the sample point. To get an accurate measurement, soil samples were taken in the field by using the five-point method within a range of 20 cm × 20 cm of each site. After removing plant roots, gravel, and other debris, the topsoil of 1 kg within the upper and lower 15 cm was mixed, bagged, and sealed. Finally, the soil was air-dried, ground, and screened at 2 mm, and the content of SOM was determined by the potassium dichromate external heating method [42]. Table 1 shows the basic statistics of the SOM samples.

2.2.2. Acquisition and Processing of Remote Sensing Data

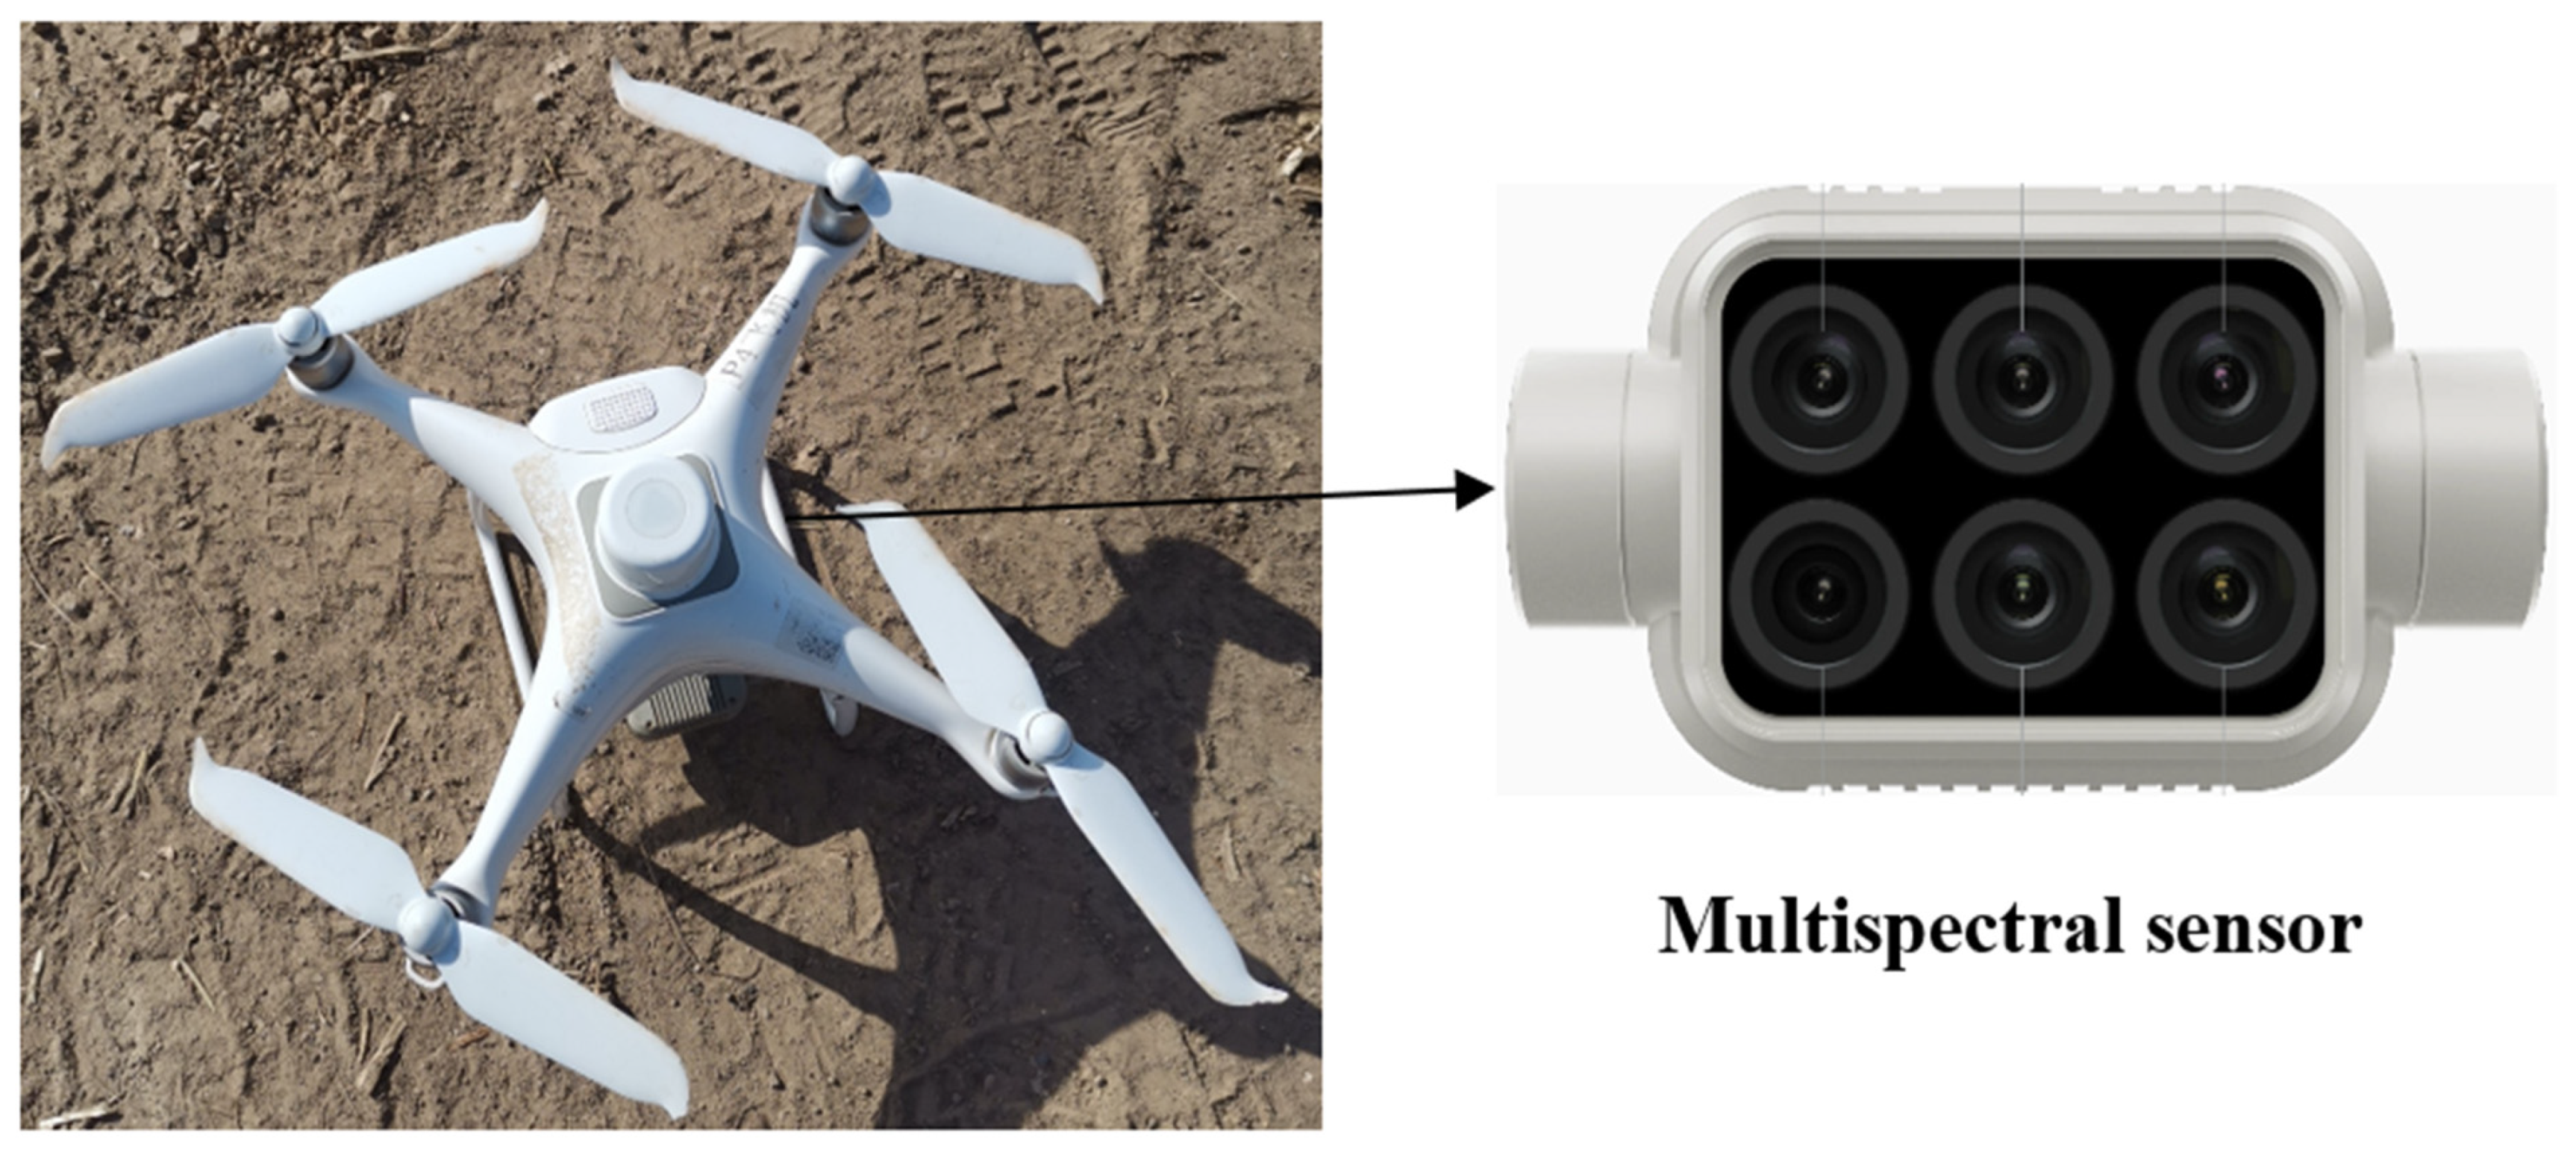
Multispectral remote sensing images with a resolution of centimeter-level were obtained during the bare soil period (October to May) in the study area using a DJI Phantom 4 Pro V2.0 multispectral UAV (Figure 2). The aerial photo was taken on 29 October 2021, with clear and breezy weather conditions. To ensure that the study’s area was adequately covered, the route was reasonably planned using DJI GS Pro (Ground Station Pro), a DJI route planning professional software. The aerial parameters were set as follows: the altitude was 60 m, the spatial resolution of the image was 1.5 cm, and the course overlap rate and lateral overlap rates were both 80%. The multispectral images have five bands (Table 2): blue band B1 (450 nm), green band B2 (560 nm), red band B3 (650 nm), rededge band B4 (730 nm), and near-infrared band B5 (840 nm).
The obtained images underwent preprocessing, including the following steps: (1) checking photo quality to eliminate unnecessary photos such as take-off and landing images; (2) image photogrammetry and ortho-mosaicking to merge the photos; (3) generating a digital orthophoto image; (4) exporting multispectral images; (5) exporting the digital surface model (DSM) image; (6) image band combination; (7) image clipping; (8) projection transformation; (9) resampling. Consequently, a multispectral image with a spatial resolution of 1.5 cm and a DSM image with a spatial resolution of 20 cm were generated. The coordinate system used was WGS84_UTM_Zone 51N.

2.3. Methods

2.3.1. Construction of Spectral Characteristic Indices

In order to achieve the high-precision remote sensing inversion of SOM, the sensitive characteristic band of SOM must be found first. This is because the sensitive characteristic band and sensitive characteristic index of SOM are the basis of the remote sensing inversion model of SOM. In this study, the sensitive characteristic index can be constructed according to the sensitive characteristic band of SOM. In order to determine the sensitive characteristic bands of SOM, the correlation between SOM and the reflectance of five bands was analyzed.
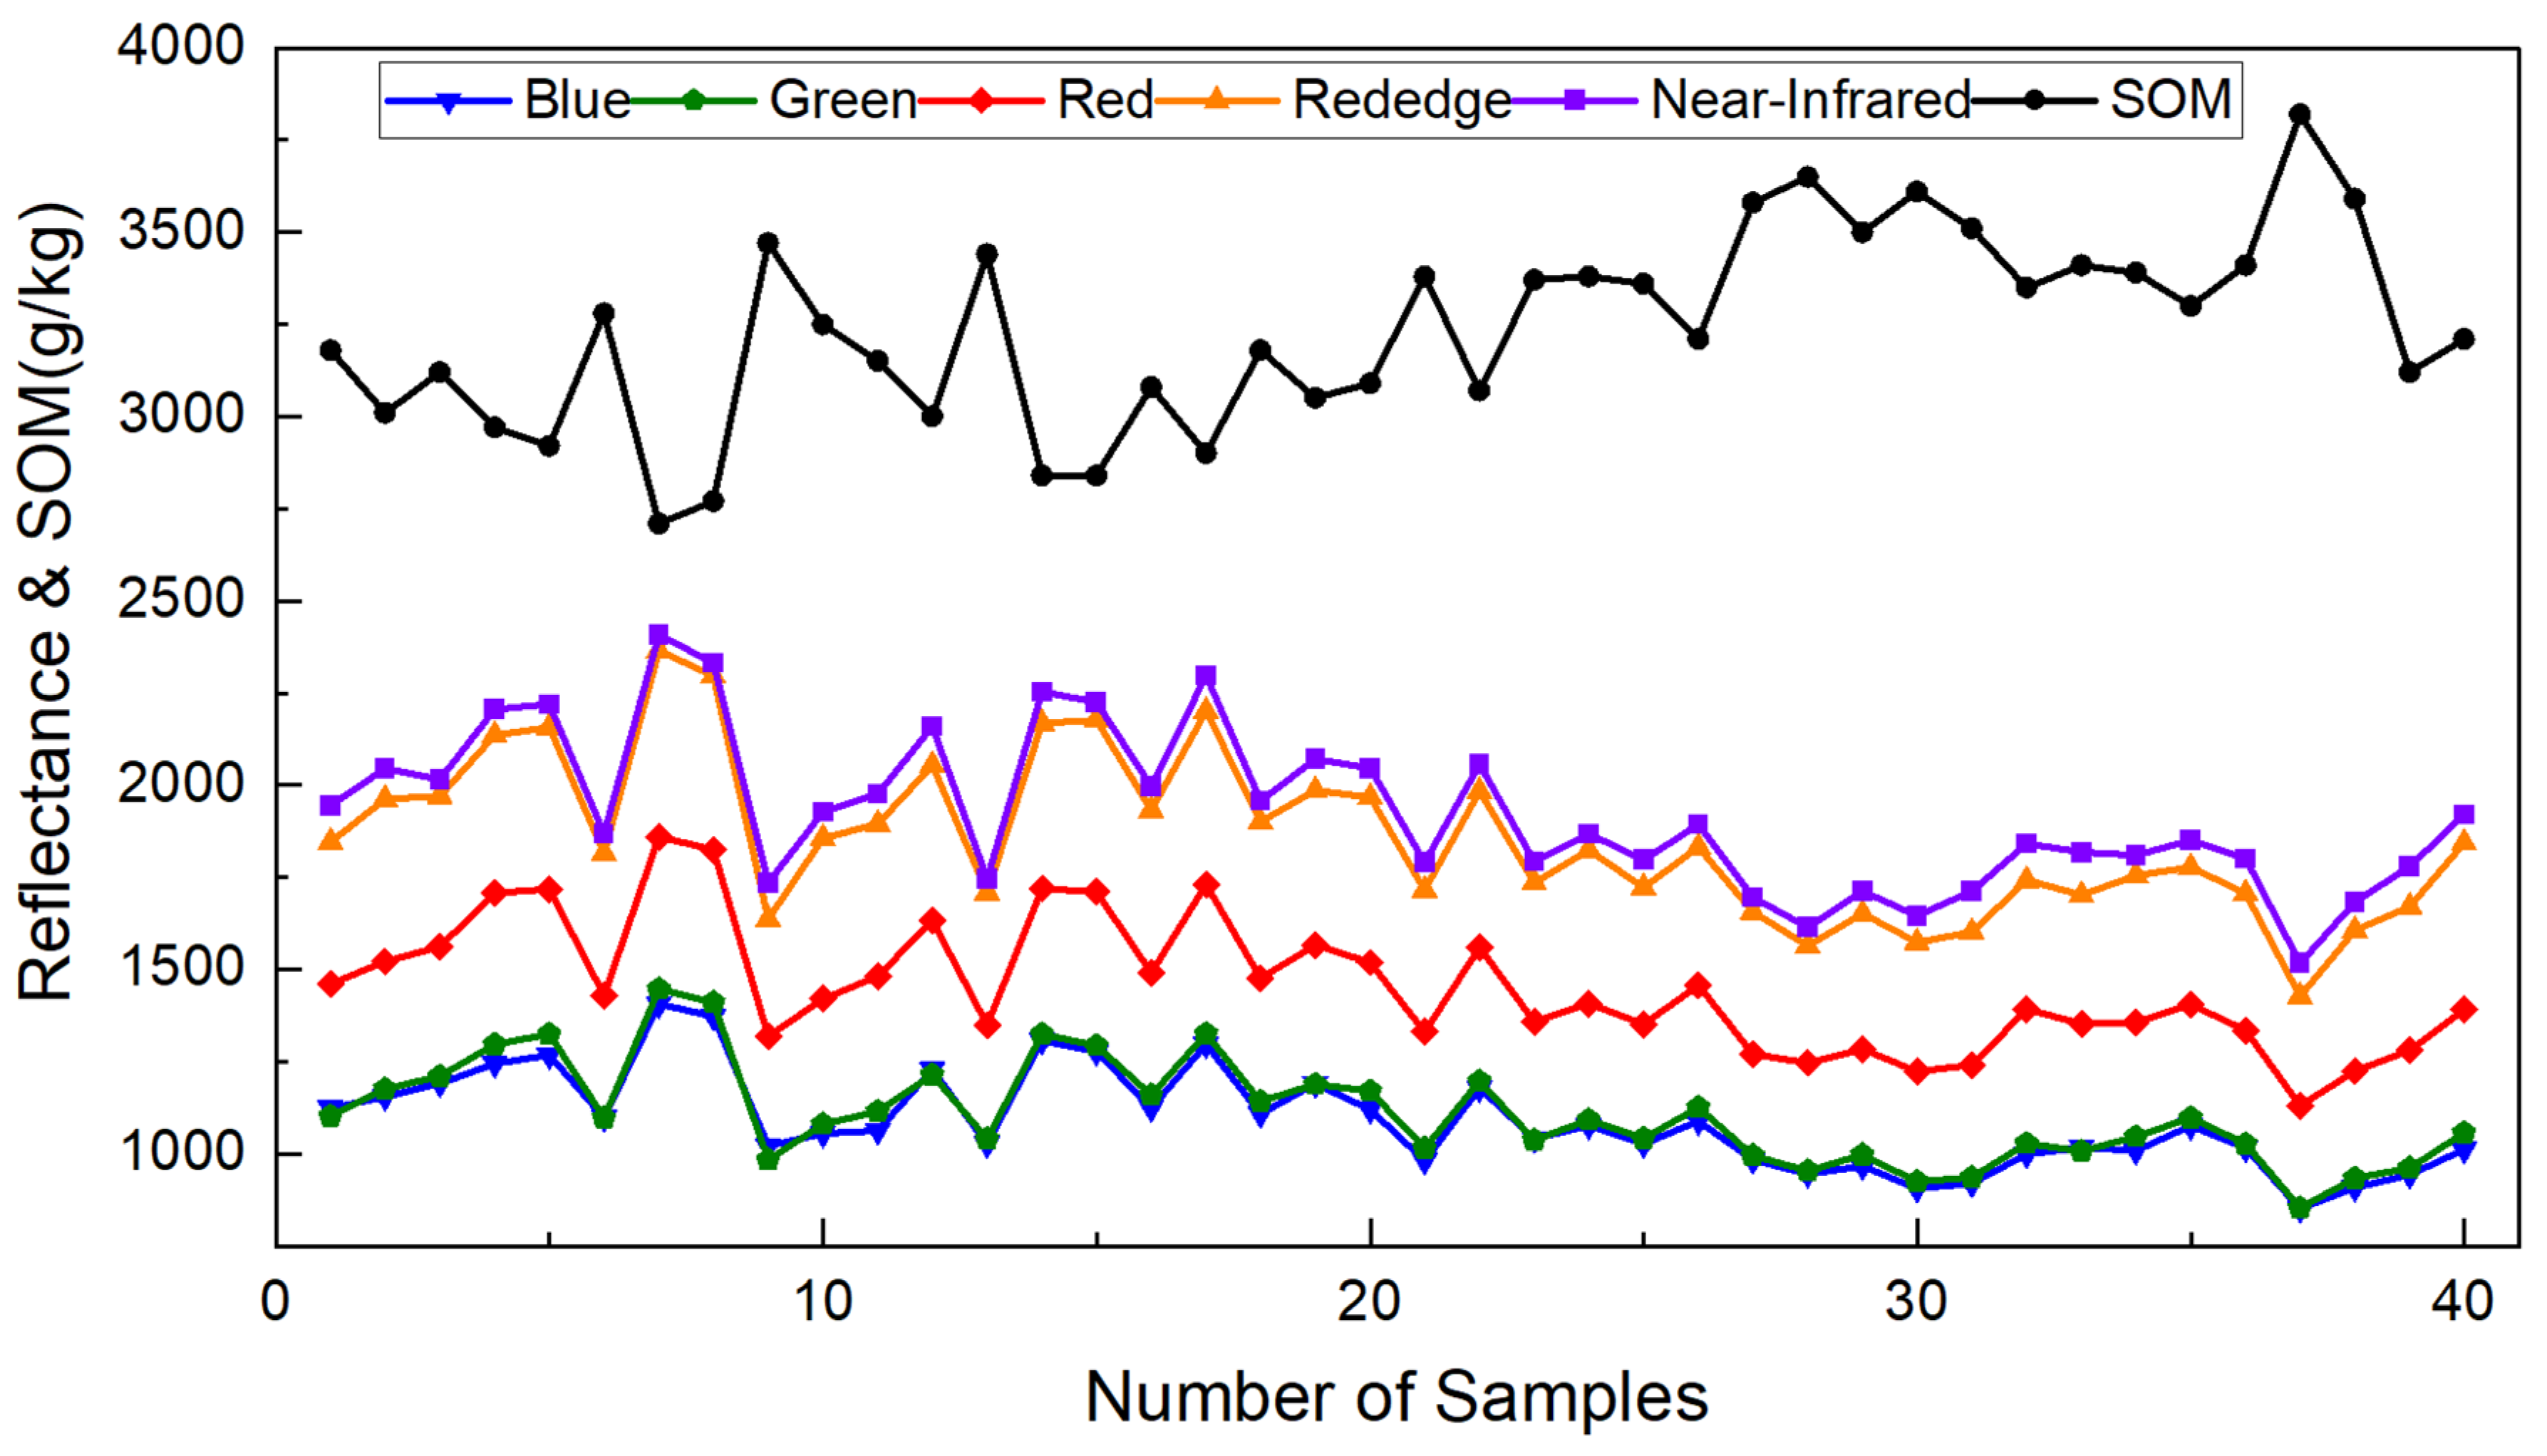
Using the multispectral images from UAV, the soil spectral curves for 5 bands (B1–B5) were obtained by extracting the spectral pixel values from 40 soil samples obtained in the field. These curves were used to analyze the spectral response of soil samples with varying organic matter content. To enhance the level of detail, we calculated the soil index by increasing the reflectivity by 10,000 times. In order to analyze and screen the sensitive band of SOM, SOM was enlarged by 100 times and compared with band reflectance (Figure 3).
By conducting thorough observations and analysis of the spectral reflectance and SOM curve of soil samples, a negative correlation was discovered between SOM and the five bands. Particularly, in the near-infrared band B5, the rededge band B4, and the red band B3, there were distinct spectral response characteristics that could be utilized to create the novel soil index. This soil index could be further applied for remote sensing modeling and inversion to investigate SOM in greater detail.

2.3.2. Selection of Spectral Characteristic Indices

Various spectral characteristic indices for remote sensing retrieval of soil parameters have been compiled and summarized from the literature review of previous studies (Table 3). In addition, a comprehensive analysis of the spectral response of soil samples with varying levels of organic matter was performed using UAV images, specifically focusing on the B1–B5 band and the B4 rededge band, the bands that are highly sensitive to SOM. In this paper, ten new soil indices were proposed, which were RDVIrededge1, RDVIrededge2, GDVIrededge1, GDVIrededge2, NLIrededge1, NLIrededge2, CRSIrededge1, CRSIrededge2, MSRrededge1, and MSRrededge2. As a result of this analysis, a multitude of new soil indices have been proposed and constructed, resulting in the identification of 118 indicators in total. For the complete list of indicators, see Table 3.
CARS is used for feature selection and classification tasks [38,58]. It is particularly useful in situations where there are many input features and only a limited amount of data. CARS works by iteratively selecting a subset of features based on their importance in separating the different classes in the data. The algorithm assigns weights to each feature and uses these weights to sample the data, with more weight given to the features that are more important for classification. The weights are then updated based on the performance of the classifier, with more weight given to the features that contribute more to the classification accuracy. This process is repeated until a satisfactory subset of features is obtained. CARS [38] has been shown to be effective in improving classification accuracy and reducing the number of input features needed, which can lead to more efficient and interpretable models.
To minimize data redundancy, it is essential to identify the optimal sensitive band and index for SOM inversion. Based on existing vegetation remote sensing research, a few spectral indices that are sensitive to SOM were selected and applied to monitor it. This study selected and constructed 118 indicators in total, and employed the CARS method for screening sensitive features, which outperformed the R2 sorting method.

2.3.3. Inversion Model of SOM

There are many different types of machine learning algorithms, including supervised learning algorithms, unsupervised learning algorithms, and reinforcement learning algorithms [11,15,36,38]. Some common machine learning algorithms for regression analysis include random forest regression, SVR, neural networks, K-nearest neighbors regression, principal component regression, and so on. Each algorithm has its own strengths and weaknesses, and the choice of algorithm depends on the specific problem being addressed and the characteristics of the data.
Random forest regression is a non-parametric and nonlinear machine learning approach that is used for predicting continuous numerical values. It is an ensemble learning method that combines multiple decision trees to improve the accuracy and robustness of the predictions [38]. Each decision tree in the forest is trained on a random subset of the input data and a random subset of the input features. Random forest regression is widely used in various fields, including agricultural science and environmental sciences, due to its ability to handle high-dimensional data, nonlinear relationships, and interactions among input variables. SVR is a linear method that is useful in situations where there are many input variables and a limited amount of data. SVR is based on the idea of finding the hyperplane that maximizes the margin between the data points. In SVR, the goal is to find a function that stays within a certain margin of error from the true function, while still trying to fit the data as closely as possible [38]. Elastic net combines the lasso and ridge regression methods. It is designed to handle datasets with a high degree of collinearity between the input variables, where lasso and ridge regression may not perform as well. Elastic net combines the penalties of lasso and ridge regression, allowing it to select relevant features and reduce overfitting [15]. Bayesian ridge is based on Bayesian inference. It is a linear model that estimates a probabilistic distribution of the regression coefficients, which allows for uncertainty quantification in the model predictions. Bayesian ridge uses a prior distribution over the regression coefficients and updates it based on the observed data, using Bayes’ theorem. This approach allows for the incorporation of prior knowledge about the data into the model, which can improve its accuracy and robustness. The algorithm also automatically determines the amount of regularization to apply, which can help prevent overfitting [36]. Linear regression is a statistical method used for modeling the relationship between a dependent variable and one or more independent variables. It assumes a linear relationship between the variables and aims to find the line of best fit that minimizes the sum of squared errors between the predicted and actual values. Linear regression is a simple yet powerful algorithm that can be used for both prediction and inference [11,38].
In this paper, five fitting methods, including random forest regression, SVR, elastic net, Bayesian ridge, and linear regression, were utilized to fit the SOM in the study area. By analyzing the fitting effect and comparing the inversion accuracy, the optimal fitting algorithm was selected based on their performance, and a remote sensing inversion model for SOM was constructed.

2.3.4. Accuracy Evaluation

Based on the data in this study area, the leave-one-out cross-validation (LOO-CV) method [59] was chosen to assess the accuracy of the fitting outcomes. In this paper, the coefficient of determination (R2), root mean square error (RMSE), mean bias error (MBE), and the ratio of performance to interquartile distance (RPIQ) were selected as evaluation indices to comprehensively evaluate the precision of the remote sensing inversion model for SOM (in Equations (1)–(4)). This approach was used to determine the optimal inversion model for SOM based on the model’s performance.
R 2 = 1 i = 1 m y ^ i y i 2 i = 1 m ( y i y i ) 2
R M S E = 1 m i = 1 m y i y ^ i 2 1 2
M B E = 1 m i = 1 m ( y i y ^ i )
R P I Q = Q 3 Q 1 R M S E
where m is the number of test samples, y ^ i is the predicted value of the i-th data point, y i is the true value of the i-th data point, y i is the average of true values, and Q1 and Q3 are the first and third quartiles, respectively.
Large R2 and RPIQ values and small RMSE and MBE values indicate a high level of model accuracy [37].

3. Results

3.1. Selection of the Best Spectral Index Combination

3.1.1. Band Correlations

By analyzing the correlation analysis map of SOM and reflectance of five bands, it was found that there was a significant negative correlation between SOM and the blue, green, red, rededge, and near-infrared bands (Figure 4). The R2 value of SOM and the near-infrared band was 0.67, and the correlation is the strongest, followed by the R2 value of SOM and the rededge band (0.64), and the R2 value of SOM and the red band (0.63). The R2 values between SOM and the green band as well as between SOM and the blue band were both 0.61. The R2 values of SOM and the green and blue bands were all greater than 0.60, and there was also an obvious correlation.
These results are consistent with previous studies, where near-infrared and red had been widely used in soil index construction [43,51,54]. The rededge band is the second most important band after the near-infrared band in terms of its correlation with SOM. However, the comprehensive soil index for the rededge band is currently less developed. In order to more accurately reflect the spectral characteristics of SOM and improve the accuracy of SOM inversion, this study aims to utilize the rededge band to its fullest potential. Specifically, we combine the near-infrared band and red band to construct new soil indices.

3.1.2. Performance of the Ten Newly Constructed Soil Indices

To improve the accuracy of SOM remote sensing inversion, a rededge band with a strong correlation with SOM was introduced to construct the new soil indices. Specifically, the results of RDVIrededge1, RDVIrededge2, GDVIrededge1, GDVIrededge2, NLIrededge1, NLIrededge2, CRSIrededge1, CRSIrededge2, MSRrededge1, and MSRrededge2 are reported.
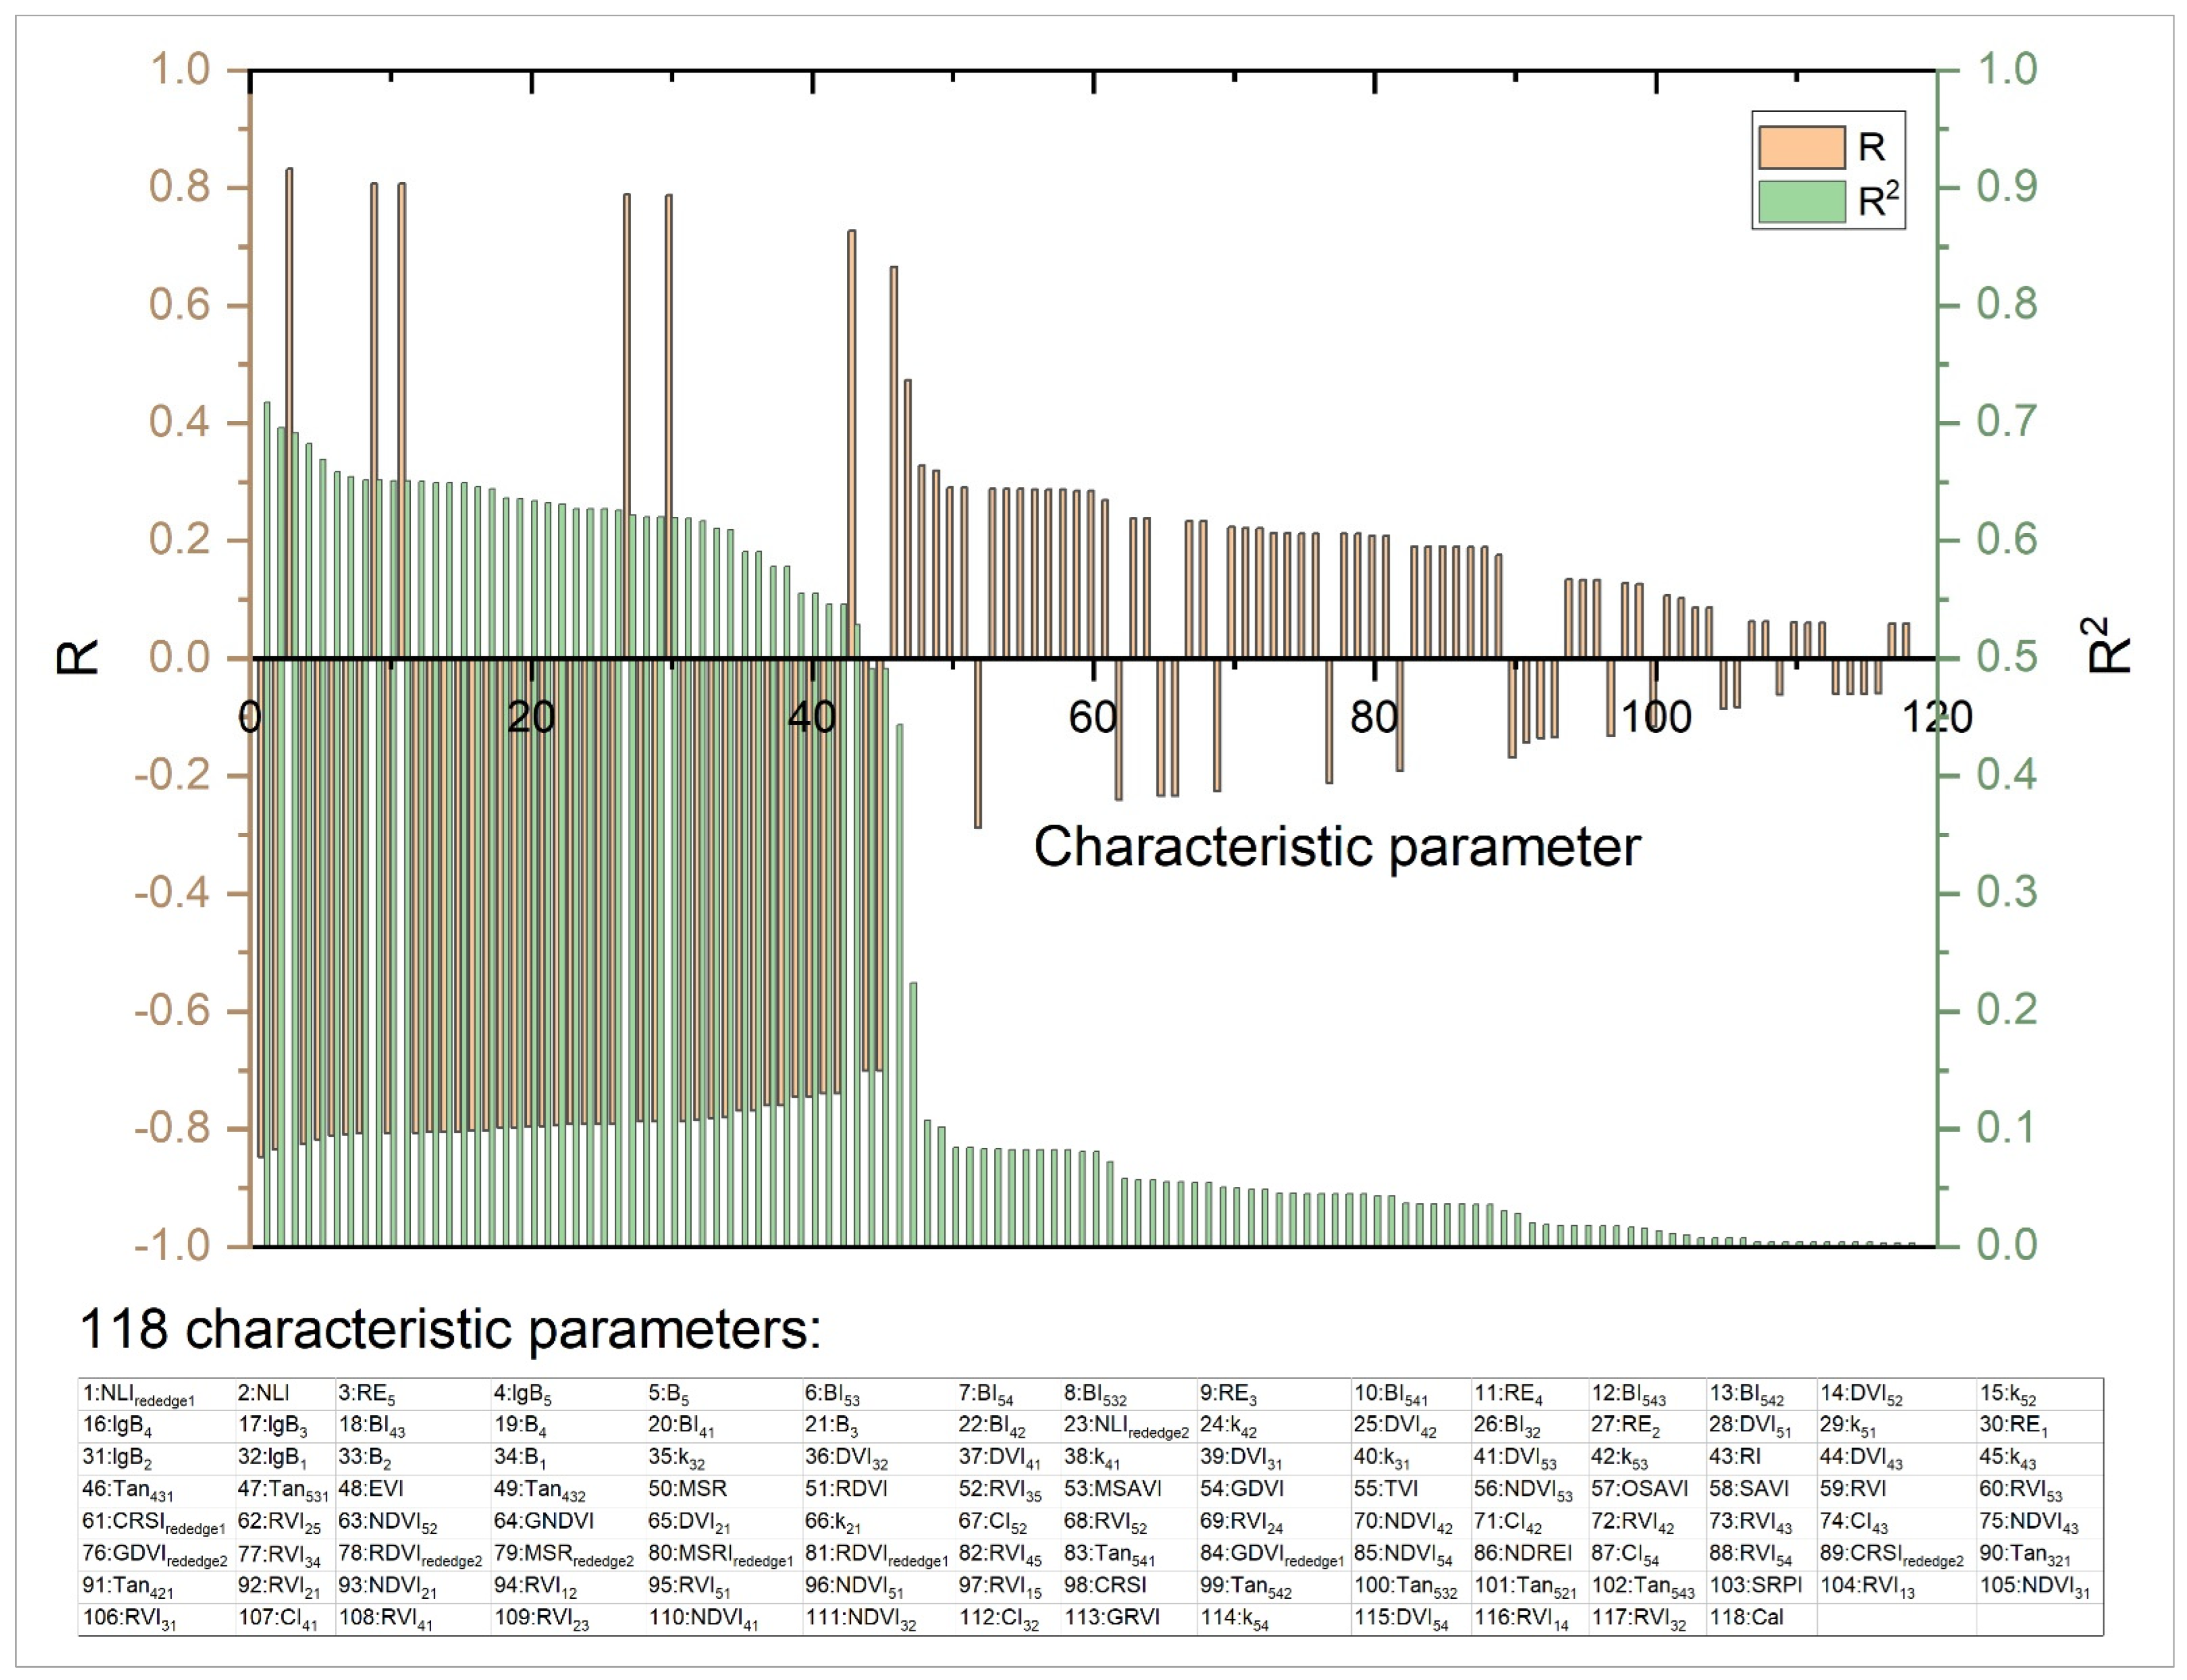
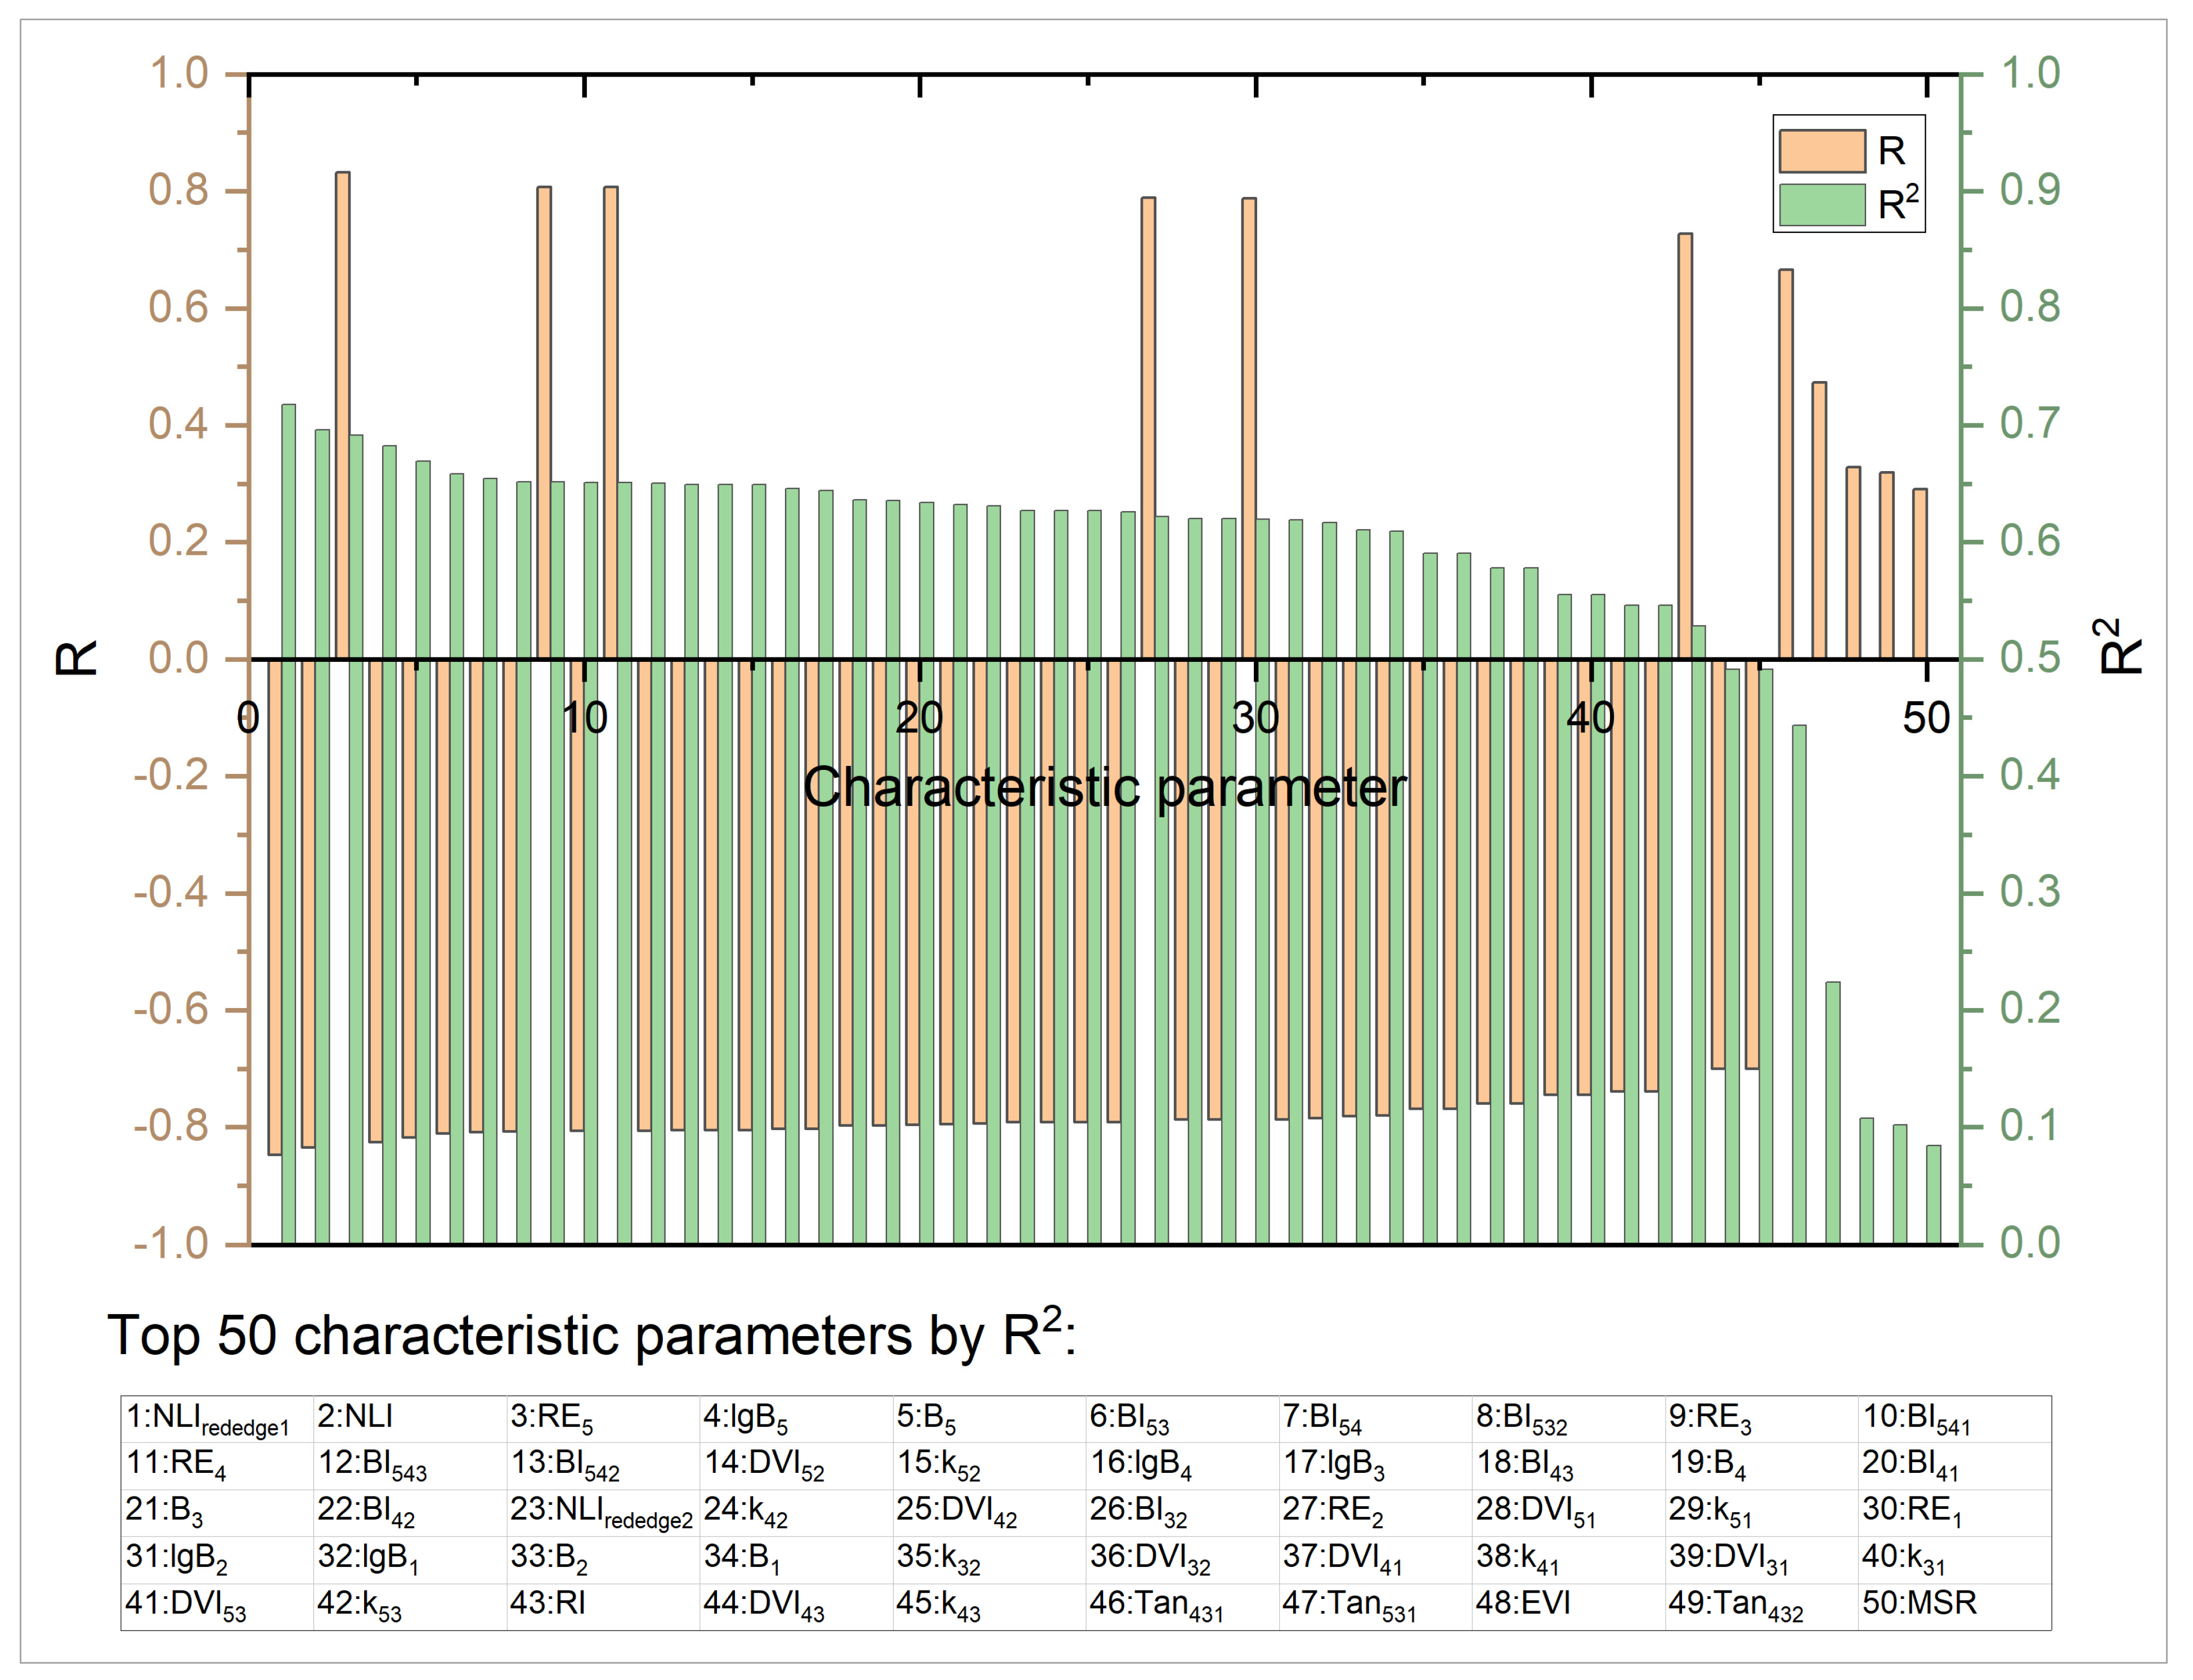
By using the ten new soil indices proposed in this paper, combined with the traditional band spectrum and characteristic index, the results of the 118 characteristic indices were constructed. The correlation between each index in the characteristic index set and SOM was analyzed, and the corresponding R and R2 values were calculated (Figure 5). Figure 5 shows the in-depth analysis of the correlation characteristics between each index and SOM and provides basic information support for feature index screening.
Figure 5 is the correlation analysis map between SOM and the top 50 characteristic parameters by R2. For the complete correlation analysis map between SOM and the top 118 characteristic parameters by R2, see Figure A1 in the Appendix A. As can be seen from Figure 5, NLIrededge1 has the highest correlation with SOM, with the R2 being 0.72. The correlation between NLIrededge1, NLI, NLIrededge2, and SOM was very high, and R2 values were all above 0.6. The correlation between the logarithmic index lgB5, lgB4, lgB3, and SOM was also high, the R2 values were above 0.5. The correlation between original band B5, B4, B3, and SOM was also high, the R2 was above 0.5. Overall, the R2 of 34 indices and SOM was above 0.6, and that of 43 indices and SOM was above 0.5.
The final selection of nine ratios and normalized forms of spectral indices are presented in Table 4. The CARS algorithm was used to identify nine soil indices as SOM-sensitive indices, NLIrededge2, GDVIrededge2, RVI54, RVI, NDREI, B5, lgB1, lgB3, and lgB4. Statistical characteristics of the spectral reflectance of the five bands, blue, green, red, rededge, and near-infrared, including maximum, minimum, mean, and standard deviation, were calculated based on the results of SOM monitoring. Spectral indices were then computed using the reflectance values of UAV remote sensing images, which were used to establish the remote sensing monitoring model for SOM. Out of the nine indices selected by the CARS algorithm, two were derived from the new soil index constructed in this study, namely NLIrededge2 and GDVIrededge2.

3.2. Construction of Inversion Model of SOM

Five fitting methods with good performance, namely random forest regression, SVR, elastic net, Bayesian ridge, and traditional linear regression, were utilized to fit SOM in the study area. Using the nine indices, a SOM model was constructed. Through comparison and analysis, the optimal fitting method was selected as the best-fitting model. Since the correlation between vegetation indices with better correlation with SOM was higher, a multiple regression model was established by partial least squares regression to estimate SOM to resolve the multi-collinearity issue among variables. The models of random forest regression, SVR, elastic net, Bayesian ridge, and traditional linear regression were trained using the “Random Forest Regression, SVR, Elastic Net, Bayesian Ridge, and traditional Linear Regression” package within R.
The calibration dataset consisted of 39 samples, while the validation dataset comprised one sample. Table 5 shows the accuracy of the LOO-CV estimation. The accuracy of the model was evaluated using the comprehensive decision coefficient R2, RMSE, MBE, and RPIQ. The optimal remote sensing model for monitoring SOM was chosen based on the principle of high R2 and RPIQ values and low RMSE and MBE values.
The table above indicates that the random forest regression method provided the best fit for remote sensing inversion of SOM. This was evident by the R2 value of 0.91, as well as the low RMSE of 0.95, the low MBE of 0.49, and the high RPIQ of 3.25. The linear regression method provided a better fit for remote sensing inversion of SOM. The R2, RMSE, MBE, and RPIQ values of the linear regression method were 0.75, 1.04, 0.83, and 2.80, respectively. The elastic net regression, SVR regression, and Bayesian ridge regression methods provided the general fit for remote sensing inversion of SOM. The R2, RMSE, MBE, and RPIQ values of the elastic net regression method were 0.70, 1.09, 0.94, and 3.10, respectively. The R2, RMSE, MBE, and RPIQ values of the SVR regression method were 0.67, 1.09, 0.91, and 3.16, respectively. The R2, RMSE, MBE, and RPIQ values of the Bayesian ridge regression method were 0.67, 0.96, 0.88, and 3.18, respectively. As a result, the random forest regression method was chosen as the optimal approach to develop a model for remote sensing inversion of SOM in the study area.

3.3. The Final Map of SOM

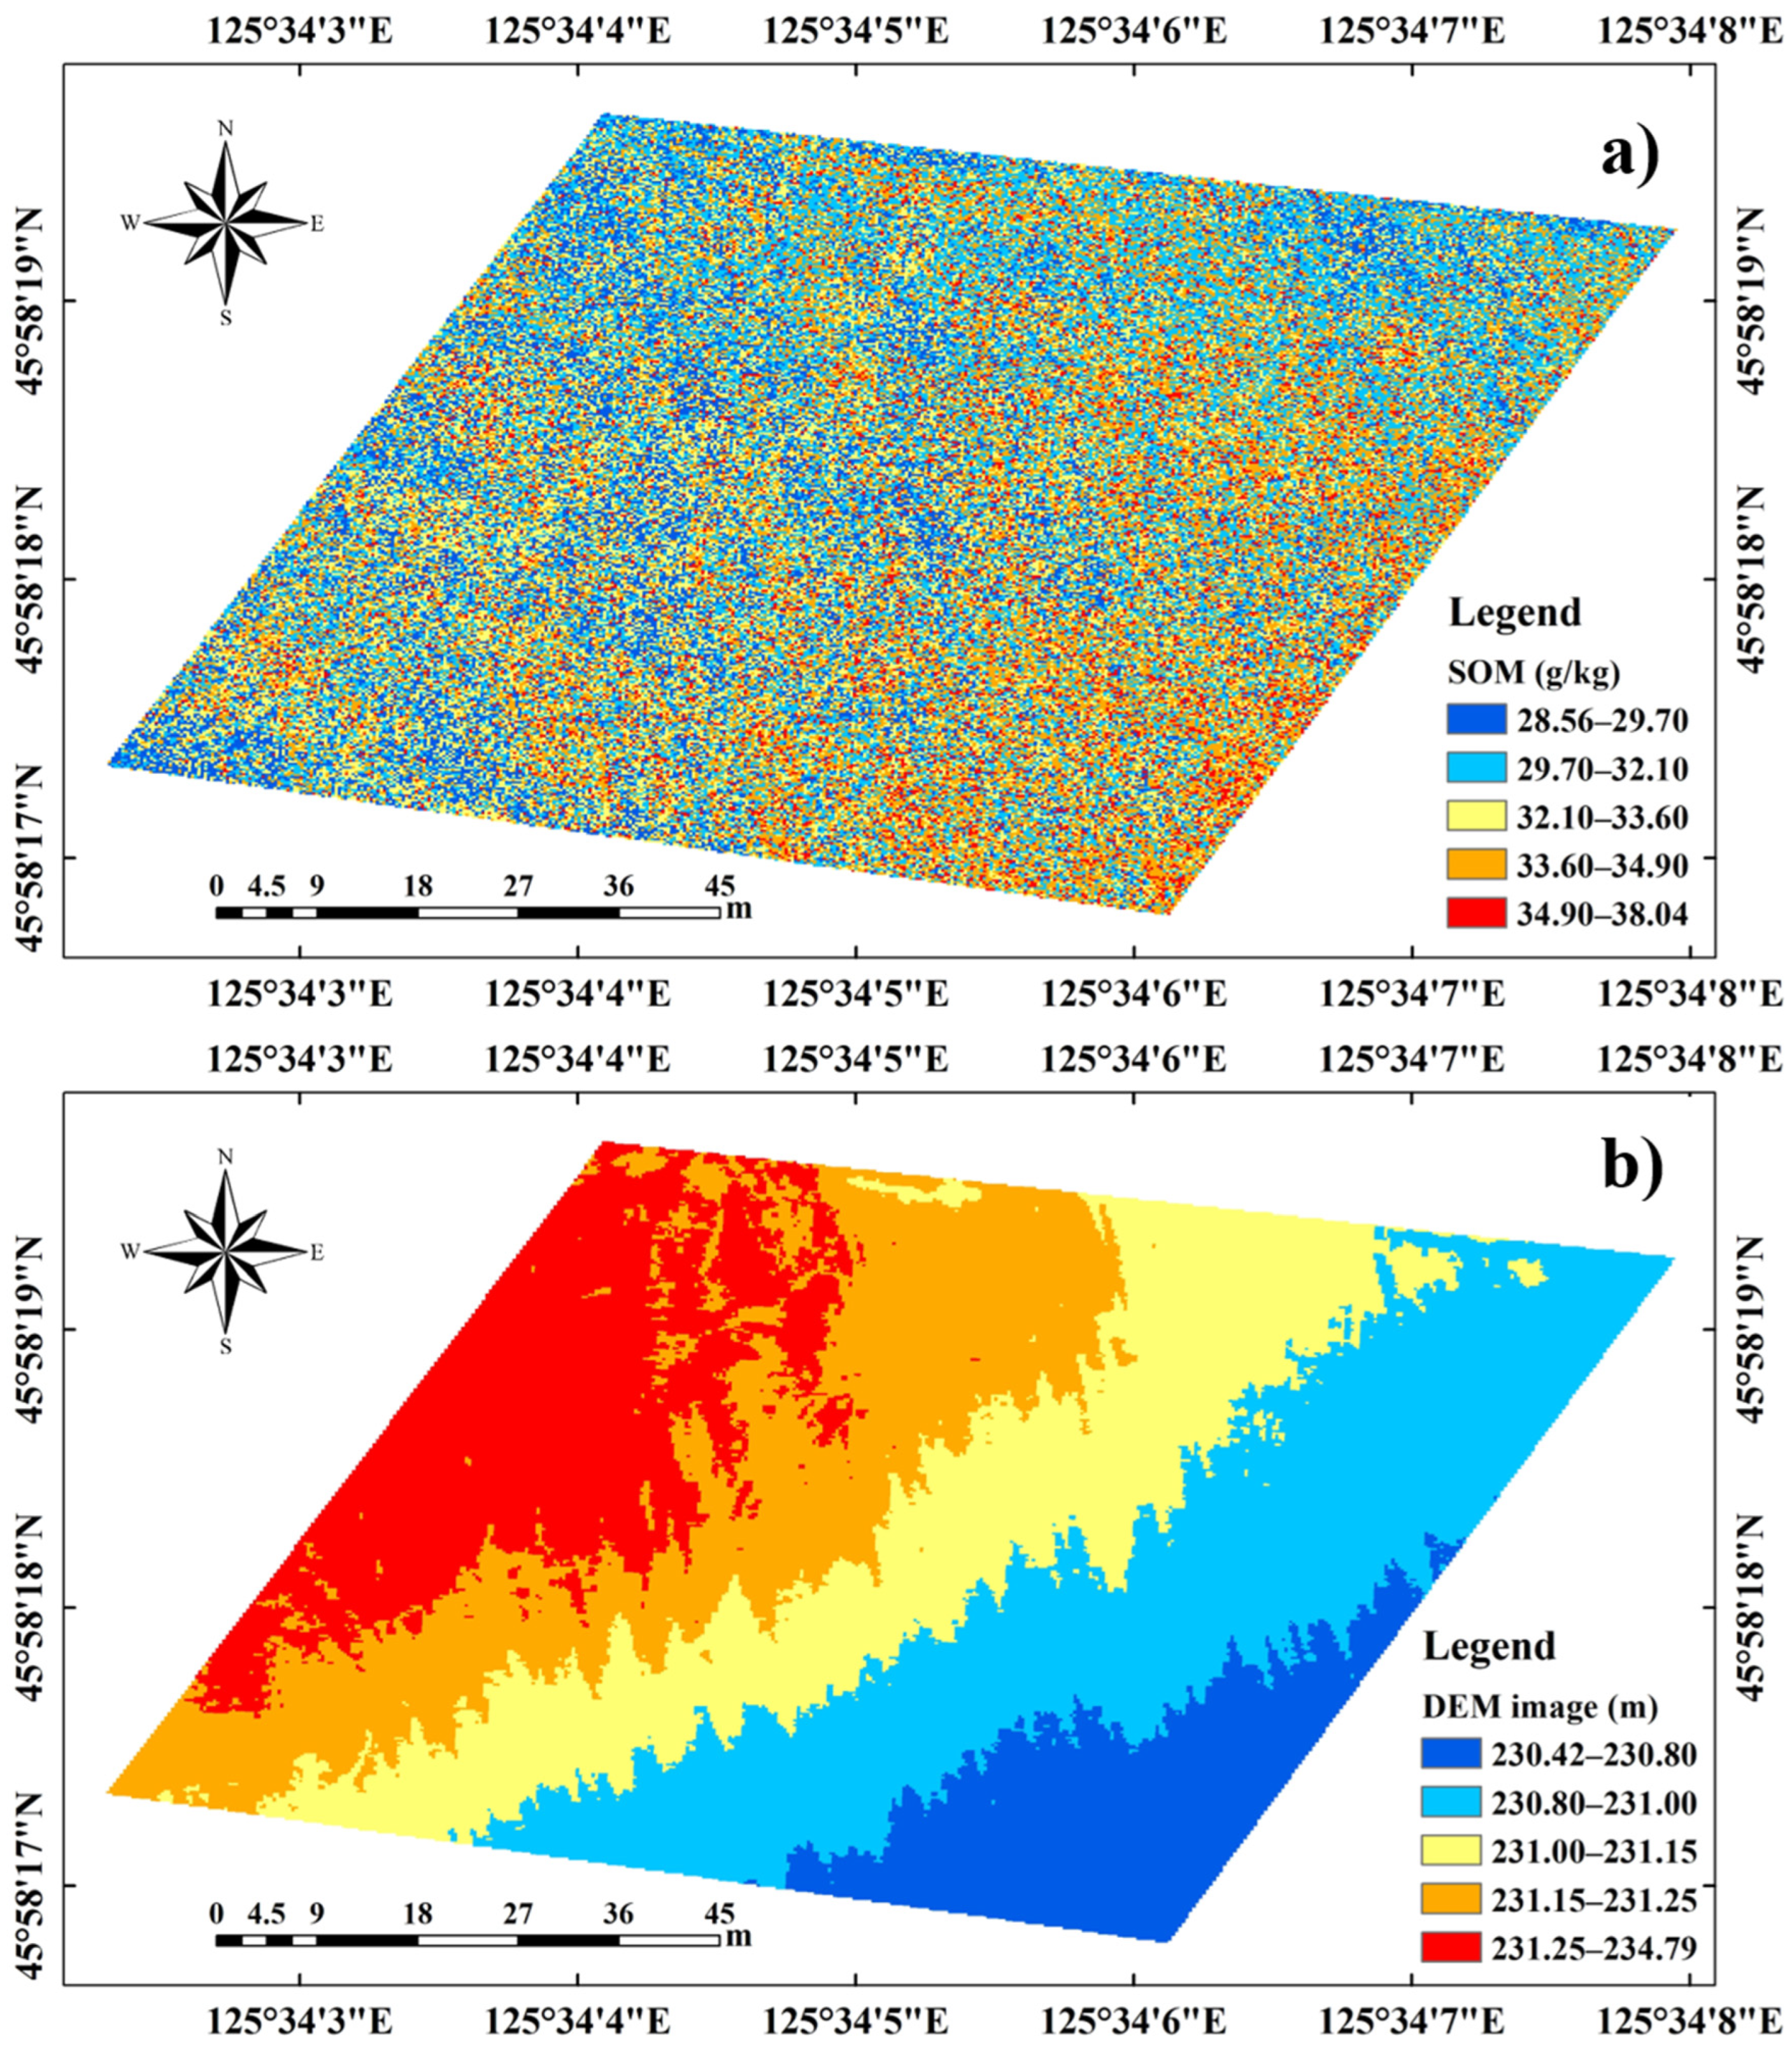
The study area’s remote sensing inversion model for SOM was built using the random forest regression method, and the results are displayed in Figure 6.
Figure 6a shows that the SOM in the study area ranges from a minimum of 28.56 g/kg to a maximum of 38.04 g/kg. These values were consistent with the measured SOM content in the field survey, indicating that the modeling and mapping effect was good. The SOM content was observed to be higher in the southeast of the study area and lower in the west and north. This pattern could be attributed to the high topography in the west and low topography in the east, as shown in the DSM image (Figure 6b) of the study area. The movement of soil and water due to precipitation in the high terrain could lead to a lower organic matter content, while the organic matter content was typically higher in low-lying areas. These findings are consistent with related research by other scholars [60,61]. These findings provided additional evidence for the reliability of this method in terms of SOM modeling and mapping.

4. Discussion

4.1. Necessity of UAV Studies for SOM

SOM is one of the key indicators to reflect soil fertility [62,63], and the rapid monitoring of SOM is of great significance. High-precision remote sensing inversion of SOM can be achieved using UAV multispectral images. In the past, remote sensing inversion of SOM mainly relied on satellite multispectral images for large-area monitoring [15,16]. However, the low spatial resolution of satellite images was a major drawback. For example, the typical resolution for SOM based on satellite multispectral imagery is about 10 m. Some scholars have used hyperspectral data for remote sensing inversion of SOM [17,18], but obtaining such data is difficult. Fortunately, the UAV offers advantages such as flexibility, low cost, and the ability to obtain high-resolution remote sensing images at centimeter-level accuracy [64]. Additionally, multispectral images are cost-effective, easy to process, and contain SOM-sensitive near-infrared and red band information. SOM is a key indicator of soil fertility, and parcel scale SOM remote sensing mapping can help farmers to obtain real-time soil fertility information for croplands, enabling precise fertilizer application management. Therefore, this study proposed a method of SOM inversion based on UAV multispectral images that could realize high-precision remote sensing mapping of SOM at the parcel scale.
In this study, the DJI Phantom 4 Pro V2.0 multispectral UAV was used to obtain multispectral images of the blue, green, red, rededge, and near-infrared bands during the bare soil period of the typical black soil region in Northeast China. SOM exhibits local spatial consistency and large regional spatial variation. The requirement for spatial resolution depends on the spatial scale of the study area. The resolution of the remote sensing inversion distribution map of SOM must be adjusted to match the spatial heterogeneity of the soil. In this study, high-resolution original UAV remote sensing images with a spatial resolution of 1.5 cm were obtained to accurately understand and reflect the spatial distribution and variation of SOM in the study area. Additionally, DEM images were also obtained to investigate the response relationship between SOM and topographic relief. During the study, the original UAV remote sensing images were resampled at different scales to determine the appropriate remote sensing inversion resolution that was adapted to the spatial heterogeneity of the soil. The findings indicated a negative correlation between soil organic matter content and altitude, with a UAV remote sensing image spatial resolution of 0.2 m being optimal for reflecting the spatial variation of SOM. Figure 6 showed that the effect of remote sensing inversion and mapping of SOM was better when the spatial resolution of the UAV remote sensing image was 0.2 m.
The study area had a maximum elevation difference of 4.37 m, with most areas having an elevation difference of less than 2 m. Given this relatively small variation in elevation, the SOM remote sensing inversion model achieved a monitoring R2 of 0.91, RMSE of 0.95, MBE of 0.49, and RPIQ of 3.25, indicating good model performance. Furthermore, the study results suggest that the altitude was higher but the SOM content was lower in the northwest, while the southeast had a lower altitude but higher SOM content. Therefore, the UAV remote sensing image resolution (0.2 m) determined in this study was suitable for the spatial heterogeneity of soil and could effectively reflect the spatial distribution of SOM in the study area. Taking into account the spatial variation of SOM on the parcel scale, a sub-meter resolution is sufficient, therefore, the spatial resolution of the UAV multispectral image used in this study was set at 0.2 m to invert SOM.
To accurately reflect the spectral differences caused by changes in SOM, it is essential to ensure time consistency between UAV remote sensing images and measured soil data. This study obtained UAV remote sensing images (multispectral and DEM) and soil samples from 40 sites synchronously on 29 October 2021, between 11:00 a.m. and 1:00 p.m. The data acquisition period had clear and cloudless skies with a gentle breeze, ensuring consistent lighting conditions for UAV remote sensing images. Soil samples were collected using the five-point method, where five points were selected within a 20 cm × 20 cm spatial range, including upper left, lower left, upper right, lower right, and central points. After removing plant roots, gravel, and other debris, the topsoil of 1 kg within the upper and lower 15 cm was mixed, bagged, and sealed. On the afternoon of 29 October 2021, all samples were promptly dispatched to the laboratory for analysis and determination of SOM content by potassium dichromate external heating method [42]. This was done simultaneously with UAV remote sensing imaging and soil field sampling to ensure temporal consistency across all data.

4.2. SOM Index Sensitivity

Using appropriate soil indices is crucial for achieving high-precision remote sensing inversion of SOM [65,66,67]. In this study, the SOM of the field samples was correlated with the corresponding spectral information of blue, green, red, rededge, and near-infrared images. It was found that there was a strong negative correlation between SOM and the spectra of these five bands. In particular, strong correlations were observed between SOM and the red, rededge, and near-infrared bands. The R2 values of the near-infrared, rededge, red, green, and blue bands and SOM were 0.67, 0.64, 0.63, 0.61, and 0.61, respectively. In previous SOM research, the red and near-infrared bands were commonly used to construct indices for modeling. However, from our study, the rededge band also exhibits a strong correlation with SOM and, like the red and near-infrared bands, is a sensitive band for SOM. In order to improve the accuracy of SOM inversion, ten new soil indices were constructed by integrating the red, rededge, and near-infrared bands. These indices were RDVIrededge1, RDVIrededge2, GDVIrededge1, GDVIrededge2, NLIrededge1, NLIrededge2, CRSIrededge1, CRSIrededge2, MSRrededge1, and MSRrededge2.
To accurately determine the sensitivity index of SOM, 118 characteristic indices sensitive to soil characteristics were widely collected and constructed in this study. Apart from the 10 new soil indices proposed in this paper, such as NLIrededge1, NLIrededge2, and GDVIrededge2, the remaining 108 indices were obtained from previous studies conducted by scholars at home and abroad. The specific index names, calculation formulas, and sources are shown in Table 3. By analyzing the correlation between all the indices and SOM, the study found that NLIrededge1 had an R2 value greater than 0.70, 43 indices had R2 values greater than 0.50 (such as NLI, RE5, and lgB5), and 46 indices had R2 values greater than 0.30 (such as Tan431, Tan531, and EVI). These indicators showed a strong correlation with SOM, providing strong support for the construction and operation of the SOM model. The other indicators could also provide some help for the construction and operation of the SOM model. However, to remove redundant indices, it was necessary to select the most suitable soil index set for SOM remote sensing inversion.
The R2 sorting method, SPA, and CARS were compared to screen for the SOM sensitivity index based on the characteristics of SOM. The study found that using R2 classification alone could only select the soil index set based on a certain empirical threshold. While each index had a strong correlation with SOM, they could not guarantee the overall modeling effect of the soil index set. On the other hand, although the soil index set screened by the SPA method could ensure a good modeling effect as a whole, it contained more indices, leading to a large amount of calculation in the later stage, which was not conducive to its practical application. In contrast, the CARS method could not only ensure a good overall modeling effect but also contain moderate indices, providing a more balanced and practical solution. Finally, the CARS algorithm was used to identify nine soil indices as SOM-sensitive indices, NLIrededge2, GDVIrededge2, RVI54, RVI, NDREI, B5, lgB1, lgB3, and lgB4. Out of the nine indices selected by the CARS algorithm, two were derived from the new soil index constructed in this study, namely NLIrededge2 and GDVIrededge2. Among these indices, NLIrededge2 exhibited the highest correlation with SOM, with an R2 value of 0.63. The R2 values of B5, lgB1, lgB3, lgB4, and SOM were 0.69, 0.62, 0.64, and 0.65, respectively. GDVIrededge2, RVI54, and RVI were also found to be effective in promoting the inversion of SOM. Based on the principle of the CARS algorithm, these nine soil indices together comprised the optimal soil index set for the highest accuracy of SOM modeling and mapping.

4.3. SOM Model Performance

The appropriate inversion model is crucial for achieving high-precision remote sensing inversion of SOM [3,11,13]. Currently, machine learning algorithms are continuously emerging and have been widely applied in agriculture, ecology, and other fields, significantly improving the accuracy and efficiency of monitoring [11,15,36,38]. Through the investigation and analysis of machine learning algorithms and their application in SOM remote sensing inversion, it was found that forest regression and SVR had better performance in this field. To compare the inversion results of different models, this paper also included elastic net, Bayesian ridge, and linear regression models for comparative experiments.
This study considered five machine learning algorithms, namely random forest regression, SVR, elastic net, Bayesian ridge, and linear regression, to determine the best model for this purpose. The results showed that the remote sensing retrieval accuracy of SOM from UAVs using the new soil index and random forest algorithm proposed in this study was the highest (R2 = 0.91, RMSE = 0.95, MBE = 0.49, and RPIQ = 3.25), which outperformed the other models, including SVR (R2 = 0.67, RMSE = 1.09, MBE = 0.91, and RPIQ = 3.16), elastic net (R2 = 0.70, RMSE = 1.09, MBE = 0.94, and RPIQ = 3.10), Bayesian ridge (R2 = 0.67, RMSE = 0.96, MBE = 0.88, and RPIQ = 3.18), and linear regression (R2 = 0.75, RMSE = 1.04, MBE = 0.83, and RPIQ = 2.80). The new soil index, SOM inversion models, and mapping results presented in this paper could assist farmers in obtaining essential information on SOM at the parcel scale, enabling them to make informed decisions about soil management practices such as precise fertilization regulation, and soil scientific supervision.
It is important to note that the focus of this study was on the remote sensing inversion and mapping of SOM during the bare soil stage, where the various soil backgrounds were relatively consistent. The research period was during the bare soil period after crop and straw harvest, with no mulch on the soil surface. Remote sensing inversion of SOM is influenced by various factors, such as soil type, soil water content, soil surface cover (vegetation, crop straw), tillage method, etc. To conduct remote sensing inversion of SOM in other areas, it is crucial to have a comprehensive understanding of the specific local conditions in the study area. It is imperative to accurately identify and eliminate any interfering factors that may have an impact on the results of the study. Once these factors have been effectively accounted for and minimized, the research methods outlined in this paper can be effectively applied for remote sensing inversion of SOM. In the future, we plan to conduct SOM modeling research under the influence of various factors, such as soil type, surface cover, soil moisture, tillage method, and other single or multiple factors. These additional factors will further enhance the robustness of the SOM remote sensing inversion model. Furthermore, we will also explore the use of new intelligent algorithms such as integrated learning algorithms and deep learning algorithms for SOM inversion research. We aim to continuously improve the accuracy and efficiency of the SOM inversion model to better provide technical support for precision agriculture and intelligent agriculture.

5. Conclusions

Based on the sensitive spectral response characteristics of SOM in the near-infrared, rededge, and red bands, ten new soil indices (NLIrededge2, NLIrededge1, GDVIrededge2, etc.), were proposed in this paper. Moreover, combined with 108 indices collected, 118 soil indices were constructed and collected in this study. Combined with multi-index parameters, nine parameters suitable for SOM modeling and mapping were determined by screening CARS characteristics. Out of the nine indices selected by the CARS algorithm, two were derived from the new soil index constructed in this study, namely NLIrededge2 and GDVIrededge2. Among these nine indices, we concluded that NLIrededge2 exhibited the highest correlation with SOM (R2 = 0.63). We concluded that field-scale high-precision remote sensing modeling and mapping of SOM in Northeast China was feasible by using centimeter-level high-resolution UAV remote sensing images and the random forest machine learning algorithm. The results indicated that the remote sensing inversion accuracy of SOM based on the new soil indices using the random forest algorithm (R2 = 0.91, RMSE = 0.95, MBE = 0.49, and RPIQ = 3.25) was significantly better than other methods. Our study revealed a negative correlation between the results of SOM inversion and topography. This finding is in line with the known enrichment of SOM from high to low topography and supports the conclusions of other researchers. These results reinforced the reliability of the research methods and findings presented in our study. The SOM modeling and mapping results could provide essential information on SOM for farmers and support soil scientific supervision and precise fertilization regulation. Further work needs to be done on the optimization and application of the new soil indices and the models constructed in this study in other regions.

Author Contributions

J.Z., X.G. and T.C. made substantial contributions to the conception and design of the study and performed data analysis and interpretation. Q.S. and S.Z. performed data acquisition and project administration. J.Z. and Y.X. wrote the initial manuscript. Y.X., Q.S., S.Z. and Y.P. provided technical and material support. All authors have read and agreed to the published version of the manuscript.

Funding

This work was supported by the National Key Research and Development Program of China (2021YFD1500203).

Institutional Review Board Statement

Not applicable.

Informed Consent Statement

Not applicable.

Data Availability Statement

Not applicable.

Conflicts of Interest

All authors declared that there are no conflict of interest.

Appendix A

Figure A1. Correlation analysis map between soil organic matter (SOM) and 118 characteristic parameters (B1—blue band; B2—green band; B3—red band; B4—rededge band; B5—near-infrared band).
Drones 07 00290 g0a1

References

  1. Adeline, K.; Gomez, C.; Gorretta, N.; Roger, J.M. Predictive ability of soil properties to spectral degradation from laboratory Vis-NIR spectroscopy data. Geoderma 2017, 288, 143–153. [Google Scholar] [CrossRef]
  2. Watt, M.S.; Palmer, D.J. Use of regression kriging to develop a Carbon:Nitrogen ratio surface for New Zealand. Geoderma 2012, 184, 49–57. [Google Scholar] [CrossRef]
  3. Mohanty, B.P. Soil Hydraulic Property Estimation Using Remote Sensing: A Review. Vadose Zone J. 2013, 12, 1–9. [Google Scholar] [CrossRef]
  4. Gupta, R.K. Comparative study of AVHRR ratio vegetation index and normalized difference vegetation index in district level agricultural monitoring. Remote Sens. 1993, 14, 53–73. [Google Scholar] [CrossRef]
  5. Bolton, D.K.; Friedl, M.A. Forecasting crop yield using remotely sensed vegetation indices and crop phenology metrics. Agric. For. Meteorol. 2013, 173, 74–84. [Google Scholar] [CrossRef]
  6. Chang, A.; Yeom, J.; Jung, J.; Landivar, J. Comparison of Canopy Shape and Vegetation Indices of Citrus Trees Derived from UAV Multispectral Images for Characterization of Citrus Greening Disease. Remote Sens. 2020, 12, 4122. [Google Scholar] [CrossRef]
  7. Peng, J.; Biswas, A.; Jiang, Q.S.; Zhao, R.Y.; Hu, J.; Hu, B.; Shi, Z. Estimating soil salinity from remote sensing and terrain data in southern Xinjiang Province, China. Geoderma 2019, 337, 1309–1319. [Google Scholar] [CrossRef]
  8. Dou, X.; Wang, X.; Liu, H.; Zhang, X.; Cui, Y. Prediction of soil organic matter using multi-temporal satellite images in the Songnen Plain, China. Geoderma 2019, 356, 113896. [Google Scholar] [CrossRef]
  9. Gholizadeh, A.; Žižala, D.; Saberioon, M.; Borůvka, L. Soil organic carbon and texture retrieving and mapping using proximal, airborne and Sentinel-2 spectral imaging. Remote Sens. Environ. 2018, 218, 89–103. [Google Scholar] [CrossRef]
  10. Mirzaee, S.; Ghorbani-Dashtaki, S.; Mohammadi, J.; Asadi, H.; Asadzadeh, F. Spatial variability of soil organic matter using remote sensing data. Catena 2016, 145, 118–127. [Google Scholar] [CrossRef]
  11. Forkuor, G.; Hounkpatin, O.; Welp, G.; Thiel, M. High Resolution Mapping of Soil Properties Using Remote Sensing Variables in South-Western Burkina Faso: A Comparison of Machine Learning and Multiple Linear Regression Models. PLoS ONE 2017, 12, e170478. [Google Scholar] [CrossRef] [PubMed]
  12. Zhang, X.; Dou, X.; Xie, Y.; Liu, H.; Pan, Y. Remote sensing inversion model of soil organic matter in farmland by introducing temporal information. Trans. Chin. Soc. Agric. Eng. 2018, 34, 143–150. [Google Scholar]
  13. Zhai, M. Inversion of organic matter content in wetland soil based on Landsat 8 remote sensing image. J. Vis. Commun. Image Represent. 2019, 64, 102641–102645. [Google Scholar] [CrossRef]
  14. Morellos, A.; Pantazi, X.E.; Moshou, D.; Alexandridis, T.; Whetton, R.; Tziotzios, G.; Wiebensohn, J.; Bill, R.; Mouazen, A.M. Machine learning based prediction of soil total nitrogen, organic carbon and moisture content by using VIS-NIR spectroscopy. Biosyst. Eng. 2016, 152, 104–116. [Google Scholar] [CrossRef]
  15. Martínez-España, R.; Bueno-Crespo, A.; Soto, J.; Janik, L.J.; Soriano-Disla, J.M. Developing an intelligent system for the prediction of soil properties with a portable mid-infrared instrument. Biosyst. Eng. 2018, 177, 101–108. [Google Scholar] [CrossRef]
  16. Mara, M.N.; Helmy Nursyahid, A.; Setyawan, T.A.; Sriyanto, A. Adjustment Pattern of pH Using Random Forest Regressor for Crop Modelling of NFT Hydroponic Lettuce. J. Phys. Conf. Ser. 2021, 1863, 12075. [Google Scholar] [CrossRef]
  17. Jia, S.; Li, H.; Wang, Y.; Tong, R.; Li, Q. Hyperspectral Imaging Analysis for the Classification of Soil Types and the Determination of Soil Total Nitrogen. Sensors 2017, 17, 2252. [Google Scholar] [CrossRef]
  18. Shan, J.; Zhao, J.; Liu, L.; Zhang, Y.; Wang, X. A novel way to rapidly monitor microplastics in soil by hyperspectral imaging technology and chemometrics. Environ. Pollut. 2018, 238, 121–129. [Google Scholar] [CrossRef]
  19. Stagakis, S.; Markos, N.; Sykioti, O.; Kyparissis, A. Monitoring canopy biophysical and biochemical parameters in ecosystem scale using satellite hyperspectral imagery: An application on a Phlomis fruticosa Mediterranean ecosystem using multiangular CHRIS/PROBA observations. Remote Sens. Environ. 2010, 114, 977–994. [Google Scholar] [CrossRef]
  20. Stavrakoudis, D.G.; Dragozi, E.; Gitas, I.Z.; Karydas, C.G. Decision Fusion Based on Hyperspectral and Multispectral Satellite Imagery for Accurate Forest Species Mapping. Remote Sens. 2014, 6, 6897–6928. [Google Scholar] [CrossRef]
  21. Gevaert, C.M.; Suomalainen, J.; Tang, J.; Kooistra, L. Generation of Spectral-Temporal Response Surfaces by Combining Multispectral Satellite and Hyperspectral UAV Imagery for Precision Agriculture Applications. IEEE J. Sel. Top. Appl. Earth Obs. Remote Sens. 2015, 8, 3140–3146. [Google Scholar] [CrossRef]
  22. Bindlish, R.; Barros, A.P. Subpixel variability of remotely sensed soil moisture: An inter-comparison study of SAR and ESTAR. IEEE Trans. Geosci. Remote Sens. 2002, 40, 326–337. [Google Scholar] [CrossRef]
  23. Hosseini, R.; Newlands, N.K.; Dean, C.B.; Takemura, A. Statistical Modeling of Soil Moisture, Integrating Satellite Remote-Sensing (SAR) and Ground-Based Data. Remote Sens. 2015, 7, 2752–2780. [Google Scholar] [CrossRef]
  24. Yuzugullu, O.; Lorenz, F.; Frohlich, P.; Liebisch, F. Understanding Fields by Remote Sensing: Soil Zoning and Property Mapping. Remote Sens. 2020, 12, 1116. [Google Scholar] [CrossRef]
  25. Garosi, Y.; Ayoubi, S.; Nussbaum, M.; Sheklabadi, M.; Nael, M.; Kimiaee, I. Use of the time series and multi-temporal features of Sentinel-1/2 satellite imagery to predict soil inorganic and organic carbon in a low-relief area with a semi-arid environment. Int. J. Remote Sens. 2022, 43, 6856–6880. [Google Scholar] [CrossRef]
  26. Soriano-Disla, J.M.; Janik, L.J.; Allen, D.J.; Mclaughlin, M.J. Evaluation of the performance of portable visible-infrared instruments for the prediction of soil properties. Biosyst. Eng. 2017, 161, 24–36. [Google Scholar] [CrossRef]
  27. Allbed, A.; Kumar, L.; Aldakheel, Y.Y. Assessing soil salinity using soil salinity and vegetation indices derived from IKONOS high-spatial resolution imageries: Applications in a date palm dominated region. Geoderma 2014, s230–231, 1–8. [Google Scholar] [CrossRef]
  28. Scudiero, E.; Skaggs, T.H.; Corwin, D.L. Regional scale soil salinity evaluation using Landsat 7, western San Joaquin Valley, California, USA. Geoderma Reg. 2014, 2, 82–90. [Google Scholar] [CrossRef]
  29. Mashimbye, Z.E.; Cho, M.A.; Nell, J.P.; Clercq, W.; Niekerk, A.V.; Turner, D.P. Model-Based Integrated Methods for Quantitative Estimation of Soil Salinity from Hyperspectral Remote Sensing Data: A Case Study of Selected South African Soils. Pedosphere 2012, 22, 640–649. [Google Scholar] [CrossRef]
  30. Araújo, S.R.; Wetterlind, J.; Demattê, J.; Stenberg, B. Improving the prediction performance of a large tropical vis-NIR spectroscopic soil library from Brazil by clustering into smaller subsets or use of data mining calibration techniques. Eur. J. Soil Sci. 2014, 65, 718–729. [Google Scholar] [CrossRef]
  31. Takata, Y.; Funakawa, S.; Akshalov, K.; Ishida, N.; Kosaki, T. Regional evaluation of the spatio-temporal variation in soil organic carbon dynamics for rainfed cereal farming in northern Kazakhstan. Soil Sci. Plant Nutr. 2008, 5, 794–806. [Google Scholar] [CrossRef]
  32. Zhang, J. Research on the Prediction of Several Soil Properties in Heihe River Basin Based on Remote Sensing Images. Sustainability 2021, 13, 13930. [Google Scholar]
  33. Song, P. Detection of Aquatic Plants Using Multispectral UAV Imagery and Vegetation Index. Remote Sens. 2020, 12, 387. [Google Scholar] [CrossRef]
  34. Xu, Y.P.; Shrestha, V.; Piasecki, C.; Wolfe, B.; Hamilton, L.; Millwood, R.J.; Mazarei, M.; Stewart, C.N. Sustainability Trait Modeling of Field-Grown Switchgrass (Panicum virgatum) Using UAV-Based Imagery. Plants 2021, 10, 2726. [Google Scholar] [CrossRef]
  35. Zhang, H.; Shi, P.; Crucil, G.; van Wesemael, B.; Limbourg, Q.; van Oost, K. Evaluating the capability of a UAV-borne spectrometer for soil organic carbon mapping in bare croplands. Land Degrad. Dev. 2021, 32, 4375–4389. [Google Scholar] [CrossRef]
  36. Heil, J.; Jorges, C.; Stumpe, B. Fine-Scale Mapping of Soil Organic Matter in Agricultural Soils Using UAVs and Machine Learning. Remote Sens. 2022, 14, 3349. [Google Scholar] [CrossRef]
  37. Yan, Y.; Yang, J.J.; Li, B.G.; Qin, C.Z.; Ji, W.J.; Xu, Y.; Huang, Y. High-Resolution Mapping of Soil Organic Matter at the Field Scale Using UAV Hyperspectral Images with a Small Calibration Dataset. Remote Sens. 2023, 15, 1433. [Google Scholar] [CrossRef]
  38. Zhu, C.M.; Ding, J.L.; Zhang, Z.P.; Wang, Z. Exploring the potential of UAV hyperspectral image for estimating soil salinity: Effects of optimal band combination algorithm and random forest. Spectrochim. Acta Part A-Mol. Biomol. Spectrosc. 2022, 279, 121416. [Google Scholar] [CrossRef]
  39. Xu, S. Temporal and Spatial Characteristics of the Change of Cultivated Land Resources in the Black Soil Region of Heilongjiang Province (China). Sustainability 2019, 11, 38. [Google Scholar] [CrossRef]
  40. Cao, D.; Feng, J.Z.; Bai, L.Y.; Xun, L.; Jing, H.T.; Sun, J.K.; Zhang, J.H. Delineating the rice crop activities in Northeast China through regional parametric synthesis using satellite remote sensing time-series data from 2000 to 2015. J. Integr. Agric. 2021, 20, 424–437. [Google Scholar] [CrossRef]
  41. Guo, R.; Zhu, X.F.; Zhang, C.; Cheng, C.X. Analysis of Change in Maize Plantation Distribution and Its Driving Factors in Heilongjiang Province, China. Remote Sens. 2022, 14, 3590. [Google Scholar] [CrossRef]
  42. Li, M.; Xi, X.; Xiao, G.; Cheng, H.; Yang, Z.; Zhou, G.; Ye, J.; Li, Z. National multi-purpose regional geochemical survey in China. J. Geochem. Explor. 2014, 139, 21–30. [Google Scholar] [CrossRef]
  43. Fern, R.R.; Foxley, E.A.; Bruno, A.; Morrison, M.L. Suitability of NDVI and OSAVI as estimators of green biomass and coverage in a semi-arid rangeland. Ecol. Indic. 2018, 94, 16–21. [Google Scholar] [CrossRef]
  44. Oszwald, J.; Bonis, A.; Bouzille, J.B.; Rapinel, S. Use of bi-Seasonal Landsat-8 Imagery for Mapping Marshland Plant Community Combinations at the Regional Scale. Wetl. J. Soc. Wetl. Sci. 2015, 35, 1043–1054. [Google Scholar]
  45. Gitelson, A.A.; Gritz, Y.; Merzlyak, M.N. Relationships between leaf chlorophyll content and spectral reflectance and algorithms for non-destructive chlorophyll assessment in higher plant leaves. J. Plant Physiol. 2003, 160, 271–282. [Google Scholar] [CrossRef]
  46. Wang, L.; Zheng, S.; Liu, H.; Wang, X.; Meng, L.; Ma, Y.; Guan, H. Soil Organic Matter Inversion in Agro-pastoral Ecotone of Northeast China. Soils 2022, 1, 184–190. [Google Scholar]
  47. Qi, J.; Chehbouni, A.; Huete, A.R.; Kerr, Y.H.; Sorooshian, S. A Modified Soil Adjusted Vegetation Index. Remote Sens. Environ. 1994, 2, 119–126. [Google Scholar] [CrossRef]
  48. Kazimova, F. Research of interrelation of RI index and colorimetric parameters of measurements of soil organic content. Agrar. Sci. J. 2020, 1, 13–16. [Google Scholar] [CrossRef]
  49. Elhag, M.; Gitas, I.; Othman, A.; Bahrawi, J.; Gikas, P. Assessment of Water Quality Parameters Using Temporal Remote Sensing Spectral Reflectance in Arid Environments, Saudi Arabia. Water 2019, 11, 556. [Google Scholar] [CrossRef]
  50. Motohka, T.; Nasahara, K.N.; Oguma, H.; Tsuchida, S. Applicability of Green-Red Vegetation Index for Remote Sensing of Vegetation Phenology. Remote Sens. 2010, 2, 2369–2387. [Google Scholar] [CrossRef]
  51. Ge, X.Y.; Ding, J.L.; Teng, D.X.; Wang, J.Z.; Huo, T.C.; Jin, X.; Wang, J.; He, B.; Han, L. Updated soil salinity with fine spatial resolution and high accuracy: The synergy of Sentinel-2 MSI, environmental covariates and hybrid machine learning approaches. Catena 2022, 212, 106054. [Google Scholar] [CrossRef]
  52. Han, L.; Liu, D.; Cheng, G.; Zhang, G.; Wang, L. Spatial distribution and genesis of salt on the saline playa at Qehan Lake, Inner Mongolia, China. Catena 2019, 177, 22–30. [Google Scholar] [CrossRef]
  53. Xie, L.F.; Wu, W.C.; Huang, X.L.; Ou, P.H.; Lin, Z.Y.; Wang, Z.; Song, Y.; Lang, T.; Huangfu, W.; Zhang, Y.; et al. Mining and Restoration Monitoring of Rare Earth Element (REE) Exploitation by New Remote Sensing Indicators in Southern Jiangxi, China. Remote Sens. 2020, 12, 3558. [Google Scholar] [CrossRef]
  54. Skianis, A.G.; Vaiopoulos, D.; Nikolakopoulos, K. A study of the performance of the MSR vegetation index, using probabilistic and geostatistical methods. Bull. Geol. Soc. Greece 2007, 40, 2048. [Google Scholar] [CrossRef]
  55. Liu, Y.; Sun, Q.; Huang, J.; Feng, H.K.; Wang, J.J.; Yang, G.J. Estimation of Potato Above Ground Biomass Based on UAV Multispectral Images. Spectrosc. Spectr. Anal. 2021, 41, 2549–2555. [Google Scholar]
  56. Qi, H.X.; Zhu, B.Y.; Wu, Z.Y.; Liang, Y.; Li, J.W.; Wang, L.; Chen, T.; Lan, Y.; Zhang, L. Estimation of Peanut Leaf Area Index from Unmanned Aerial Vehicle Multispectral Images. Sensors 2020, 20, 2732. [Google Scholar] [CrossRef] [PubMed]
  57. Li, X.H.; Ba, Y.X.; Zhang, M.Q.; Nong, M.L.; Yang, C.; Zhang, S. Sugarcane Nitrogen Concentration and Irrigation Level Prediction Based on UAV Multispectral Imagery. Sensors 2022, 22, 2711. [Google Scholar] [CrossRef] [PubMed]
  58. Richter, R.; Reu, B.; Wirth, C.; Doktor, D.; Vohland, M. The use of airborne hyperspectral data for tree species classification in a species-rich Central European forest area. Int. J. Appl. Earth Obs. Geoinf. 2016, 52, 464–474. [Google Scholar] [CrossRef]
  59. Karasiak, N.; Dejoux, J.F.; Fauvel, M.; Willm, J.; Monteil, C.; Sheeren, D. Statistical Stability and Spatial Instability in Mapping Forest Tree Species by Comparing 9 Years of Satellite Image Time Series. Remote Sens. 2019, 11, 2512. [Google Scholar] [CrossRef]
  60. Liu, W.J.; Jiang, Y.M.; Yang, Q.; Yang, H.; Li, Y.D.; Li, Z.; Mao, W.; Luo, Y.; Wang, X.; Tan, Z. Spatial distribution and stability mechanisms of soil organic carbon in a tropical montane rainforest. Ecol. Indic. 2021, 129, 107965. [Google Scholar] [CrossRef]
  61. Kingsley, J.; Afu, S.M.; Isong, I.A.; Chapman, P.A.; Kebonye, N.M.; Ayito, E.O. Estimation of Soil Organic Carbon Distribution by Geostatistical and Deterministic Interpolation Methods: A Case Study of The Southeastern Soils of Nigeria. Environ. Eng. Manag. J. 2021, 20, 1077–1085. [Google Scholar] [CrossRef]
  62. Maynard, J.J.; Dahlgren, R.A.; O’Geen, A.T. Soil carbon cycling and sequestration in a seasonally saturated wetland receiving agricultural runoff. Biogeosciences 2011, 8, 3391–3406. [Google Scholar] [CrossRef]
  63. Zheng, G.; Ryu, D.; Jiao, C.; Hong, C. Estimation of Organic Matter Content in Coastal Soil Using Reflectance Spectroscopy. Pedosphere 2016, 26, 130–136. [Google Scholar] [CrossRef]
  64. Sebastian, C.; Fabio, R.; Michaela, D.G.; Marco, D.; Mario, G. Evaluating Multispectral Images and Vegetation Indices for Precision Farming Applications from UAV Images. Remote Sens. 2015, 7, 4026–4047. [Google Scholar]
  65. Zou, H.; Zhang, H.H. On the adaptive elastic-net with a diverging number of parameters. Ann. Stat. 2009, 4, 1733–1751. [Google Scholar] [CrossRef]
  66. Tang, G.; Huang, Y.; Tian, K.; Song, X.; Min, S. A new spectral variable selection pattern using competitive adaptive reweighted sampling combined with successive projections algorithm. Analyst 2014, 139, 4894–4902. [Google Scholar] [CrossRef]
  67. Zhang, D.; Zhou, G. Estimation of Soil Moisture from Optical and Thermal Remote Sensing: A Review. Sensors 2016, 16, 1308. [Google Scholar] [CrossRef]
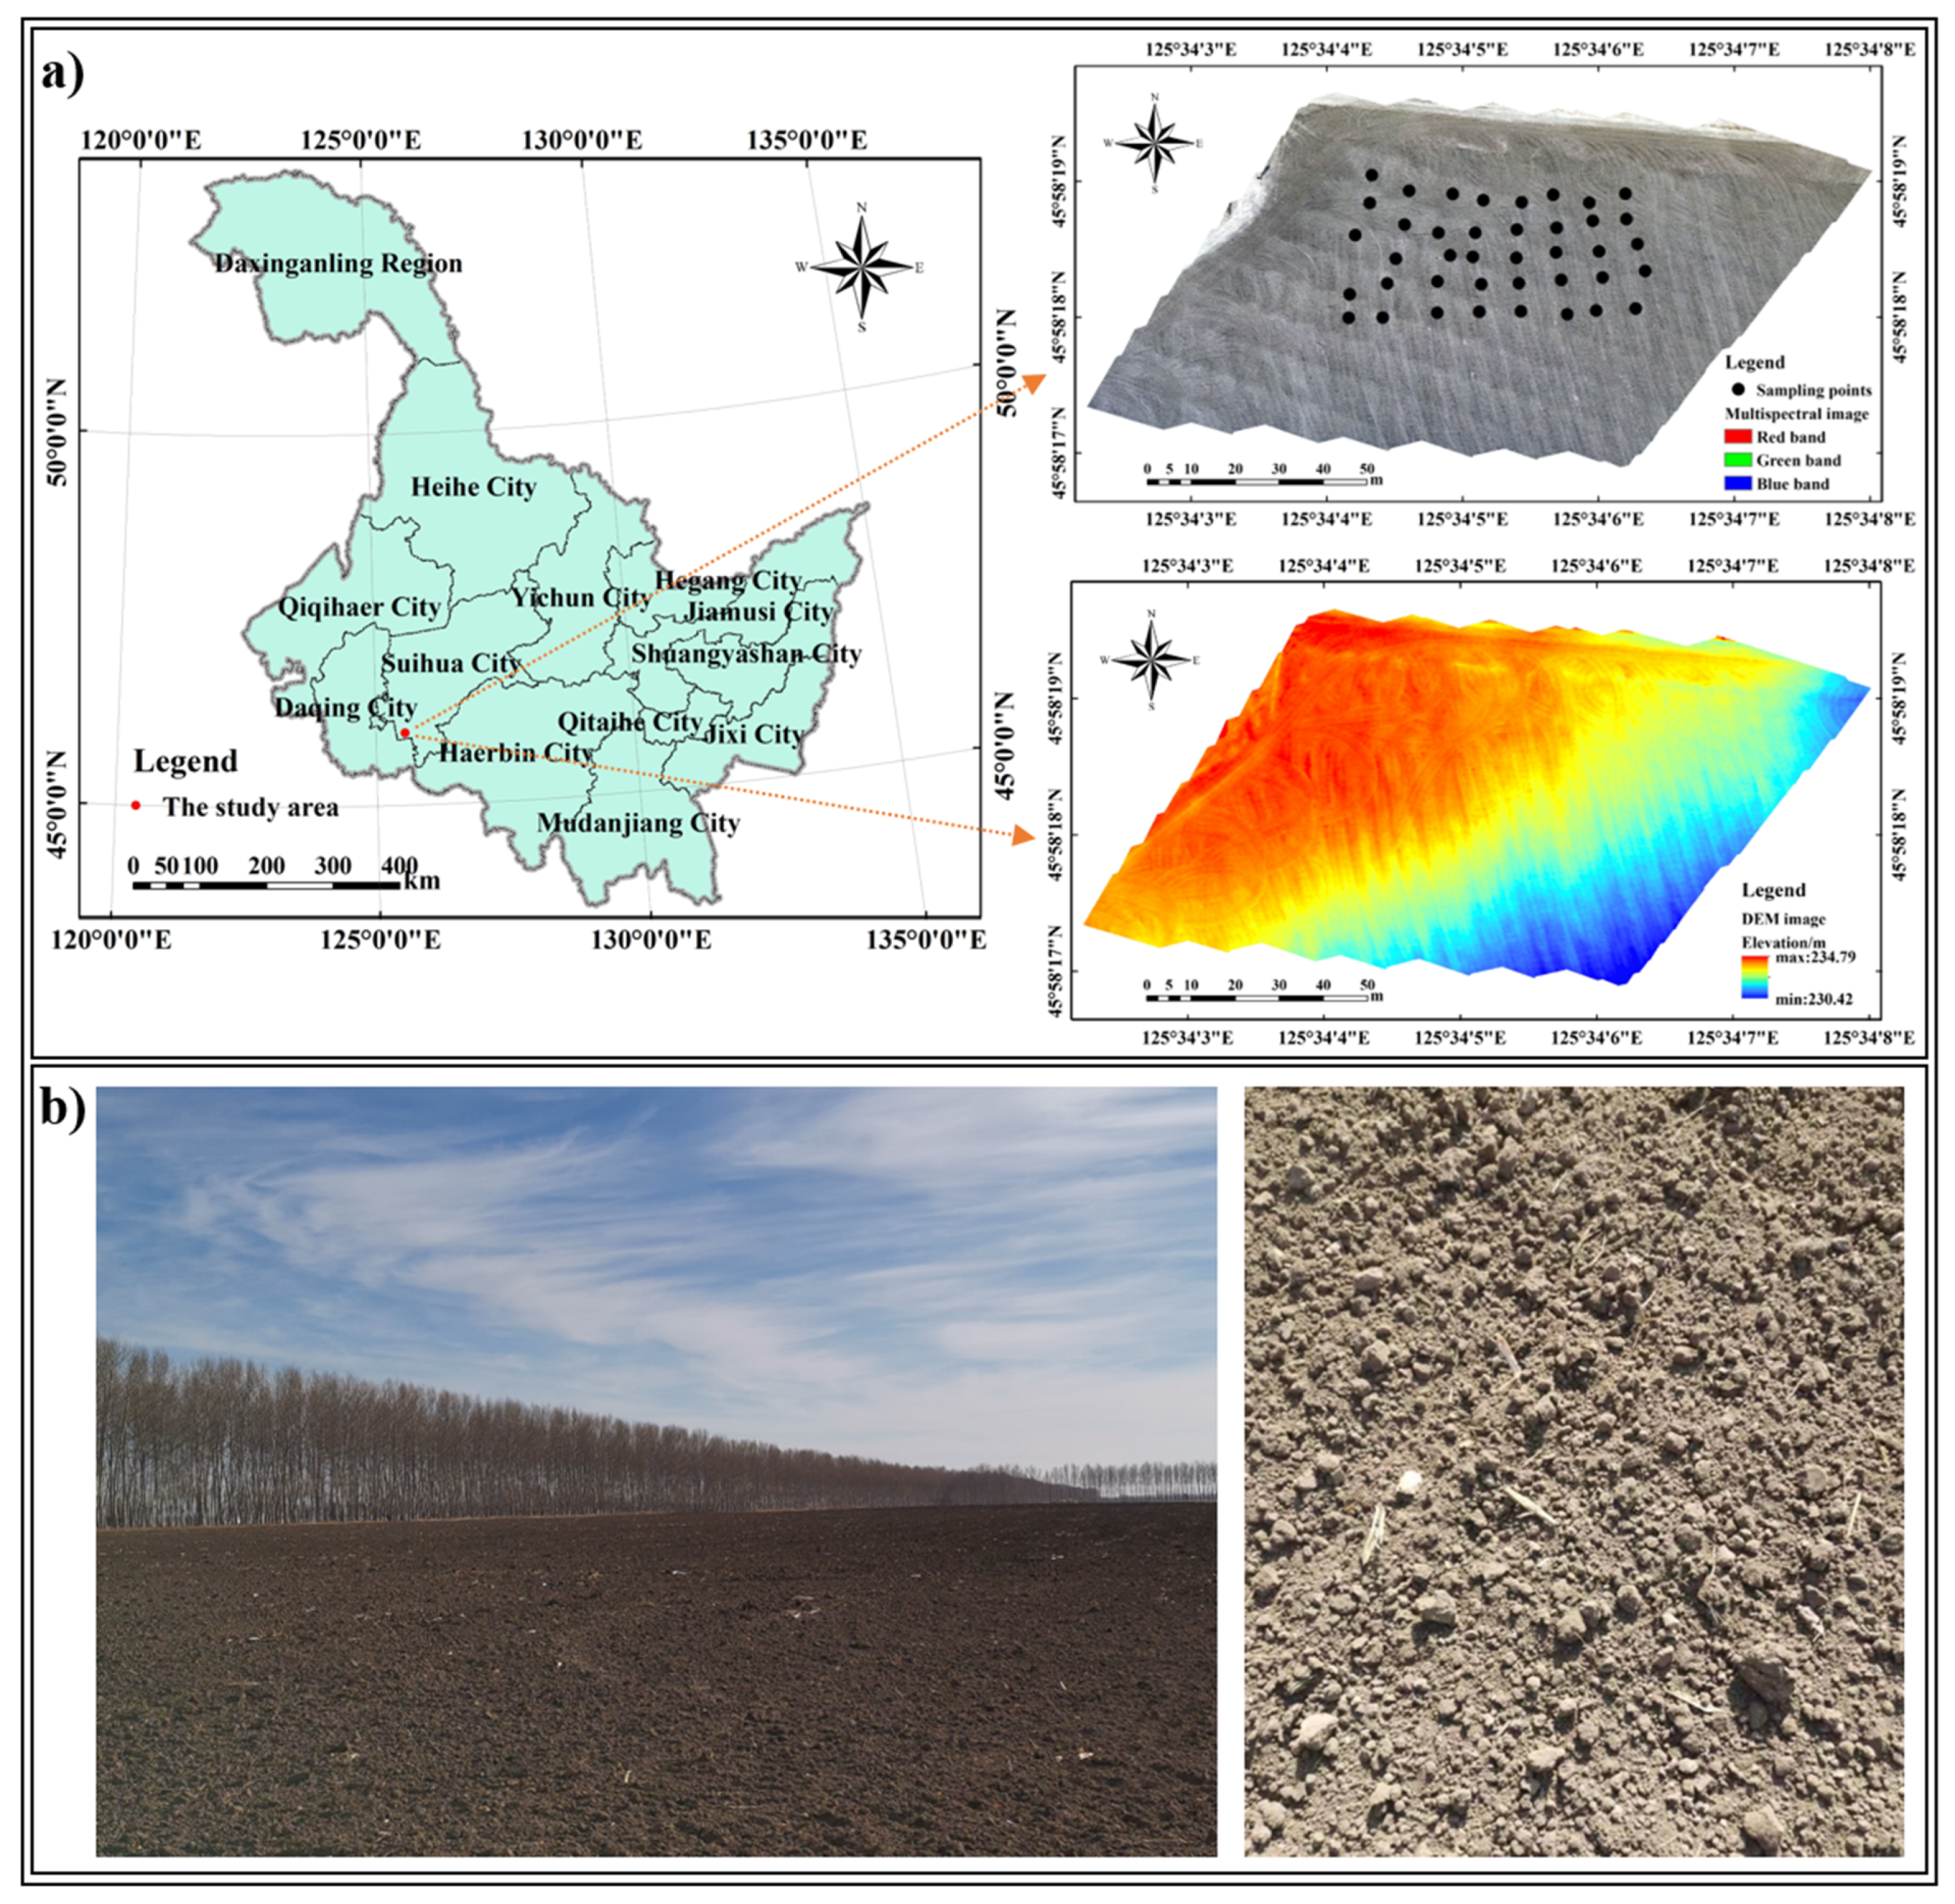
Figure 1. Multispectral image, digital elevation model (DEM) image, and sample distribution map (a); field overview picture and detail picture (b) on 29 October 2021 in the study area.
Drones 07 00290 g001
Figure 2. Multispectral version of the DJI Phantom 4 Pro V2.0 unmanned aerial vehicle (UAV).
Drones 07 00290 g002
Figure 3. Spectral reflectance and soil organic matter (SOM) curve of soil samples. The soil reflectance was increased by 10,000 times, and SOM was enlarged by 100 times.
Drones 07 00290 g003
Figure 4. Correlation analysis map of soil organic matter (SOM) and reflectance of five bands. The soil reflectance was increased by 10,000 times, and SOM was enlarged by 100 times.
Drones 07 00290 g004
Figure 5. Correlation analysis map between soil organic matter (SOM) and top 50 characteristic parameters by R2 (B1—blue band; B2—green band; B3—red band; B4—rededge band; B5—near-infrared band).
Drones 07 00290 g005
Figure 6. Thematic map of soil organic matter (SOM) remote sensing monitoring (a) and digital elevation model (DEM) image (b) in the study area.
Drones 07 00290 g006
Table 1. Descriptive statistics of soil organic matter (SOM) for the 40 ground truth soil samples.
Number of SamplesMinimum Value
(g/kg)
Maximum Value
(g/kg)
Mean Value
(g/kg)
Standard Deviation
(g/kg)
4027.1038.5032.263.00
Table 2. Band characteristics of the Phantom 4 multispectral camera.
BandsCentral Wavelength (nm)Resolution (cm)
    B1—Blue4431.5
    B2—Green4901.5
    B3—Red5601.5
    B4—Red Edge6651.5
    B5—Near-Infrared7051.5
Table 3. Spectral indices and calculation formulas.
NumbersSpectral IndicesFormulasReferences
(1)–(10)Difference Vegetation Index (DVIij)Bi − Bj[33]
(11)–(20)Normalized Difference Vegetation Index (NDVIij)(Bi − Bj)/(Bi + Bj)[43]
(21)–(26)Brightness Index (BIij)(Bi2 + Bj2)0.5[11]
(27)–(30)Brightness Index 2 (BIijk)(Bi2 + Bj2 + Bk2)0.5/3[44]
(31)–(40)kij(Bj − Bi)/(CWj − CWi)[8]
(41)–(50)Tanijk(kjk−kij)/(1 + kjk × kij)[8]
(51)–(70)Ratio Vegetation Index (RVIij)Bi/Bj[4]
(71)–(76)Clumping Index (CIij)Bj/Bi − 1[45]
(77)–(81)Band Reflectivity (Bi)B1, B2, B3, B4, B5[46]
(82)–(86)Logarithm of Band Reflectivity (lgBi)lgB1, lgB2, lgB3, lgB4, lgB5[46]
(87)–(91)Reciprocal of Band Reflectivity (REi)1/B1, 1/B2, 1/B3, 1/B4, 1/B5[46]
(92)Normalized Difference Rededge Index (NDREI)(B5 − B4)/(B5 + B4)[33]
(93)Modified Soil-Adjusted Vegetation Index (MSAVI)(2 × B5 + 1 − ((2 × B5 + 1)2 − 8 × (B5 − B3))0.5)/2[47]
(94)Carbonate Index (Cal)B4/B3[10]
(95)Redness Index (RI)(B3 × B3)/(B4 × B4 × B4)[48]
(96)Ratio Vegetation Index (RVI)B5/B3[4]
(97)Green Normalized Difference Vegetation Index (GNDVI)(B5 − B2)/(B5 + B2)[49]
(98)Green-Red Vegetation Index (GRVI)(B2 − B3)/(B2 + B3)[50]
(99)Transformed Vegetation Index (TVI)((B5 − B3)/(B5 + B3) + 0.5)0.5 × 100[51]
(100)Enhanced Vegetation Index (EVI)2.5 × (B5 − B3)/(B5 + 6 × B3 − 7.5 × B1 + 1)[51]
(101)Canopy Response Salinity Index (CRSI)(B5 × B3 − B2 × B1)/(B5 × B3 + B2 × B1)[52]
(102)Generalized Difference Vegetation Index (GDVI)(B52 − B32)/(B52 + B32)[53]
(103)Modified Simple Ratio (MSR)((B5/B3 − 1)/(B5/B3 + 1)0.5[54]
(104)Nonlinear Vegetation Index (NLI)(B52 − B3)/(B52 + B3)[55]
(105)Optimized Soil Background Adjust Index (OSAVI)1.16 × (B5 − B3)/(B5 + B3 + 0.16)[43]
(106)Soil-Adjusted Vegetation Index (SAVI)1.5 × (B5 − B3)/(B5 + B3 + 0.5)[53]
(107)Renormalized Difference Vegetation Index (RDVI)(B5 − B3)/(B5 + B3)0.5[56]
(108)Simple Ratio Pigment Index (SRPI)B1/B3[57]
(109)Renormalized Difference Vegetation Index 1 (RDVIrededge1)((B5 − B4)/(B5 + B4))0.5This paper
(110)Renormalized Difference Vegetation Index 2 (RDVIrededge2)((B4 − B3)/(B4 + B3))0.5This paper
(111)Generalized Difference Vegetation Index 1 (GDVIrededge1)(B52 − B42)/(B52 + B42)This paper
(112)Generalized Difference Vegetation Index 2 (GDVIrededge2)(B42 − B32)/(B42 + B32)This paper
(113)Nonlinear Vegetation Index 1 (NLIrededge1)(B52 − B4)/(B52 + B4)This paper
(114)Nonlinear Vegetation Index 2 (NLIrededge2)(B42 − B3)/(B42 + B3)This paper
(115)Canopy Response Salinity Index 1 (CRSIrededge1)(B5 × B4 − B3 × B2)/(B5 × B4 + B3 × B2)This paper
(116)Canopy Response Salinity Index 2 (CRSIrededge2)(B5 × B4 − B3 × B1)/(B5 × B4 + B3 × B1)This paper
(117)Modified Simple Ratio 1 (MSRrededge1)((B5/B4 − 1)/(B5/B4 + 1)0.5This paper
(118)Modified Simple Ratio 2 (MSRrededge2)((B4/B3 − 1)/(B4/B3 + 1)0.5This paper
Table 4. Vegetation indices and calculation formulas.
NumbersSpectral Indices
1NLIrededge2
2GDVIrededge2
3RVI54
4RVI
5NDREI
6B5
7lgB1
8lgB3
9lgB4
Table 5. Soil organic matter (SOM) monitoring regression model and precision test.
NumbersRegression MethodR2RMSE/%MBE/%RPIQ
1Random Forest Regression0.910.950.493.25
2Support Vector Regression0.671.090.913.16
3Elastic Net Regression0.701.090.943.10
4Bayesian Ridge Regression0.670.960.883.18
5Linear Regression0.751.040.832.80
Disclaimer/Publisher’s Note: The statements, opinions and data contained in all publications are solely those of the individual author(s) and contributor(s) and not of MDPI and/or the editor(s). MDPI and/or the editor(s) disclaim responsibility for any injury to people or property resulting from any ideas, methods, instructions or products referred to in the content.