Article

Dual-UAV Payload Transportation Using Optimized Velocity Profiles via Real-Time Dynamic Programming

1
Department of Mechanical Engineering, University of Alberta, Edmonton, AB T6G 1H9, Canada
2
Dubai Future Foundation, Emirates Towers, Dubai P.O. Box 72127, United Arab Emirates
3
Advanced Research and Innovation Center (ARIC), Aerospace Engineering Department, Khalifa University of Science and Technology, Abu Dhabi P.O. Box 127788, United Arab Emirates
4
Polytechnic Institute, Purdue University, Knoy 190, 401 North Grant Street, West Lafayette, IN 47907-2021, USA
*
Author to whom correspondence should be addressed.
Drones 2023, 7(3), 171; https://doi.org/10.3390/drones7030171
Submission received: 13 December 2022 / Revised: 24 January 2023 / Accepted: 27 January 2023 / Published: 1 March 2023

Abstract

:
In this paper, a real-time dynamic programming (RTDP) approach was developed for the first time to jointly carry a slung load using two unmanned aerial vehicles (UAVs) with a trajectory optimized for time and energy consumption. The novel strategy applies RTDP algorithm, where the journey was discretized into horizons consisting of distance intervals, and for every distance interval, an optimal policy was obtained using a dynamic programming sweep. The RTDP-based strategy is applied for dual-UAV collaborative payload transportation using coordinated motion where UAVs act as actuators on the payload. The RTDP algorithm provides the optimal velocity decisions for the slung load transportation to either minimize the journey time or the energy consumption. The RTDP approach involves minimizing a cost function which is derived after simplifying the combined model of the dual-UAV-payload system. The cost function derivation was also accommodated to dynamically distribute the load/energy between two multi-rotor platforms during a transportation mission. The cost function is used to calculate transition costs for all stages and velocity decisions. A terminal cost is used at the last distance interval during the first phase of the journey when the velocity at the end of the current horizon is not known. In the second phase, the last stage or edge of the horizon includes the destination, hence final velocity is known which is used to calculate the transition cost of the final stage. Once all transition costs are calculated, the minimum cost is traced back from the final stage to the current stage to find the optimal velocity decision. The developed approach was validated in MATLAB simulation, software in the loop Gazebo simulation, and real experiments. The numerical and Gazebo simulations showed the successful optimization of journey time or energy consumption based on the selection of the factor λ . Both simulation and real experiments results show the effectiveness and the applicability of the proposed approach.

1. Introduction

Collaborative aerial manipulation has been recently a topic of interest among researchers for various reasons, including increased safety, ease of maintenance, ease of control, increased payload capacity, and complex shape transport capability [1,2,3]. As shown in Figure 1, the initial research questions focused on the feasibility of payload transport, it’s orientation, and how to perform pose control in equilibrium during transport [4,5,6]. The next set of problems included the communication outage problem, which can destabilize the dual-UAV transport, for which researchers proposed leader-follower based approaches [7,8]. Another study proposed a control strategy for multi-UAV payload transportation which requires less communication [9]. The increased payload capacity of a multi-UAV system brings additional challenges related to obstacle avoidance and increased air resistance [10,11]. Researchers also focused on the control design of the multi-UAV payload transport system [12,13,14]. Moreover, researchers looked into the thrust regulation amongst the UAVs while transporting the payload. The problem of the energy distribution during collaborative transport was investigated in [15]. Energy-efficient motion or energy-related optimization in multi-UAV transport, however, was not investigated yet.
Energy conservation is important in both single and dual-UAV aerial transportation since multi-rotors have a limited endurance due to battery limitations [16]. Recently [17] reviewed the resource management in UAV-assisted wireless networks, where energy is described as one of the resource constraints. Similarly, another study focused on finding the optimal path for energy savings for UAV-assisted wireless networks [18]. In another study [19] routing and scheduling of UAVs were optimized for varying payloads for delivery drones. A study suggested that routing techniques can minimize travel time and path length and hence reduce energy consumption [20]. In a study [21], drone payload transportation was shown to be more energy efficient than conventional transportation methods (e.g., cars or trucks), hence the recent push towards commercial drone delivery systems such as  https://www.medicaldrones.org/ (accessed on 20 January 2022). An increase in the endurance of single and multi-UAV payload transportation systems could potentially increase the coverage area of such payload transportation systems, thus making them even more appealing as a transportation and delivery alternative to classical methods.
Most studies focused on joint transportation of a payload via multiple UAVs focused on the problems related to the transportation itself. Despite an extensive search, authors could not find any study regarding the joint transportation of a payload via multiple UAVs which focused on the energy consumption-related aspects. The lack of existing literature/studies regarding the optimization of dual-UAV collaborative payload transportation makes this study the first to address this issue. The authors believe that once drone delivery becomes mainstream and large payloads are transported using multiple drones, this study will be helpful in planning the drone delivery journey beforehand based on time or energy-saving requirements. Another important aspect with respect to large payload transport is the increased volume of the payload. Increased volume results in excessive drag forces during high-speed transport, which results in high energy consumption. Therefore an optimum velocity exists which might better suit, based on either saving the time of the journey or the energy consumption.
Apart from velocity optimization in lateral transportation, another concern is the capability of load distribution between two UAVs. Despite some application-based research studies regarding multi-UAV payload transportation such as [22], commercial service exists currently that utilizes multi-UAV payload transportation systems. A reason for this could be the increased risk of mission failure due to the fact that accidents and power failures in one UAV could eventually cause a catastrophic failure in the whole mission. The chances of mission success could increase if energy consumption is purposely distributed between UAVs to reduce stressing one system more than it’s capable of handling. One way to distribute energy consumption is to distribute the payload weight. Weight can be distributed by using the mechanisms proposed by  [23,24]. The load distribution for energy management amongst UAVs while transporting a payload was performed in [15], however, the velocity commands in the transport direction were not optimized. Mission priority could potentially be optimized to reduce travel time or energy consumption during a transportation mission by optimizing the velocity commands generated during mission execution. Depending on the payload type, such as medical supplies PPEs (personal protective equipment), and automated external defibrillators (AEDs), optimizing for a reduction in journey time is more important. Otherwise, energy savings can be focused on.
The work [25] was the first demonstration of real time energy optimization for single UAV aerial transportation, followed by other papers such as [26]. However, to the best of our knowledge, the work presented in this paper is the first to propose dual UAV optimized payload transportation, while considering the load distribution between two UAVs. The lack of studies in this area is due to additional difficulties related to the highly coupled dynamics where errors in localization in one UAV can significantly destabilize the other UAV. The RTDP based optimization performed on a single UAV in [25] can be scaled to multi-UAVs. This is achieved by finding optimal policy decisions for the velocity set points in the transport direction while regulating the payload distribution. Also depending on the volume of the payload, the opposing drag force acting on the whole system will vary, therefore the optimum velocity required to transport the payload will also change. However, searching for optimal velocity decisions along with load distribution presents an increased level of complexity that should be addressed carefully. This complication is due to the fact that when thrust is regulated between the two UAVs, the attitude angles are different and the individual energy consumption is also different. This required amendment in the previous approach in [25] for the calculation of the energy part of the cost function. This procedural correctness comes at the cost of increased computational time and costs. An investigation, therefore, was needed to ensure that the RTDP-based approach with a load distribution strategy would deliver the required results.
This paper presents a RTDP algorithm for achieving energy or time-optimized collaborative aerial dual-UAV payload transportation while considering the load distribution between the two UAVs. Specifically, this paper addresses the problem of collaborative payload transportation with two UAVs, where the UAVs are able to adjust the shared payload according to the UAV’s capabilities and the optimization strategies employed. A proposed factor λ (described in the paper) will be used to either minimize the total energy consumption of both drones or to minimize the time required to travel from point A to point B, based on the system model. Optimization is performed by determining optimum velocity decisions using RTDP algorithm in real-time. During lateral high-speed forward flight, the velocity can affect the time of travel and energy consumption. In this paper, the methodology for real-time optimum velocity decisions for a dual-UAV system is presented. Advantages of our RTDP approach for dual-UAV payload transportation are presented as below
  • Small number of parameters in the algorithm that has to be considered. This list of parameters includes the mass of the vehicles, the mass of the payload, the power consumption model, and tuned normalization parameters.
  • The approach takes into account for the thrust regulation between the two UAVs while optimizing the lateral transport.
  • Parameters required for our approach can also be identified using already existing techniques. Some of the parameters required for multi-UAV systems can also be estimated using the method presented in study  [27].
  • Training data-sets are not required once the parameters of the model are available.
  • The optimized velocity decision is obtained in real-time to achieve either time savings or energy savings.
The rest of this paper is structured as follows: The system model is presented in Section 2, the optimization algorithm is detailed in Section 3, Section 4 describes the model derivation for the cost function, Section 5 discusses the numerical simulation methodology, Section 6 presents the software in the loop gazebo simulation methods and results, Section 7 presents hardware experiments and finally the study concludes in Section 8.

2. System Model

The proposed collaborative system consists of hex-rotors attached to a payload as shown in Figure 2. The payload is a rigid cylinder of length d and diameter w, with uniformly distributed mass. Examples of such payloads in the real world include wooden logs, pre-cast columns, and pipeline segments. In real-world scenarios, this payload could be any item such as rechargeable batteries, communication equipment, beams [28], fire fighting equipment [29], sensors like [30] or spray for agricultural purposes [31]. We define the position vector P i = [ X , Y , Z ] T of the CoM (Center of mass) of the slung load relative to a fixed inertial frame ε = [ X , Y , Z ] T . We define the orientation of the slung load by using Euler angles as ζ = [ α , β , γ ] T , where α represents the roll angle about the x-axis which is described as tilt angle. The angle α is the main constituent in the load distribution strategy. The angle β is fixed and it represents the pitch angle around the y-axis, while γ represents the yaw angle around the z-axis of the slung load. The mathematical model of the system is divided into two parts. The first part is the translational dynamics of the system defined in Section 2.1, whereas the second part is the individual attitude dynamics of each UAV as defined in Section 2.2. The system is modeled by considering the payload actuated by the UAVs. The translational dynamics of the payload and UAVs are coupled whereas the attitude dynamics of the UAVs and the payload are decoupled. The decoupling of attitude dynamics can be achieved by using a cable-based anchor-point for attachment with a magnetic gripper. The UAVs and the payload are considered geometrically constrained in order to be able to determine the payload‘s location while knowing the position of a UAV. Some uncertainties associated with the modeling were not included in the model such as the effects of wind gusts and the effects of UAV platform parameter mismatch, etc.

2.1. Whole System Translational Dynamics

The system when considered as a whole, consists of a combined mass, UAVs as actuators, facing parasitic drag forces caused by air friction. Extending on the single UAV dynamic model [25], the lumped dual-UAV-payload dynamics can be defined as:
m X ¨ = i = 1 2 s i n ϕ i s i n ψ i + c o s ϕ i c o s ψ i s i n θ i T i
+   F D i ( V x + V w x ( z ) , θ i , ρ ( z ) ) + F p x ,
m Y ¨ = i = 1 2 c o s ϕ i s i n θ i s i n ψ i c o s ψ i s i n ϕ i T i
+   F D i ( V y + V w y ( z ) , ϕ i , ρ ( z ) ) + F p y ,
m Z ¨ = i = 1 2 c o s θ i c o s ϕ i T i m g
+   F D i ( V z + V w y ( z ) , ϕ i , ρ ( z ) ) + F p z .
where m = m p + i = 1 2 M i is the total mass which includes mass of hexrotors M i and slung load m p , X ¨ , Y ¨ , Z ¨ are the translational accelerations of the dual-hexrotor-UAV payload system in x, y and z axes. T i is the sum of the thrusts produced by all motors of the UAV i calculated as T i = k b N = 1 6 ω i N 2 . Payload’s drag forces are shown by F p x , F p y , F p z for x,y,z axis respectively.

2.2. Individual UAV Rotational Dynamics

The rotational dynamics of individual UAVs are essentially the same as the conventional description of a single UAV. This is achieved by decoupling the rotational dynamics of the UAV with the payload, by using a cable for attaching the payload to the UAV. The equations describing UAV’s individual rotational dynamics are explained in Equations (4)–(6).
I i x ϕ i ¨ = ( I y I z ) θ i ˙ ψ i ˙ + l u 2 i j θ i ˙ u 5 i ,
I i y θ i ¨ = ( I z I x ) ϕ i ˙ ψ ˙ + l u 3 i j ϕ i ˙ u 5 i ,
I i z ψ i ¨ = ( I x I y ) ϕ i ˙ θ i ˙ + u 4 i ,
where u 2 i = k b c o s ( 30 ) ( ω i 1 2 + ω i 2 2 ω i 4 2 ω i 5 2 ) u 3 i = k b ( s i n ( 30 ) ω i 1 2 + ω i 6 2 + s i n ( 30 ) ω i 5 2 s i n ( 30 ) ω i 2 2 ω i 3 2 s i n ( 30 ) ω i 4 2 ) and u 4 i = k t ( ω i 3 2 + ω i 1 2 + ω i 5 2 ω i 2 2 ω i 4 2 ω i 6 2 ) , k t and k b are the propeller co-efficients for drag and lift, u 5 i = ( ω i 1 ω i 2 + ω i 3 ω i 4 + ω i 5 ω i 6 ) . The rotational inertia of each UAV i is shown by ( I i x , I i y , I i z ) .

3. Algorithm Description

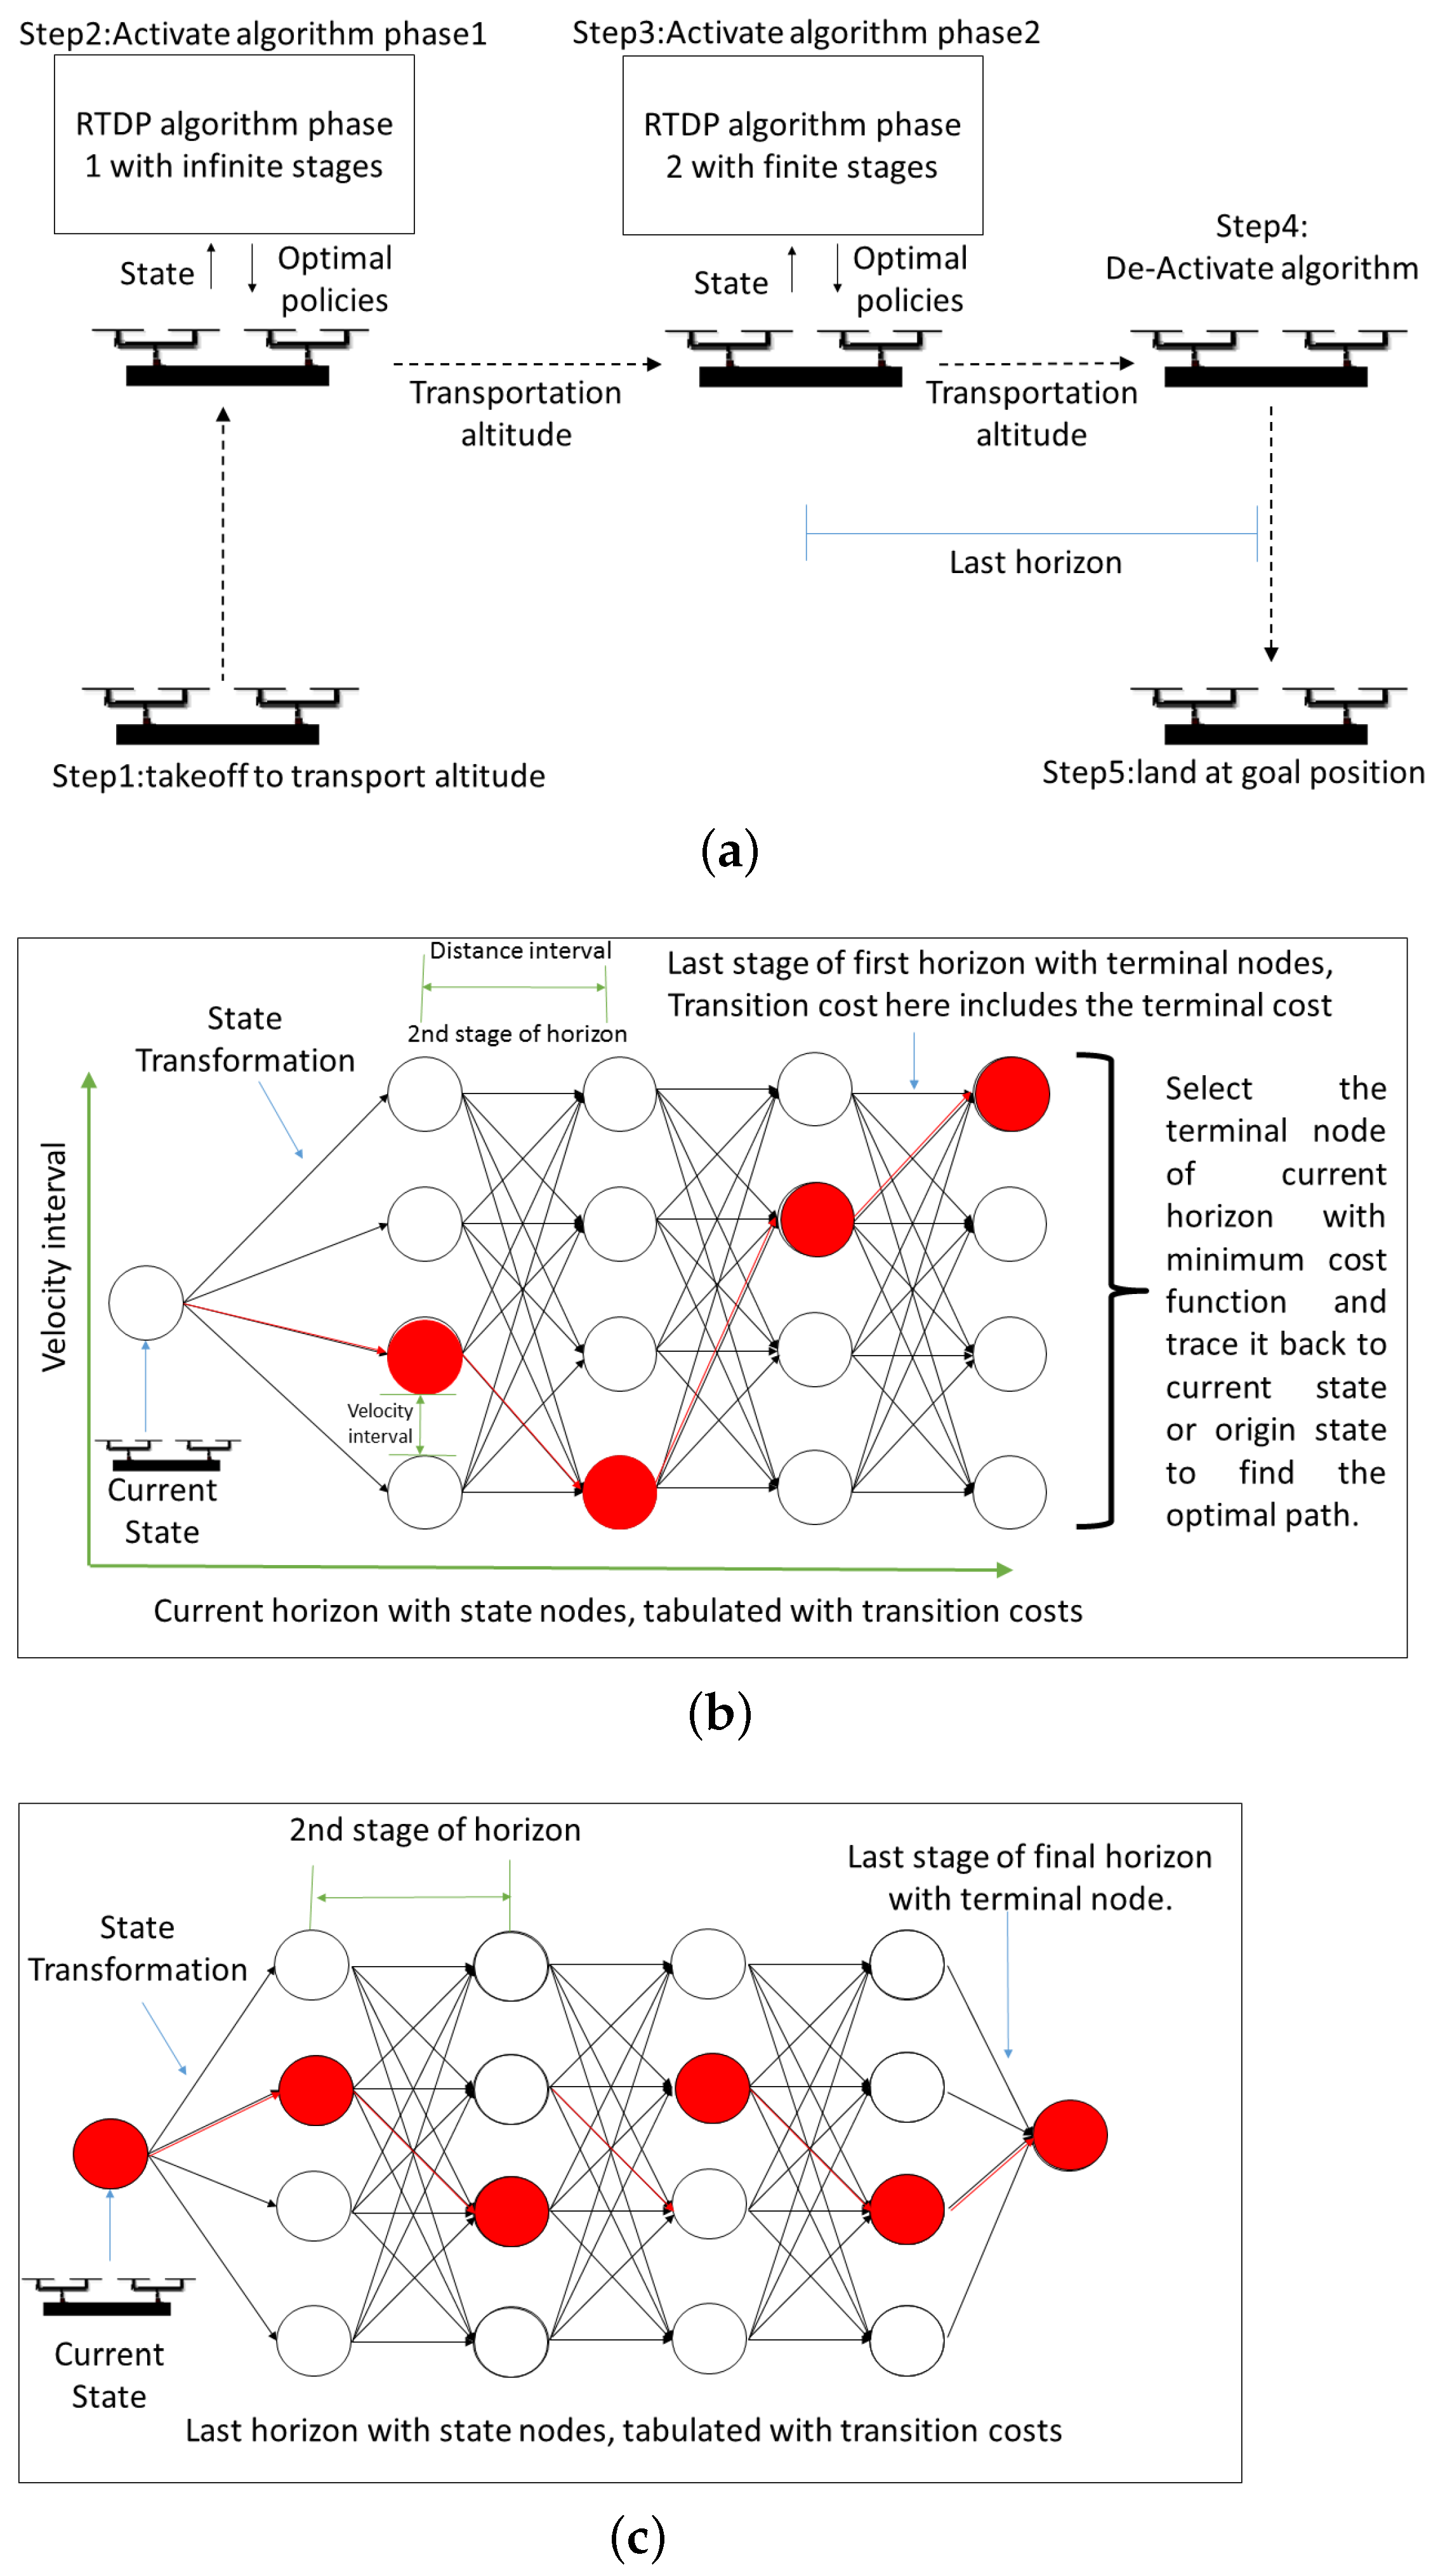
The Dynamic Programming (DP) algorithm is applied in two phases as shown in Figure 3a. The first phase is called the infinite stage problem which requires adding the terminal cost. During the first phase, DP sweep is applied on a limited portion of the travel, called horizon length. We do not specify the final velocity of the system in the first phase. The second phase starts when the dual-UAV-payload system enters the last horizon. In the second phase, the dual-UAV-payload system completes the travel, hence the final velocity state is specified. The main difference between these two phases is that in the first phase, a terminal cost is added, while in the second phase, the final velocity decision is known, so the final transition cost is calculated.

3.1. Phase 1: Infinite Stage Problem

The first phase with a non-finite stage is described below. The following cost function is minimized in this strategy as shown in Equation (7).
m i n J ( u ( s ) ) ,
J ( u ( s ) ) = G ( x ( s f ) ) + 0 s f H ( x ( s ) , u ( s ) , z ( s ) ) d s ,
where H is the cost at distance step, s, along the trajectory, which is a function of the system state x, the control inputs u s and the disturbance z s . This is added to G ( x ( s f ) ) , a terminal cost associated with the state, x, of the system at the final distance considered, s f . The distance between s and s f is referred to as the horizon over which the optimization is applied. The control action or decision variable, u ( s ) , is the velocity in this case. G ( x ( s f ) ) is the cost of the travel from the end of the current horizon to the end of travel. The terminal cost G ( x ( s f ) ) is selected as an integral multiple of the transition cost at the last stage. The value of the integral multiple is found by an iterative method. The purpose of terminal cost is to penalize the decisions which benefit the current horizon at the expense of future horizons. Equation (8) is in the continuous form that cannot be directly applied to our system. The discretized form of Equation (8) will be discussed in Section 3.3 as Equation (14).

3.2. Phase 2: Finite Stage Problem

The second phase of the optimization is activated when the dual-hexrotor-payload system enters the last horizon. In this phase, the final state of the dual-hexrotor-payload system is known, for example, landing. This phase does not require the calculation of terminal cost, instead at the final node, the final cost is calculated using the predefined final state. In this phase, the DP sweep is performed in such a way that the number of stages is reduced for each DP computation since the dual-hexrotor-payload system gets closer to the goal position. The second phase of the algorithm is defined by the following cost equation.
J ( u ( s ) ) = 0 s f H ( x ( s ) , u ( s ) , z ( s ) ) d s .

3.3. Implementation

Apart from a cumulative cost function, the DP problem requires that the system is described via a descretizable model as well. The discretized state model can be written in the following form,
x k + 1 = f k ( x k , u k , z k ) ,
where k = 0 , 1 , 2 , 3 N 1 . The current state of the system is x k + 1 , which is obtained by using the decision variable u k , the previous state of the system x k , and the disturbance z k using a function f k . x k is the state vector defined as
x k = V x V y ,
where V x and V y represents the velocity components of the slung load in x and y axis. u k is the control input defined as
u k = V x u V y u ,
where V x u and V x u are the velocity inputs in the x and y axis for the actuating UAVs in the transport direction. The velocity set-points of both UAVs are going to be the same as the whole system is geometrically connected. The disturbance can be defined as z k
z k = w i n d ρ ,
where w i n d represents wind speed and ρ is air density.
The cost function as described in Equation (8) was discretized as follows to make it compatible with our system,
J = g ( x N ) + N d 1 k = 0 J k ( x k , u k , z k ) .
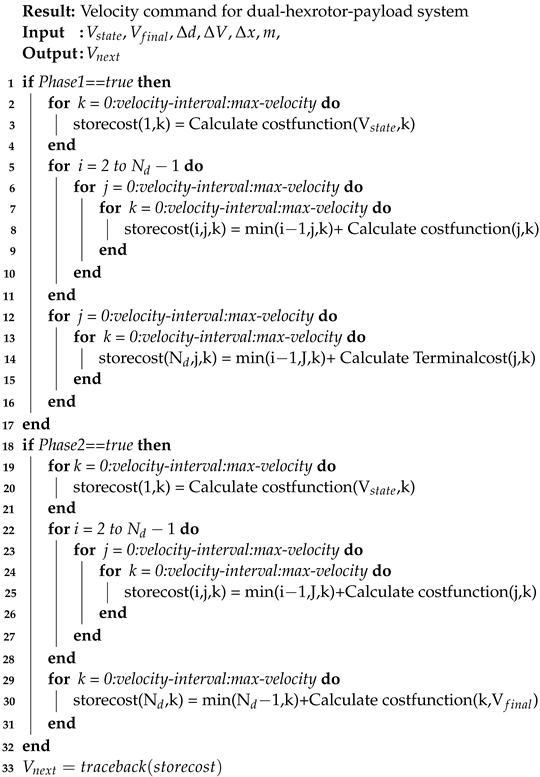
Assuming there are N d distance intervals in one horizon, the current position marks the beginning of the current horizon. As shown in Algorithm 1, during the first phase, transition costs are calculated from each possible velocity state to another state for each distance interval. To get the cumulative cost, the minimum cost to reach that velocity state at each distance interval is added to the cost. For the last distance interval, the terminal cost is also added. After calculating all cumulative transition costs, the minimum cost from the last node is traced back to the first distance interval. The first velocity decision obtained in this manner is implemented on the dual-hexrotor-payload system. During the second phase, the last velocity state is known, zero in this case. Thus, instead of terminal cost, the transition cost is calculated to reach zero velocity from all possible velocity states, for the last interval.
Algorithm 1: DP sweep for RTDP algorithm for dual-hexrotor-payload system
Drones 07 00171 i001

3.4. Cost Function Definition

In order to implement the RTDP algorithm to optimize the travel time and energy consumption of the dual-UAV payload system, we have defined a multi-objective cost function. It covers both the energy consumption and time spent traveling from one node to another. A factor λ is used to shift the priority weight between the travel time and energy consumption.
J k = i = 1 2 E i k E n λ + T a k T n ( 1 λ ) ,
where J k is the cost function in stage k for a distance interval s, E i k is the energy consumed while the velocity state is changed for UAV i for stage k. A factor E n is used to normalize the energy part and make it comparable to the time factor. The first part considers the energy consumption of all UAVs. The second part of the cost function is related to time spent, while the dual-UAV payload system traveled through one distance step. T a k is the time spent by following one decision from search space for stage k and a factor T n is used to scale it with the energy consumption factor in the combined cost function. The terminal cost is calculated as a multiple of the current transition cost and a factor that is selected iteratively to penalize decisions benefiting the current horizon but resulting in the loss in the next horizon. The cost function requires a simplified model of the system to be able to calculate the energy consumption and the time spent during the travel between two nodes. The simplified model that is used to calculate the cost function is defined in Section 4. The model is described in Section 4. The assumptions and constraints of the cost function stem from the simplification of the system model equations and are applicable when the dual-UAV system transitions from one node to another. These simplifications and assumptions are explained in Section 4.

4. Model Derivation for Cost Function

The model shown in Equations (1)–(6) in Section 2 is not suitable for cost function calculation due to high computational costs, however, it will be used for the testing the algorithm in the MATLAB based numerical simulations and SITL Gazebo simulations. The formulation for the reduced model for cost function calculation is described below. The Equations (1)–(3) describing the translational dynamics of the dual-hex-rotor-payload system are used to develop the reduced model. If we consider constant altitude motion z ¨ = 0 , the total thrust required by the dual-hexrotor-payload system to stay in the air would be
i = 1 2 T i = i = 1 2 m g c o s θ i c o s ϕ i
where m is the total mass of the system. If the load is unevenly lifted by the two UAVs, the Equation (16) can be expanded as:
i = 1 2 T i = ( δ m p + M 1 ) g c o s θ 1 c o s ϕ 1 + ( ( 1 δ ) m p + M 2 ) g c o s θ 2 c o s ϕ 2
where m p is the mass of the payload, M i is the mass of U A V i and δ is the ratio of the mass of the payload lifted by U A V 1 vs U A V 2 . If we know the thrust distribution (needed to regulate the payload weight distribution between two hex-rotors) we can find individual thrusts required by each UAV. If the yaw angle is fixed to zero and T i from Equation (17) is substituted in equations of motion (1), (2), the dual-UAV-payload equations of motion can be rewritten as Equations (18) and (19).
m X ¨ = t a n θ 1 · ( δ m p + M 1 ) g + t a n θ 2 · ( ( 1 δ ) m p + M 2 ) g
+ i = 1 2 F D i ( V y + V w y ( z ) , ϕ i , ρ ( z ) ) ,
m Y ¨ = t a n ϕ 1 c o s θ 1 · ( δ m p + M 1 ) g t a n ϕ 2 c o s θ 2 · ( ( 1 δ ) m p + M 2 ) g
+ i = 1 2 F D i ( V x + V w x ( z ) , θ i , ρ ( z ) ) .
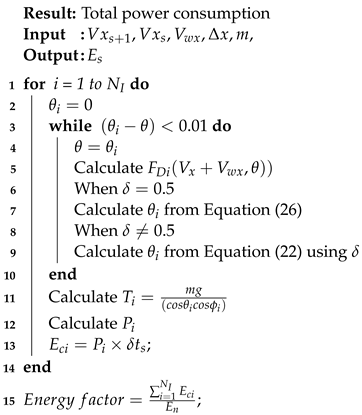
Assuming that the translational push exerted by the two UAVs is the same, Equations (18) and (19) can be used to find the roll and pitch angles for both UAVs and they will be used to find the thrust required as shown in Algorithm 2. The equations must be descritized in order to calculate the required thrust which will be used to calculate the power consumption.
Algorithm 2: Power cost calculation for a state transition for dual-UAV payload system
Drones 07 00171 i002

4.1. Time Domain to Distance Domain

Since the algorithm developed is applied in stages that are based on distance steps, the translational dynamics model of dual-hexrotor-payload system is converted from the time domain to the distance domain using the chain rule d x ˙ d t = dx d t d x ˙ d x as follows.

4.1.1. δ = 0.5

When δ = 0.5 and the translational push and the attitude angles of both UAVs are the same
m V x ( s ) d V x d x = i = 1 2 t a n θ s i · m g + F D i ( V x + V w x , θ i ) ,
m V y ( s ) d V y d y = i = 1 2 t a n ϕ s c o s θ s i · m g + F D i ( V y + V w y , ϕ i ) .

4.1.2. δ 0.5

When δ 0.5 the translational push from both UAVs is the same, however, the attitude angles and the thrust force for each UAV are different.
m V x ( s ) d V x d x = t a n θ 1 · ( δ m p + M 1 ) g + t a n θ 2 · ( ( 1 δ ) m p + M 2 ) g
+ i = 1 2 F D i ( V y + V w y ( z ) , ϕ i , ρ ( z ) ) ,
m V y ( s ) d V y d y = t a n ϕ 1 c o s θ 1 · ( δ m p + M 1 ) g
t a n ϕ 2 c o s θ 2 · ( ( 1 δ ) m p + M 2 ) g
+ i = 1 2 F D i ( V x + V w x ( z ) , θ i , ρ ( z ) ) .

4.2. Discretized Model for δ = 0.5

The translational dynamics model is currently described using the forward Euler method as explained below, however for future work other discretization schemes can also be used such as backward Euler.
V x k + 1 V x k Δ x =
1 m V x k · 1 2 ( t a n θ s k · m g + F D ( V x + V w x , θ k ) ) ,
V y k + 1 V y k Δ y =
1 m V y k · 1 2 ( t a n ϕ s k c o s θ s k · m g + F D ( V y + V w y , ϕ k ) ) .
However, if we assume that both the UAVs are applying equal force in the lateral direction we may simply write the above equations as
V x k + 1 V x k Δ x =
1 m V x k · 2 ( t a n θ s k · m g + F D ( V x + V w x , θ k ) ) ,
V y k + 1 V y k Δ y =
1 m V y k · 2 ( t a n ϕ s k c o s θ s k · m g + F D ( V y + V w y , ϕ k ) ) .
Here k and k + 1 represent the transition happening for the stage s.

4.3. Calculation of Time Spent

The time spent by the dual-hexrotor-payload system to cover the distance interval step can be calculated using the following equation,
Δ t = 0 s f 1 v d s
We ignore the time variation between the two UAVs and assume that the whole system traveled the distance interval during this time. Equation (28) is discretized to evaluate the time consumed in that particular step.
Δ t = k = 1 N 1 v k Δ s

4.4. Parameter Selection for the Algorithm

Parameters including the distance step, the horizon length, and the velocity intervals should be carefully selected since the complexity of the algorithm or the number of computations can increase significantly when increasing these parameter values. The complexity of algorithm O is a function of the number of distance intervals N s between the start and goal position, the number of velocity intervals N v , and the number of drones performing the collaborative transport N I .
O ( N s N I N v 2 ) .
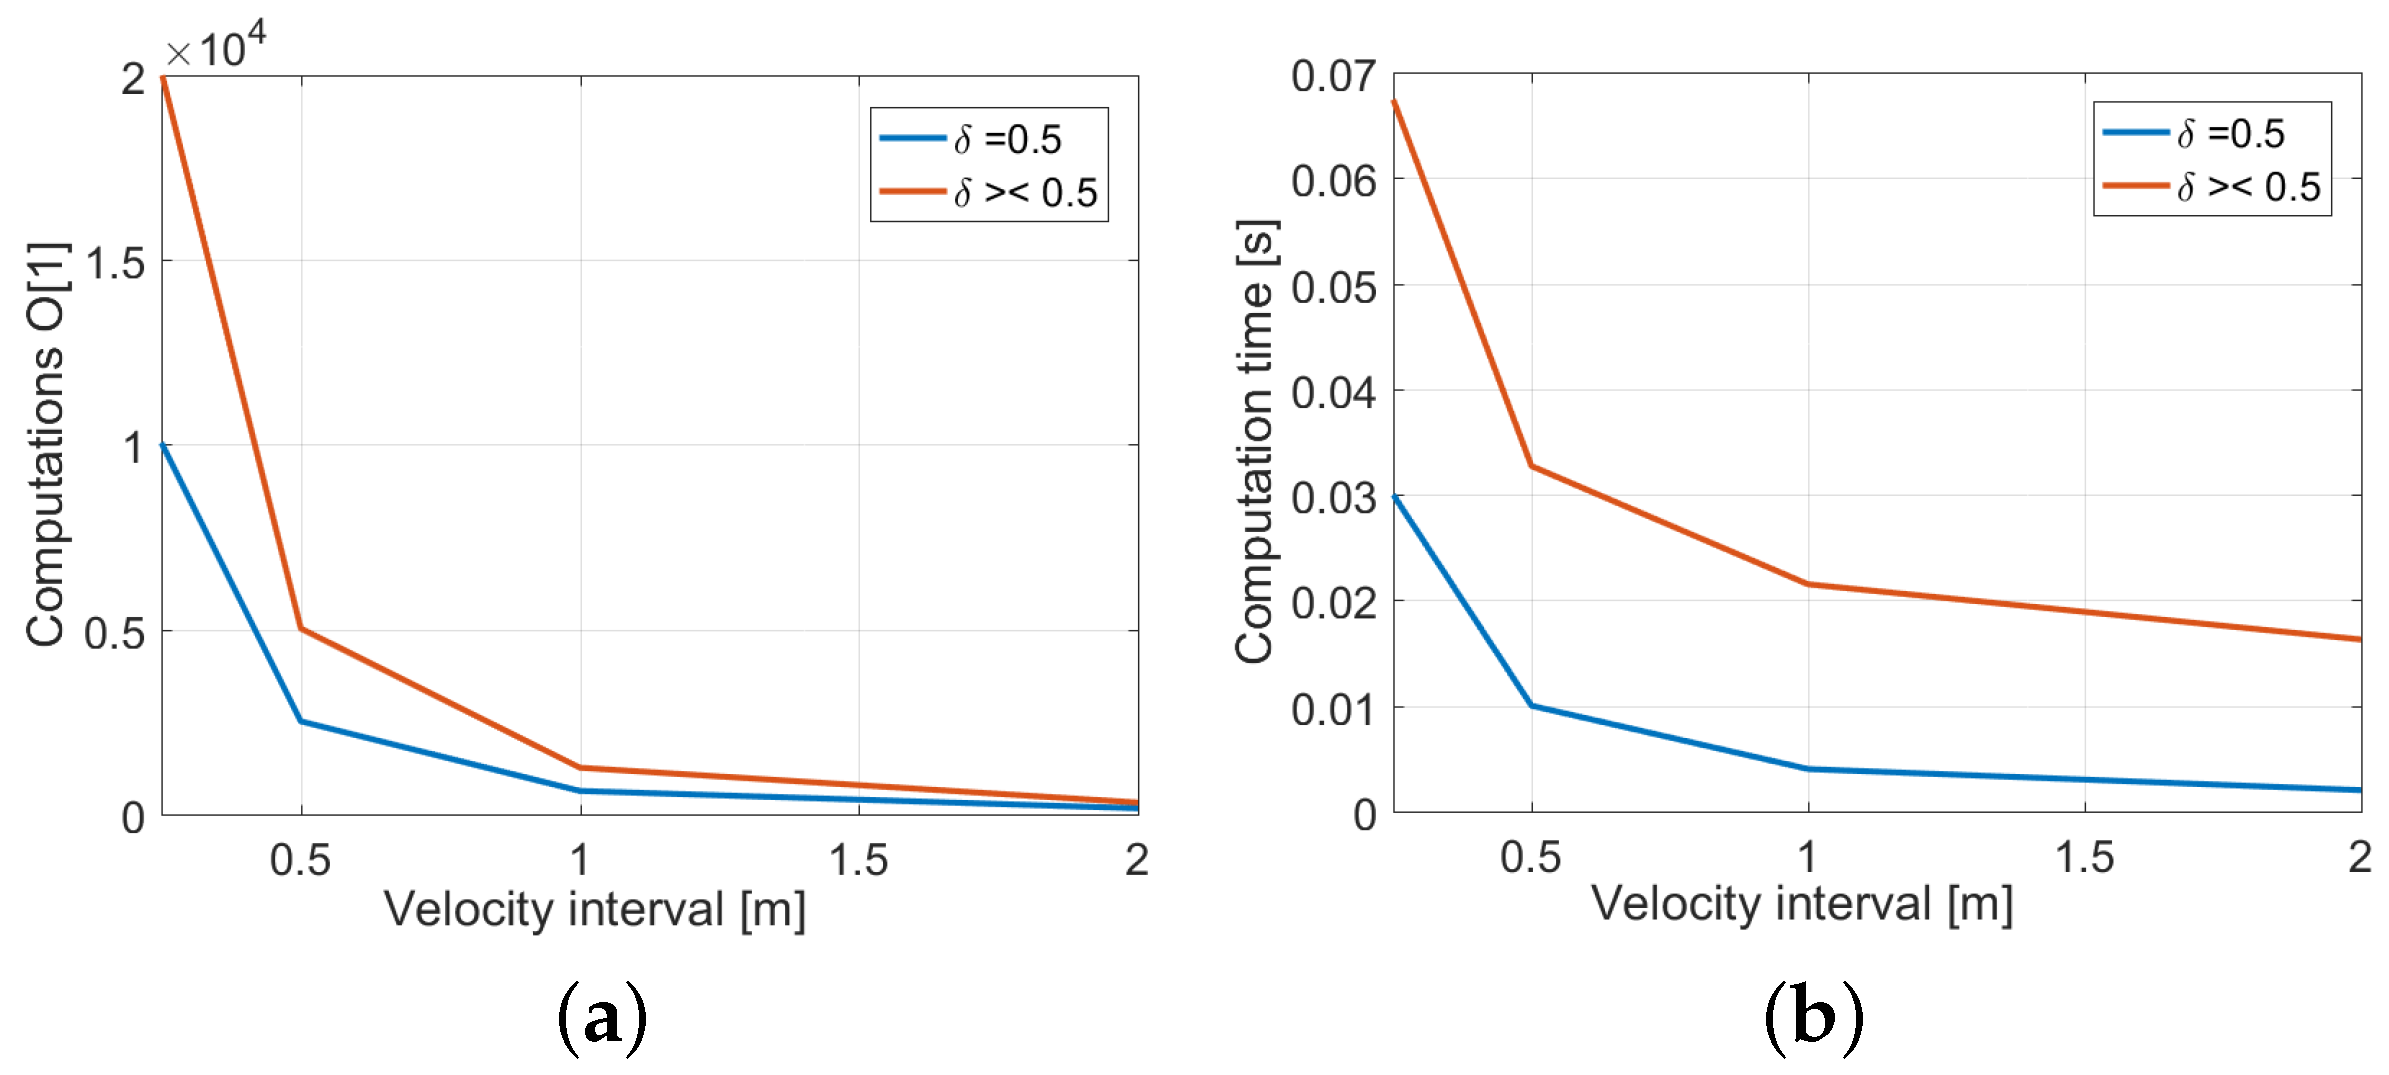
The computation illustrated in Figure 4 includes a distance interval of 10 m and a velocity interval ranging from 0.25 m/s to 2 m/s. The computational costs are calculated using two approaches, the first approach is when the thrust is equally distributed between the two drones and therefore the attitude angles and the power consumption is expected to be the same. However, when the load is uneven the thrust requirements are also uneven, this means that the attitude angles for the two drones are also different. In this case, the cost function has two steps, during the first step we calculate the attitudes of both drones and then the power costs of both drones. Figure 4 shows that the computational costs and computational time are almost doubled in the case of uneven load distribution. It can also be seen in Figure 4 that when a smaller velocity interval is used (high number of velocity options in search space), it results in more computational time. However it can be clearly seen that for a range of velocity intervals, 0.5–2 m/s, the computational time for one DP sweep is always <0.07 s.
The computation is performed on a 2.4 GHz computer with 8 GB RAM. The distance interval and the number of distance intervals in one horizon are iteratively selected as Δ x = 3 m and N d = 10 .

4.4.1. DP Sweep Trigger

When the slung load travels a distance interval, it activates another DP sweep. The distance traveled is considered from the center of the whole system. The lateral, vertical, and transport direction velocity commands are continuously sent to both drones to maintain the lateral and vertical positions, even when the DP sweep is not triggered. This is very important since this is a coupled system and any delay in relative position control commands can lead to unstable behavior.

4.4.2. Relative Position Compensator

The RTDP algorithm sends the optimal velocity set-points to both UAVs. However, when two drones are carrying the payload together it is crucial that they maintain a safe distance from each other. This safe distance ensures that no unnecessary forces are acting on the payload. It is also important for the stability of the whole system since it maintains a safe distance between the two drones. Therefore the velocity set-point sent to the follower UAV is adjusted to compensate for the relative position distance error between the two UAVs. This compensation is done via a proportional controller, which calculates the error between the desired relative distance and actual relative distance and generates the velocity compensation value. The velocity compensation value is then summed up with the velocity set-point generated by the RTDP sweep.

4.4.3. Constraints

Several constraints are considered during the execution of the algorithm. Firstly, it is necessary that the force applied by both UAVs in the transport direction be the same, especially in parallel motion. When the load is distributed unevenly between the two UAVs, the UAV with low thrust will require a higher attitude angle to apply the same force toward the transport direction as the UAV with high thrust. The required attitude angle for the UAV with low thrust should not be greater than the allowable attitude angle.
s i n ϕ s i n ψ + c o s ϕ c o s ψ s i n θ m a x T m i n >
s i n ϕ s i n ψ + c o s ϕ c o s ψ s i n θ T m a x ,
c o s ϕ s i n θ s i n ψ c o s ψ s i n ϕ m a x T m i n >
c o s ϕ s i n θ s i n ψ c o s ψ s i n ϕ T m a x ,
0 < T i < T m a x i .
The relative distance between the two UAVs should be around the length of the payload and the allowed tolerance. This tolerance can be defined based on the length of the gripper cables.
P 2 P 1 l ± t p ,
where P 1 and P 2 are the position vectors of the UAV i, and t p is the tolerance in [ m ] , determined based on the gripper cable length. Any velocity decision which could result in an attitude higher than the allowable attitude should be penalized during cost function calculation in a DP sweep.
θ i < π 2 , ϕ i < π 2 , ψ i = 0 .

5. Numerical Experiments

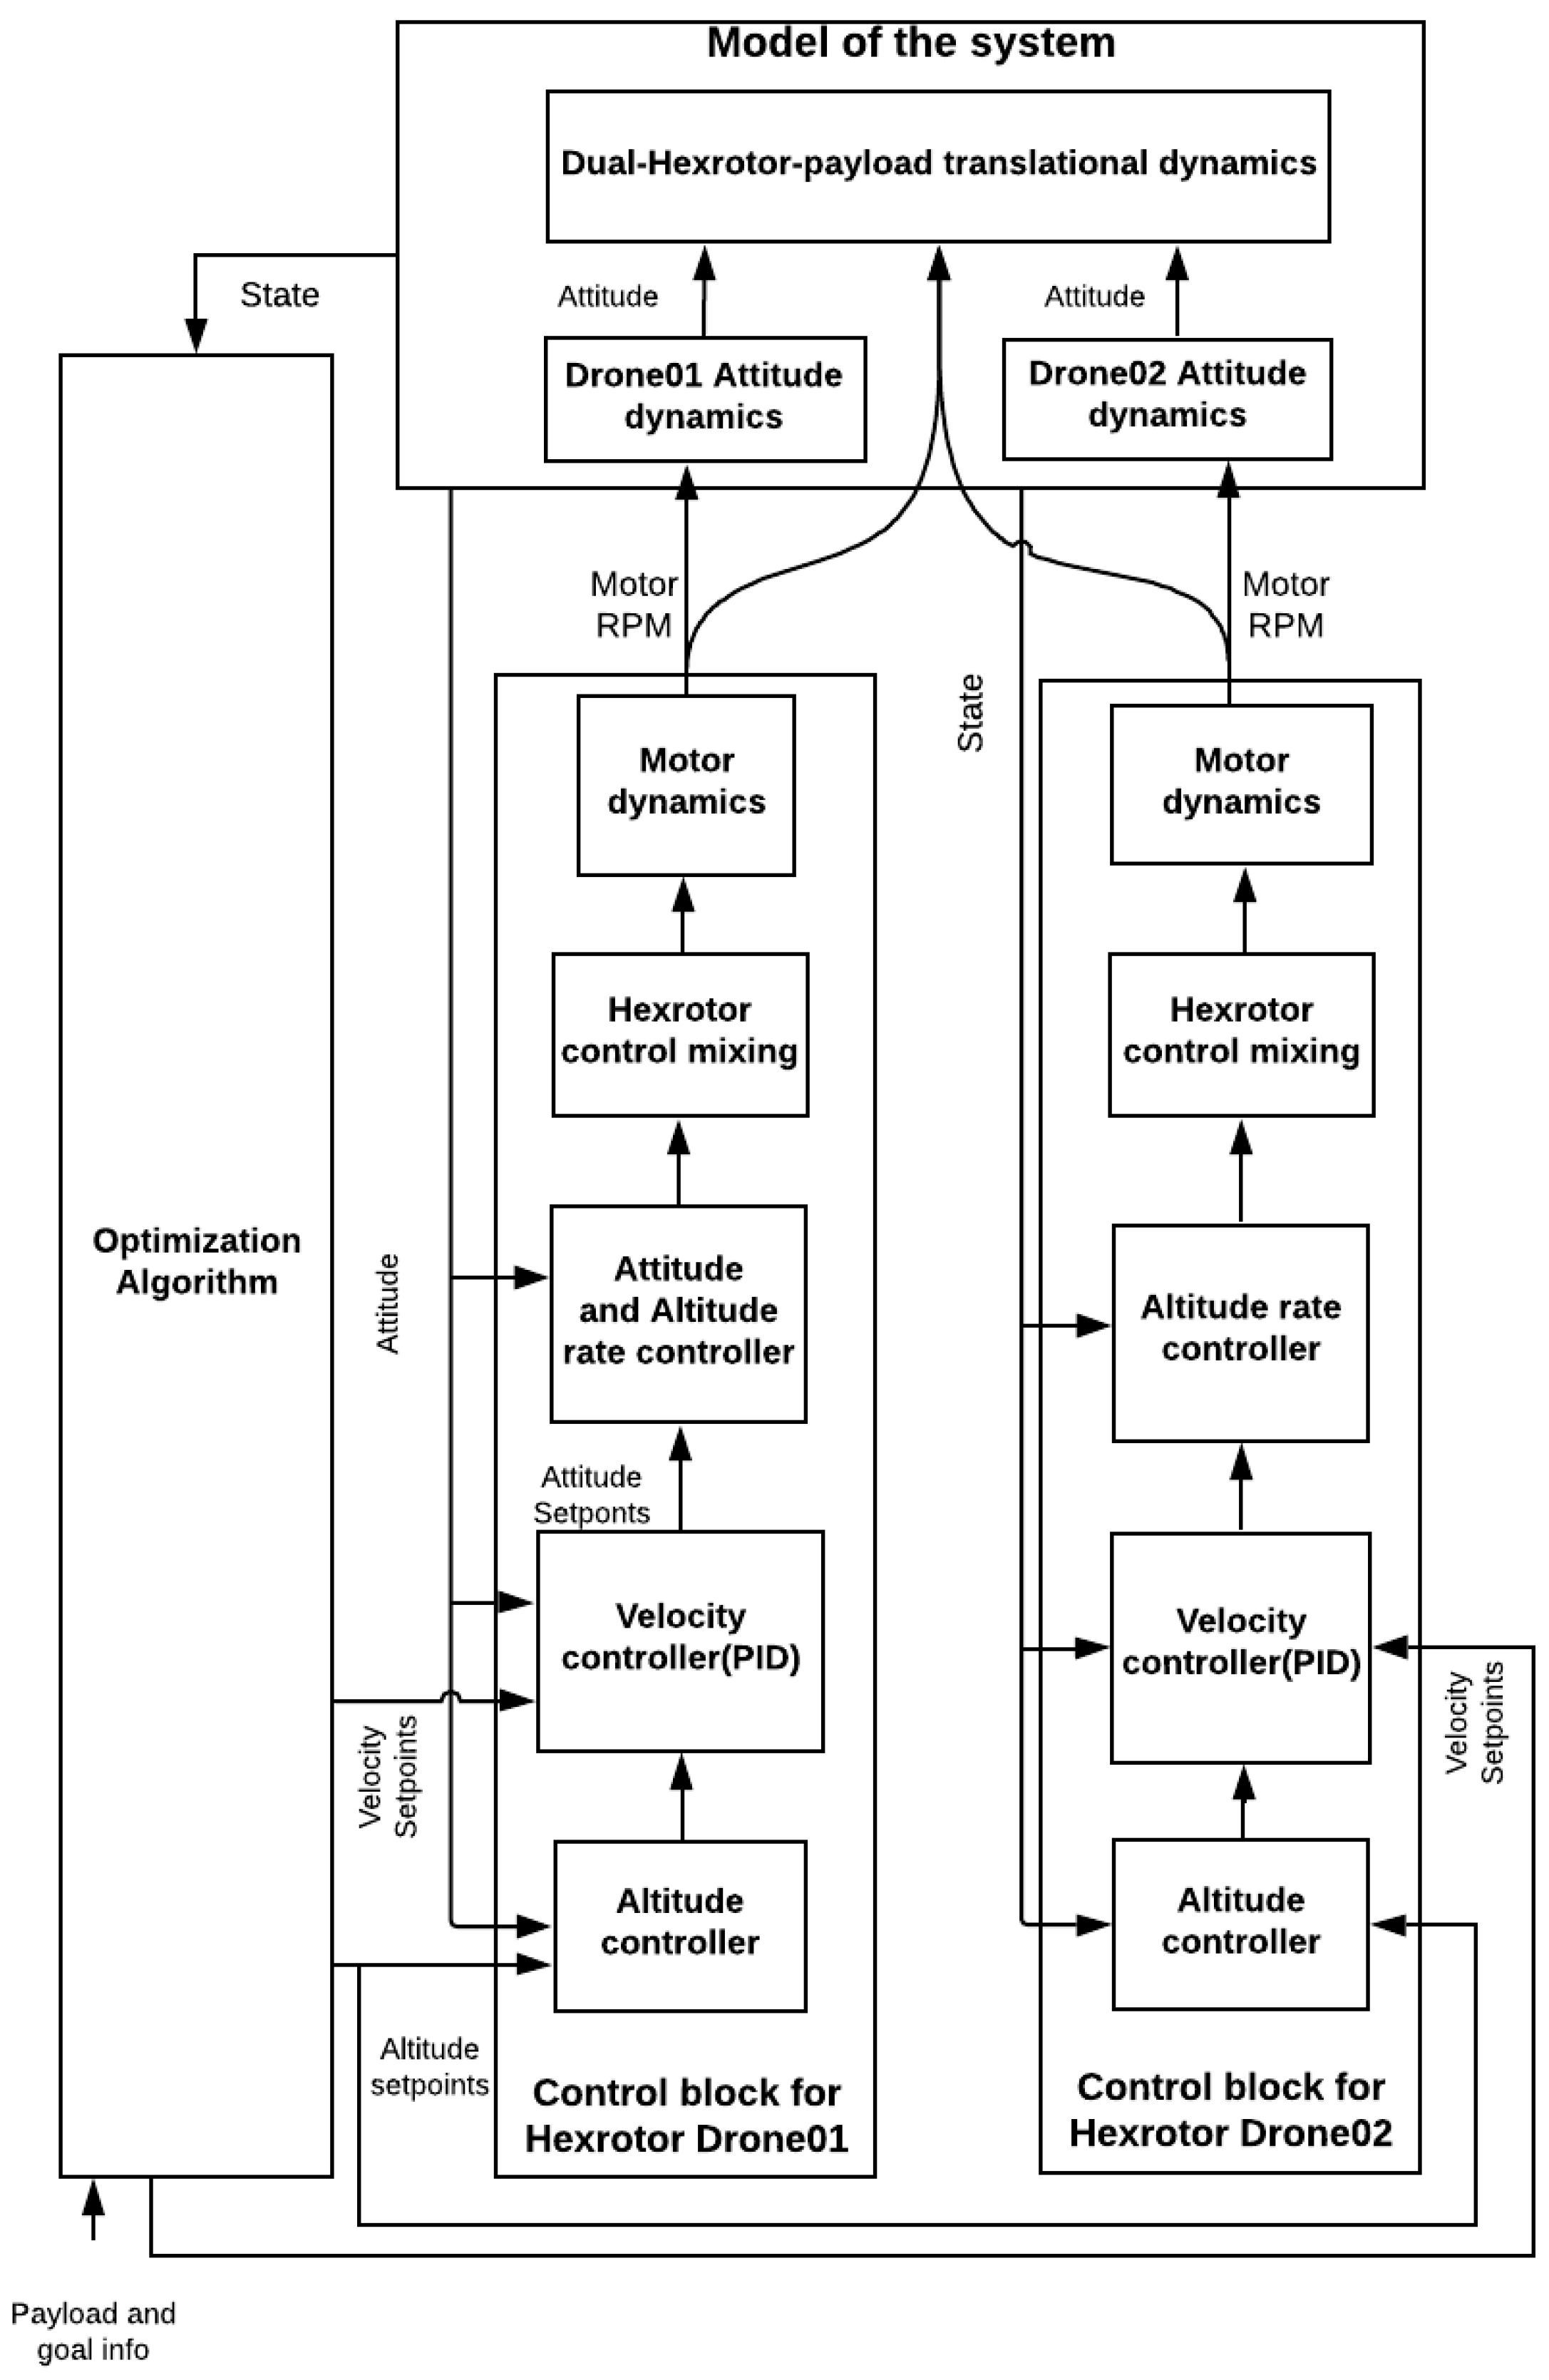
Initial tests of the algorithm were performed using a dual-hex-rotor-payload model developed in MATLAB Simulink. The Simulink model consisted of two hexrotor-attitude dynamics blocks, a combined lateral linear dynamics block, two vertical linear dynamics blocks, a control block, and an optimization algorithm block as shown in Figure 5. The dual-hexrotor-payload model uses Equations (1)–(6) as described in the previous Section 2 in details. The vertical linear dynamics blocks were separately modeled to incorporate the load sharing between the two UAVs, which can be achieved by changing the elevation of the UAVs.
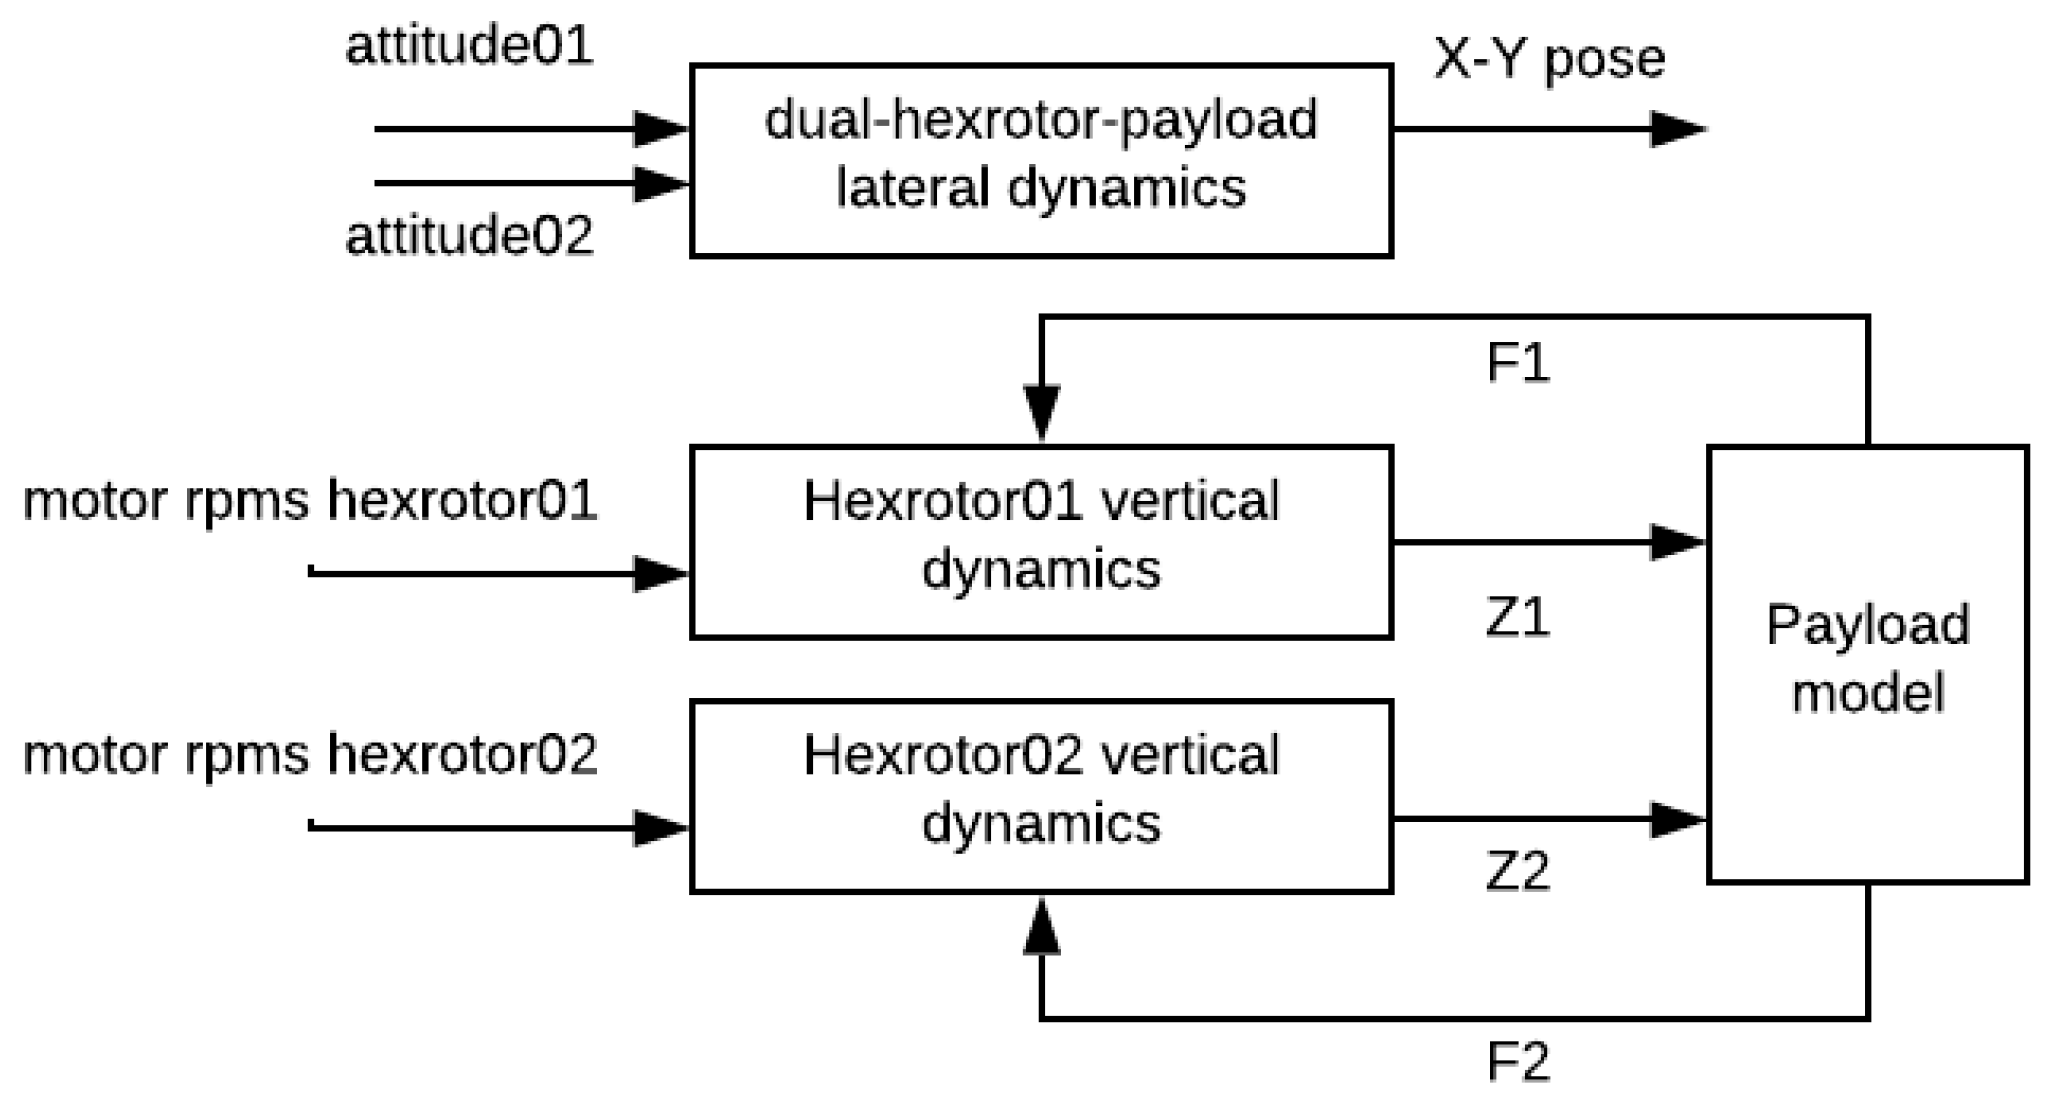
The optimization block takes the states of the system and applies RTDP algorithm to return the optimum policy decisions to the controller blocks of the system. Power consumption was calculated in the model using the rotor speed, attitude angles, and translational speed of the system. The wind speed block calculates the wind speed at the elevation of drones. The controller block consists of a proportional altitude controller, a PID (Proportional-Integral-Derivative) velocity controller, a proportional attitude controller, and a PID attitude rate controller. The atmospheric density block is based on the standard atmosphere, provided by Simulink, and it provides the air density at a certain elevation. The linear dynamics of the dual-hexrotor-payload system is explained further by expanding it in Figure 6. The payload model is described further below in Section 5.1 respectively.

5.1. Payload Model

The payload is a rectangular cuboid with a surface area A p , length d, width w and hence a mass m p , and a drag co-efficient CD. The mass of the payload is assumed to be uniformly distributed, hence CoG (Center of gravity) is the same as the geometrical center. The effects of the spatial configuration of the UAVs on thrust distribution while transporting payload are also modeled. The vertical dynamics of the two UAVs are separately solved to account for the lift force distribution. The payload model is shown in Figure 6. The payload is a rectangular cuboid and a drag co-efficient is used along with payload speed to calculate its drag.

5.2. Assumptions

We assume that both UAVs are capable of jointly lifting a rectangular cuboid with a frontal area of 0.12 m 2 . Robust communication is required to ensure that the centralized computer running the RTDP is connected to the autopilots of both drones. The velocity and attitude controllers of the drones are used as provided by the open-source PX4 flight controller, however, users can adopt other robust controllers such as [32,33]. The RTDP algorithm requires continuous input of the states of the drones and sends optimal policies continuously to both of them. The communication problem and the contingency plans related to communication outages are therefore outside the scope of this paper. We assume the structural integrity of the drones and payloads are maintained during the high-speed forward flight. The magnetic gripper is also assumed to be able to resist external forces to keep the payload attached.

5.3. Numerical Simulation Results

A couple of numerical simulation tests were conducted for verification of the algorithm. In all numerical tests, the horizon consisted of 10 distance interval steps. In the first test, two UAVs were jointly transporting a rectangular cuboid payload of 0.12 m 2 surface area from [0, 0, 10 m] to [250 m, 0, 10]. The payload was assumed to be already attached to the UAVs, and a simple coordinated motion strategy was used to transport them to the initial position at [0, 0, 10 m]. The velocities at starting point A and at goal point B were 0 m/s. A velocity interval of 0.1 m/s was considered, and the distance intervals were 1 , 2 , 3 and 4 m. Three test cases were performed with values of λ = ( 0.2 , 0.5 , 0.7 ) and δ = 0.1 . Table 1, Table 2, Table 3 and Table 4 show the test case results. Travel time and energy consumption at λ = 0.5 were considered the base case to calculate the percentage of the difference in column 3 and column 5 of Table 1, Table 2, Table 3 and Table 4.
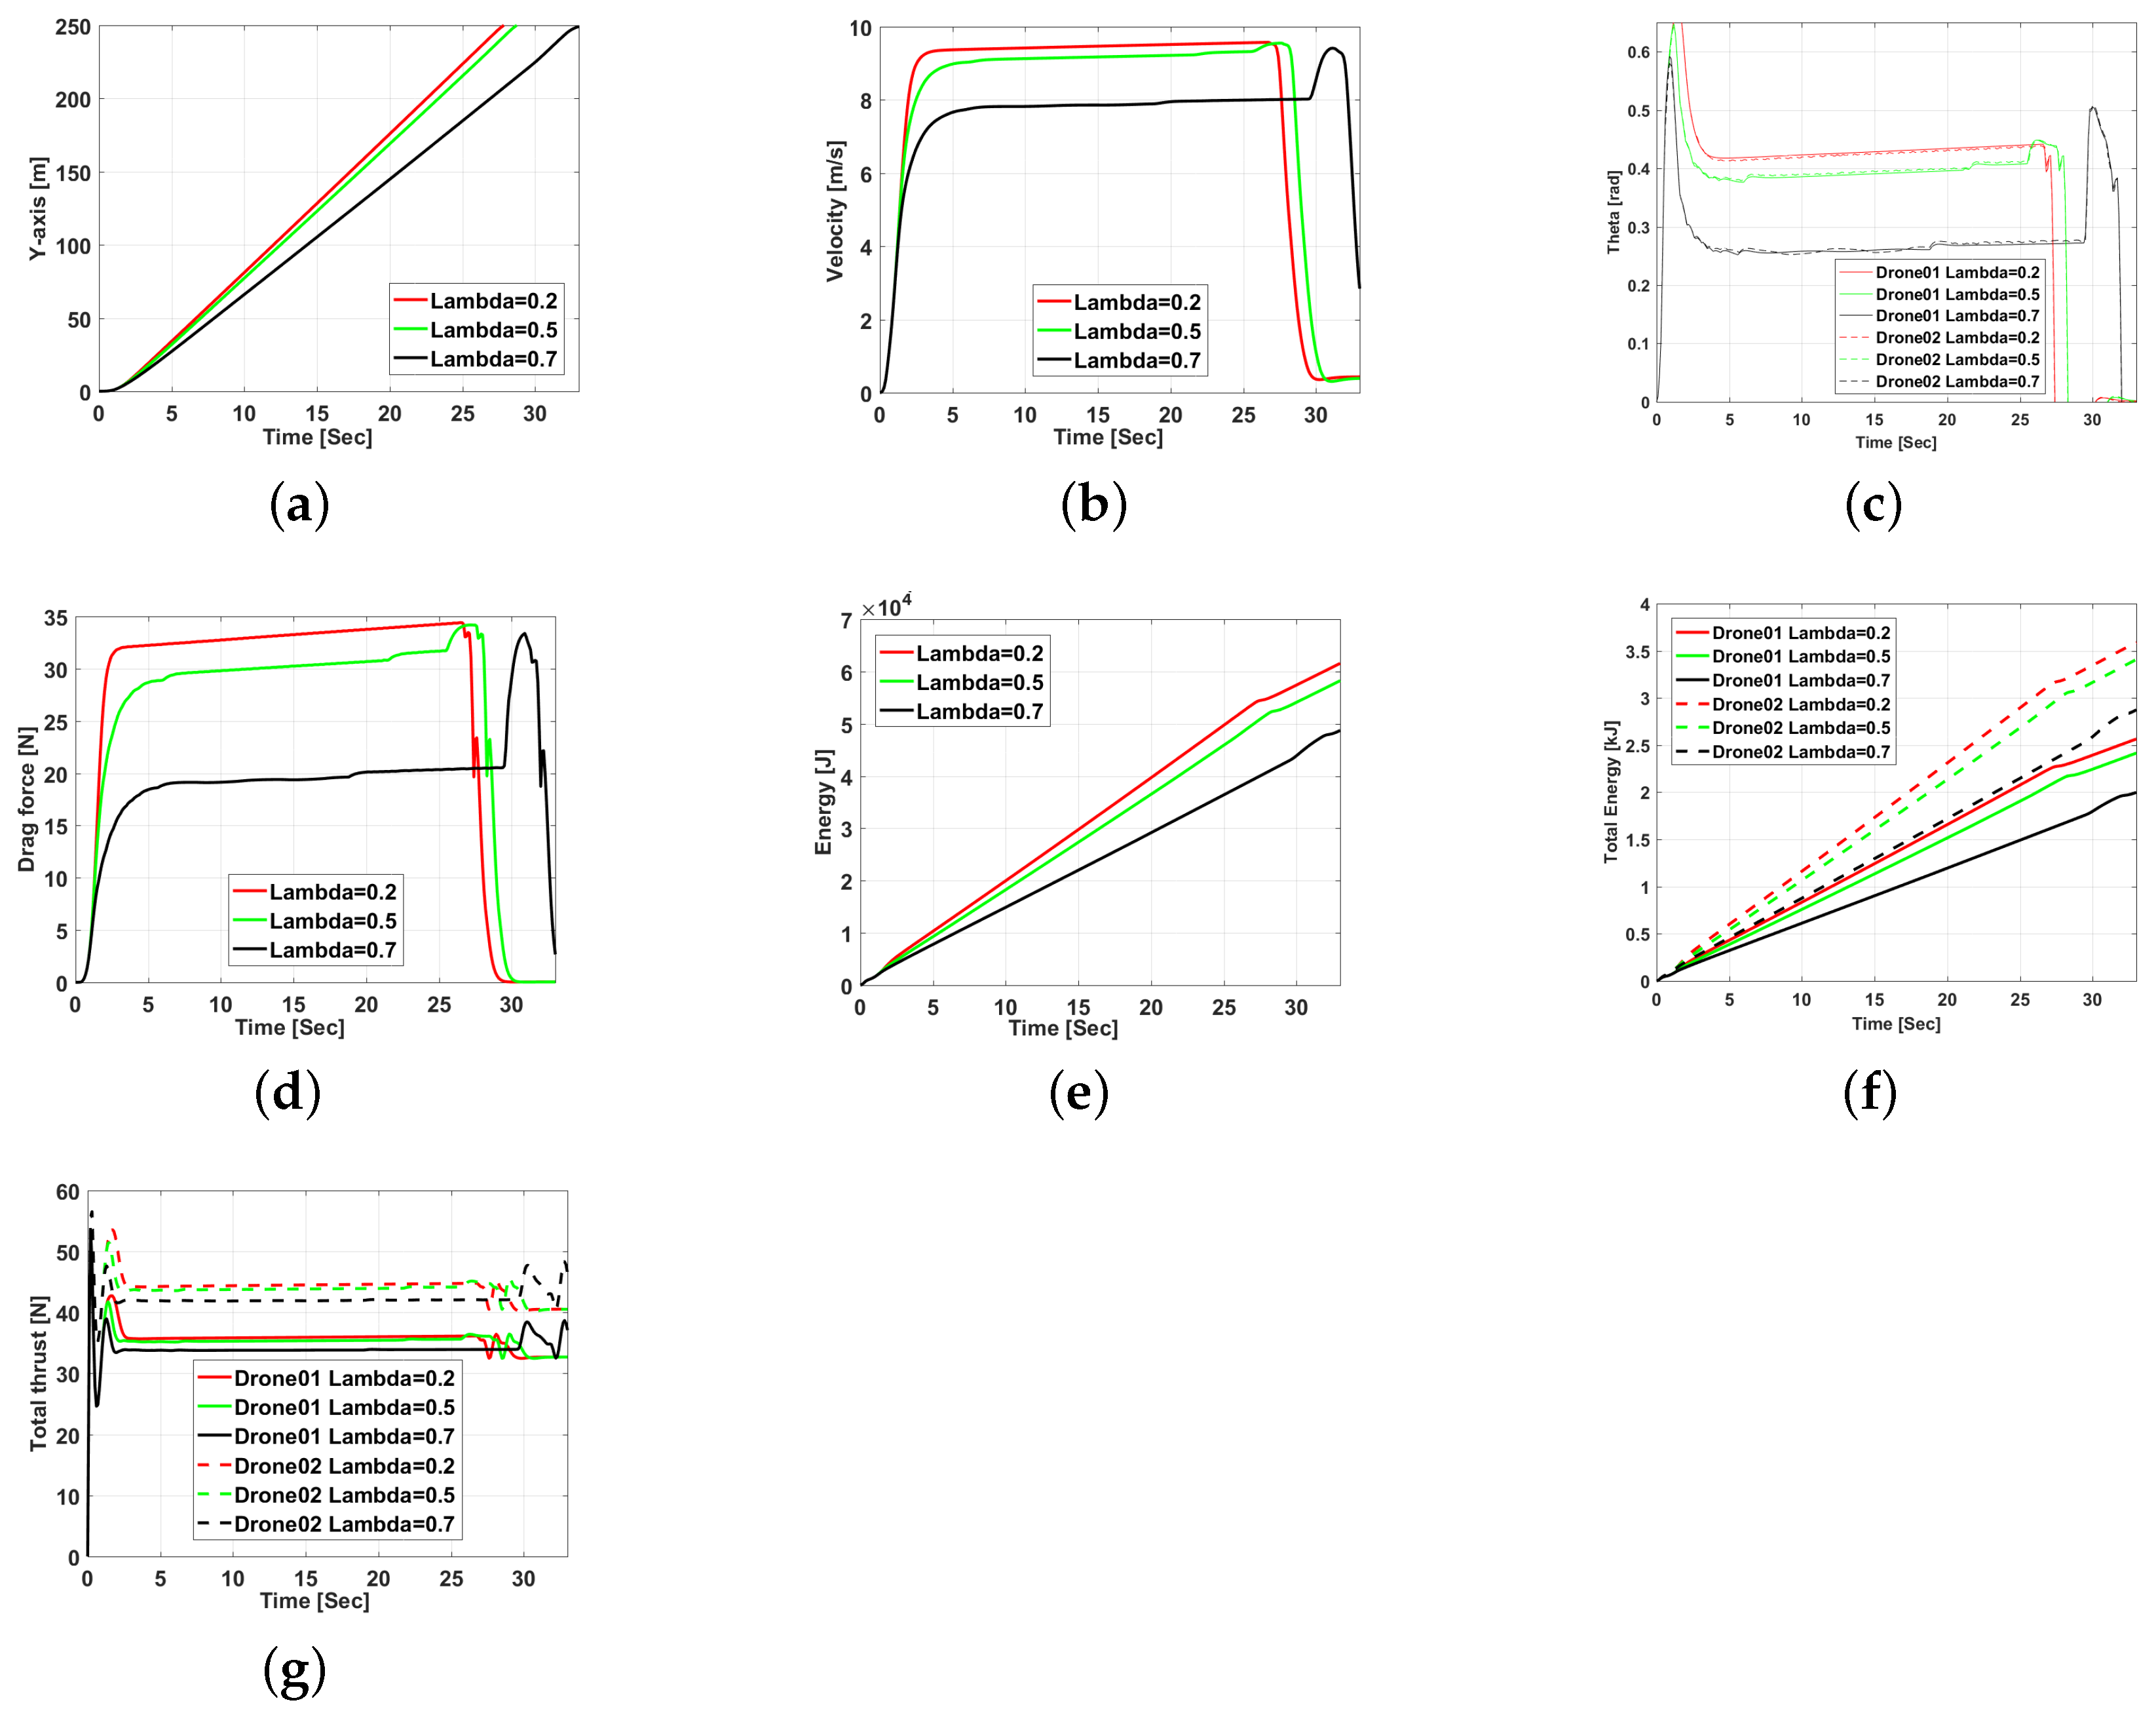
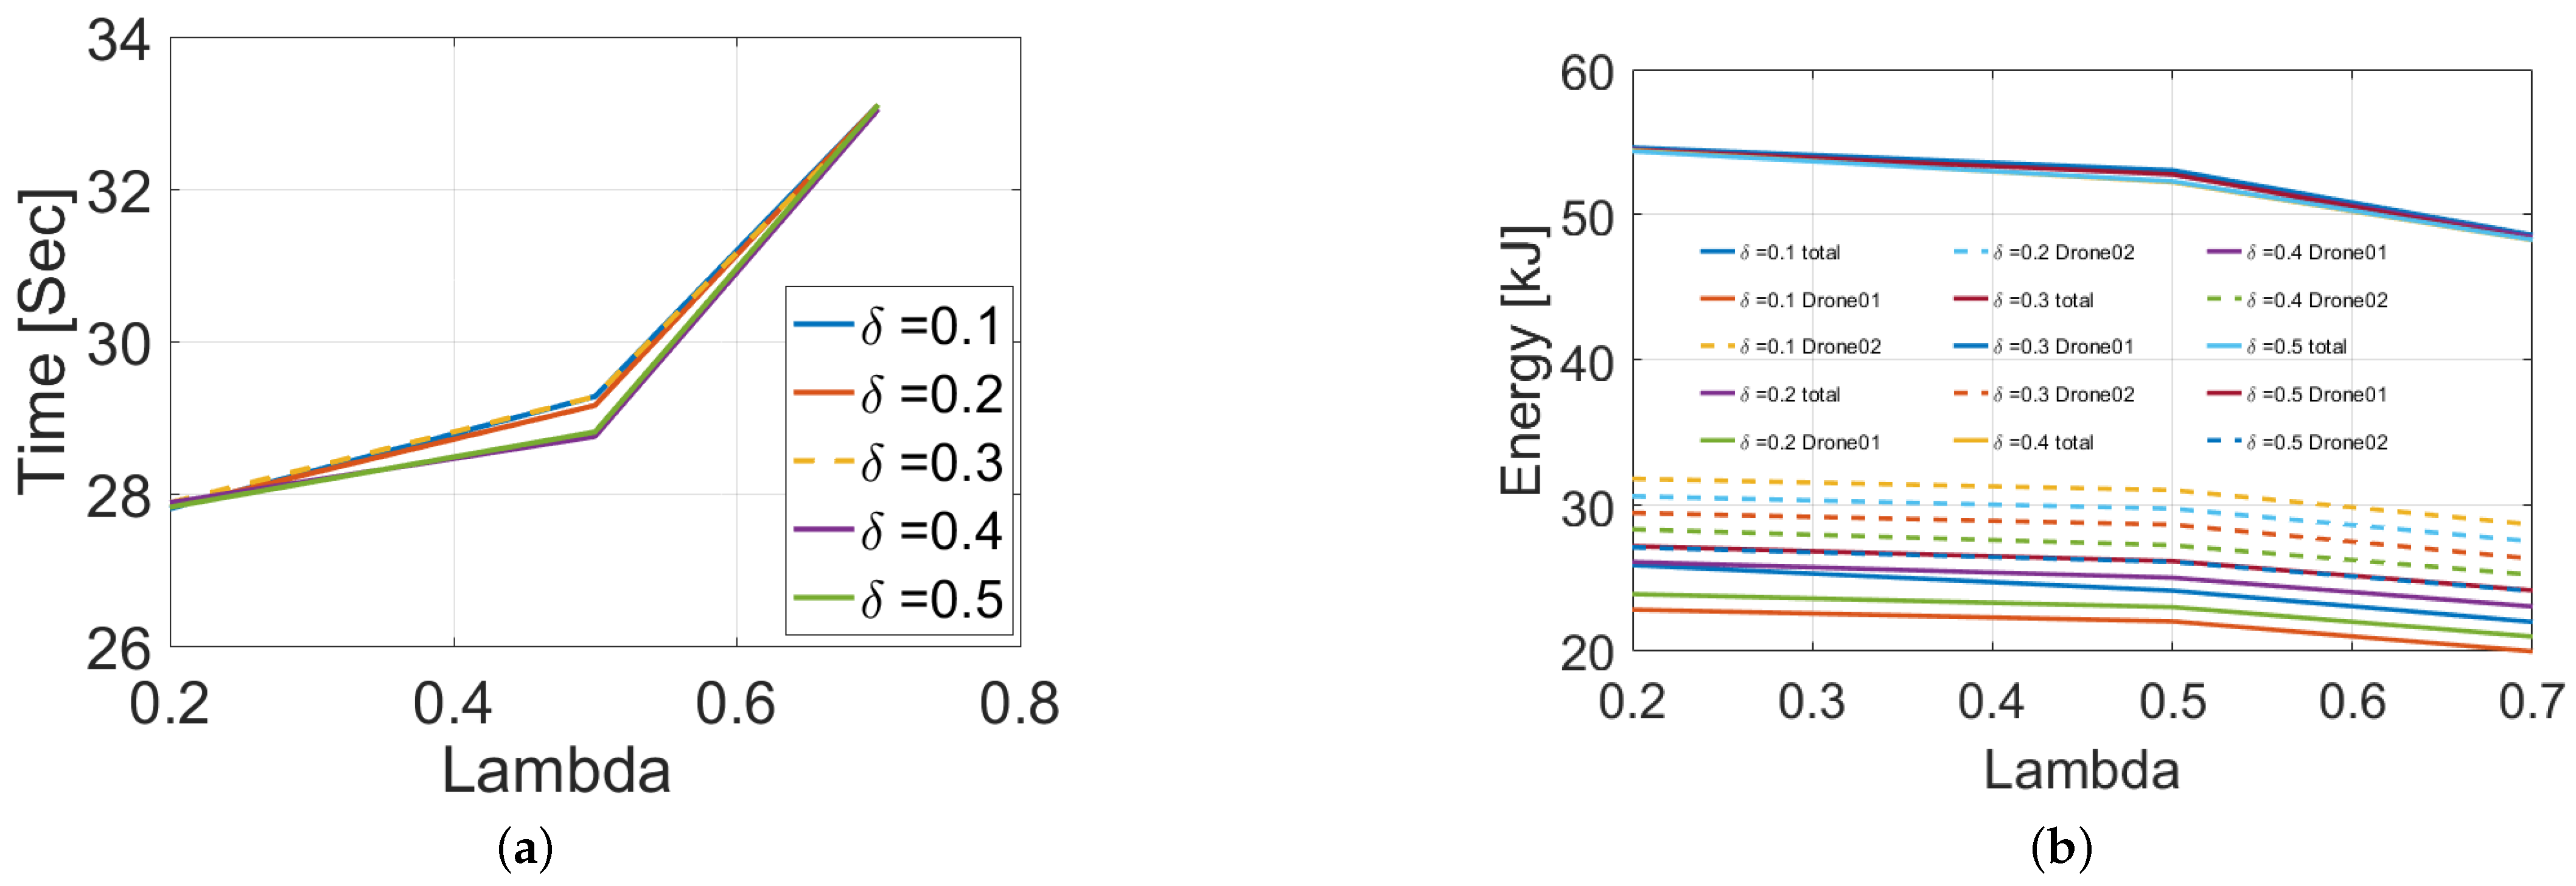
The plots of the numerical simulation are shown in Figure 7. The trajectory of the dual-hexrotor-payload system is shown in Figure 7a where it can be seen that λ = 0.2 results in the fastest travel, whereas λ = 0.7 results in the slowest travel. The velocity profiles of the dual-hexrotor-payload system are shown in Figure 7b, showing that λ = 0.2 results in higher velocities and λ = 0.7 results in lowest velocities. The respective pitch angles of both drones are plotted in Figure 7c which shows that the pitch angles are similar for both drones for a particular value of λ . It is also noticeable that λ = 0.2 results in higher pitch angles whereas λ = 0.7 results in lower pitch angles. The opposing energy consumption profiles and drag forces are also plotted in Figure 7. The results show that λ = 0.2 results in higher speeds, and higher pitch angles and thus, requires more thrust and energy, whereas λ = 0.7 results in slower speeds, and lower pitch angles and thus requires less thrust and energy. It is also noticeable that even though the lift force was unevenly distributed amongst the UAVs, the attitude angles are very similar for both drones for a particular value of λ . Numerical simulations were extended to verify if any discrepancy exists in the outcomes when various δ values are used. The results for the travel time and the total energy consumption and individual energy consumption values for various λ values are shown in Figure 8. It is shown in Figure 8 that although the load share ratio δ can change the energy consumption ratio of the two UAVs, the total energy consumption follows the same trend and the total energy consumption values are similar. This proves that the optimization algorithm can provide the required results, even when the load is unevenly shared between the two UAVs.

6. Software in the Loop Simulations

Apart from numerical modeling and testing in MATLAB, a more accurate mode of testing SITL (Software in the Loop Simulation) in the Gazebo (Physics Engine) environment was utilized. This ensures the compatibility of the firmware with our algorithm, along with better physical modeling of the drones such as the dynamics associated with the gripper/links and its effect on the base of the drones, and hence the coupling between the two drones is simulated better as compared to numerical modeling in MATLAB. Using a detailed model of a DJI F-550 drone, two drones: drone01, and drone02, and a payload were modeled in the Gazebo simulator. Each of the drone models had a flight stack mimicking the firmware of the actual autopilot. The SITL setup architecture is detailed in Figure 9, whereas the simulation snapshot is shown in Figure 10.
The payload is defined as a 0.586 kg rectangular box with a uniform mass of dimensions [2 m, 0.2 m, 0.2 m] as shown in Figure 10. The ROS (Robotics Operating System) Master, Gazebo simulator, two MAVROS nodes, two PX4 flight stack simulators, and the RTDP algorithm were running on the same computer and were connected by the ROS Master. The computer has a 2.4 GHz processor and 32 GB RAM.
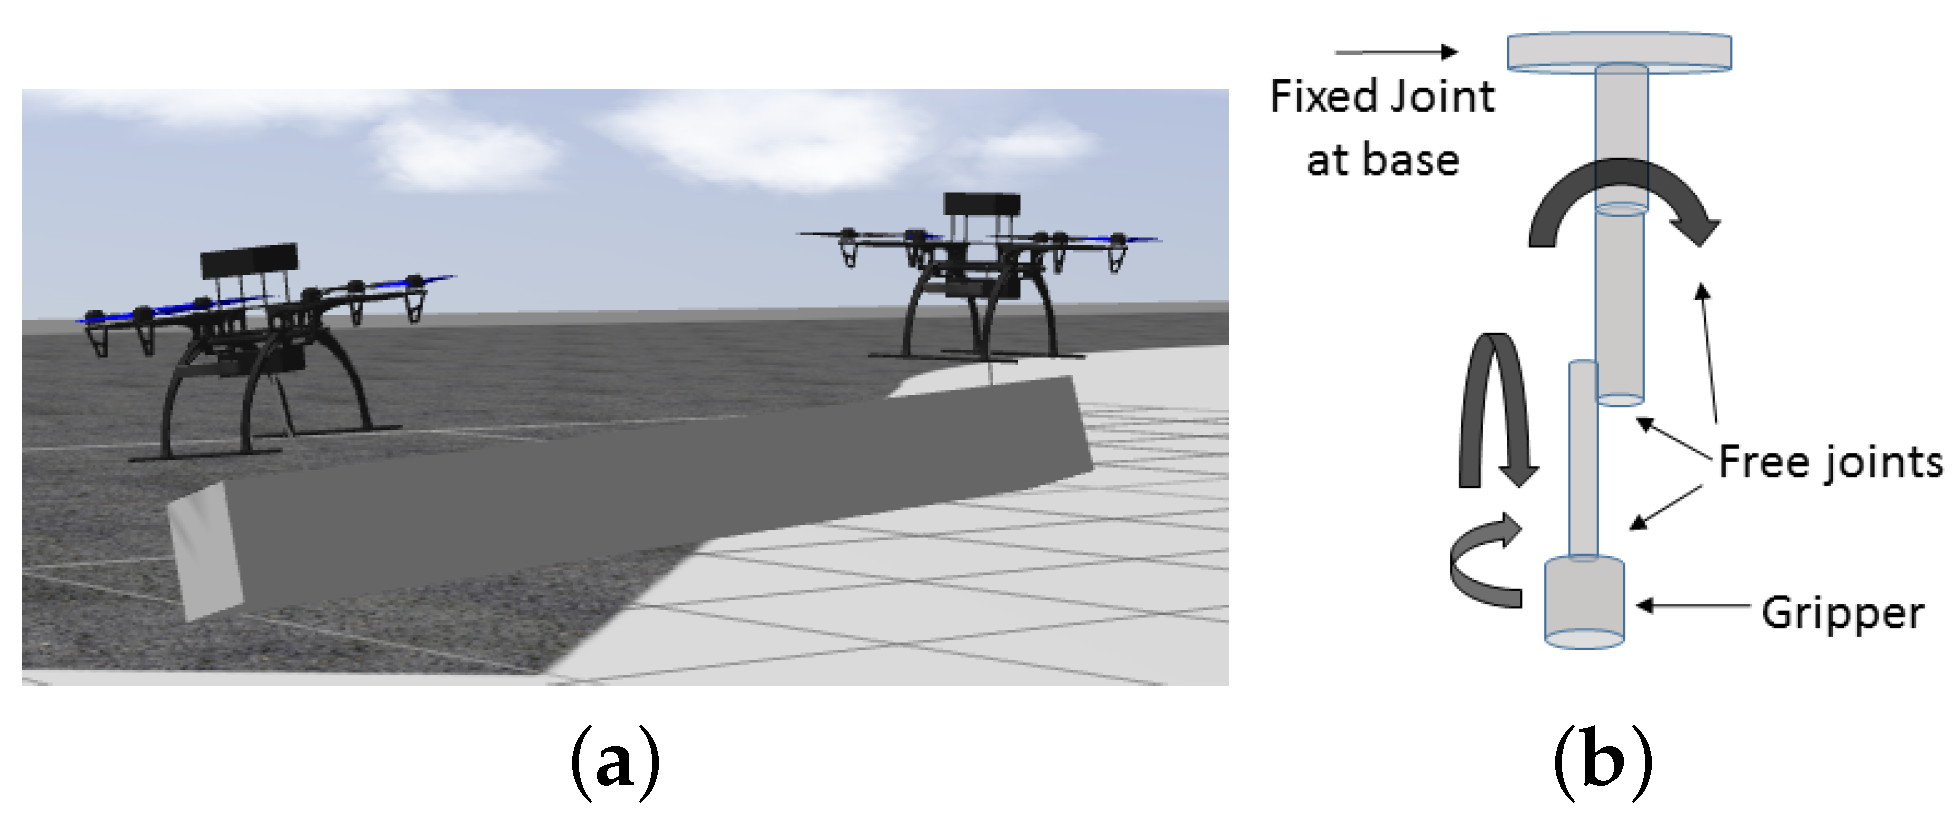
The flight-stack01 and flight-stack02 were communicating with drone01 and drone02 in the Gazebo simulator. The RTDP algorithm running in Simulink communicates with the two drone’s flight stacks via MAVROS protocol facilitated by MATLAB’s robotics toolbox. A free-joint multi-link arm was fixed at the base of each drone as shown in Figure 10. A gripper node was also running to attach and detach the payload with the grippers of both drones.

SITL Experiments

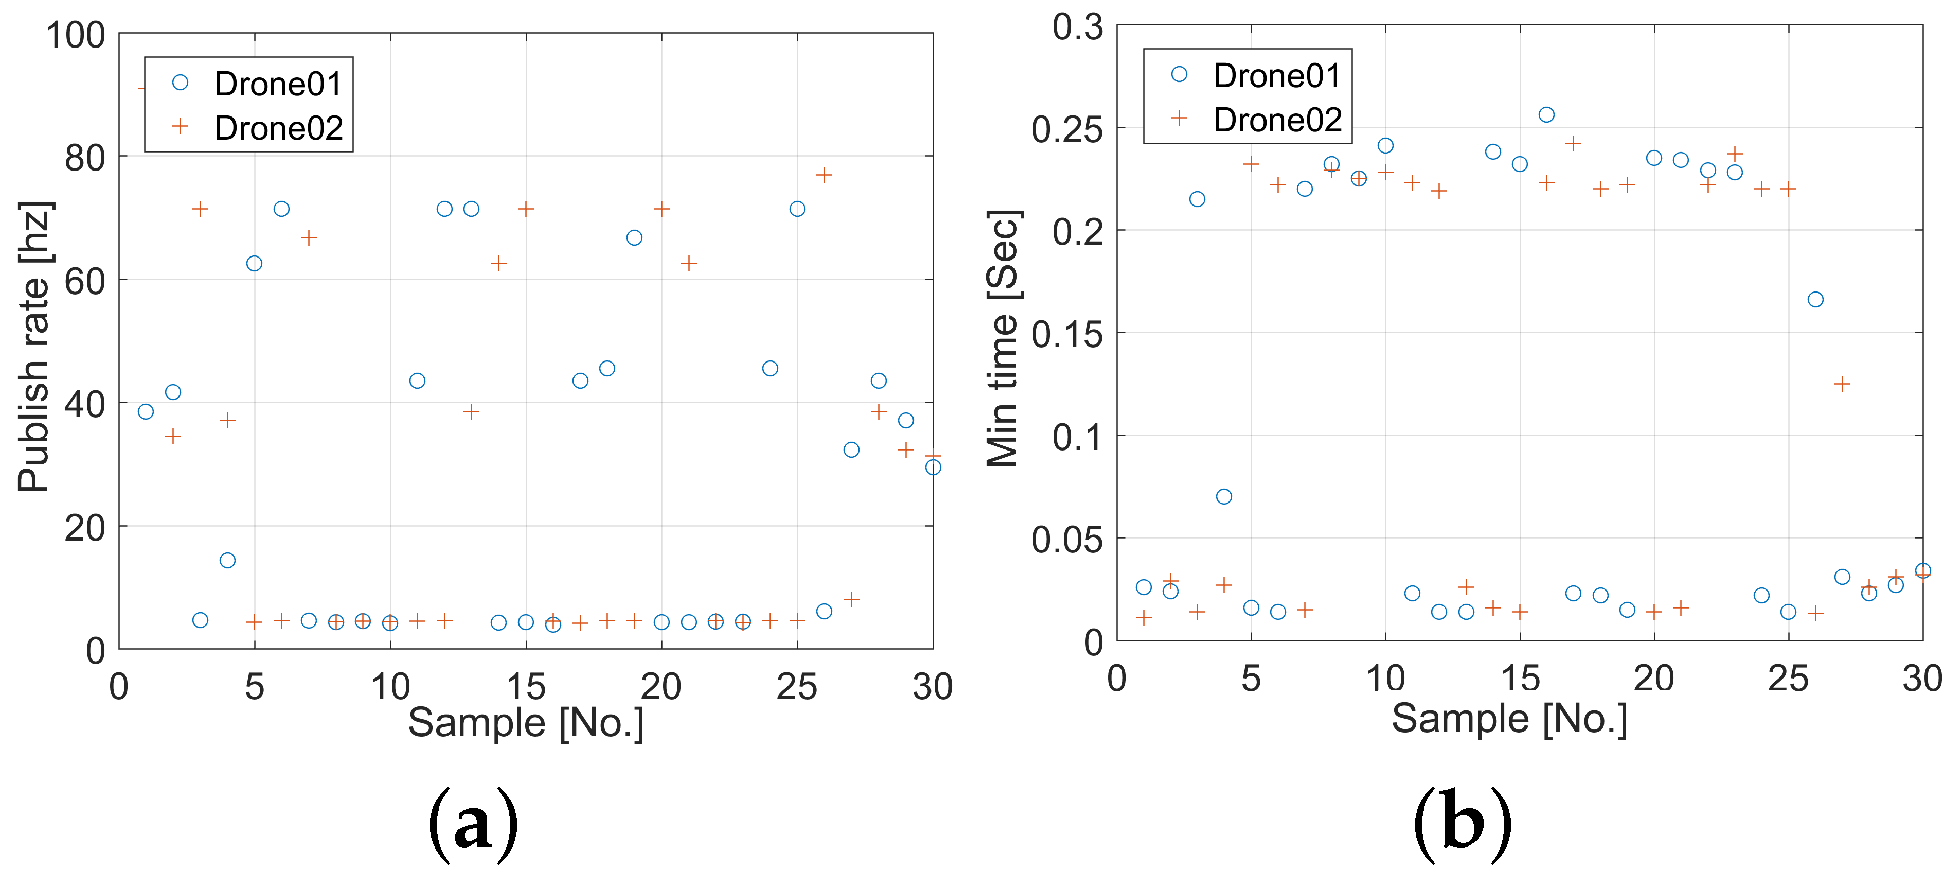
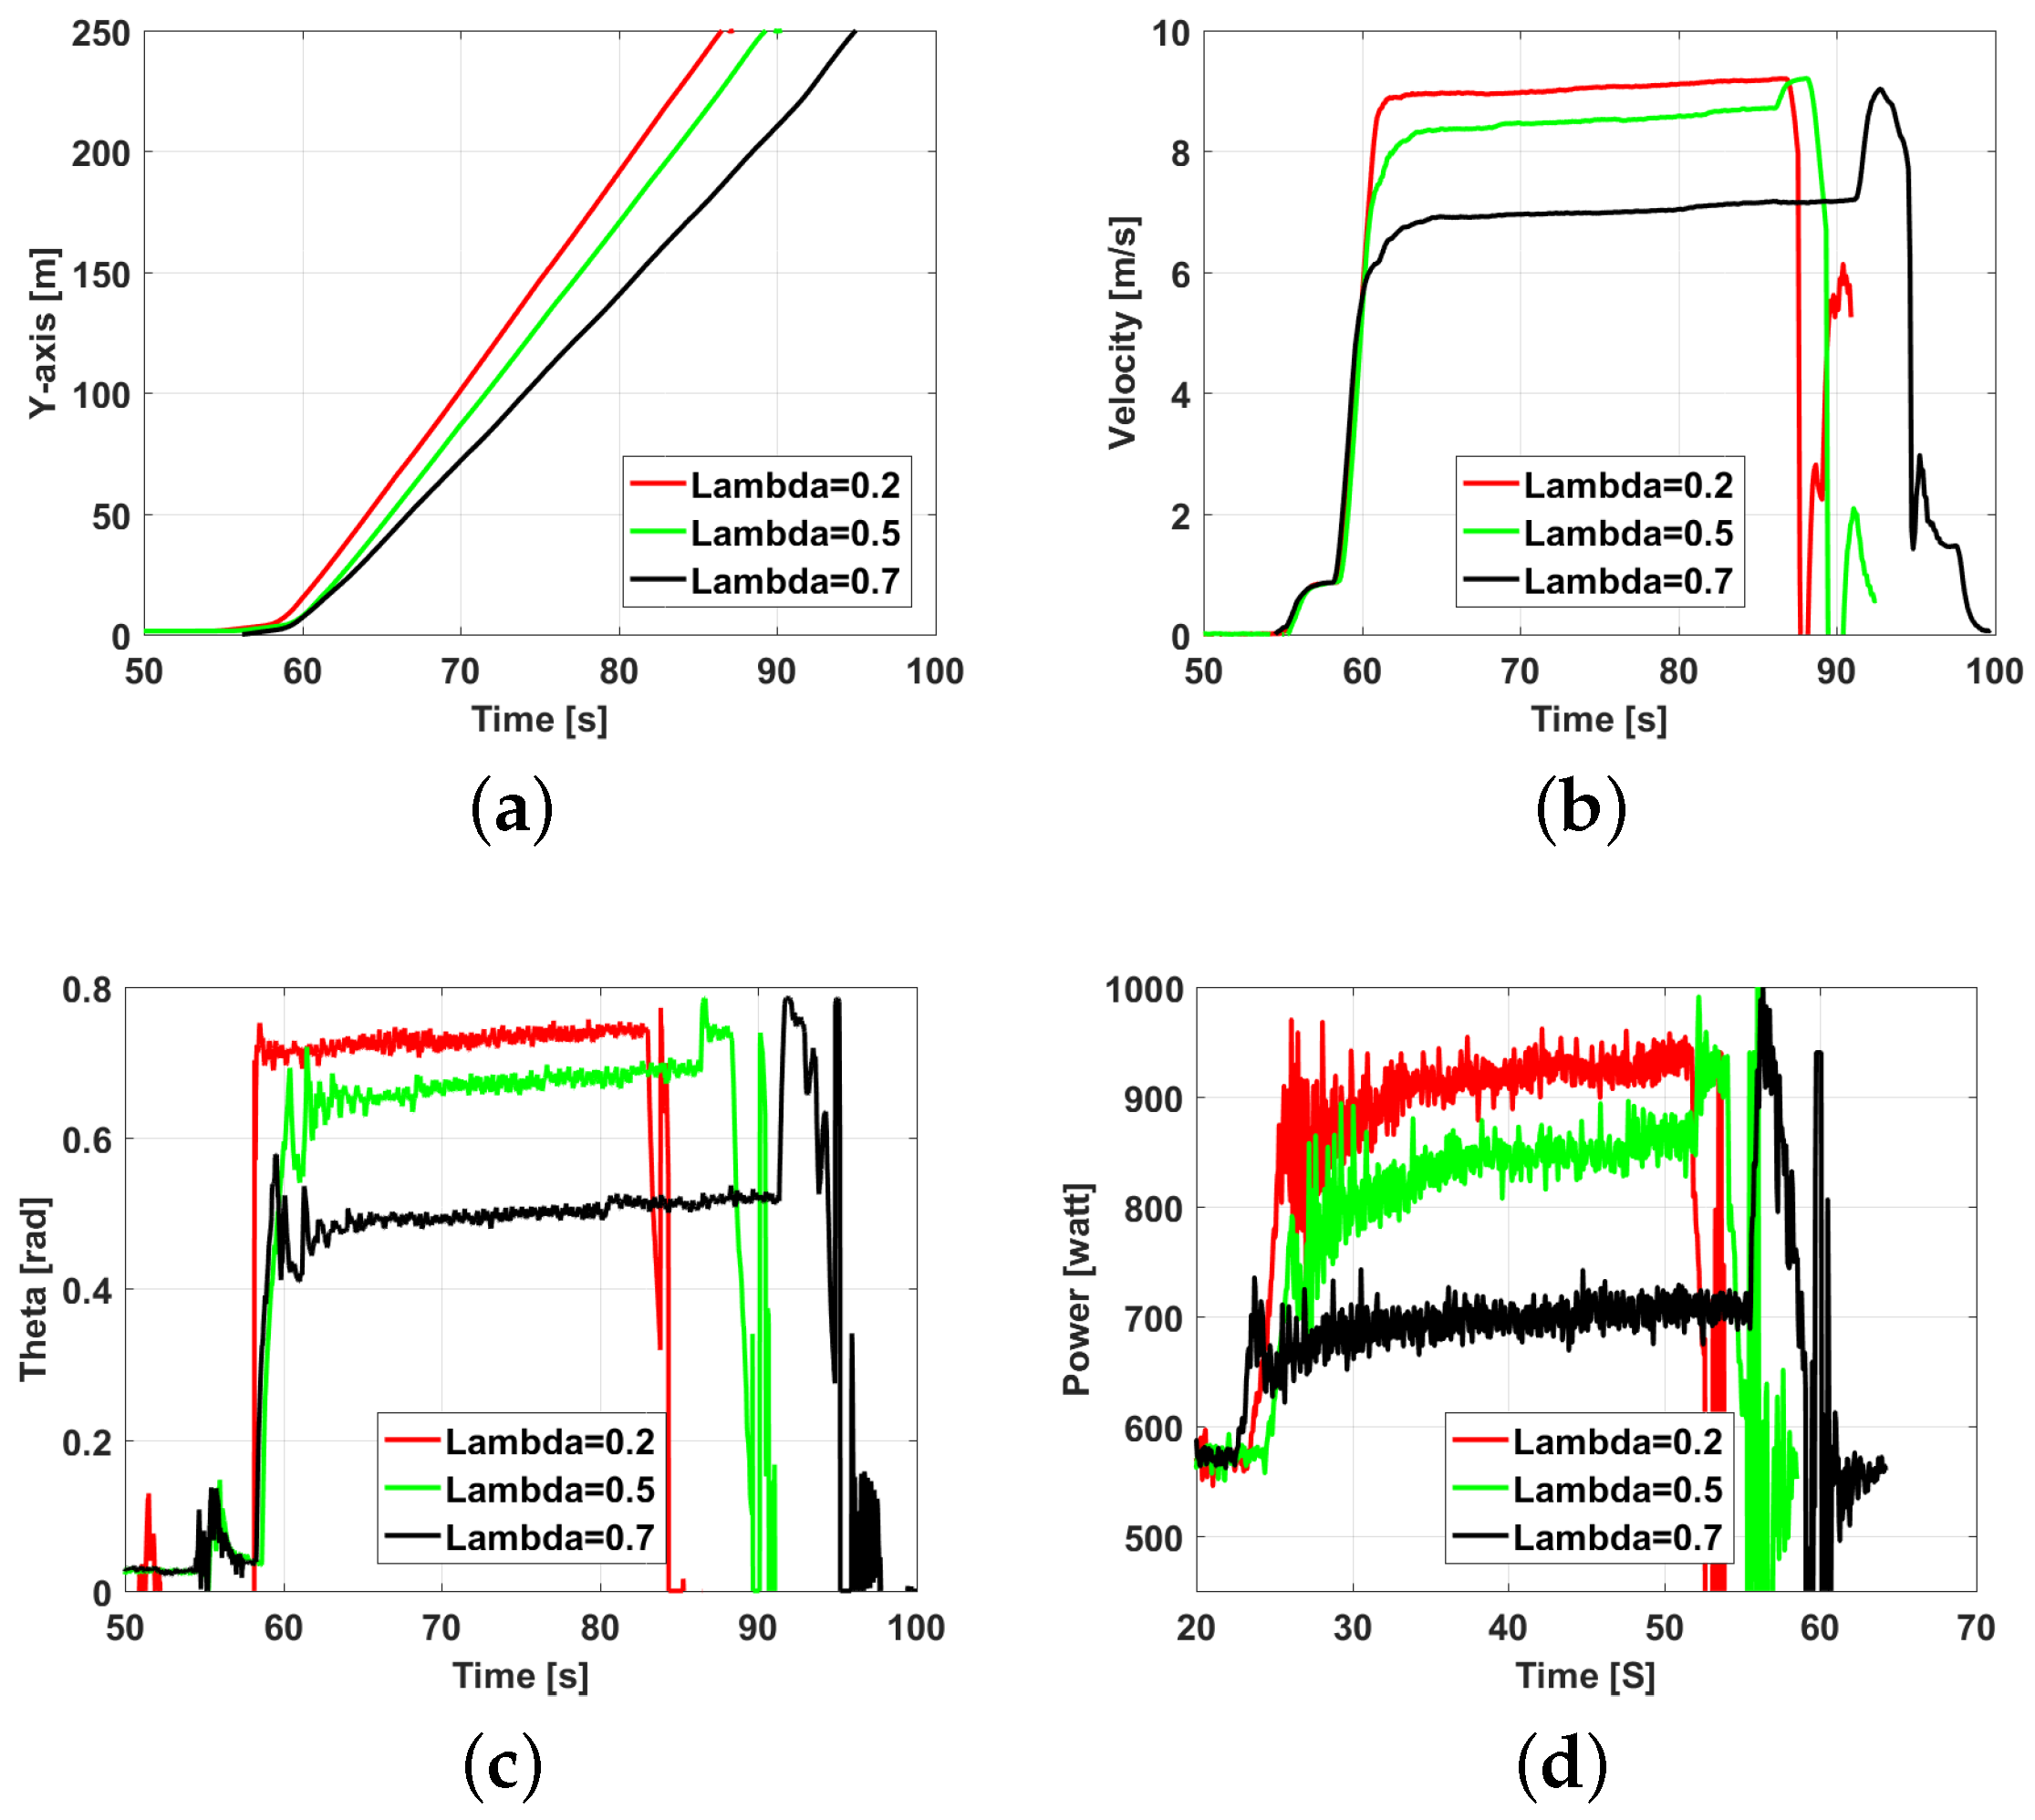
SITL simulation experiments were performed using the same parameters discussed in Section 5.3. The SITL experiments were performed following similar steps to those shown in Figure 3a. After taking off, both drones moved toward the payload location anchor points. After activating the gripper node, the coordinated motion strategy was used to get the dual-hexrotor-payload system to reach the transport altitude. A velocity interval of 0.1 m/s was used. The publish rates of the velocity command topics for drone01 and drone02 during the joint-aerial-payload transport in SITL simulations were observed and plotted in Figure 11. The results in Figure 11 also reflect upon the real-time behavior of the algorithm. The minimum allowed publishing rate is 2 Hz in the firmware settings, where a rate below 2 Hz activates the fail-safe mode within the firmware. The frequency of publishing is very high when the DP sweep is not triggered reaching 70 Hz. The lowest publishing frequency is 4 Hz, above the minimum 2 Hz. The simulation results are plotted in Figure 12. The SITL simulation shows good agreement with the numerical simulation and conclusions.

7. Hardware Experiments

Apart from SITL experiments, some experiments were also performed in the lab. Experiments in the lab however were limited to the lab space as compared to the SITL and numerical experiments. The experiments were performed using two DJI-F550s each fitted with an onboard computer connected with the Pixhawk autopilot via MAVROS protocol. The Pixhawk autopilot was using PX4 firmware, and MAVLINK was used as a bridge between onboard computer and the autopilot. A gripper consisted of a 3D-printed low-weight triangular frame with a commercially available electro-permanent magnet attached to the base of each hexrotor. Six cables were attached to the three corners of the triangular frame and the edge of the three hex-rotor motor arms, in a manner similar to Gough-Stewart platform. This gripper design was chosen to achieve cable-like compliance with fewer oscillations of the gripper during flight.
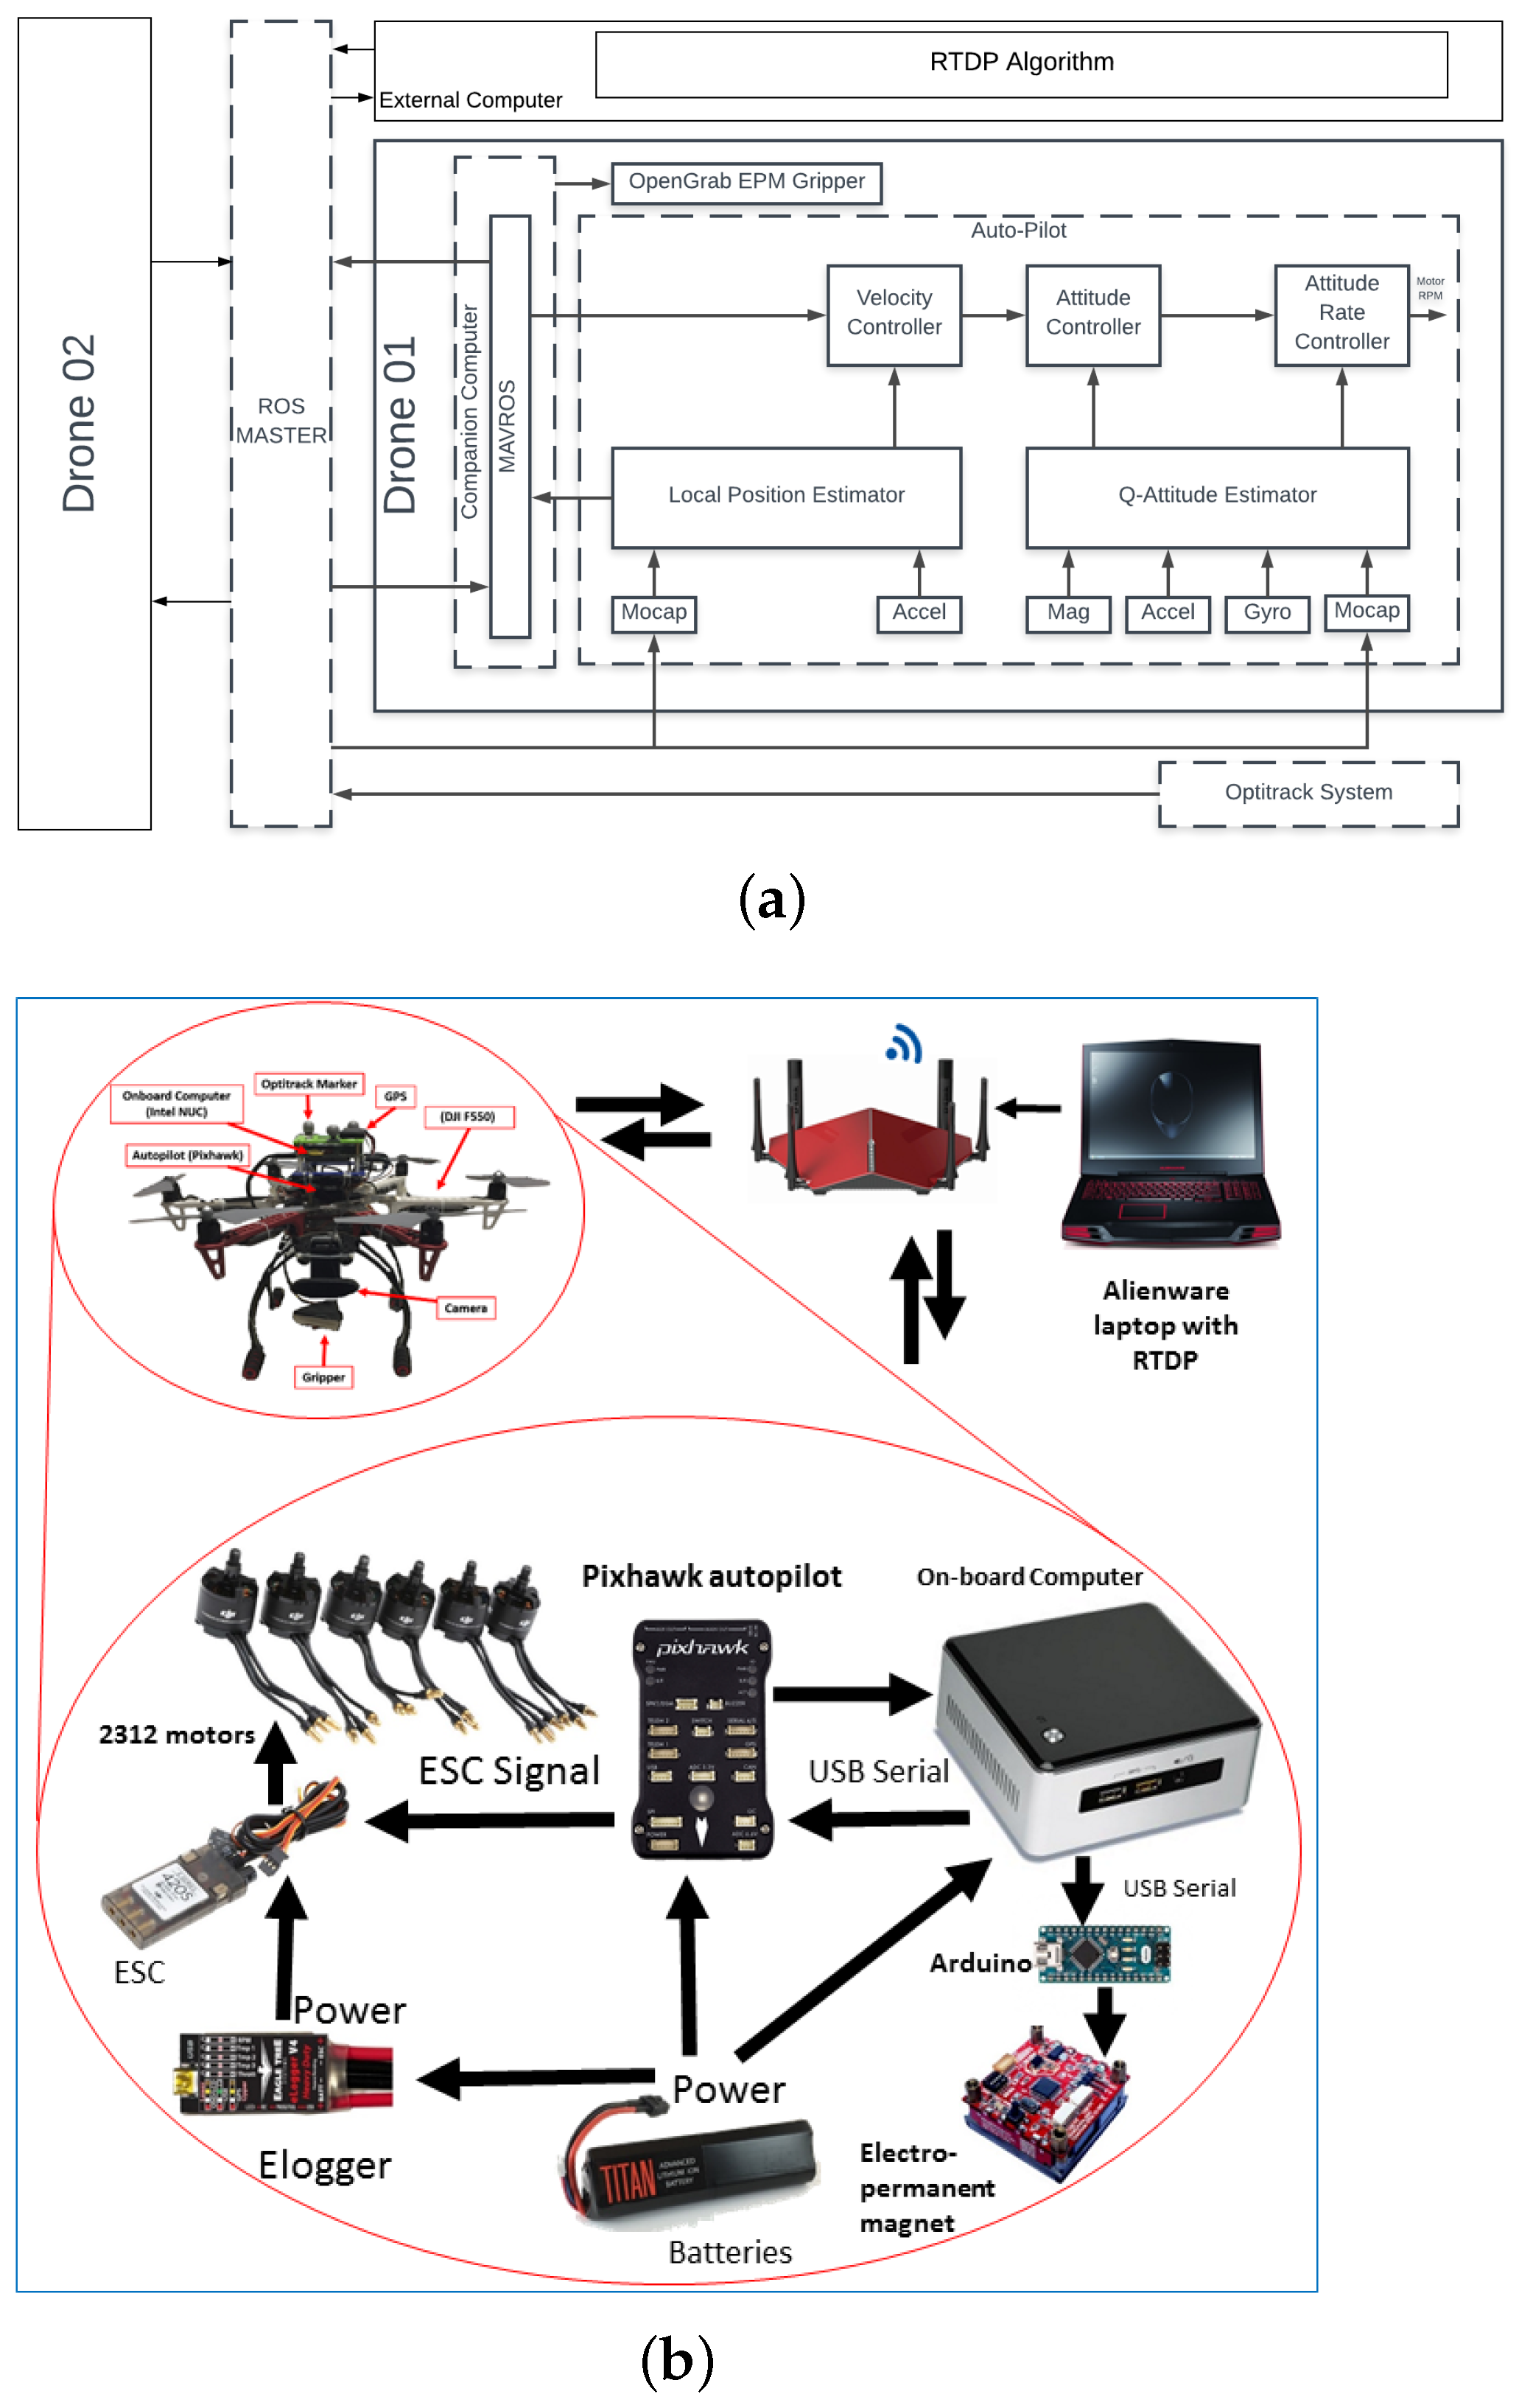
The magnetic gripper is connected to the drone computer’s USB port via arduino nano. The magnetic gripper is activated and de-activated by the node running in each drone’s computer. This allows for the safe detachment of the payload at the drop location. A voltage and current sensor called Elogger V4 is connected in series between the ESCs (Electronic speed controllers) and the batteries of each hexrotor while bypassing the power supply of the on-board computer as shown in Figure 13b. MAVROS was running on the on-board computer of each hexrotor to interface the auto-pilot with the ROS MASTER. A motion capture system was used for position estimation. The algorithm was running on the central computer, communicating with the drones using ROS framework via the WiFi network.

7.1. Base Case Experiment

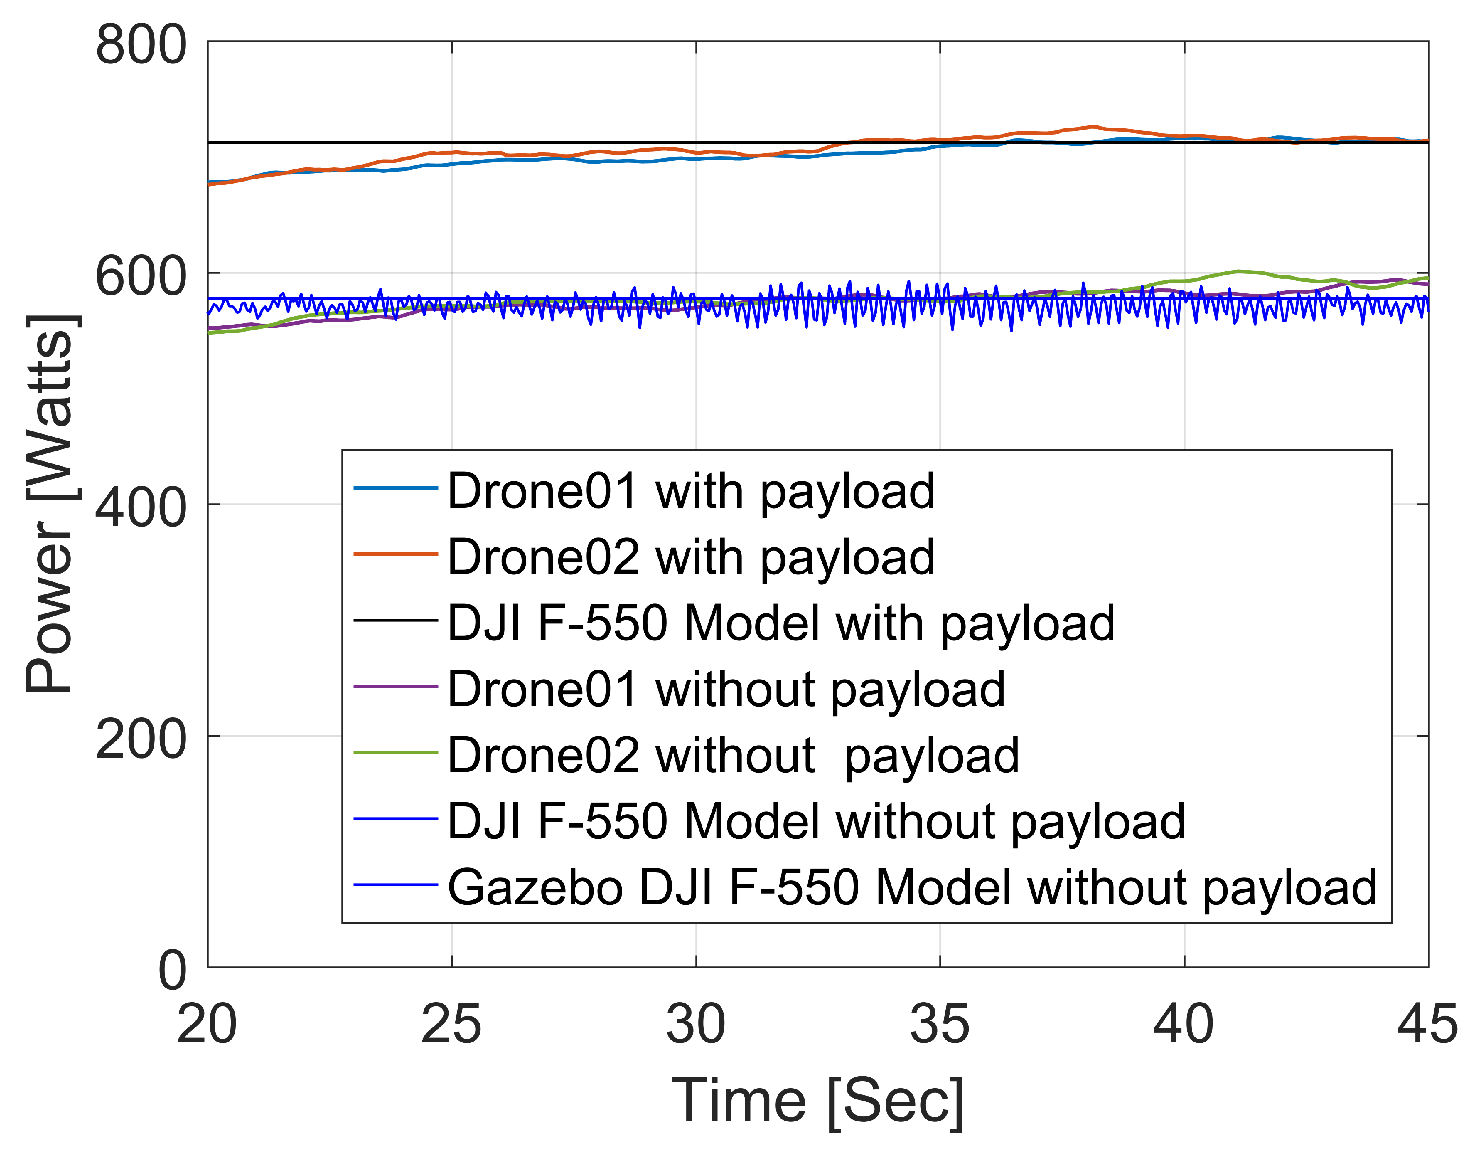
A baseline experiment was performed, where drone01 and drone02 (similar to those modeled in Gazebo) were hovering at a fixed altitude set-point. Two cases with and without payload were tested in simulation and experiments. Eloggers were used to record the energy consumption data in each drone. The resulting energy consumption of drones in hover, with and without jointly carrying payload is compared by plotting in Figure 14. The results show the effectiveness of the energy consumption model.

7.2. Experiments for Dual-UAV RTDP Transportation

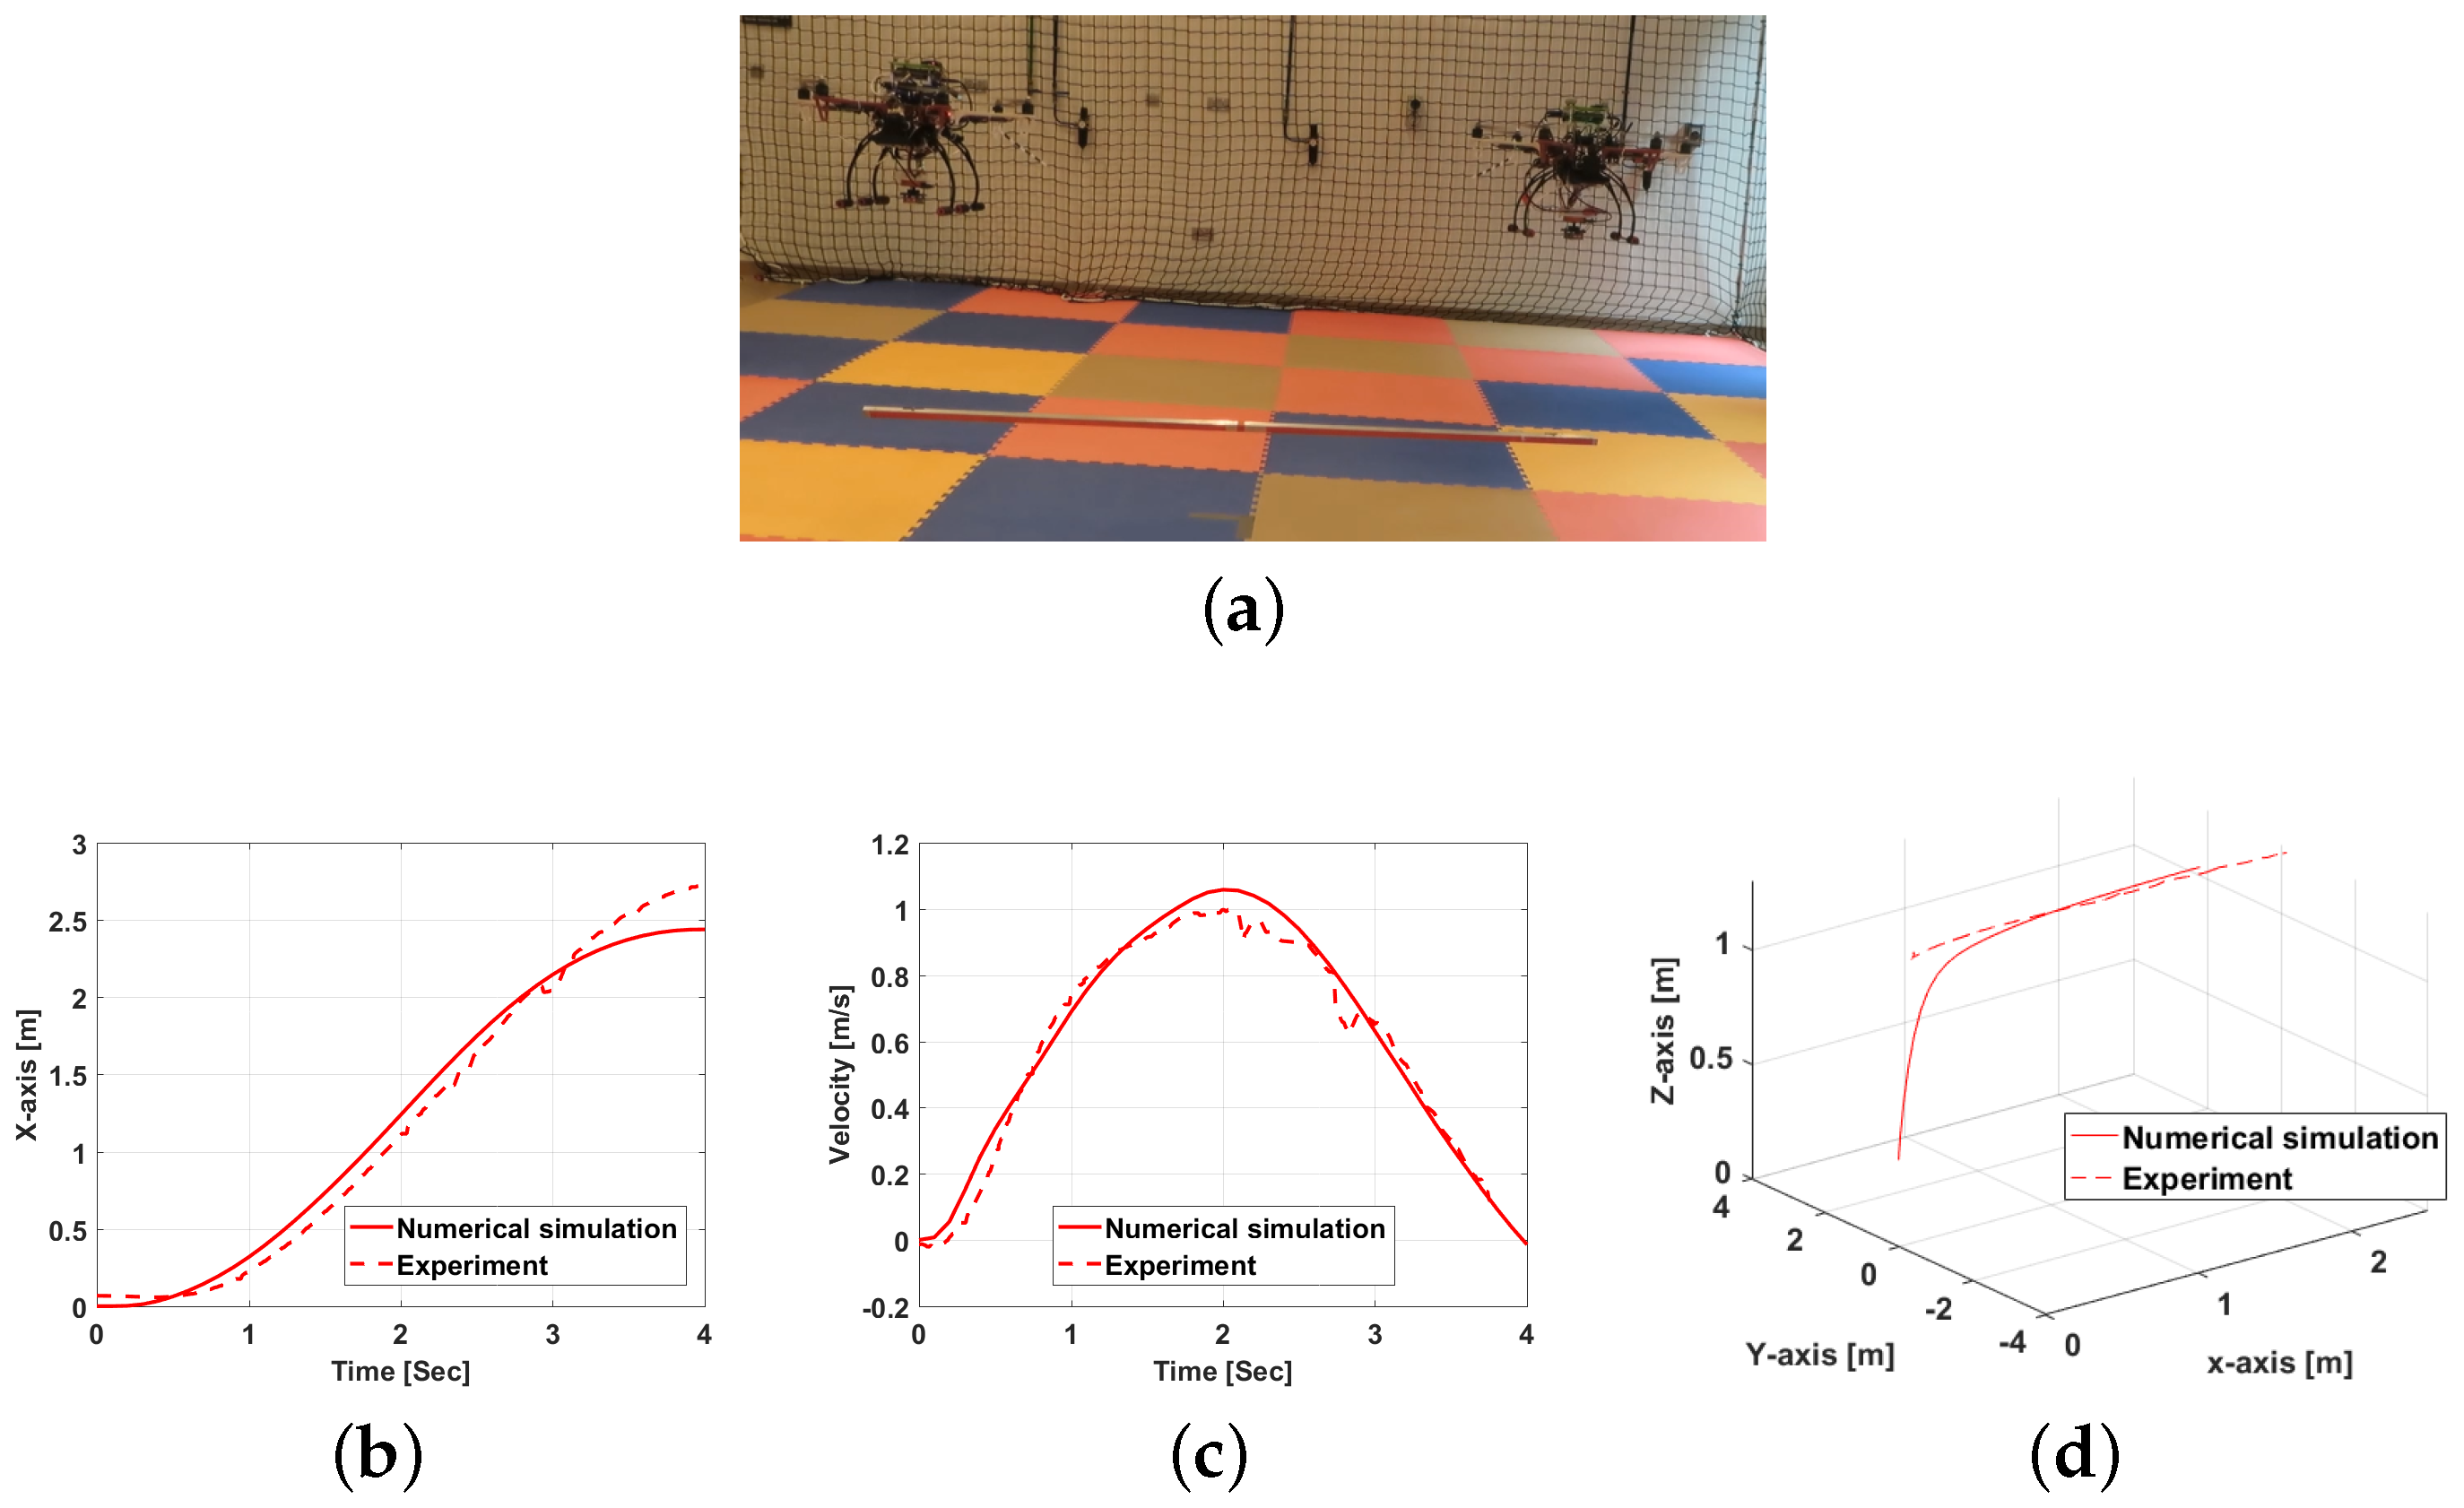
A hardware experiment was performed in the lab to transport a payload weighing 0.5 kg, from point A [ 0 , 0 , 1.2 ] to point B [ 0 , 2.5 , 1.2 ] using the RTDP algorithm developed in this study. The drone01 and drone02 jointly carried the payload as shown in Figure 15a. The video of the experiment is available online at [34]. Dual UAV transport requires autonomous takeoff since a manual takeoff would require two pilots with good synchronization, which is difficult to achieve. Autonomous takeoff was incorporated in a Simulink-based algorithm using a position controller which first ensures that the UAVs and payload have first reached the transportation altitude and then the RTDP algorithm is activated.
The simulation model developed in Simulink as described in Section 5, was also used to run the simulation with the same drones and parameters. The results from the numerical simulation and the hardware tests were compared together and were found to be similar as shown in Figure 15. The test successfully shows that the RTDP algorithm can be used to jointly transport a payload from one point to another using two drones.
The parameters used during the experiment were: velocity interval of 0.1 m/s, was used with distance intervals of 0.1 m, and a total of 10 distance intervals were considered in one horizon length. A 0.7 λ was considered with an equal load sharing factor 0.5 δ was used. The payload was a metallic rod with a square cross-section of length 2 m, and 0.2 m width and depth. The payload was connected to the magnetic grippers using a cable. One end of the cable was tied to the payload and the other end was tied to a metallic strip that attaches to the magnetic gripper.
Further tests were conducted to compare the effects of changing the factor λ = 0.7 , 0.5 , 0.2 while keeping parameters the same as above. The test results can be seen in Figure 16, as expected the dual-UAV-payload system, reaches the destination quickest when λ = 0.2 and slowest when λ = 0.7 .

8. Conclusions

This paper presented for the first time a real-time dynamic programming (RTDP) approach used to jointly transport a payload using two UAVs while optimizing the payload transport in real-time. The dual-UAV-payload system model was simplified and used to formulate the cost function. The algorithm requires the minimization of the cost function to achieve either a reduction in the total energy consumed, or to reduce the journey time. The switching between the two optimization methods is controlled by the λ factor. Based on the best of authors knowledge this is the first time dual-UAV joint payload transportation is performed while optimizing the journey in the lateral direction, along with distributing the load between the two UAVs. A factor δ is introduced in the cost function calculation to incorporate the effects of the distribution of lift between the two UAVs. A detailed numerical model was developed to test the algorithm. The proposed methods were initially tested numerically, followed by Software in the loop testing in a Gazebo simulation environment to confirm the compatibility of the algorithm in a representative environment. After the simulations, real-world experiments were conducted in the lab. It was found in this study that by increasing the value of λ the energy consumption decreases, while the travel time increases. The factor λ can be selected based on the nature of the UAV’s mission. The main limitation of this approach is the discretization of the path in a straight line from point A to B, without considering complex paths and obstacles. Future extension of this work would include, RTDP-based obstacle-free path generation for dual-UAV systems. Point A and point B will be extracted from this path and velocity optimization will be coupled with the generated path. It is also important to test the high-speed forward flights for dual-UAV-payload system experimentally.

Author Contributions

T.T., D.G. and Y.Z. supervised the design of experiments and algorithm development; A.M. developed the algorithm, developed the numerical and SITL model and performed the experiments; T.T. provided assistance with lab experiments and SITL simulations; Y.Z. supervised the Simulink based numerical model; A.M. wrote the paper, while T.T., D.G. and Y.Z. revised the manuscript. All authors have read and agreed to the published version of the manuscript.

Funding

This research was funded by the Khalifa University of Science and Technology under Award No. RC1-2018-KUCARS.

Data Availability Statement

No special data was collected to conduct this study.

Acknowledgments

Special thanks to Khalifa University and the lab staff for the help.

Conflicts of Interest

The authors declare no conflict of interest.

Abbreviations

The following abbreviations are used in this manuscript:
CoGCenter of gravity
UAVUnmanned aerial vehicles
SITLSoftware in the loop
RTDPReal-time dynamic programming
EPMElectro Permanent Magnet
ESCElectronic speed controller

References

  1. Kim, S.; Seo, H.; Choi, S.; Kim, H.J. Vision-guided aerial manipulation using a multirotor with a robotic arm. IEEE/ASME Trans. Mechatron. 2016, 21, 1912–1923. [Google Scholar] [CrossRef]
  2. Mellinger, D.; Shomin, M.; Michael, N.; Kumar, V. Cooperative Grasping and Transport using Multiple Quadrotors. In Distributed Autonomous Robotic Systems: The 10th International Symposium; Springer: Berlin/Heidelberg, Germany, 2015; Volume 83, pp. 545–558. [Google Scholar] [CrossRef]
  3. Maza, I.; Kondak, K.; Bernard, M.; Ollero, A. Multi-UAV cooperation and control for load transportation and deployment. J. Intell. Robot. Syst. Theory Appl. 2010, 57, 417–449. [Google Scholar] [CrossRef]
  4. Fink, J.; Michael, N.; Kim, S.; Kumar, V. Planning and control for cooperative manipulation and transportation with aerial robots. Springer Tracts Adv. Robot. 2011, 70, 643–659. [Google Scholar] [CrossRef]
  5. Michael, N.; Fink, J.; Kumar, V. Cooperative manipulation and transportation with aerial robots. Auton. Robot. 2010, 30, 73–86. [Google Scholar] [CrossRef] [Green Version]
  6. Jiang, Q.; Kumar, V. The inverse kinematics of cooperative transport with multiple aerial robots. IEEE Trans. Robot. 2013, 29, 136–145. [Google Scholar] [CrossRef]
  7. Gassner, M.; Cieslewski, T.; Scaramuzza, D. Dynamic Collaboration without Communication: Vision-Based Cable-Suspended Load Transport with Two Quadrotors. In Proceedings of the IEEE International Conference on Robotics and Automation (ICRA), Singapore, 29 May–3 June 2017; pp. 5196–5202. [Google Scholar] [CrossRef] [Green Version]
  8. Tagliabue, A.; Kamel, M.; Verling, S.; Siegwart, R.; Nieto, J. Collaborative transportation using MAVs via passive force control. In Proceedings of the 2017 IEEE International Conference on Robotics and Automation (ICRA), Singapore, 29 May–3 June 2017; pp. 5766–5773. [Google Scholar] [CrossRef]
  9. Zhang, X.; Zhang, F.; Huang, P.; Gao, J.; Yu, H.; Pei, C.; Zhang, Y. Self-triggered based coordinate control with low communication for tethered multi-UAV collaborative transportation. IEEE Robot. Autom. Lett. 2021, 6, 1559–1566. [Google Scholar] [CrossRef]
  10. Lee, H.; Kim, H.; Kim, H.J. Planning and control for collision-free cooperative aerial transportation. IEEE Trans. Autom. Sci. Eng. 2016, 15, 189–201. [Google Scholar] [CrossRef]
  11. Hegde, A.; Ghose, D. Multi-UAV collaborative transportation of payloads with obstacle avoidance. IEEE Control Syst. Lett. 2021, 6, 926–931. [Google Scholar] [CrossRef]
  12. Webb, K.; Rogers, J. Adaptive Control Design for Multi-UAV Cooperative Lift Systems. J. Aircr. 2021, 58, 1302–1322. [Google Scholar] [CrossRef]
  13. Doakhan, M.; Kabganian, M.; Azimi, A. Cooperative Payload Transportation with Flexible Formation Control of Multi-Quadrotors. Available at SSRN 4222094. Available online: https://papers.ssrn.com/sol3/papers.cfm?abstract_id=4222094 (accessed on 31 July 2019).
  14. Liu, Y.; Zhang, F.; Huang, P.; Zhang, X. Analysis, planning and control for cooperative transportation of tethered multi-rotor UAVs. Aerosp. Sci. Technol. 2021, 113, 106673. [Google Scholar] [CrossRef]
  15. Mohiuddin, A.; Tarek, T.; Zweiri, Y.; Dongming, G. Energy distribution in Dual-UAV collaborative transportation through load sharing. ASME J. Mech. Robot. 2020, 12, 1–14. [Google Scholar] [CrossRef]
  16. Dai, X.; Quan, Q.; Ren, J.; Cai, K.Y. Efficiency Optimization and Component Selection for Propulsion Systems of Electric Multicopters. IEEE Trans. Ind. Electron. 2018, 66, 7800–7809. [Google Scholar] [CrossRef]
  17. Masroor, R.; Naeem, M.; Ejaz, W. Resource management in UAV-assisted wireless networks: An optimization perspective. Ad Hoc Netw. 2021, 121, 102596. [Google Scholar] [CrossRef]
  18. Sharma, B.; Srivastava, G.; Lin, J.C.W. A bidirectional congestion control transport protocol for the internet of drones. Comput. Commun. 2020, 153, 102–116. [Google Scholar] [CrossRef]
  19. Sajid, M.; Mittal, H.; Pare, S.; Prasad, M. Routing and scheduling optimization for UAV assisted delivery system: A hybrid approach. Appl. Soft Comput. 2022, 126, 109225. [Google Scholar] [CrossRef]
  20. Sharma, B.; Obaidat, M.S.; Sharma, V.; Hsiao, K.F. Routing and collision avoidance techniques for unmanned aerial vehicles: Analysis, optimal solutions, and future directions. Int. J. Commun. Syst. 2020, 33, e4628. [Google Scholar] [CrossRef]
  21. Stolaroff, J.K.; Samaras, C.; O’Neill, E.R.; Lubers, A.; Mitchell, A.S.; Ceperley, D. Energy use and life cycle greenhouse gas emissions of drones for commercial package delivery. Nat. Commun. 2018, 9, 409. [Google Scholar] [CrossRef] [Green Version]
  22. Hegde, A.; Ghose, D. Multi-Quadrotor Distributed Load Transportation for Autonomous Agriculture Spraying Operations. J. Guid. Control. Dyn. 2022, 45, 944–951. [Google Scholar] [CrossRef]
  23. Gimenez, J.; Gandolfo, D.C.; Salinas, L.R.; Rosales, C.; Carelli, R. Multi-objective control for cooperative payload transport with rotorcraft UAVs. ISA Trans. 2018, 80, 491–502. [Google Scholar] [CrossRef]
  24. Iglesias, R.B.; Regueiro, C.V.; Barro, S.; Rodriguez, G.; Nieto, A. Improved Control of DLO Transportation by a team of quadrotors. In Biomedical Applications Based on Natural and Artificial Computing, Proceedings of the International Work-Conference on the Interplay between Natural and Artificial Computation, IWINAC 2017, Corunna, Spain, 19-23 June 2017; Springer International Publishing: New York, NY, USA, 2017; Volume 10338, pp. 345–354. [Google Scholar] [CrossRef]
  25. Mohiuddin, A.; Tarek, T.; Zweiri, Y.; Dongming, G. UAV payload transportation via RTDP based optimized velocity profiles. Energies 2019, 12, 3049. [Google Scholar] [CrossRef] [Green Version]
  26. Raza, W.; Osman, A.; Ferrini, F.; Natale, F.D. Energy-Efficient Inference on the Edge Exploiting TinyML Capabilities for UAVs. Drones 2021, 5, 127. [Google Scholar] [CrossRef]
  27. Lee, H.; Kim, H.J. Constraint-Based Cooperative Control of Multiple Aerial Manipulators for Handling an Unknown Payload. IEEE Trans. Ind. Inform. 2017, 13, 2780–2790. [Google Scholar] [CrossRef]
  28. Horyna, J.; Baca, T.; Saska, M. Autonomous collaborative transport of a beam-type payload by a pair of multi-rotor helicopters. In Proceedings of the 2021 International Conference on Unmanned Aircraft Systems (ICUAS), Athens, Greece, 15–18 June 2021; pp. 1139–1147. [Google Scholar]
  29. Aydin, B.; Selvi, E.; Tao, J.; Starek, M.J. Use of Fire-Extinguishing Balls for a Conceptual System of Drone-Assisted Wildfire Fighting. Drones 2019, 3, 17. [Google Scholar] [CrossRef] [Green Version]
  30. Natesan, S.; Armenakis, C.; Benari, G.; Lee, R. Use of UAV-Borne Spectrometer for Land Cover Classification. Drones 2018, 2, 16. [Google Scholar] [CrossRef] [Green Version]
  31. del Cerro, J.; Cruz Ulloa, C.; Barrientos, A.; de León Rivas, J. Unmanned Aerial Vehicles in Agriculture: A Survey. Agronomy 2021, 11, 203. [Google Scholar] [CrossRef]
  32. Guo, Y.; Jiang, B.; Zhang, Y. A novel robust attitude control for quadrotor aircraft subject to actuator faults and wind gusts. IEEE/CAA J. Autom. Sin. 2017, 5, 292–300. [Google Scholar] [CrossRef]
  33. Peng, C.; Bai, Y.; Gong, X.; Gao, Q.; Zhao, C.; Tian, Y. Modeling and robust backstepping sliding mode control with Adaptive RBFNN for a novel coaxial eight-rotor UAV. IEEE/CAA J. Autom. Sin. 2015, 2, 56–64. [Google Scholar]
  34. Abdullah Mohiuddin. Dual UAV Payload Transportation Using RTDP Based Optimized Velocity Profiles. Available online: https://youtu.be/JjPNZcLU7RU (accessed on 31 July 2019).
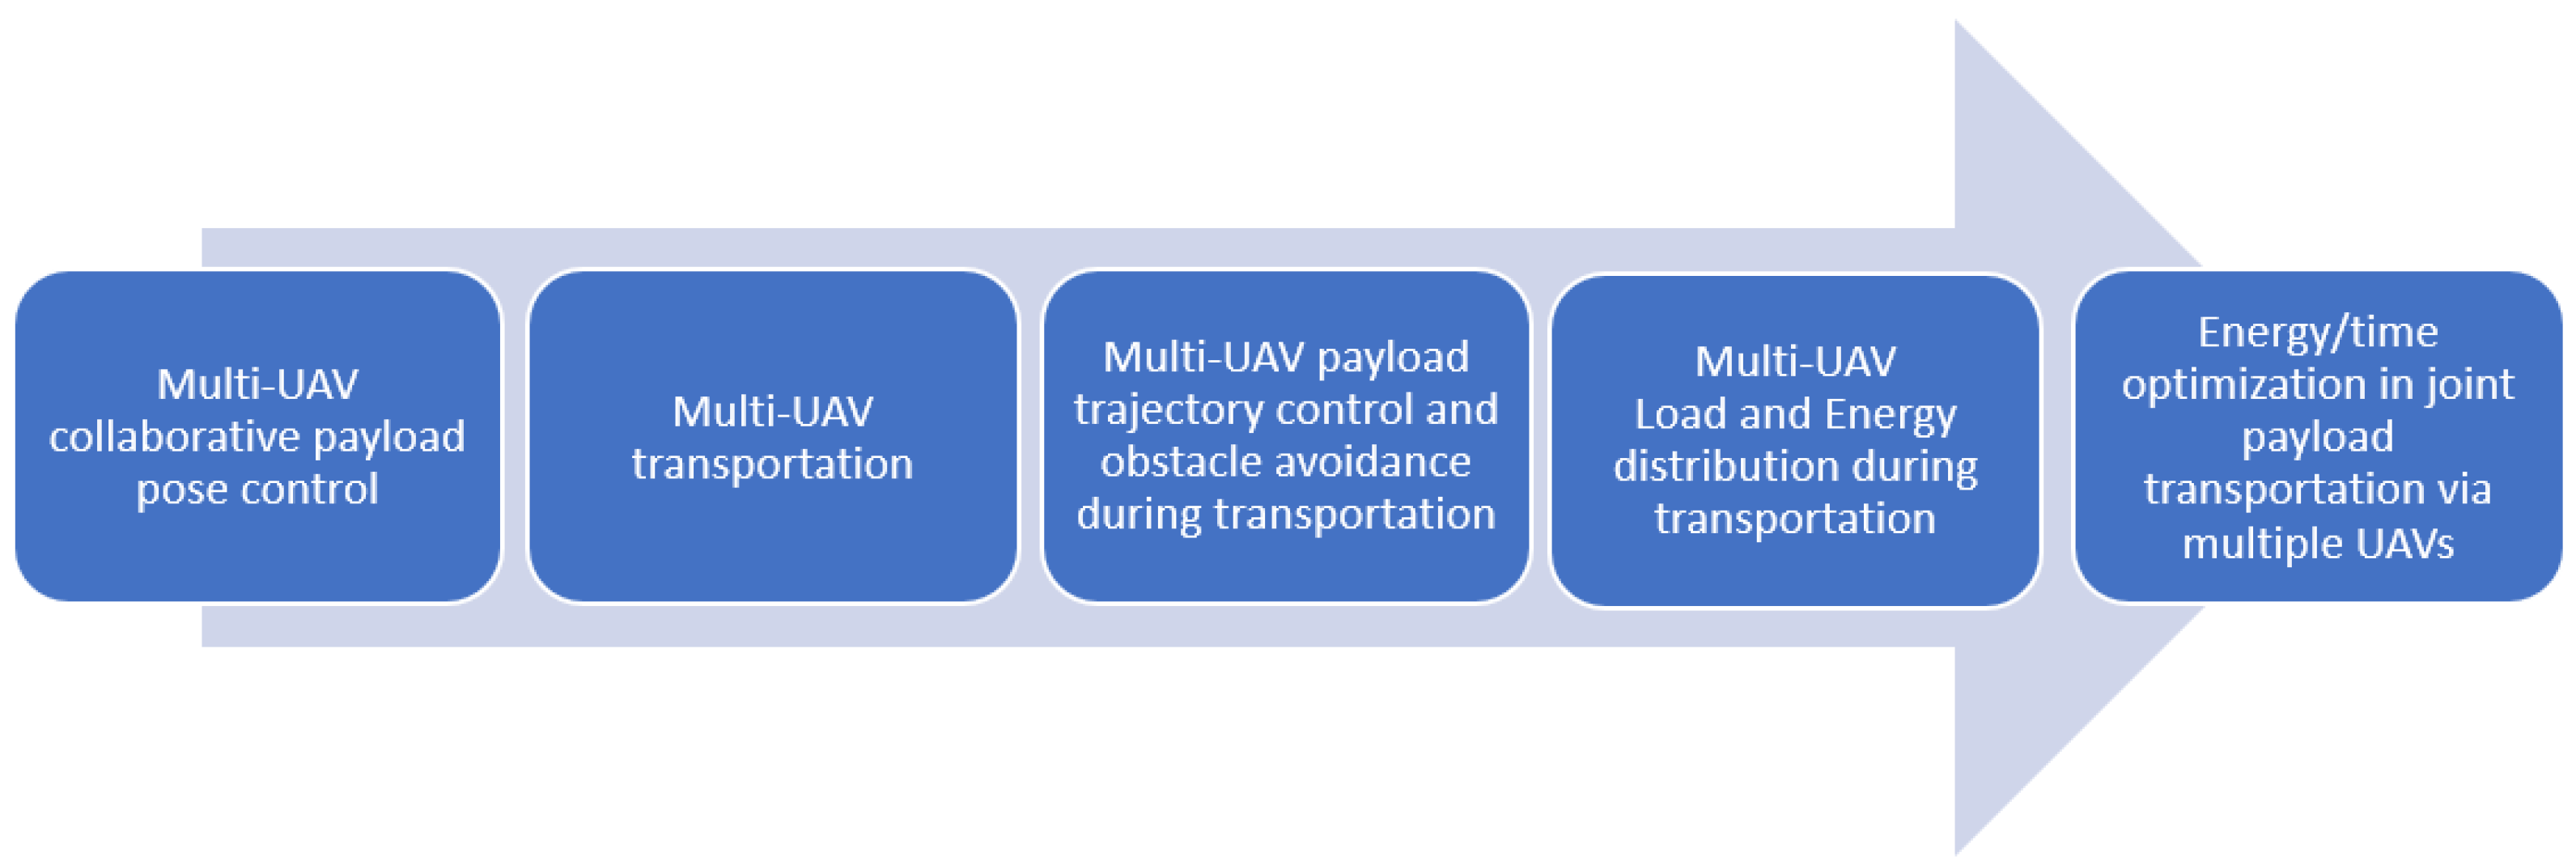
Figure 1. Multi-UAV collaborative payload transportation research problems.
Drones 07 00171 g001
Figure 2. Schematic of the dual-multi-rotor-payload showing the body and inertial frames.
Drones 07 00171 g002
Figure 3. The process flow diagram (a) The overall process, where the dotted arrows represent different phases in overall operation, from takeoff to start of phase 1 and then start of phase 2 and then landing (b) Phase 1 of the algorithm (c) Phase 2 of the algorithm. Circles represent nodes, red filled circles represent an example of traceback towards the first node.
Drones 07 00171 g003
Figure 4. Variation of (a) computations number and (b) computation time with respect to the velocity interval.
Drones 07 00171 g004
Figure 5. Numerical model developed in Simulink for the testing which includes, controller block, the hexrotor attitude dynamics block, linear dynamics block, and the optimization algorithm block.
Drones 07 00171 g005
Figure 6. Description of the linear dynamics of the coupled dual-hexrotor-payload system which includes the payload model.
Drones 07 00171 g006
Figure 7. Numerical simulation results for the RTDP based dual-hexrotor-payload transportation. (a) Payload trajectory using λ = ( 0.2 , 0.5 , 0.7 ) . (b) Payload velocity using λ = ( 0.2 , 0.5 , 0.7 ) . (c) Pitch angles of drone01 and drone02 using λ = ( 0.2 , 0.5 , 0.7 ) . (d) Opposing drag force of the UAV using λ = ( 0.2 , 0.5 , 0.7 ) . (e) UAV energy consumption using λ = ( 0.2 , 0.5 , 0.7 ) . (f) Individual energy consumption of the UAVs with λ = ( 0.2 , 0.5 , 0.7 ) . (g) Individual total thrusts of the individual UAVs with λ = ( 0.2 , 0.5 , 0.7 ) .
Drones 07 00171 g007
Figure 8. Numerical simulation results with δ = 0.1 0.5 for λ = [ 0.2 , 0.5 , 0.7 ] using cost-function definition 01. (a) travel time spent with δ = 0.1 0.5 by using cost function definition 01. (b) travel energy consumption with δ = 0.1 0.5 by using cost function definition 01.
Drones 07 00171 g008
Figure 9. SITL architecture for dual UAV payload transportation.
Drones 07 00171 g009
Figure 10. (a) SITL gazebo simulation scene showing two DJI F550 drone models along (b) with the description of the manipulator. (a) Two DJI-F550 models in Gazebo simulator with PX4 flight stack simulation jointly carrying a payload. (b) The multi-link free joints based arm attached to both multi-rotors. The arrows show the axis of rotation.
Drones 07 00171 g010
Figure 11. Publish frequency and time of the velocity command topic as obtained by the ROSTOPIC tool. (a) Publish frequency of the velocity command for both drones. (b) Minimum and maximum delay between two velocity commands.
Drones 07 00171 g011
Figure 12. Flight plots for the performed SITL gazebo simulations. (a) Dual UAV-payload system trajectory using λ = ( 0.2 , 0.5 , 0.7 ) . (b) Dual UAV-payload system Velocity using λ = ( 0.2 , 0.5 , 0.7 ) . (c) UAV Pitch angle using λ = ( 0.2 , 0.5 , 0.7 ) . (d) UAV Power consumption using λ = ( 0.2 , 0.5 , 0.7 ) .
Drones 07 00171 g012
Figure 13. A description of the software architecture and the hardware used in the testing of the RTDP algorithm for dual-UAV payload transportation. (a) Experimental platform setup. Dotted and solid lines are just to represent and distinguish different systems/subsystems (b) Drone01 and drone02 are connected to the central computer using WiFi. Drone02 is shown with its components to describe the power source route. The arrows show the information/signal/power flow between components.
Drones 07 00171 g013
Figure 14. Hover power consumption of both drones in lab, the SITL and Simulink experiments.
Drones 07 00171 g014
Figure 15. Experiment and simulation flight plots for comparison. (a) Drone01 and Drone02 jointly carried a payload during the lab experiment. (b) Payload Trajectory using λ = ( 0.7 ) . (c) Velocity of the payload using λ = ( 0.7 ) . (d) Payload Trajectory using λ = ( 0.7 ) .
Drones 07 00171 g015
Figure 16. Experiment flight plots for comparison between λ = ( 0.2 , 0.5 , 0.7 ) . (a) Payload Trajectory using λ = ( 0.2 , 0.5 , 0.7 ) . (b) Payload Velocity using λ = ( 0.2 , 0.5 , 0.7 ) . (c) Payload Trajectory using λ = ( 0.2 , 0.5 , 0.7 ) .
Drones 07 00171 g016
Table 1. Time spent and energy consumption during Numerical tests with distance step 4 m.
Weight-Age ( λ ) Time (s) Δ Time (%)Energy (kJ) Δ Energy (%)Velocity
Interval
(m/s)
0.2 30.32 5.20 %57.8 0.71 %0.1
0.5 30.72057.3900.1
0.7 34.73 11.54 %54.8 4.72 %0.1
Table 2. Time spent and energy consumption during Numerical tests with distance step 3 m.
Weight-Age ( λ ) Time (s) Δ Time (%)Energy (kJ) Δ Energy (%)Velocity
Interval
(m/s)
0.2 27.7 3.48 %54.57 + 4.14 %0.1
0.5 28.7052.500.1
0.7 33 13.03 %48.6 8.02 %0.1
0.2 27.82 4.00 %54.65 4.17 %0.2
0.5 28.983052.4600.2
0.7 32.9 11.91 %48.4 8.38 %0.2
0.2 27.8 5.02 %55.78 6.28 %0.3
0.5 29.27052.4800.3
0.7 32.9 11.03 %48.27 8.72 %0.3
0.2 27.87 4.6 %55.87 5.33 %0.4
0.5 29.215053.0400.4
0.7 33.43 12.6 %48.79 8.71 %0.4
0.2 27.82 4.56 %54.65 3.75 %0.5
0.5 29.15052.6700.5
0.7 33.63 13.32 %49.62 6.14 %0.5
Table 3. Time spent and energy consumption during Numerical tests with distance step 2 m.
Weight-Age ( λ ) Time (s) Δ Time (%)Energy (kJ) Δ Energy (%)Velocity
Interval
(m/s)
0.2 29.43 13.36 %56.91 13.82 %0.1
0.5 33.9705000.1
0.7 39.24 13.43 %52.06 3.95 %0.1
Table 4. Time spent and energy consumption during Numerical tests with distance step 1 m.
Weight-Age ( λ ) Time (s) Δ Time (%)Energy (kJ) Δ Energy (%)Velocity
Interval
(m/s)
0.2 31.219 22.80 %49.37 5.49 %0.1
0.5 40.44052.2400.1
0.7 47.45 47.45 %60 12.93 %0.1
Disclaimer/Publisher’s Note: The statements, opinions and data contained in all publications are solely those of the individual author(s) and contributor(s) and not of MDPI and/or the editor(s). MDPI and/or the editor(s) disclaim responsibility for any injury to people or property resulting from any ideas, methods, instructions or products referred to in the content.