Article

An Autonomous Soaring for Small Drones Using the Extended Kalman Filter Thermal Updraft Center Prediction Method Based on Ordinary Least Squares

1
School of Aeronautics, Northwestern Polytechnical University, Xi’an 710072, China
2
The Pre Research Center of AVIC Chengdu Caic Electronics Co., Ltd., Chengdu 610041, China
*
Author to whom correspondence should be addressed.
Drones 2023, 7(10), 603; https://doi.org/10.3390/drones7100603
Submission received: 15 August 2023 / Revised: 21 September 2023 / Accepted: 22 September 2023 / Published: 26 September 2023
(This article belongs to the Section Drone Design and Development)

Abstract

:
Many birds in the natural world are capable of engaging in sustained soaring within thermal updrafts for extended periods without flapping their wings. Autonomous soaring has the potential to greatly improve both the range and endurance of small drones. In this paper, the extended Kalman filter (EKF) thermal updraft center prediction method based on ordinary least squares (OLS) is proposed to develop the autonomous soaring system for small drones, and an adaptive step size update strategy is incorporated into the EKF. The proposed method is compared with EKF thermal updraft prediction methods through simulated experiments. The results indicate that the proposed prediction method has low computational complexity and fast convergence speed and performs more stably in weak thermal updrafts. The above advantages stem from the OLS providing an approximate distribution of the thermal updraft around the drone for the EKF. This empowers the EKF algorithm with ample information to dynamically update the thermal updraft center in real time. The adaptive step size update strategy further accelerates the convergence speed of this process. In addition, flight experiments were conducted on the Talon fixed-wing drone platform to test the autonomous soaring system. During the flight experiment, the drone successfully engaged in static soaring within thermal updrafts, effectively hovering and gaining energy. Throughout the approximately 40 min flight duration, the drone only utilized its propulsion for about 8 min. This demonstrated the effectiveness of the autonomous soaring system using the EKF thermal updraft center prediction method based on OLS. Finally, by analyzing and discussing the differences between the simulation experiment results and the flight experiment results, some improvement strategies for the current work are proposed.

1. Introduction

With the continuous expansion of applications for small fixed-wing drones [1], diverse scenarios and task requirements have imposed higher demands on their endurance and adaptability to different environments. However, the limited onboard energy capacity and storage constrain the extension of their endurance capabilities. Thermal updrafts are widely distributed across regions such as hilly areas, deserts, urban centers, farmlands, lakes, and swamps. Raptors like vultures [2,3,4], frigatebirds [5,6,7], steppe eagles [8], bats [9], desert eagles, and vultures [10] can engage in static soaring within thermal updrafts, soaring in the high altitudes for extended periods without flapping their wings. By emulating the soaring behavior of birds within thermal updrafts, it is possible to significantly enhance the endurance of drones at a relatively low cost, enabling small drones to undertake long-range missions with extended flight times. Consequently, the static soaring of small fixed-wing drones has become a prominent research topic in the realm of drones in recent years, prompting scholars to conduct extensive research in this field.
Real-time perception for the wind field is a prerequisite for drones to achieve static soaring. Various sensors, such as ultrasonic anemometers [11], porous probes [12], and wind vane sensors, can provide real-time perception of updrafts. However, these sensors are difficult to install and come at a high cost, particularly for small drones. Hence, researchers have been devoted to developing updraft perception methods that do not require additional sensors. Edwards [13], inspired by the Netto pressure altimeter principle of conventional gliders, proposed an updraft perception method based on the rate of energy change. This method relies solely on GPS, airspeed indicators, and the drone’s descent polar curve to calculate the magnitude of updrafts in real time. Addressing roll situations, Edwards [14] supplemented the energy-based updraft perception algorithm, investigating the relationship between circling guidance parameters and energy efficiency. Langelaan [15] and Pachter [16], by fusing data from onboard sensors such as GPS and airspeed indicators and utilizing filtering algorithms, estimated the three-dimensional wind field in real time to consequently perceive updrafts. Currently, there is relatively limited research regarding the precision of perception achieved by such methods.
Ákos, building upon the previous research findings, summarized the typical flight patterns of gliders and birds within thermal updrafts. These patterns involve entering and circling within thermal updrafts upon detection, leading to a sustained increase in altitude. When the strength of the thermal updraft is insufficient to achieve altitude gain, the circling is terminated, and the search for a new thermal updraft is initiated [17]. Therefore, real-time and accurate prediction of the distribution of thermal updrafts can enable drones to engage in static soaring within them. Methods for predicting the distribution of thermal updrafts around drones can currently be categorized into two types: model-free regression estimation methods and model-based parameter estimation methods.
Model-free regression estimation methods use statistical learning techniques to predict thermal updrafts from onboard wind speed measurements. Lawrance [18] utilized Gaussian process regression to create wind speed maps based on multiple location measurements to predict thermal updrafts. He further extended this approach by introducing temporal components that account for wind field drift and variations [19]. Singh [20] incorporated time components into Gaussian regression to obtain temporal wind speed maps. Lee [21] employed a generalized neural network to create distribution maps of updrafts within a region, but this approach is computationally intensive. Woodbury [22] combined reinforcement learning with predicting updraft behaviors to guide drones in energy harvesting. Model-free regression estimation methods can avoid prediction errors caused by model inaccuracies, but they often come with high computational requirements.
With the simultaneous development of onboard computers and mathematical techniques, there is hope that this issue can be resolved. For example, recently introduced intelligent low-latency control [23] and robust control [24] algorithms, proposed by scholars, show extensive potential in the application of static soaring for small drones.
Model-based parameter estimation methods involve iteratively updating thermal updraft model parameters based on prior models and observed data. Allen [25] established a thermal updraft model based on convective velocity scale and convective mixing layer thickness parameters using extensive empirical data. This model has been widely adopted in subsequent wind field prediction simulations. Allen [26] also introduced a batch processing approach based on a data storage queue to predict the thermal center and radius of updrafts, providing an important reference for later research. Building upon Allen’s work, Edwards [13] proposed the weighted centroid method based on the Wharington thermal updraft model, designed an advanced search strategy based on ordinary least squares (OLS) to predict thermal updraft parameters, and validated that this approach was more reliable than Allen’s. Subsequent research extended the application of techniques like Kalman filtering [27], particle filtering [28], and unscented Kalman filtering [29] to thermal updraft parameter prediction. Depenbusch et al. [30], inspired by Edwards’ work, proposed a method for mapping wind field cloud diagrams and wind field intensity probability distribution diagrams in an expanded area based on perception results. This effectively utilizes perception data to predict wind fields. Notter et al. [31] introduced a method based on particle filtering that predicts the positions and intensities of multiple thermal updrafts. They validated its effectiveness through numerical simulations based on actual flight data. Model-based fitting methods for thermal updrafts have relatively lower computational and storage requirements. They are currently the mainstream methods for thermal updraft prediction in the application of small drones.
The Wharington model is the most widely used thermal updraft model in the study of static soaring. Mainstream methods for the parameter estimation of this thermal updraft model include OLS and filtering methods. The OLS method has drawbacks: (1) the prediction accuracy of thermal updraft parameters is significantly affected by wind field perception noise and (2) the real-time prediction of thermal updraft parameters is poor, requiring specific trajectories and sufficient data for accurate predictions. In comparison, filtering prediction methods can estimate thermal updraft parameters in real time. However, existing filtering methods require sufficient state and observation quantities for accurate parameter estimation, posing challenges for the stability of prediction algorithms and the computational capacity of small drones.
Addressing the limitations of both methods, this paper introduces an EKF thermal updraft center prediction method based on OLS. This method offers advantages such as low computational load, rapid convergence, and high stability, guiding small drones in static soaring within thermal updrafts in real time.
During the iteration process, this method uses OLS to estimate thermal updraft intensity and radius, employing the updraft magnitude on the current position as an observation, and employs an EKF to estimate the thermal updraft center in real time. Since the OLS provides an approximate distribution of thermal updrafts around the drone, it reduces the complexity of thermal updraft center prediction, allowing the EKF to utilize only one observation. This enhances stability and facilitates real-time updates of the thermal updraft center with minimal computational load.
Furthermore, this paper introduces an adaptive step size thermal updraft center update strategy into the EKF. This strategy significantly enhances the algorithm’s convergence speed. Employing this strategy, even when dealing with weaker intensity thermal updraft fields and initial predicted center points at the thermal’s edge, the algorithm swiftly converges to the real thermal updraft center.
The autonomous soaring system using the EKF thermal updraft center prediction method based on OLS has undergone flight testing on the Talon fixed-wing drone platform. In this test, the thermal updraft center point will be updated at a frequency of 1 Hz. The system will employ the L1 navigation algorithm to guide the drone in a circling flight around the real-time predicted thermal updraft center. During the testing process, the drone successfully engages in static soaring within the thermal updrafts, continuously hovering and harvesting energy from the updrafts. Throughout the approximately 40 min flight duration, the drone only utilizes its propulsion for about 8 min.
The chapter arrangement of this paper is as follows. Section 2 provides the constitution of the autonomous soaring system and proposes the EKF thermal updraft center prediction method based on OLS. Section 3 conducts simulation experiments and flight experiments to validate the effectiveness of the proposed EKF thermal updraft center prediction method based on OLS. Section 4 analyzes and discusses the differences between the simulation experiment results and the flight experiment results, and the improvement strategies for the current work are proposed. Section 5 provides conclusions and recommendations.

2. Autonomous Soaring System

2.1. Constitution of the Autonomous Soaring System

The autonomous soaring system was built on the PX4 open-source flight controller, as illustrated in Figure 1. This system consisted of three components: the wind field perception system, the thermal updraft prediction system, and the navigation system. They all collectively subscribed to real-time sensor messages provided by the PX4 system to carry out their respective functions. The wind field perception system was used to obtain the current wind speed at the drone’s position. The thermal updraft prediction system continuously updated the thermal updraft center based on the current wind speed information at the drone’s position. The navigation system was responsible for controlling the drone to track the center of the thermal updraft in real time through the L1 guidance algorithm, enabling static soaring. The wind field perception system and the thermal updraft prediction system are two unique components specifically designed for static soaring of the drone. They will be detailed in the following sections.

2.2. Wind Field Perception System

Real-time wind field perception technology is a prerequisite for achieving static soaring of drones. In this study, a wind field perception system was constructed based on the current mainstream methods. This system could dynamically perceive both the updraft and the horizontal wind at the drone’s position in real time. It provided essential references for the drone’s static soaring within thermal updrafts. The operational framework and data interfaces of the wind field perception system are illustrated in Figure 2.
(1)
Perception of updraft
The real-time estimation of updrafts was achieved using an energy change rate-based perception method [13]. During the drone’s process of static soaring within updrafts, the propulsion was turned off. At this point, the change in aircraft mechanical energy was influenced by aerodynamic drag and the updraft. Hence,
E · ms = W · drag + W · updraft
In this equation, E ˙ m s = h ˙ + V t V ˙ t g represents the specific mechanical energy change rate, comprising the change rates of specific potential energy and specific kinetic energy, and it can be obtained from GPS and barometric pressure sensors. W ˙ u p d r a f t s can be considered as the equivalent magnitude of the updraft. W ˙ d r a g s is the rate of descent of the aircraft and can be approximated using the sink curve of the aircraft.
The sink rate polar curve establishes a relationship between the airspeed and the expected sink rate during both stationary air conditions and stable flight. It is a crucial indicator for evaluating an aircraft’s gliding performance [13]. The sink rate polar curve is typically approximated using a quadratic function of the airspeed. However, in addition to this, during coordinated turns, the roll angle causes extra energy loss (Edwards et al., 2016). Thus, the comprehensive expression of the aircraft’s sink rate polar curve is as follows:
V sink 0 = a V a 2 + b V a + c V sink ϕ = V sin k 0 ( sec ϕ ) 1.5
where V sink 0 represents the sink rate at zero roll angle, which is a quadratic curve with respect to airspeed; V sink ϕ is the sink rate when the aircraft’s roll angle is not zero.
(2)
Perception of horizontal wind
Using the EKF for horizontal wind estimation, we chose the state variable as X = w i n d N w i n d E . We assumed that the horizontal wind speed remained approximately constant over a short period of time. The selected observation was the airspeed magnitude V a . Under the assumption of small angles of attack and sideslip, it approximately equals the measurement from the airspeed sensor. Therefore, the state transition equation and the observation equation are
X t = [ wind N t wind E t ] = f ( X t 1 ) = [ wind N t 1 wind E t 1 ]
V a = ( V N wind N ) 2 + ( V E wind E ) 2 + V D 2
respectively, where w i n d N represents the northward wind speed, and w i n d E represents the eastward wind speed.
(3)
Accuracy of perception
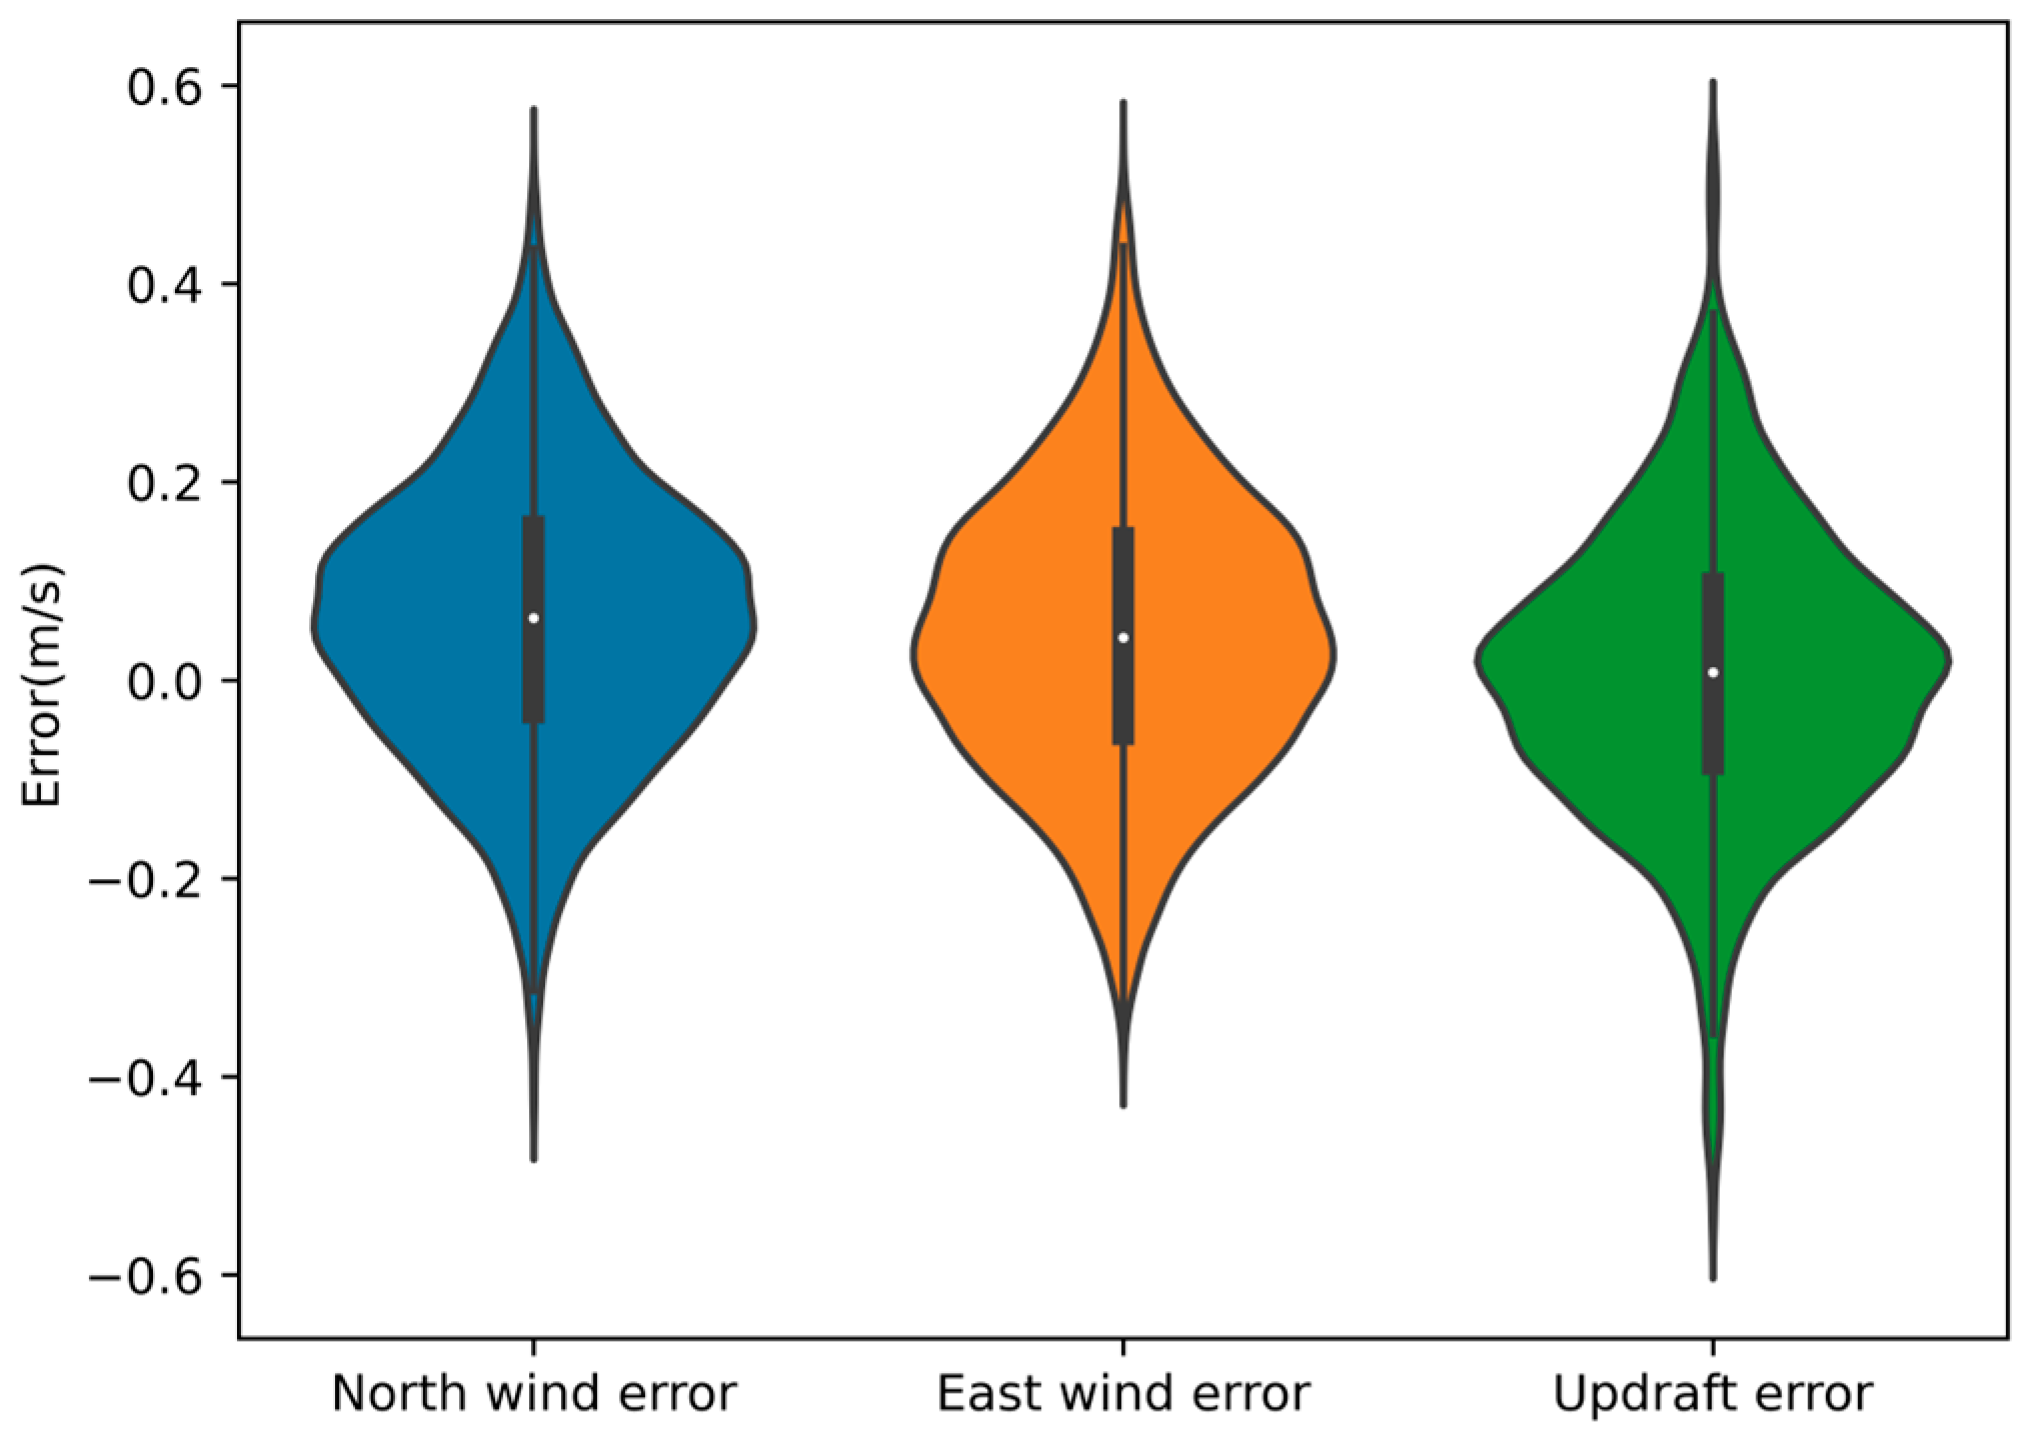
To validate the accuracy of the wind field perception system, a wind vane sensor capable of measuring three-dimensional wind field information was installed on the test prototype platform, and multiple flight experiments were conducted. The wind vane sensor was tested and calibrated in wind tunnel experiments, demonstrating high measurement accuracy and providing reference data [32]. The quantitative analysis was conducted on the wind speed measurement noise relative to the wind vane sensor for the wind field perception system. Figure 3 presents the noise distribution of the wind field perception system in comparison with the wind vane sensor. It can be observed that the errors approximately follow a normal distribution. Table 1 provides the noise parameters for the wind field perception system.

2.3. The EKF Thermal Updraft Center Prediction Method Based on OLS

A thermal model that characterizes the distribution characteristics of updraft is a prerequisite for the research of model-based thermal prediction methods. In this paper, the Wharington thermal updraft model influenced by horizontal wind drift was chosen. This thermal model was based on the following assumptions:
(1)
The intensity and radius of the thermal are fixed, and their distribution does not change with altitude.
(2)
The thermal’s hot center point, denoted as ( x c , y c ) in a north-east-down coordinate system, drifts within the horizontal plane due to the horizontal wind’s velocity.
The magnitude of the updraft at the thermal center is also referred to as the thermal’s center intensity, denoted as W . The radius of the thermal is denoted as R . The formula for calculating the updraft magnitude at point ( x , y ) is
w ( x , y ) = W exp ( D 2 R 2 )
where D 2 = x x c 2 + y y c 2 represents the square of the distance between the current point and the thermal’s center point.
The Wharington thermal model influenced by horizontal wind drift can effectively represent the basic structure of thermals and explain the variations in thermal behavior. Although it neglects the downdrafts at the edges of the thermal, this simplified model is more suitable for simulation and practical flight scenarios.
The EKF center prediction method based on OLS employs the OLS to estimate the intensity and radius of the thermal updraft. This method aims to approximate the distribution of thermal updrafts around the drone. The magnitude of the updraft at the current position serves as the observation, and the EKF is utilized to perform real-time estimation of the thermal updraft center. The algorithmic framework is illustrated in Figure 4.
In this method, the least squares technique is employed to approximate the thermal updraft intensity W and radius R. By taking the logarithm of both sides of Equation (5), the nonlinear thermal model can be transformed into a linear model:
ln [ w ( x , y ) ] = ln ( W ) D 2 R 2
ln [ w ( x , y ) ] is a linear function of D 2 . Therefore, by establishing an updraft perception queue over a certain period of time and a position queue from the GPS sensor, the OLS can be employed to approximate the thermal updraft’s intensity and radius.
EKF is utilized to update the thermal updraft center point ( x c , y c ) in real time. According to the assumptions of the thermal model, the thermal center will drift along with the horizontal wind. To reduce errors, a trapezoidal integration formula is employed. As a result, the system’s state transition equation is given by
X = [ x c t y c t ] = [ x c t 1 y c t 1 ] + 1 2 [ wind N t + wind N t 1 wind E t + wind E t 1 ]
where X = x c y c represents the center point of the thermal updraft, w i n d N stands for the northward wind speed, and w i n d E represents the eastward wind speed.
For a stable thermal updraft wind field, the thermal parameters are not expected to change significantly over a short period of time. As a result, the system’s state transition equation does not include dynamic equations, leading to a state transition matrix given by
F = f X = X k + 1 X = [ 1 0 0 1 ] = I
Choosing the updraft magnitude at the drone’s current position as the observation, and using Equation (5) as the observation equation, the observation matrix is obtained by linearizing through the Jacobian method:
H T = h X = [ 2 W ( x x c ) R 2 exp ( D 2 R 2 ) 2 W ( y y c ) R 2 exp ( D 2 R 2 ) ]
The aforementioned EKF involves only a single observation equation, and the algorithm update process does not require matrix inversion calculations. This property enables the method to run in real time and with stability. The measurement noise and process noise in the algorithm depend on the accuracy of the wind field perception system, and their noise parameters are derived from the noise information tested, as provided in Table 1.
The initial center for the algorithm iteration is typically located at the edge of the thermal updraft, resulting in a considerable distance from the true center of the updraft. This requires the prediction method to have a rapid convergence rate. To address this need, this paper introduces an adaptive update step size ω on top of the existing EKF. Its expression is given as follows:
ω = { ω 0 1 t t 0 + 1.0 , t t 0 1.0 , t > t 0
where ω 0 > 1.0 represents the initial update step size, and t 0 > 0 is a time constant used to control the variation of the step size. When t t 0 , the update step size gradually decreases from the initial step size to 1.0. This causes the algorithm-predicted thermal updraft center to rapidly approach the true thermal updraft center. When t > t 0 , the algorithm-predicted thermal updraft center point is already close to the true thermal updraft center, and the update step size becomes 1.0. This ensures that the algorithm-predicted thermal updraft center can stably track the true thermal updraft center.

3. Experiments and Results

3.1. Simulation Experiments

3.1.1. Simulation Environment

Based on the Wharington thermal model influenced by the horizontal wind drift mentioned earlier, a simulation environment was constructed. In a 1000 m × 1000 m area, a thermal updraft with an intensity of W and radius of R was present. The initial center of the thermal updraft was located at the center of the area. The intensity and radius of the thermal updraft remained constant over time. There was a certain horizontal wind within the area, causing the center of the updraft to drift at the speed of the horizontal wind.
Following the testing of the wind field perception system in Section 2, the perception of the wind field is approximately influenced by Gaussian noise. Hence, in the simulation environment, the drone’s perception of the wind field was the true wind field with added Gaussian noise. The parameters of the Gaussian noise are provided in Table 1.
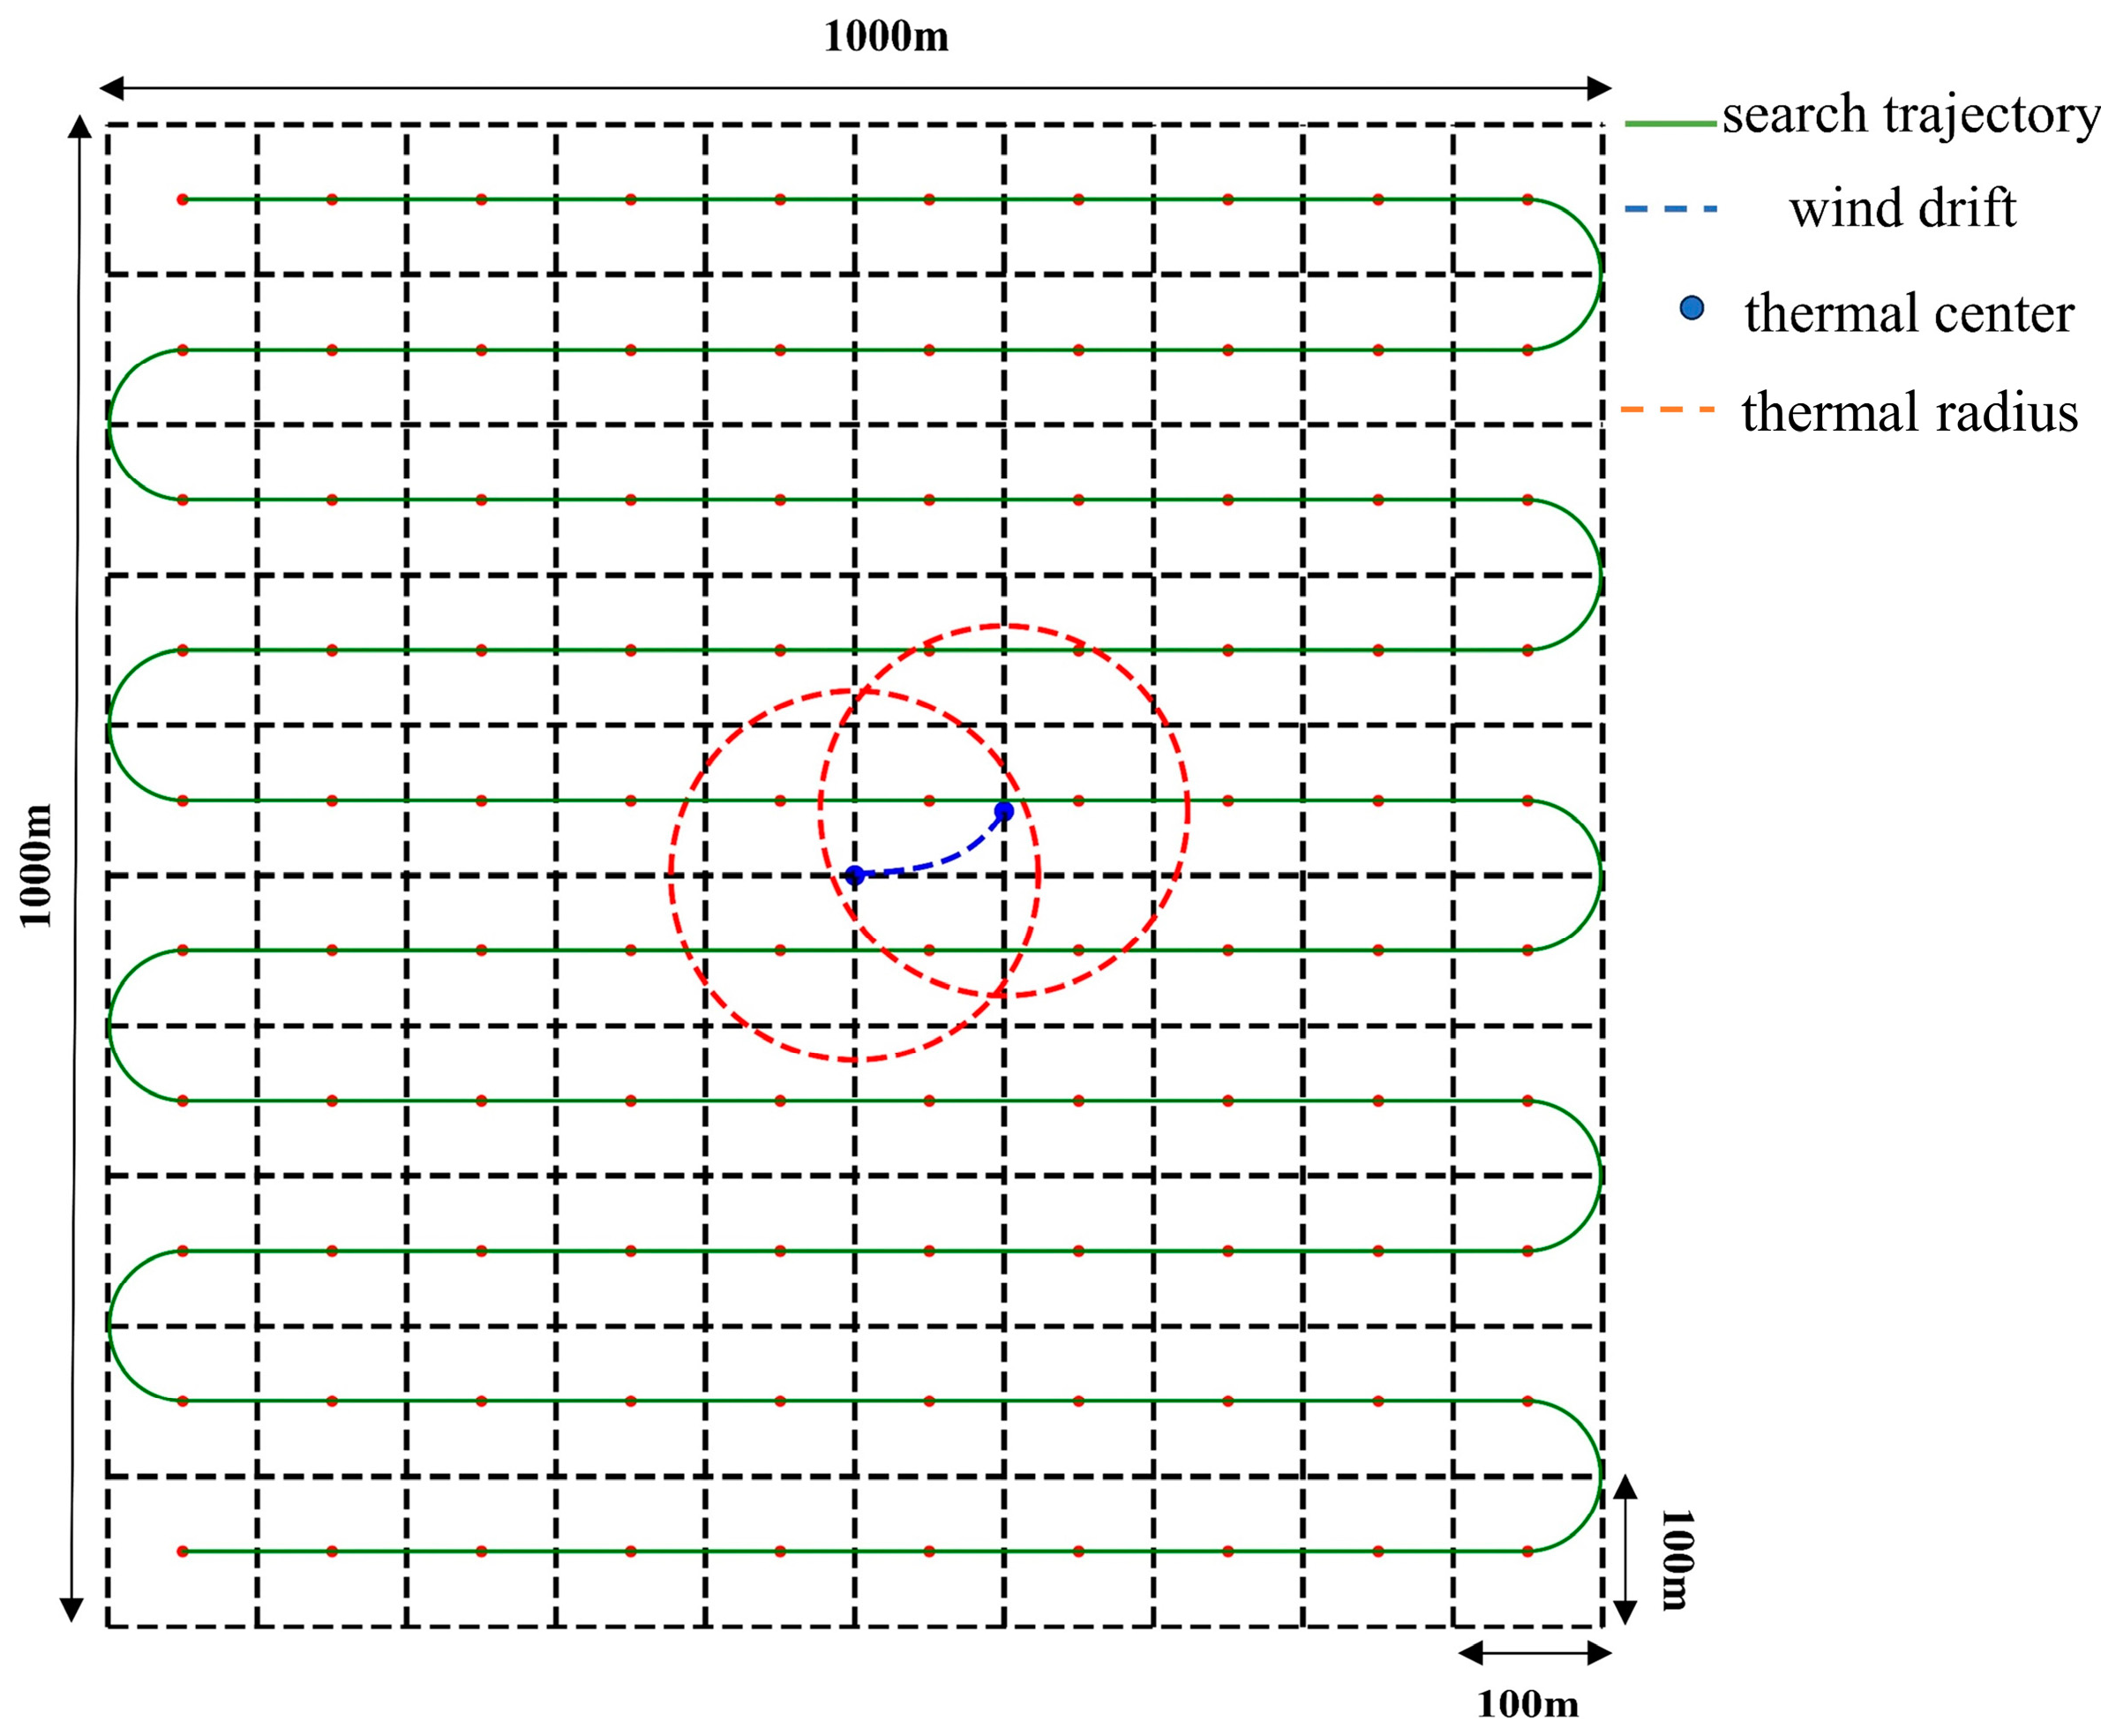
The entire area was divided into 100 sub-regions, each measuring 100 m × 100 m . A smooth curve connected the center points of all the sub-regions, forming a search trajectory. This trajectory systematically traversed the entire area in a predetermined order, as depicted in Figure 5.
In the simulation environment, the drone operated in two flight modes: area search mode and autonomous soaring mode. In the area search mode, the drone followed the search trajectory to systematically cover the entire area. In the autonomous soaring mode, the drone continuously tracked thermal updraft centers based on the prediction results. This mode enabled the drone to achieve sustained static soaring.

3.1.2. Case Settings

To better illustrate the advantages of the proposed method, eight cases were set up for comparative analysis as shown in Table 2. In these eight cases, four different methods to predict the thermal updraft center were employed for the simulation analysis in two distinct thermal updrafts. Both the two updrafts had a radius of 300 m, with intensities of 1 m/s and 2 m/s, respectively. The variation in wind field intensity was designed to investigate the performance of the thermal updraft prediction methods in strong and weak thermal updrafts. Cases (a) and (b) utilized the EKF thermal updraft center prediction method based on OLS proposed in Section 2.3, while cases (g) and (f) employed the existing EKF thermal updraft center prediction method [26]. This method treats the center coordinates, intensity, and radius of the thermal updraft as four state variables and uses the current updraft at the drone’s position as an observation. Due to its larger state space, this method involved higher computational complexity. Cases (c) and (d) and cases (e) and (f) removed the adaptive step size update strategy and OLS based on cases (a) and (b), respectively, aiming to explore the influence of these two factors.
Other simulation experiment parameters are provided by Table 3. The parameter settings in the table are consistent with the Talon fixed-wing drone platform used in the flight experiments.

3.1.3. Simulation Results

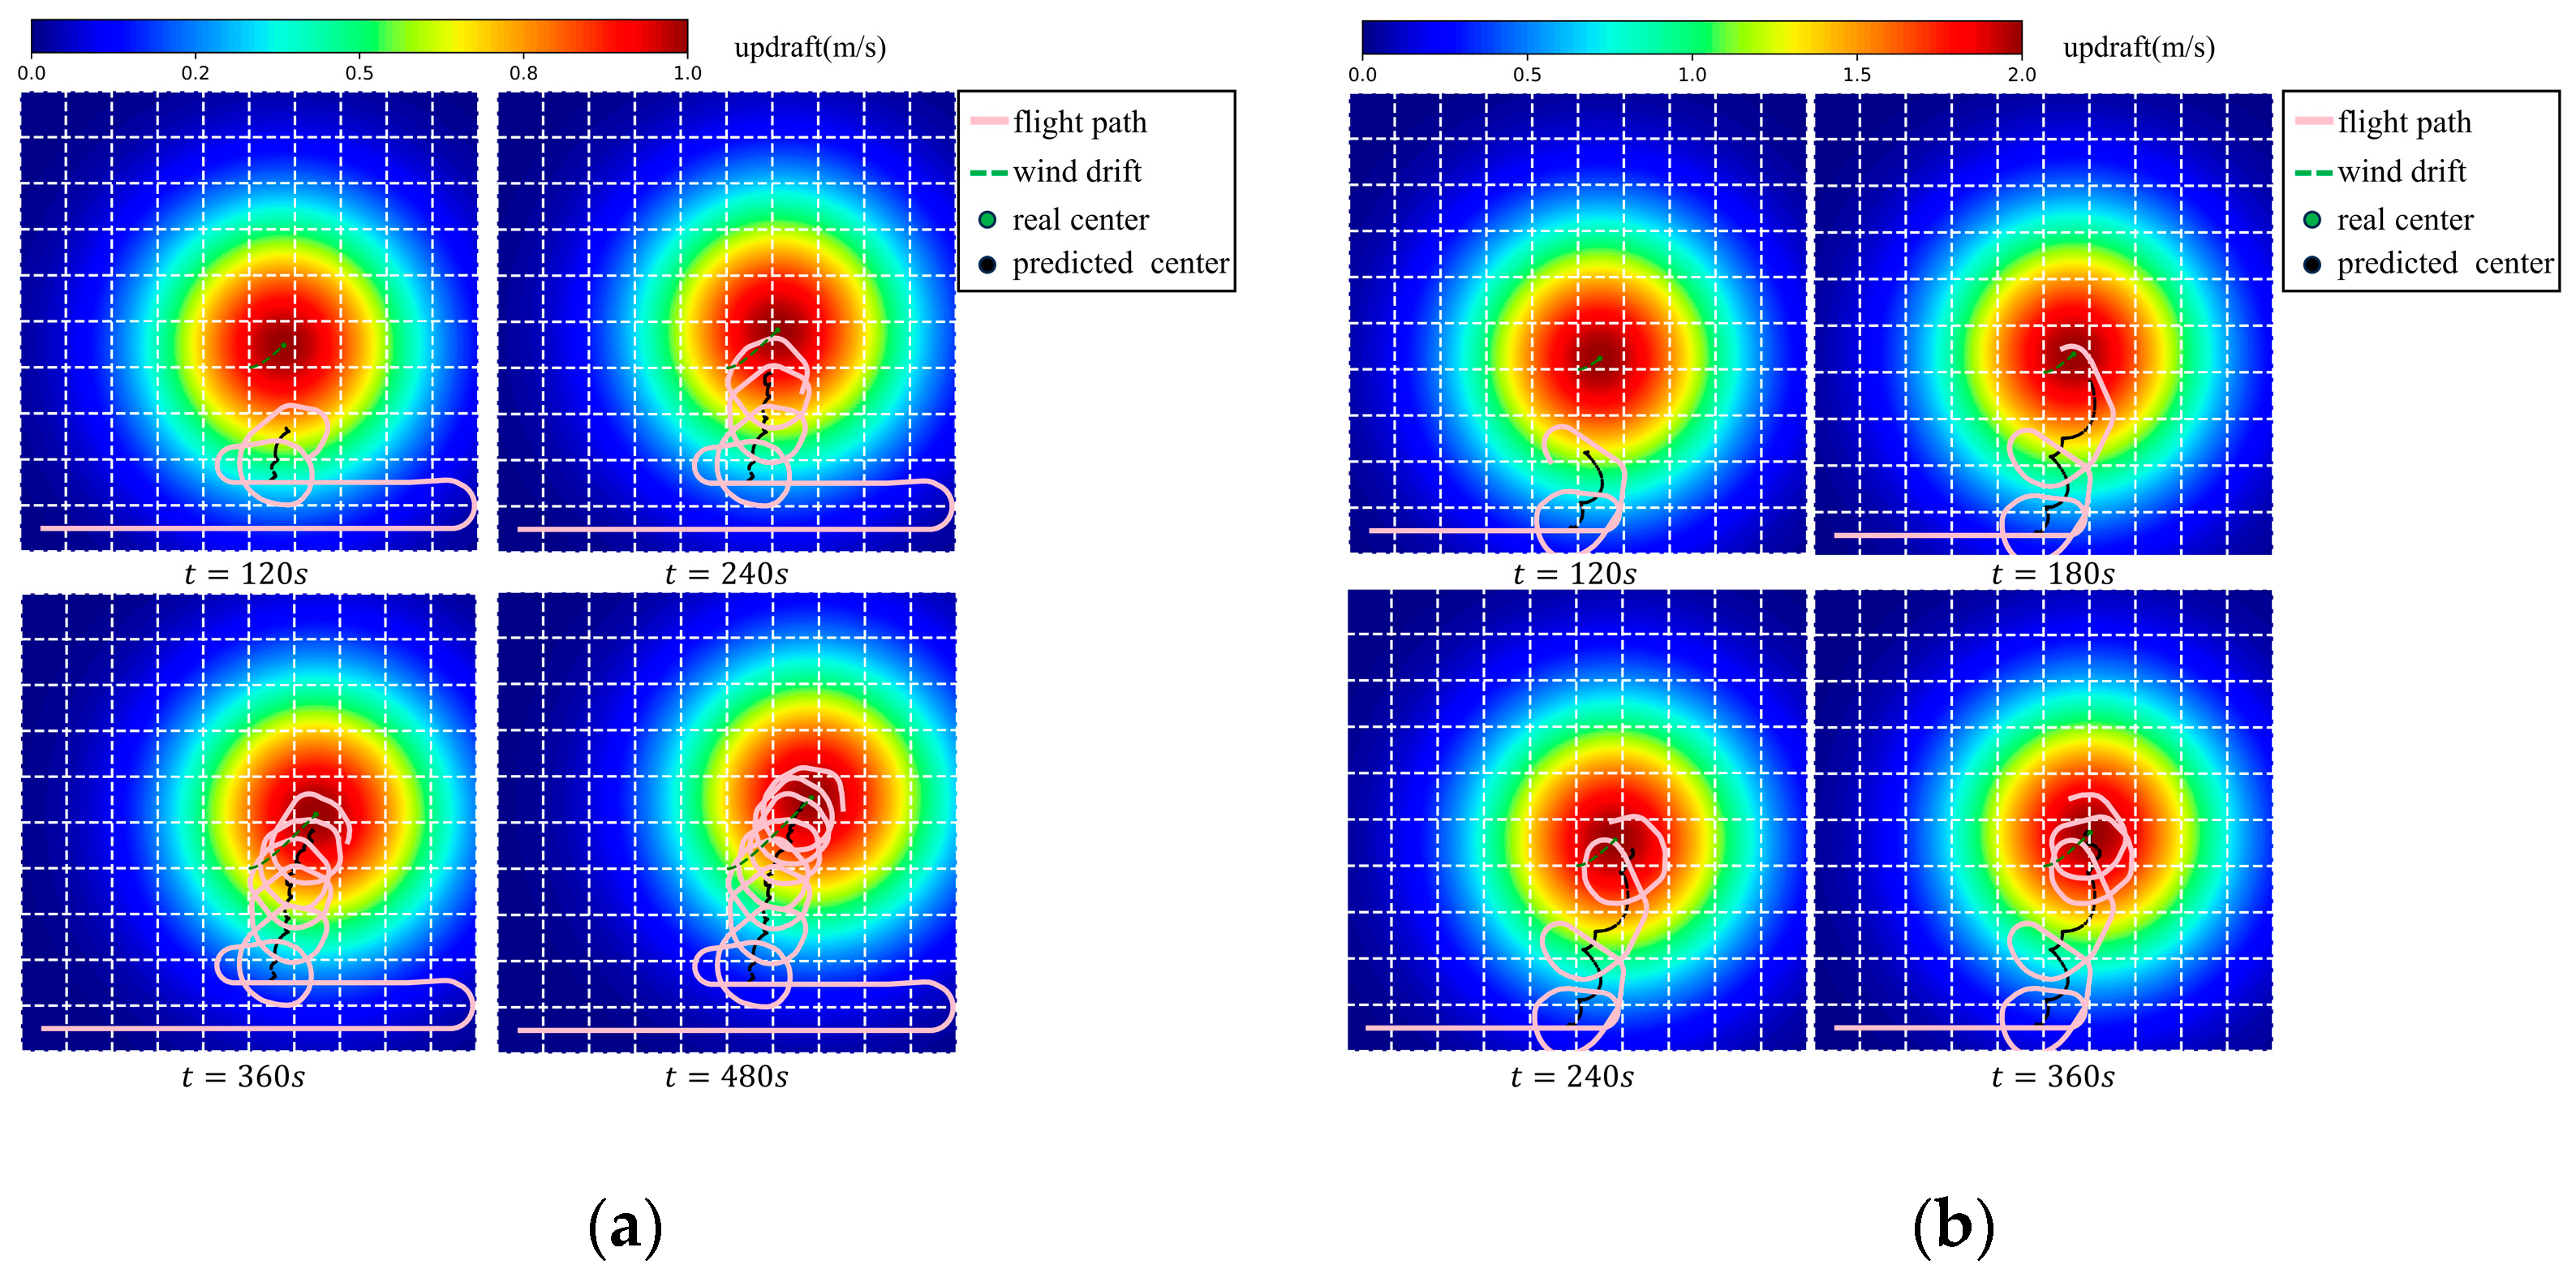
The simulation experiments were conducted for the eight cases specified in Table 2. Figure 6 displays the trajectory plots of the simulation results. In the figures, the initial centers of all cases are located at the edge of the thermal updraft, approximately 300 m away from the actual center. Upon comparing the images, it can be observed that the cases (Figure 6a,b) using the EKF thermal updraft center prediction method based on OLS proposed in this paper converged to the real thermal updraft center at the fastest rate. In comparison with the original EKF thermal updraft center prediction method (Figure 6g,h), the introduction of either OLS (Figure 6c,d) or the adaptive step size update strategy (Figure 6e,f) could improve the convergence characteristics to some extent, but the improvement was not significant within a relatively short period of time.
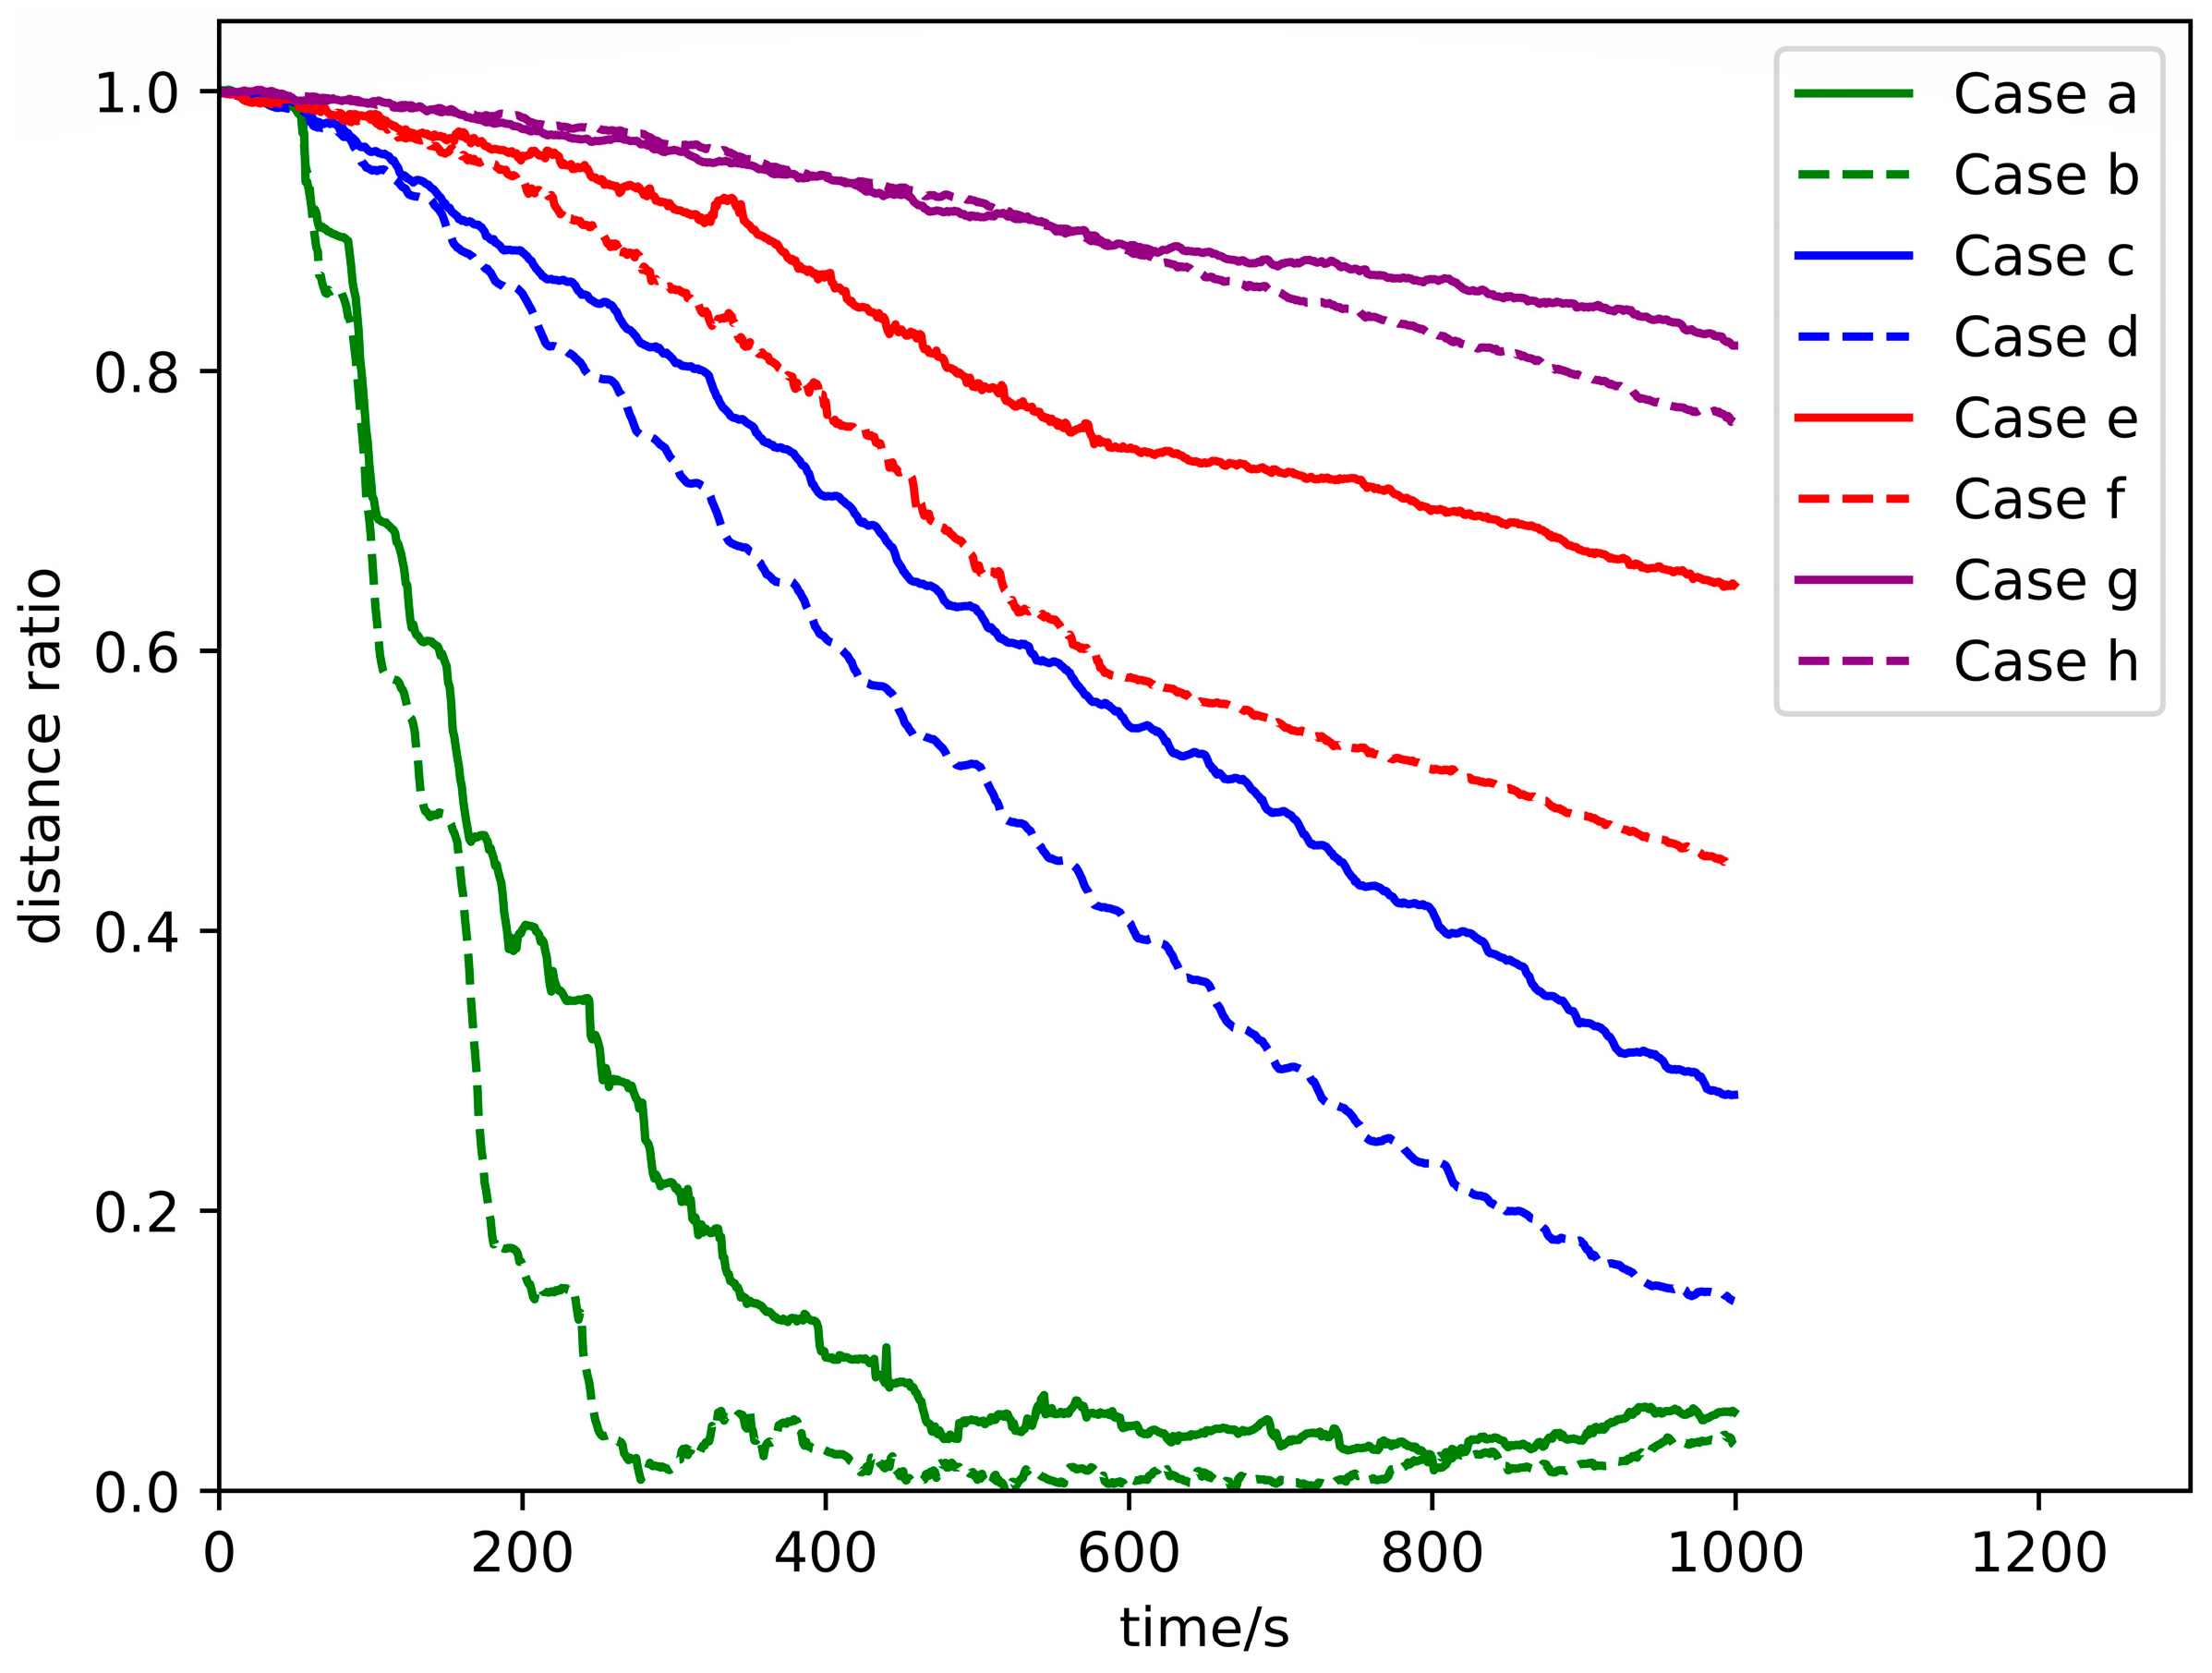
To provide a more intuitive comparison of the convergence speeds of thermal updraft center predictions for different cases over an extended period of time, the following convergence curves are defined. The vertical axis of the curve represents the distance ratio, which signifies the ratio between the current predicted center’s distance to the thermal updraft center and the initial predicted center’s distance to the thermal updraft center. In this way, the values of all convergence curves for different cases on the vertical axis fall within the range of [0,1], enabling a direct comparison. Figure 7 presents the convergence curves for the eight cases shown in Figure 6.
By observing Figure 7, we can further validate the conclusions drawn earlier, and it is evident that the improvement in convergence speed due to OLS was significantly higher than that achieved through the adaptive update step size strategy. Additionally, by comparing the convergence curves of the solid and dashed lines in the figure, it can be noted that as the thermal updraft intensity increased, the convergence speed of all methods also accelerated. This was attributed to the increased gradient of the updrafts due to the higher intensity. However, for the EKF thermal updraft center prediction method based on OLS proposed in this paper, halving the intensity of the thermal updraft only had a marginal impact on its convergence speed. This indicates that the method holds promising applications in environments with weak thermal updrafts.

3.1.4. Interpretation of the Results

The improvement in the convergence speed due to the adaptive update step size strategy was easy to explain. In the initial stages, using a larger step size was helpful for quickly approaching the real center, as the initial predicted center was often far from the actual center. As the predicted center became closer to the real center, reducing the step size could alleviate “oscillating convergence”.
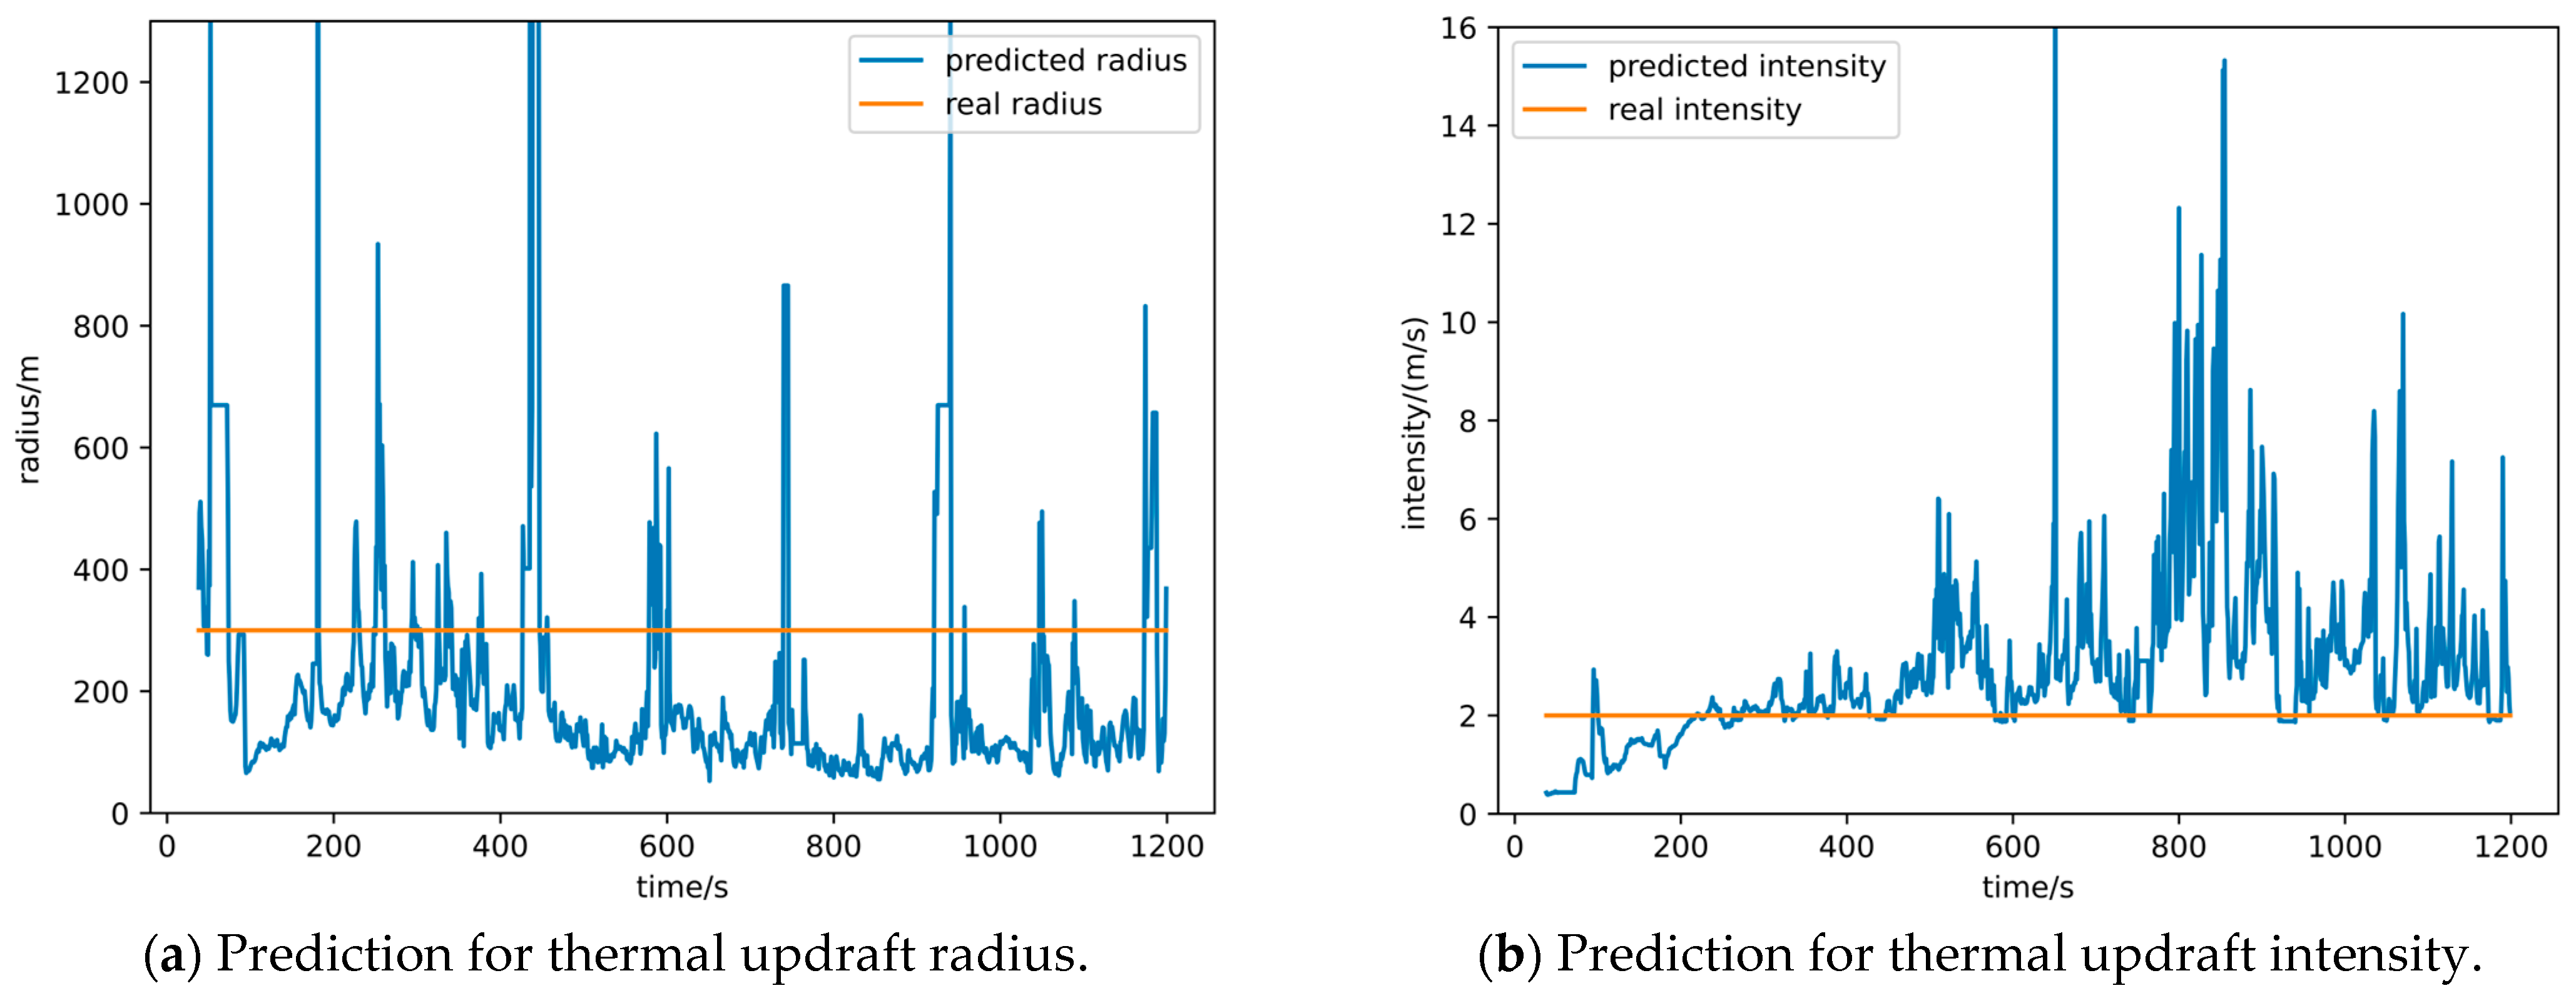
On the other hand, what was the role of OLS? As mentioned in Section 2.3, OLS operates by predicting the intensity and radius of the thermal updraft based on a small amount of data. To further elucidate the role of OLS in the prediction method and how it significantly enhanced the convergence speed, Figure 8 is plotted, and it displays the predicted results for thermal updraft intensity and radius under case b.
Observing the graph reveals that the EKF thermal updraft center prediction method based on OLS did not accurately predict the thermal updraft intensity and radius. The predicted results differed significantly from the actual thermal updraft intensity and radius and exhibited considerable fluctuations. The thermal updraft intensity and radius provided by the OLS were not meaningful for reference.
This discrepancy arose because the thermal updraft intensity and radius were fitted using OLS only based on a small number of data points collected over a short period of time. Furthermore, these data points were concentrated around the drone, leading to inevitable overfitting, where the fitting result performed well on the given data points but poorly on a global scale. This issue explained why the OLS required a large amount of data for accurate prediction of thermal updraft parameters and was the reason behind its high latency and slow computation.
So, what exactly is the role of OLS? This requires shifting the focus away from the parameters of thermal updraft intensity W and radius R themselves and instead looking for other intermediate variables to explain the effect of OLS. One explanation provided in this paper is as follows:
Although the OLS based on a small number of data points collected over a short time can lead to overfitting, the overfitted results are relatively accurate for predicting the updraft values in local regions. On the other hand, the EKF updates the thermal updraft center in real time using the updraft magnitude on drone’s current position. Therefore, it does not require a global distribution of thermal updrafts (which would demand significant computational resources), instead relying on the local thermal updraft distribution around the drone. This real-time provision of local updraft predictions can satisfy the convergence requirements of the EKF.
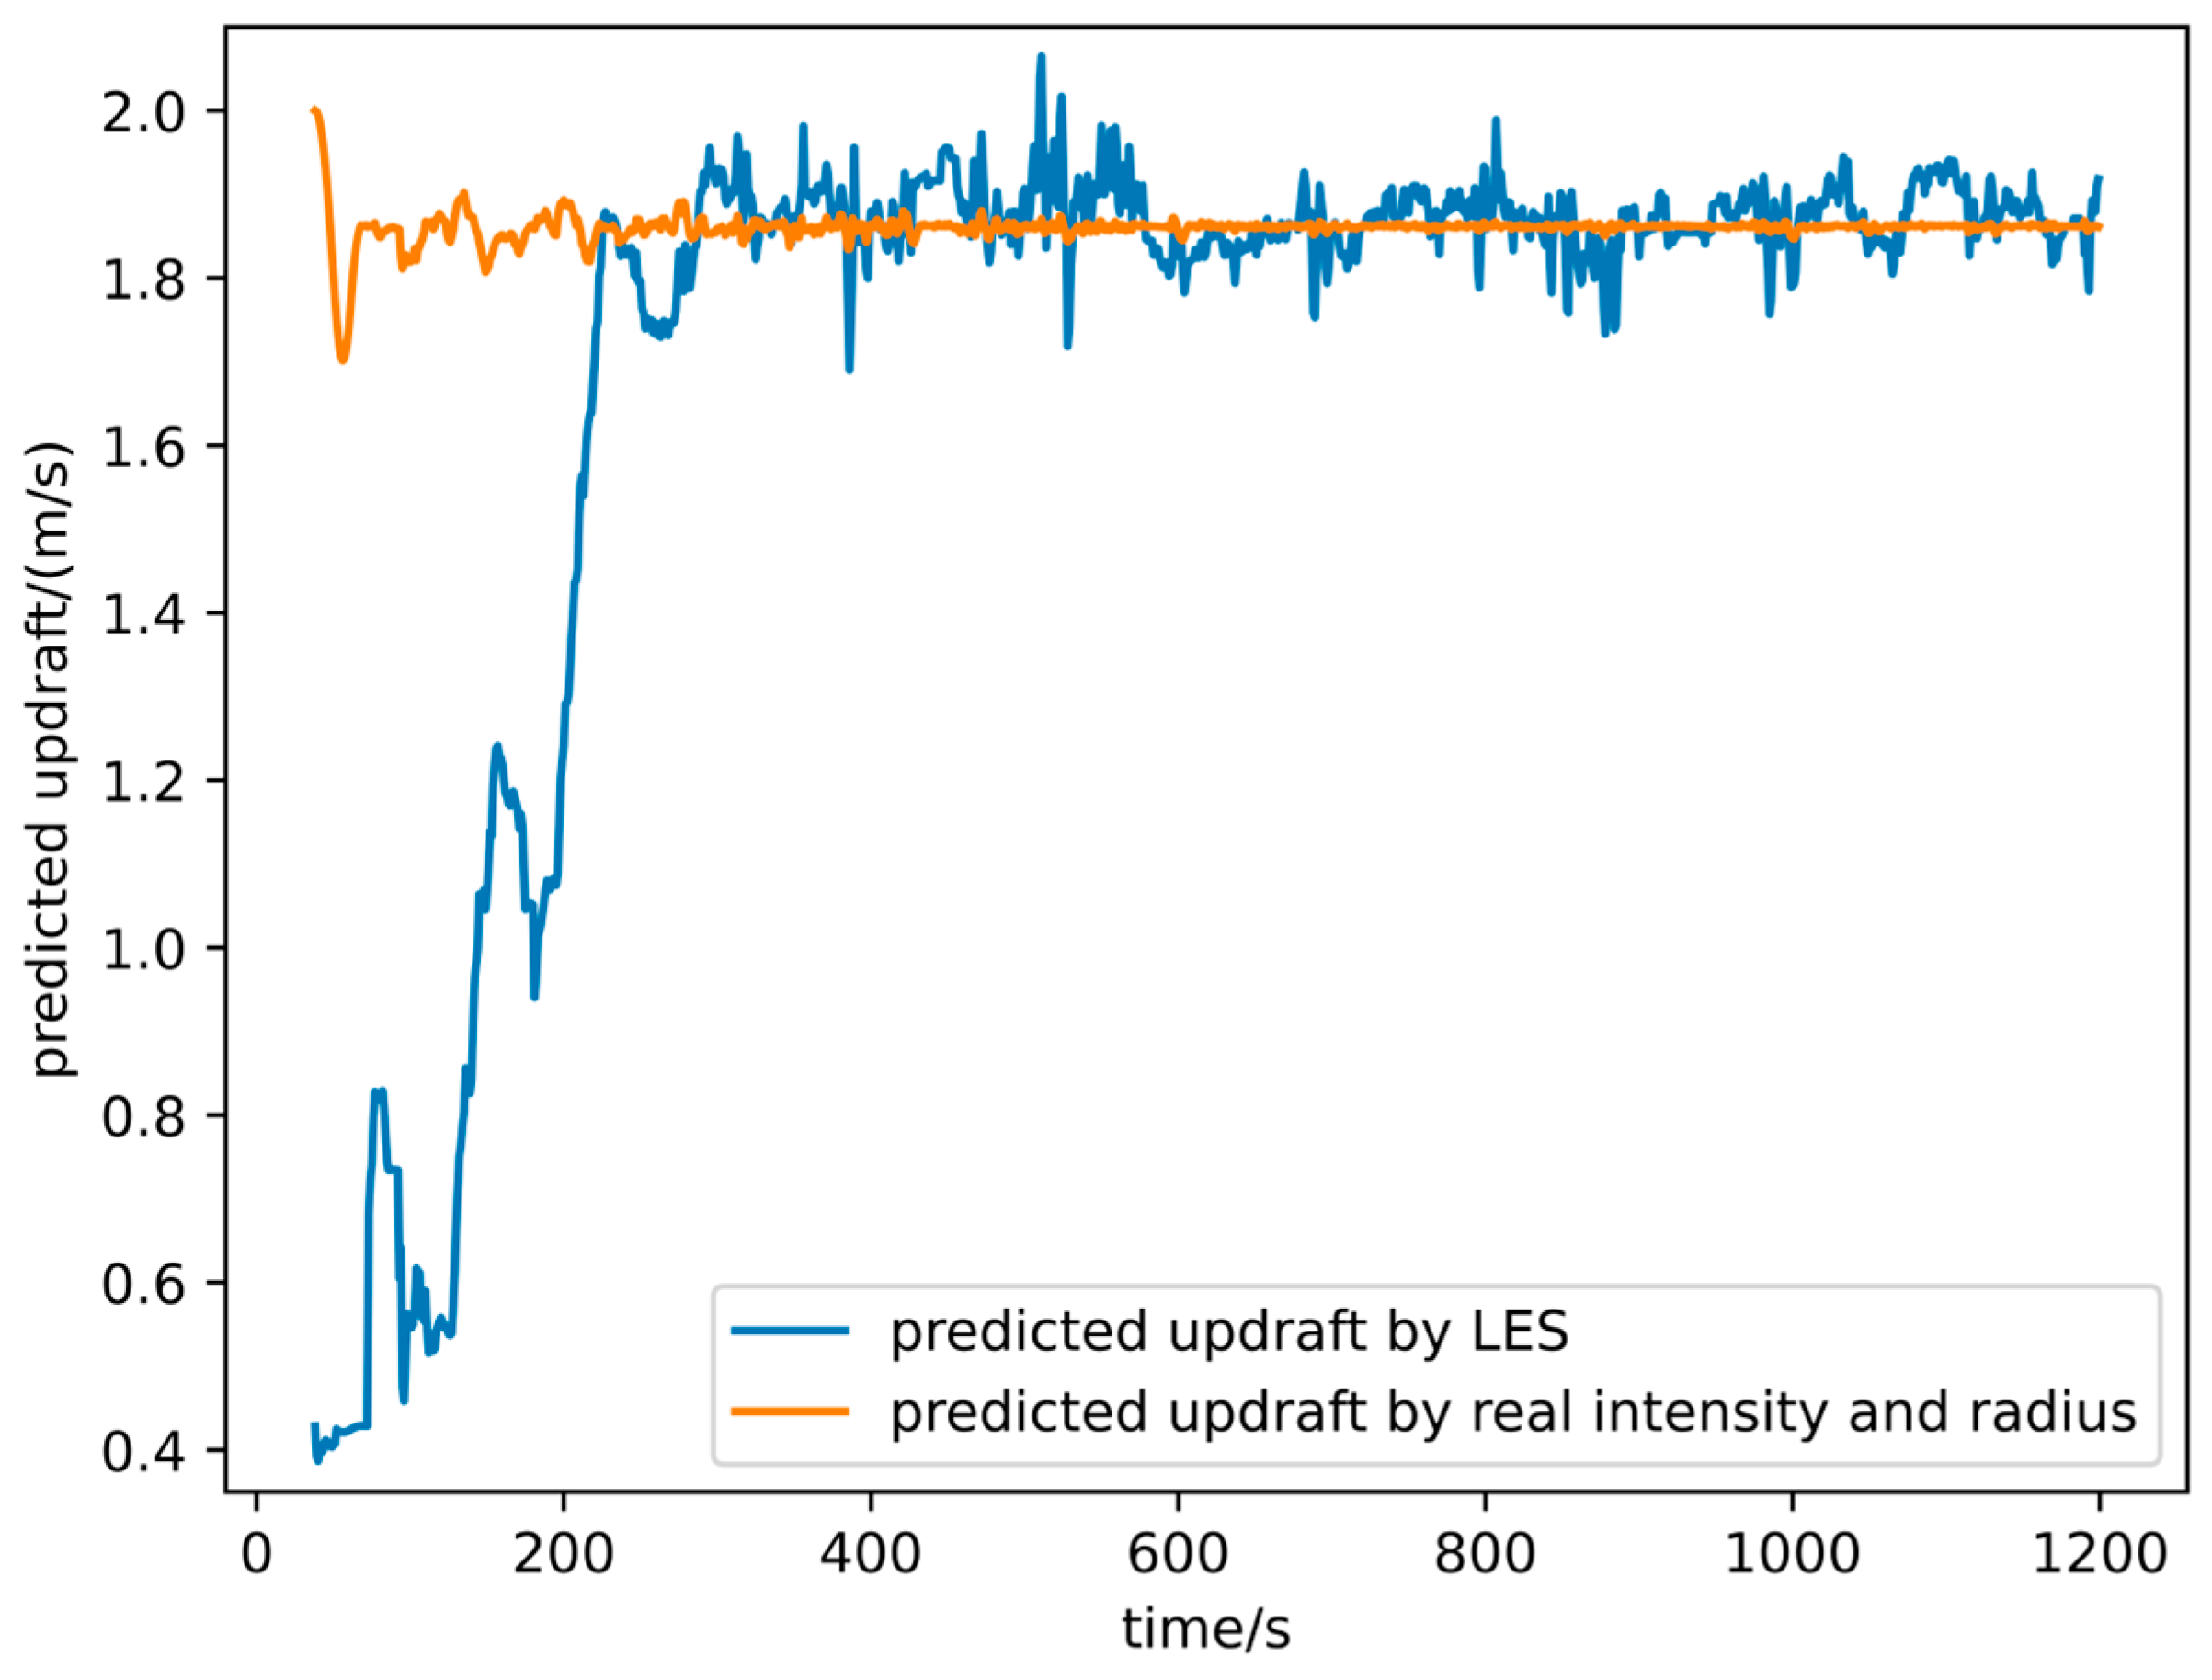
To verify the above explanation, consider a specific scenario where the true thermal updraft intensity and radius are known. In this scenario, the method can converge more rapidly and accurately to the actual thermal updraft center, providing a valuable reference for the predicted updraft. For case b, a comparison between the predicted updraft based on the actual thermal updraft radius and intensity and the predicted updraft based on OLS is shown in Figure 9.
Figure 9 indicates that although the OLS could not accurately predict the thermal updraft radius and intensity with a small amount of data, compared with the predictions based on the actual thermal updraft radius and intensity, the error of the OLS’s updraft predictions gradually reduced as the algorithm iterated. This reduction continued until convergence was achieved, resulting in slight fluctuations within a small range. This demonstrated that the OLS could approximate the distribution of thermal updrafts around the drone using a small number of data points. As a result, it assisted the EKF in converging quickly to the true thermal updraft center point with relatively low computational load.

3.2. Flight Experiments

3.2.1. Configuration

(1)
Drone platform
This study was based on the Talon fixed-wing drone platform (as shown in Figure 10) to conduct various flight tests in order to validate the effectiveness of the methods and systems. The general parameters of the drone are provided in Table 4.
Through CFD simulation analysis and flight testing of the Talon fixed-wing drone, its gliding performance and sink rate polar curve were obtained, as shown in Figure 11. The overall differences between the two methods of obtaining the sink rate polar curve were minimal. Considering the impact of environmental winds and sensor errors during flight testing, CFD simulation data were used to adjust the flight data. This adjusted result was considered the final sink rate polar curve for the Talon fixed-wing drone. From the graph, it can be observed that the Talon fixed-wing unmanned aircraft exhibited the minimum sink rate of 1.69 m/s at an airspeed of 8.53 m/s. Additionally, its optimal gliding performance, with a maximum lift-to-drag ratio of 7.5, occurred at an airspeed of 11.08 m/s.
(2)
Sensors
This platform was equipped with devices such as accelerometers, gyroscopes, magnetometers, barometers, airspeed sensors, GPS, and a data link. The detailed configuration of the sensors is shown in Figure 12 and Table 5.
(3)
Flight controller
During the flight tests, the takeoff and landing phases were controlled by the pilot. Once the drone reached the designated altitude under manual control, it was switched into autonomous soaring mode. In this mode, the propulsion system was turned off. When significant updrafts were not detected, the drone glided along the planned trajectory at the optimal glide speed, searching for thermal updrafts. Upon sensing significant updrafts, the EKF thermal updraft center prediction method based on OLS would update the thermal updraft center in real time at a frequency of 1 Hz, guiding the drone in static soaring. If the drone’s altitude dropped below a safety threshold or its airspeed fell below a safe speed, the propulsion system would automatically engage, guiding the drone back along the planned trajectory to regain the mission altitude before resuming autonomous soaring. In the event of low battery levels displayed on the ground station, the pilot would switch back to manual control mode to initiate the drone’s landing. The logic for transitioning between these flight modes is illustrated in Figure 13, and the corresponding flight parameter settings are provided in Table 6.
(4)
Experimental site
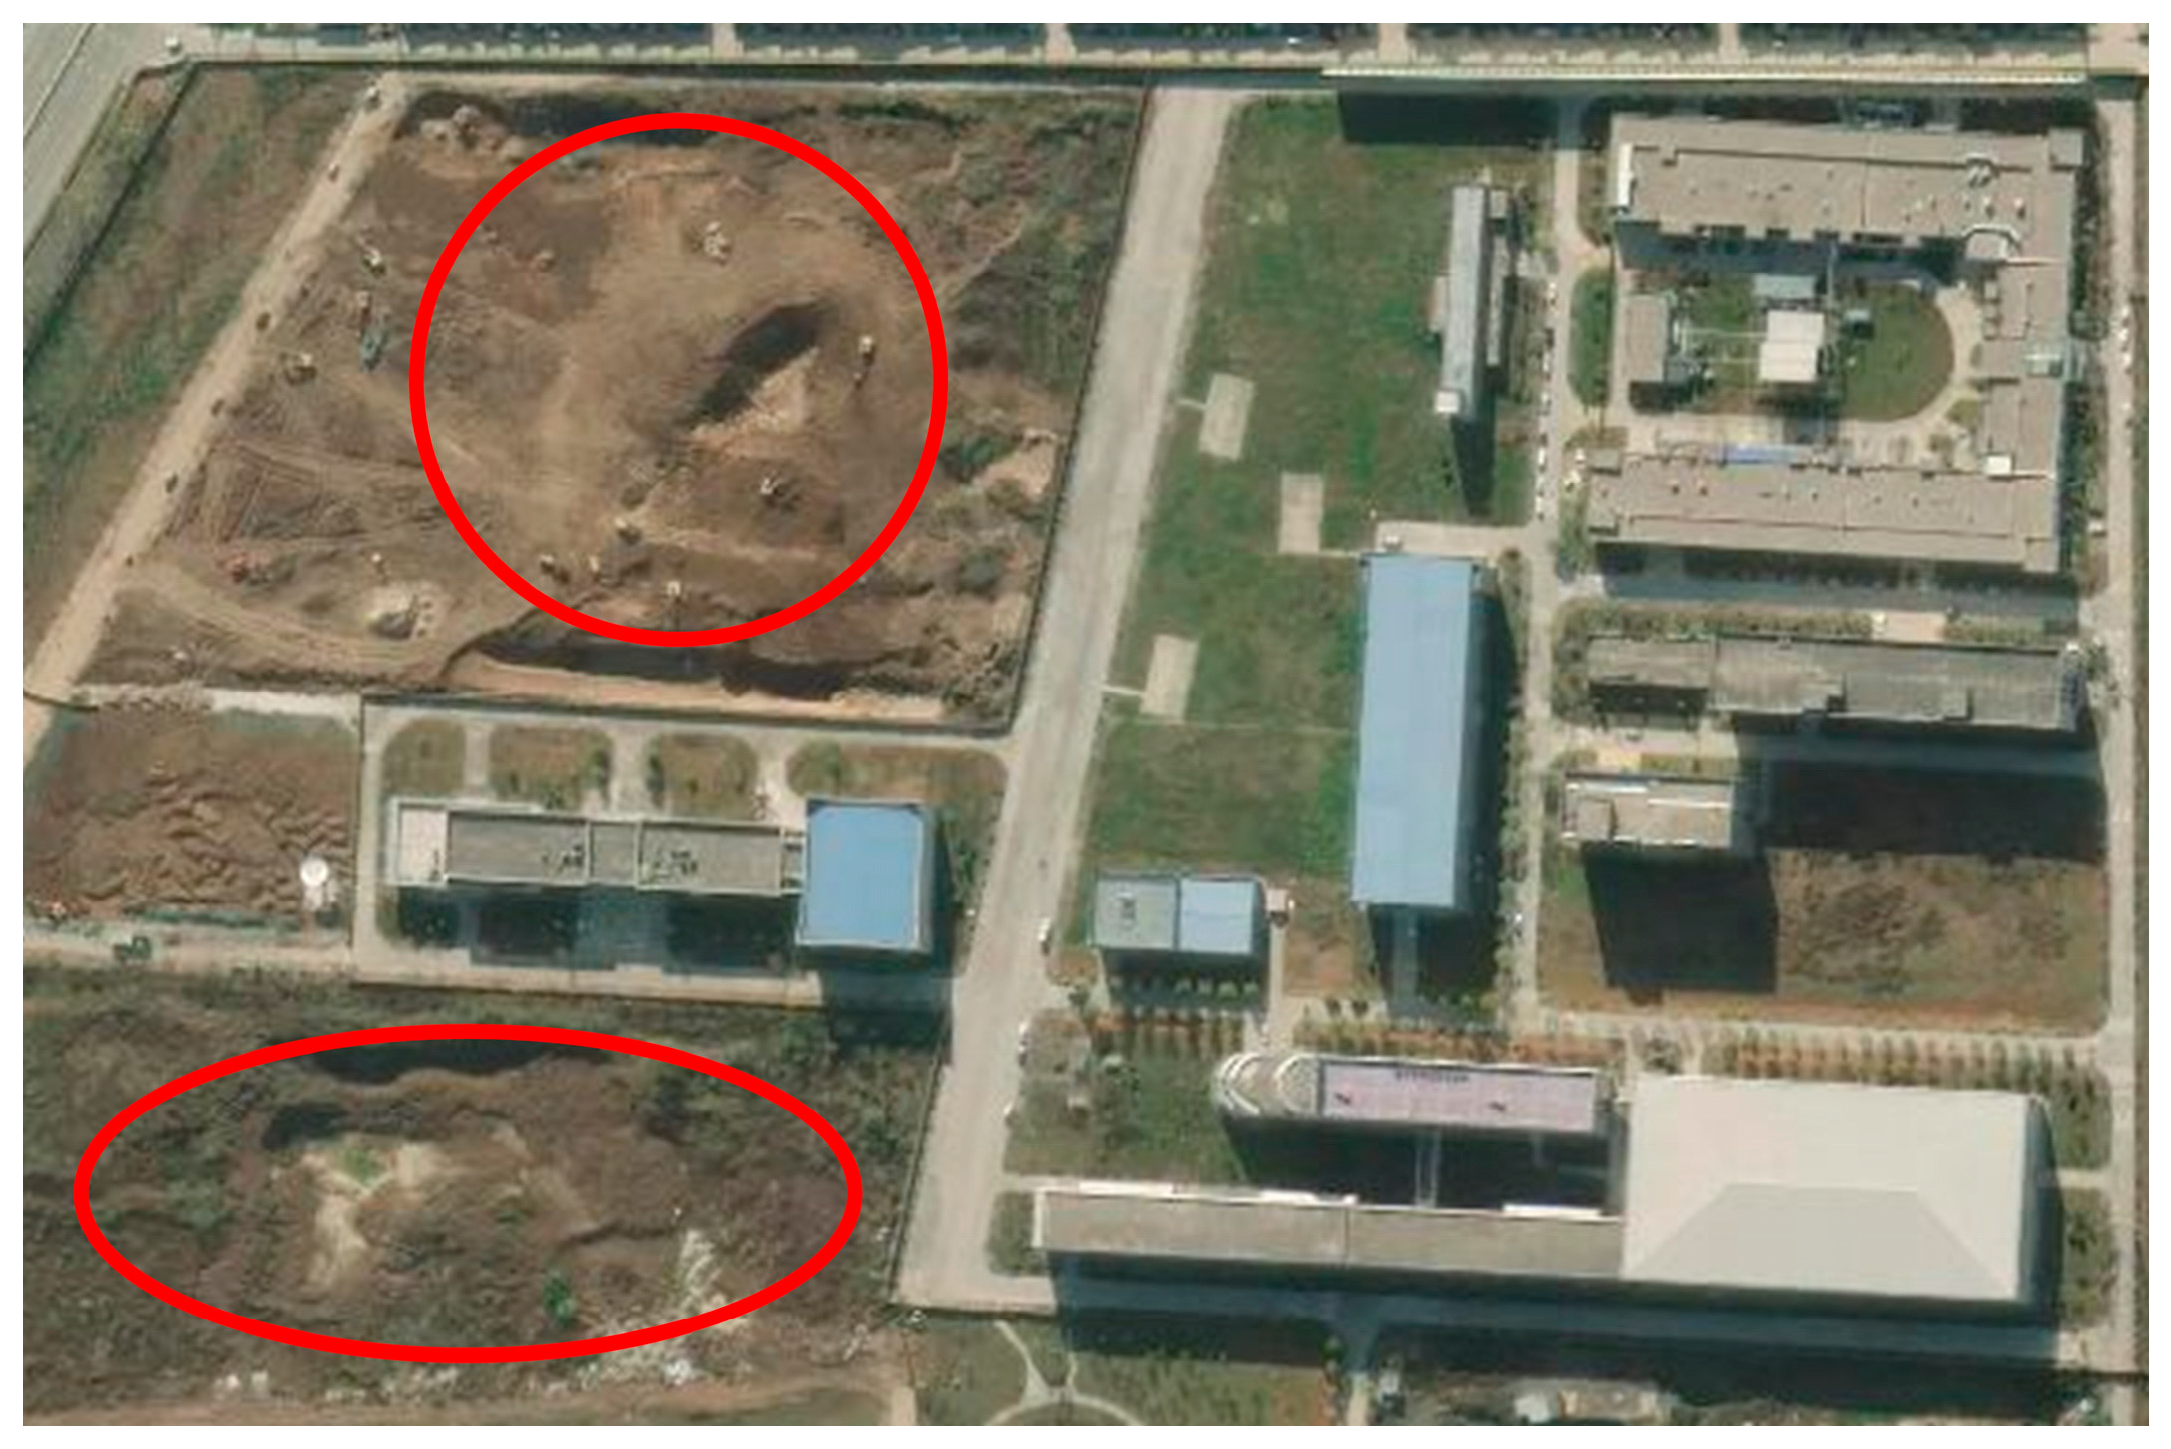
The flight experiments were conducted in a suburban area in northern China, as shown in Figure 14. The experimental site featured a concrete runway approximately 200 m in length, which served as the takeoff and landing strip. In addition, the experimental site also had two undeveloped construction areas (marked in Figure 14). These two construction sites, compared with the surrounding environment, had no vegetation or buildings to provide shade. Under the sun’s exposure, they could quickly heat up, generating updrafts. Therefore, the experiments took place between 7 June and 14 June in the year 2022, from 14:00 to 16:00 local time, ensuring clear weather conditions during each session. Within this time frame, the heating of the Earth’s surface by the sun reached its peak, making it conducive to generating thermal updrafts.

3.2.2. Results

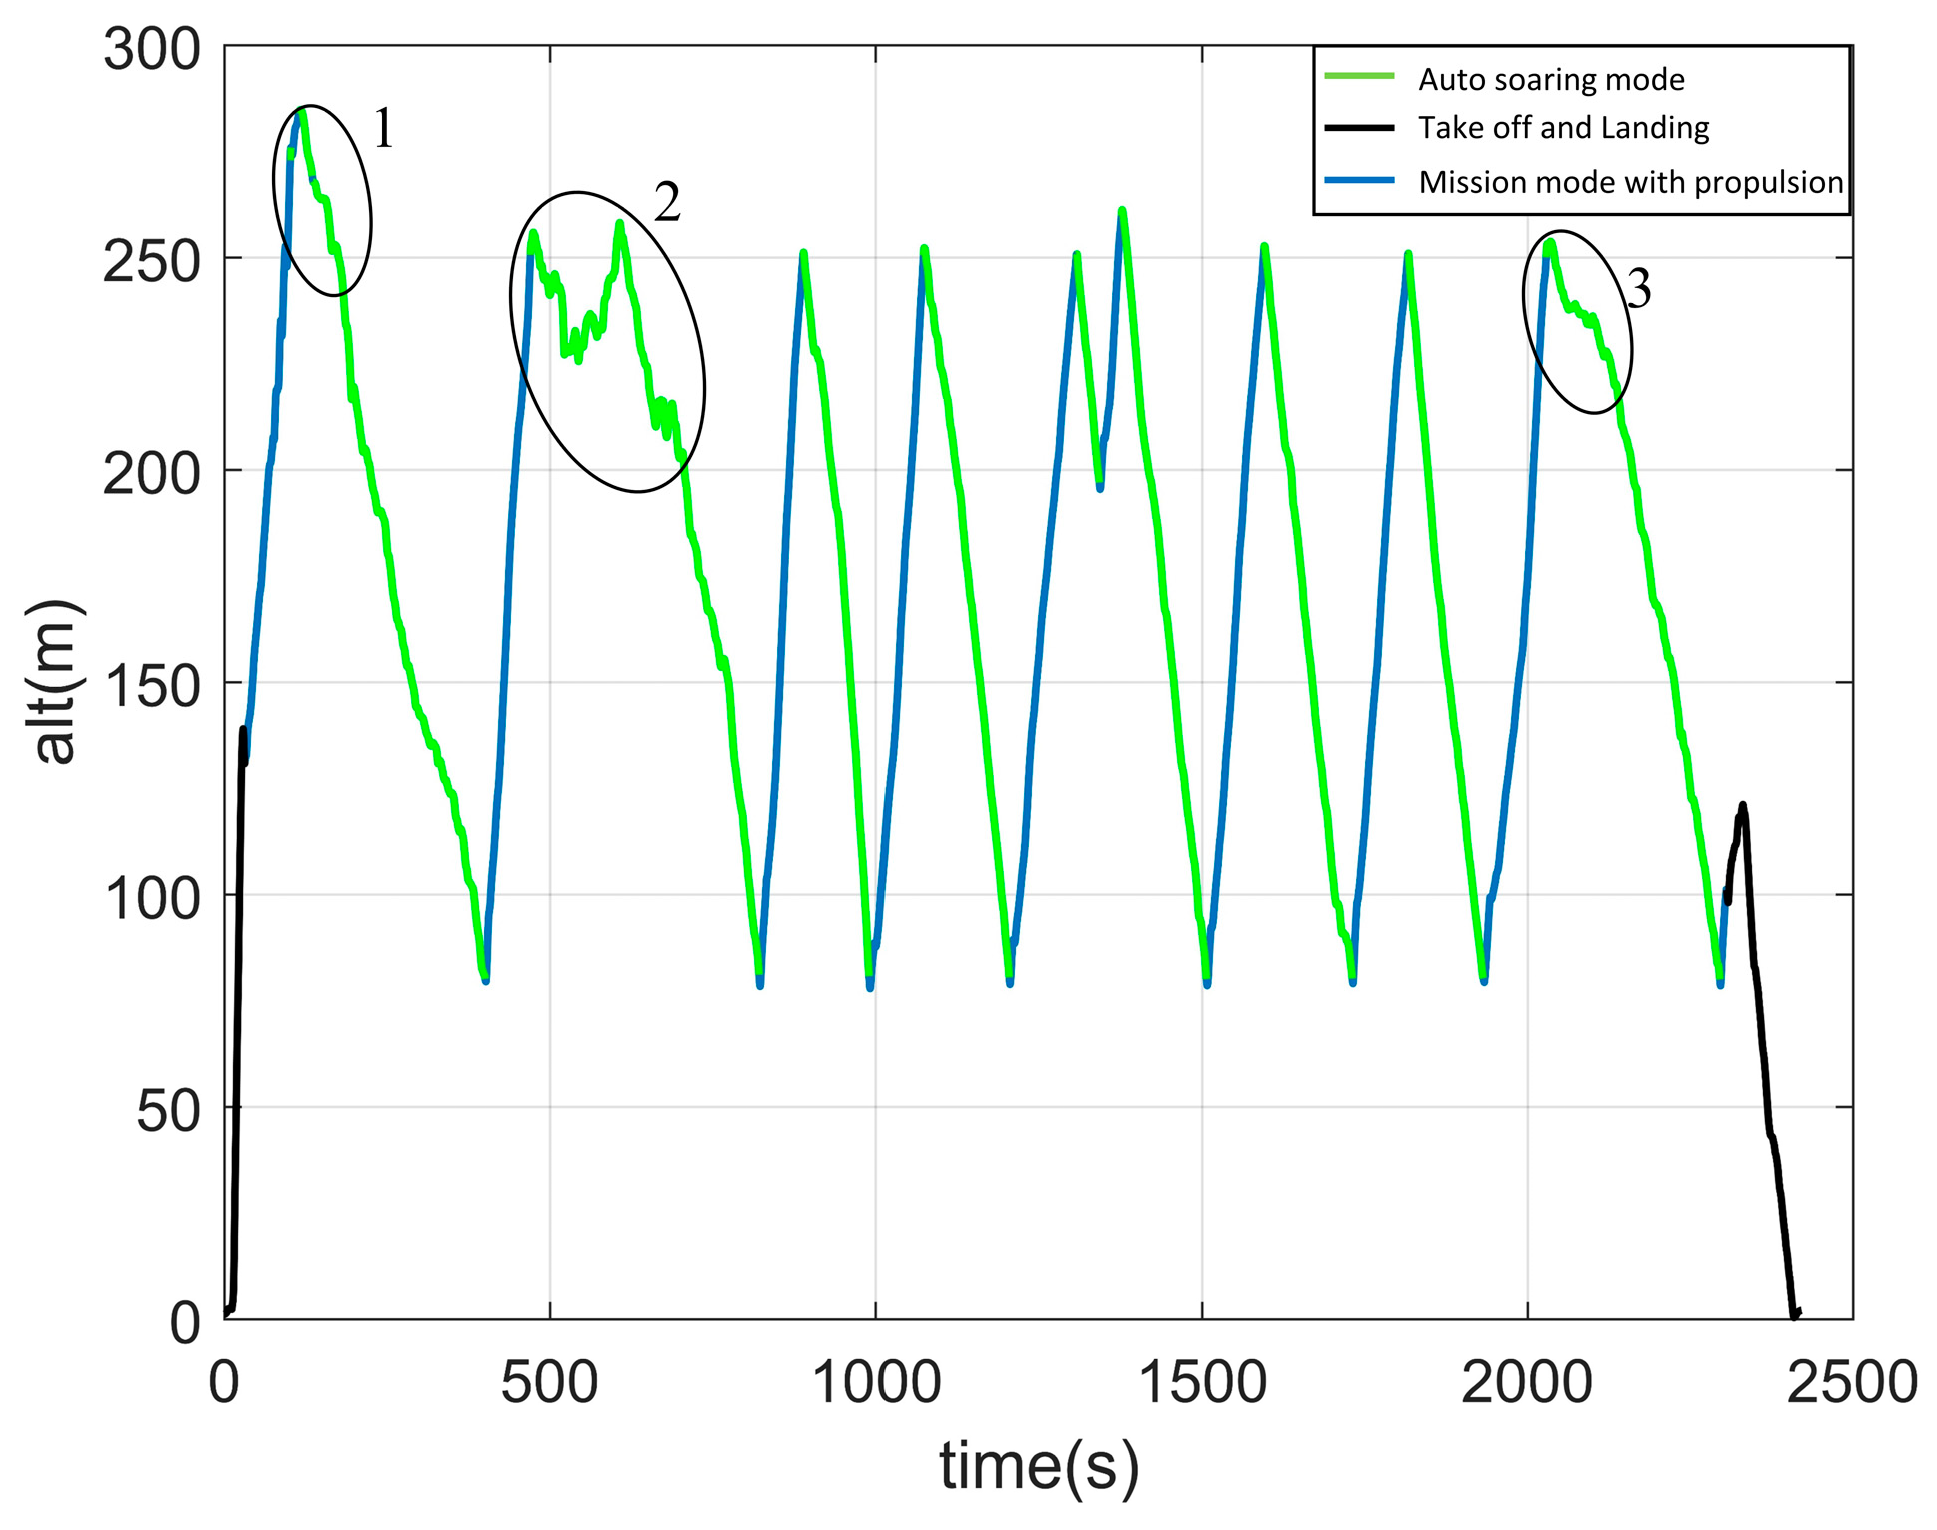
Figure 15 illustrates the altitude variation curve of the drone during the flight tests. The black line represents the takeoff and landing phases, the blue line represents the flight phase when the drone engaged its propulsion system to enter the mission mode, and the green line represents the flight phase when the drone deactivated its propulsion system for autonomous soaring. Throughout the entire flight experiment, the drone flew for approximately 40 min, with only about 8 min spent in powered flight mode. Observing the three segments marked with black circles in the altitude variation curve revealed that the drone’s altitude declines significantly slowed down or even achieved altitude gain. This demonstrated that the drone successfully performed static soaring within updrafts and acquired energy.
Figure 16 presents the 3D trajectory map of the drone throughout the entire flight test. The flight paths corresponding to the three segments of static soaring indicated in Figure 16 are labeled with black circles, and the thermal updraft centers predicted by the method during static soaring are also marked. The autonomous soaring system guided the drone to circle around the predicted thermal updraft center, thereby enabling the drone to perform static soaring within thermal updrafts.
Throughout the flight, the drone circled around the real-time predicted thermal updraft center, successfully performing static soaring within thermal updrafts and continuously acquiring energy. This demonstrated that the autonomous soaring system constructed using the EKF thermal updraft center prediction method based on OLS could effectively guide small drones in performing static soaring.

4. Discussion

Figure 17 zooms in on the static soaring flight trajectories from Figure 16 and displays the perceived updrafts. In “Static Soaring 1” and “Static Soaring 3”, the drone detected two stable thermal updrafts, but their intensities were too weak to maintain the drone’s altitude. As a result, the drone experienced a gradual descent until it exited static soaring. Upon observing the images, it became apparent that as the drone’s altitude changed, its perceived updraft also changed. This contradicts the assumption in Section 2.3 that the distribution of updrafts does not vary with altitude. This difference could potentially affect the drone’s performance in static soaring within weaker updrafts. This issue arises from limitations in the wind perception system. Since the current wind perception system can only operate with power off, the drone is unable to maintain altitude in weaker updrafts. In contrast to natural birds, which can compensate for altitude loss by flapping their wings slowly, the drone lacks this capability. In future research, it may be worthwhile to consider constructing a wind perception system that includes a power component and to develop an autonomous soaring controller capable of maintaining the drone’s altitude with minimal power in weaker updrafts.
In “Static Soaring 3,” The drone utilized a high-intensity thermal updraft to achieve altitude gain with the power off. However, this updraft appeared to be unstable, as the drone encountered descending airflows during flight, contrary to the predicted results. Natural flows in the real world often involve complex turbulence. The Wharington thermal updraft model used in this paper is a simplified one and may not account for such complexities. One approach to address this issue is to establish a more detailed wind field model with more parameters. However, this is expected to increase the complexity of the prediction method and impose a higher computational load on the small drones. Therefore, addressing this issue requires the collaborative development of mathematical methods and onboard miniaturized computers.

5. Conclusions

This paper employed an EKF thermal updraft center prediction method based on OLS to establish an autonomous soaring system for small drones. This system, via real-time perception of the updraft on drone’s current position, continuously estimated and updated the thermal updrafts center within the environment, guiding the small drone in static soaring. The conclusions drawn from this work are as follows:
(1)
The thermal updraft intensity and radius obtained by the prediction method showed significant differences and large fluctuations compared with the true values. This was due to the overfitting phenomenon resulting from the OLS only using a small number of data points. However, the overfitting results of the least squares method were effective in localized areas, enabling the accurate prediction of updrafts around the drone. Thus, the OLS could significantly reduce the complexity of the EKF thermal center prediction, allowing for real-time and stable updates of the center with minimal computational load.
(2)
The adaptive step size update strategy significantly enhanced the convergence characteristics of the original EKF, leading to rapid convergence. This strategy enabled the prediction method to adapt to weak updrafts. Even if the initial predicted center point were at the edge of the thermal, the method could swiftly converge to the actual thermal updraft center.
(3)
The developed autonomous soaring system was tested in flight on the Talon fixed-wing drone platform. The thermal updraft center was updated at a frequency of 1 Hz. The L1 navigation algorithm guided the drone to circle in flight around the predicted thermal updraft center. In the flight test, the drone successfully engaged in static soaring within thermal updrafts, continuously hovering and gaining energy. Throughout the approximately 40 min flight duration, the drone only utilized its propulsion for about 8 min. This confirmed the effectiveness of the autonomous soaring system using the EKF thermal updraft center prediction method based on OLS on guiding small drones effectively in static soaring.
(4)
The current autonomous soaring system can only operate in an unpowered state. In future work, there is a plan to create an autonomous soaring system for small drones that considers propulsion. This system can maintain the drone’s altitude using minimal power in weaker thermal updrafts. This enhancement will significantly boost the drone’s mission capabilities and energy harvesting from wind fields, thereby expanding its application scope.

Author Contributions

Conceptualization, W.A. and P.Z.; methodology, T.L.; software, T.L.; validation, T.L.; investigation, W.A. and P.Z.; resources, W.A. and P.Z.; data curation, T.L.; writing—original draft preparation, W.A. and T.L.; writing—review and editing, W.A. and T.L.; visualization, T.L.; supervision, W.A. and P.Z.; project administration, W.A. and P.Z.; funding acquisition, W.A. All authors have read and agreed to the published version of the manuscript.

Funding

This research received no external funding.

Data Availability Statement

Conflicts of Interest

The authors declare no conflict of interest.

References

  1. Watts, A.C.; Perry, J.H.; Smith, S.E.; Burgess, M.A.; Wilkinson, B.E.; Szantoi, Z.; Ifju, P.G.; Percival, H.F. Small unmanned aircraft systems for low-altitude aerial surveys. J. Wildl. Manag. 2010, 74, 1614–1619. [Google Scholar] [CrossRef]
  2. Pennycuick, C.J. Soaring behaviour and performance of some east African birds, observed from a motor-glider. Ibis 1972, 114, 178–218. [Google Scholar] [CrossRef]
  3. Pennycuick, C.J. Field Observations of Thermals and Thermal Streets, and the Theory of Cross-Country Soaring Flight. J. Avian Biol. 1998, 29, 33–43. [Google Scholar] [CrossRef]
  4. Pennycuick, C. The concept of energy height in animal locomotion: Separating mechanics from physiology. J. Theor. Biol. 2003, 224, 189–203. [Google Scholar] [CrossRef]
  5. Weimerskirch, H.; Bishop, C.; Jeanniard-du-Dot, T.; Prudor, A.; Sachs, G. Frigate birds track atmospheric conditions over months-long transoceanic flights. Science 2016, 353, 74–78. [Google Scholar] [CrossRef]
  6. De Monte, S.; Cotté, C.; d’Ovidio, F.; Lévy, M.; Le Corre, M.; Weimerskirch, H. Frigatebird behaviour at the ocean–atmosphere interface: Integrating animal behaviour with multi-satellite data. J. R. Soc. Interface 2012, 9, 3351–3358. [Google Scholar] [CrossRef]
  7. Weimerskirch, H.; Chastel, O.; Barbraud, C.; Tostain, O. Frigatebirds ride high on thermals. Nature 2003, 421, 333–334. [Google Scholar] [CrossRef]
  8. Taylor, G.K.; Reynolds, K.V.; Thomas, A.L.R. Soaring energetics and glide performance in a moving atmosphere. Philos. Trans. R. Soc. B Biol. Sci. 2016, 371, 20150398. [Google Scholar] [CrossRef]
  9. Norberg, U.M.L.; Brooke, A.P.; Trewhella, W.J. Soaring and Non-Soaring Bats of the Family Pteropodidae (Flying Foxes, Pteropus spp.): Wing Morphology and Flight Performance. J. Exp. Biol. 2000, 203, 651–664. [Google Scholar] [CrossRef]
  10. Khosravifard, S.; Venus, V.; Skidmore, A.K.; Bouten, W.; Muñoz, A.R.; Toxopeus, A.G. Identification of Griffon Vulture’s Flight Types Using High-Resolution Tracking Data. Int. J. Environ. Res. 2018, 12, 313–325. [Google Scholar] [CrossRef]
  11. Palomaki, R.T.; Rose, N.T.; van den Bossche, M.; Sherman, T.J.; De Wekker, S.F. Wind estimation in the lower atmosphere using multirotor aircraft. J. Atmos. Ocean. Technol. 2017, 34, 1183–1191. [Google Scholar] [CrossRef]
  12. Van den Kroonenberg, A.; Martin, T.; Buschmann, M.; Bange, J.; Vörsmann, P. Measuring the wind vector using the autonomous mini aerial vehicle M2AV. J. Atmos. Ocean. Technol. 2008, 25, 1969–1982. [Google Scholar] [CrossRef]
  13. Edwards, D. Implementation Details and Flight Test Results of an Autonomous Soaring Controller. In Proceedings of the AIAA Guidance, Navigation and Control Conference and Exhibit, Honolulu, Hawaii, 18–24 August 2008; p. 7244. [Google Scholar]
  14. Edwards, D.J.; Kahn, A.D.; Kelly, M.; Heinzen, S.; Scheiman, D.A.; Jenkins, P.P.; Walters, R.; Hoheisel, R. Maximizing Net Power in Circular Turns for Solar and Autonomous Soaring Aircraft. J. Aircr. 2016, 53, 1237–1247. [Google Scholar] [CrossRef]
  15. Langelaan, J.W.; Alley, N.; Neidhoefer, J. Wind Field Estimation for Small Unmanned Aerial Vehicles. J. Guid. Control Dyn. 2011, 34, 1016–1030. [Google Scholar] [CrossRef]
  16. Pachter, M.; Ceccarelli, N.; Chandler, P.R. Estimating MAV’s heading and the wind speed and direction using GPS, inertial and airspeed measurements. In Proceedings of the AIAA Guidance Navigation and Control Conference, Honolulu, HI, USA, 18–21 August 2008; p. 6311. [Google Scholar]
  17. Ákos, Z.; Nagy, M.; Leven, S.; Vicsek, T. Thermal soaring flight of birds and unmanned aerial vehicles. Bioinspiration Biomim. 2010, 5, 045003. [Google Scholar] [CrossRef]
  18. Lawrance, N.R.J.; Sukkarieh, S. Autonomous Exploration of a Wind Field with a Gliding Aircraft. J. Guid. Control. Dyn. 2011, 34, 719–733. [Google Scholar] [CrossRef]
  19. Lawrance, N.R.; Sukkarieh, S. Path planning for autonomous soaring flight in dynamic wind fields. In Proceedings of the 2011 IEEE International Conference on Robotics and Automation, Shanghai, China, 9–13 May 2011; pp. 2499–2505. [Google Scholar] [CrossRef]
  20. Singh, A.; Ramos, F.; Whyte, H.D.; Kaiser, W.J. Modeling and decision making in spatiotemporal processes for environmental surveillance. In Proceedings of the 2010 IEEE International Conference on Robotics and Automation, Anchorage, AK, USA, 3–7 May 2010; pp. 5490–5497. [Google Scholar]
  21. Lee, D.; Longo, S.; Kerrigan, E.C. Predictive Control for Soaring of Unpowered Autonomous UAVs. IFAC Proc. Vol. 2012, 45, 194–199. [Google Scholar] [CrossRef]
  22. Woodbury, T.; Dunn, C.; Valasek, J. Autonomous soaring using reinforcement learning for trajectory generation. In Proceedings of the 52nd AIAA Aerospace Sciences Meeting—AIAA Science and Technology Forum and Exposition, National Harbor, MD, USA, 13–17 January 2014; pp. 1–11. [Google Scholar]
  23. Li, W.; Shi, M.; Shi, L.; Lin, B.; Qin, K. Containment Tracking for Networked Agents Subject to Nonuniform Communication Delays. IEEE Trans. Netw. Sci. Eng. 2023, 1–12. [Google Scholar] [CrossRef]
  24. Li, W.; Qin, K.; Li, G.; Shi, M.; Zhang, X. Robust bipartite tracking consensus of multi-agent systems via neural network combined with extended high-gain observer. ISA Trans. 2023, 136, 31–45. [Google Scholar] [CrossRef]
  25. Allen, M. Updraft Model for Development of Autonomous Soaring Uninhabited Air Vehicles. In Proceedings of the 44th AIAA Aerospace Sciences Meeting and Exhibit, Reno, NV, USA, 9–12 January 2006; p. 1510. [Google Scholar] [CrossRef]
  26. Allen, M.J. Guidance and Control for an Autonomous Soaring UAV. U.S. Patent 7,431,243, 6 October 2008. pp. 58–61. [Google Scholar]
  27. Tabor, S.; Guilliard, I.; Kolobov, A. ArduSoar: An Open-Source Thermalling Controller for Resource-Constrained Autopilots. In Proceedings of the 2018 IEEE/RSJ International Conference on Intelligent Robots and Systems (IROS), Madrid, Spain, 1–5 October 2018; pp. 6255–6262. [Google Scholar]
  28. Bencatel, R. Thermal localization. In Proceedings of the 2010 International Conference on Autonomous and Intelligent Systems, AIS, Povoa de Varzim, Portugal, 21–23 June 2010; pp. 1–6. [Google Scholar]
  29. Hazard, M. Unscented Kalman Filtering for Real-Time Atmospheric Thermal Tracking; North Carolina State University: Raleigh, NC, USA, 2010. [Google Scholar]
  30. Depenbusch, N.T.; Bird, J.J.; Langelaan, J.W. The AutoSOAR autonomous soaring aircraft, part 1: Autonomy algorithms. J. Field Robot. 2018, 35, 868–889. [Google Scholar] [CrossRef]
  31. Notter, S.; Groß, P.; Schrapel, P.; Fichter, W. Multiple Thermal Updraft Estimation and Observability Analysis. J. Guid. Control. Dyn. 2020, 43, 490–503. [Google Scholar] [CrossRef]
  32. Liu, L.; Song, B.; An, W.; Yang, X.; Xuan, J. A UAV Wind Field Perception System Inspired by Biological Perception. Appl. Sci. 2023, 13, 6743. [Google Scholar] [CrossRef]
Figure 1. The autonomous soaring controller. The blue box is the sensor module, the green box is the wind field perception module, the orange box is the thermal updraft center prediction module, and the yellow box is the navigation module.
Drones 07 00603 g001
Figure 2. Wind field sensing system block diagram. The blue box is the sensor module, and the green box is the wind field perception module.
Drones 07 00603 g002
Figure 3. Noise distribution of wind measurement in the wind perception system relative to wind vane sensor.
Drones 07 00603 g003
Figure 4. Block diagram of the EKF thermal updraft center prediction method based on OLS. The blue box is the sensor module, the green box is the wind field perception module, and the orange box is the thermal updraft center prediction module.
Drones 07 00603 g004
Figure 5. Simulation environment of the autonomous soaring system.
Drones 07 00603 g005
Figure 6. Simulation of the flight trajectory of the eight cases in Table 2. (a) EKF thermal updraft center prediction method based on OLS with adaptive update step size strategy in the updraft (W = 1 m/s, R = 300 m). (b) EKF thermal updraft center prediction method based on OLS with adaptive update step size strategy in the updraft (W = 2.0 m/s, R = 300 m). (c) EKF thermal updraft center prediction method based on OLS with fixed update step size strategy (step size is 1) in the updraft (W = 1 m/s, R = 300 m). (d) EKF thermal updraft center prediction method based on OLS with fixed update step size strategy (step size is 1) in the updraft (W = 2.0 m/s, R = 300 m). (e) EKF thermal updraft center prediction method with adaptive update step size strategy in the updraft (W = 1 m/s, R = 300 m). (f) EKF thermal updraft center prediction method with adaptive update step size strategy in the updraft (W = 2.0 m/s, R = 300 m). (g) EKF thermal updraft center prediction method with fixed update step size strategy (step size is 1) in the updraft (W = 1 m/s, R = 300 m). (h) EKF thermal updraft center prediction method with fixed update step size strategy (step size is 1) in the updraft (W = 2.0 m/s, R = 300 m).
Drones 07 00603 g006aDrones 07 00603 g006b
Figure 7. The convergence curves for the eight cases. Solid lines represent the case with W = 1.0 m/s, while dashed lines represent the case with W = 2.0 m/s, and different colors represent the use of different thermal updraft center prediction methods.
Drones 07 00603 g007
Figure 8. The prediction results of thermal intensity and thermal radius in case b, where the orange curve is the real thermal intensity and real thermal radius, and the blue curve is the thermal intensity and thermal radius predicted by OLS.
Drones 07 00603 g008
Figure 9. The predicted updraft of the drone’s current position based on Equation (5) in case b. The blue curve is the prediction result based on OLS, and the orange curve is the prediction result based on the real intensity and real radius.
Drones 07 00603 g009
Figure 10. Talon fixed-wing drone platform.
Drones 07 00603 g010
Figure 11. Glide performance of the Talon fixed-wing drone.
Drones 07 00603 g011
Figure 12. The configuration of sensors in Talon fixed-wing drone platform.
Drones 07 00603 g012
Figure 13. Switching logic between flight modes.
Drones 07 00603 g013
Figure 14. Top view of the experimental site.
Drones 07 00603 g014
Figure 15. Altitude variation during the flight test. The static soaring segments are marked with black circles.
Drones 07 00603 g015
Figure 16. A 3D trajectory map of the flight experiment.
Drones 07 00603 g016
Figure 17. Static soaring flight paths during the flight test.
Drones 07 00603 g017
Table 1. Noise parameters of the wind field perception system relative to the wind beacon sensor.
ParameterMean Value ( m / s ) Standard Deviation ( m / s )
W i n d N 0.06260.139
W i n d E 0.04590.144
U p d r a f t 0.07830.157
Table 2. Case settings of simulation experiments.
Case IndexUpdraftOLSAdaptive Update Step Size
(a)W = 1 m/s, R = 300 mYesYes
(b)W = 2 m/s, R = 300 mYesYes
(c)W = 1 m/s, R = 300 mYesNo
(d)W = 2 m/s, R = 300 mYesNo
(e)W = 1 m/s, R = 300 mNoYes
(f)W = 2 m/s, R = 300 mNoYes
(g)W = 1 m/s, R = 300 mNoNo
(h)W = 2 m/s, R = 300 mNoNo
Table 3. Parameter setting of the thermal updraft center prediction method.
ParametersValue
Update frequency1.0 Hz
Queue length25
ω010.0
t0300 s
Updraft threshold0.314 m/s
Circling radius80 m
Minimum circling radius50 m
Table 4. General parameters of the Talon fixed-wing drone.
ParametersValue
Wing span1.718 m
Wing area0.545 m2
Mean chord length0.185 m
Length1.100 m
Weight1.050 kg
Table 5. The sensor model of the Talon fixed-wing drone.
ComponentsModel
ProcessorSTM32F765/STM32F100
IMUICM-20689/BMI055
MagnetometerIST8310
BarometerMS5611×2
Airspeed meterMS5525
GPSNEO3-GNSS
Data linkP9-Radio
Electric machineX4120/KV480
Table 6. Flight parameter settings of the autonomous soaring controller.
ParametersValue
Mission airspeed12 m/s
Mission altitude250 m
Safe altitude80 m
Safe airspeed6.5 m/s
Gliding airspeed11.0 or 8.5 m/s
Circling radius80 m
Disclaimer/Publisher’s Note: The statements, opinions and data contained in all publications are solely those of the individual author(s) and contributor(s) and not of MDPI and/or the editor(s). MDPI and/or the editor(s) disclaim responsibility for any injury to people or property resulting from any ideas, methods, instructions or products referred to in the content.