Article

Strapdown Celestial Attitude Estimation from Long Exposure Images for UAV Navigation

1
School of Engineering, University of South Australia, Mawson Lakes, SA 5095, Australia
2
Joint and Operations Analysis Division, Defence Science and Technology Group, Melbourne, VIC 3207, Australia
*
Author to whom correspondence should be addressed.
Drones 2023, 7(1), 52; https://doi.org/10.3390/drones7010052
Submission received: 13 December 2022 / Revised: 9 January 2023 / Accepted: 9 January 2023 / Published: 12 January 2023

Abstract

:
Strapdown celestial imaging sensors provide a compact, lightweight alternative to their gimbaled counterparts. Strapdown imaging systems typically require a wider field of view, and consequently longer exposure intervals, leading to significant motion blur. The motion blur for a constellation of stars results in a constellation of trails on the image plane. We present a method that extracts the path of these star trails, and uses a linearized weighted least squares approach to correct noisy inertial attitude measurements. We demonstrate the validity of this method through its application to synthetically generated images, and subsequently observe its relative performance by using real images. The findings of this study indicate that the motion blur present in strapdown celestial imagery yields an a posteriori mean absolute attitude error of less than 0.13 degrees in the yaw axis, and 0.06 degrees in the pitch and roll axes (3 σ ) for a calibrated wide-angle camera lens. These findings demonstrate the viability of low-cost, wide-angle, strapdown celestial attitude sensors on lightweight UAV hardware.

1. Introduction

The use of stabilized celestial navigation sensors for uncrewed aerial vehicle (UAV) attitude determination is well documented [1]. With recent demand for size, weight and power constrained systems, strapdown celestial sensors have become more common. A strapdown [2] celestial navigation sensor is rigidly mounted to the airframe, causing imagery to be subjected to motion artefacts from the aircraft, such as actuation, vibration and turbulence. The length of the exposure window is the primary factor governing the severity of the resultant motion blur. For wide-angled lenses, it is necessary to use longer exposure windows so as to increase the total light energy incident on the sensor. Under stable flight conditions, longer exposure windows enable the detection of higher magnitude stars, and consequently provide a more accurate attitude estimate. Under motion, however, the longer exposure window results in "smearing" of star images, leaving a trail as seen in Figure 1. This image shows a region of interest (ROI) containing a single star trail captured in-flight from a strapdown celestial imaging system. We can see from this ROI that the resultant trail tends to be noisy, and the angular velocity tends to change throughout the exposure interval.
The premise for this research comes from the hypothesis that the observed star trails contain high-resolution information pertaining to the attitude of the aircraft during the exposure window. We present a method which estimates high-resolution attitude data from long-exposure images, provided availability of a low resolution approximation from the autopilot (e.g., from an inertial measurement unit). This method makes use of long-exposure strapdown imagery simulation, presented in [3], to provide an initial approximation of the star trail location and orientation, and corrects for attitude and attitude rate errors from the inertial unit. We demonstrate the effectiveness of this method in estimating aircraft attitude under high motion conditions.
The method presented in this paper is unique in the domain of drone navigation. Similar research has been conducted in the field of satellite navigation for the removal of motion blur. A common technique for the removal of motion blur includes estimation of the blur kernel. Knowledge of the kernel enables methods such as inverse filtering and Wiener filtering to correct the motion-blurred image. Estimation of the blur kernel is typically straightforward when analyzing stellar imagery, due to the sparsity of the stars; thus, it is is common practice to estimate the kernel parameters as seen in [4] and apply filters that utilize this kernel, as seen in [5,6]. While offering an effective means of removing motion blur in satellite imagery, such approaches tend not to capture rotational motion about the optical axis, due to the assumption that the blur kernel is spatially invariant. The method presented in [7] does explicitly take into account rotation about the boresight; however, the linear approximation used in this method is not applicable for UAV applications.
The work presented in [8] estimates the motion parameters of a given image, and uses this information to estimate the centroid of a blurred star. This assumes that there exists a global degradation function, which tends not to be the case for UAV navigation. The method presented in [9] uses an attitude correlated frames approach, in which the attitude between frames is measured with a gyroscope to within 1 arcsecond precision. This work also assumes that the rotation about the optical axis is negligible. The approach in [10] identifies correlation between subsequent short-exposure frames, and superimposes these frames to generate a long exposure image. This approach is limited by the sensor sensitivity, however, due to the need to identify stars from the shorter exposure images.
We can see in Figure 1 that the assumption of a spatially invariant blur kernel does not hold true when factors such as turbulence and aircraft control are taken into consideration. The aircraft will typically experience rotation about the yaw axis to some extent, leading to spatial variations in the motion blur on the imaging plane. Additionally, correlated frames approaches, such as those seen in [9,10], require levels of sensitivity from the imaging equipment that are not achievable with lightweight hardware at low altitudes. Furthermore, inertially aided approaches to noise removal tend to assume that gyroscope measurements contain negligible error, as seen in [9]. We observe that, especially with low-cost UAV hardware, angular rate measurements tend to be subjected to multiple sources of noise, and thus do not offer the level of precision required to perform image stabilization.
The method presented here is unique in that no attempt is made at denoising the image. Rather, we detect points from each star trail that are correlated, and infer the attitude by using a least-squares approximation that corrects the noisy inertial navigation system (INS) attitude measurements. This approach gives rise to potential use cases such as in-flight magnetometer calibration and thermal photogrammetry. Additionally, this may be used to correlate points from different star trails within a single frame, enabling the use of traditional point-source celestial imaging techniques, such as camera calibration [11] and star identification/tracking [12].

2. Methods

The methodology outlined in this section assumes that the camera orientation, relative to the aircraft body frame, is calibrated and fixed throughout the flight. It also assumes that the camera calibration matrix is known. These calibrations are conducted prior to takeoff.
The following steps are performed in attitude estimation:
  • Estimate the theoretical curve of the star trail on the image plane by using INS measurements.
  • Apply a smoothing filter, morphological operations, and clustering to extract the star trail for each star with brightness above a given magnitude threshold.
  • Apply a thinning algorithm on each star trail to remove the effects of Gaussian point-spread diffusion.
  • Identify the endpoints of each star trail given the INS-simulated approximation.
  • Use the endpoints of the thinned star trails, along with the endpoints of the INS approximation, to compute the weighted least squares approximation for the mean attitude offset throughout the exposure window.
  • For each point in the mean-error corrected INS approximation, compute the least squares approximation of the precise attitude offset.
This method is valid for star trails which form a simple curve with observable endpoints on the image plane. Complex curves create ambiguity in the apparent motion of the airframe.

2.1. Image Processing

We denote the series of n INS attitude measurements (pertaining to a long-exposure image) as
r i = ϕ θ ψ
for attitude measurement i with roll ϕ , pitch θ and yaw ψ . We compute the theoretical curve of the star trails on the image plane following the methodology in [3], denoted s j , for star j. Initial corrections to right ascension and declination are applied given annual proper motion, precession, nutation, and aberration given the location of the aircraft and time of flight. These corrections are only applied once per flight, prior to further calculations.
Given the hour-angle of a star, ω , the local elevation E l of a celestial body given declination δ and latitude L a t is computed:
E l = asin sin ( δ ) sin ( L a t ) + cos ( δ ) cos ( L a t ) cos ( ω )
and the local azimuth, A z , is given by:
A z = atan 2 sin ( ω ) , cos ( ω ) sin ( L a t ) tan ( δ ) cos ( L a t ) + π .
We subsequently correct for refraction, given by
R = 1.02 tan E l + 10.3 E l + 5.11 ,
where R is the refractive distance, expressed in arcminutes; thus, the apparent elevation of a star E l is then given by
E l = E l + R .
Given the azimuth and elevation of a star, the corresponding unit vector in northeast-down (NED) coordinates is given by
X = cos ( A z ) cos ( E l ) Y = sin ( A z ) cos ( E l ) Z = sin ( E l ) .
The rotation from the local NED frame to the aircraft frame is computed from the roll, pitch, and yaw of attitude measurement i, represented as matrix C a / n e d . The transformation from aircraft to camera frame, C c / a , remains constant, and is determined by the orientation of the camera with respect to the inertial unit. The unit vector in local NED coordinates v l is then transformed to the camera frame of reference, v c :
v c = C c / a C a / l v l .
For components x, y and z of unit vector v c , we compute the homogeneous point P in the camera frame of reference:
P = X Z Y Z 1 .
The camera intrinsic matrix, K , is assumed to be known, given by
K = f x 0 x 0 0 f y y 0 0 0 1 ,
where f x and f y are the focal lengths in the x and y axes, respectively, and  x 0 and y 0 are the x and y locations of the principal point on the image plane. Thus, the pixel location, s j [ i ] , of the star for attitude measurement i is computed:
s j [ i ] = K P .
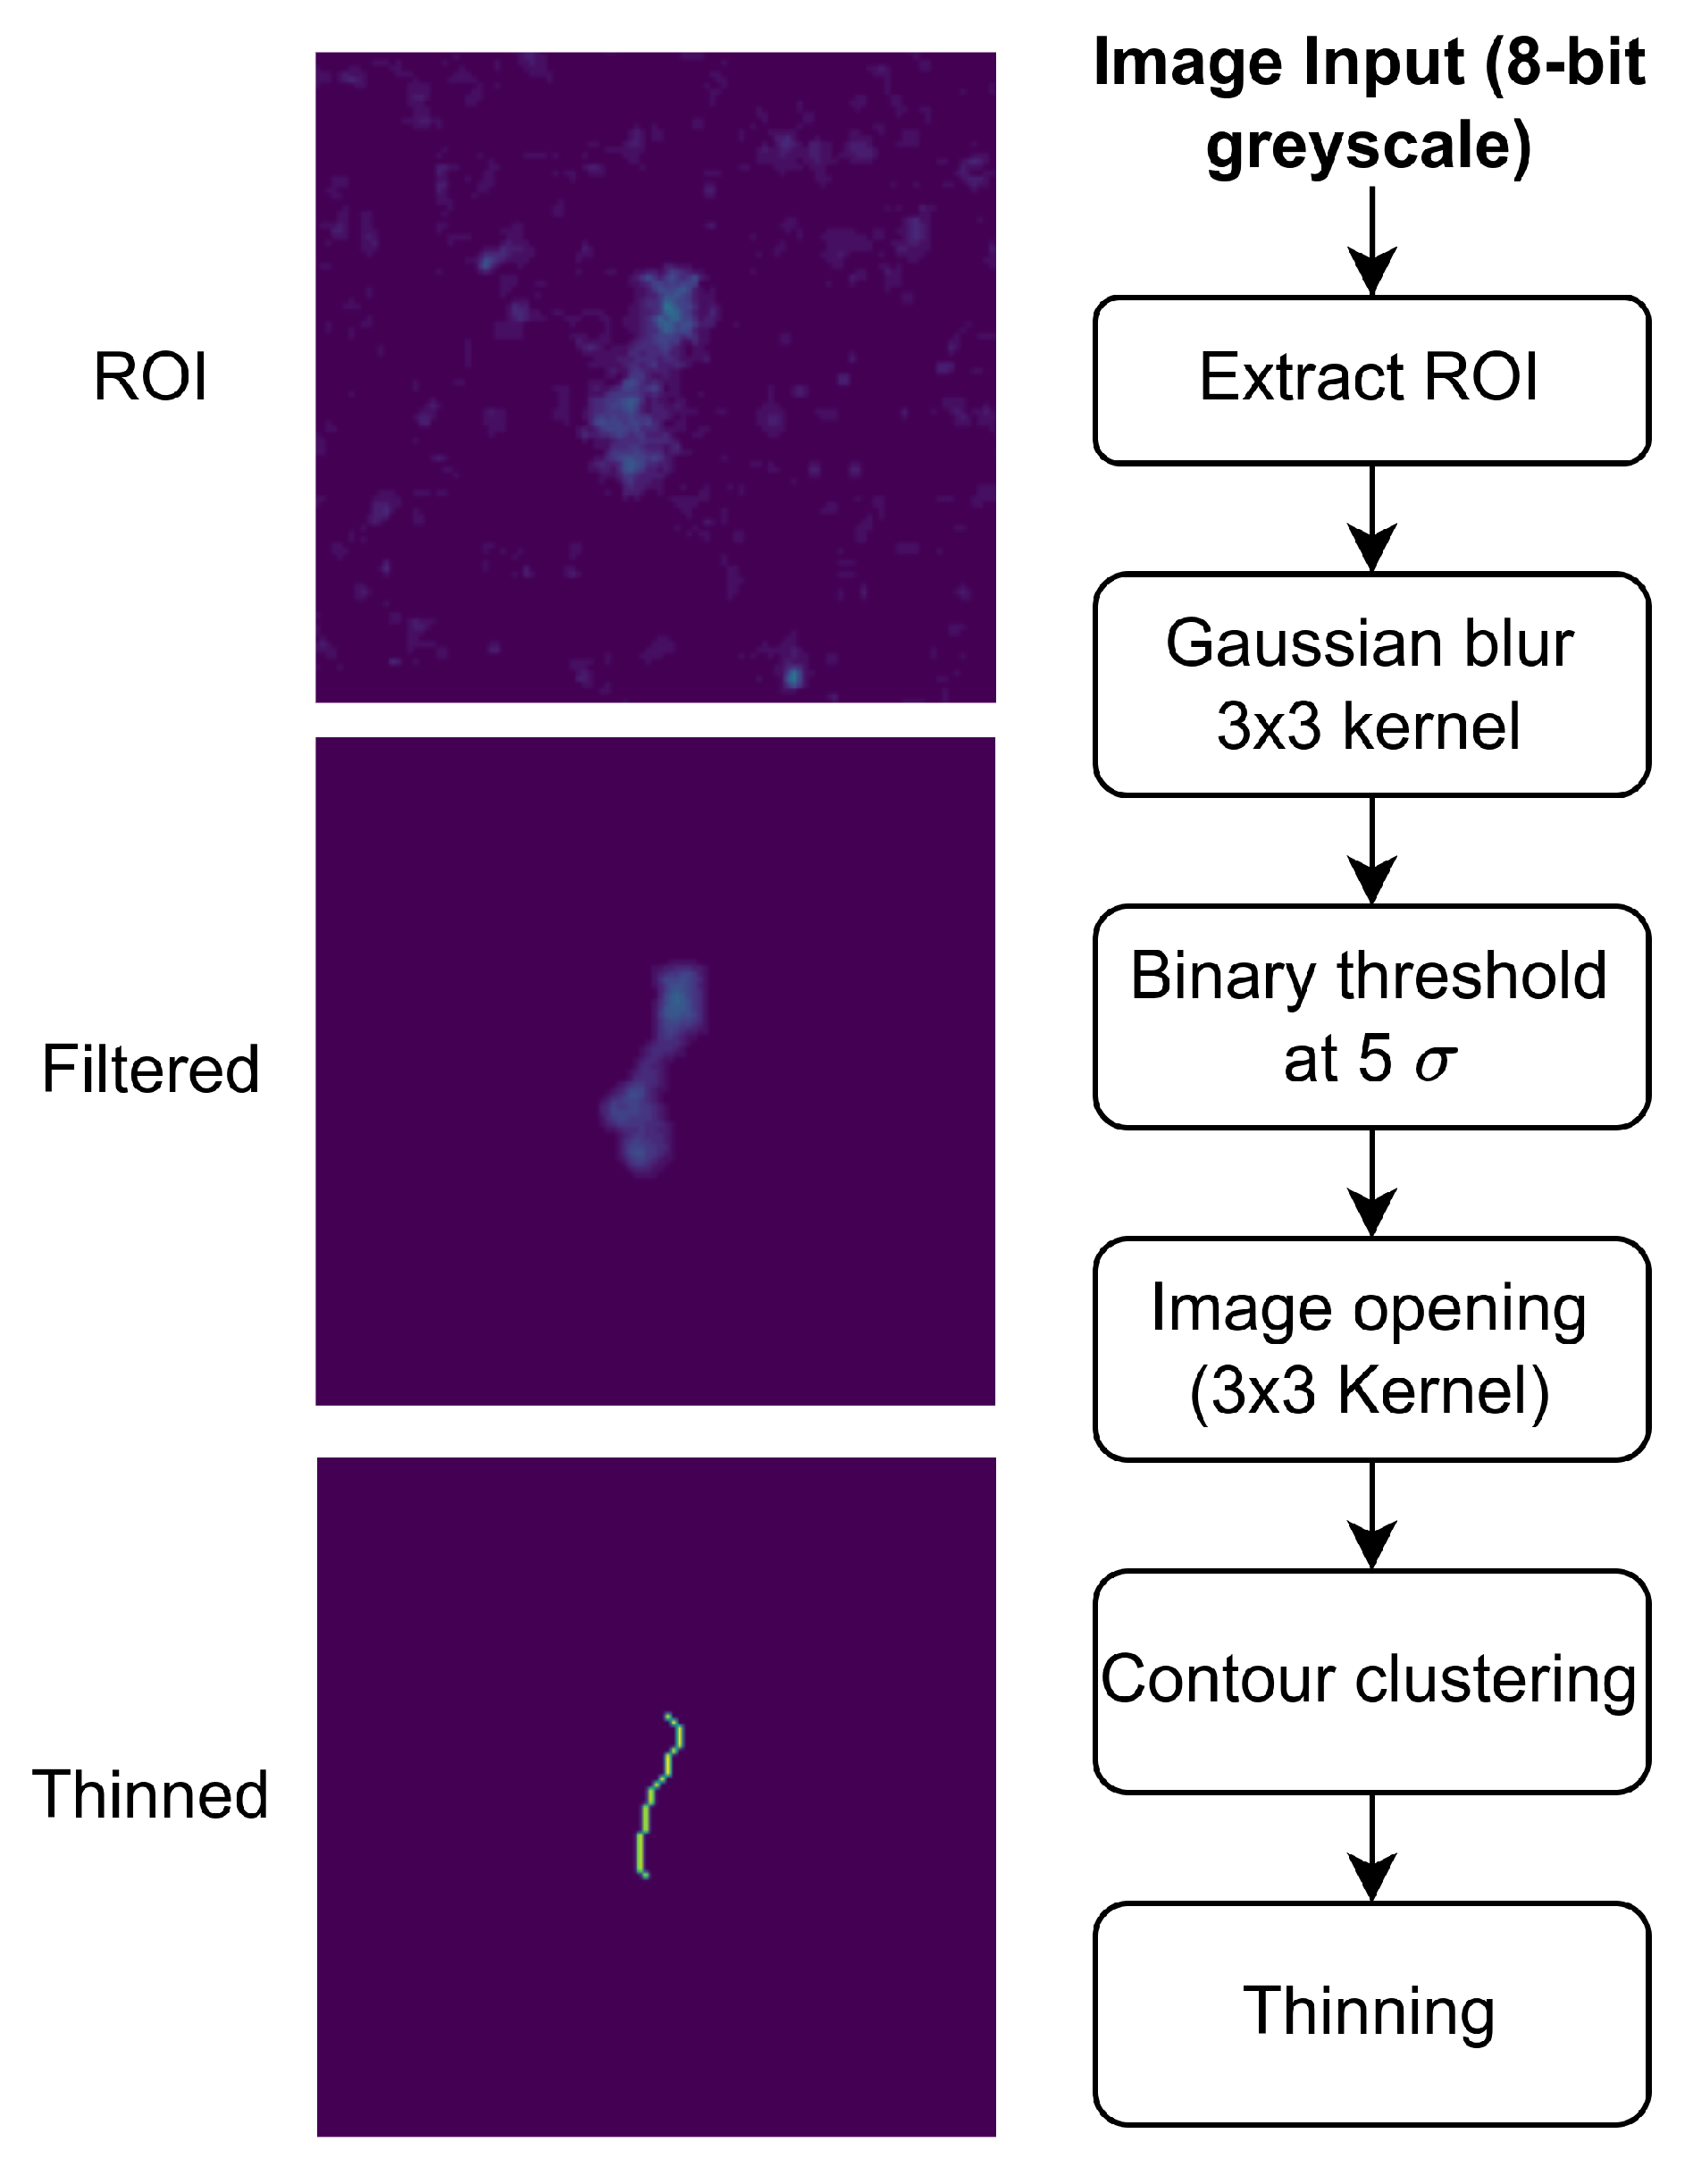
Each s j contains n two-dimensional points on the image plane, corresponding with the n attitude measurements. The prior calculations are performed n times for each star visible in the theoretical camera field of view to produce the array s j . Reference stars are selected based on their intensity, such that the brightest o stars in the frame are chosen. For each theoretical star trail, we apply a series of image-processing operations on the real image, as shown in Figure 2.
We first extract the ROI from the real image, given the theoretical star trail. A buffer is applied to the height and width of the ROI to allow for INS errors, typically corresponding to 2–3 of angular deviation. Gaussian blur is applied to the image with a 3 × 3 kernel, so as to reduce the magnitude of the image noise. A binary threshold is applied at five standard deviations above the average pixel value, as measured from the original full-scale image. This threshold is typical of stellar imaging sensors [13]. Image opening is performed with a 3 × 3 kernel to remove any remaining noise. The remaining contours are clustered, originating with the centre-most contour, and accumulating additional contours which are within 0.25 angular separation of the clustered set. Finally, the clustered contours are thinned by using the method presented in [14], so as to extract the centre-line from the star trail. Disjoint sections in the thinned image are connected by a straight line segment. The thinned image is reduced to an array of two-dimensional points that are ordered from endpoint to endpoint. We denote this array as p j , for star j.
There is a possibility that the correspondence between endpoints in p j and s j is reversed. We use the approximate orientation from s j to resolve the polarity of p j . We measure the angle on the image plane, θ s , between the first and last elements of s j , as well as θ p , the angle between the first and last elements of p j . If the magnitude of the difference between these angles exceeds π 2 , we reverse the indices of array p j to match the orientation of s j .

2.2. Orientation Estimation

Orientation estimation is performed in two steps. We first compute the mean attitude correction required to correlate the endpoints in s with the endpoints in p . Once aligned, we compute the individual offsets for each of the n INS attitude measurements.
The rotation which transforms a vector from real-world coordinates to camera coordinates via a yaw-pitch-roll Euler sequence, is given by
R = [ c ( θ ) c ( ψ ) c ( θ ) s ( ψ ) s ( θ ) c ( ϕ ) s ( ψ ) + s ( ϕ ) s ( θ ) c ( ψ ) c ( ϕ ) c ( ψ ) + s ( ϕ ) s ( θ ) s ( ψ ) s ( ϕ ) c ( θ ) s ( ϕ ) s ( ψ ) + c ( ϕ ) s ( θ ) c ( ψ ) s ( ϕ ) c ( ψ ) + c ( ϕ ) s ( θ ) s ( ψ ) c ( ϕ ) c ( θ ) ] ,
where c ( x ) and s ( x ) represent cos ( x ) and sin ( x ) , respectively.
Stars are framed in the celestial coordinate system; thus, translation is negligible. Therefore, the image coordinates, x , for infinitely distant objects, is given by
x = K R X ,
where X is the vector containing the local NED world coordinates at a given point:
X = X Y Z .
We expand the vector x into its components to get the image coordinates x, y, and z:
x = f x ( cos θ cos ψ ) X + ( cos θ sin ψ ) Y ( sin θ ) Z + p x [ ( sin ϕ sin ψ + cos ϕ sin θ cos ψ ) X + ( sin ϕ cos ψ + cos ϕ sin θ sin ψ ) Y + ( cos ϕ cos θ ) Z ]
y = f y [ ( cos ϕ sin ψ + sin ϕ sin θ cos ψ ) X + ( cos ϕ cos ψ + sin ϕ sin θ sin ψ ) Y + ( sin ϕ cos θ ) Z ] + p y [ ( sin ϕ sin ψ + cos ϕ sin θ cos ψ ) X + ( sin ϕ cos ψ + cos ϕ sin θ sin ψ ) Y + ( cos ϕ cos θ ) Z ]
z = sin ϕ sin ψ + cos ϕ sin θ cos ψ X + ( sin ϕ cos ψ + cos ϕ sin θ sin ψ ) Y + cos ϕ cos θ Z .
The two-dimensional homogeneous image pixel coordinates, are subsequently given by
u = u v ; u = x z , v = y z .
The Jacobian containing partial derivatives of pixel location with respect to changes in orientation is then given by (see Appendix A.1 for partial derivative equations):
J = u ϕ u θ u ψ v ϕ v θ v ψ .
Thus, the first order Taylor series expansion gives
u = u + J Δ r ,
where Δ r is the vector containing the change in roll, pitch, and yaw required to translate pixel u to u :
Δ r = Δ ϕ Δ θ Δ ψ .
The linearized relationship between change in pixel location and change in orientation can be expressed as
Δ u = J Δ r .
We extend this notation for multiple observations, Δ u ^ , where each observation Δ u i = [ Δ u i , Δ v i ] T is vertically stacked to give a vector of length 2 m :
Δ u ^ = Δ u 1 , Δ v 1 , Δ u m , Δ v m T
and similarly the Jacobian J i for each observation is vertically stacked to give the matrix of size [ 2 m × 3 ]:
J ^ = J 1 J m .
Thus, provided a minimum of m = 2 points, we can apply the weighted least squares solution for Δ r ,
Δ r = J ^ T W J ^ 1 J ^ T W Δ u ^ ,
where the diagonal weight matrix W with size [ 2 m × 2 m ] contains the weighting for each observation
W = w 1 0 0 0 0 w 1 0 0 0 0 w m 0 0 0 0 w m ,
where w i is calculated from the signal strength of observation i, such that salient stars are weighted more heavily,
w i = log 10 p i μ σ ,
and p i is the peak pixel intensity for observation i, μ is the mean value across the image ( p i μ ), and  σ is the standard deviation in pixel intensity in the image. Note that the weightings for the u and v components of a given observation are equal.
The mean-offset corrected camera attitude is computed iteratively, such that
Δ r k = Δ r k 1 + J ^ k 1 T W J ^ k 1 1 J ^ k 1 T W Δ u ^ k 1
until | Δ r k Δ r k 1 | 10 6 rad. Values Δ u ^ k 1 and J ^ k 1 are recomputed at each iteration from Equations (17) and (18), given the updated attitude:
r i = r i Δ r k .
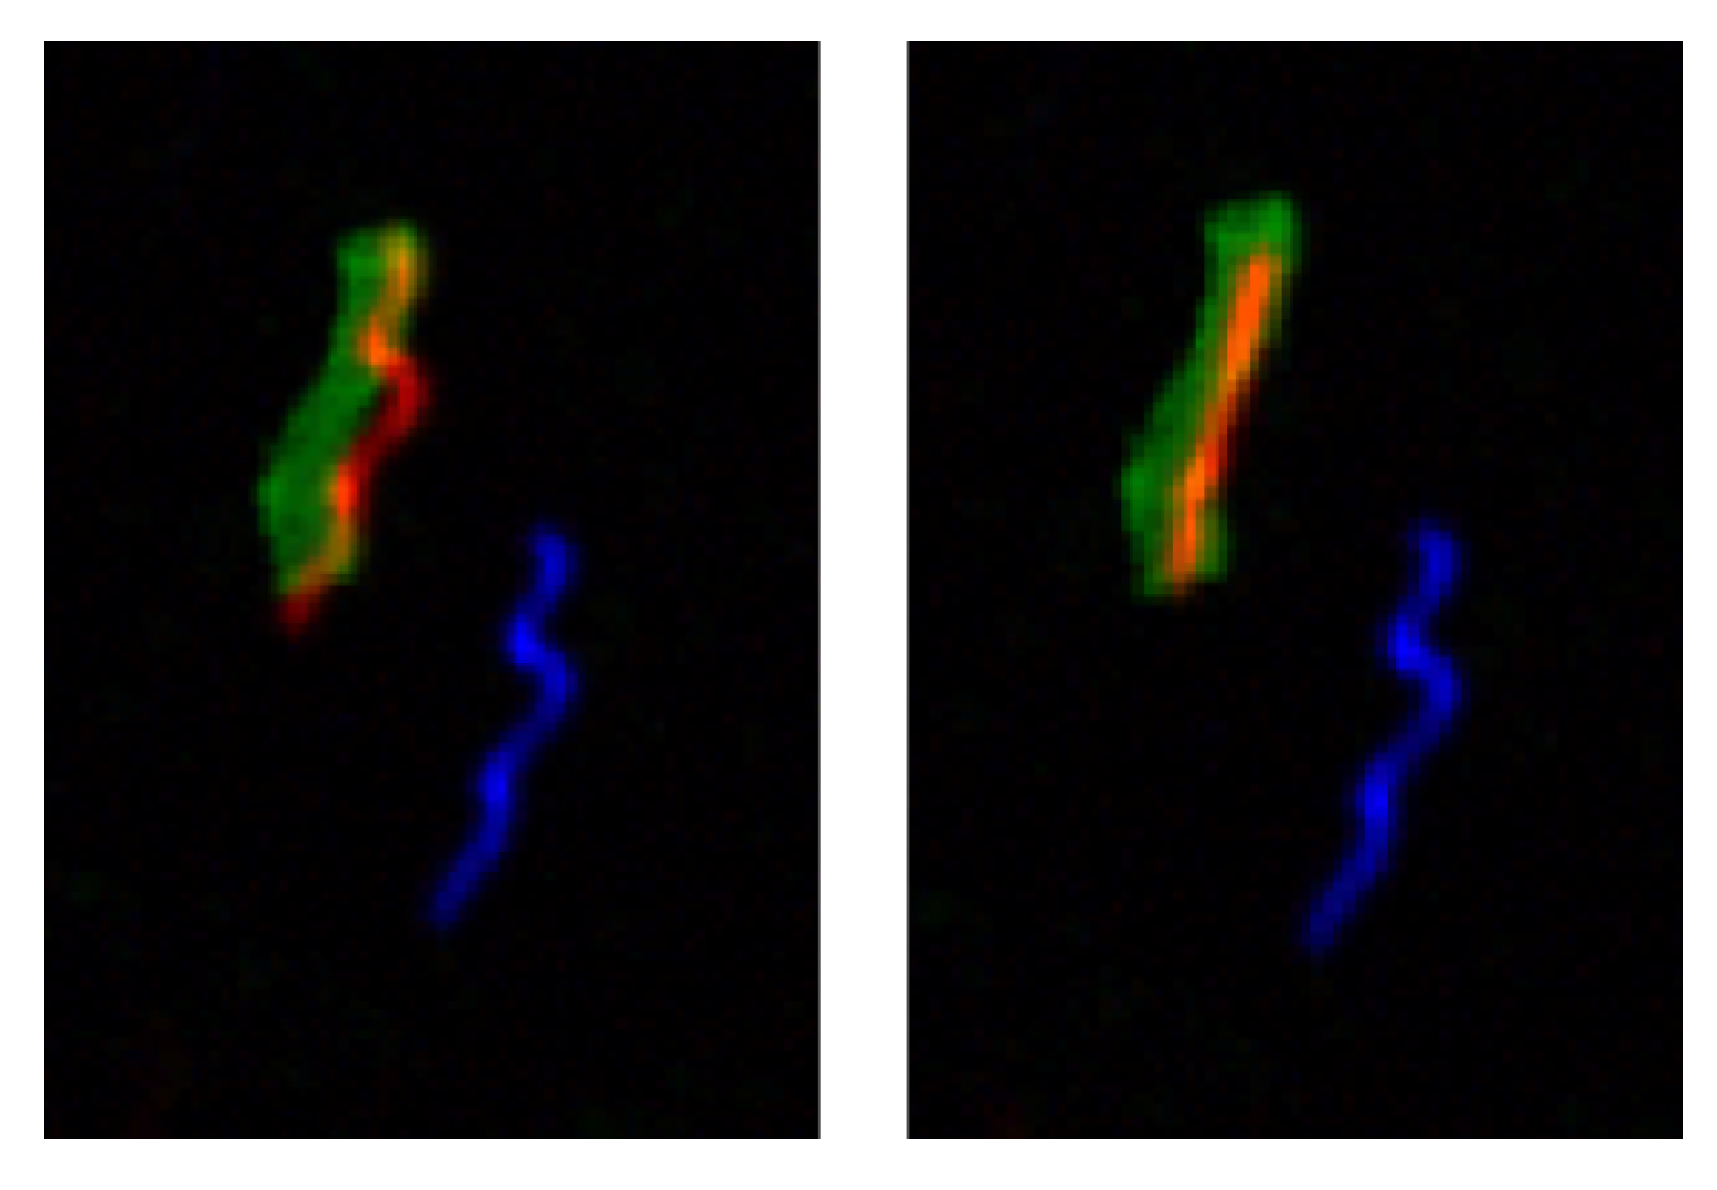
Equation (26) yields the mean attitude offset throughout a given exposure window. In some cases, this level of precision is satisfactory (for example, for online magnetometer calibration). The long exposure image typically contains higher-resolution attitude information pertaining to the aircraft orientation throughout the exposure window. This information can be obtained by aligning elements from the mean-corrected array s j with elements from observation p j . An example demonstrating the difference between mean and fine alignment can be seen in Figure 3.
A similar process to the mean attitude correction is followed for the high-resolution attitude estimation. For each star, the theoretical curve of the trail is recomputed with the mean attitude offset applied to obtain s j , and the polarity once again checked to ensure that the elements of p j are in the correct order. We make the following assumptions when mapping s j to p j :
  • The INS sampling period, T s , is constant.
  • The photon flux density incident on the sensor from a given luminary is constant.
  • The path taken by the airframe results in a simple curve on the image plane (i.e., the star trail does not cross itself at any point).
From these assumptions, it is evident that for each successive point in the fine-attitude corrected set, s , the rate of increase in the cumulative intensity must be constant,
I s j [ i ] I s j [ i 1 ] = C ,
given pixel intensity I ( x ) at location x in the frame. Thus, the location of pixel s [ i ] should be chosen to satisfy
I s j [ i ] = I s j [ i 1 ] + C ,
where the first element, s j [ 0 ] is equal to p j [ 0 ] , and C is chosen to ensure the last element in s j is equal to the last element in p j :
C = 1 n i = 0 p I ( p j [ i ] )
given n elements in s j , and p elements in p j .
The candidates for s j [ i ] are contained in the ordered set of thinned points from the real image, p j . We use a cumulative sum of real image intensities along the skeleton to solve for s j empirically, as shown in Algorithm 1:
Algorithm 1 Mapping from INS points to real image points.
  • s j [ 0 ] p j [ 0 ]
  • n 1
  • s u m 0
  • for i = 1 ; i < p do
  •        s u m s u m + p j [ i ]
  •       if  s u m C  then
  •               o v e r s h o o t ( s u m C )
  •               s j [ n ] I n t e r p o l a t e p j [ i ] , p j [ i 1 ] , o v e r s h o o t
  •               s u m o v e r s h o o t
  •               n n + 1
  •       end if
  • end for
For each observed star, there exists a set of mean attitude corrected points, s j , and a set of fine attitude corrected points, s j . For each of the n INS attitude measurements, we apply the least squares solution from Equation (26). The Jacobian J is computed for each attitude by using Equation (18), and the change in pixel location, Δ u , is computed as s j s j . The updated attitudes, r i , are given by
r i = r i Δ r i k .
The updated direction cosine matrices (DCM), R i , are constructed from the Euler angles r i similarly to Equation (11). Given the rotational transformation C c / a which relates the aircraft frame of reference to the camera frame of reference, the aircraft DCM for each attitude, expressed in NED coordinates is calculated:
C a / n e d [ i ] = C c / a T [ i ] R i .
Thus, we use Equation (32) to compute the updated aircraft DCM for each attitude measurement from the INS.
In theory, two endpoints from a single star are sufficient to estimate attitude. In practice, however, there does not exist enough angular resolution to accurately correct for aircraft yaw (under normal flight conditions, with the camera facing upward). For this reason, we limit estimation to images containing three or more salient stars, separated by at least one third of the image width.

3. Results

Due to limitations in the accuracy of INS estimation with the available hardware, we are unable to acquire a ground-truth attitude reference for images captured in flight at the level of precision required. Consequently, we use the methodology presented in [3] to generate high-quality simulation images from real flight data for quantitative analysis. We treat the INS attitude measurements as ground truth, and apply two forms of noise to these measurements:
  • A random-valued constant offset, and
  • Perlin noise.
The random valued constant offset is applied to every attitude measurement throughout the exposure interval, and is representative of attitude/estimation bias. The gradient-based Perlin noise is generated for each individual measurement, and is representative of attitude drift from the INS estimator. We selected Perlin noise due to its gradient-based nature, and zero-crossing properties, which are typical of iterative estimators. Both sources of noise are applied together. We measure the efficacy of the methodology presented in Section 2 based on its ability to correct for these sources of noise and recover the true attitude of the aircraft.
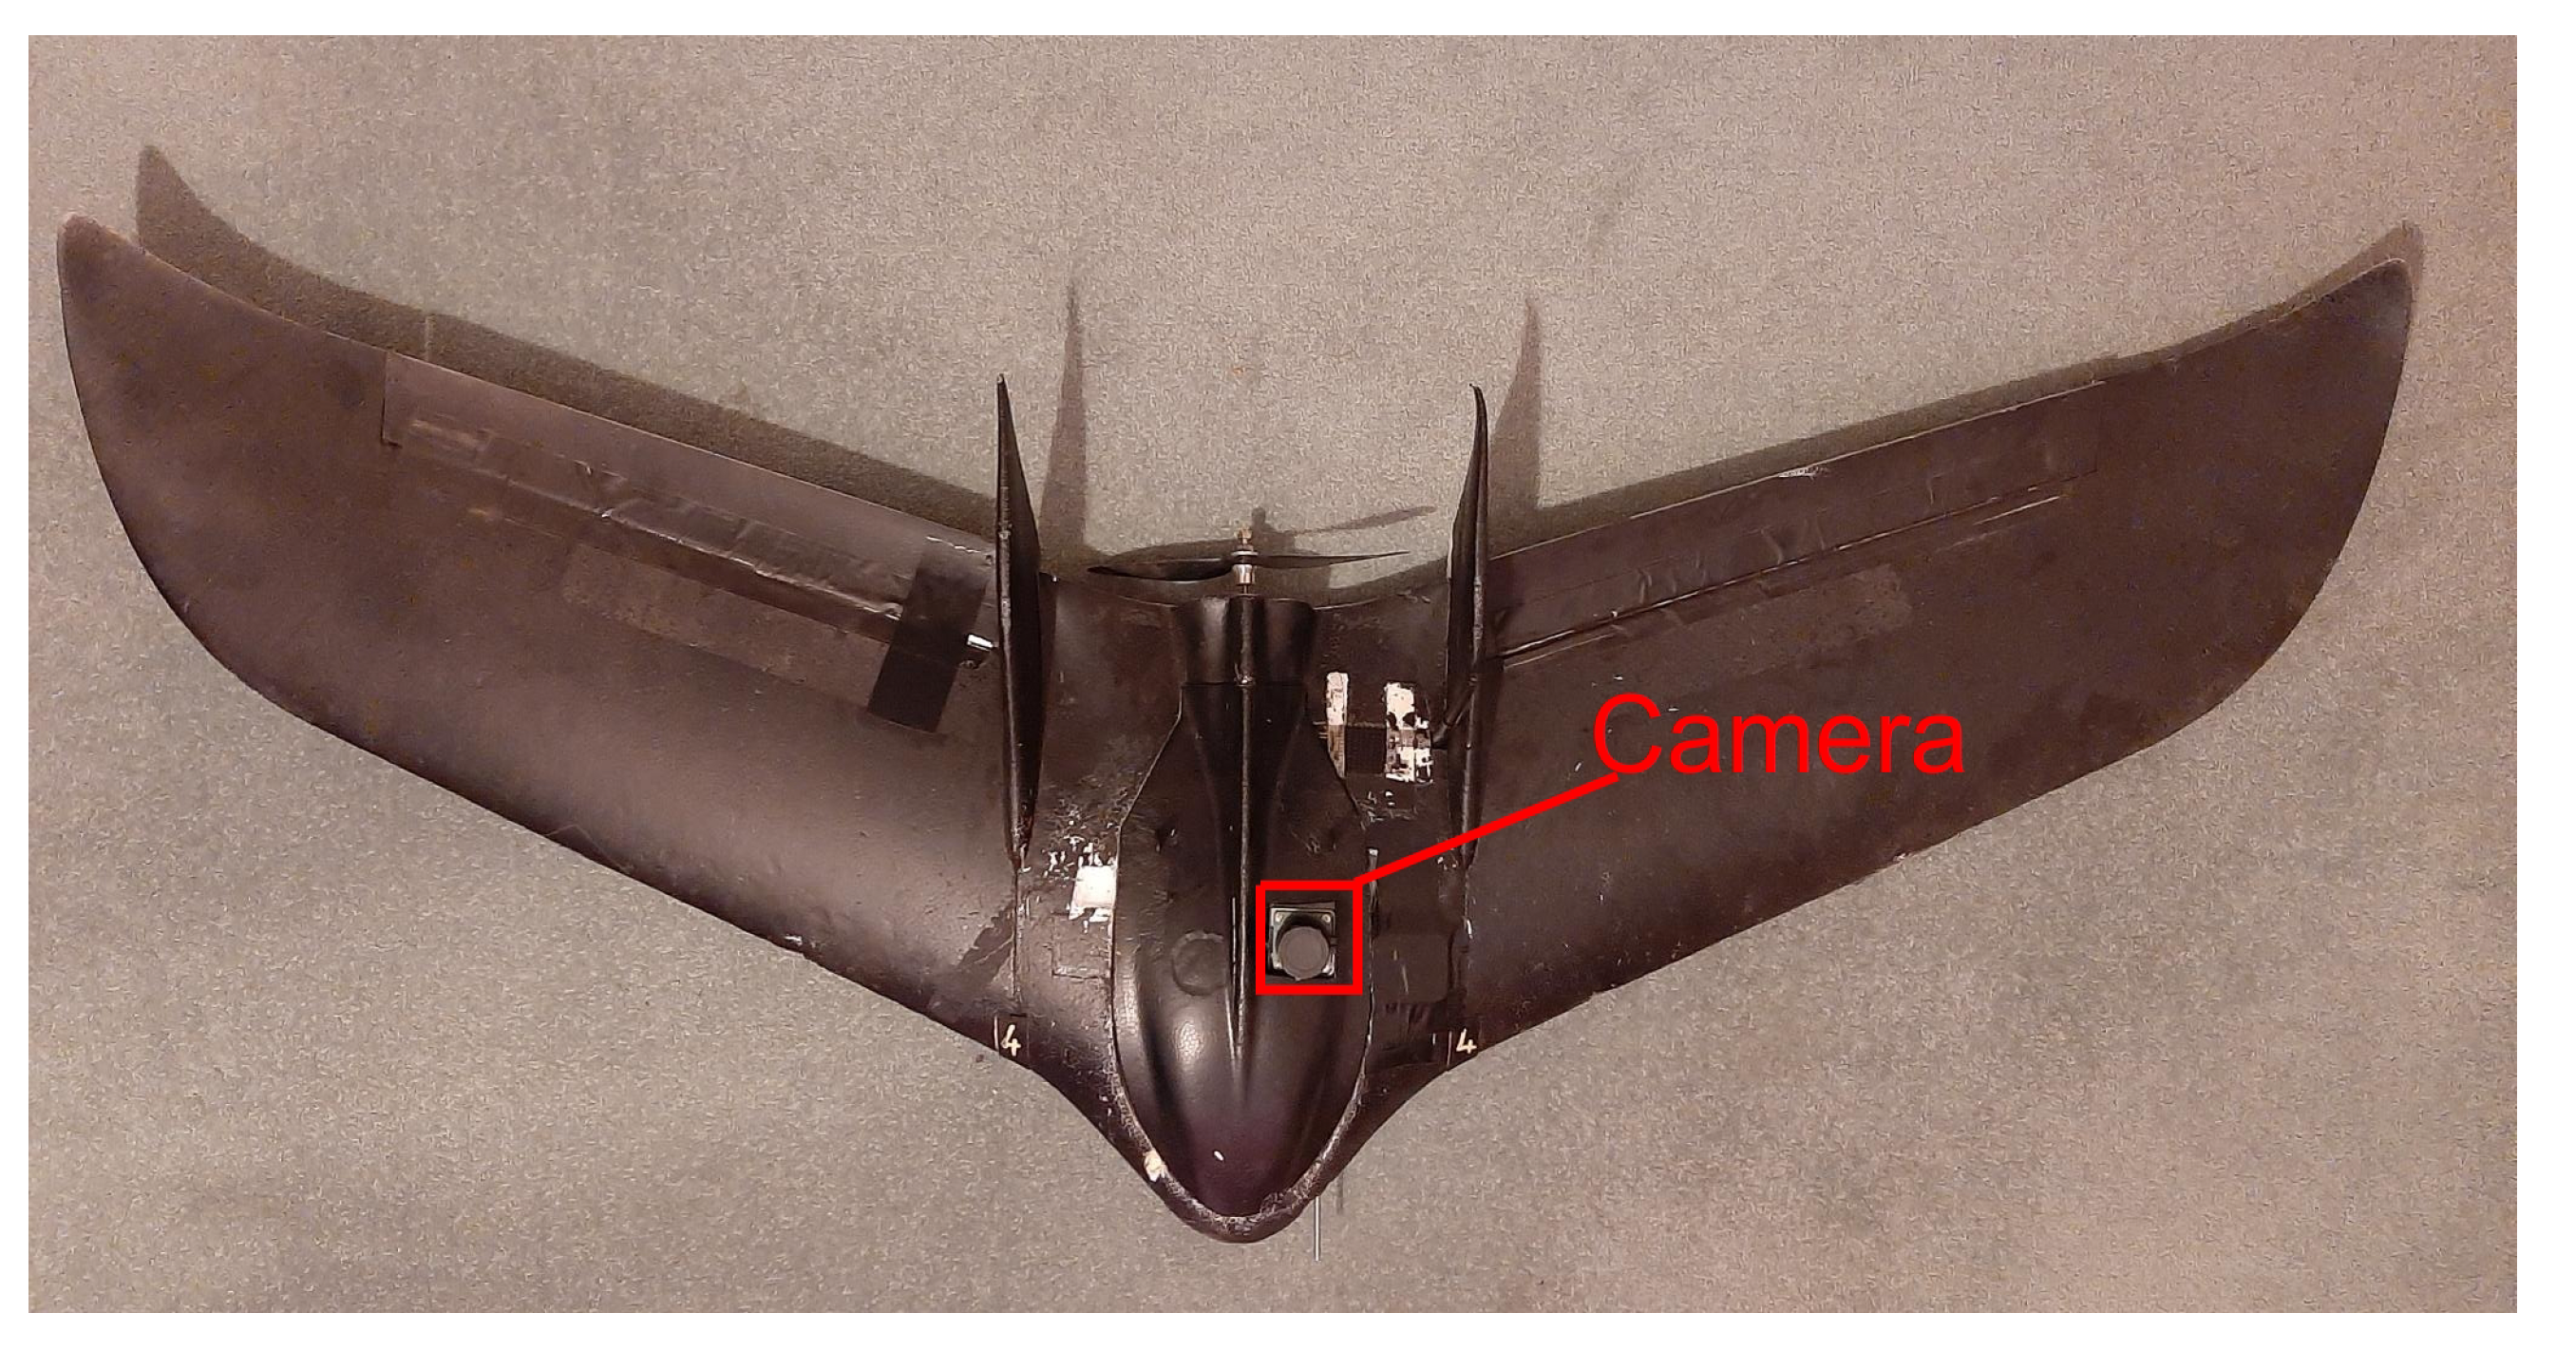
Real imagery and INS attitude data was captured from a single test flight. A Pixhawk version 2 autopilot was used for vehicle control and attitude estimation. Attitude data was logged from the autopilot’s extended Kalman filter (EKF) at a rate of 30 Hz. The camera was mounted to the autopilot via a rigid plastic 3D-printed structure, such that all autopilot attitudes were coupled with the aerial imagery. We used a Raspberry Pi 4 companion computer for image storage, and a Raspberry Pi high-quality camera sensor fitted with the official 6-mm wide-angle lens for image capture. The sensor resolution was set to 3280 × 2464 , with an ISO of 800. The flight was conducted at a height of 150 m above ground level with an exposure interval of 500 ms. No clouds were present, and the trial was conducted under moonless conditions. The airframe used for this study was a Zeta Science FX61 with 1.5 m wingspan, with an approximate mass of 1.5 kg, as seen in Figure 4.

3.1. Simulation Results

For each image captured, a series of attitude measurements were stored to disk corresponding with the exposure interval. We used a static ground image to calibrate the simulation, and subsequently generate each synthetic image from the log data. A uniformly distributed random offset between −1 and 1 was applied to the roll and pitch channels, and a uniformly distributed random offset between −3 and 3 was applied to the yaw channel. We applied a greater offset to the yaw channel to replicate the magnetometer bias typically seen in low-cost INS systems. A sequence of Perlin noise of length n was generated for the roll, pitch, and yaw channels, with number of octaves uniformly randomly selected between 0.1 and 2 , and magnitude less than 0.5 . This noise is representative of angular rate errors, as can be seen in Figure 5.
The methodology from Section 2 was applied, given the synthetic images (ground truth) and noisy attitude data (INS). Points p j were extracted by using the presented image processing methods, and points s j were computed by using the noisy attitude data.
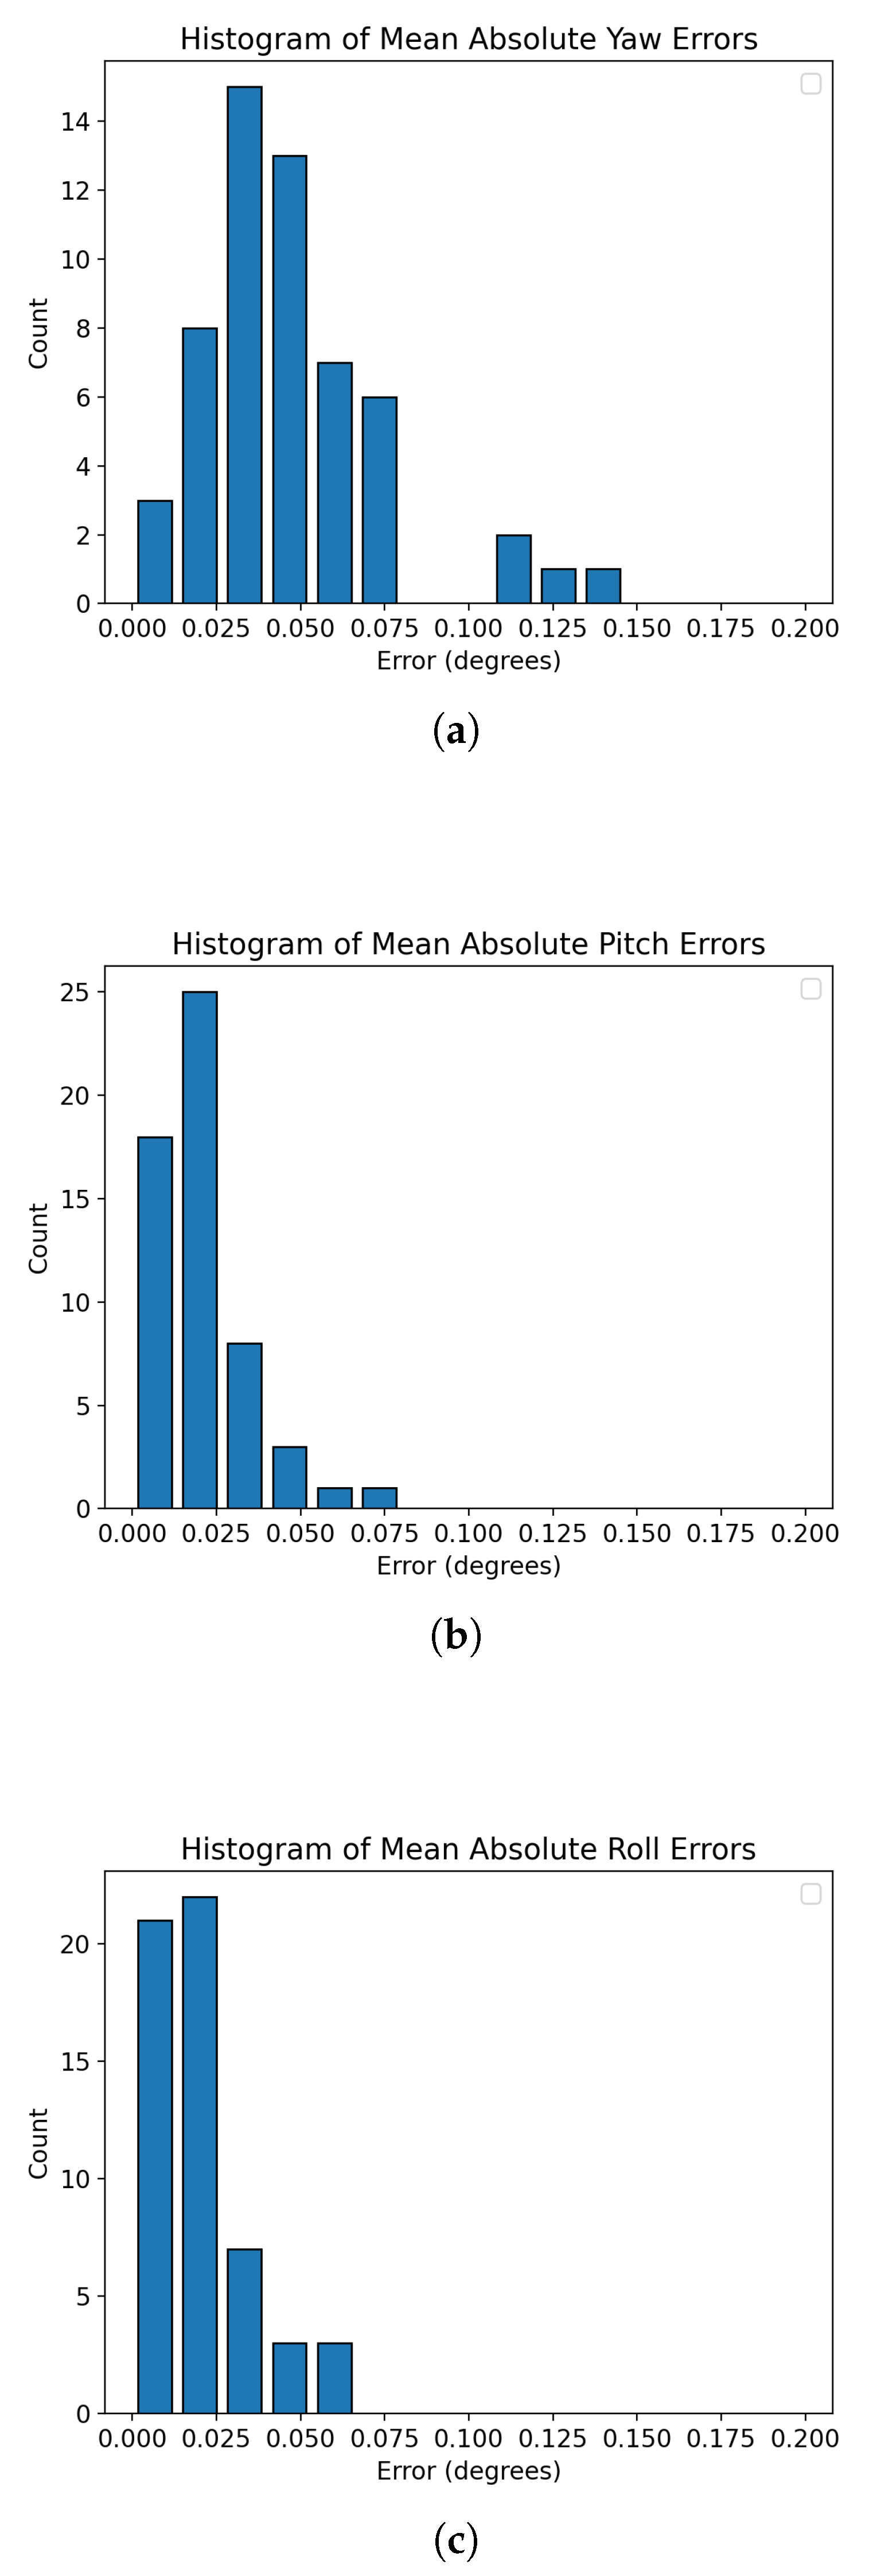
A total of 110 images were simulated and processed. From these, 56 images contained a sufficient number of salient stars to perform attitude estimation (in accordance with the constraints set in Section 2). Each image had n = 14 noisy attitude estimates. Figure 6 shows histograms of mean absolute errors. Table 1 shows detailed results from this test. For each image captured, the mean, mean absolute, and max errors were recorded from the attitude correction output. We can see from these results that the mean errors were close to zero, indicating that bias in the estimation process is low. The three standard deviation limit indicates that 99.7% of yaw errors are less than 0.2828 , pitch errors less than 0.1453 , and roll errors less than 0.1366 . Similarly, 99.7% of mean absolute yaw errors fell within ±0.1294 , pitch errors within ±0.0591 , and roll errors within ±0.0604 . The residual mean absolute error in the least squares approximation was 1.246 pixels, and an average of 6.036 stars were used for each estimation.
We can see from testing that the corrected attitude contained significantly reduced errors. Yaw errors with average magnitude 1.5 were typically corrected to within approximately 0.05 , and roll and pitch errors with average magnitude 0.5 were corrected to within approximately 0.02 . The maximum errors were also significantly lower than the average Perlin noise of 0.2 , highlighting the efficacy of this algorithm in removing both sources of noise. A graphic showing the simulated attitude correction can be seen in Figure 7.

3.2. Real Imagery

To supplement the simulation results, we observe the output of our methodology when applied directly to a real image. Although no ground truth was available, we assess the resulting reprojection in a qualitative manner, so as to validate the efficacy of the image-processing techniques. The real images are subjected to small errors in the camera matrix K , which are most prevalent at maximal radial distance from the principal point, as well as other minor unmodeled sources of noise.
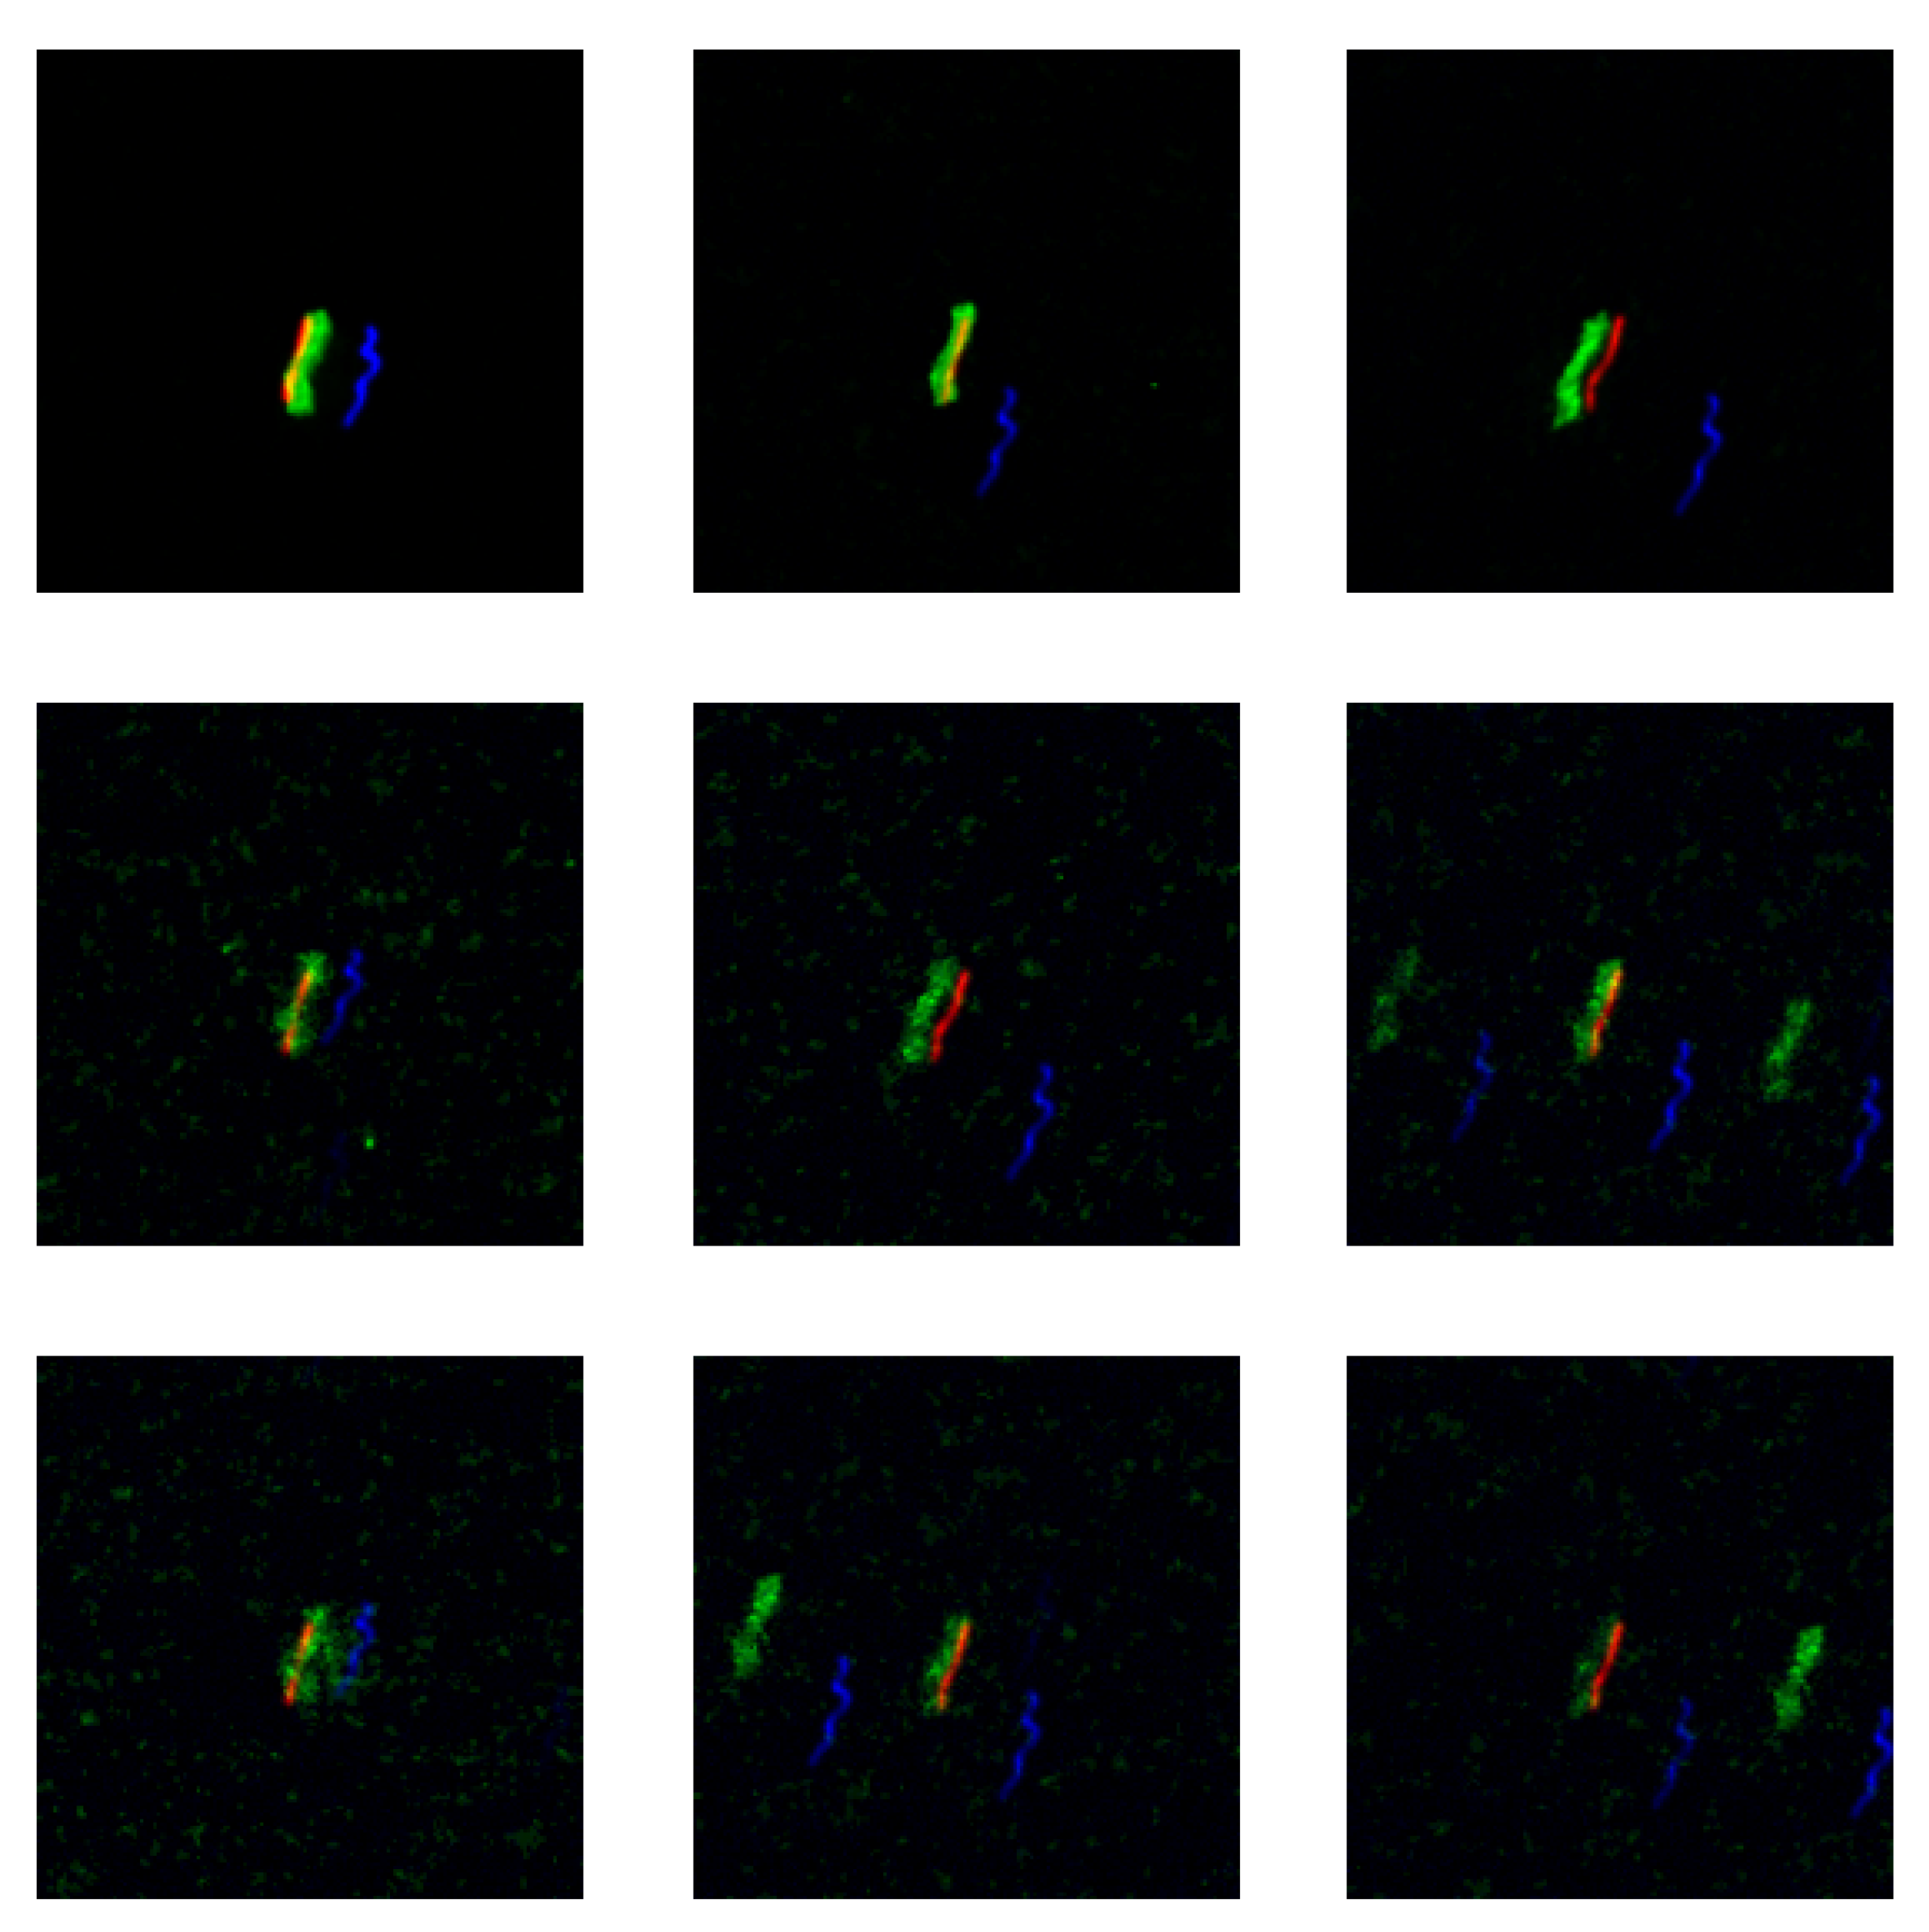
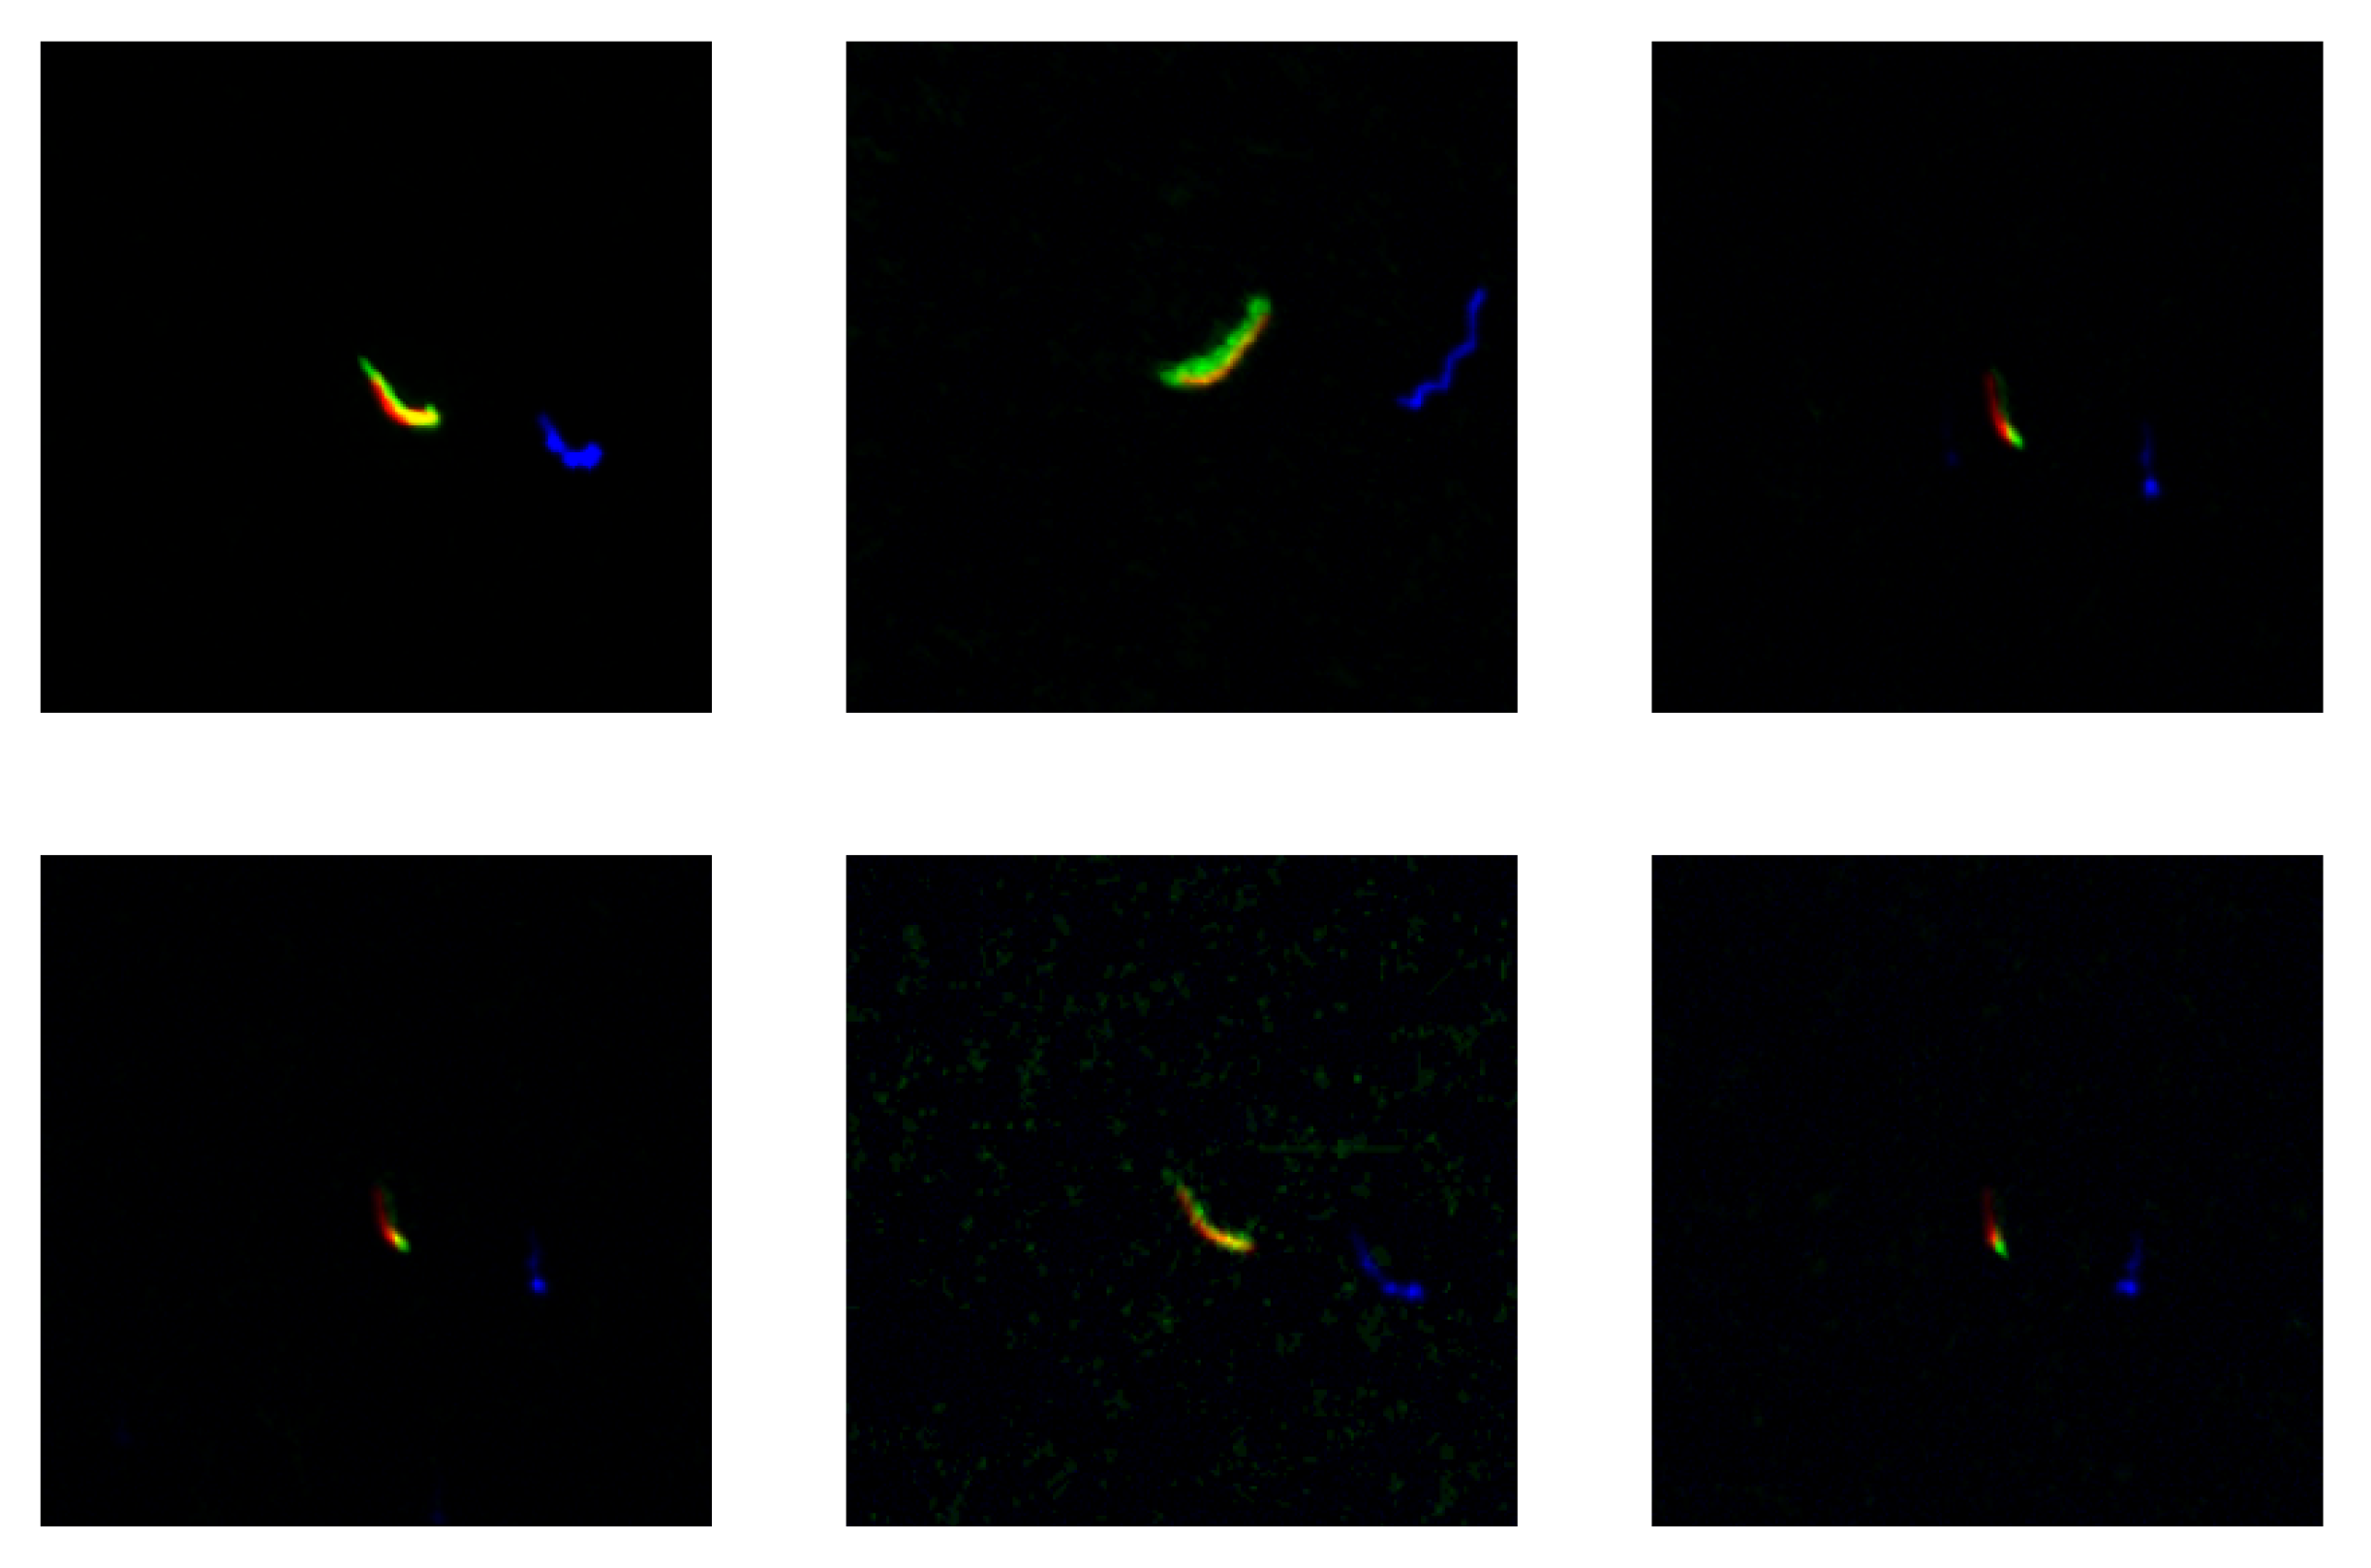
From the 110 images captured, 49 satisfied the requirements for attitude estimation. The mean residual error of the least squares estimation was 3.945 pixels, as compared with 1.264 pixels in simulation. The average number of stars used for estimation was 5.510, as compared to 6.036 in simulation. Figure 8 and Figure 9 demonstrate the efficacy of this method in practice. We show the ROI for each star used in the attitude estimation process. The green channel contains the real image, the blue channel contains the uncorrected INS data, and the red channel is a reprojection of the corrected INS data. We can see that our method corrected for both types of noise. Some bias remains present in some stars, which is more prominent at greater distances from the optical centre.

4. Discussion

The assumptions made in Section 2 may limit potential use cases for this approach. Assumption 2, constant photon flux density from a given luminary, disqualifies the use of rolling shutter cameras, and indicates that the performance will be hindered if the image is subjected to obscurities such as partial cloud cover. Assumption 3, that the star forms a simple curve on the image plane, may become limiting for imaging systems with longer exposure intervals, due to the increased likelihood of complex curves forming on the image plane. Interestingly, it may be possible to plan aircraft trajectories, which reduces the likelihood of this occurring.
It is evident in the results that some re-projection bias remains when performing attitude correction on the real images (3.945 pixels, as compared with 1.264 in simulation). There are two potential causes for this value being significantly higher than in simulation.
  • The camera calibration matrix, K does not perfectly characterize the camera.
  • Unmodeled sources of noise caused the image processing techniques not to transfer from simulation to reality.
Our observation is that the former is the most likely cause of this error. It is evident that certain areas on the imaging plane are defocused and do not conform with a Gaussian point-spread distribution, which may be contributing to the delocalization of pixels during the image processing stage. The image-thinning algorithm preserves the endpoints of the simulated stars (which are drawn from a sequence of Gaussian point-spread functions); however it tends to truncate the endpoints of the real stars. We postulate, however, that this effect is less significant than the effect caused by camera calibration. We see in Figure 8 and Figure 9 that the fine-attitude correction appears to remove both the high- and low-frequency components of noise, but the bias offset remains for some stars. If the image-processing techniques were failing, we would not observe the removal of noise, particularly with the lower signal-to-noise ratio stars seen in Figure 8. We also observe that the bias tends to be greater for stars located further from the optical centre. These effects are indicative of residual nonlinear errors, such as radial and tangential distortion. Despite our efforts to remove the sources of distortion, this is a practical limitation of low-cost hardware. Interestingly, if this bias is caused by nonlinear distortion, then the residual error is not a good indicator of attitude error. This is evident when considering that a perfect attitude estimate will still yield reprojection errors.
The geometry of the camera tends toward a greater error in yaw than for pitch and roll. Under stable flying conditions (minimal roll and pitch), the yaw angle of the aircraft is measured from the angle of arc between stars about the principal point. When only a small number of observations are made, the dispersion of stars about this principal point is unlikely to be uniform, and consequently the resolution is decreased. In theory, this could be offset by applying a higher weight to stars that are further displaced from the principal point. In practice, however, the effects of lens distortion are most prominent at points farthest from the principal point, and these observations are likely to be more erroneous.
In this study we seldom encountered multiple stars within the same ROI. With more sensitive optical equipment, or less accurate attitude sensors, the occurrence of multiple stars may increase. We have not explored the possibility of outlier removal; however, we expect that the use of a random sample consensus (RANSAC) [15] algorithm may be beneficial for the selection of stars under such circumstances.

5. Conclusions

We have demonstrated a novel use for long-exposure imagery captured from a low-cost strapdown celestial sensor mounted to a lightweight, low-altitude, fixed-wing airframe. The captured imagery contains high-resolution data pertaining to the attitude of the aircraft. Standard image processing techniques were used on the long exposure images, in conjunction with a linearized weighted least squares approximation, so as to produce a corrected attitude estimate for each attitude reported by the INS. Through simulation, we demonstrated that attitude is estimated with means absolute error less than 0.13 degrees in the yaw axis, and less than 0.06 degrees in the pitch and roll axes (3 σ ). We subsequently demonstrated that this algorithm translates to real imagery, with some additional noise due to calibration. Future work will explore the use of this technique for the online calibration of magnetometer offsets.

Author Contributions

Conceptualization, S.T. and J.C.; methodology, S.T.; software, S.T.; validation, S.T.; formal analysis, S.T.; investigation, S.T.; resources, J.C.; data curation, S.T. and J.C.; writing—original draft preparation, S.T.; writing—review and editing, J.C.; visualization, S.T.; supervision, J.C.; project administration, J.C. All authors have read and agreed to the published version of the manuscript.

Funding

This research received no external funding.

Informed Consent Statement

Not applicable.

Data Availability Statement

Not applicable.

Acknowledgments

This work was supported by Scope Global Pty Ltd. under the Commonwealth Scholarships Program, and the Commonwealth of South Australia under the Australian Government Research Training Program.

Conflicts of Interest

The authors declare no conflict of interest.

Appendix A

Appendix A.1. Jacobian Matrix Entries

The partial derivatives of the image coordinates with respect to the aircraft Euler angles are given by:
x ϕ = p x [ cos ϕ sin ψ X cos ψ Y sin ϕ sin θ cos ψ X + sin θ sin ψ Y + cos θ Z ]
x θ = f x sin θ cos ψ X + sin θ sin ψ Y + cos θ Z + p x cos ϕ cos θ cos ψ X + cos θ sin ψ Y sin θ Z
x ψ = f x cos θ sin ψ X + cos ψ Y + p x sin ϕ cos ψ X + sin ψ Y + p x cos ϕ sin θ sin ψ X + sin θ cos ψ Y
y ϕ = f y [ sin ϕ sin ψ + cos ϕ sin θ cos ψ X + sin ϕ cos ψ + cos ϕ sin θ sin ψ Y + cos ϕ cos θ Z ] + p y [ cos ϕ sin ψ sin ϕ sin θ cos ψ X + cos ϕ cos ψ sin ϕ sin θ sin ψ Y sin ϕ cos θ Z ]
y θ = f y [ sin ϕ cos θ cos ψ X + sin ϕ cos θ sin ψ Y + sin ϕ sin θ Z ] + p y [ cos ϕ cos θ cos ψ X + cos ϕ cos θ sin ψ Y + cos ϕ sin θ Z ]
y ψ = f y [ cos ϕ cos ψ sin ϕ sin θ sin ψ X + cos ϕ sin ψ + sin ϕ sin θ cos ψ Y ] + p y [ sin ϕ cos ψ cos ϕ sin θ sin ψ X + sin ϕ sin ψ + cos ϕ sin θ cos ψ Y ]
z ϕ = cos ϕ sin ψ sin ϕ sin θ cos ψ X + cos ϕ cos ψ sin ϕ sin θ sin ψ Y + sin ϕ cos θ Z
z θ = cos ϕ cos θ cos ψ X + cos ϕ cos θ sin ψ Y + cos ϕ sin θ Z
z ψ = sin ϕ cos ψ cos ϕ sin θ sin ψ X + sin ϕ sin ψ + cos ϕ sin θ cos ψ Y
and the 2-dimensional homogeneous image coordinates are given by:
u = x z , v = y z
then by applying the quotient rule, we compute the partial derivatives:
u ϕ = z x ϕ x z ϕ ( z ) 2
u θ = z x θ x z θ ( z ) 2
u ψ = z x ψ x z ψ ( z ) 2
v ϕ = z y ϕ y z ϕ ( z ) 2
v θ = z y θ y z θ ( z ) 2
v ψ = z y ψ y z ψ ( z ) 2

References

  1. Kayton, M.; Fried, W.R. Avionics Navigation Systems; John Wiley & Sons: Hoboken, NJ, USA, 1997. [Google Scholar]
  2. Titterton, D.; Weston, J.L.; Weston, J. Strapdown Inertial Navigation Technology; IET: Stevenage, UK, 2004; Volume 17. [Google Scholar]
  3. Teague, S.; Chahl, J. Imagery Synthesis for Drone Celestial Navigation Simulation. Drones 2022, 6, 207. [Google Scholar] [CrossRef]
  4. Chen, X.; Liu, D.; Zhang, Y.; Liu, X.; Xu, Y.; Shi, C. Robust motion blur kernel parameter estimation for star image deblurring. Optik 2021, 230, 166288. [Google Scholar] [CrossRef]
  5. Wei, Q.; Weina, Z. Restoration of motion-blurred star image based on Wiener filter. In Proceedings of the 2011 Fourth International Conference on Intelligent Computation Technology and Automation, Shenzhen, China, 28–29 March 2011; Volume 2, pp. 691–694. [Google Scholar]
  6. Wang, S.; Zhang, S.; Ning, M.; Zhou, B. Motion blurred star image restoration based on MEMS gyroscope aid and blur kernel correction. Sensors 2018, 18, 2662. [Google Scholar] [CrossRef] [PubMed] [Green Version]
  7. Zhang, W.; Quan, W.; Guo, L. Blurred star image processing for star sensors under dynamic conditions. Sensors 2012, 12, 6712–6726. [Google Scholar] [CrossRef] [PubMed]
  8. Sun, T.; Xing, F.; You, Z.; Wei, M. Motion-blurred star acquisition method of the star tracker under high dynamic conditions. Opt. Express 2013, 21, 20096–20110. [Google Scholar] [CrossRef] [PubMed]
  9. Ma, L.; Zhan, D.; Jiang, G.; Fu, S.; Jia, H.; Wang, X.; Huang, Z.; Zheng, J.; Hu, F.; Wu, W.; et al. Attitude-correlated frames approach for a star sensor to improve attitude accuracy under highly dynamic conditions. Appl. Opt. 2015, 54, 7559–7566. [Google Scholar] [CrossRef] [PubMed]
  10. He, Y.; Wang, H.; Feng, L.; You, S. Motion-blurred star image restoration based on multi-frame superposition under high dynamic and long exposure conditions. J. Real-Time Image Process. 2021, 18, 1477–1491. [Google Scholar] [CrossRef]
  11. Klaus, A.; Bauer, J.; Karner, K.; Elbischger, P.; Perko, R.; Bischof, H. Camera calibration from a single night sky image. In Proceedings of the 2004 IEEE Computer Society Conference on Computer Vision and Pattern Recognition, 2004. CVPR 2004, Washington, DC, USA, 27 June–2 July 2004; Volume 1, p. I. [Google Scholar]
  12. Rijlaarsdam, D.; Yous, H.; Byrne, J.; Oddenino, D.; Furano, G.; Moloney, D. A survey of lost-in-space star identification algorithms since 2009. Sensors 2020, 20, 2579. [Google Scholar] [CrossRef] [PubMed]
  13. Liebe, C.C. Accuracy performance of star trackers-a tutorial. IEEE Trans. Aerosp. Electron. Syst. 2002, 38, 587–599. [Google Scholar] [CrossRef]
  14. Zhang, T.Y.; Suen, C.Y. A fast parallel algorithm for thinning digital patterns. Commun. ACM 1984, 27, 236–239. [Google Scholar] [CrossRef]
  15. Fischler, M.A.; Bolles, R.C. Random sample consensus: A paradigm for model fitting with applications to image analysis and automated cartography. Commun. ACM 1981, 24, 381–395. [Google Scholar] [CrossRef]
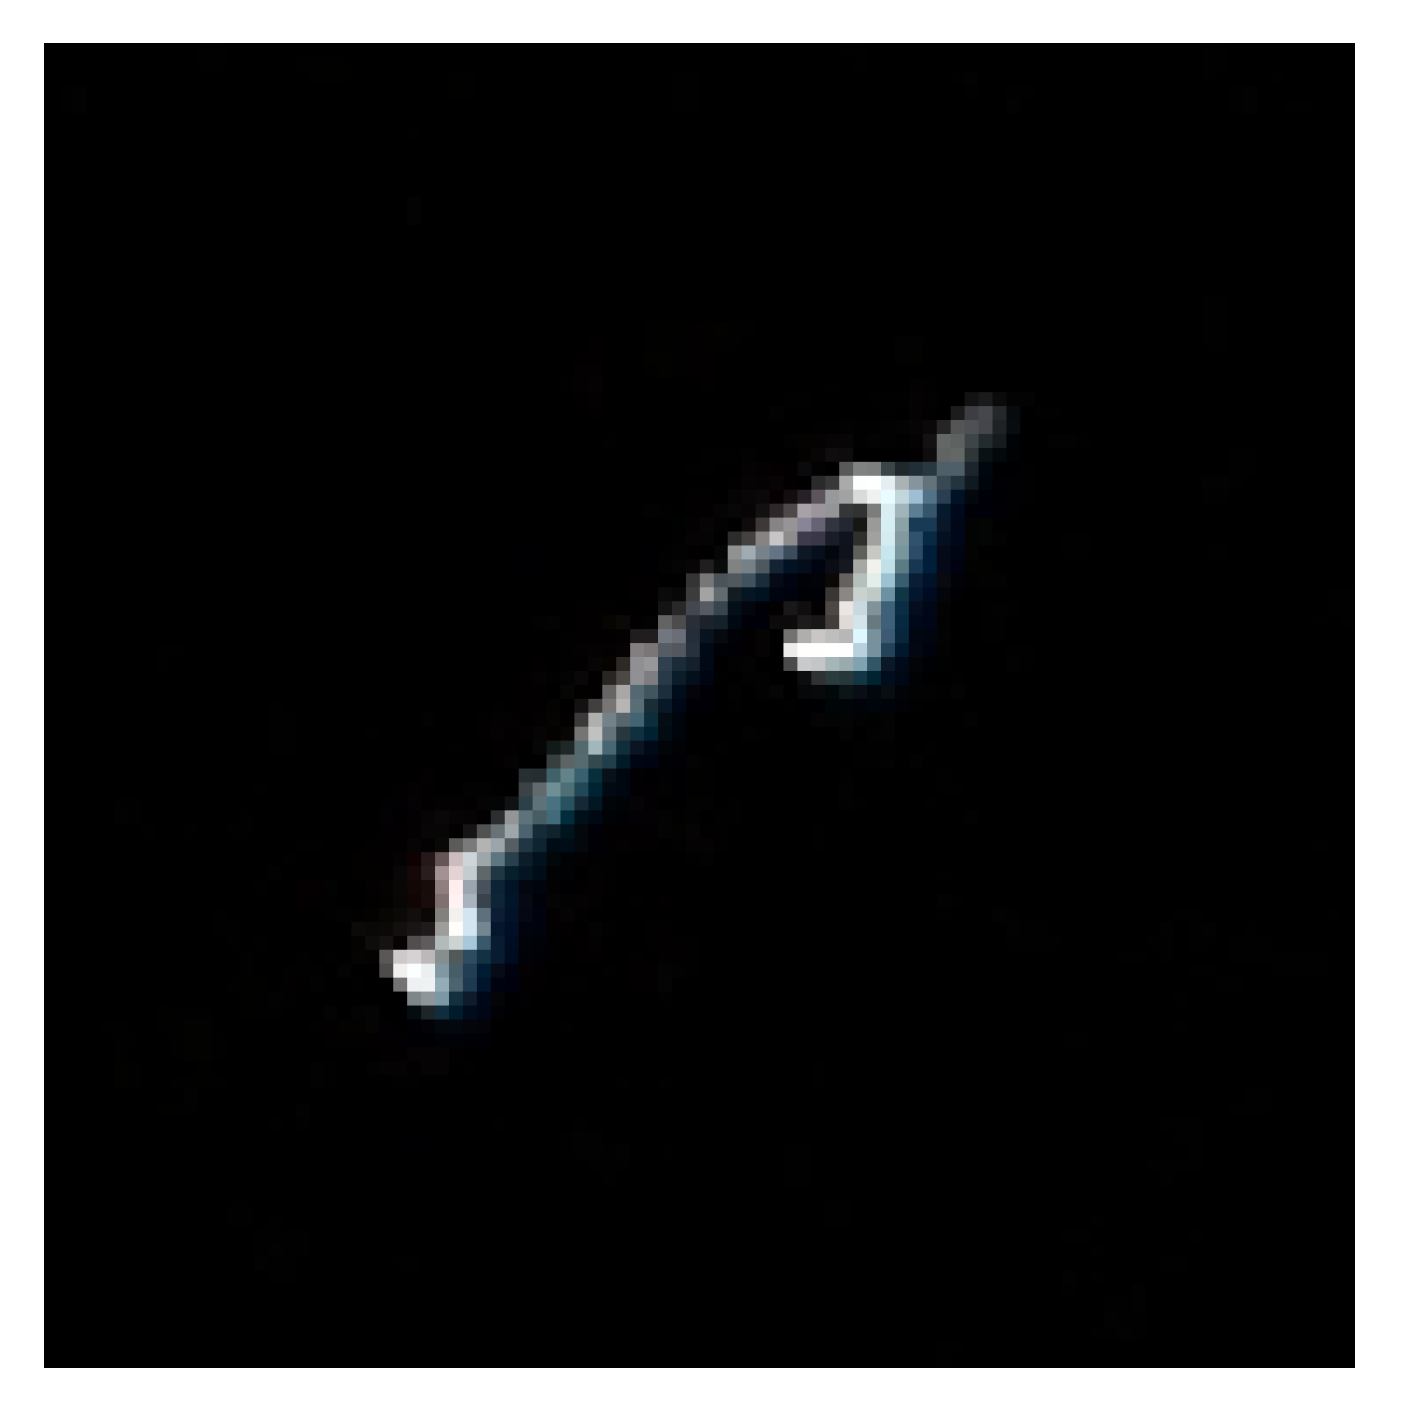
Figure 1. A region of interest containing a single star trail, captured from a strapdown celestial imaging sensor (Pi Camera HQ, 500 ms exposure interval). The shape of the star trail indicates that the camera was subjected to significant changes in attitude throughout the exposure interval.
Drones 07 00052 g001
Figure 2. Flow diagram of image processing chain, with example images (black and white images converted to a perceptually uniform colour scale).
Drones 07 00052 g002
Figure 3. An example of attitude correction, displaying a region of interest for a single star. Greyscale images are overlaid onto a three-channel image. Left: mean-only alignment, Right: fine attitude alignment. Green, real image; blue, synthetic image from INS; red, reprojection after corrections.
Drones 07 00052 g003
Figure 4. Zeta Science FX61 airframe used for capturing in-flight imagery.
Drones 07 00052 g004
Figure 5. An example of Perlin gradient-based noise generation across various octaves (frequencies).
Drones 07 00052 g005
Figure 6. Histogram of mean absolute errors from each simulated image containing n = 14 attitude references. (a) Yaw. (b) Pitch. (c) Roll.
Drones 07 00052 g006
Figure 7. An example of simulation attitude correction, displaying superimposed regions of interest. Green channel, baseline simulation image; blue channel, synthetic image from noisy INS; red channel, synthetic image after corrections. Max yaw error: 0.0727 , max pitch error: 0.0286 , max roll error: 0.0226 .
Drones 07 00052 g007
Figure 8. ROIs of stars used for attitude correction on a real image. Green channel, real image; blue channel, synthetic image from raw INS data; red channel, synthetic image from corrected INS data. The intensity of each ROI is amplified such that the peak pixel intensity is 255.
Drones 07 00052 g008
Figure 9. ROIs of stars used for attitude correction on a real image. Green channel, real image; blue channel, synthetic image from raw INS data; red channel, synthetic image from corrected INS data. The intensity of each ROI is amplified such that the peak pixel intensity is 255.
Drones 07 00052 g009
Table 1. Simulated flight results. All units in degrees.
MeanMedianStdMean + 3 σ
Max yaw error0.10530.09030.08560.2828
Max pitch error0.05030.04140.03170.1453
Max roll error0.05060.04180.02860.1366
Mean absolute yaw error0.04280.04420.02740.1294
Mean absolute pitch error0.02050.01670.01280.0591
Mean absolute roll error0.02170.02070.01290.0604
Mean yaw error0.01180.010760.0322-
Mean pitch error−0.0080−0.00610.0138-
Mean roll error−0.0078−0.00610.02124-
Disclaimer/Publisher’s Note: The statements, opinions and data contained in all publications are solely those of the individual author(s) and contributor(s) and not of MDPI and/or the editor(s). MDPI and/or the editor(s) disclaim responsibility for any injury to people or property resulting from any ideas, methods, instructions or products referred to in the content.