
Modeling Fuzzy and Adaptive Human Behavior for Aircraft with Dynamic-Pitch-Control Envelope Cue


Abstract
1. Introduction
2. Pilot–Aircraft System with Dynamic-Pitch-Control Envelope Cue
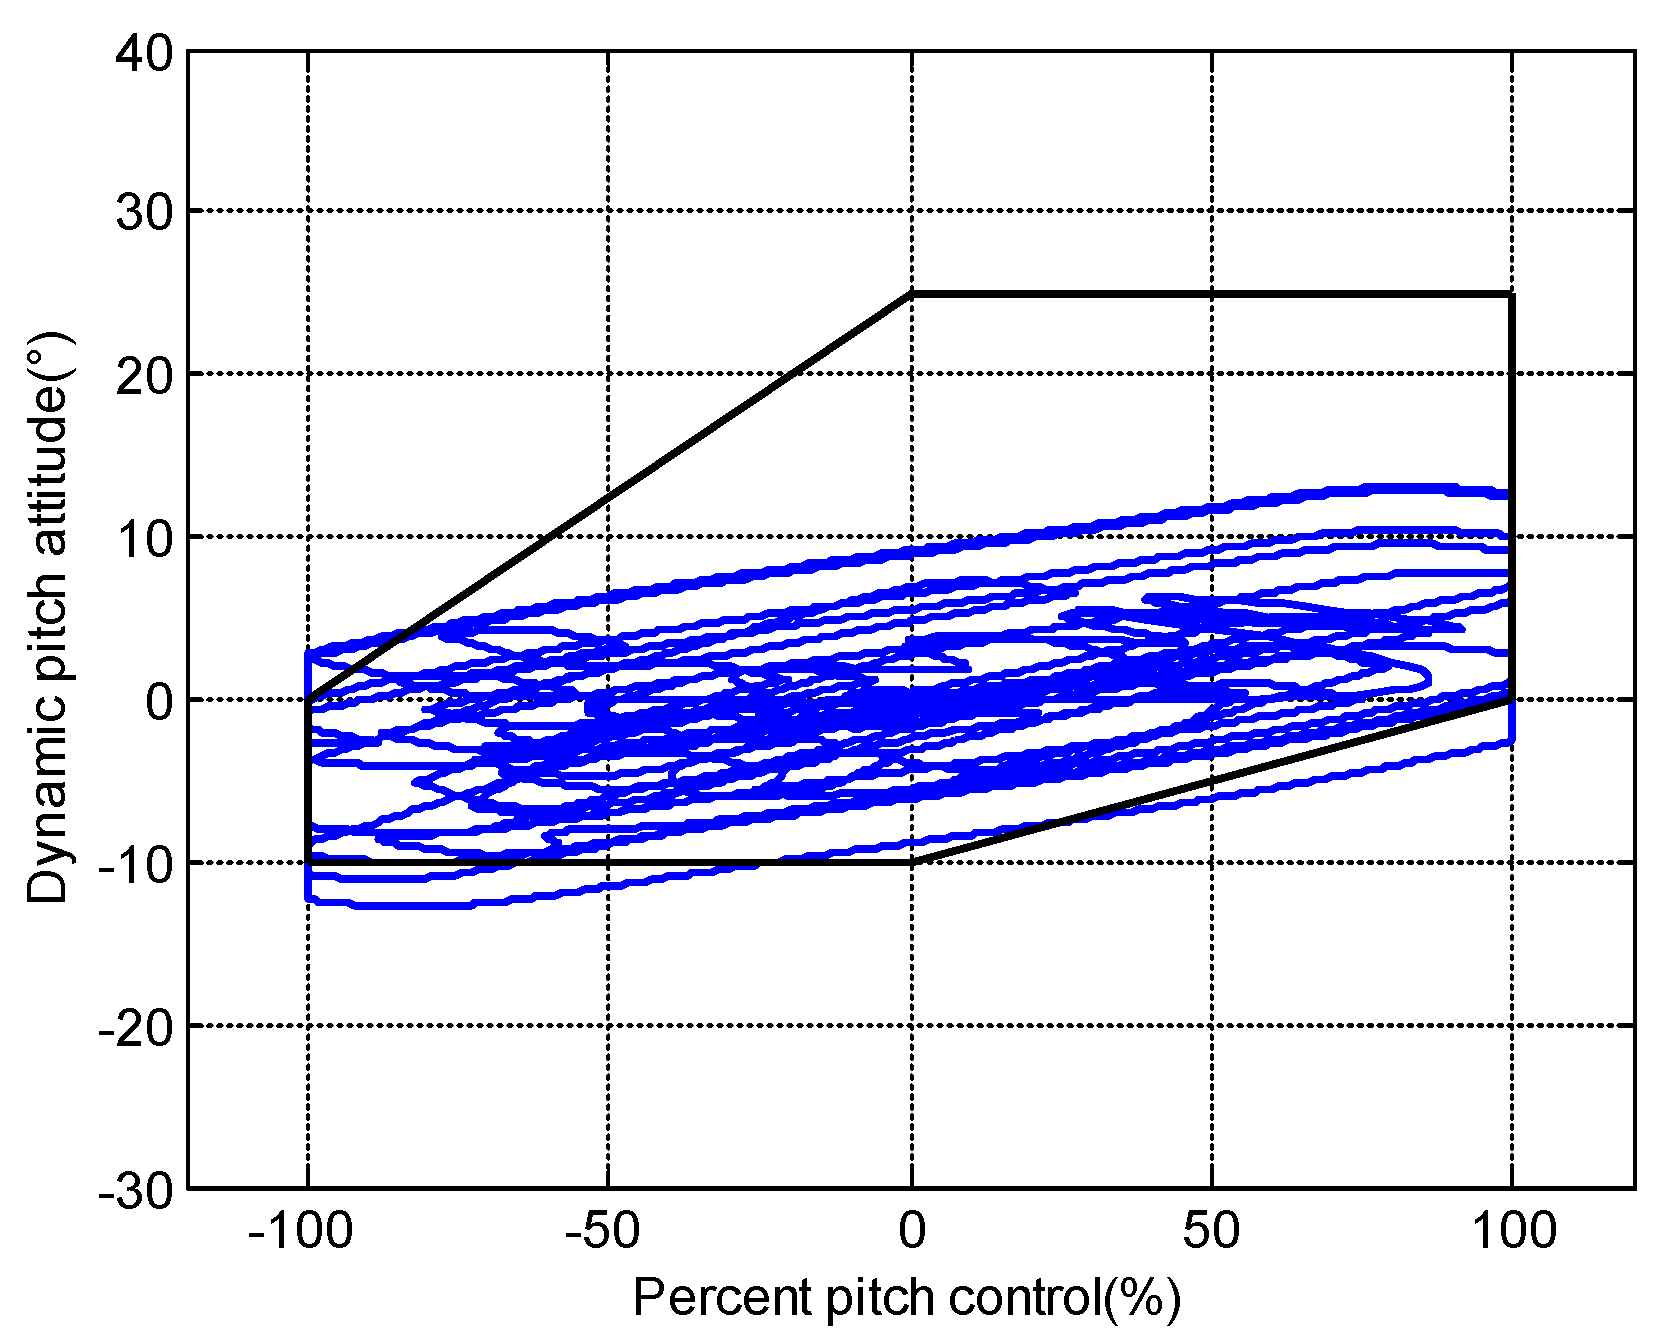
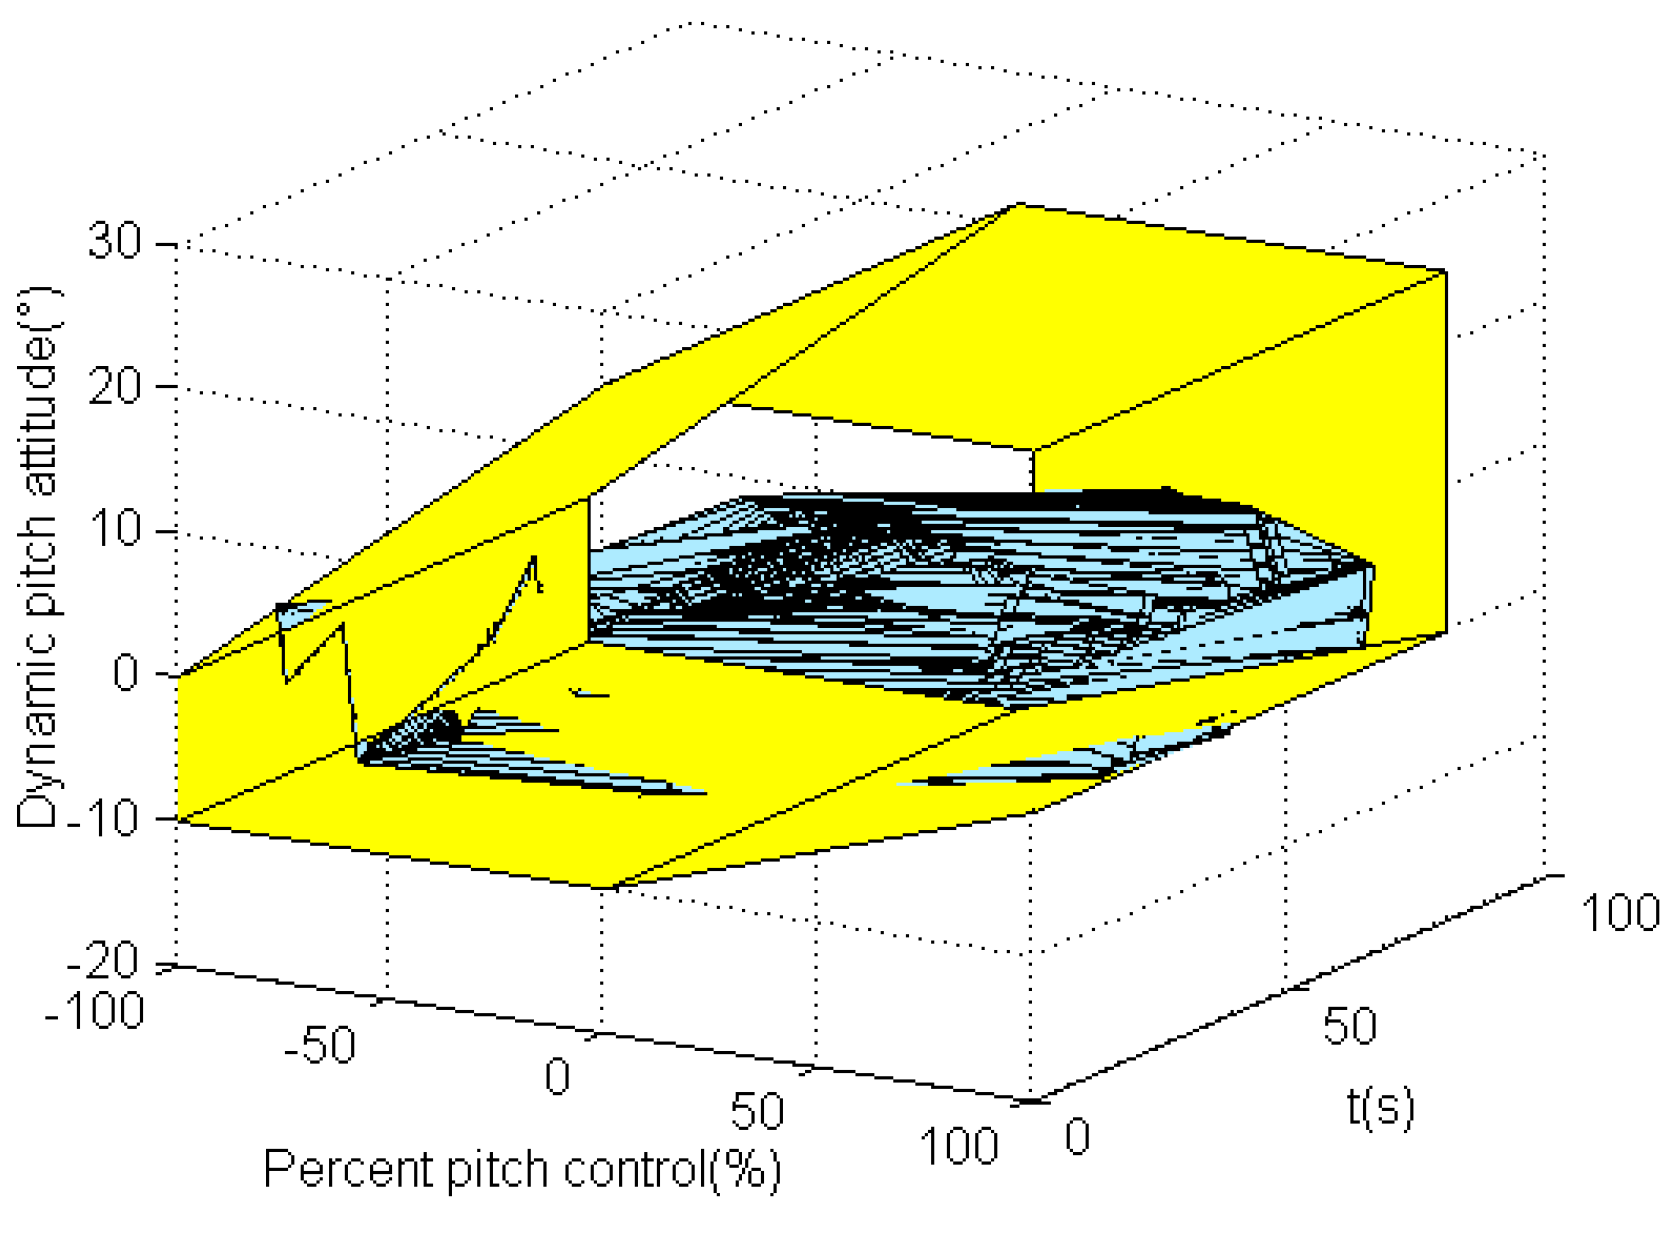
2.1. Dynamic-Pitch-Control Flight Envelope
2.2. Pilot–Aircraft System Model with Dynamic-Pitch-Control Envelope Cue
3. Human Pilot Model
3.1. Adaptation Module
3.2. Perception and Execution Modules
4. Simulation Results
4.1. Pilot–Aircraft System Parameters Description
4.2. Simulation Results Analysis
- (1)
- Simulation results without envelope cue
- (2)
- Simulation results with envelope cue
5. Design of the Dynamic-Pitch-Control Envelope Cue
5.1. Dynamic-Pitch-Control Envelope Cue Design
5.2. Assessment Metrics
- (1)
- Error metric
- (2)
- Envelope boundaries metric
- (3)
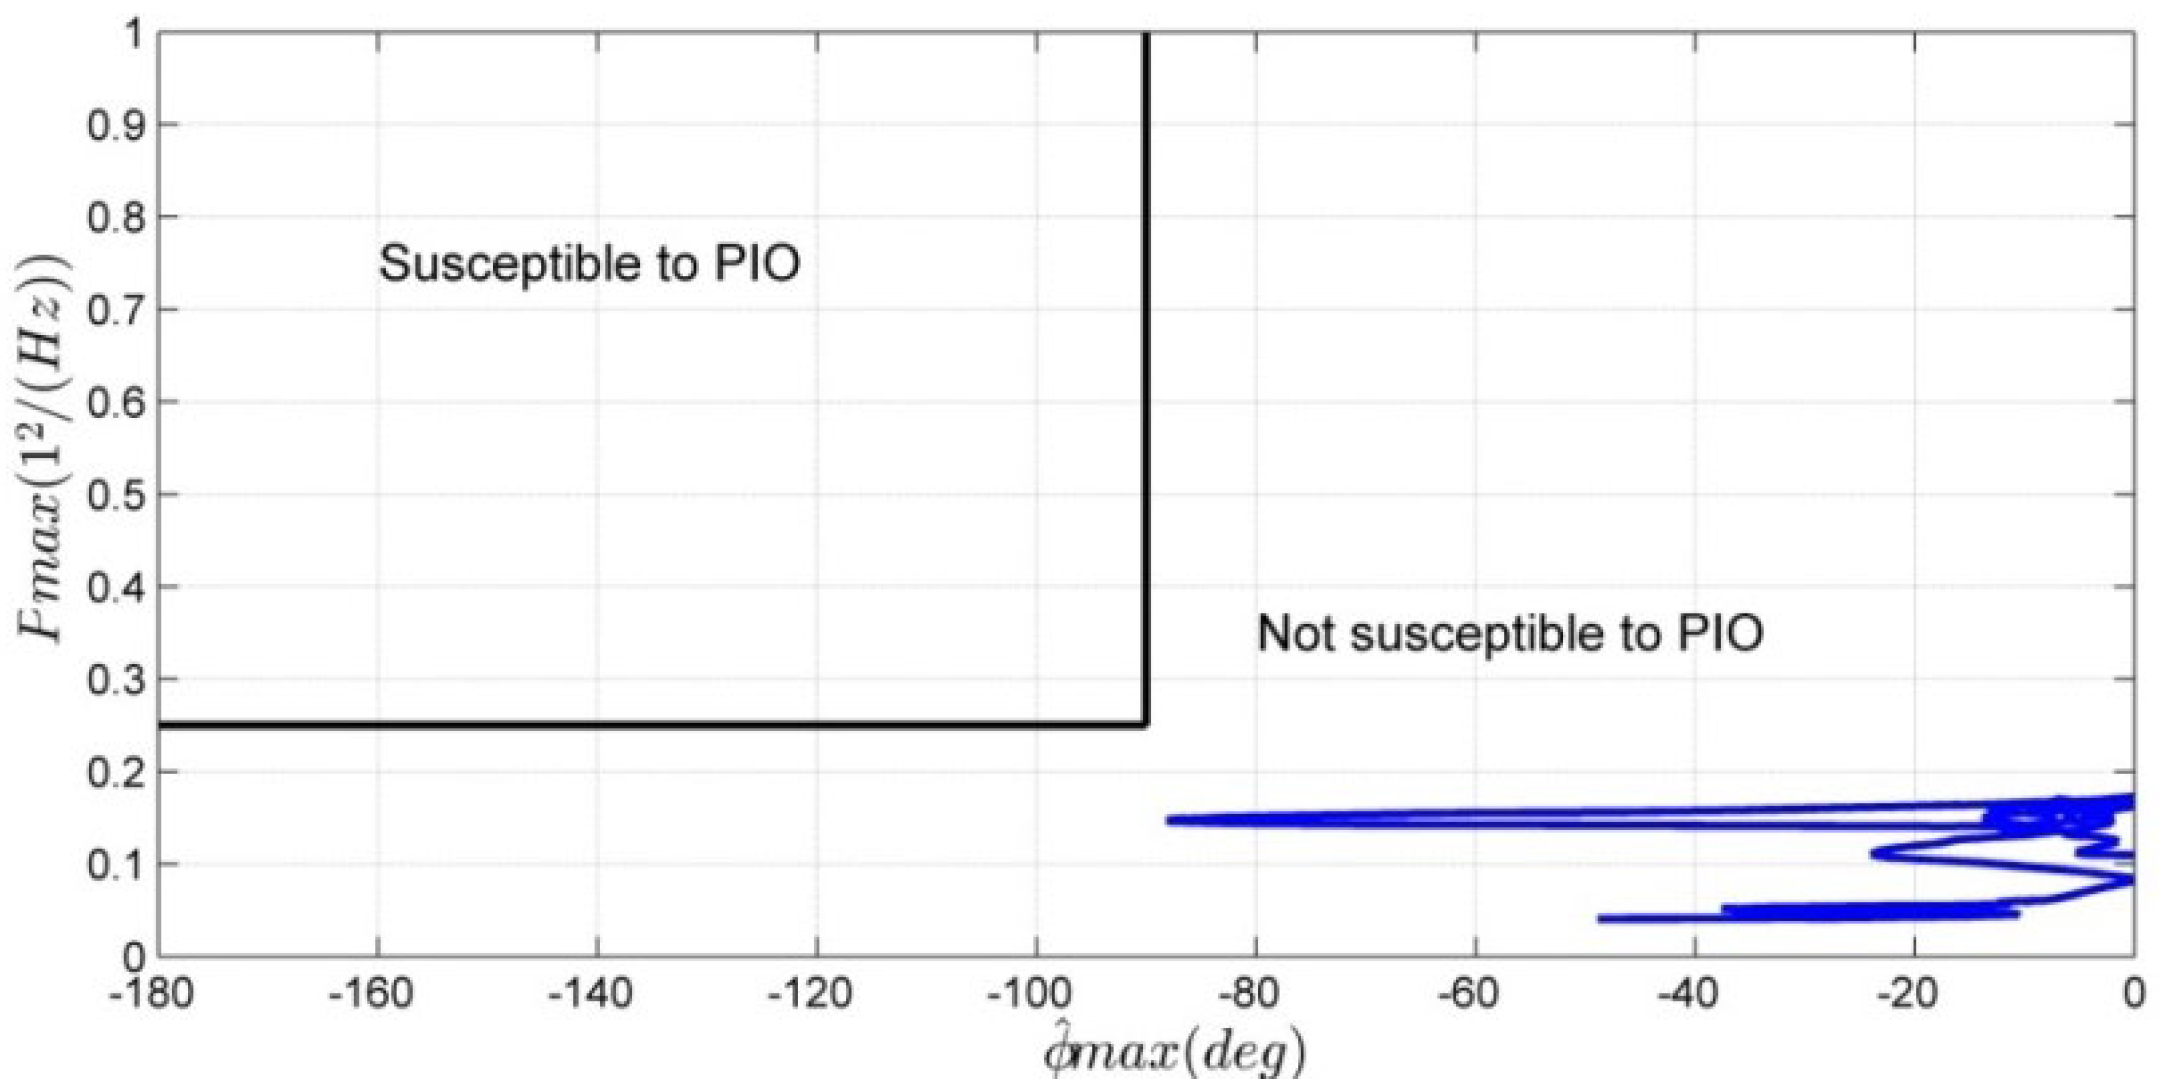
- Scalogram-based PIO metric
5.3. Results and Discussions
6. Experimental Validation and Results Comparison
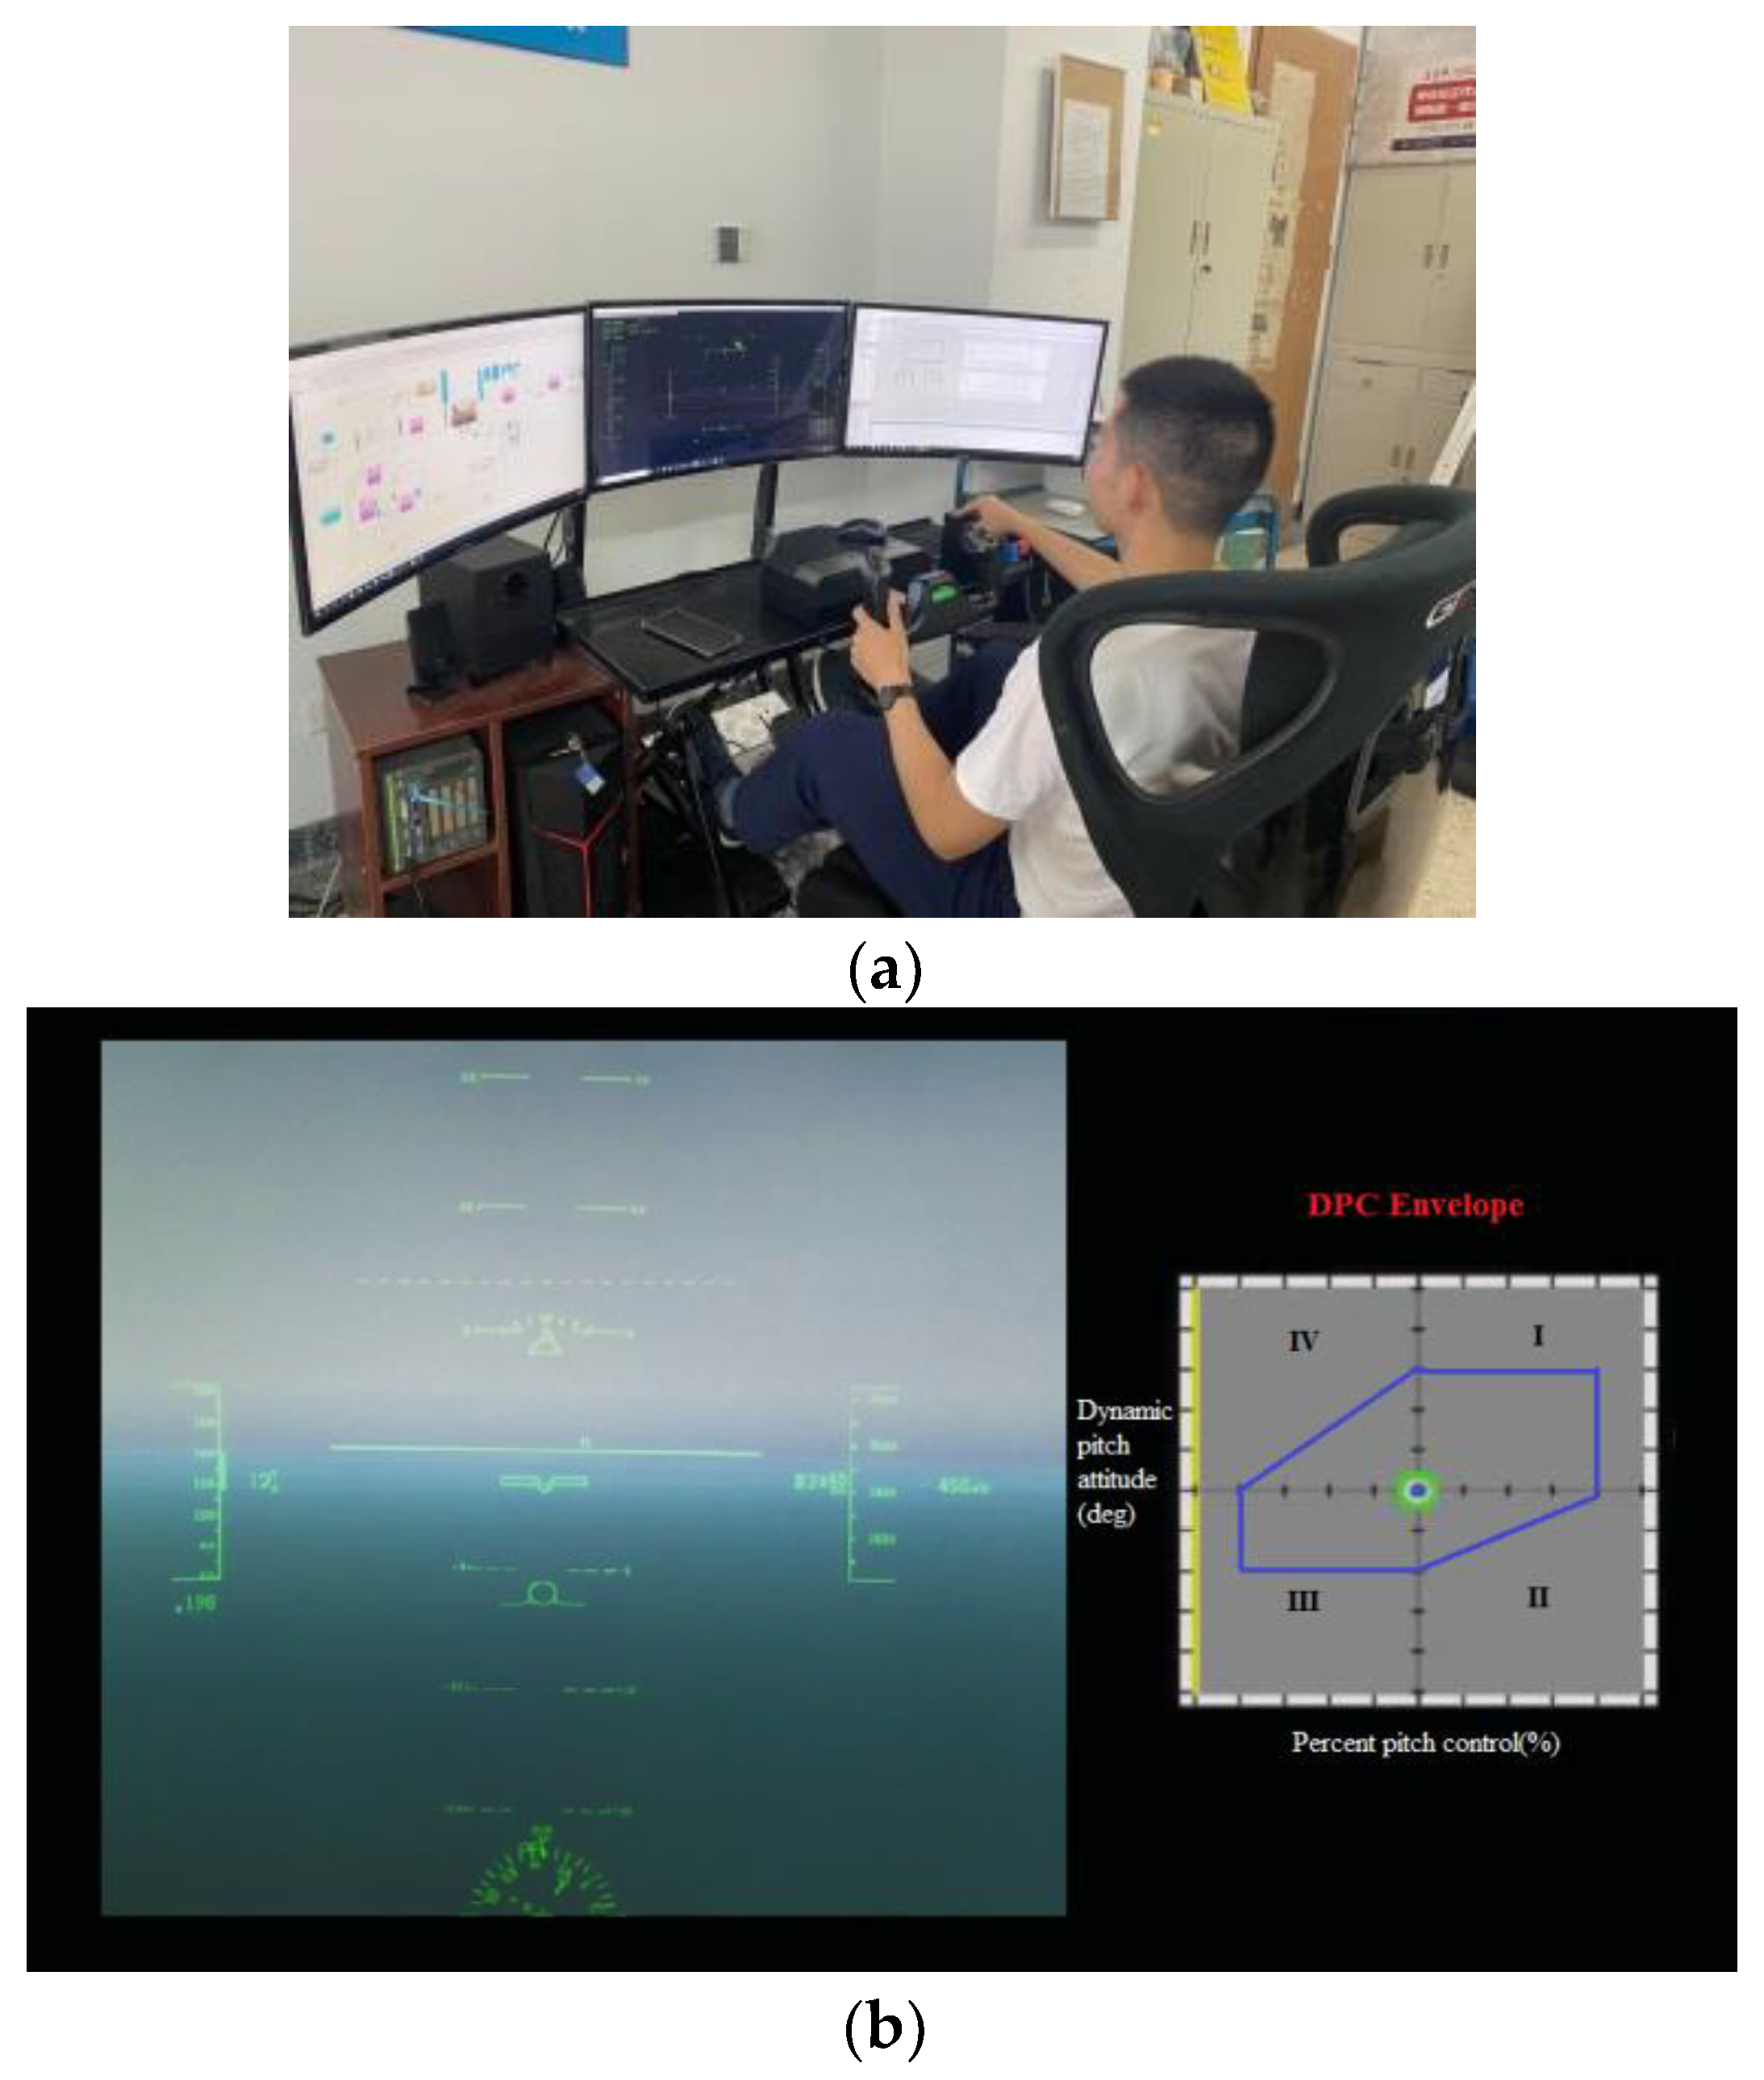
6.1. Experimental Setup
6.2. Experimental Results Analysis
- (1)
- Results of no envelope cue
- (2)
- Results of the original envelope cue
- (3)
- Results of the designed envelope cue
6.3. Results Comparison
7. Conclusions
- (1)
- Based on the behavior characteristics of a human pilot with the dynamic-pitch-control envelope cue, a fuzzy and adaptive human pilot model is developed. The envelope cue provides the PIO or excessive manipulation information for the human pilot via the visual display. The model is different from other models that fail to consider the effect of different envelope cues information. The model can reflect fuzzy, adaptation, and variable strategy characteristics to the flight envelope cue. It utilizes fuzzy logic to describe the fuzziness of a human’s response to the cue and adopts time-varying parameters to accommodate different regional boundaries cues.
- (2)
- Based on the pilot–aircraft system analysis, three metrics assessment methods, including error metric, envelope boundaries metric, and scalogram-based PIO metric, are put forward to design the dynamic-pitch-control envelope cues. Note that the error metric reflects the qualities of task completion, envelope boundaries metric, and scalogram-based PIO metric reflect the prediction of adverse aircraft-pilot couplings. The comparison of the simulation and the experiment demonstrated that the assessments are basically consistent. The simulation and experimental results indicate that the evaluations of small boundary cues are easy to maintain within the envelope boundaries and unsusceptible to the PIO region. While if the envelope boundaries are small enough, the quality of the task completion will be reduced. In this study, the flight envelope cue near the place of 90% from the upper and lower boundaries is effective for mitigating the loss-of-control related to pilot-induced oscillations.
- (3)
- In addition, further investigation of this study is needed. First of all, the investigations of dynamic roll control envelope cues are expected to study the evaluation and mitigation of adverse aircraft-pilot couplings in the roll-axis. Secondly, more experienced human pilots are expected to be introduced into the verification of the human pilot modeling and flight envelope cue design.
Author Contributions
Funding
Conflicts of Interest
References
- Squalli, J. Mutual forbearance, the representativeness heuristic and airline safety. Transp. Res. Part F Traffic Psychol. Behav. 2010, 13, 143–152. [Google Scholar] [CrossRef]
- Smaili, M.H.; Breeman, J.; Lombaerts, T.J.J.; Mulder, J.A.; Chu, Q.P.; Stroosma, O. Intelligent flight control systems evaluation for loss-of-control recovery and prevention. J. Guid. Control Dyn. 2017, 40, 890–904. [Google Scholar] [CrossRef]
- Pavel, M.D.; Masarati, P.; Gennaretti, M.; Jump, M.; Zaichik, L.; Dang-Vu, B.; Lu, L.; Yilmaz, D.; Quaranta, G.; Ionita, A.; et al. Practices to identify and preclude adverse Aircraft-and-Rotorcraft-Pilot Couplings–A design perspective. Prog. Aerosp. Sci. 2015, 76, 55–89. [Google Scholar] [CrossRef]
- Pavel, M.D.; Jump, M.; Dang-Vu, B.; Masarati, P.; Gennaretti, M.; Ionita, A.; Zaichik, L.; Smaili, H.; Quaranta, G.; Yilmaz, D.; et al. Adverse rotorcraft pilot couplings—Past, present and future challenges. Prog. Aerosp. Sci. 2013, 62, 1–51. [Google Scholar] [CrossRef]
- Ji, M.; Xu, Q.; Xu, S.; Du, Q.; Li, D. Proactive personality and situational judgment among civil flying cadets: The roles of risk perception and cognitive flexibility. Transp. Res. Part F Traffic Psychol. Behav. 2018, 59, 179–187. [Google Scholar] [CrossRef]
- Klyde, D.H.; McRuer, D. Smart-cue and smart-gain concepts to alleviate loss of control. J. Guid. Control Dyn. 2009, 32, 1409–1417. [Google Scholar] [CrossRef]
- Wilborn, J.; Foster, J. Defining commercial transport loss-of-control: A quantitative approach. In Proceedings of the AIAA Atmospheric Flight Mechanics Conference and Exhibit, Providence, RI, USA, 16–19 August 2004; p. 4811. [Google Scholar]
- Lombaerts, T.; Schuet, S.; Acosta, D.; Kaneshige, J.; Shish, K.; Martin, L. Piloted simulator evaluation of safe flight envelope display indicators for loss of control avoidance. J. Guid. Control Dyn. 2017, 40, 948–963. [Google Scholar] [CrossRef]
- Garone, E.; Di Cairano, S.; Kolmanovsky, I. Reference and command governors for systems with constraints: A survey on theory and applications. Automatica 2017, 75, 306–328. [Google Scholar] [CrossRef]
- Zheng, W.; Li, Y.; Zhang, D.; Zhou, C.; Wu, P. Envelope protection for aircraft encountering upset condition based on dynamic envelope enlargement. Chin. J. Aeronaut. 2018, 31, 1461–1469. [Google Scholar] [CrossRef]
- Sun, D.; Jafarnejadsani, H.; Hovakimyan, N. Command Limiting for Aerial Vehicles with Rate Control Augmentation Systems. IEEE Trans. Aerosp. Electron. Syst. 2021, 57, 1702–1712. [Google Scholar] [CrossRef]
- Yuan, G.; Li, Y. Determination of the flight dynamic envelope via stable manifold. Meas. Control 2019, 52, 244–251. [Google Scholar] [CrossRef]
- Zhang, Y.; Huang, Y.; Chu, Q.; de Visser, C.C. Database-Driven Safe Flight-Envelope Protection for Impaired Aircraft. J. Aerosp. Inf. Syst. 2021, 18, 14–25. [Google Scholar] [CrossRef]
- Norouzi, R.; Kosari, A.; Sabour, M.H. Investigating Impaired Aircraft’s Flight Envelope Variation Predictability Using Least-Squares Regression Analysis. J. Aerosp. Inf. Syst. 2020, 17, 3–23. [Google Scholar] [CrossRef]
- Wang, Z.; Wang, Q.; Dong, C.; Gong, L. Closed-loop fault detection for full-envelope flight vehicle with measurement delays. Chin. J. Aeronaut. 2015, 28, 832–844. [Google Scholar] [CrossRef]
- Maciejowski, J.M.; Hartley, E.N.; Siaulys, K. A longitudinal flight control law to accommodate sensor loss in the reconfigure benchmark. Annu. Rev. Control 2016, 42, 212–223. [Google Scholar] [CrossRef][Green Version]
- Sun, D.; Hovakimyan, N.; Jafarnejadsani, H. Design of command limiting control law using exponential potential functions. J. Guid. Control Dyn. 2021, 44, 441–448. [Google Scholar] [CrossRef]
- Venkataraman, R.; Bauer, P.; Seiler, P.; Vanek, B. Comparison of fault detection and isolation methods for a small unmanned aircraft. Control Eng. Pract. 2019, 84, 365–376. [Google Scholar] [CrossRef]
- Liu, Z.; Wang, Y. Fuzzy adaptive tracking control within the full envelope for an unmanned aerial vehicle. Chin. J. Aeronaut. 2014, 27, 1273–1287. [Google Scholar] [CrossRef]
- Rohith, G. An investigation into aircraft loss of control and recovery solutions. Proc. Inst. Mech. Eng. Part G J. Aerosp. Eng. 2019, 233, 4509–4522. [Google Scholar] [CrossRef]
- Lombaerts, T.; Looye, G.; Seefried, A.; Neves, M.; Bellmann, T. Proof of concept simulator demonstration of a physics based self-preserving flight envelope protection algorithm. Eng. Appl. Artif. Intell. 2018, 67, 368–380. [Google Scholar] [CrossRef]
- Hughes, J.S.; Jamie, S.; Trafimow, D.; Clayton, K. The automated cockpit: A comparison of attitudes towards human and automated pilots. Transp. Res. Part F Traffic Psychol. Behav. 2009, 12, 428–439. [Google Scholar] [CrossRef]
- Klyde, D.H.; Schulze, P.C.; Mello, R.S.F.D.; Mitchell, D.G.; Cameron, N.; Cunliffe, C.; White, M.D. Assessment of a Scalogram-Based Pilot-Induced Oscillation Metric with Flight-Test and Simulation Data. J. Guid. Control Dyn. 2020, 43, 2058–2072. [Google Scholar] [CrossRef]
- Koglbauer, I.; Reinhard, B. Ab initio pilot training for traffic separation and visual airport procedures in a naturalistic flight simulation environment. Transp. Res. Part F Traffic Psychol. Behav. 2018, 58, 1–10. [Google Scholar] [CrossRef]
- Van Baelen, D.; van Paassen, R.; Ellerbroek, J.; Abbink, D.; Mulder, M. Evaluating Stick Stiffness and Position Guidance for Feedback on Flight Envelope Protection. In Proceedings of the AIAA Scitech 2021 Forum, Online, 11–15 January 2021; p. 1013. [Google Scholar]
- Van Baelen, D.; van Paassen, M.M.; Ellerbroek, J.; Abbink, D.A.; Mulder, M. Flying by Feeling: Communicating Flight Envelope Protection through Haptic Feedback. Int. J. Hum.–Comput. Interact. 2021, 37, 655–665. [Google Scholar] [CrossRef]
- Benloucif, M.A.; Sentouh, C.; Floris, J.; Simon, P.; Popieul, J.C. Online adaptation of the level of haptic authority in a lane keeping system considering the driver’s state. Transp. Res. Part F Traffic Psychol. Behav. 2019, 61, 107–119. [Google Scholar] [CrossRef]
- Van Baelen, D.; Ellerbroek, J.; van Paassen, M.M.; Abbink, D.; Mulder, M. Using Asymmetric Vibrations for Feedback on Flight Envelope Protection. In Proceedings of the AIAA Scitech 2020 Forum, Orlando, FL, USA, 6–10 January 2020; p. 0409. [Google Scholar]
- Ackerman, K.A.; Talleur, D.A.; Carbonari, R.S.; Xargay, E.; Seefeldt, B.D.; Kirlik, A.; Hovakimyan, N.; Trujillo, A.C. Automation situation awareness display for a flight envelope protection system. J. Guid. Control Dyn. 2017, 40, 964–980. [Google Scholar] [CrossRef]
- Nguyen, T.; Lim, C.P.; Nguyen, N.D.; Gordon-Brown, L.; Nahavandi, S. A review of situation awareness assessment approaches in aviation environments. IEEE Syst. J. 2019, 13, 3590–3603. [Google Scholar] [CrossRef]
- Stepanyan, V.; Krishnakumar, K.; Dorais, G.; Reardon, S.; Barlow, J.; Lampton, A.; Hardy, G. Loss-of-control mitigation via predictive cuing. J. Guid. Control Dyn. 2017, 40, 831–846. [Google Scholar] [CrossRef]
- Xu, S.; Tan, W.; Qu, X. Modeling human pilot behavior for aircraft with a smart inceptor. IEEE Trans. Hum.-Mach. Syst. 2019, 49, 661–671. [Google Scholar] [CrossRef]
- Xu, S.; Tan, W.; Qu, X.; Zhang, C. Prediction of nonlinear pilot-induced oscillation using an intelligent human pilot model. Chin. J. Aeronaut. 2019, 32, 2592–2611. [Google Scholar] [CrossRef]
- Hess, R.A. A model for pilot control behavior in analyzing potential loss-of-control events. Proc. Inst. Mech. Eng. Part G J. Aerosp. Eng. 2014, 228, 1845–1856. [Google Scholar] [CrossRef]
- Hess, R.A. Modeling pilot control behavior with sudden changes in vehicle dynamics. J. Aircr. 2009, 46, 1584–1592. [Google Scholar] [CrossRef]
- Xu, S.; Wu, Y. Modeling multi-loop intelligent pilot control behavior for aircraft-pilot couplings analysis. Aerosp. Sci. Technol. 2021, 112, 106651. [Google Scholar] [CrossRef]
- Entzinger, J.O.; Suzuki, S. Modeling of the visual approach to landing using neural networks and fuzzy supervisory control. Aerosp. Sci. Technol. 2010, 14, 118–125. [Google Scholar] [CrossRef]


| Fuzzy Sets of Input | Fuzzy Sets of Output | ||||
|---|---|---|---|---|---|
| Name | Membership Function | Distribution | Name | Membership Function | Distribution |
| RS | Trapezoidal shape | RT | S-shape | ||
| NS | Trapezoidal shape | NT | S-shape | ||
| Parameter | Value |
|---|---|
| Spring Gradient (N/m) | 400 |
| Damping (N·s/m) | 28.28 |
| Mass (kg) | 1 |
| Control system gearing | 1 |
| Flight Control System | Form | Parameter Values |
|---|---|---|
| Rate limit (°/s) | 10°/s (failure) 100°/s (baseline) | |
| Surface actuator | ||
| Surface position limit (°) | 30° |
| Cue | Error Metric | Envelope Boundaries Metric | Scalogram-Based PIO Metric |
|---|---|---|---|
| Original envelope cue | 2.12 | Beyond envelope | Susceptible to PIO |
| Envelope cue 1 | 1.65 | Beyond envelope | Susceptible to PIO |
| Envelope cue 2 | 1.21 | Safe range | Not susceptible to PIO |
| Envelope cue 3 | 1.25 | Safe range | Not susceptible to PIO |
| Cue | Simulation/Experiment | Error Metric | Envelope Boundaries Metric | Scalogram-Based PIO Metric |
|---|---|---|---|---|
| Original envelope cue | Experiment | 1.1454 | Beyond envelope | Susceptible to PIO |
| Simulation | 2.12 | Beyond envelope | Susceptible to PIO | |
| Envelope cue 1 | Experiment | 0.9302 | Beyond envelope | Not susceptible to PIO |
| Simulation | 1.65 | Beyond envelope | Susceptible to PIO | |
| Envelope cue 2 | Experiment | 0.8868 | Safe range | Not susceptible to PIO |
| Simulation | 1.21 | Safe range | Not susceptible to PIO | |
| Envelope cue 3 | Experiment | 0.9306 | Safe range | Not susceptible to PIO |
| Simulation | 1.25 | Safe range | Not susceptible to PIO |
Publisher’s Note: MDPI stays neutral with regard to jurisdictional claims in published maps and institutional affiliations. |
© 2022 by the authors. Licensee MDPI, Basel, Switzerland. This article is an open access article distributed under the terms and conditions of the Creative Commons Attribution (CC BY) license (https://creativecommons.org/licenses/by/4.0/).
Share and Cite
Xu, S.; Tan, W.; Wu, Y.; Sun, L. Modeling Fuzzy and Adaptive Human Behavior for Aircraft with Dynamic-Pitch-Control Envelope Cue. Drones 2022, 6, 121. https://doi.org/10.3390/drones6050121
Xu S, Tan W, Wu Y, Sun L. Modeling Fuzzy and Adaptive Human Behavior for Aircraft with Dynamic-Pitch-Control Envelope Cue. Drones. 2022; 6(5):121. https://doi.org/10.3390/drones6050121
Chicago/Turabian StyleXu, Shuting, Wenqian Tan, Yu Wu, and Liguo Sun. 2022. "Modeling Fuzzy and Adaptive Human Behavior for Aircraft with Dynamic-Pitch-Control Envelope Cue" Drones 6, no. 5: 121. https://doi.org/10.3390/drones6050121
APA StyleXu, S., Tan, W., Wu, Y., & Sun, L. (2022). Modeling Fuzzy and Adaptive Human Behavior for Aircraft with Dynamic-Pitch-Control Envelope Cue. Drones, 6(5), 121. https://doi.org/10.3390/drones6050121