
Multi-Target Association for UAVs Based on Triangular Topological Sequence


Abstract
:1. Introduction
- (1)
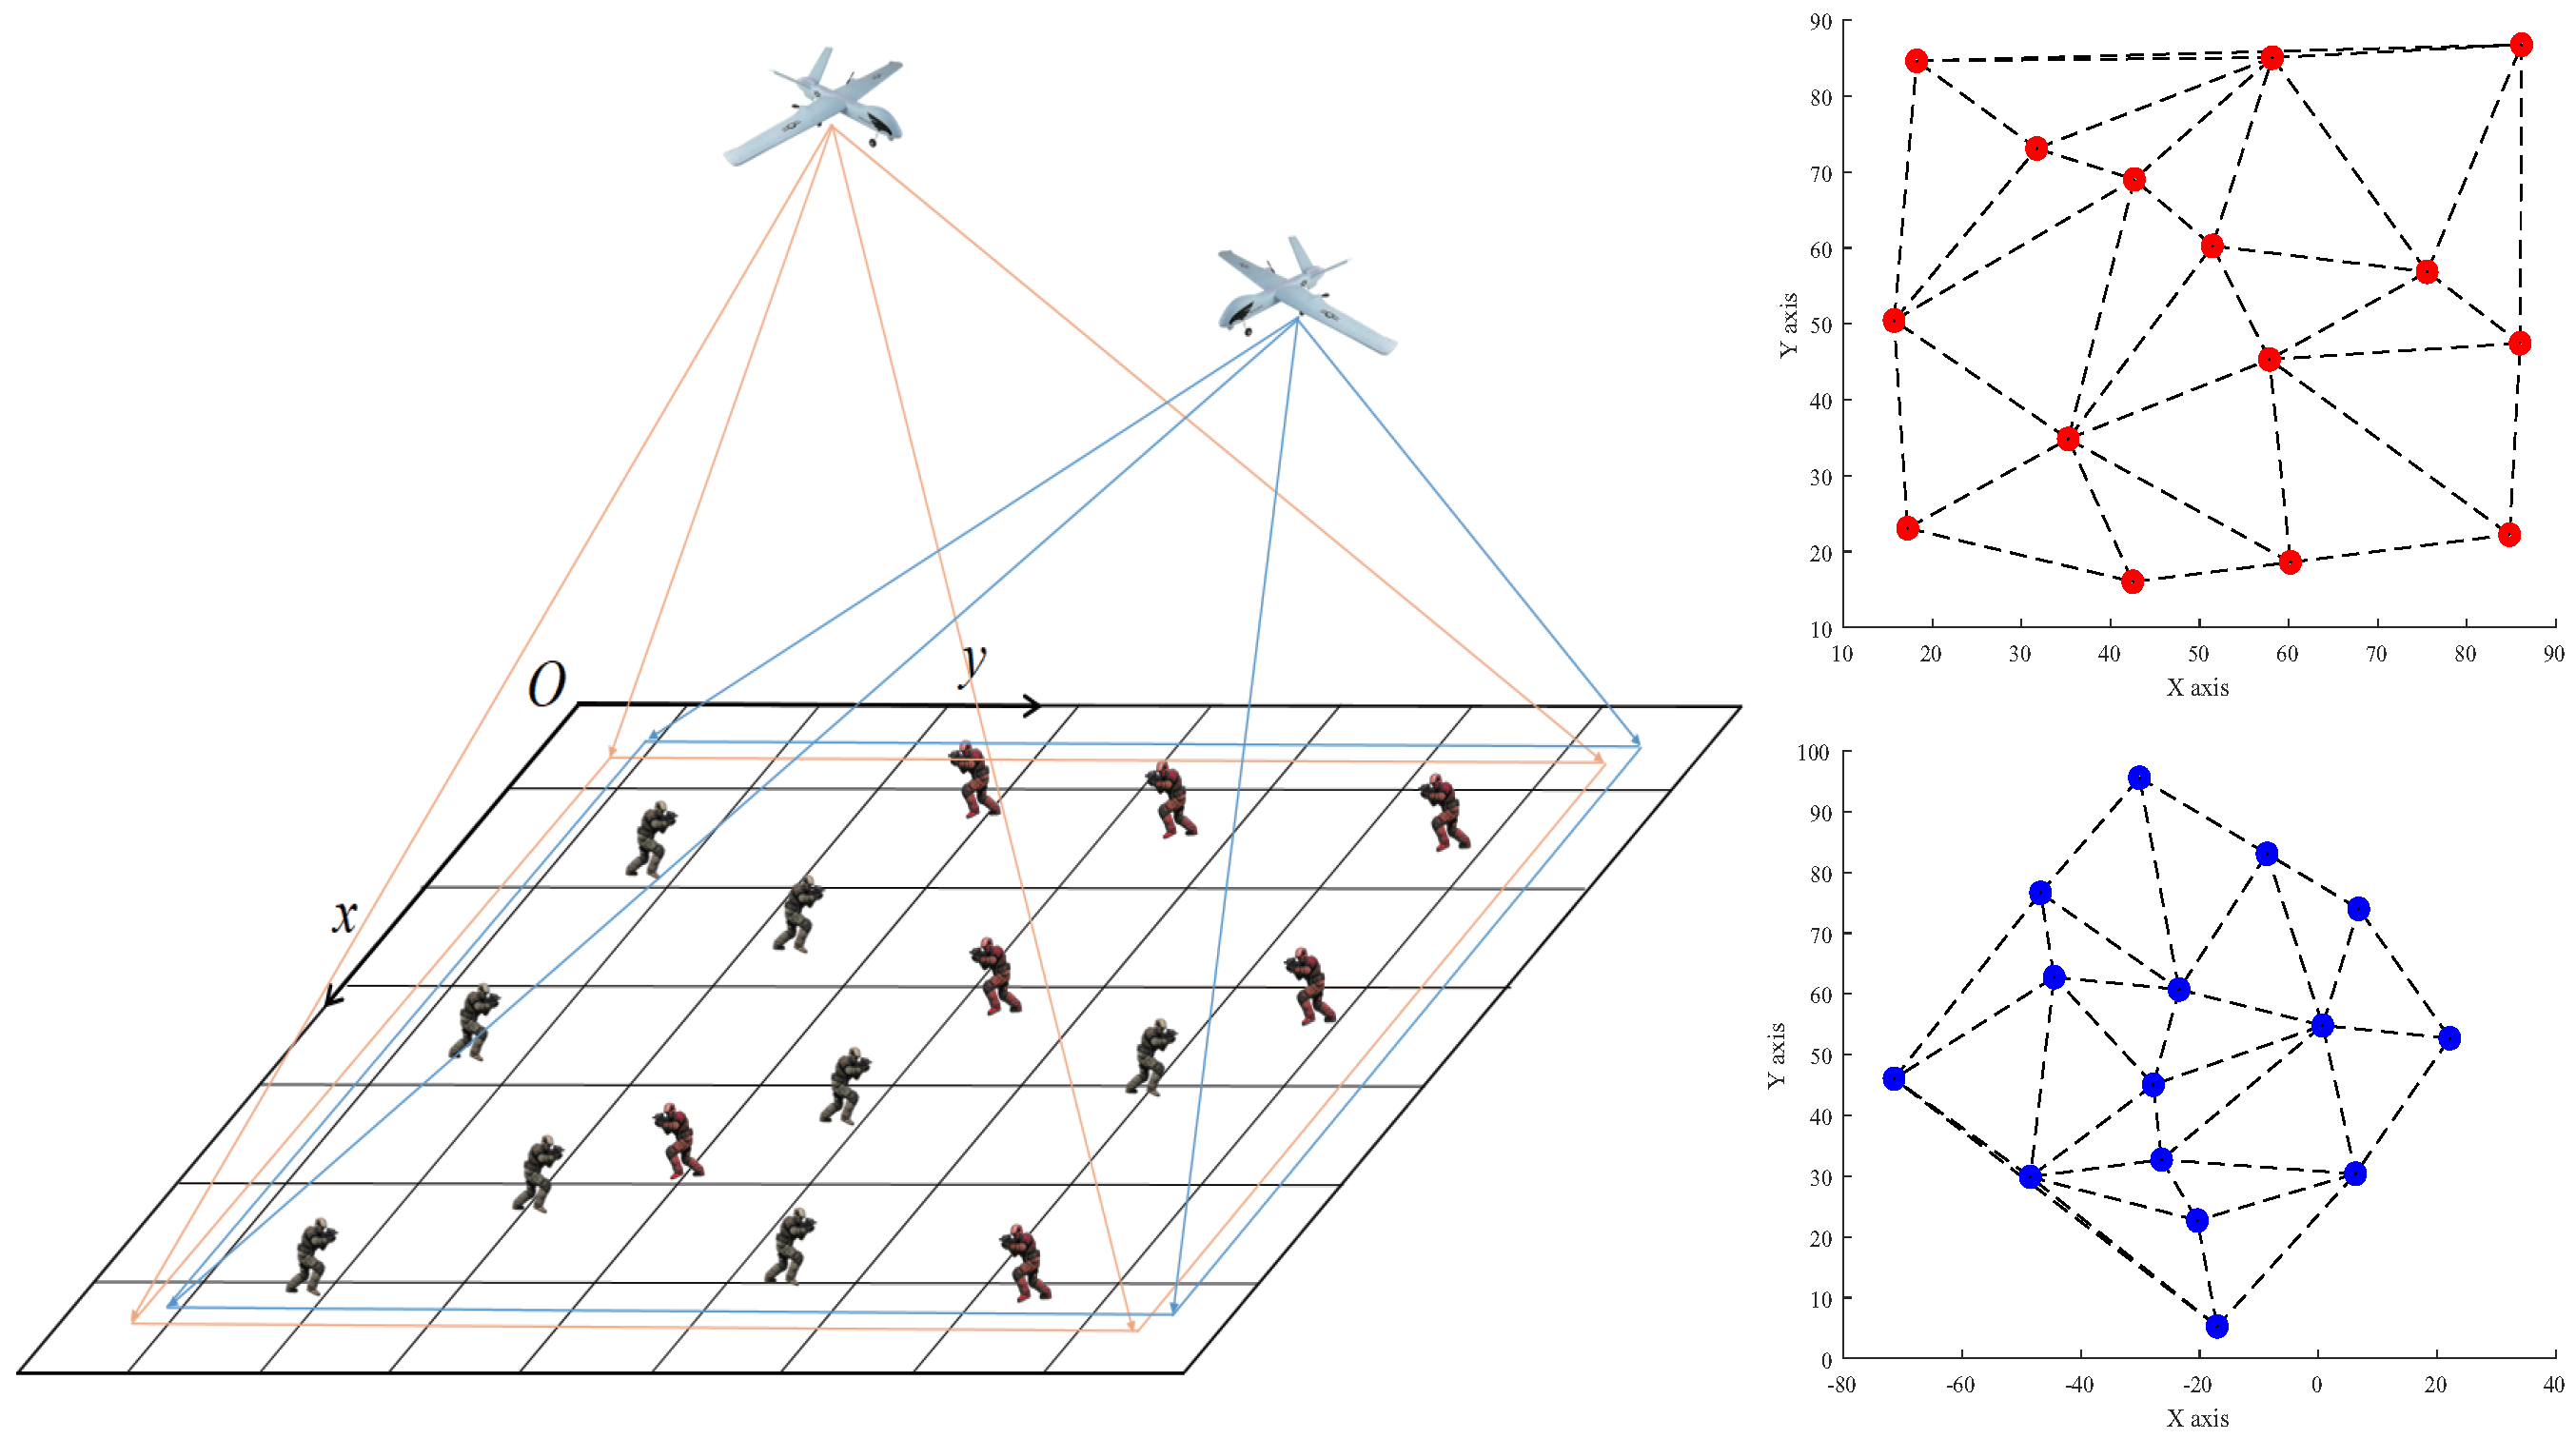
- Rather than relying on image and trajectory features, it distinguishes and associates identical targets within a single context using their relative positions.
- (2)
- The method for calculating similarity exhibits similar transformation invariance. The method used to generate feature sequences is a non-empirical one.
- (3)
- The association process considers the target coordinates’ global consistency.
- (4)
- The algorithms are applicable to vision and vision sensors, as well as vision and infrared sensors, as well as infrared and infrared sensors.
2. Related Works
3. Materials and Methods
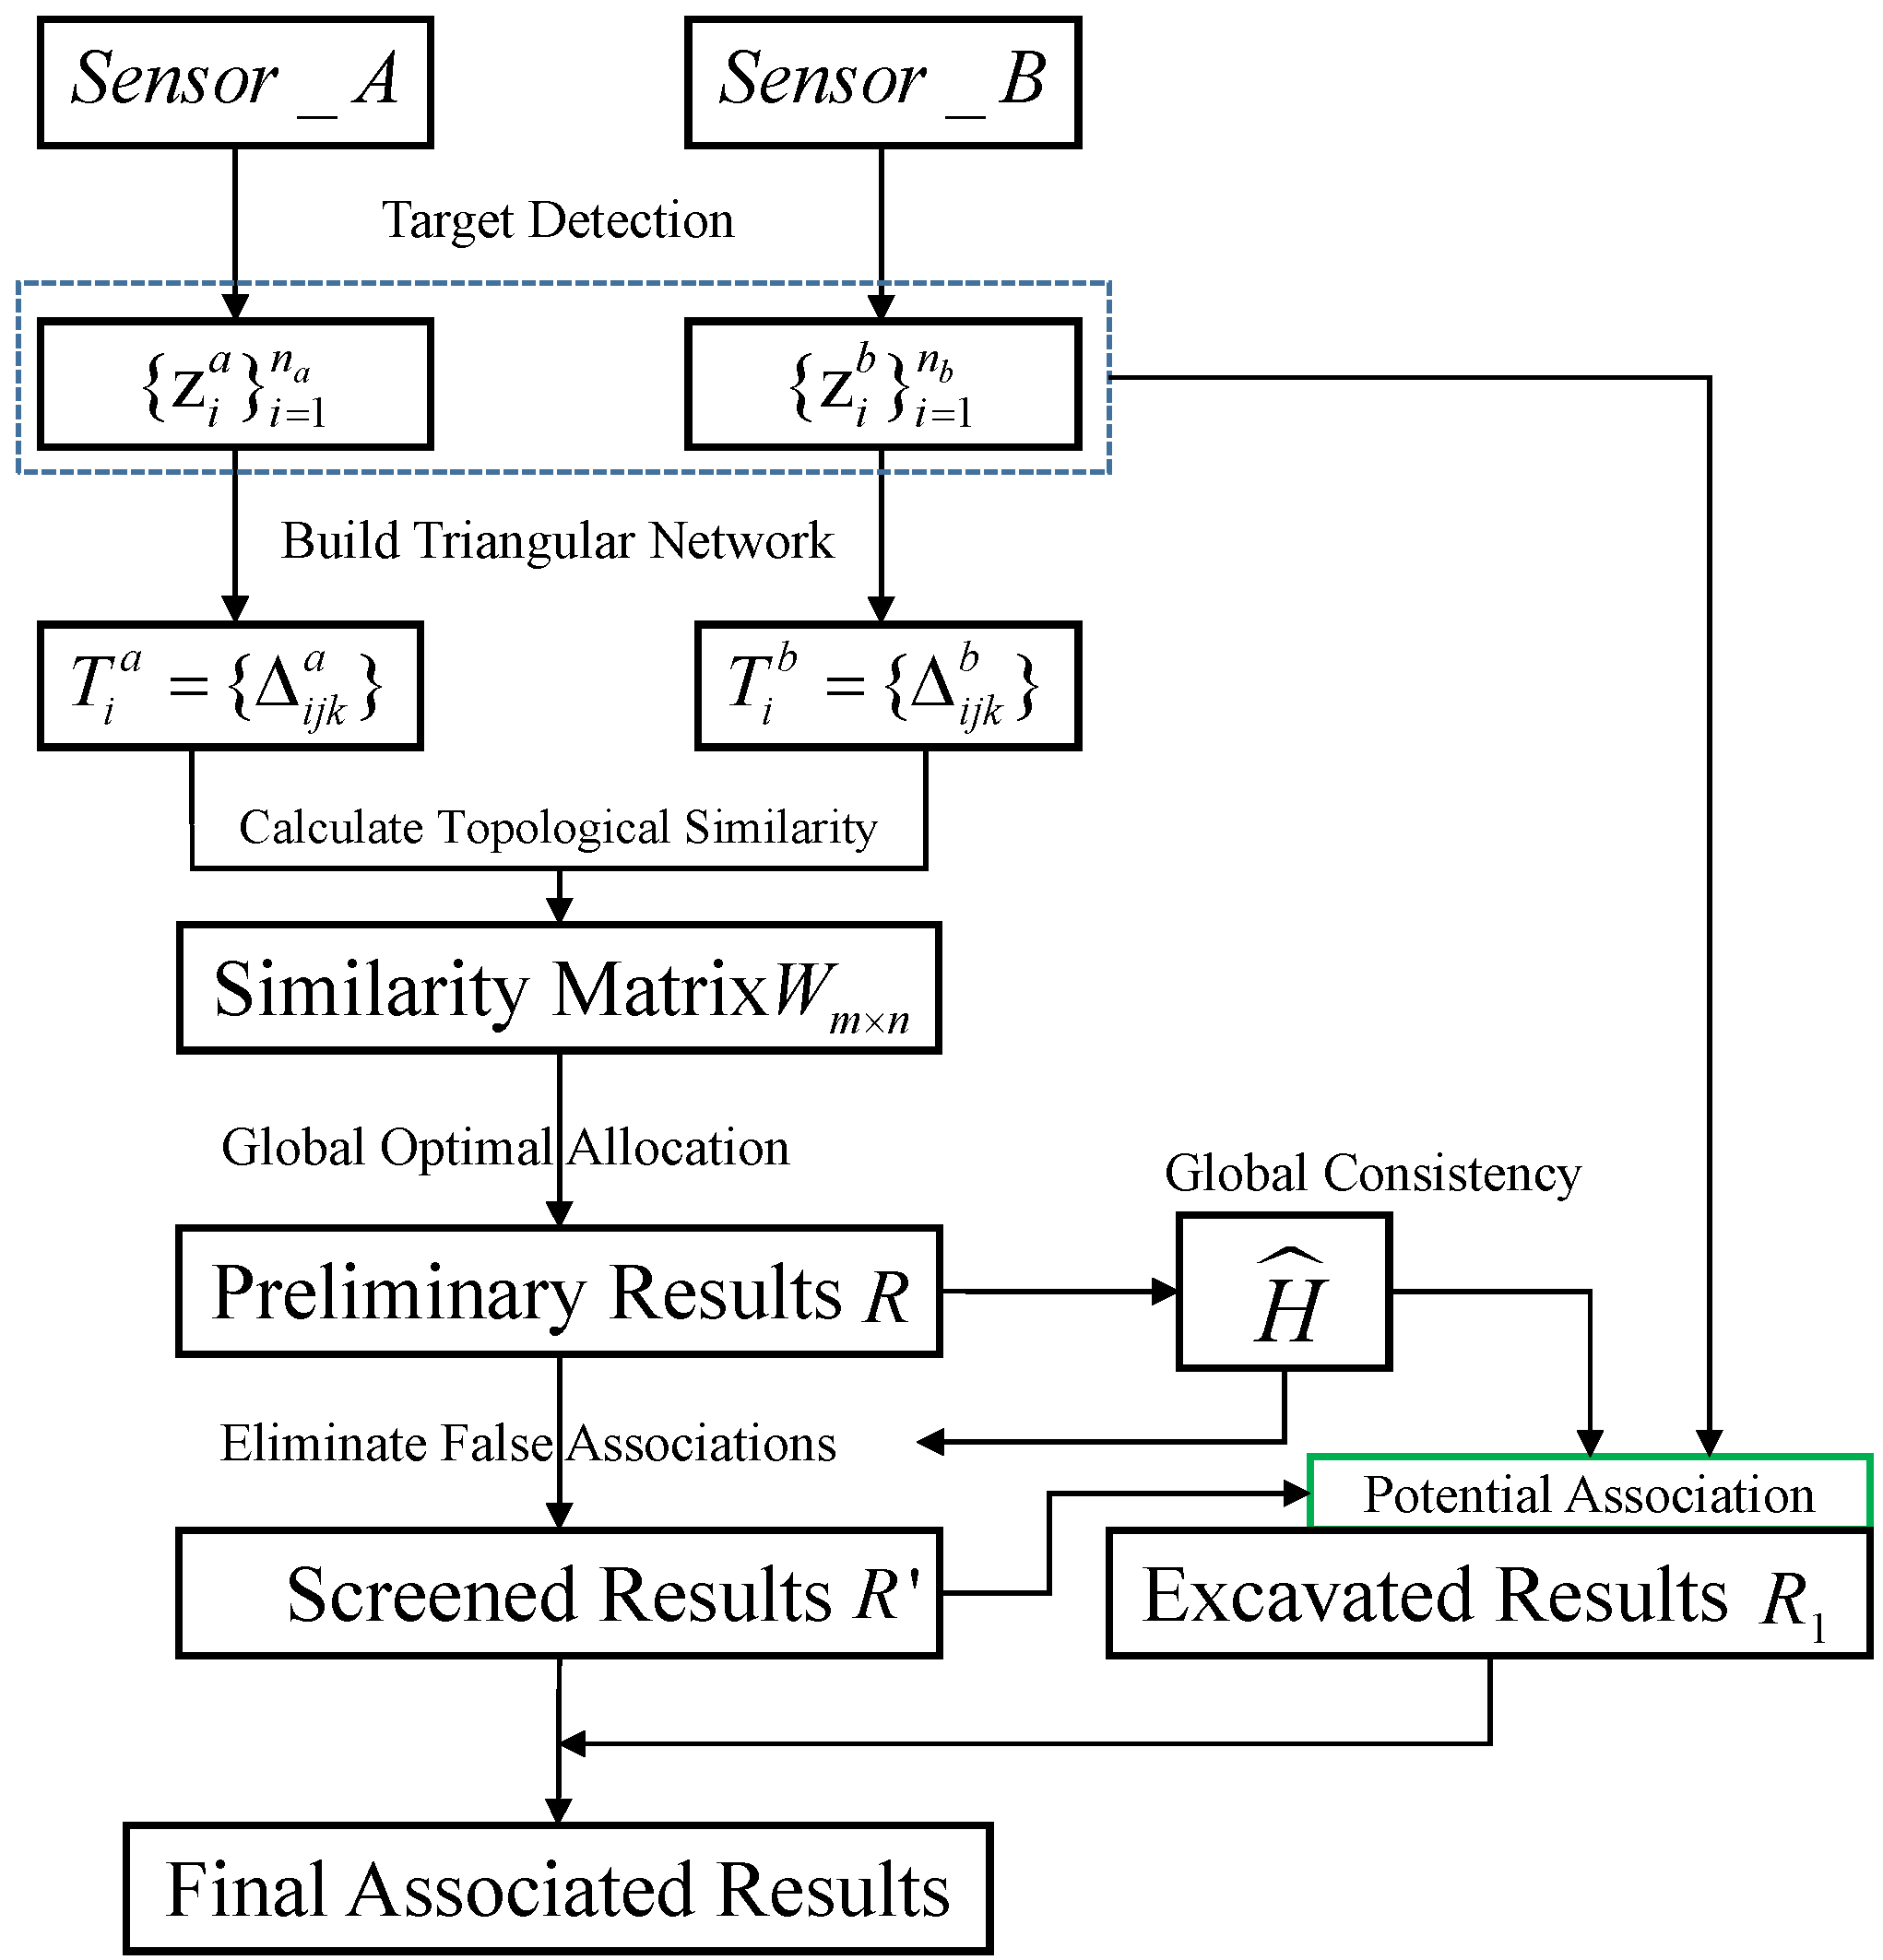
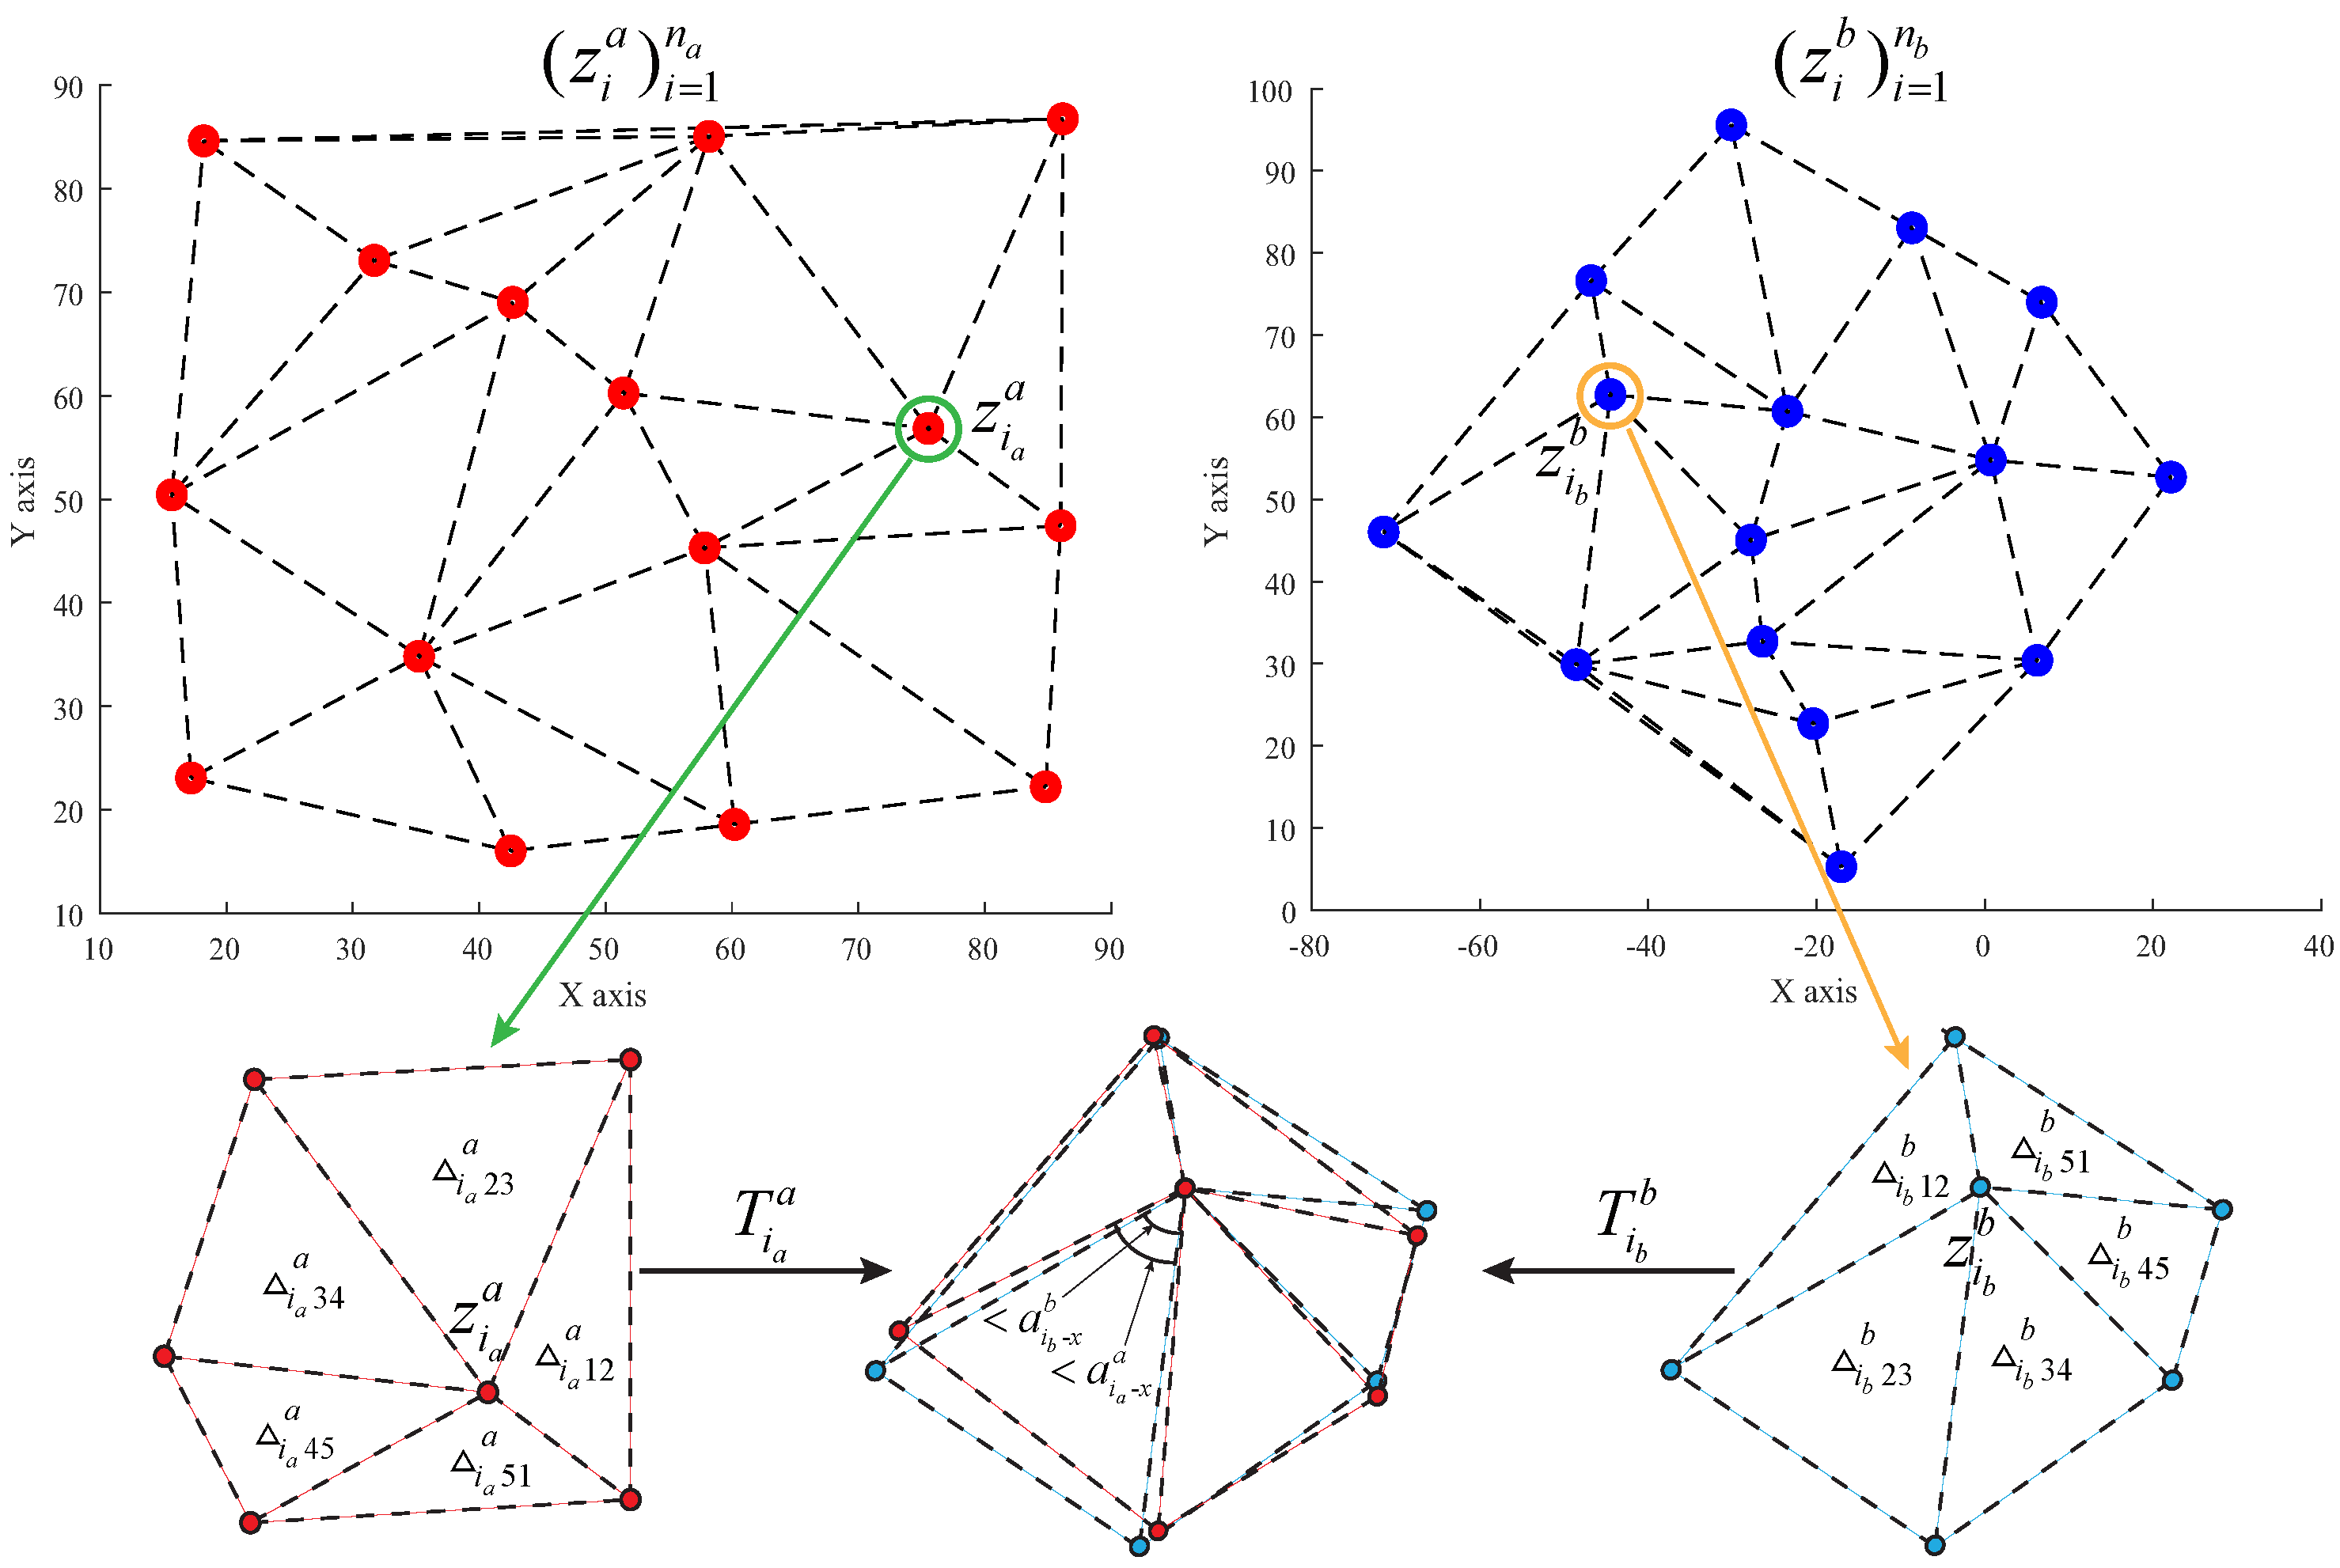
3.1. Constructing Triangular Topological Sequences
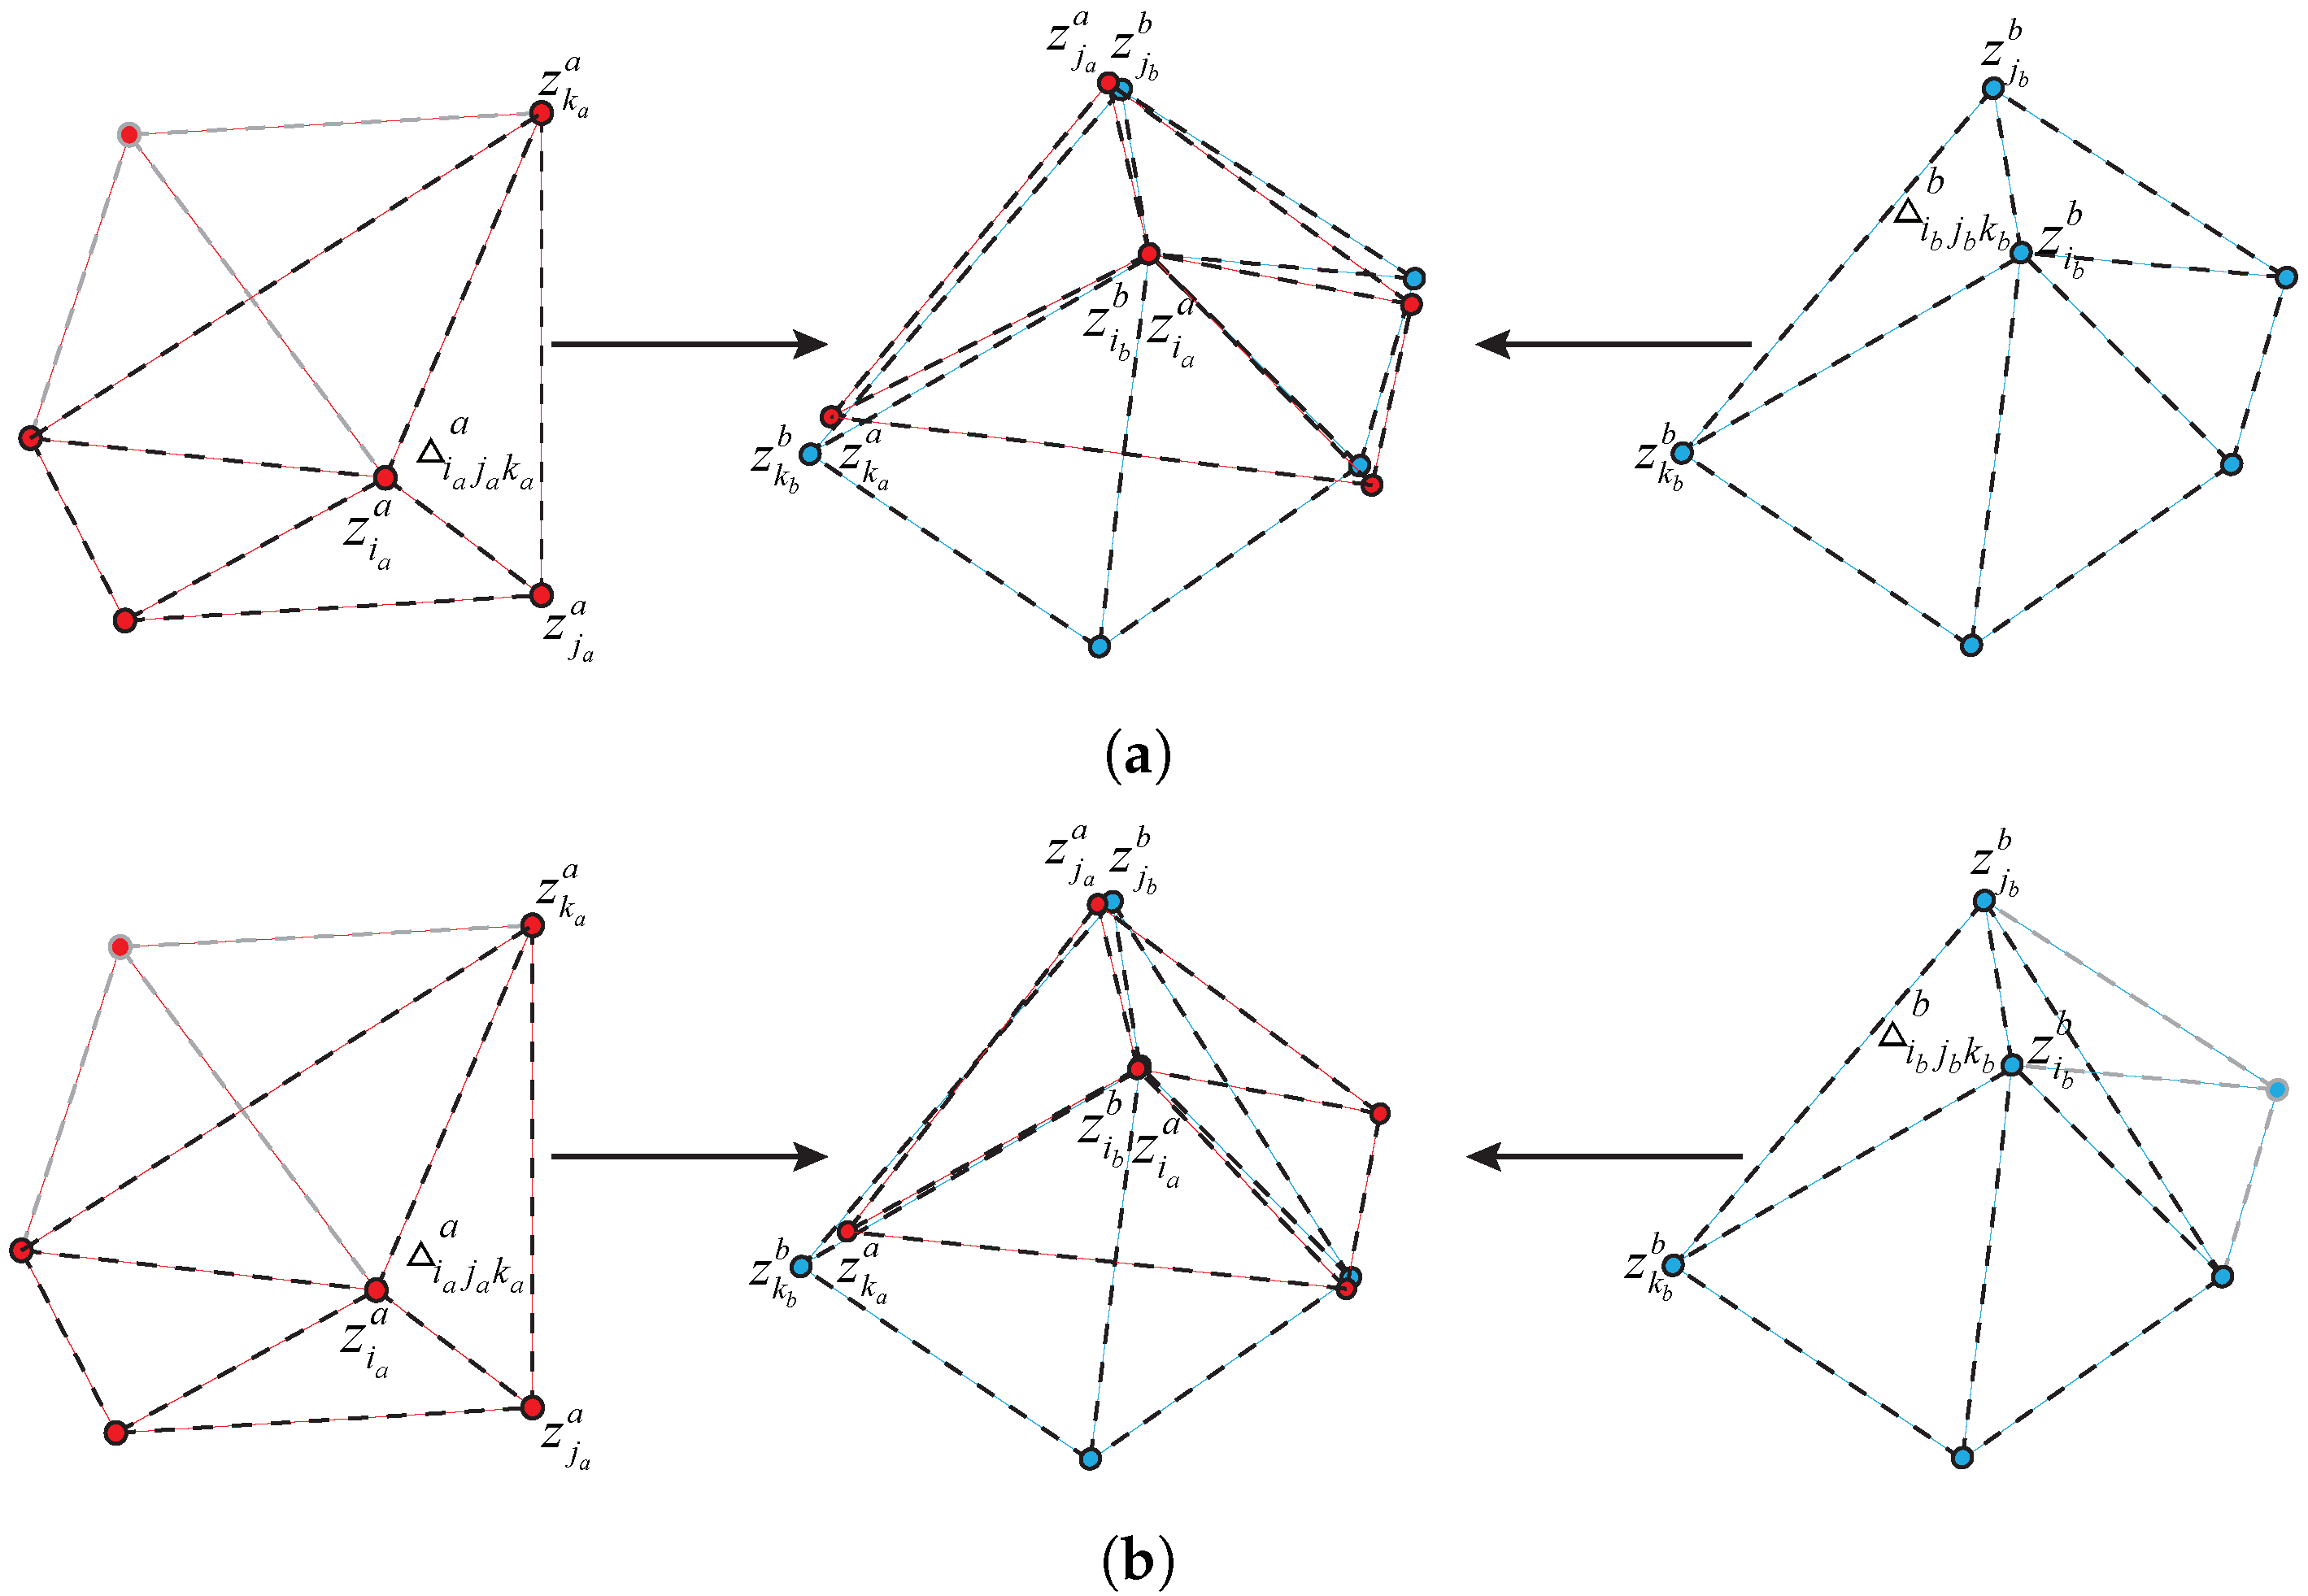
3.2. Calculate the Similarity of the Triangular Topological Sequence
3.3. Two-Step Global Constraint-Based Association Algorithm
4. Results
4.1. Testing on the Proposed Algorithm
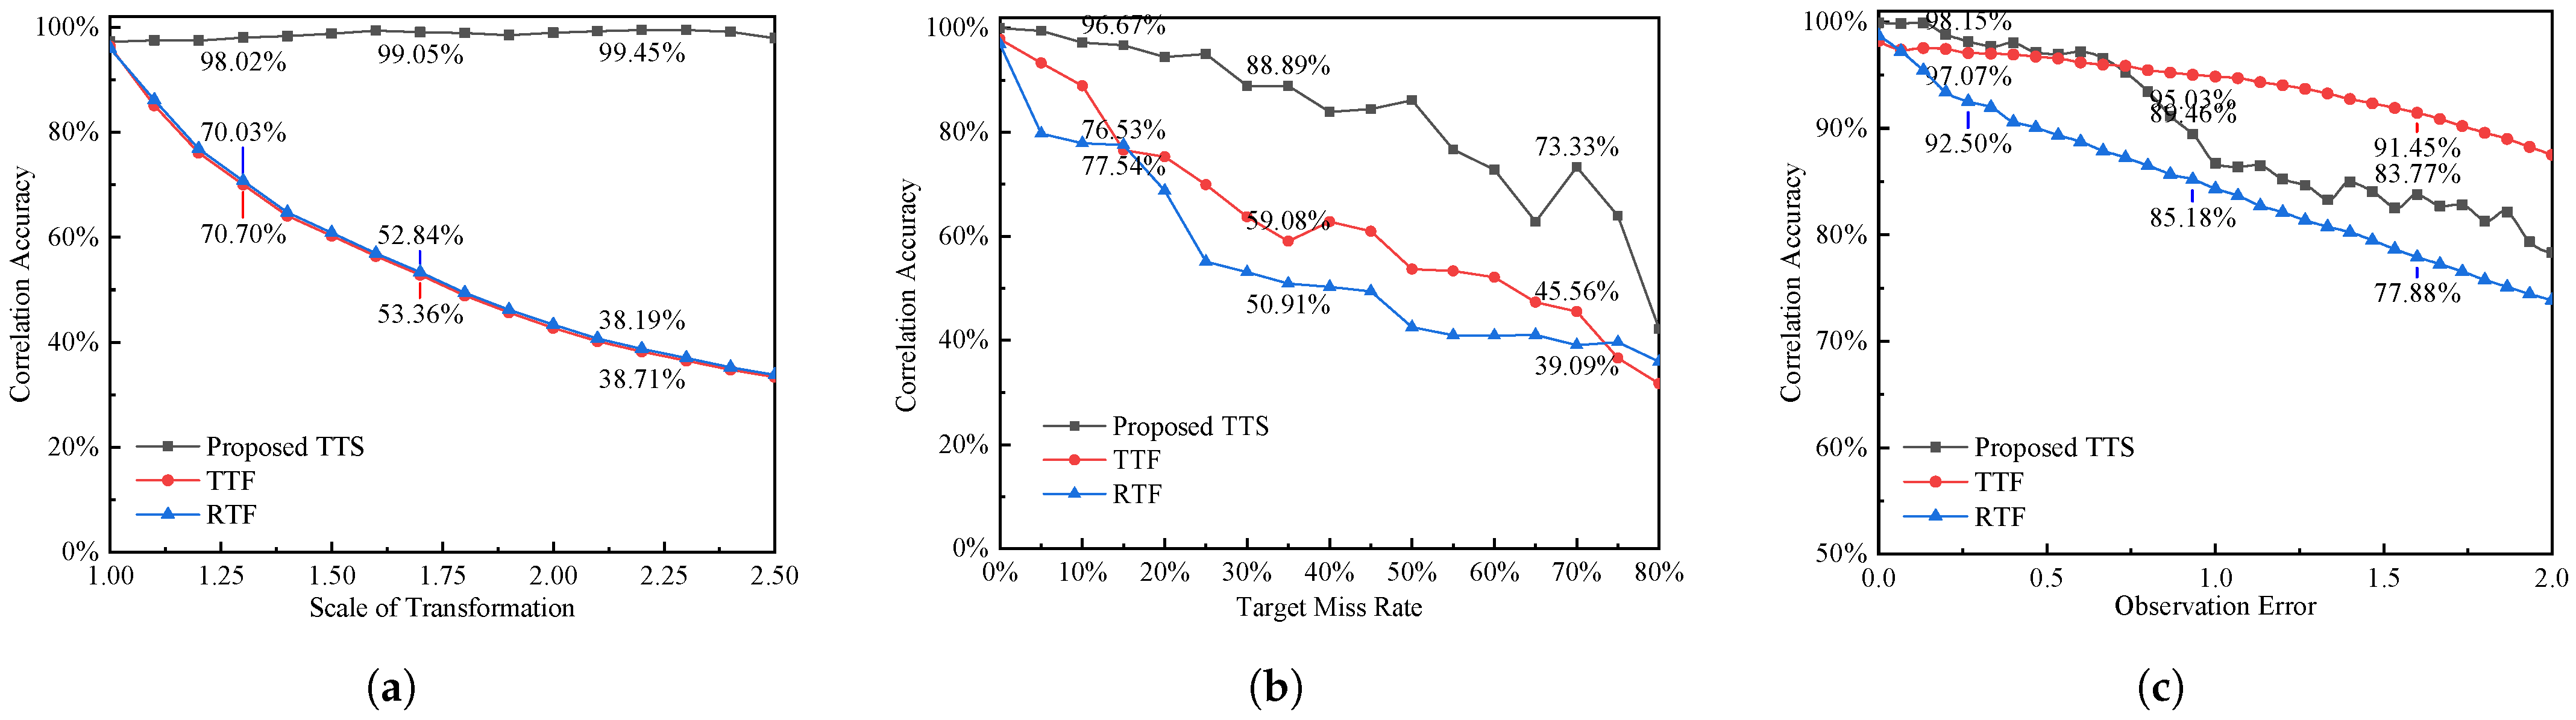
4.2. Simulation Comparison Experiments
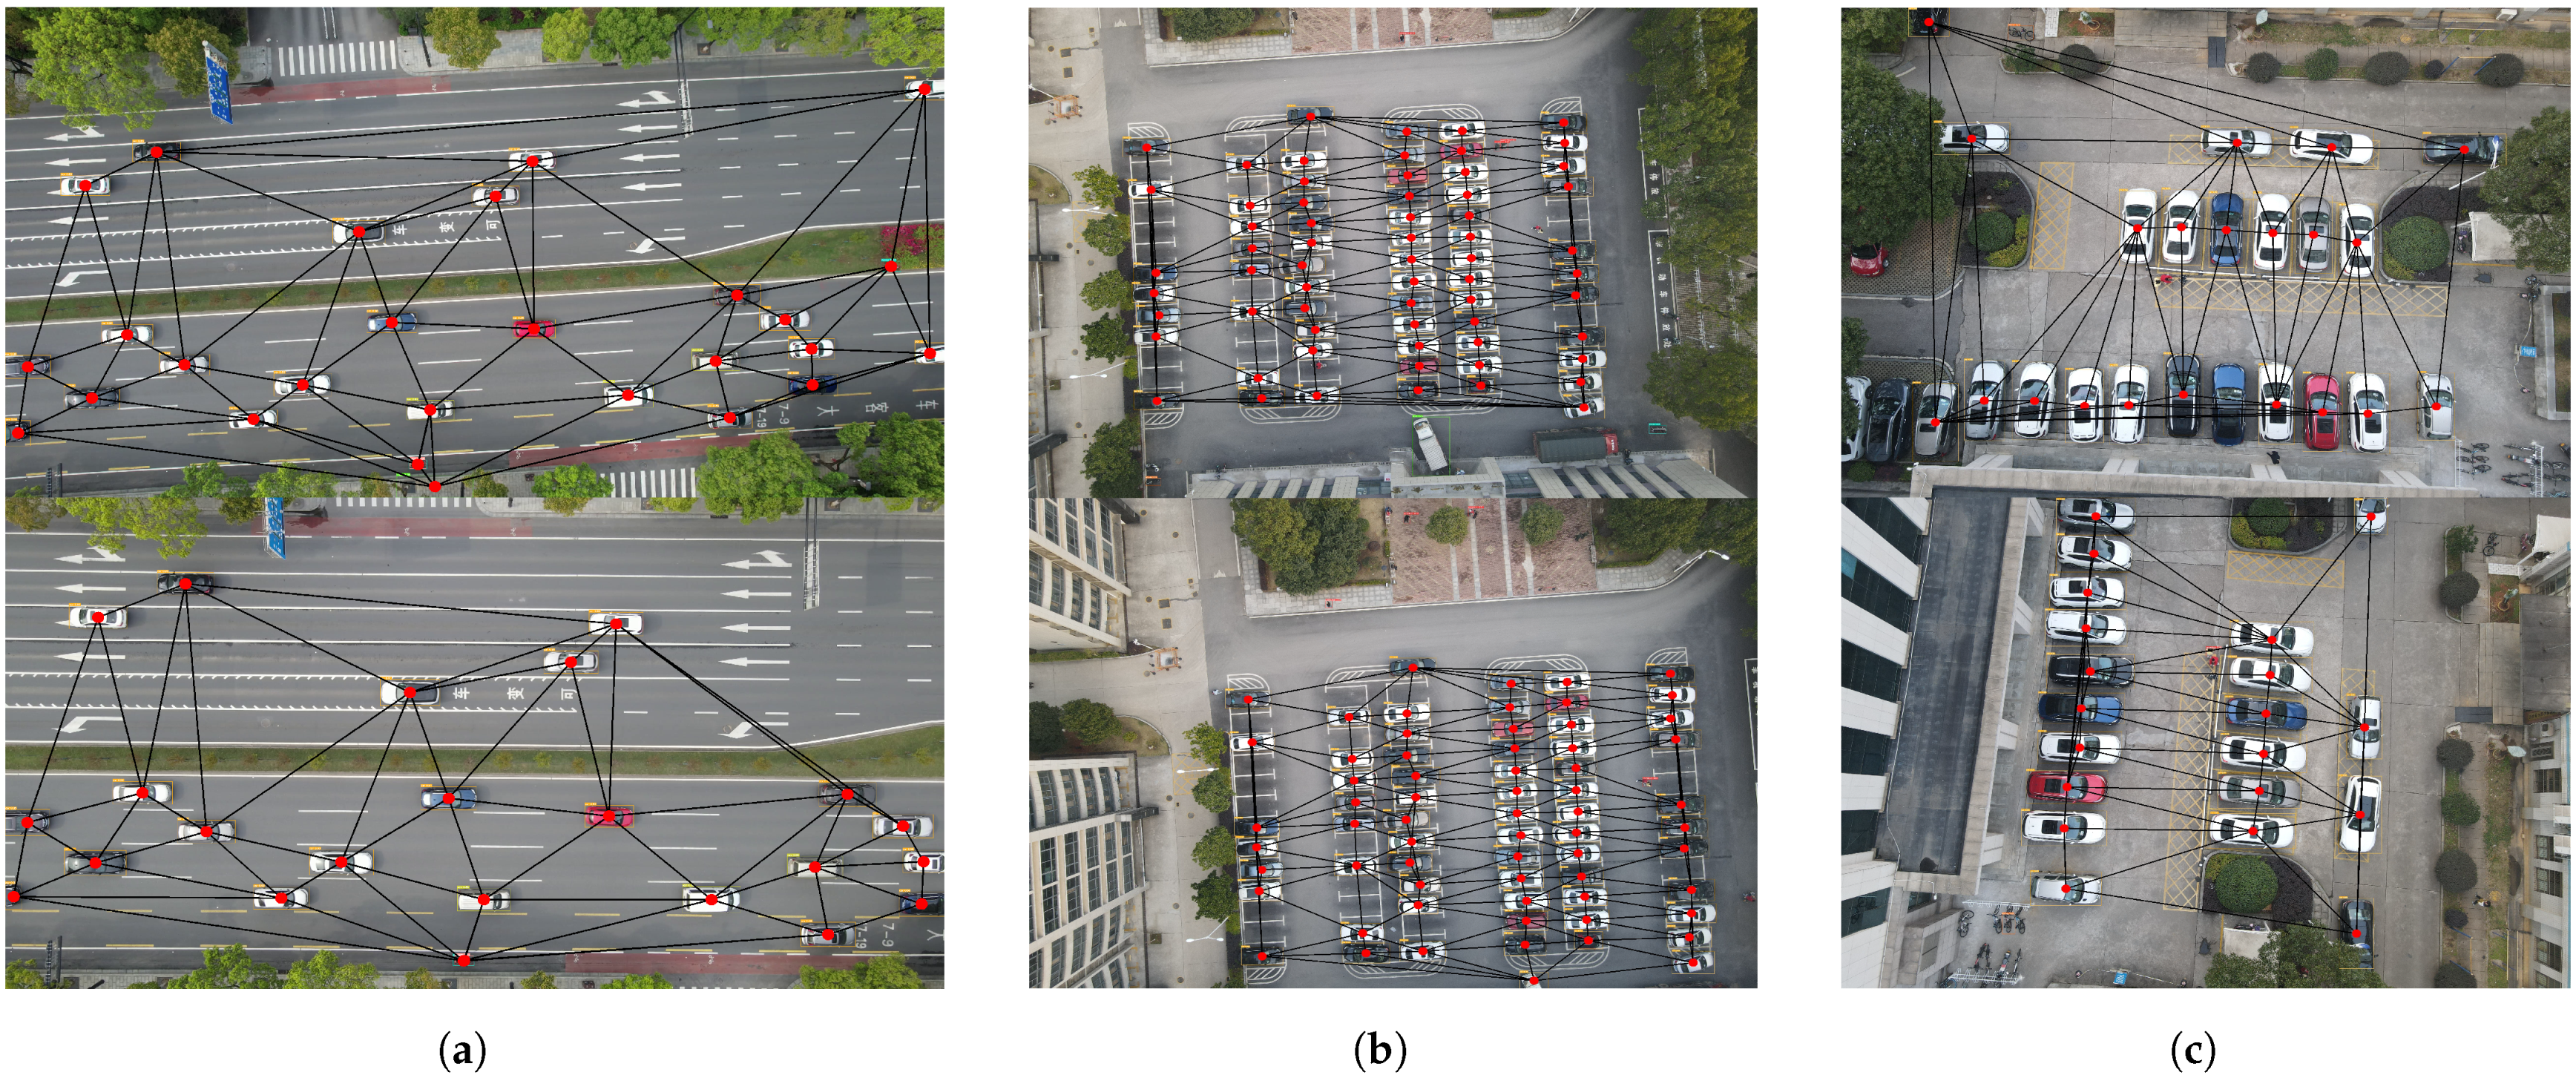
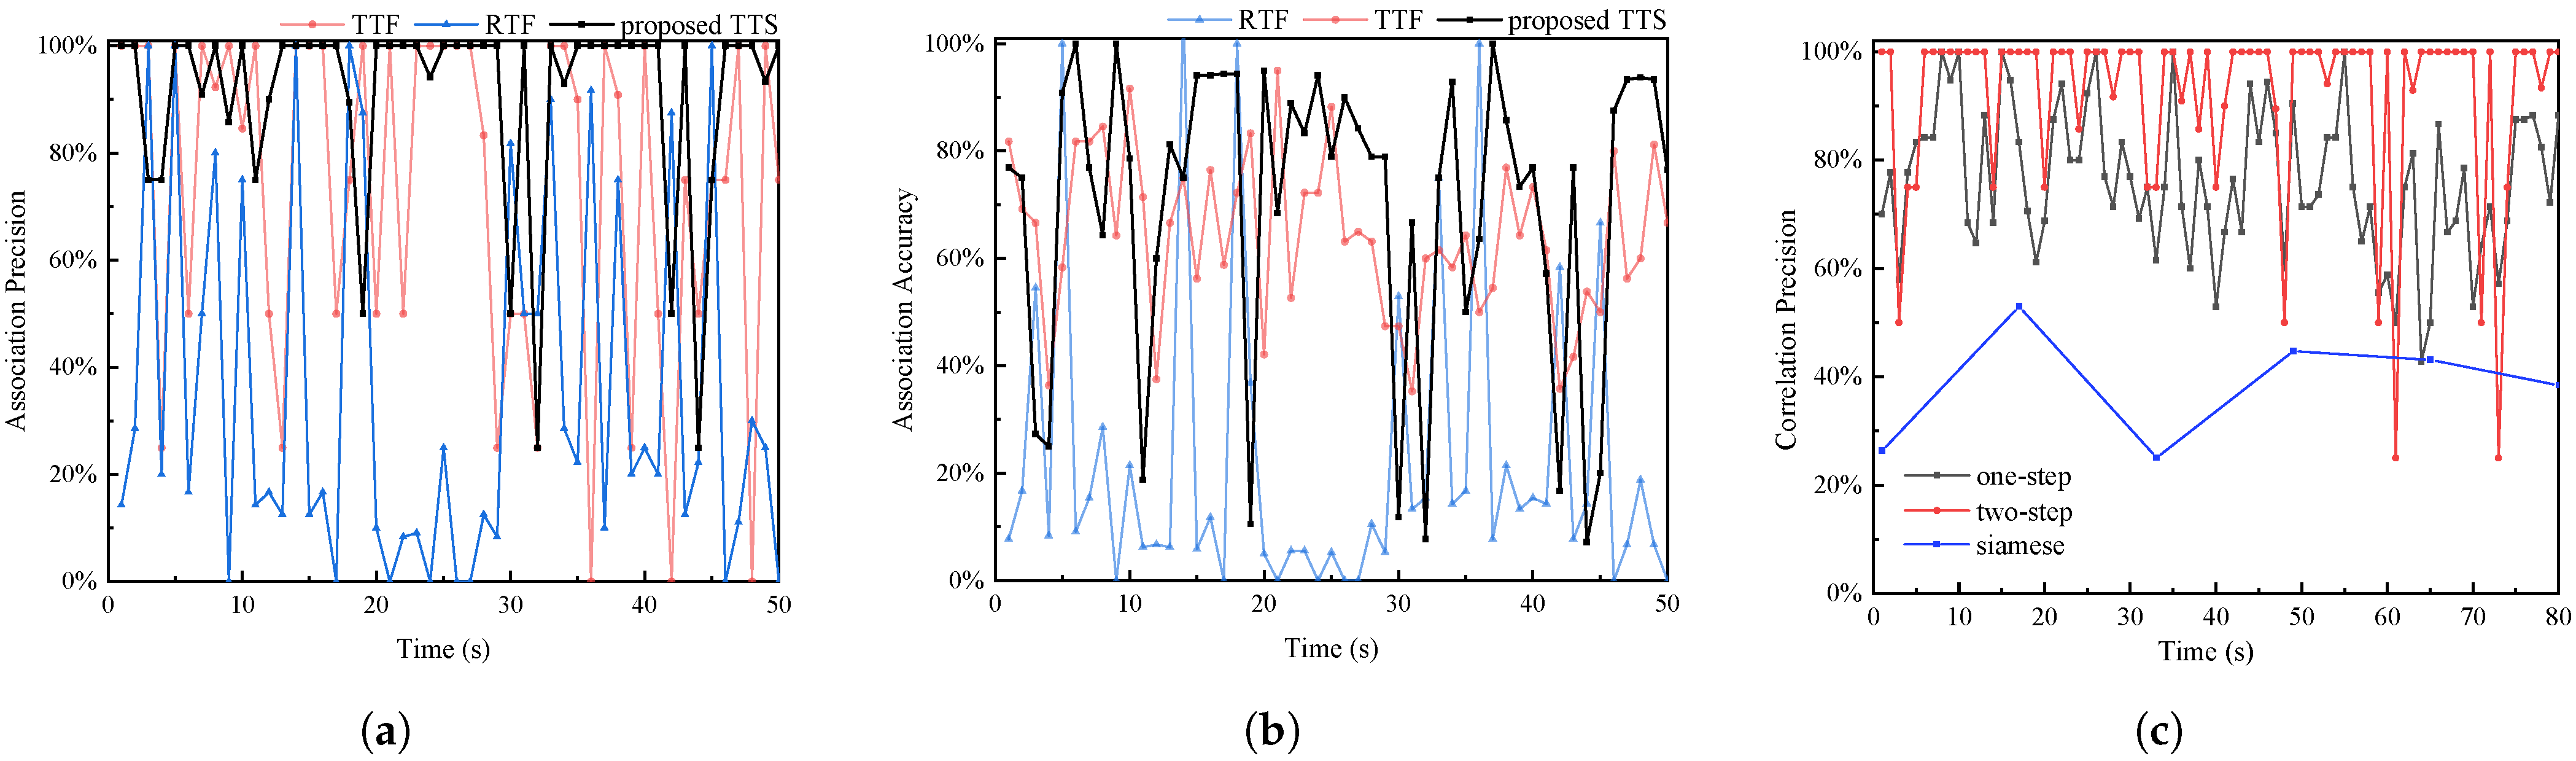
4.3. Physical Comparison Experiments
5. Conclusions
Author Contributions
Funding
Acknowledgments
Conflicts of Interest
References
- Yeom, S.; Nam, D.H. Moving Vehicle Tracking with a Moving Drone Based on Track Association. Appl. Sci. 2021, 11, 4046. [Google Scholar] [CrossRef]
- Zheng, Y.J.; Du, Y.C.; Ling, H.F.; Sheng, W.G.; Chen, S.Y. Evolutionary Collaborative Human-UAV Search for Escaped Criminals. IEEE Trans. Evol. Comput. 2019, 24, 217–231. [Google Scholar] [CrossRef]
- Wang, J.; Han, L.; Dong, X. Distributed sliding mode control for time-varying formation tracking of multi-UAV system with a dynamic leader. Aerosp. Sci. Technol. 2021, 111, 106549. [Google Scholar] [CrossRef]
- Bayerlein, H.; Theile, M.; Caccamo, M. Multi-UAV path planning for wireless data harvesting with deep reinforcement learning. IEEE Open J. Commun. Soc. 2021, 2, 1171–1187. [Google Scholar] [CrossRef]
- Ali, Z.A.; Zhangang, H. Multi-unmanned aerial vehicle swarm formation control using hybrid strategy. Trans. Inst. Meas. Control 2021, 43, 2689–2701. [Google Scholar] [CrossRef]
- Zhang, Z.; Xu, X.; Cui, J.; Meng, W. Multi-UAV Area Coverage Based on Relative Localization: Algorithms and Optimal UAV Placement. Sensors 2021, 21, 2400. [Google Scholar] [CrossRef]
- Wang, X.; Yang, L.T.; Meng, D.; Dong, M.; Ota, K.; Wang, H. Multi-UAV Cooperative Localization for Marine Targets Based on Weighted Subspace Fitting in SAGIN Environment. IEEE Internet Things J. 2021, 9, 5708–5718. [Google Scholar] [CrossRef]
- Bai, G.B.; Liu, J.H.; Song, Y.M.; Zuo, Y.J. Two-UAV intersection localization system based on the airborne optoelectronic platform. Sensors 2017, 17, 98. [Google Scholar] [CrossRef] [Green Version]
- Hinas, A.; Roberts, J.M.; Gonzalez, F. Vision-Based Target Finding and Inspection of a Ground Target Using a Multirotor UAV System. Sensors 2017, 17, 2929. [Google Scholar] [CrossRef] [PubMed] [Green Version]
- Lin, B.; Wu, L.; Niu, Y. End-to-end vision-based cooperative target geo-localization for multiple micro UAVs. J. Intell. Robot. Syst. 2022. accepted. [Google Scholar]
- Sheng, H.; Zhang, Y.; Chen, J.; Xiong, Z.; Zhang, J. Heterogeneous Association Graph Fusion for Target Association in Multiple Object Tracking. IEEE Trans. Circuits Syst. Video Technol. 2018, 29, 3269–3280. [Google Scholar] [CrossRef]
- Lee, M.H.; Yeom, S. Multiple target detection and tracking on urban roads with a drone. J. Intell. Fuzzy Syst. 2018, 35, 6071–6078. [Google Scholar] [CrossRef]
- Shekh, S.; Auton, J.C.; Wiggins, M.W. The Effects of Cue Utilization and Target-Related Information on Target Detection during a Simulated Drone Search and Rescue Task. Proc. Hum. Factors Ergon. Soc. Annu. Meet. 2018, 62, 227–231. [Google Scholar] [CrossRef]
- Rakai, L.; Song, H.; Sun, S.; Zhang, W.; Yang, Y. Data association in multiple object tracking: A survey of recent techniques. Expert Syst. Appl. 2022, 192, 116300. [Google Scholar] [CrossRef]
- Chung, D.; Tahboub, K.; Delp, E.J. A Two Stream Siamese Convolutional Neural Network for Person Re-identification. In Proceedings of the IEEE International Conference on Computer Vision (ICCV), Venice, Italy, 22–29 October 2017; pp. 1992–2000. [Google Scholar]
- Angle, R.B.; Streit, R.L.; Efe, M. Multiple Target Tracking With Unresolved Measurements. IEEE Signal Process. Lett. 2021, 28, 319–323. [Google Scholar] [CrossRef]
- Zhang, Y.; Liu, M.; Liu, X.; Wu, T. A group target tracking algorithm based on topology. J. Phys. Conf. Ser. 2020, 1544, 012025. [Google Scholar] [CrossRef]
- Tian, W.; Wang, Y.; Shan, X.; Yang, J. Track-to-Track Association for Biased Data Based on the Reference Topology Feature. IEEE Signal Process. Lett. 2014, 21, 449–453. [Google Scholar] [CrossRef]
- Tokta, A.; Hocaoglu, A.K. Sensor Bias Estimation for Track-to-Track Association. IEEE Signal Process. Lett. 2019, 26, 1426–1430. [Google Scholar] [CrossRef]
- An, N.; Qi Yan, W. Multitarget Tracking Using Siamese Neural Networks. ACM Trans. Multimid. Comput. Commun. Appl. 2021, 17, 75. [Google Scholar] [CrossRef]
- Valmadre, J.; Bertinetto, L.; Henriques, J. End-to-end representation learning for correlation filter based tracking. In Proceedings of the IEEE Conference on Computer Vision and Pattern Recognition, Honolulu, HI, USA, 21–26 July 2017; pp. 2805–2813. [Google Scholar]
- Yoon, K.; Kim, D.; Yoon, Y.C. Data Association for Multi-Object Tracking via Deep Neural Networks. Sensors 2019, 19, 559. [Google Scholar] [CrossRef] [Green Version]
- Kanyuck, A.J.; Singer, R.A. Correlation of Multiple-Site Track Data. IEEE Trans. Aerosp. Electron. Syst. 1970, 180–187. [Google Scholar] [CrossRef]
- Singer, R.A.; Kanyuck, A.J. Computer control of multiple site track correlation. Automatica 1971, 7, 455–463. [Google Scholar] [CrossRef]
- Bar-Shalom, Y. On the track-to-track correlation problem. IEEE Trans. Autom. Control 1981, 26, 571–572. [Google Scholar] [CrossRef]
- Chang, C.; Youens, L. Measurement correlation for multiple sensor tracking in a dense target environment. IEEE Trans. Autom. Control 1982, 27, 1250–1252. [Google Scholar] [CrossRef]
- Zagoruyko, S.; Komodakis, N. Learning to compare image patches via convolutional neural networks. In Proceedings of the IEEE Conference on Computer Vision and Pattern Recognition (CVPR), Boston, MA, USA, 7–12 June 2015; pp. 4353–4361. [Google Scholar]
- de Oliveira, I.O.; Fonseca, K.V.O.; Minetto, R.A. A Two-Stream Siamese Neural Network for Vehicle Re-Identification by Using Non-Overlapping Cameras. In Proceedings of the IEEE International Conference on Image Processing (ICIP), Taipei, Taiwan, 22–25 September 2019; pp. 669–673. [Google Scholar]
- Li, Q.; Zhu, J.; Cao, R. Relative geometry-aware Siamese neural network for 6DOF camera relocalization. Neurocomputing 2021, 426, 134–146. [Google Scholar] [CrossRef]
- Pang, H.; Xuan, Q.; Xie, M.; Liu, C.; Li, Z. Research on Target Tracking Algorithm Based on Siamese Neural Network. Mob. Inf. Syst. 2021, 2021, 6645629. [Google Scholar] [CrossRef]
- Qi, L.; He, Y.; Dong, K.; Liu, J. Multi-radar anti-bias track association based on the reference topology feature. Iet Radar Sonar Navig. 2018, 12, 366–372. [Google Scholar] [CrossRef]
- Yue, S.; Yue, W.; Shu, W.; Xiu, S. Fuzzy Data Association based on Target Topology of Reference. J. Natl. Univ. Def. Technol. 2006, 28, 105–109. [Google Scholar]
- Ze, W.; Shu, R.; Xi, L. Topology Sequence Based Track Correlation Algorithm. Acta Aeronaut. Astronaut. Sin. 2009, 30, 1937–1942. [Google Scholar]
- Yu, Z.; Guo, W.; Cheng, G.; Lei, C. Gray Track Correlation Algorithm Based on Topology Sequence Method. Electron. Opt. Control 2013, 20, 1–5. [Google Scholar]
- Wu, H.; Li, L.; Zhang, K. Track Association Method Based on Target Mutual-Support of Topology. In Proceedings of the 2020 IEEE 9th Joint International Information Technology and Artificial Intelligence Conference (ITAIC), Chongqing, China, 11–13 December 2020; Volume 9, pp. 2078–2082. [Google Scholar]
- Hao, Z.; Chula, S. Algorithm of Multi-feature Track Association Based on Topology. Command. Inf. Syst. Technol. 2020, 11, 83–88. [Google Scholar]
- Sönmez, H.H.; Hocaoğlu, A.K. Asynchronous track-to-track association algorithm based on reference topology feature. Signal Image Video Process. 2021, 16, 789–796. [Google Scholar] [CrossRef]
- Li, X.; Wu, L.; Niu, Y.; Jia, S.; Lin, B. Topological Similarity-Based Multi-Target Correlation Localization for Aerial-Ground Systems. Guid. Navig. Control 2021, 1, 2150016. [Google Scholar] [CrossRef]
- You, S.; Yao, H.; Xu, C. Multi-Object Tracking with Spatial-Temporal Topology-based Detector. IEEE Trans. Circuits Syst. Video Technol. 2015, 14, 12. [Google Scholar] [CrossRef]
- Oliveira, B.D.A.; Pereira, L.G.R.; Bresolin, T. A review of deep learning algorithms for computer vision systems in livestock. Livest. Sci. 2021, 253, 104700. [Google Scholar] [CrossRef]
- Jiang, P.; Ergu, D.; Liu, F.; Cai, Y.; Ma, B. A Review of Yolo Algorithm Developments. Procedia Comput. Sci. 2022, 199, 1066–1073. [Google Scholar] [CrossRef]
- Liu, L.; Ouyang, W.; Wang, X.; Fieguth, P.; Chen, J.; Liu, X.; Pietikäinen, M. Deep Learning for Generic Object Detection: A Survey. Int. J. Comput. Vis. 2020, 128, 261–318. [Google Scholar] [CrossRef] [Green Version]
- Zou, Z.; Shi, Z.; Guo, Y.; Ye, J. Object Detection in 20 Years: A Survey. arXiv 2019, arXiv:1905.05055. [Google Scholar]
- Ultralytics/yolov5. Available online: https://github.com/ultralytics/yolov5 (accessed on 31 March 2022).
- Hartley, R.; Zisserman, R. 2D Projective Geometry and Transformations. In Multi View Geometry in Computer Vision; Machinery Industry Press: Beijing, China, 2020; pp. 28–33. [Google Scholar]
- De Berg, M.T.; Van Kreveld, M.; Overmars, M.; Schwarzkopf, O. Delaunay Triangulation: Height Interpolation. In Computational Geometry: Algorithms and Applications, 3rd ed.; Springer: Dordrecht, The Netherlands, 2008; pp. 241–264. [Google Scholar]
- Zhe, Y.; Chong, H.; Chen, L.; Min, C. Data Association Based on Target Topology. J. Syst. Simul. 2008, 20, 2357–2360. [Google Scholar]
- Chopra, S.; Hadsell, R.; LeCun, Y. Learning a Similarity Metric Discriminatively, with Application to Face Verification. In Proceedings of the IEEE Computer Society Conference on Computer Vision and Pattern Recognition(CVPR), San Diego, CA, USA, 20–25 June 2005; pp. 539–546. [Google Scholar]
- Bubbliiiing, Bubbliiiing/Siamese-Keras. Available online: https://github.com/bubbliiiing/Siamese-keras (accessed on 10 March 2022).

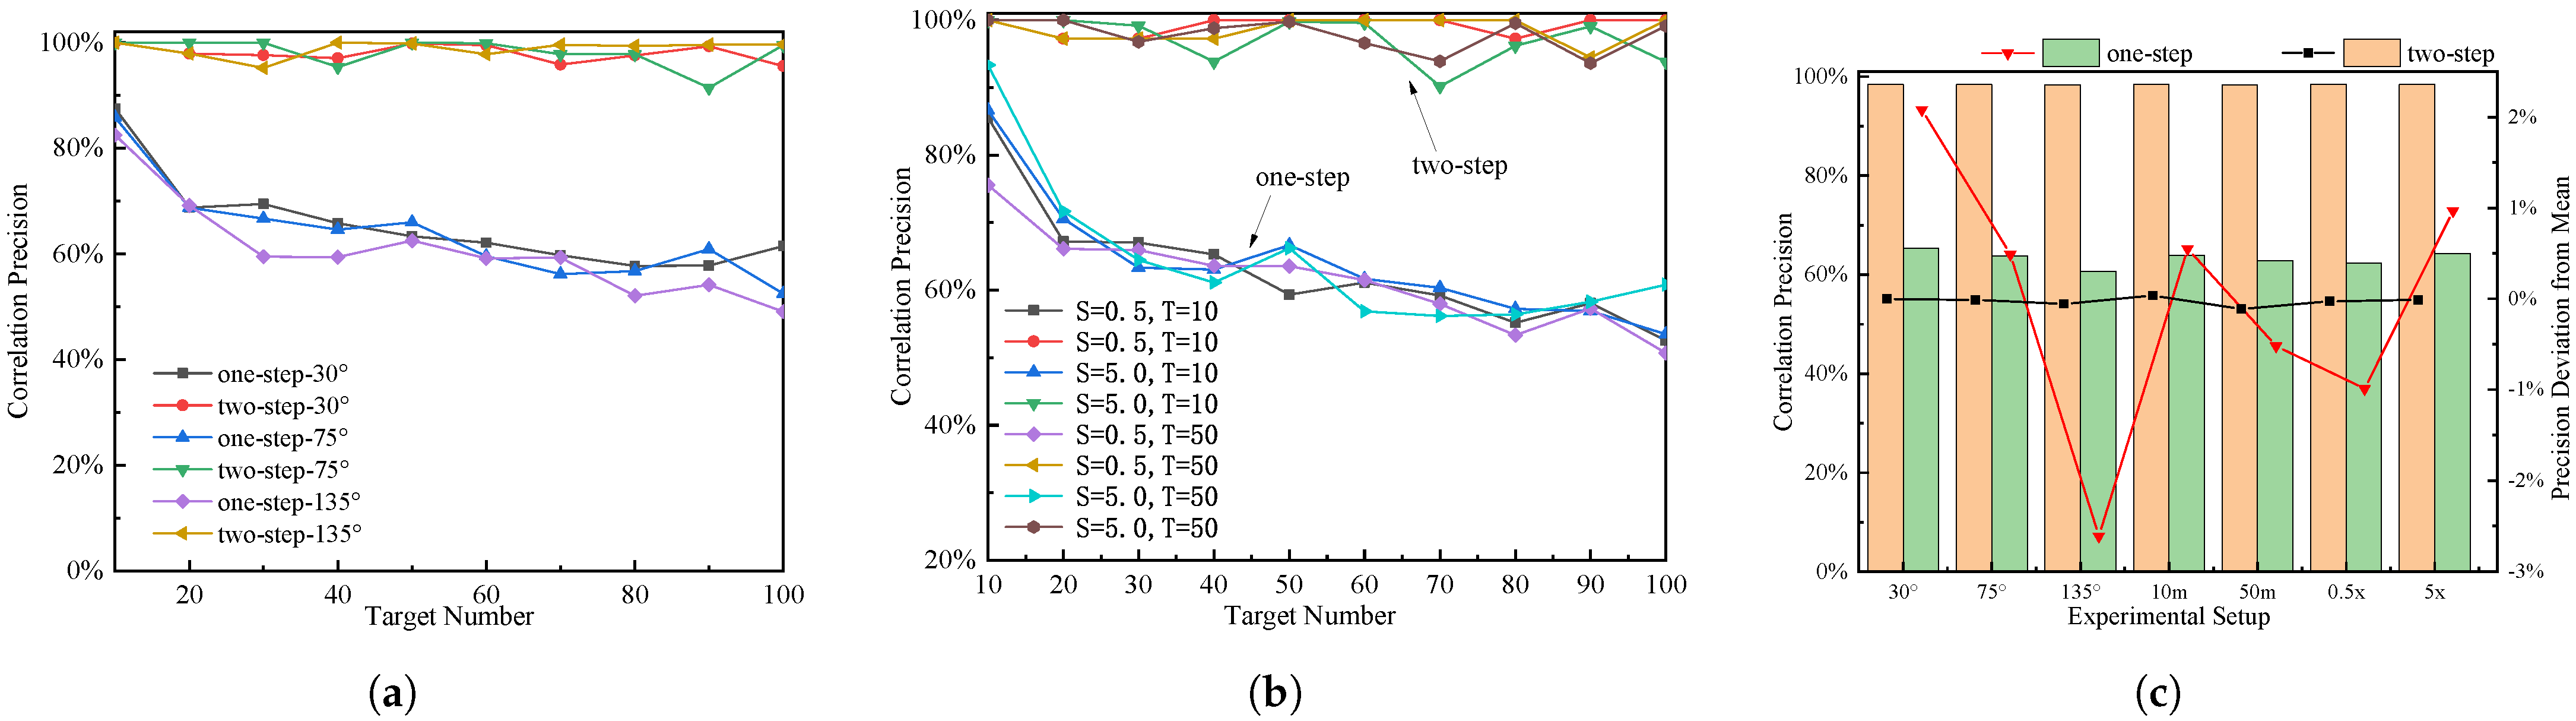
| Rotation | Translation | Scale | |||||
|---|---|---|---|---|---|---|---|
| Setup | 30° | 75° | 135° | 10 m | 50 m | 0.5× | 5× |
| Two-Step (%) | 98.40 | 98.39 | 98.34 | 98.44 | 98.28 | 98.37 | 98.39 |
| One-Step (%) | 65.37 | 63.78 | 60.68 | 63.84 | 62.77 | 62.30 | 64.26 |
| Algorithm | Proposed TTS | RTF | TTF | |
|---|---|---|---|---|
| Index | ||||
| Two-Step-Precision | 84.63% | 63.51% | 68.63% | |
| One-Step-Precision | 71.80% | 38.61% | 55.66% | |
| Two-Step-Accuracy | 67.87% | 20.31% | 61.81% | |
| One-Step-Accuracy | 79.99% | 41.45% | 42.87% | |
| Threshold | 150 | 250 | 300 | 400 | 500 | 700 | 800 | 1000 | |
|---|---|---|---|---|---|---|---|---|---|
| Index | |||||||||
| Precision | 0% | 36.98% | 42.74% | 41.47% | 53.27% | 61.08% | 63.51% | 43.72% | |
| Accuracy | 0% | 15.53% | 24.08% | 22.33% | 21.69% | 19.76% | 20.31% | 12.50% | |
| Index | One-Step-Pre | Two-Step-Pre | Two-Step-Acc | Siamese-Acc | |
|---|---|---|---|---|---|
| Scenes | |||||
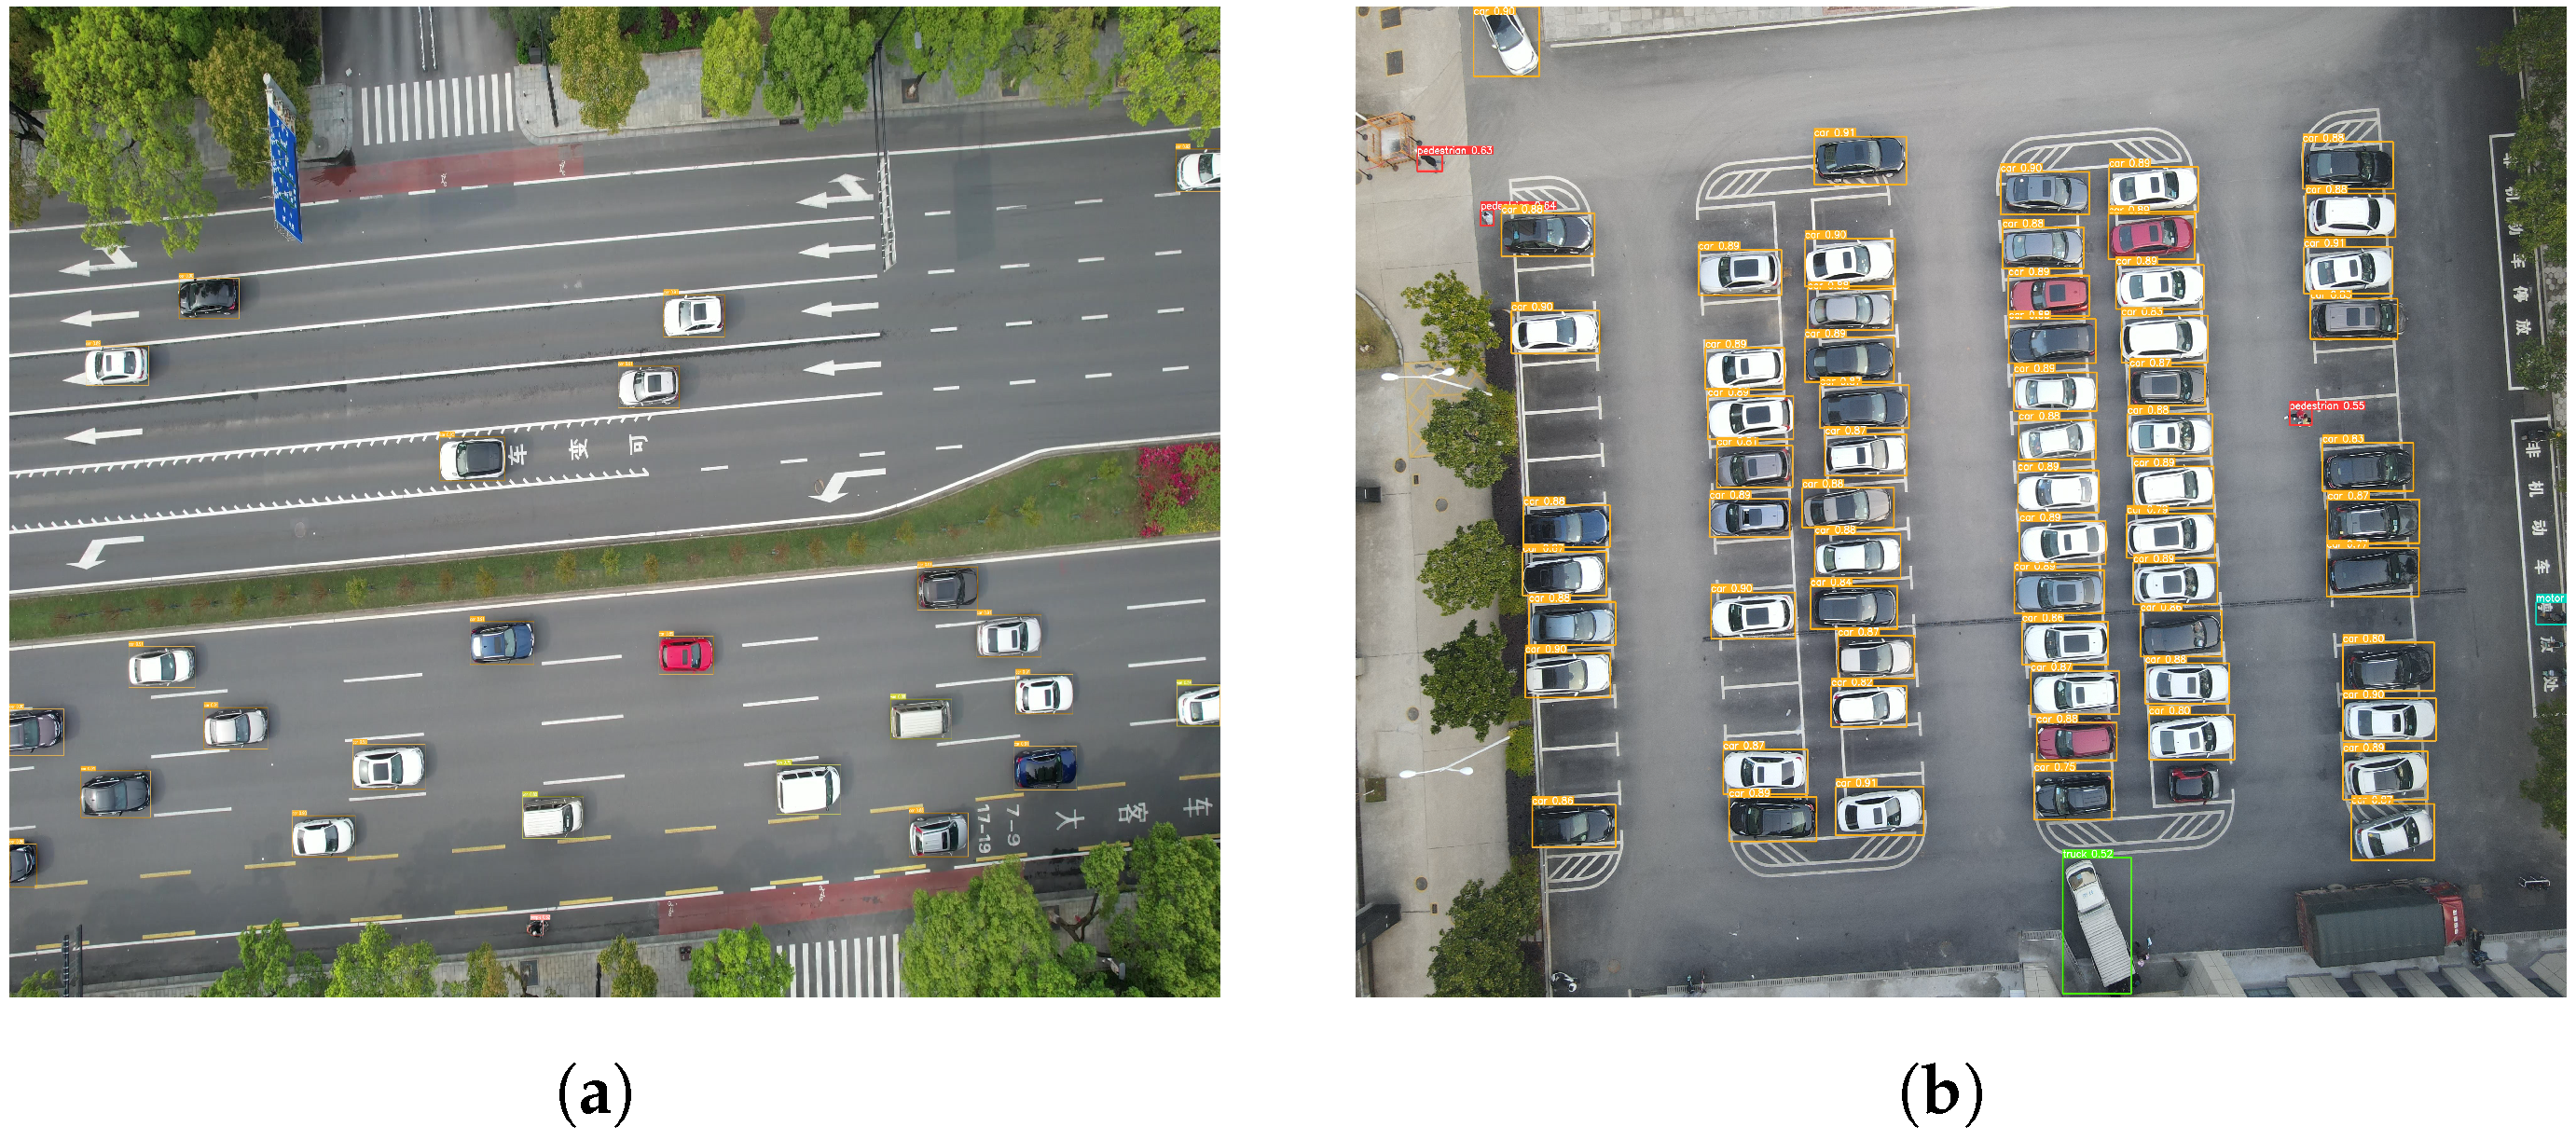
| Fast Moving (Figure 10a) | 71.80% | 84.63% | 67.87% | 38.25% | |
| Dense Stationary (Figure 10b) | 67.19% | 100.00% | 93.75% | 5.08% | |
| Algorithm | Proposed TTS | RTF | TTF | Siamese | |
|---|---|---|---|---|---|
| Characteristic | |||||
| Similarity Transformation Invariance | ✓ | X | X | ✓ | |
| Non-empirical | ✓ | X | ✓ | ✓ | |
| Global Consistency | ✓ | X | X | X | |
| Not Using Image Features | ✓ | ✓ | ✓ | X | |
Publisher’s Note: MDPI stays neutral with regard to jurisdictional claims in published maps and institutional affiliations. |
© 2022 by the authors. Licensee MDPI, Basel, Switzerland. This article is an open access article distributed under the terms and conditions of the Creative Commons Attribution (CC BY) license (https://creativecommons.org/licenses/by/4.0/).
Share and Cite
Li, X.; Wu, L.; Niu, Y.; Ma, A. Multi-Target Association for UAVs Based on Triangular Topological Sequence. Drones 2022, 6, 119. https://doi.org/10.3390/drones6050119
Li X, Wu L, Niu Y, Ma A. Multi-Target Association for UAVs Based on Triangular Topological Sequence. Drones. 2022; 6(5):119. https://doi.org/10.3390/drones6050119
Chicago/Turabian StyleLi, Xudong, Lizhen Wu, Yifeng Niu, and Aitong Ma. 2022. "Multi-Target Association for UAVs Based on Triangular Topological Sequence" Drones 6, no. 5: 119. https://doi.org/10.3390/drones6050119
APA StyleLi, X., Wu, L., Niu, Y., & Ma, A. (2022). Multi-Target Association for UAVs Based on Triangular Topological Sequence. Drones, 6(5), 119. https://doi.org/10.3390/drones6050119