Article

Detection of Forest Tree Losses in Côte d’Ivoire Using Drone Aerial Images

by
Tiodionwa Abdoulaye Ouattara
1,2,*,
Valère-Carin Jofack Sokeng
1,3,
Irié Casimir Zo-Bi
4,
Koffi Fernand Kouamé
1,3,
Clovis Grinand
2 and
Romuald Vaudry
5
1
Centre Universitaire de Recherche et d’Application en Télédétection (CURAT), UFR des Sciences de la Terre et des Ressources Minières, Université Félix Houphouët Boigny, Abidjan 22 BP 801, Côte d’Ivoire
2
NITIDÆ, 29 rue Imbert-Colomés, 69001 Lyon, France
3
Unité de Recherche et d’Expertise Numérique (UREN), Université Virtuelle de Côte d’Ivoire, Abidjan 28 BP 536, Côte d’Ivoire
4
Département Eaux, Forêts et Environnement, Institut National Polytechnique Félix Houphouët Boigny, Yamoussoukro 00225, Côte d’Ivoire
5
European Forest Institute (EFI), 08025 Barcelona, Spain
*
Author to whom correspondence should be addressed.
Drones 2022, 6(4), 83; https://doi.org/10.3390/drones6040083
Submission received: 16 February 2022 / Revised: 17 March 2022 / Accepted: 21 March 2022 / Published: 25 March 2022
(This article belongs to the Special Issue Drones for Biodiversity Conservation)

Abstract

:
The fight against deforestation and forest degradation is now a major challenge for the preservation of global forest ecosystems. The remote sensing forest monitoring methods that are currently deployed are not always adapted to the Ivorian context because of the high cloud cover, diversity of shaded crops, and land clearing techniques. This study proposes a drone-based approach to assess intra-annual tree losses in the Bossématié classified forest. The method used is based on a detection analysis of tree losses in forest areas from a time series of aerial images acquired by drones from November 2018 to April 2019 on five sites in the studied forest. Based on photogrammetric models and photointerpretation, tree heights and tree crown sizes were estimated. Then, tree losses were detected based on the variation of tree heights during the study period. An analysis of the distribution of tree heights in Bossématié classified forest reveals that the maximum tree height was 65.06 m in November 2018 and 64.07 m in April 2019 with an average tree height of 34.29–37.00 m in November 2018 and 34.63–36.88 m in April 2019. The average tree crown area, meanwhile, was estimated to be 152 m². With an estimation accuracy of about 97%, these tree structural data indicate a minimum loss of 107 trees corresponding to a clearing area of 2 ha across all the surveyed sites from November 2018 to April 2019. This forest monitoring approach shows a considerable local loss of biodiversity and should be involved in the implementation of preservation, rehabilitation, and deployment strategies in an operational deforestation monitoring system in Côte d’Ivoire.

1. Introduction

Tropical forests are the focus of important global issues related to the preservation of biodiversity, climate change, and sustainable development [1]. In West Africa, the conversion of forest areas into farmland over the 2000–2010 period has been estimated at 19% by the Food and Agriculture Organization (FAO) and represents a loss of about 870,000 ha per year [2]. In Côte d’Ivoire, more than 40% of the forests disappeared within 25 years (between 1990 and 2015), with forest cover decreasing from 7.8 million ha in 1990 to 5.1 million ha in 2000 and then to 3.4 million ha in 2015, representing about 11% of the national territory [3]. To face this challenge, Côte d’Ivoire has been involved in the international mechanism for reducing emissions from deforestation and forest degradation, sustainable management of natural resources, enhancement of forest carbon stocks, and conservation of forests (REDD+) since June 2011. A new strategy for forest preservation, rehabilitation, and expansion was adopted at the beginning of 2019, a few months before the adoption of a new forestry policy in July of the same year [4]. Essentially focused on classified forests, this policy first aims to reduce deforestation in classified forests by upgrading the remaining well-preserved classified forests to protected area status. Second, it aims to “regularize” the situation of highly degraded classified forests by introducing a new status for classified agroforests [5], which is still being widely deliberated at the time of writing. This policy is to be based in particular on the deployment of an operational land and land clearing monitoring system. However, the monitoring methods are not adapted to the Ivorian context, which is marked by shaded cultivation, high cloud cover, and new clearing methods that are difficult to detect. Monitoring studies of tropical surface conditions have tremendously diversified in recent years with the development of new sensors and the establishment of new methods [6,7,8,9,10,11,12]. In Côte d’Ivoire, monitoring land use and land cover dynamics by remote sensing faces many challenges. Land clearing starts in a very discrete way in small areas and progressively extends to the entire classified forest or protected area [13,14]. In this context, the traditional use of Landsat-type satellite images [14] is justified by the high availability of image archives (over 30 years) but may be limited for annual monitoring due to their low acquisition frequency and spatial resolution (30 m). The constellation of Sentinel-2 satellites, in operation since 2015 (Sentinel-2A) and 2017 (Sentinel-2B), provides free images at 10, 20, and 60 m resolutions. This represents a strong interest for West African institutions that still do not have sufficient financial means for the acquisition of images. The use of these sensors makes it possible to more clearly distinguish land use and land cover categories and makes images without clouds attainable. Indeed, the intertropical zone, particularly Côte d’Ivoire, is subject to heavy cloud cover that limits the application of optical remote sensing [11]. Following the lead of [15], several studies have shown the potential of Sentinel-2 sensors to significantly contribute to land monitoring. In Côte d’Ivoire, these images were used to assess the dynamics of land cover and land use change on a regional scale covering the current study area [12]. The results revealed an annual deforestation rate of 0.35% in the Bossématié classified forest. The present study seeks to assess intra-annual tree loss in this forest. These two studies are therefore complementary from the point of view of exploiting the potential use of Sentinel-2 images and aerial images acquired by drone for forest management. The reduced endurance of UAVs is a limiting factor for forestry uses. The use of drones is thus a tool for analysis at the local scale only [16]. Despite this limitation, they are being increasingly used in natural resource management [17], including rangeland management and monitoring [18,19], forest biodiversity assessment [20], fire [21] and ecosystem structure monitoring [22,23], precision agriculture [24], and wildlife counts [25]. The use of drones for detecting illegal activities has been discussed previously [26,27]. However, applications of this technology for conservation, including land use change detection, are yet to be explored [28,29], particularly in Côte d’Ivoire, where they have been undertested. This study aims to assess tree losses in the Bossématié classified forest over an intra-annual period. The methodology developed is based on aerial images acquired by drones as well as photogrammetry and stereoscopy techniques. The goal of this study is to contribute to the fight against illegal clearing in classified forests and protected areas.

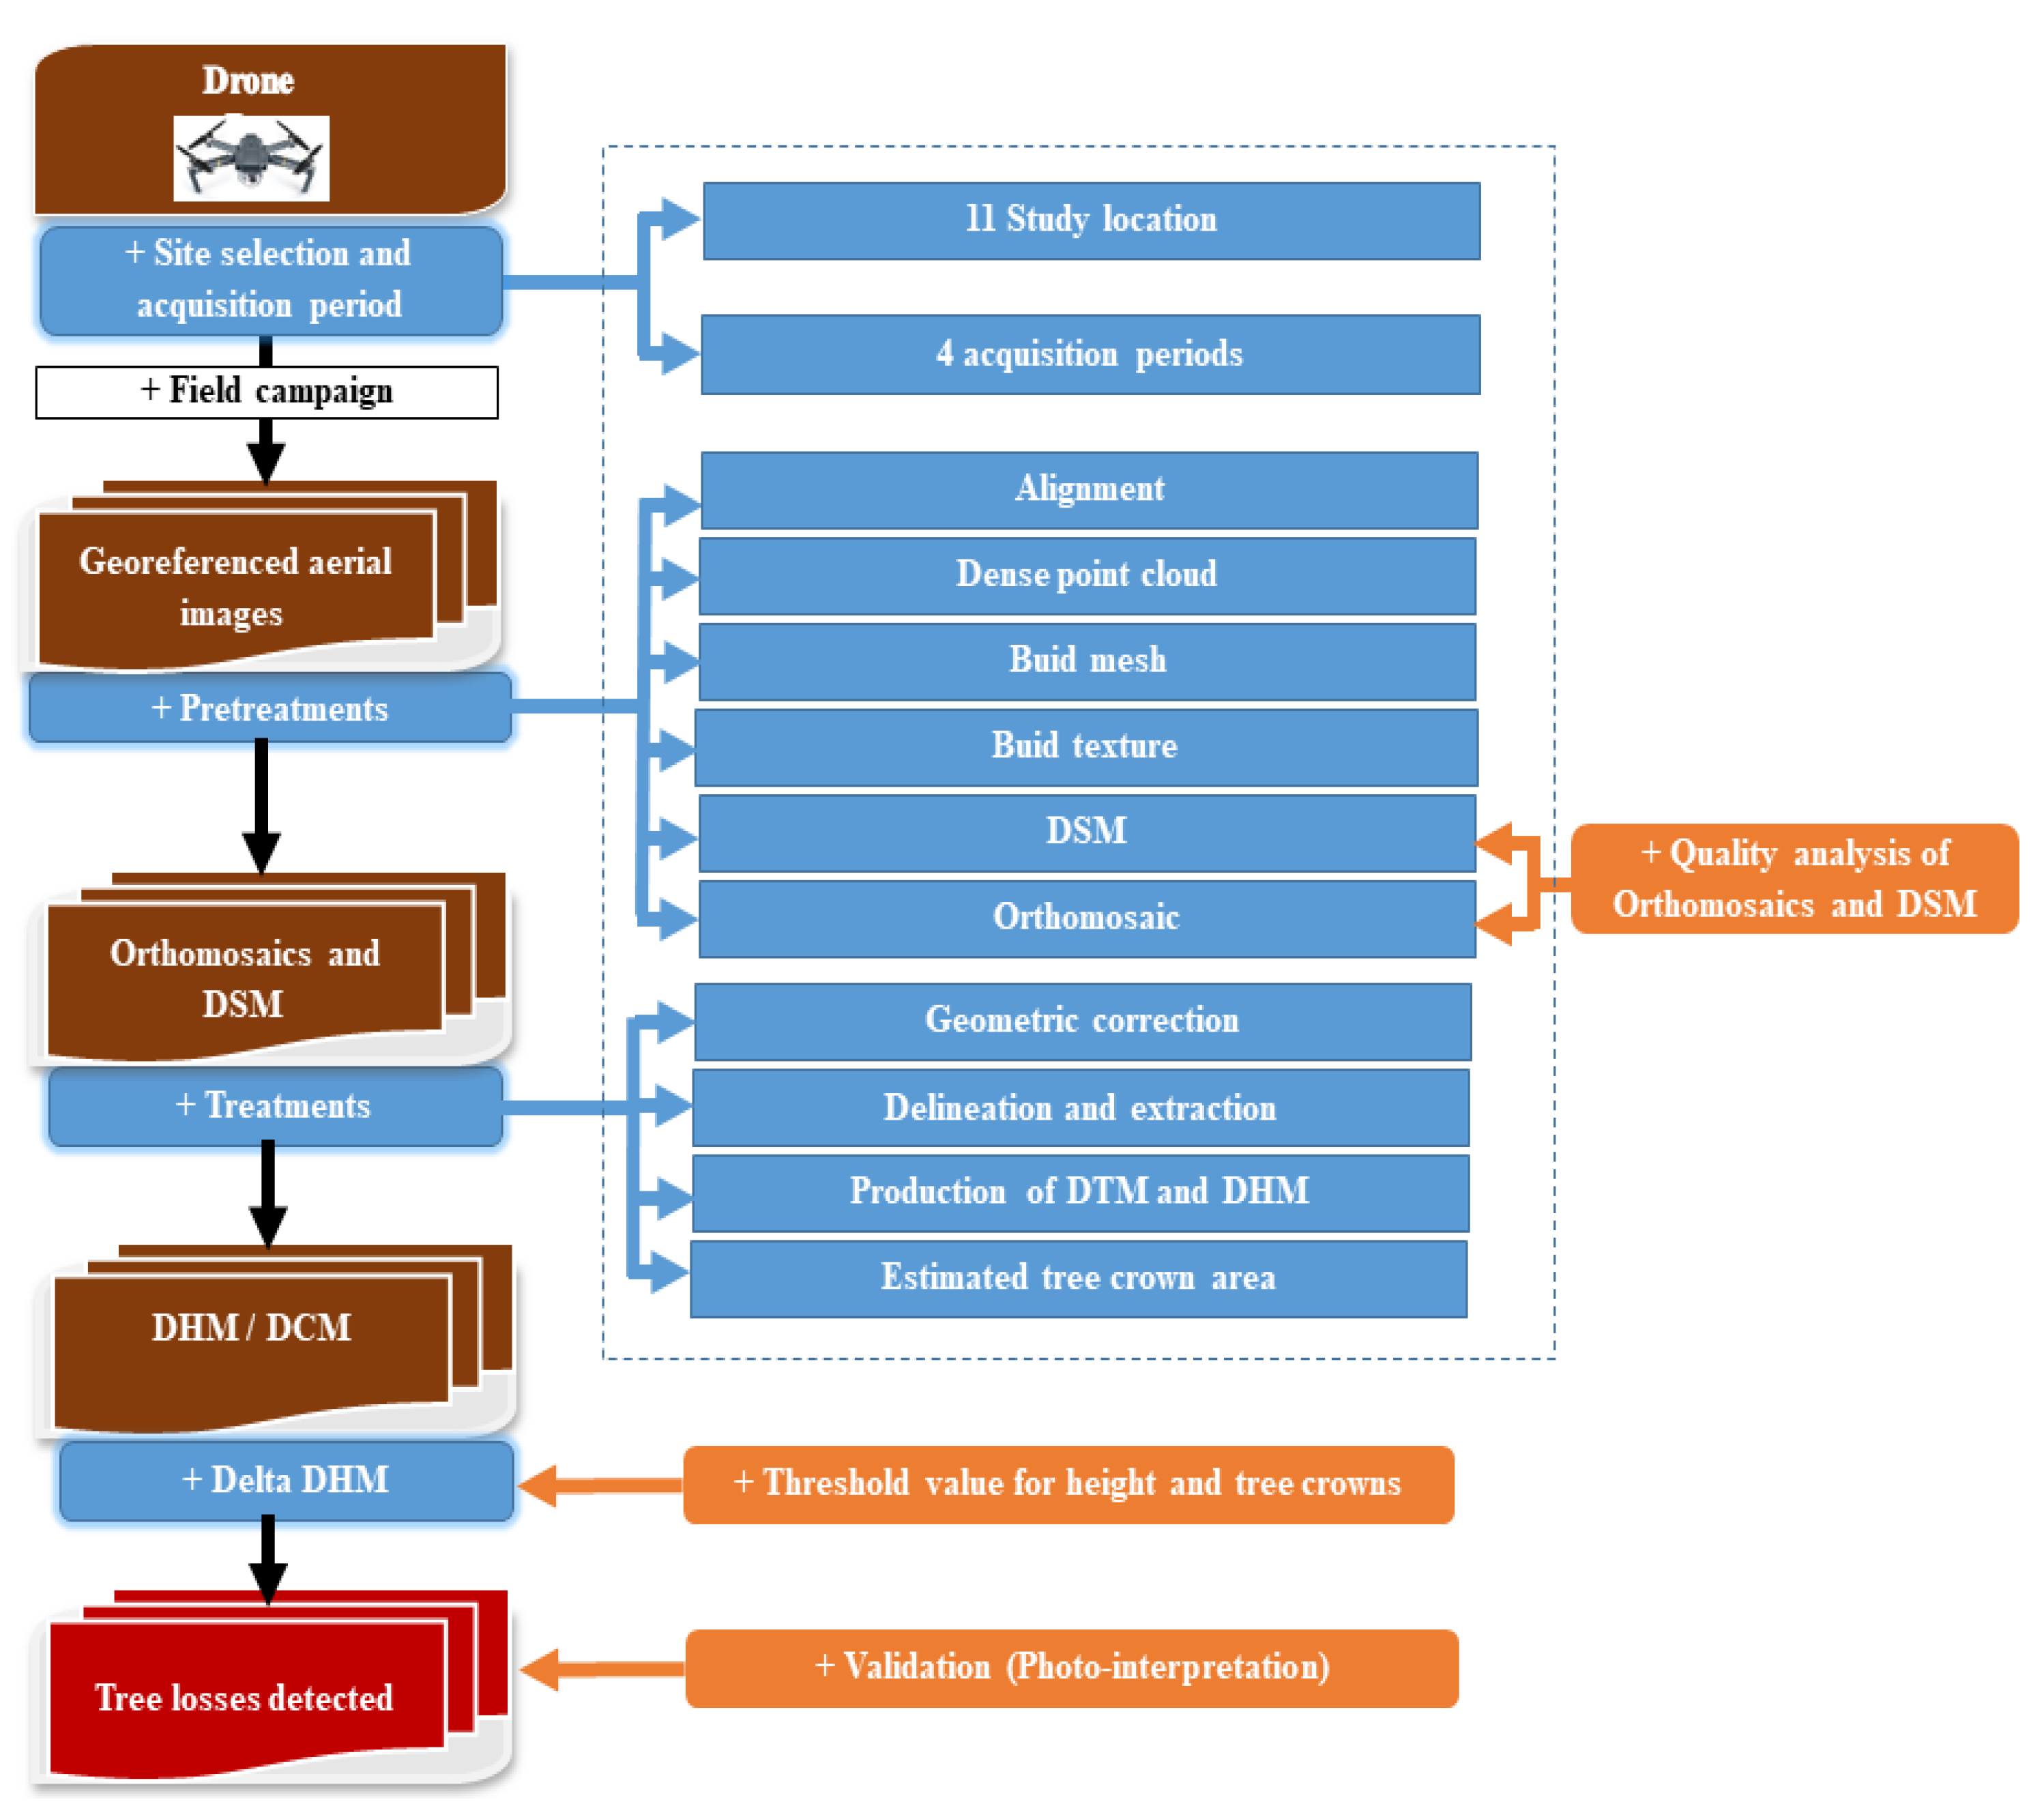
2. Materials and Methods
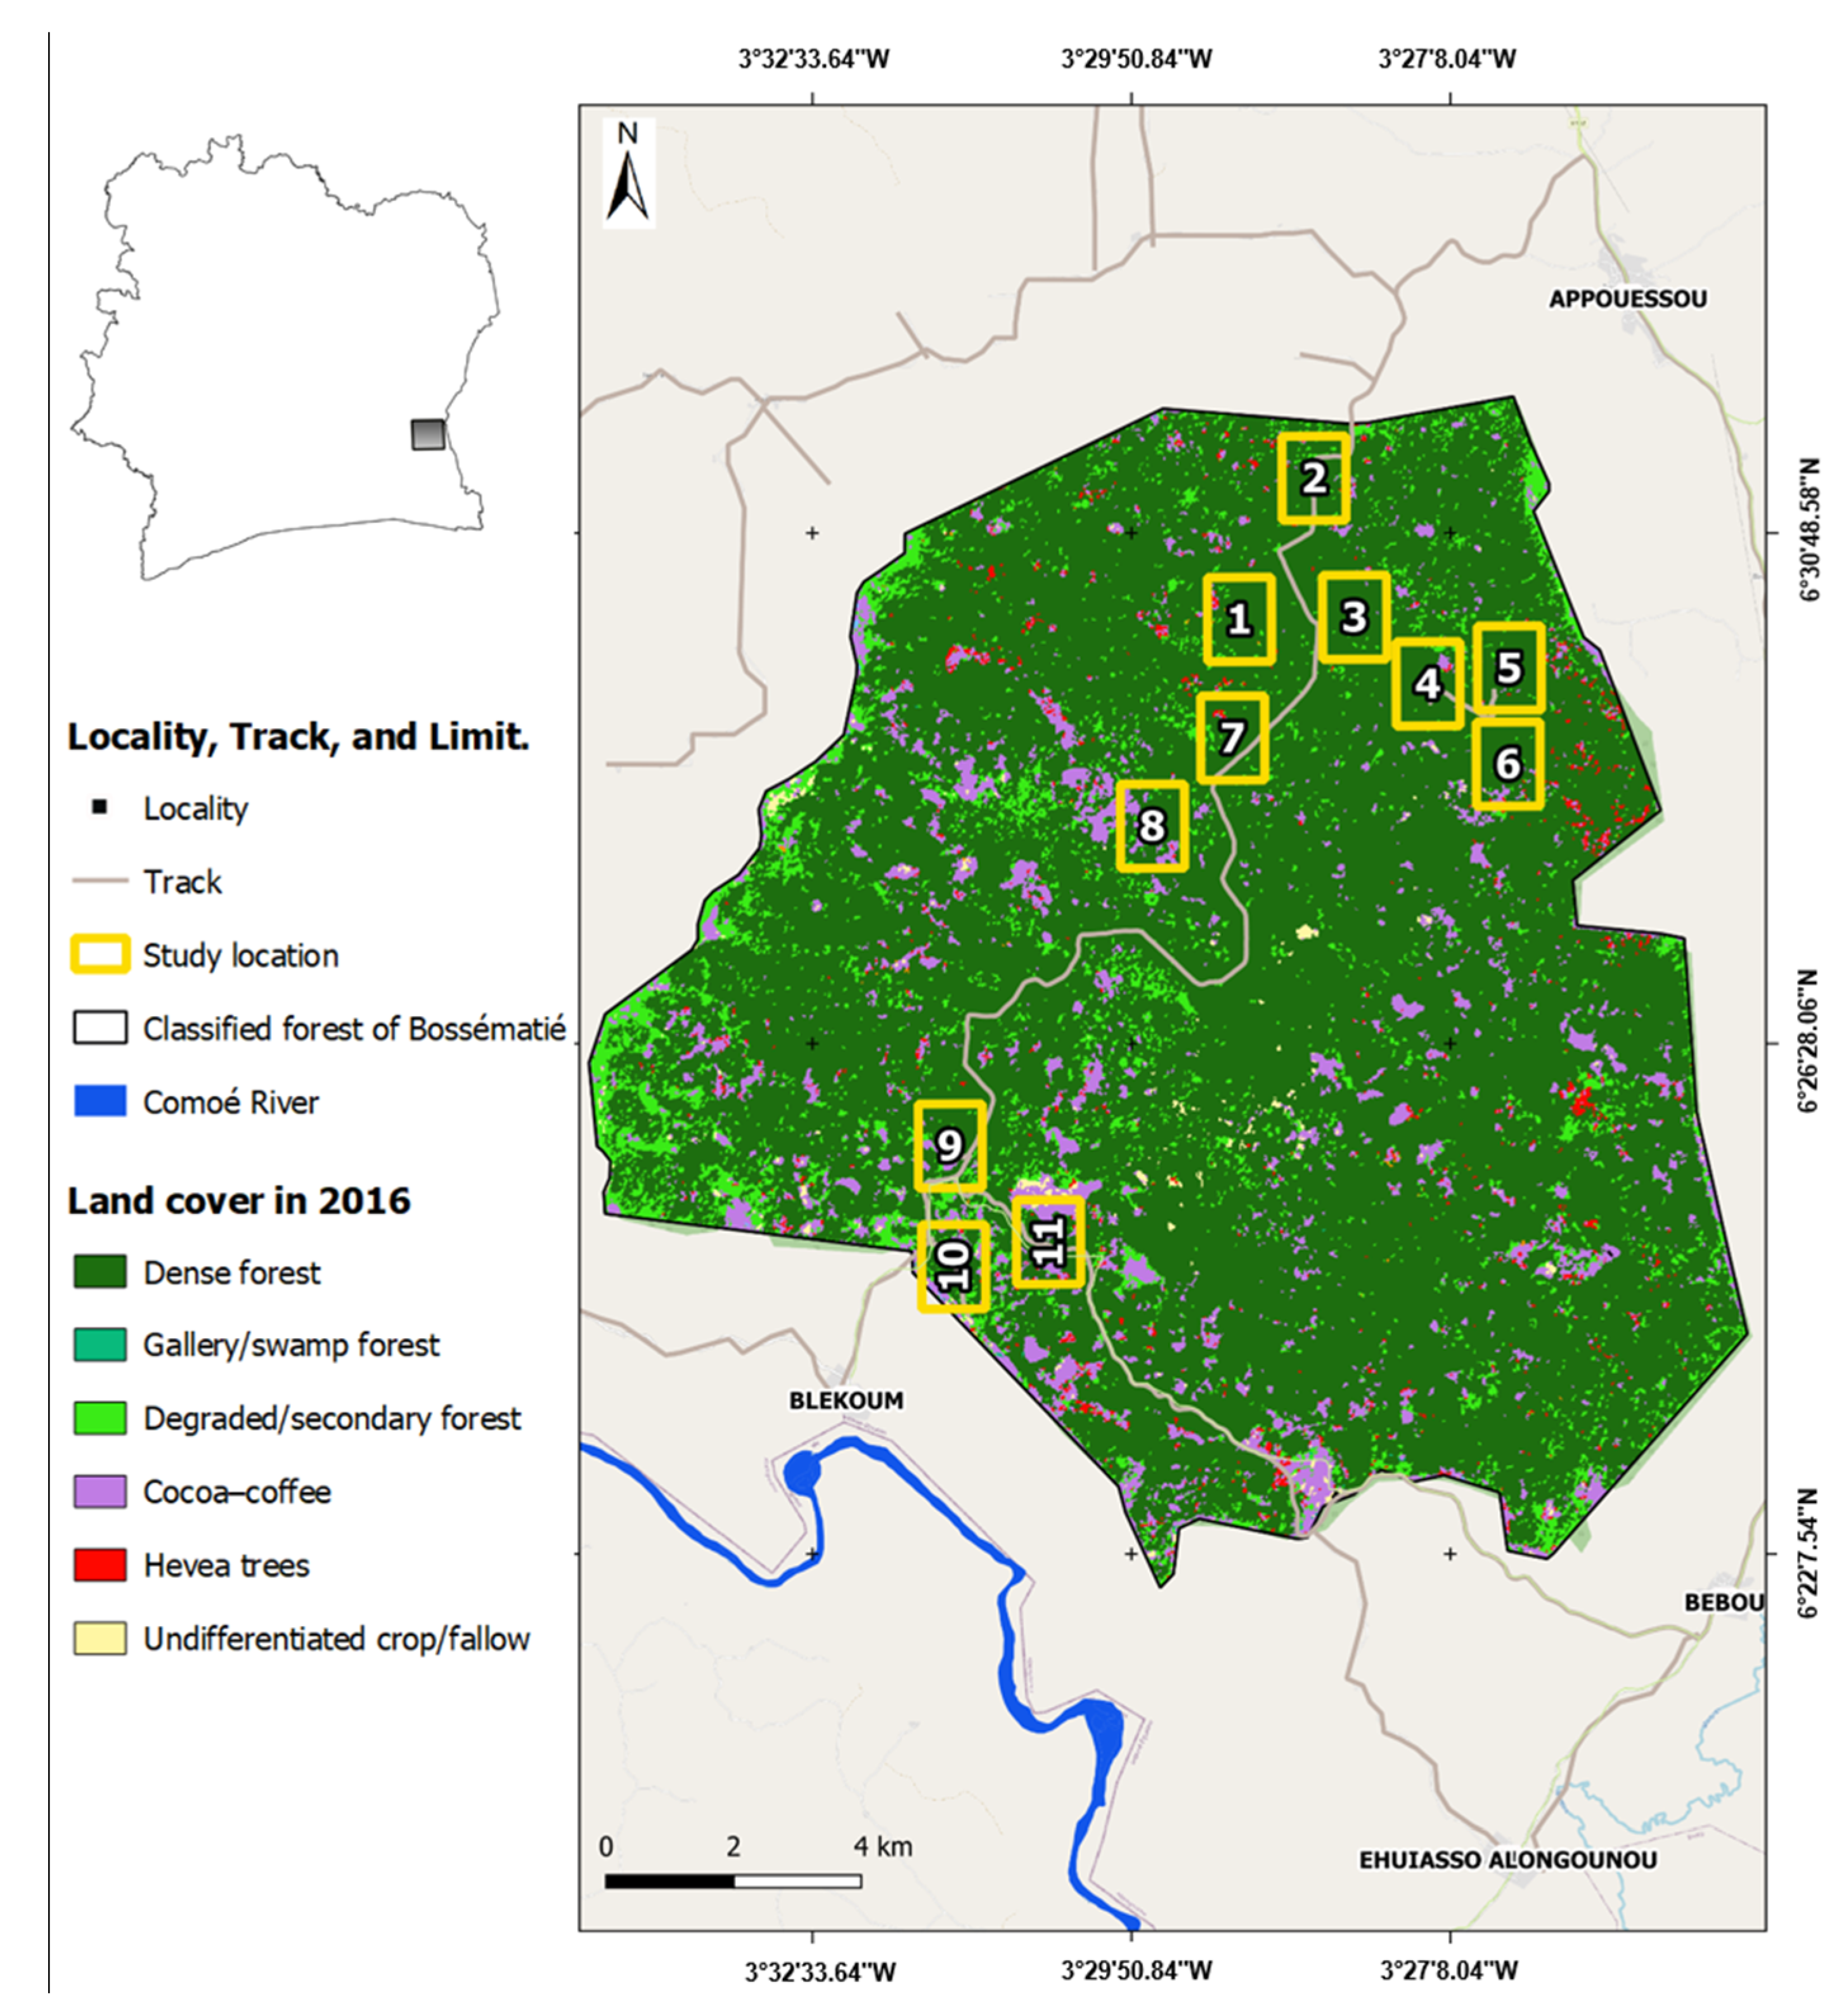
2.1. Study Area

The study area is the classified forest of Bossématié. It covers an area of approximately 220 km2 and is located between latitudes 06°21′30″ and 06°32′30″ north and longitudes 03°24′30″ and 03°34′30″ west in the southeast of Côte d’Ivoire in the Indénié-Djuablin Region (Figure 1). The classified forest of Bossématié is located in the former cocoa belt—named due to the high cocoa production here in the 1980s [12]. It is a classified forest of Côte d’Ivoire that is still well-preserved despite being subject to very strong pressures [12]. Moreover, it hosts the last population of forest elephants (Loxodonta africana) of the southeast. The vegetation is that of the Guinean domain characterized by dense evergreen rainforest. Dense forests represented 83% of the classified forest in 2016, while degraded forests represented 8%, and perennial crops of cocoa, Theobroma cacao (Sterculiaceae); coffee, Coffea arabusca and Coffea canephora (Rubiaceae); and rubber, Hevea Brasiliensis (Euphorbiaceae), represented 9% at the same date [12]. Within this forest, lianas are less numerous; the herbaceous stratum is generally well represented, with a predominance of Poaceae and Acanthaceae. The vegetation is of the semideciduous type as defined by [30] with rare epiphytes. This vegetation can be described as Malvaceae and Cannabaceae [31]. It is populated in abundance by Celtis mildbraedii (Cannabaceae), Nesogordonia papaverifera (Malvaceae), Triplochiton scleroxylon (Malvaceae), and Mansonia altissima (Malvaceae).

2.2. Overall Methodology

For the implementation of this study, a sampling protocol was set up that combines photogrammetry, stereoscopy, and change analysis techniques using very high spatial resolution images acquired with a drone (Figure 2).

2.2.1. Sampling Plan

Eleven test sites were identified with the assistance of ecoguards to conduct this study in the Bossématié classified forest (Figure 1). The flights were conducted during the dry season at these sites during three acquisition campaigns: in November 2018 and April 2019. These sites are characterized by their 2016 land-use type, allowing us to evaluate the area’s level of deforestation and degradation, as well as its accessibility (Table 1). The level of deforestation and degradation of these sites varies from 2% to 41% [12].

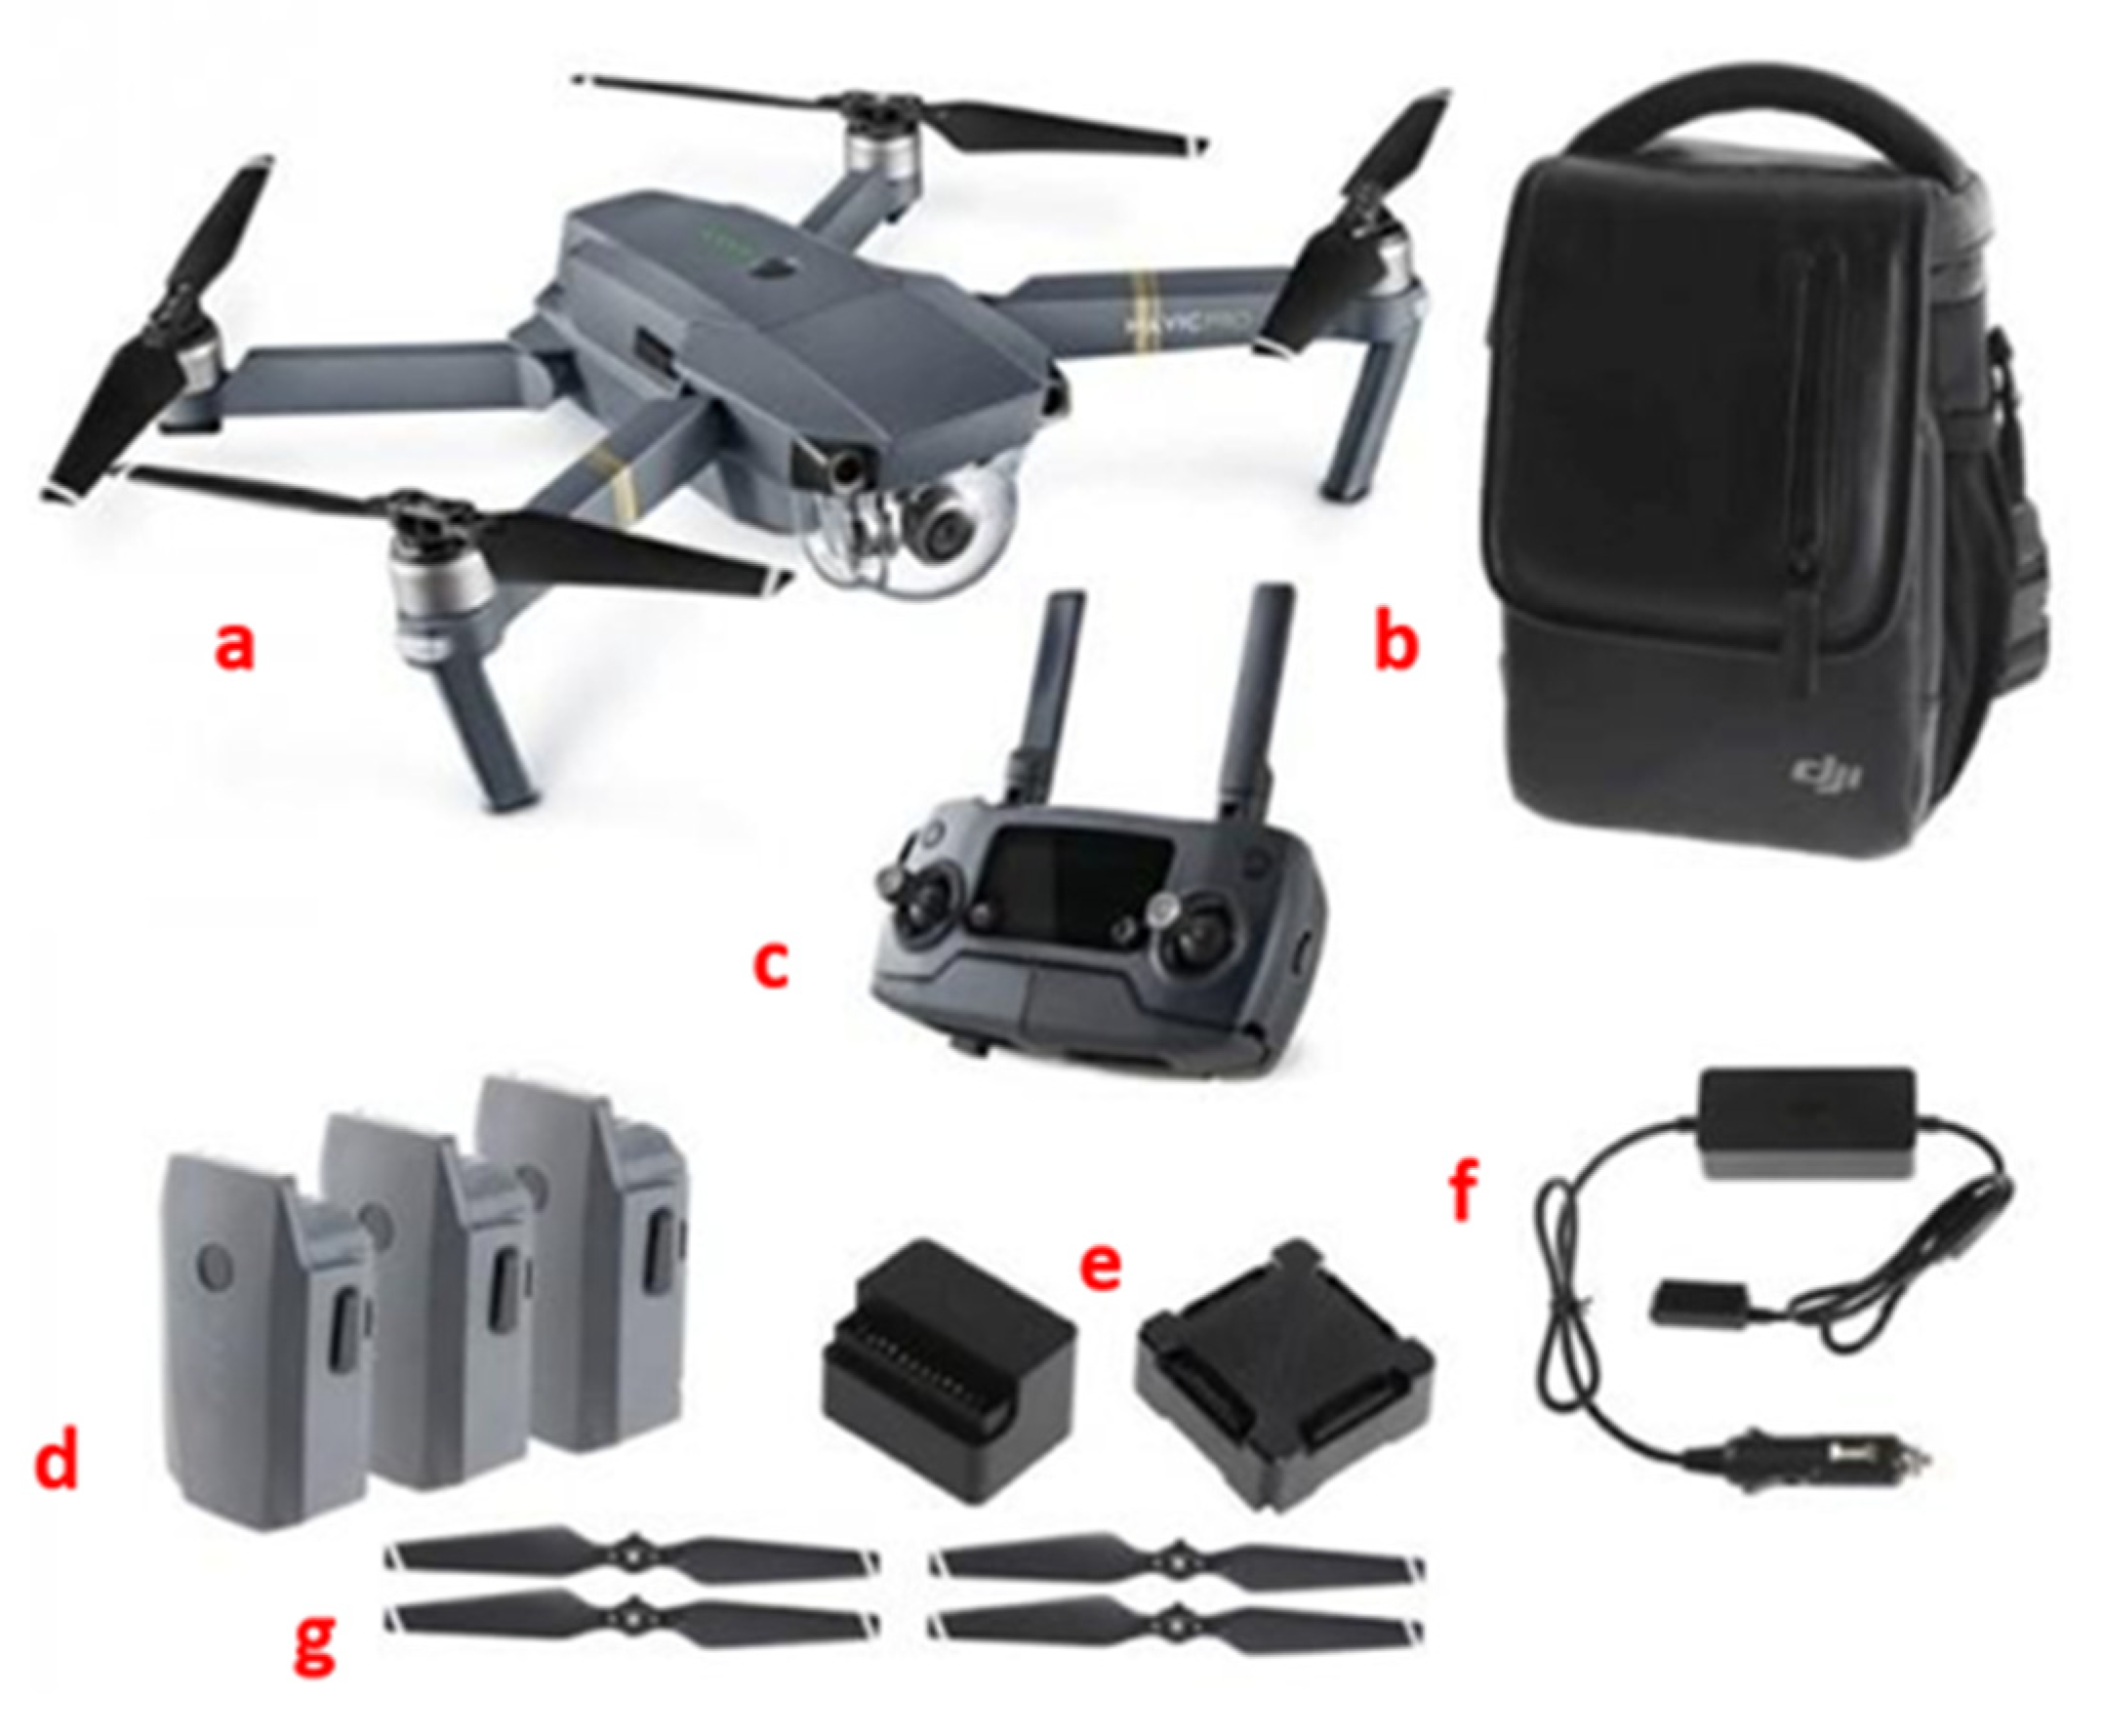
2.2.2. Drone Used for Image Acquisition

In this study, a DJI Mavic Pro drone (Figure 3) was used. It is a multirotor system with four motors (quadcopter) powered by a LiPo (lithium polymer) smart battery with a capacity of 3830 mAh and an autonomy of 27 min. It features a wingspan of 20 cm, a weight of 736 g, and a maximum speed of 65 km/h. The DJI Mavic Pro is equipped with a 12-megapixel 4 K camera (stabilized by a pod). This camera acquires images in true colors with 8-bit radiometric resolution. This acquisition is carried out automatically using a cadence previously defined during the flight preparation. The system uses autonomous ultrasonic sensor flight technology to reduce the risk of accidents and is equipped with a GPS–GLONASS location system. The system includes a ground control radio station (connected to a smartphone) with a range of 7.3 km under normal conditions (no obstacle to the transmission of the radio signal) and a battery life of 1.5 h.
The configuration of the drone and the flight planning were conducted with a DJI Go 4 (version 4.3.28) and DroneDeploy (version 4.0.0) software, respectively.

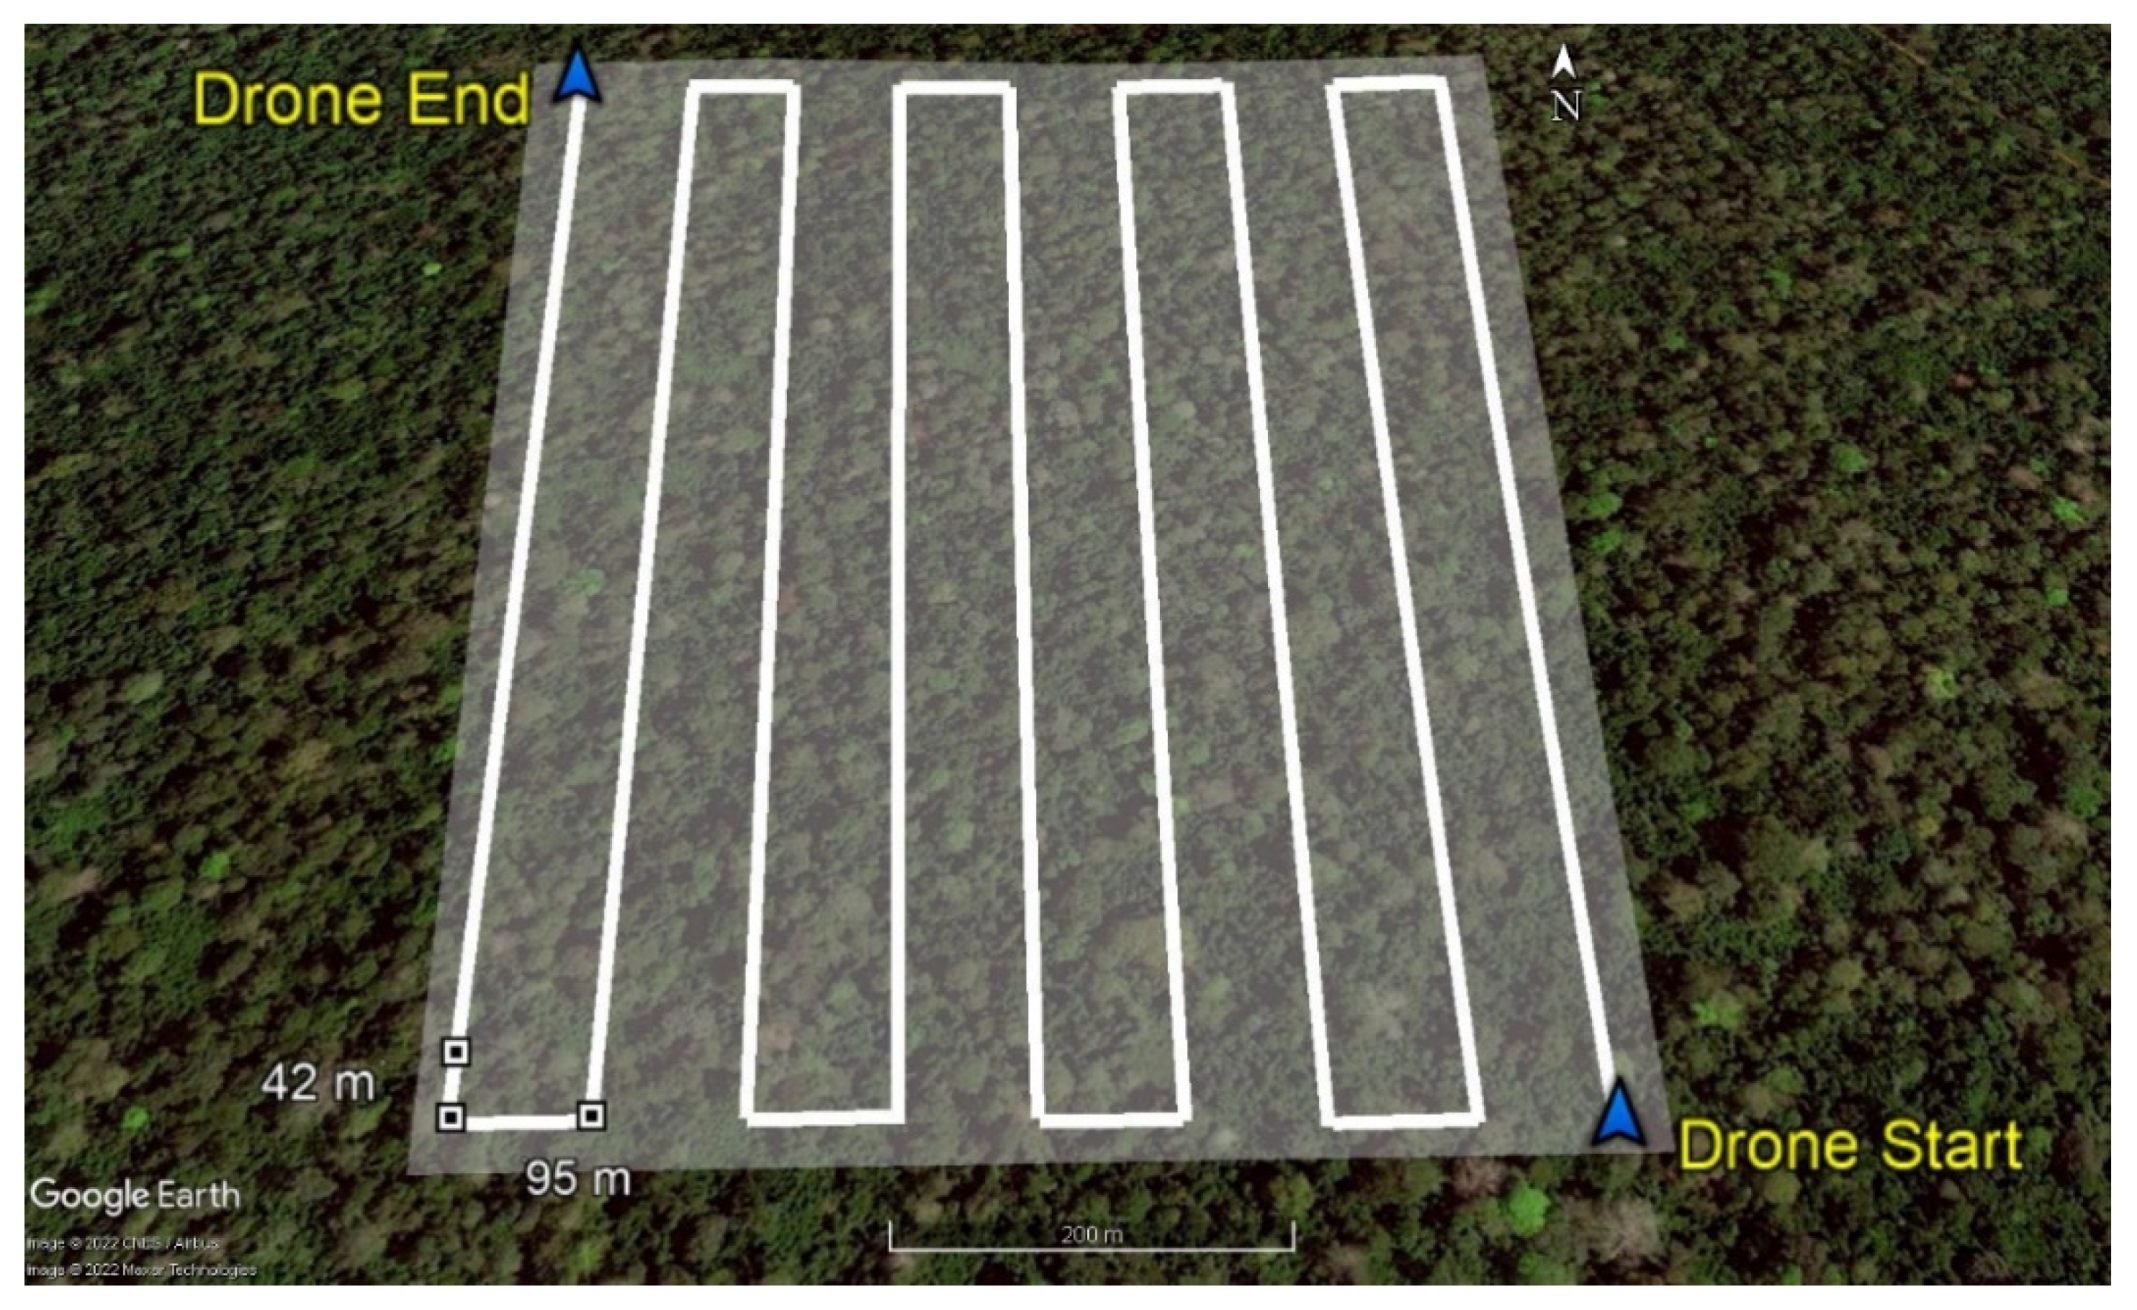
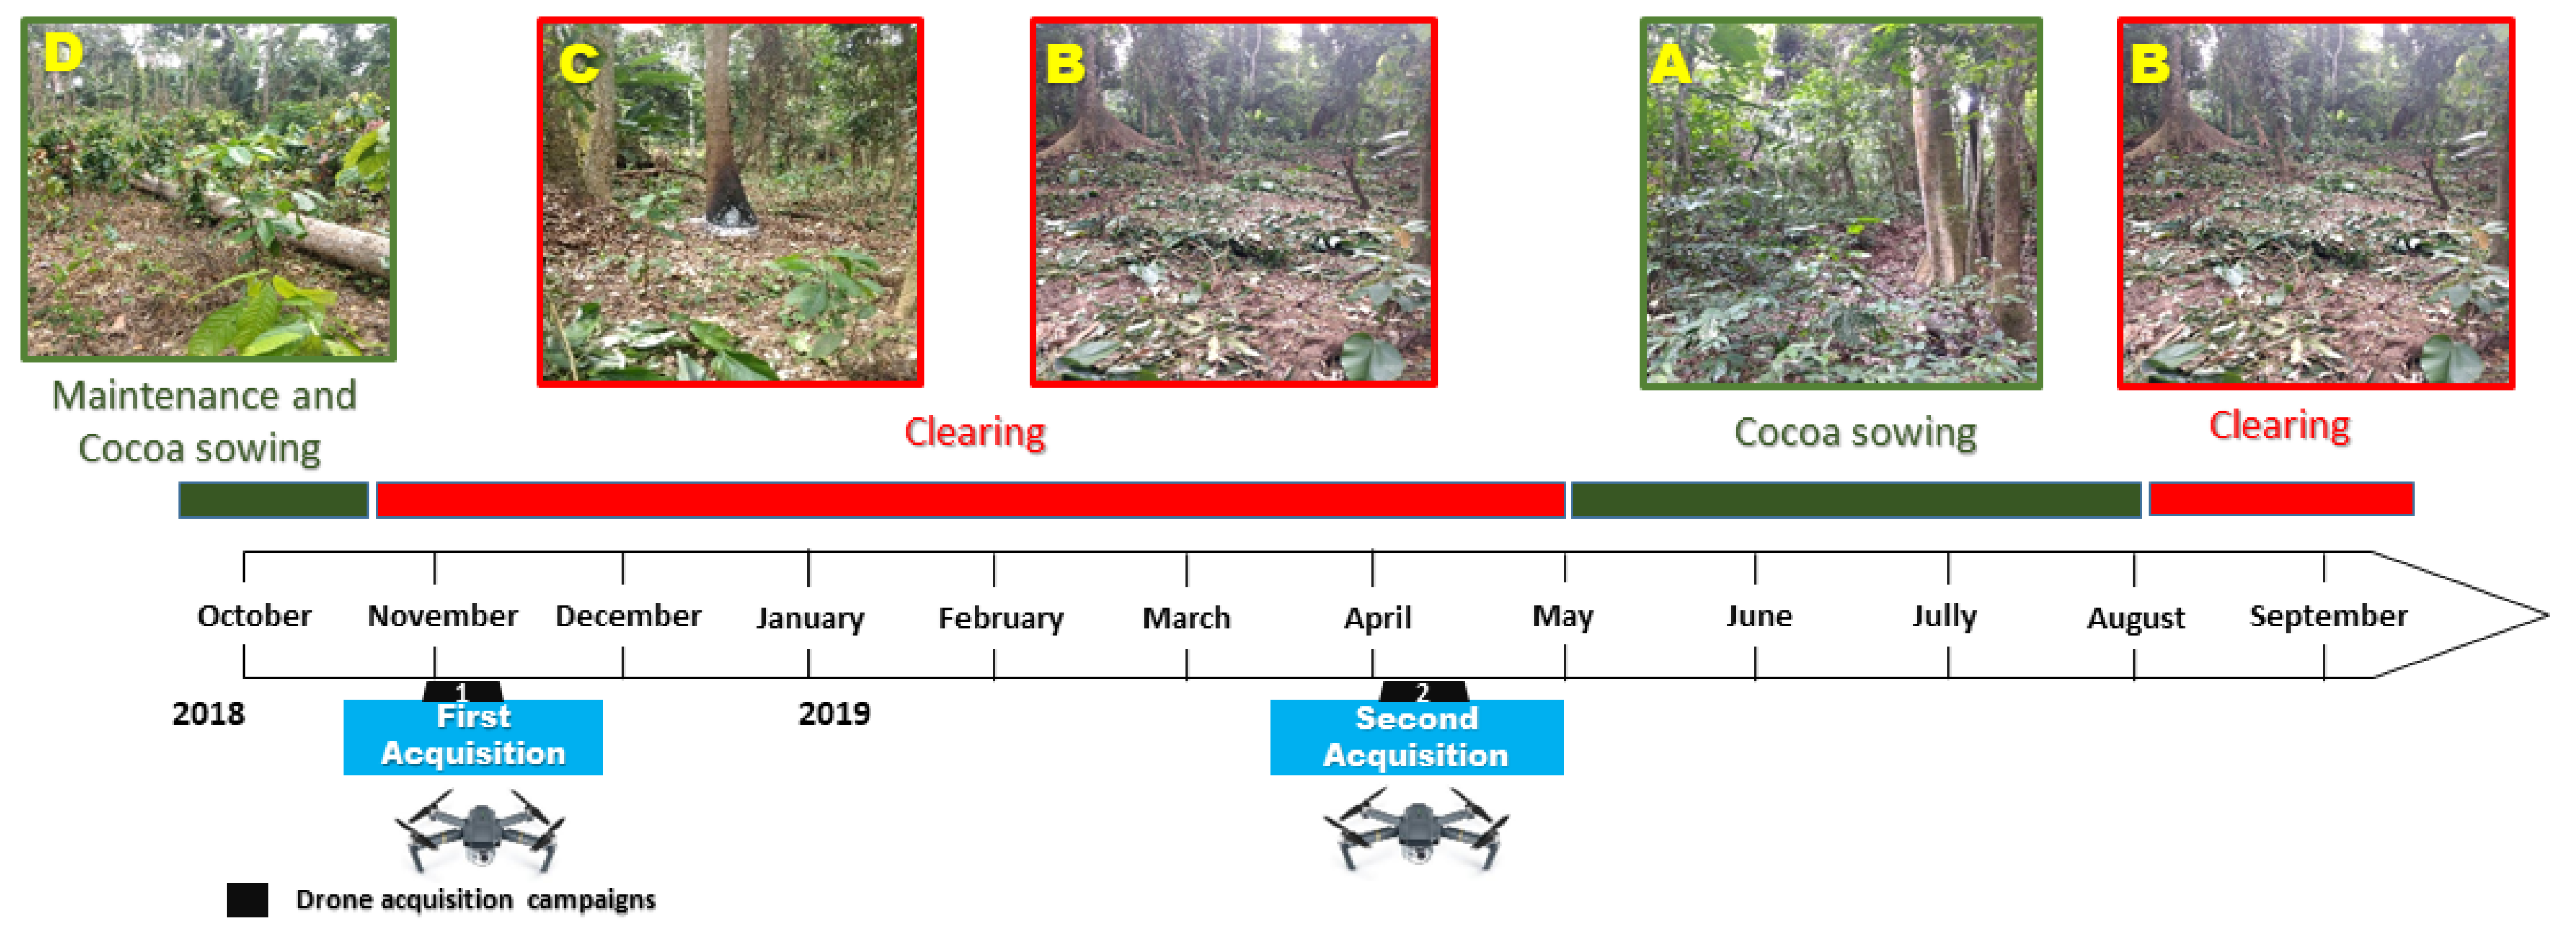
2.2.3. Acquisition of Aerial Images by Drone

Aerial images were acquired at a flying altitude of 200 m with a ground resolution of 6 cm/pixel and a footprint of 240 × 180 m per image. These images were acquired in the visible light spectrum (red, green, and blue) and have already been georeferenced (the geographical location of the center of each image is known). A rate of one image every 42 m allowed us to obtain a longitudinal coverage of 65%. A spacing of 95 m between the flight lines allowed for a lateral overlap of 75%. These significant overlaps ensure proper image stitching in the production of an orthomosaic according to photogrammetric and stereoscopic principles [28,29]. The entire set of 11 flight plans, each constituting nine parallel flight lines or transects in a north–south direction, allowed us to fly over an area of between 130 and 132 ha (Figure 4).

2.2.4. Orthomosaic and Digital Surface Model Production

Our methodology for processing and analyzing the aerial images (Figure 2) was based on the principles of photogrammetry and stereoscopy. The first step was performed in the Agisoft Photoscan Professional software (version 1.4.0) and includes orthorectification and mosaicking steps. The process is subdivided into the alignment of aerial images, the production of a scatter plot, gridding, and texturing, allowing us to generate a digital surface model (DSM) and an orthomosaic [24,28,32]. As the images are located by GPS, alignment aims to reconstruct the acquisition geometry of the aerial images from the identification of link points; point cloud aims to produce a 3D model, and mesh aims to reconstruct an analysis grid to facilitate orthomosaic production; finally, texturization aims to create the texture for the 3D model [33]. The orthomosaics and DSMs were cleaned to remove poor (blurred) quality due to edge effects. The quality of photogrammetric processing was evaluated following several parameters, including the percentage of aerial image alignment and projection errors associated with the aerial image stitching process.

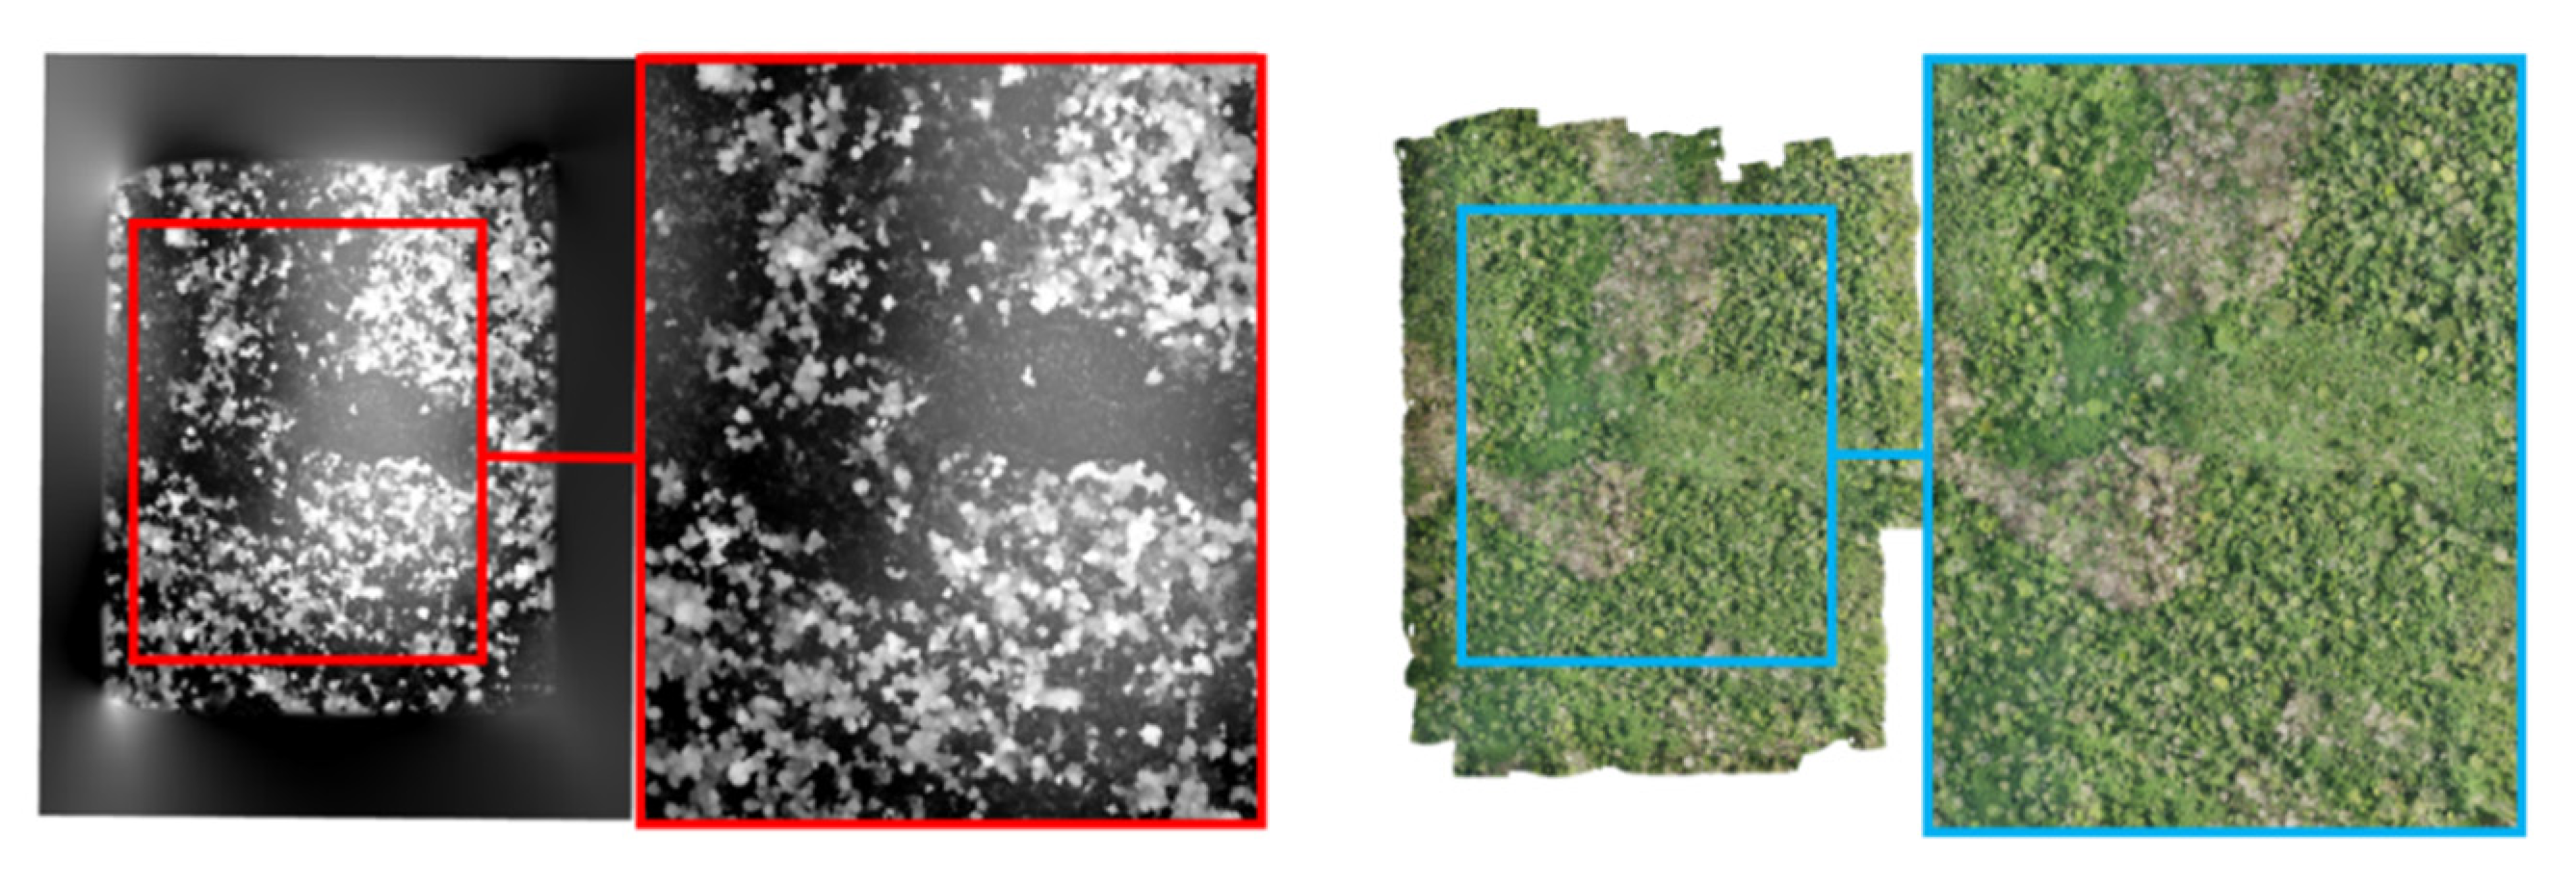
2.2.5. Geometric Corrections

In a change analysis approach, it is necessary to considerably reduce geometric errors. Geometric errors are related to uncontrolled movements (e.g., wind force) of the drone with respect to the previously defined flight line and to variations in altitude during shooting [34]. The digital surface models obtained were therefore georeferenced. The method used is image-to-image georeferencing: the DSM at date T2 is georeferenced from the DSM at date T1 on all the sites studied. The transformation applied was polynomial, and the resampling method was nearest neighbor.

2.2.6. Study Site Portion Delineation and Extraction

The orthomosaics and DSMs produced generally have some artifacts and blurred pixels, mostly along image boundaries. To guarantee the good quality of the image intended for processing, it is necessary to delimit and extract portions of the different study sites; this is to get rid of the poor quality (blurring) due to edge effects (Figure 5). Thus, from an initial area varying between 130 and 132 ha for each site, the areas retained at this step for Sites 1, 6, 8, 9, and 11 are 87, 94, 97, 102, and 121 ha, respectively.

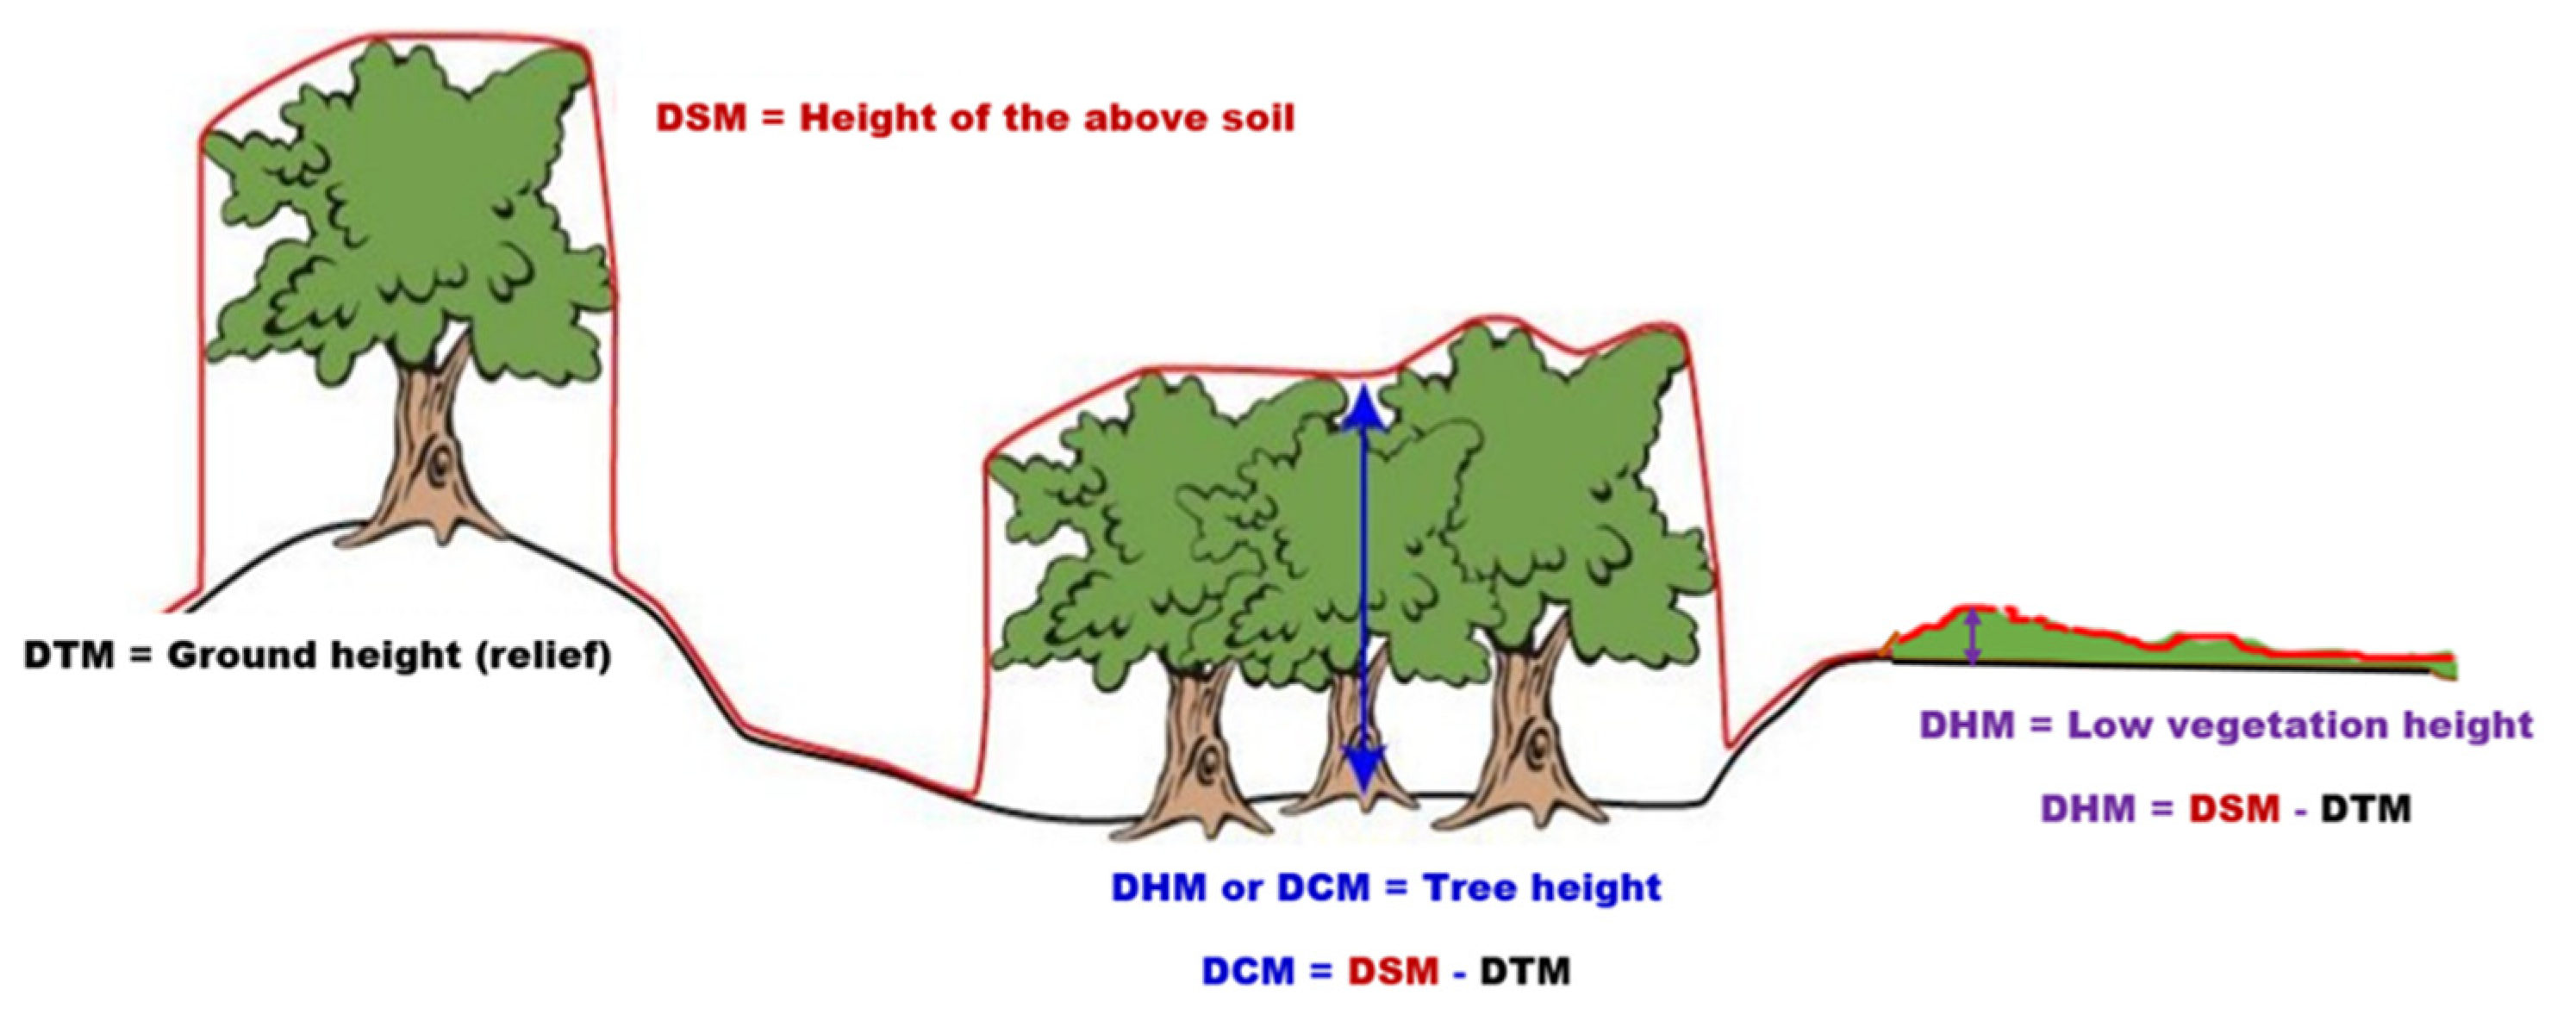
2.2.7. Digital Terrain Model Production

In this study, the DSM was used to produce the digital terrain model (DTM) following three steps. The first step consisted of partially eliminating the trees (pseudo DTM) by resampling the DSM at 10 m resolution while keeping the minimum elevation values (ground elevation). The second step consisted of a circular convolutional filter of minimum type whose size 13 was chosen after various tests. This filter size corresponds exactly to 6 pixels on either side of the central pixel (i.e., a filter with a radius of 60 m). This second step allows us to eliminate all the trees while keeping the ground elevations. At this stage, the result is a DTM with a spatial resolution of 10 m. Finally, the last step consisted of resampling the generated DTM at a 20 cm resolution.

2.2.8. Generation of Digital Tree Height and Canopy Models

In the field of forestry, the distribution of vegetation in general is known as digital height model (DHM). The distribution of tree heights is also known as digital canopy model (DCM). The DHM was calculated for each of the priority monitoring sites in the Bossématié classified forest based on two other landscape indicators: the DSM and the DTM according to Equation (1).
DHM = DSM − DTM
The DTM produced may have heights that do not always correspond to tree heights but rather to low vegetation heights (grass or cocoa crop) (Figure 6). Therefore, the DCM was calculated from the DHM based on the threshold value of minimum forest tree height excluding perennial cocoa–coffee crops. This threshold value will be defined from the statistical analysis of the vegetation height distribution:
DCM = DHM − ρ
where ρ is the height threshold value obtained with the drone to ensure that only forest trees are detected.

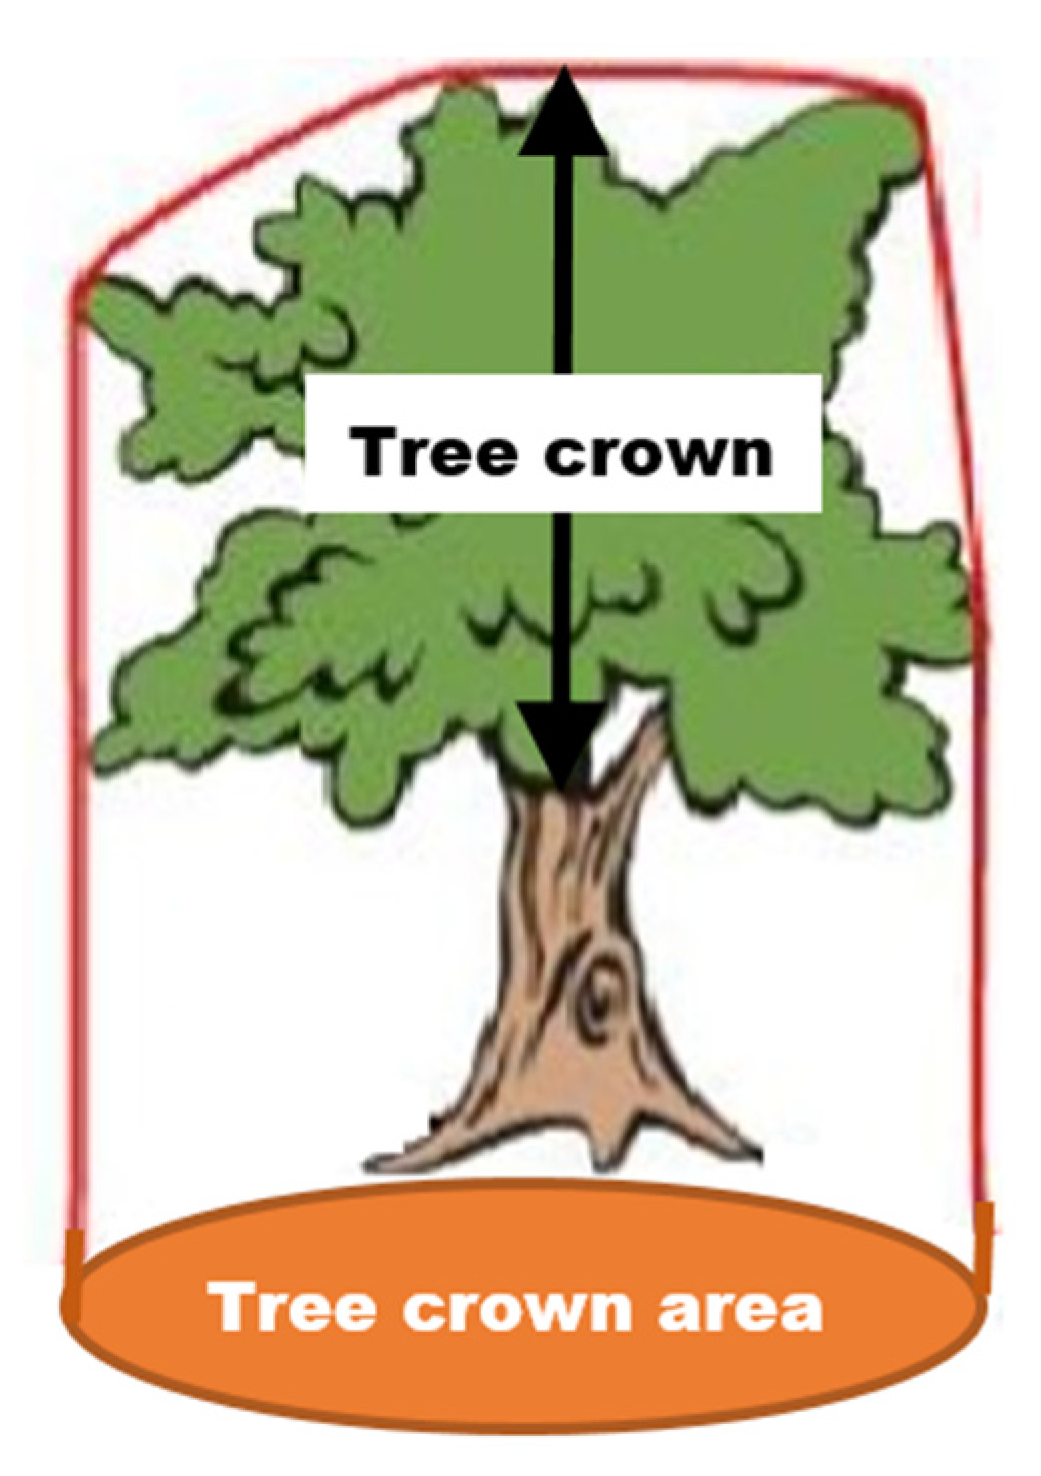
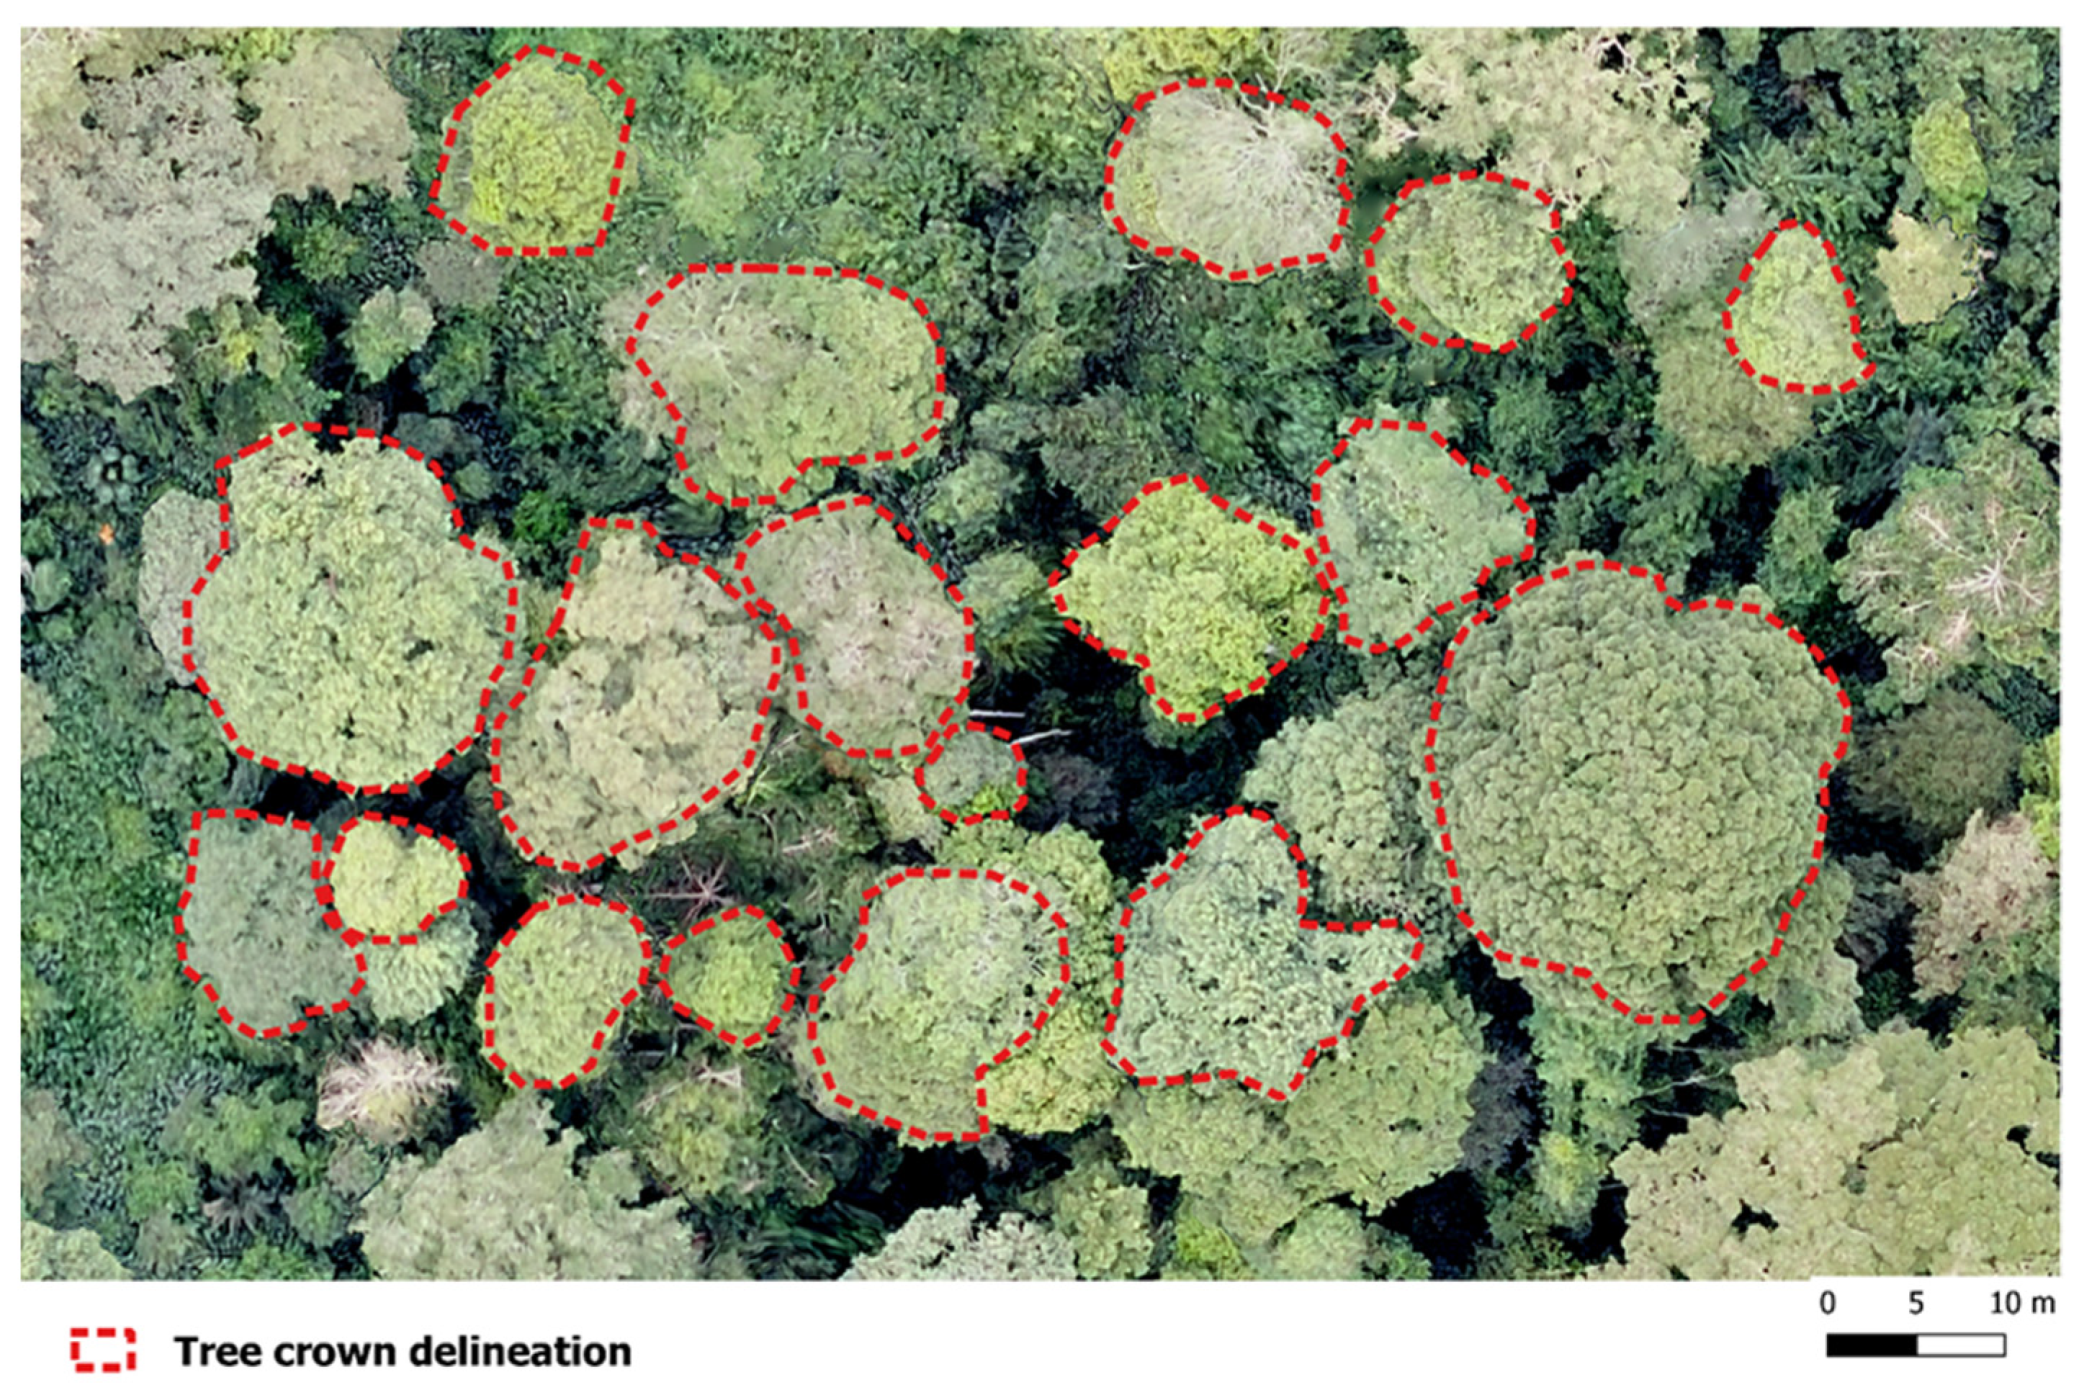
2.2.9. Estimation of Tree Crown Area

The crown is the part of the tree that is on top of the bole, including the branches, the different twigs, and the leaves [36] (Figure 7). The estimation of the ground area of the tree crown was based on photointerpretation of a sample of 124 trees based on orthomosaics from November 2018 and April 2019. First, the tree crowns were manually delineated in the QGIS 3.0 software. Then, the area (Shp) corresponding to the orthogonal projection of the tree crown to the ground was automatically calculated with QGIS 3.0 software.

2.2.10. Tree Loss Detection and Validation

Tree loss detection is based on the analysis of difference in vegetation heights (∆MNH) and based on the criteria of tree height and tree crown area. The change in vegetation height is calculated using Equation (3):
∆MNH = MNHt2 − MNHt1
where t1 and t2 represent the two selected acquisition dates (November 2018 and April 2019, respectively).
Negative values correspond to vegetation losses. Thus, the average value of the tree crown area allows us to discriminate between what corresponds to tree losses.
The tree height distribution maps in April 2019 and tree loss during the period of November 2018 to April 2019 were evaluated based on the photointerpretation of a sample of 511 observation points categorized as tree loss (total of 107 points), stable forest (total of 200 points), and stable nonforest (total of 204 points). Accuracy indicators, such as overall accuracy and kappa index, were finally calculated.

3. Results

3.1. Quality of Photogrammetric Processing

The aerial image orthorectification and mosaicking process involved a total of 33 flights, with three diachronic flights (November 2018, January 2019, and April 2019) for each of the 11 study sites. A total of 33 orthomosaics and DSMs were produced with different levels of satisfaction. The proportions of correctly aligned images and reprojection errors from the Photoscan software ranged from 59% to 100% and from 0.551 pixels to 0.813 pixels across all study sites (Table 2). The proportion of orthomosaics not retained in this study for reasons of poor quality (blurred images, presence of areas without data, artifacts, etc.) was 24% (i.e., 8 out of the 33 orthomosaics produced). Following this evaluation, Sites 1, 6, 8, 9, and 11 were selected because their orthomosaics and DSMs were of good quality and were available for both November 2018 and April 2019.

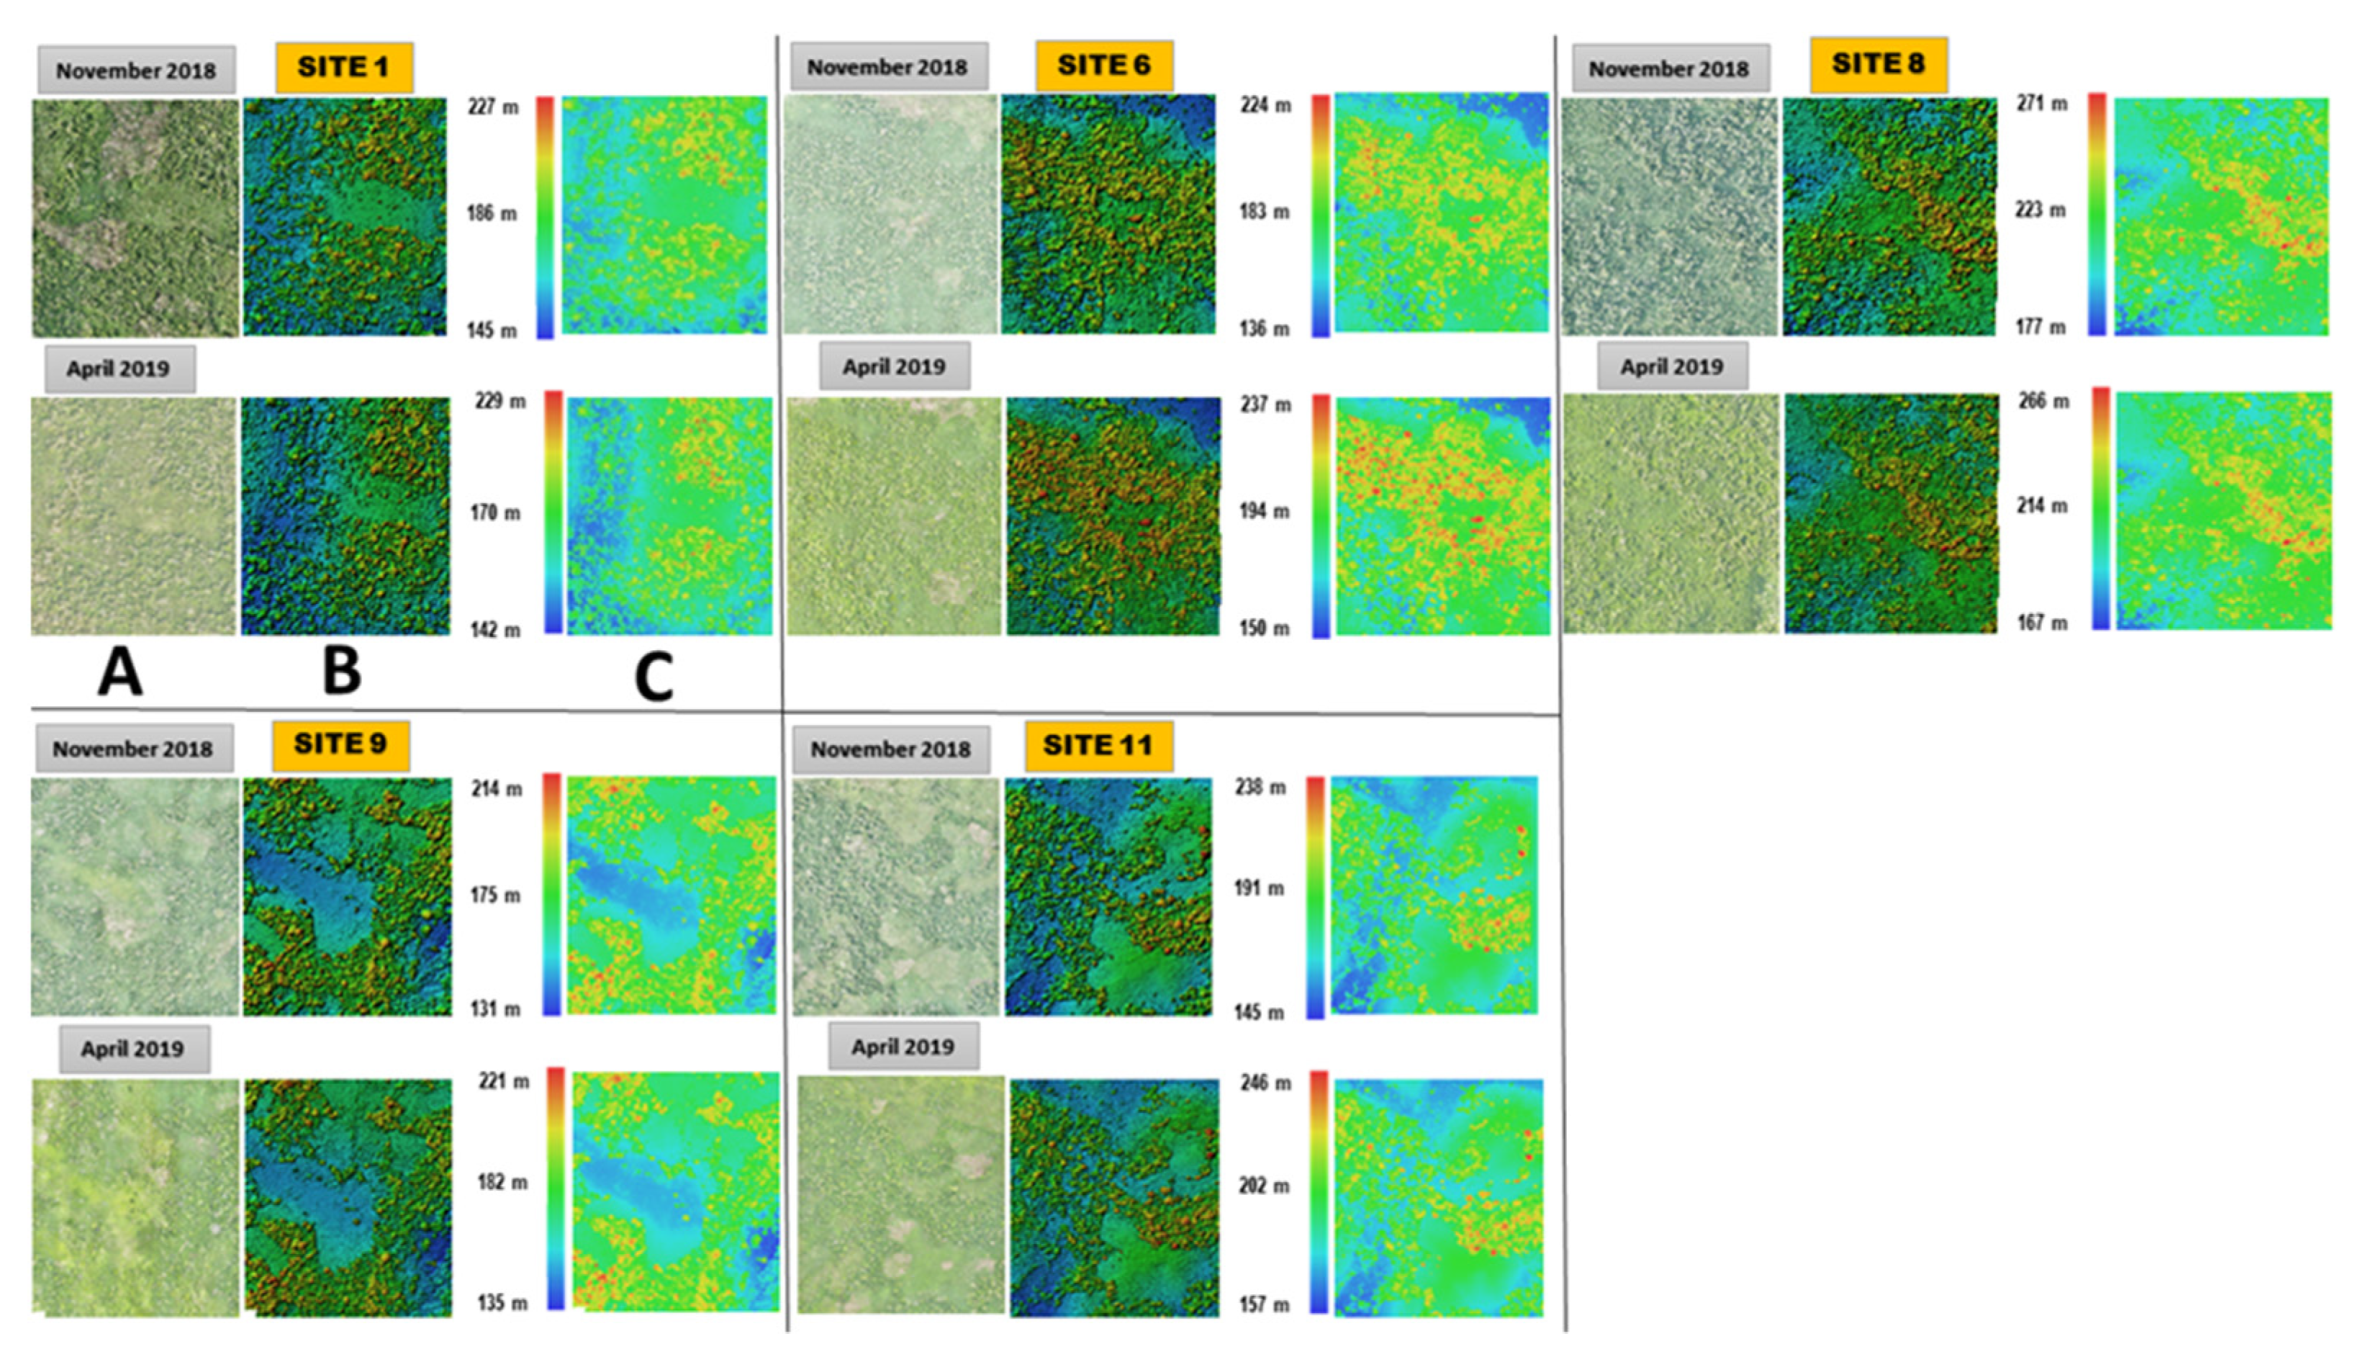
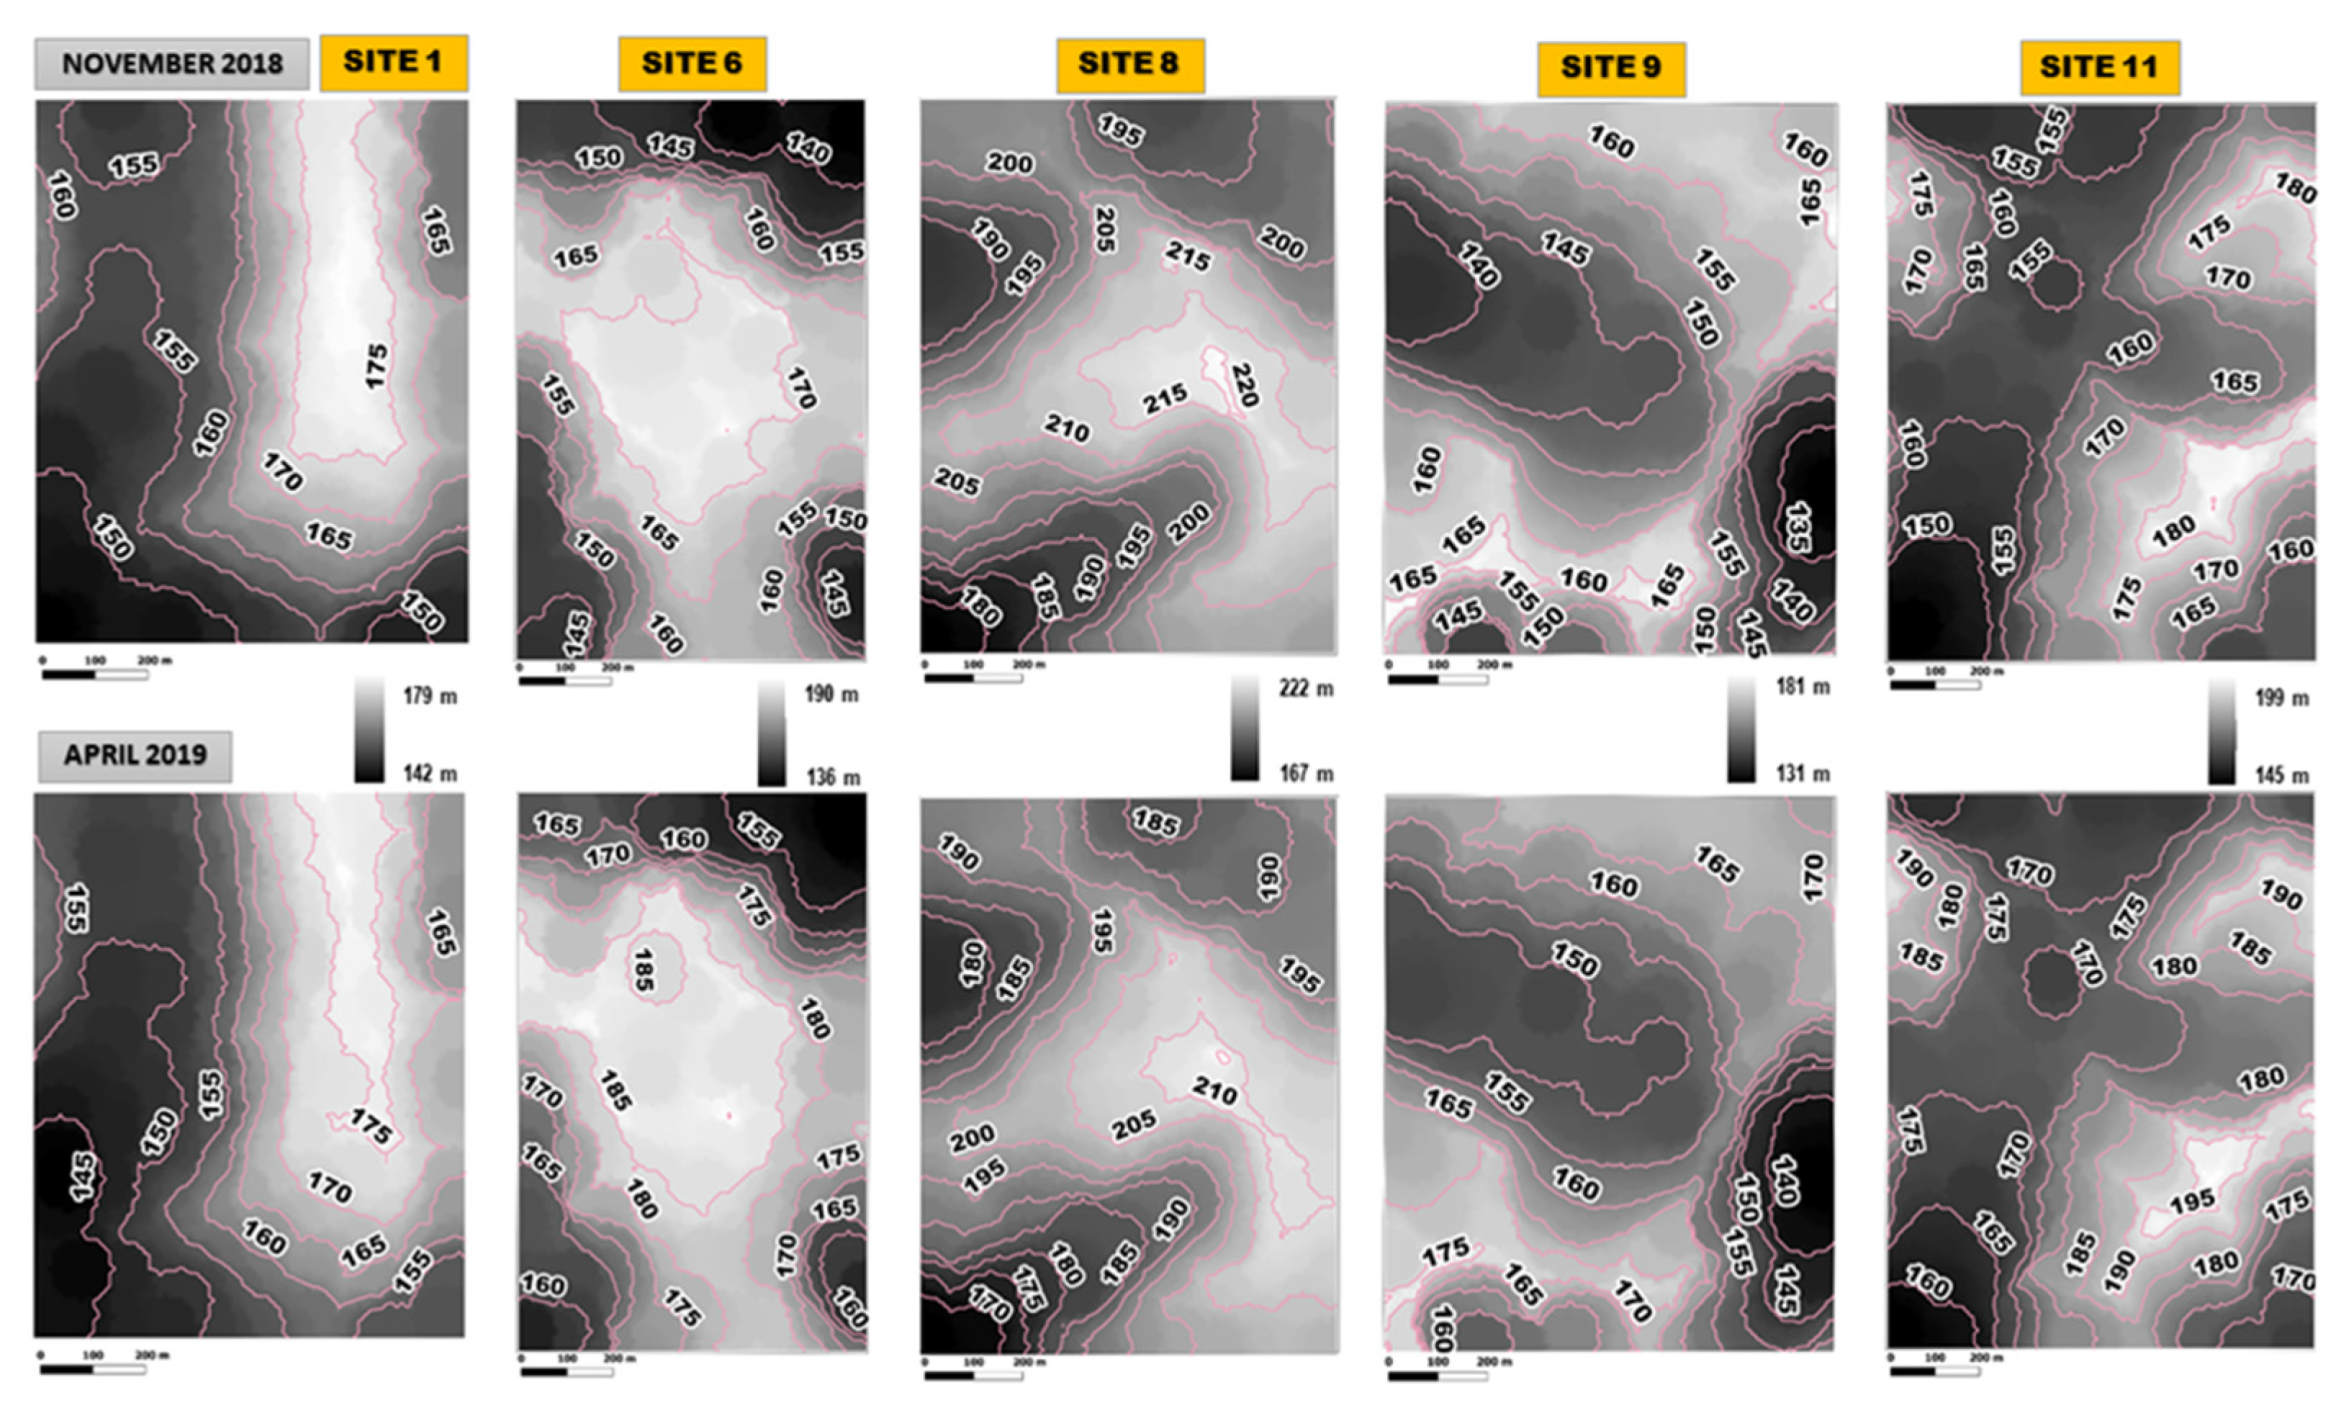
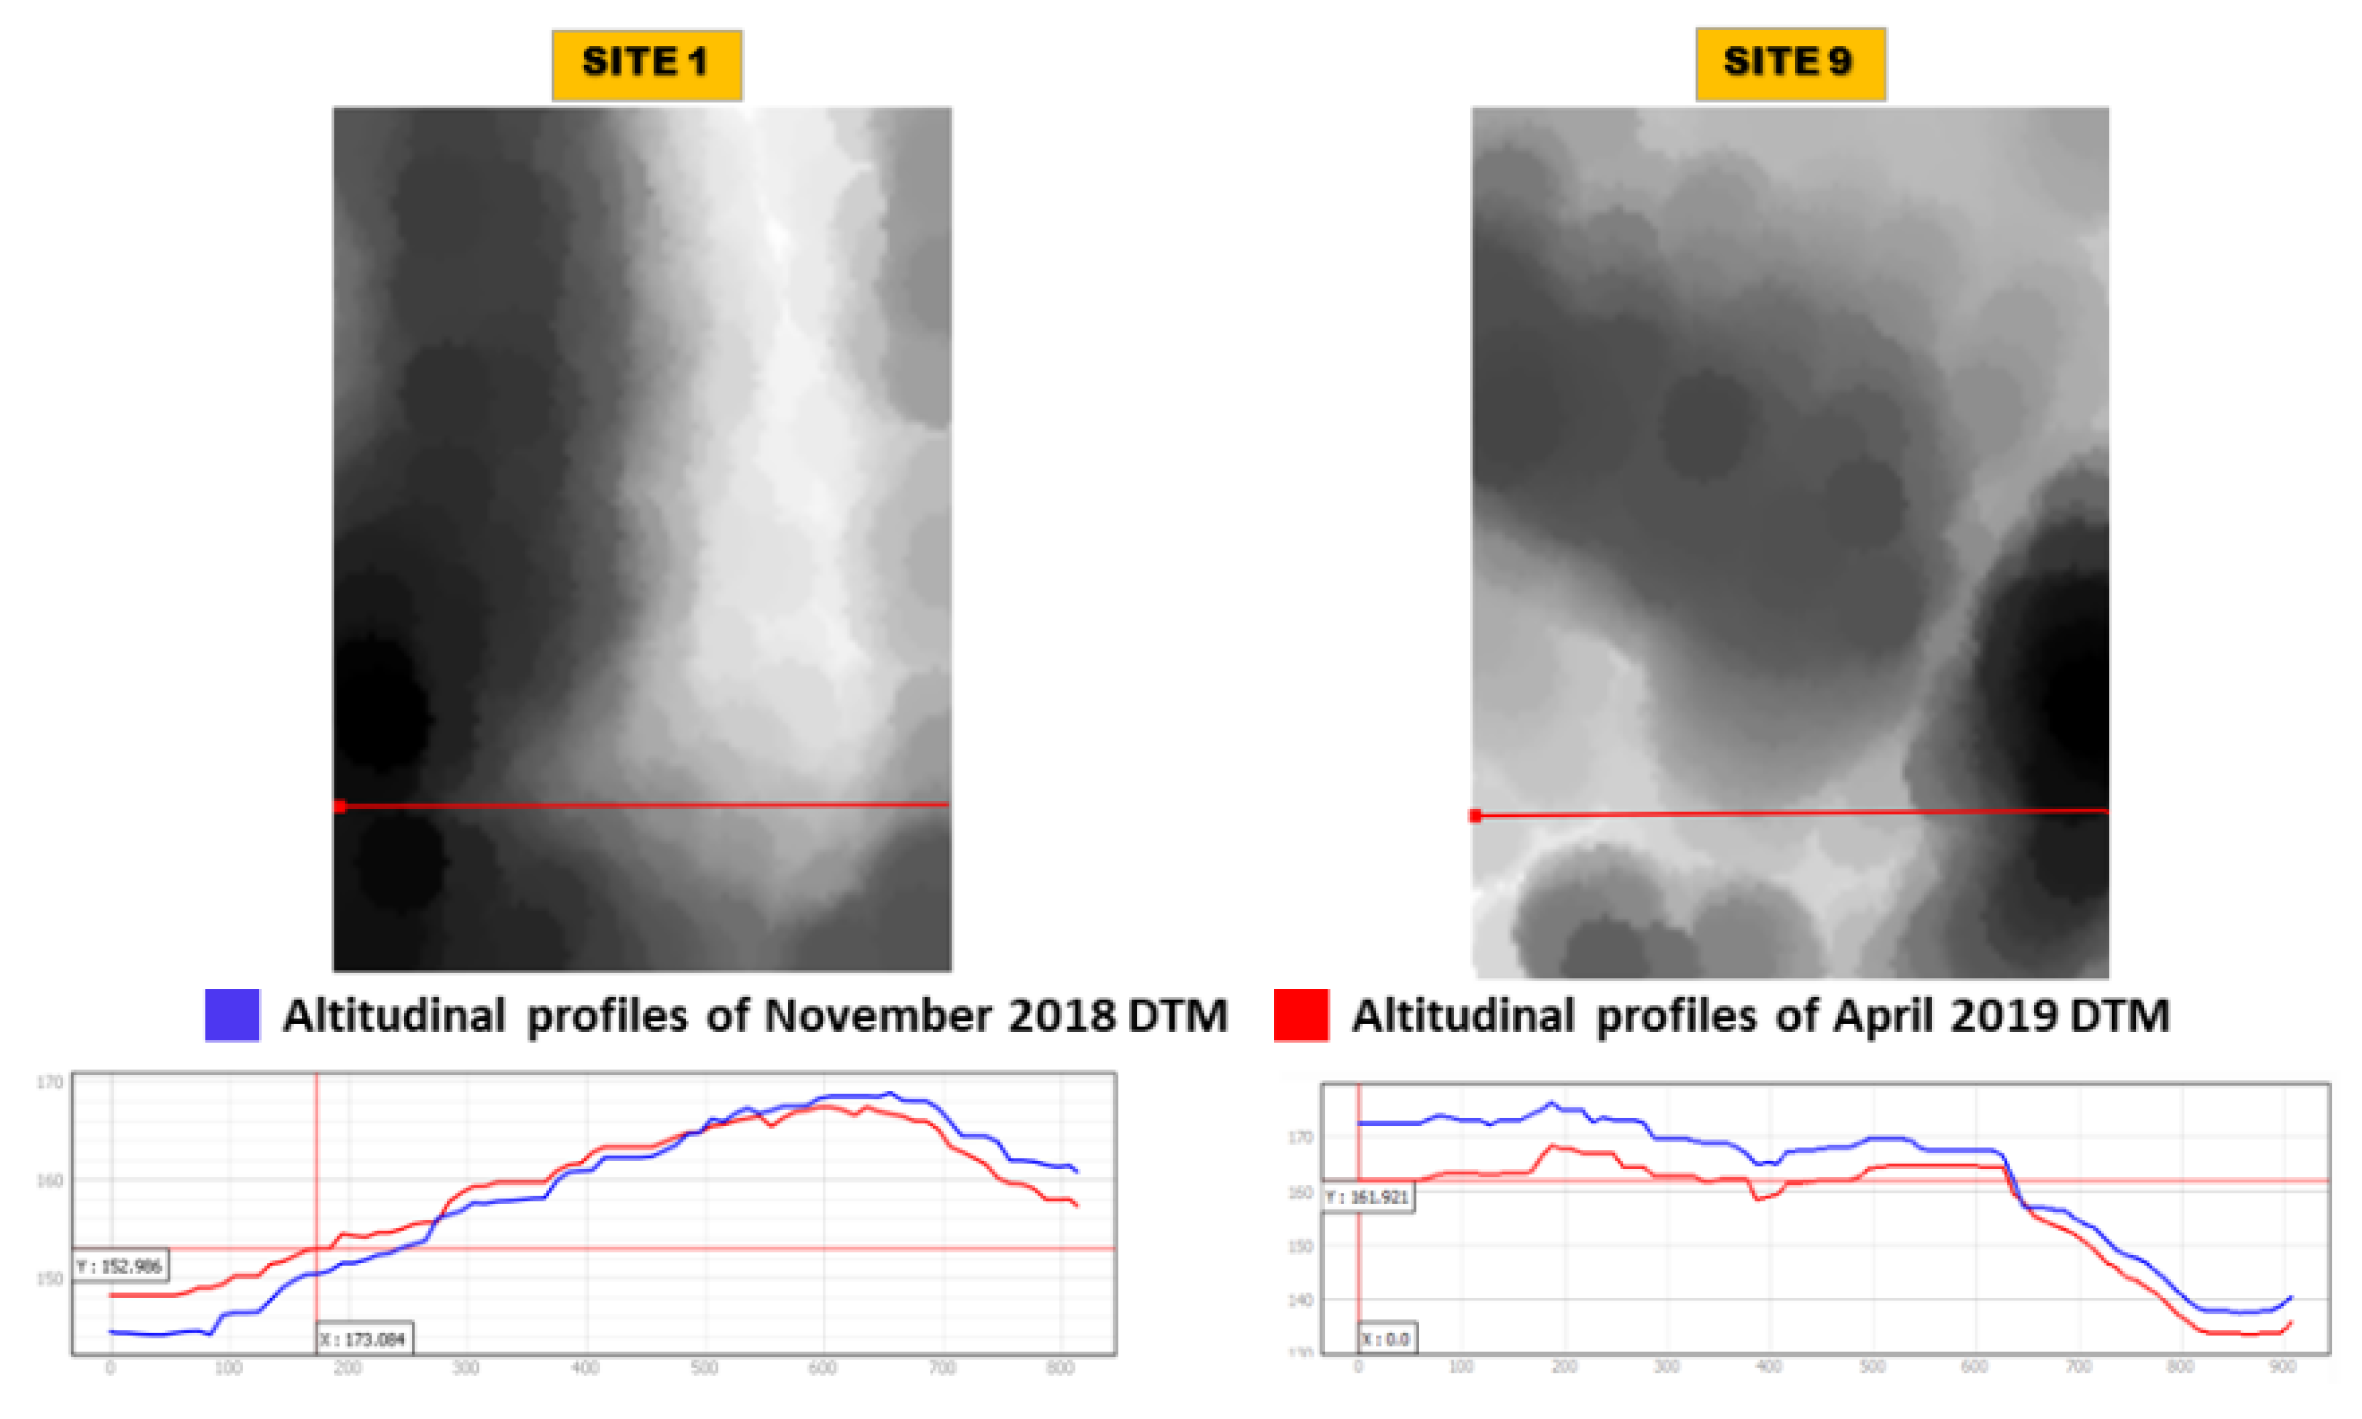
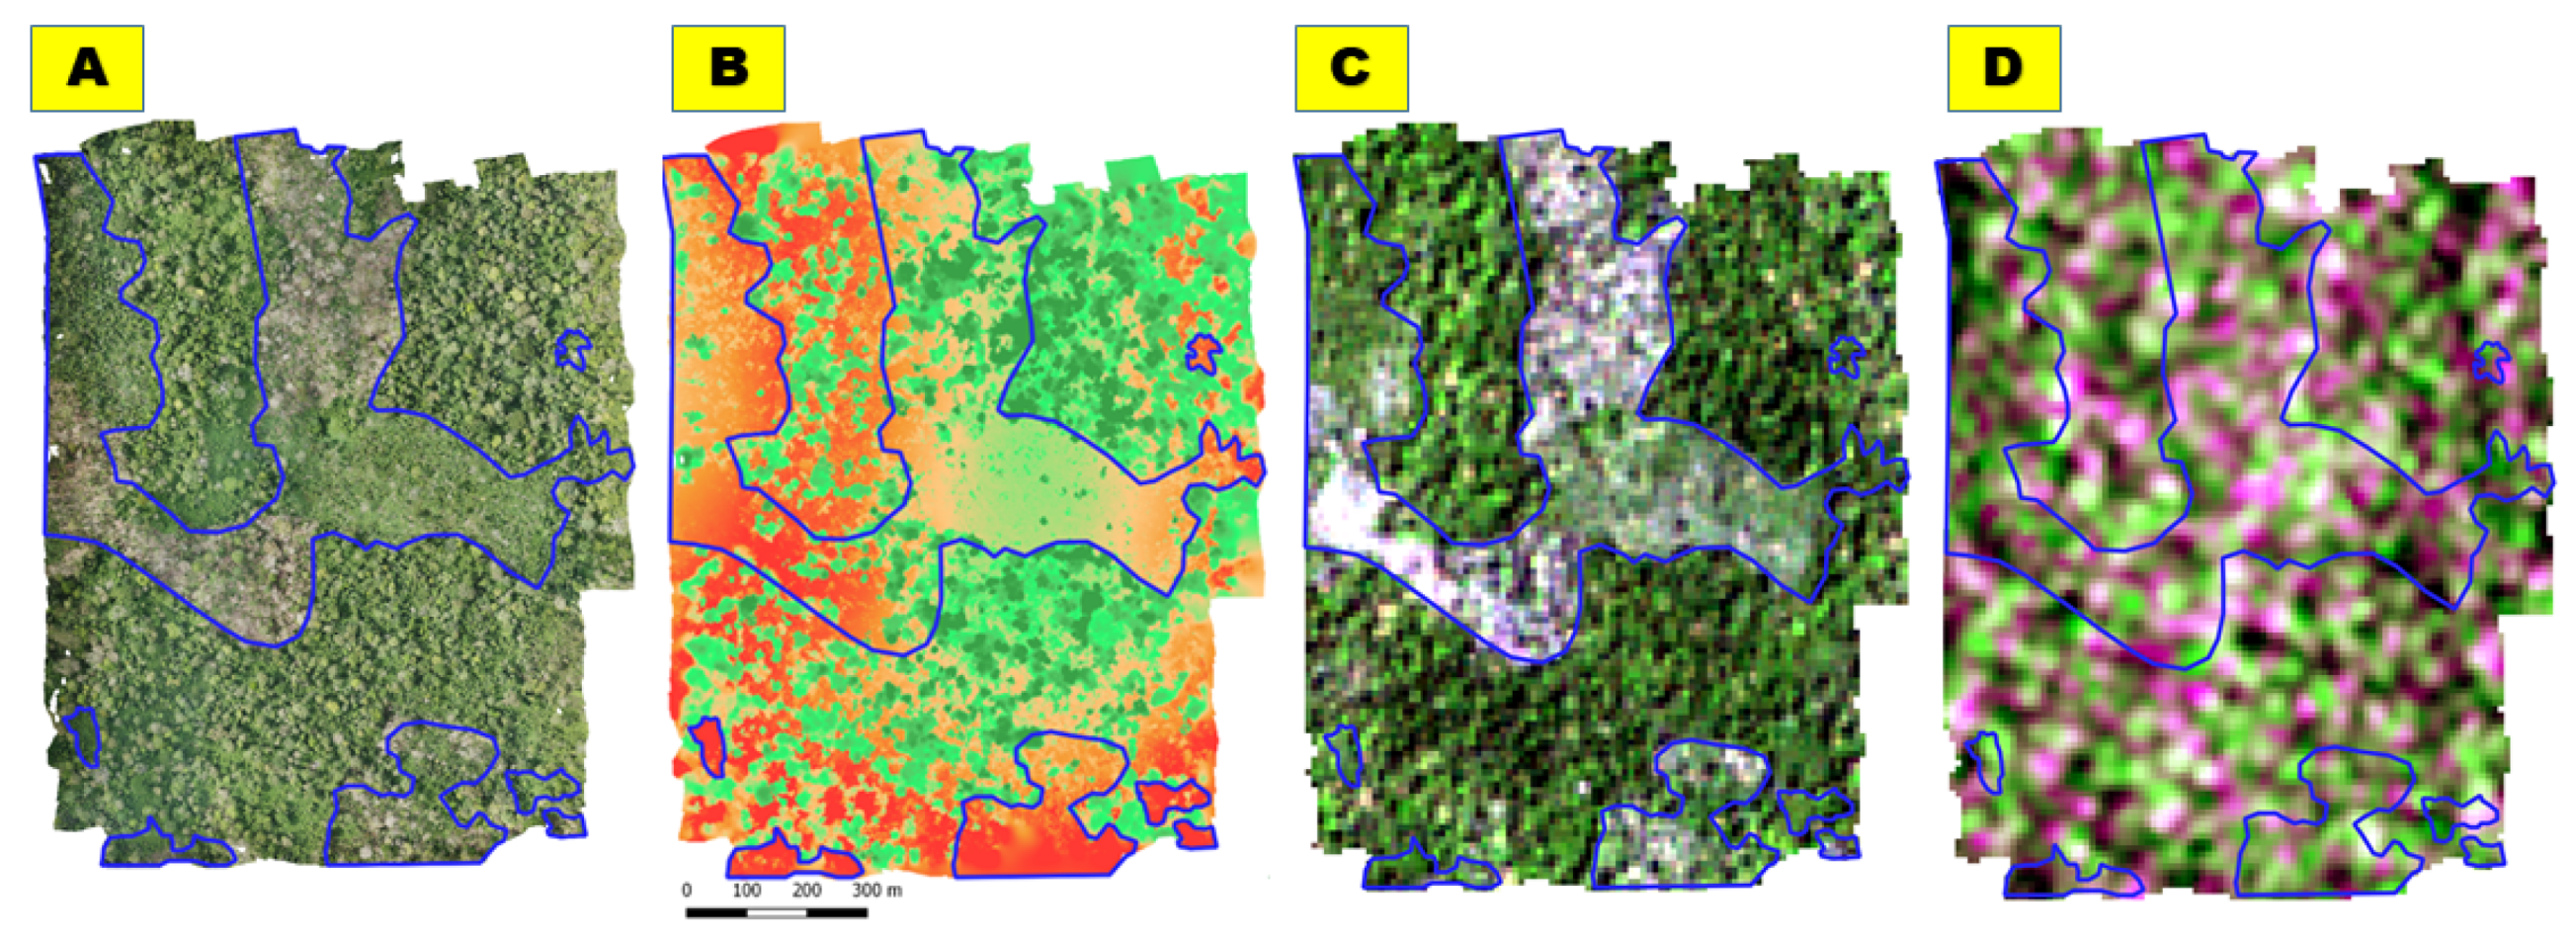
3.2. Orthomosaics, Digital Surface Models, and Digital Terrain Models

The orthomosaics obtained at each of the study sites after photogrammetric processing (Figure 8A) were exported from the Photoscan software with a spatial resolution of 6 cm/pixel. The digital surface models (Figure 8B,C) were exported with a resolution of 12 cm/pixel. Ecologically, these orthomosaics and DSMs provide information on the state of vegetation (degraded or not, heavily cleared or not, cultivated or not, etc.). At Site 1, elevations varying from 145 m to 227 m in November 2018 and from 142 m to 229 m in April 2019 show the anthropization of the forest landscape. This degradation of the forest landscape can be seen on orthomosaics through both blue and green areas corresponding to forest clearing and cultivation. These areas are more accentuated in the western and central parts of Site 1.
In Site 6, these clearings are more accentuated in the northeastern and southwestern areas. In Site 8, analysis shows that the forest is less degraded compared with other sites. Slight degradation is observed in the southeastern extremity of the site. Finally, Sites 9 and 11 are the most degraded sites with significant vegetation clearing.
The DTM (Figure 9) allows for a better appreciation of the topography. It indicates a topography that varies from 142 m to 179 m in Site 1 (87 ha), representing a difference in level of 37 m. In Site 6 (94 ha), the topography varies from 136 m to 190 m, representing a difference in level of 54 m. On Site 8 (97 ha), the topography varies from 167 m to 222 m, representing a difference in level of 55 m. On Site 9 (102 ha), the topography varies from 131 m to 181 m, representing a difference in level of 50 m. Finally, Site 11, with a surface area of 121 ha, has a topography varying from 145 m to 199 m, representing a difference in level of 54 m.
To ensure the quality of the digital terrain models, we compared the DTMs generated from the two different dates selected in the study. As an example, Figure 10 shows elevation profiles that show that the DTMs are comparable from one date to another. However, there is an error in z. Since we subsequently computed the digital elevation model from the DSM and DTM, the effect of this error is significantly mitigated [37].

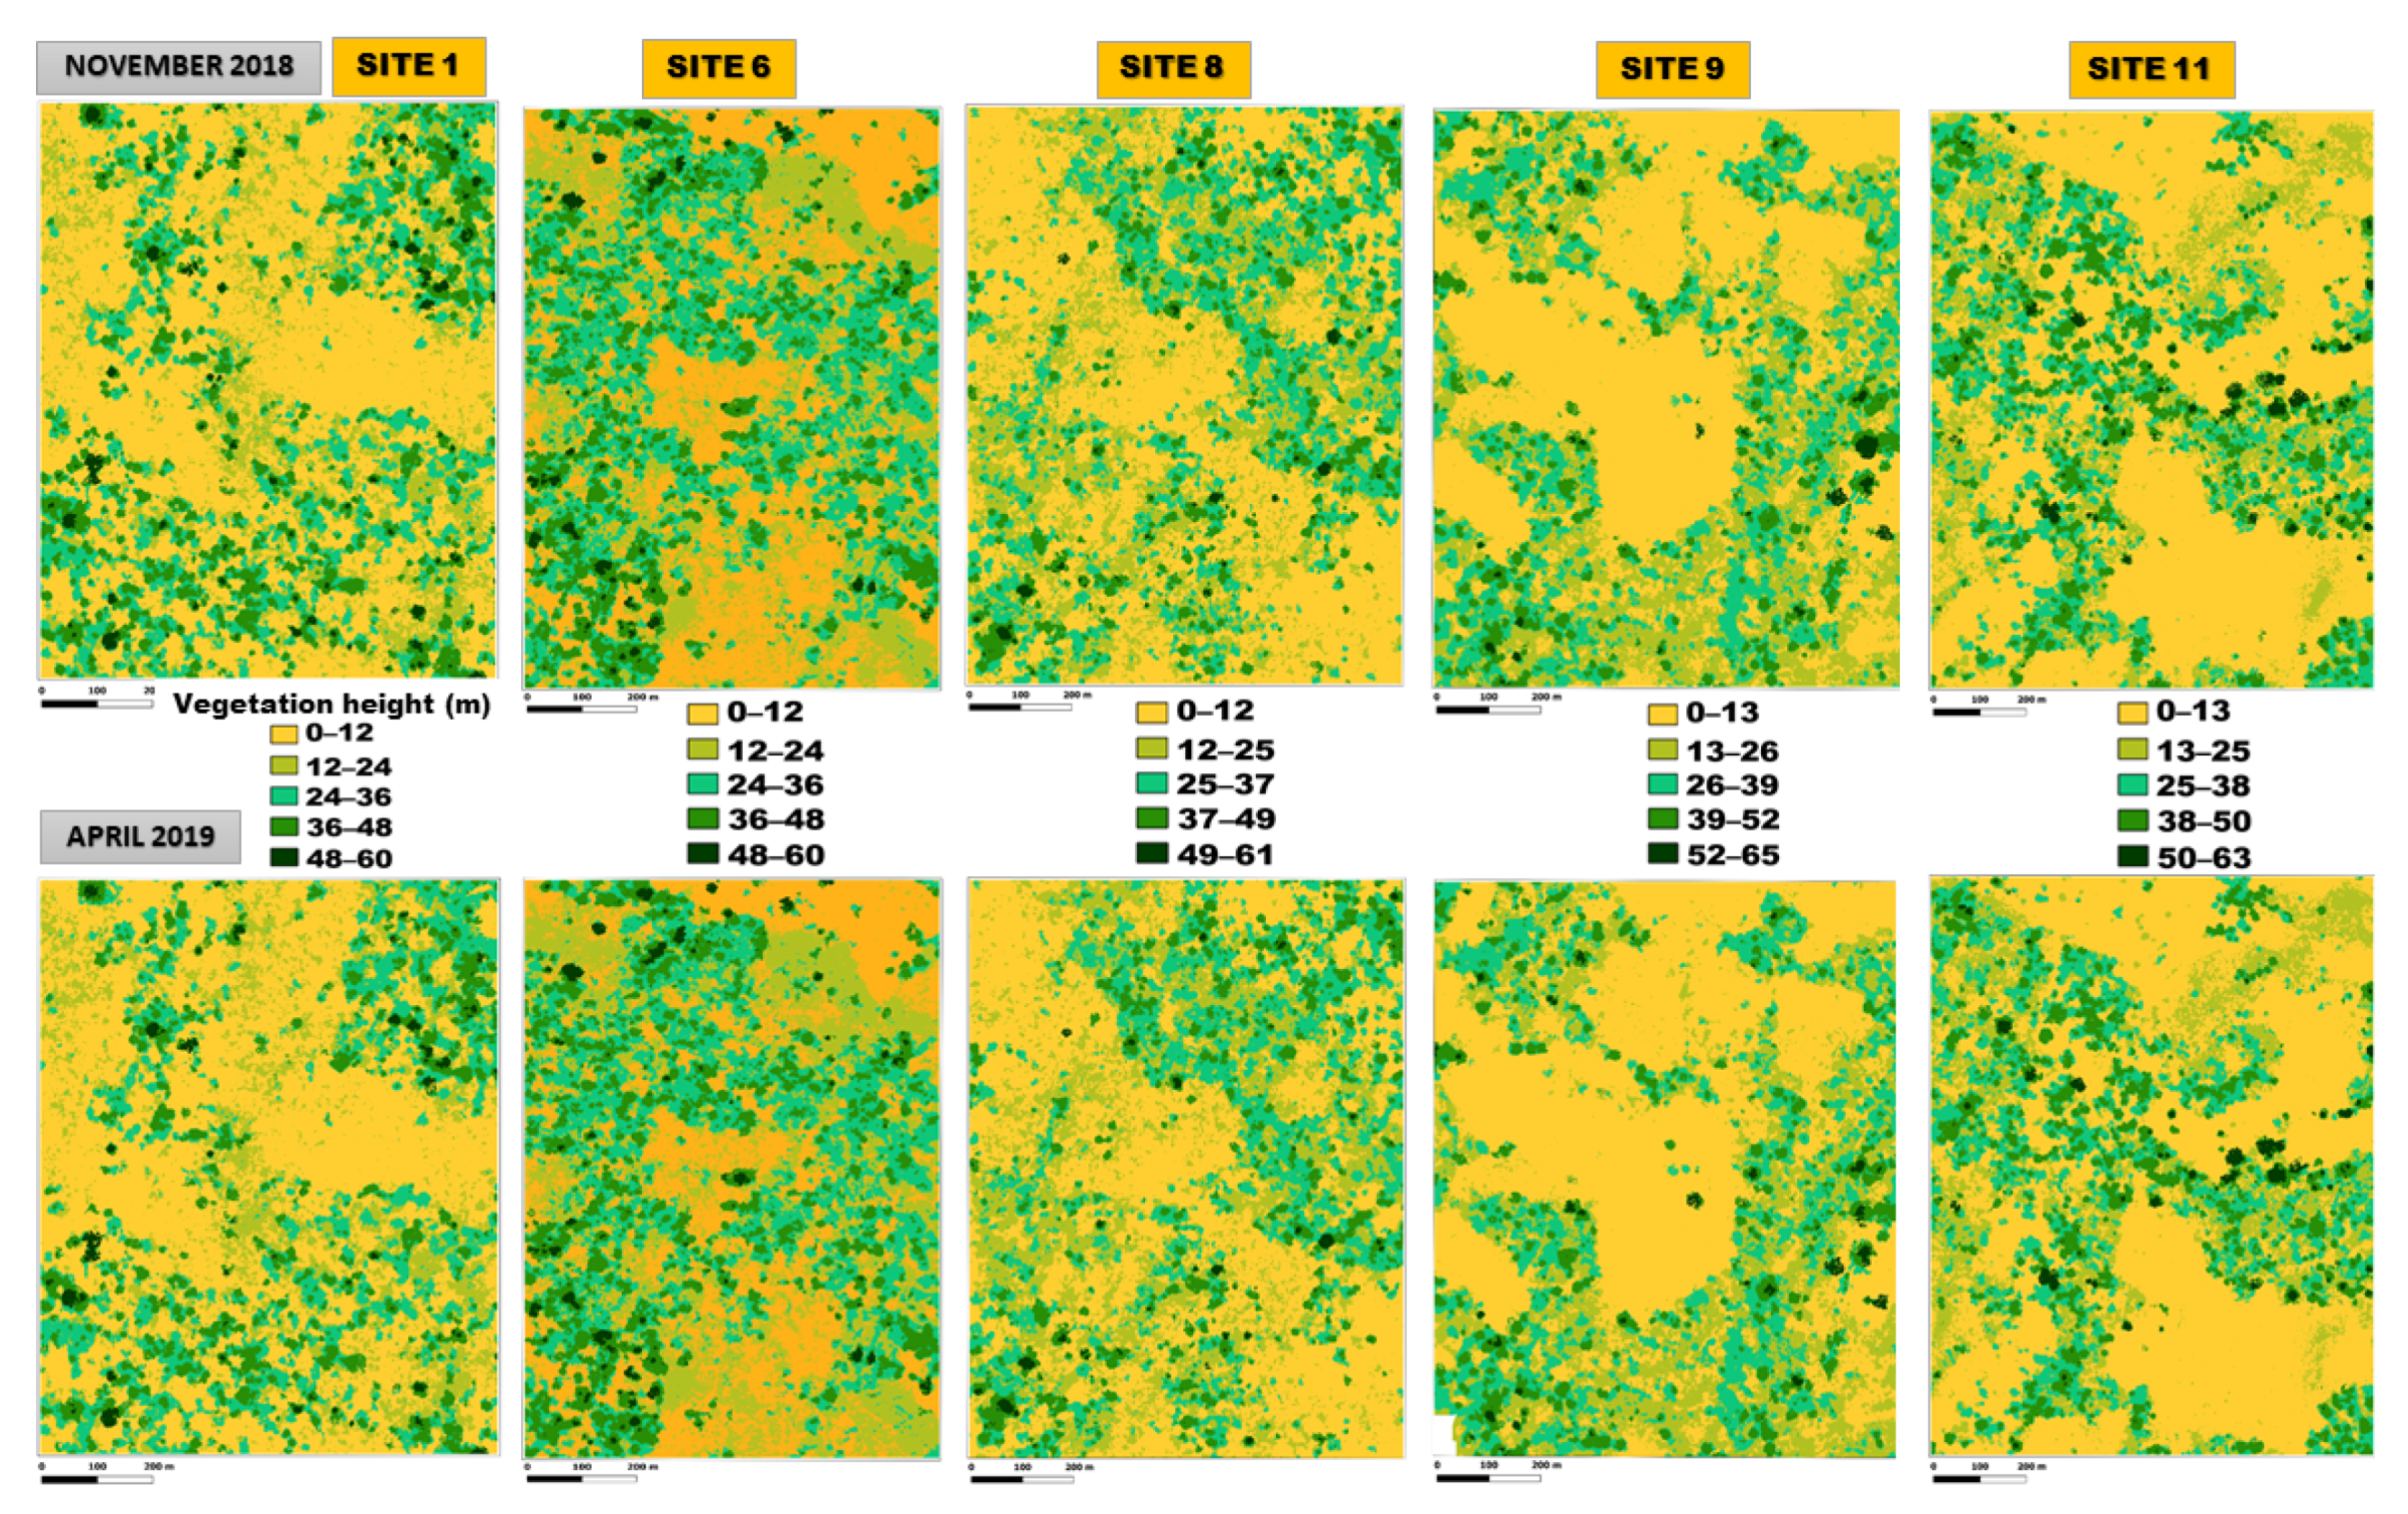
3.3. Distribution of Vegetation Heights

The distribution of vegetation heights represented by digital height models (DHM) reveals a maximum vegetation height of 65.06 m in November 2018 and 64.07 m in April 2019 for all the surveyed sites. The average vegetation height ranged from 16.72 m to 21.74 m in November 2018 and from 16.89 m to 22.15 m in April 2019 (Table 3). With an estimated height of 21.74 m in November 2018 and 22.15 m in April 2019, vegetation at Site 6 is the largest among all surveyed sites, as evidenced by the spatial distribution of vegetation heights (Figure 11). The histograms of vegetation height frequencies in November 2018 and April 2019 (Figure 12) generally show two peaks across all sites that reflect the presence of two types of vegetation: low vegetation with a height of less than 25 m and dominant vegetation with a height greater than 25 m. The low vegetation is made up of cocoa tree crops and grassy recrusts and natural regeneration. The dominant vegetation corresponds to all the trees constituting the forest. However, a third peak observed in April 2019 could signal the start of a weed control operation in April 2019.

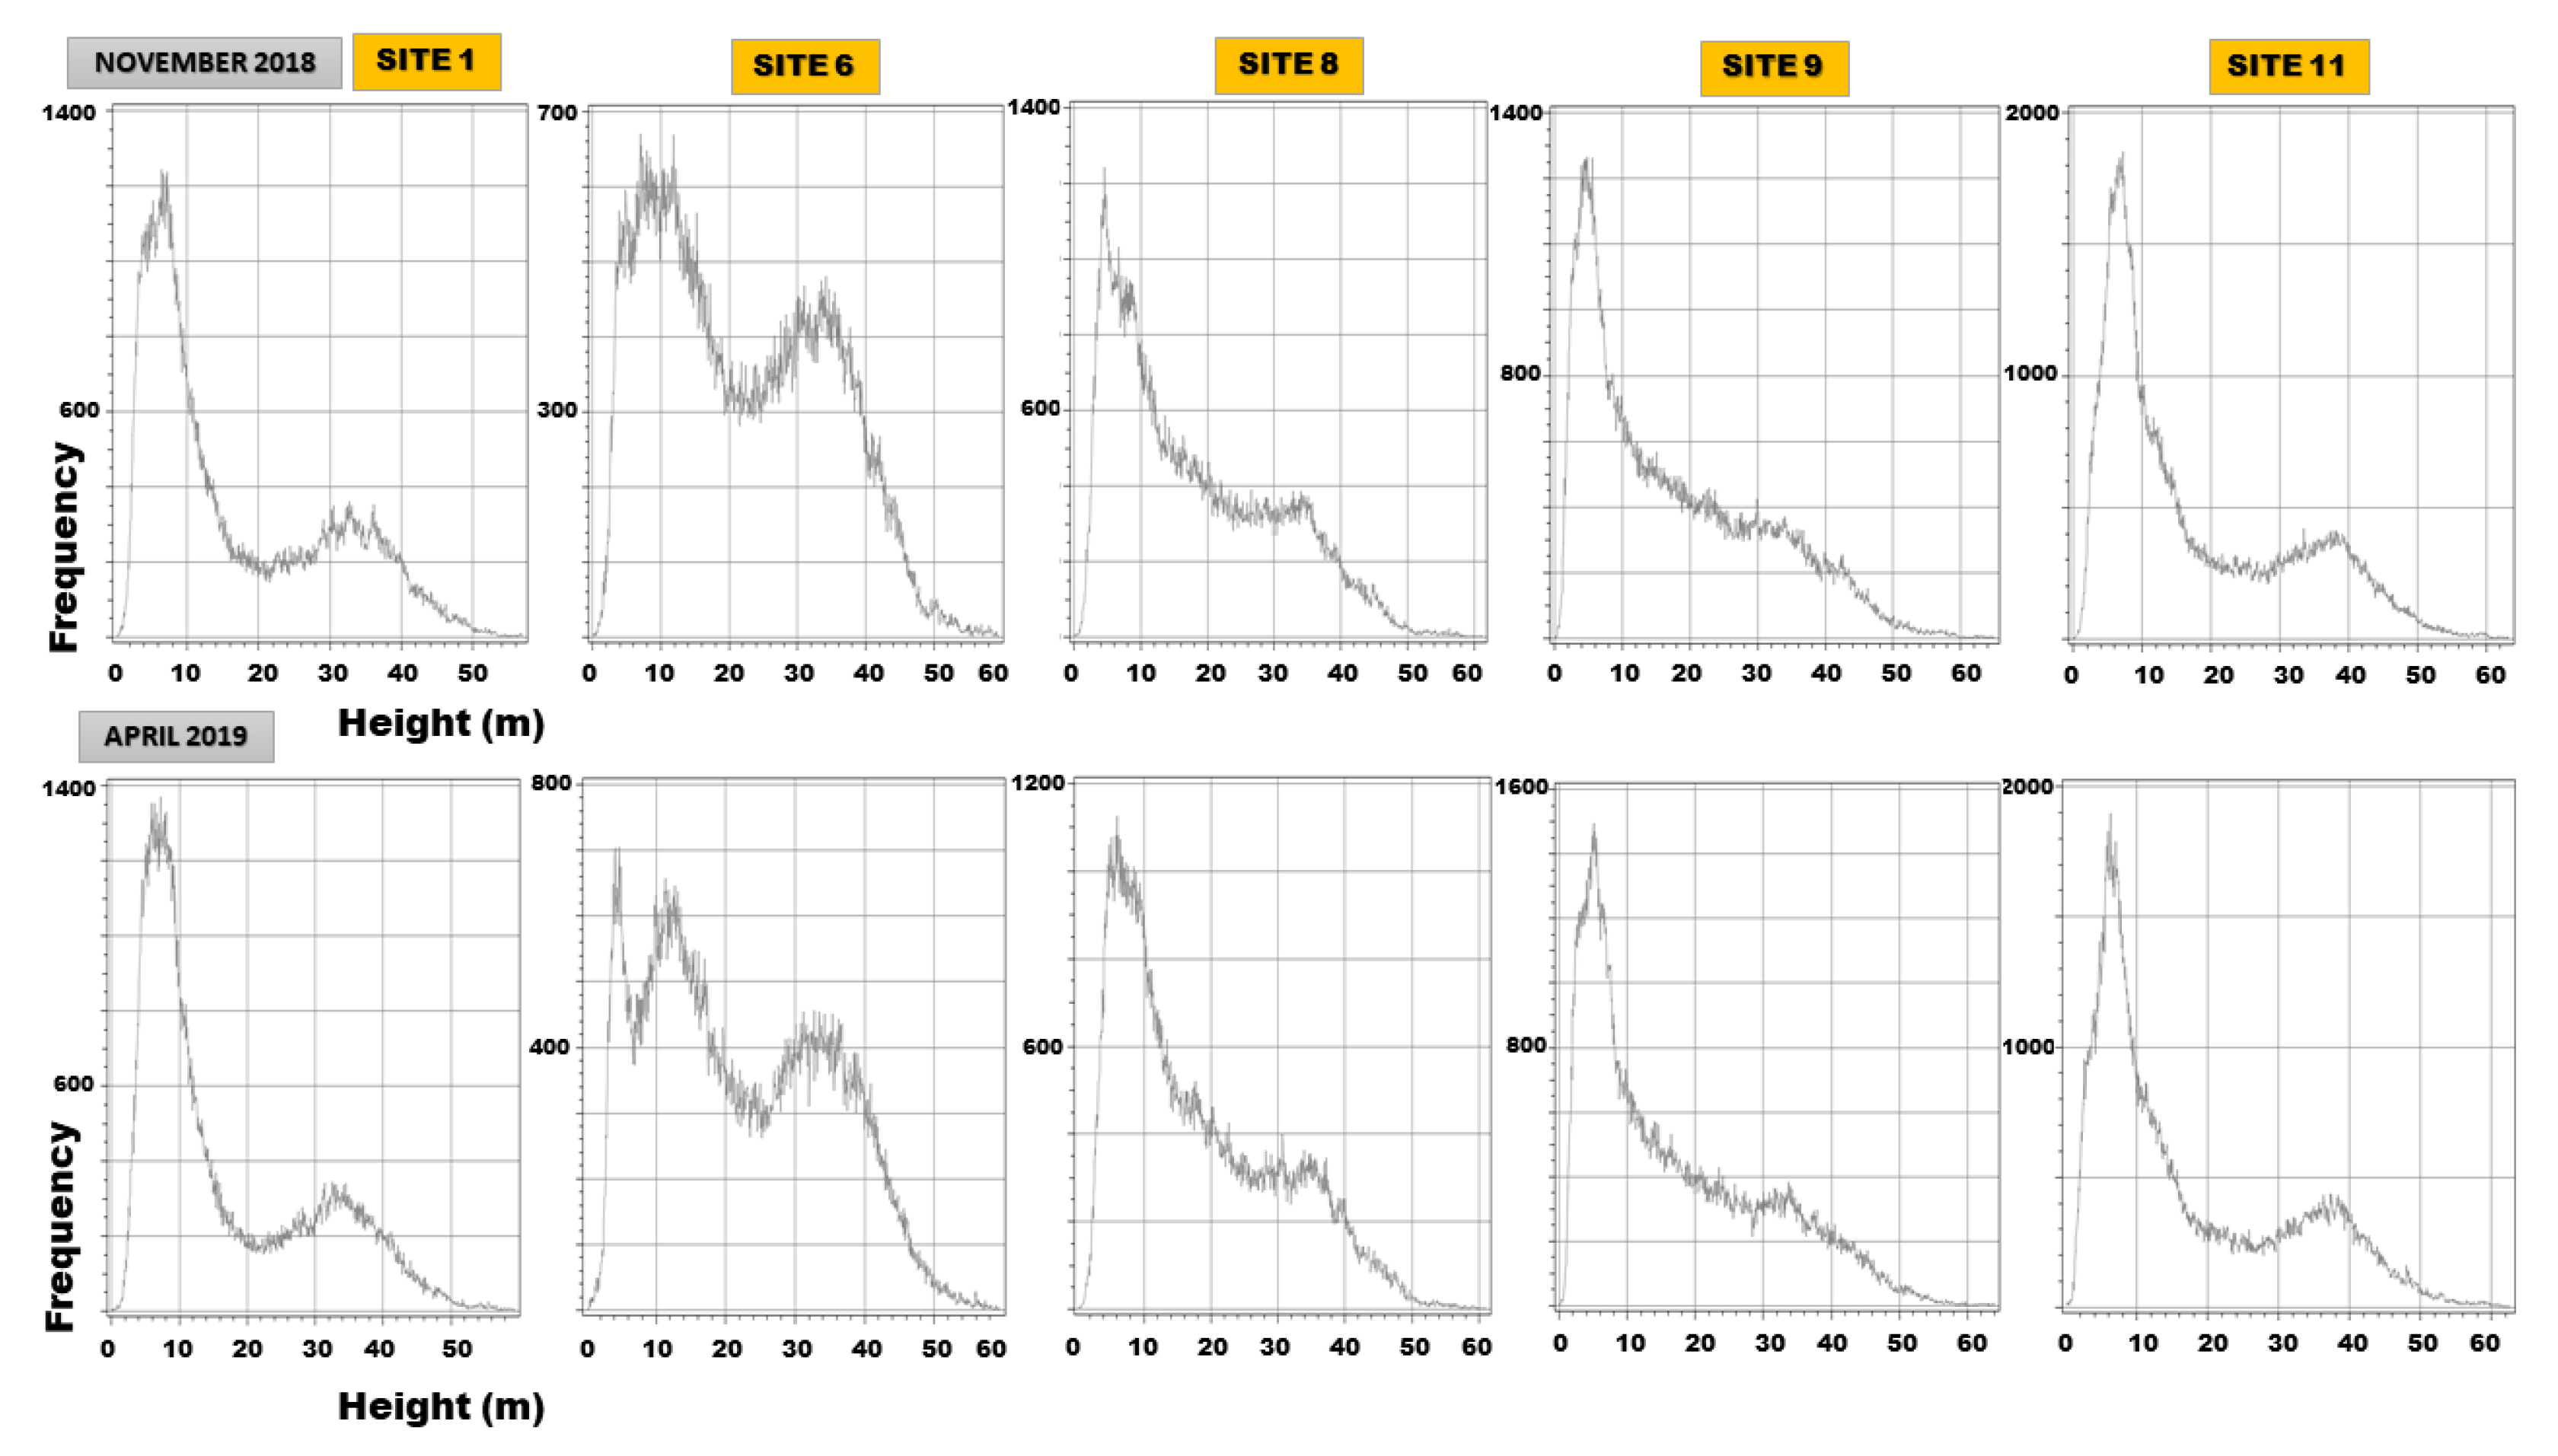
3.4. Distribution of Tree Heights

The trees here correspond to vegetation with a minimum height of 25 m. Thus, the distribution of tree heights (Table 4) shows that the maximum height of trees across all sites is 65.06 m in November 2018 and 64.07 m in April 2019. The trees have an average height that ranges from 34.29 m to 37.00 m in November 2018 and from 34.63 m to 36.88 m in April 2019. The tallest trees are over 35 m tall and are found in Sites 9 and 11.

3.5. Tree Crown Area

A total of 124 tree crown trimming polygons were delineated (Figure 13). Tree crown area values ranged from 7 m2 to 838 m2, with an average of 152 m2 across the study sites (Table 5). This average tree crown size corresponds approximately to the pixel size of a Sentinel sensor at a 10 m spatial resolution.

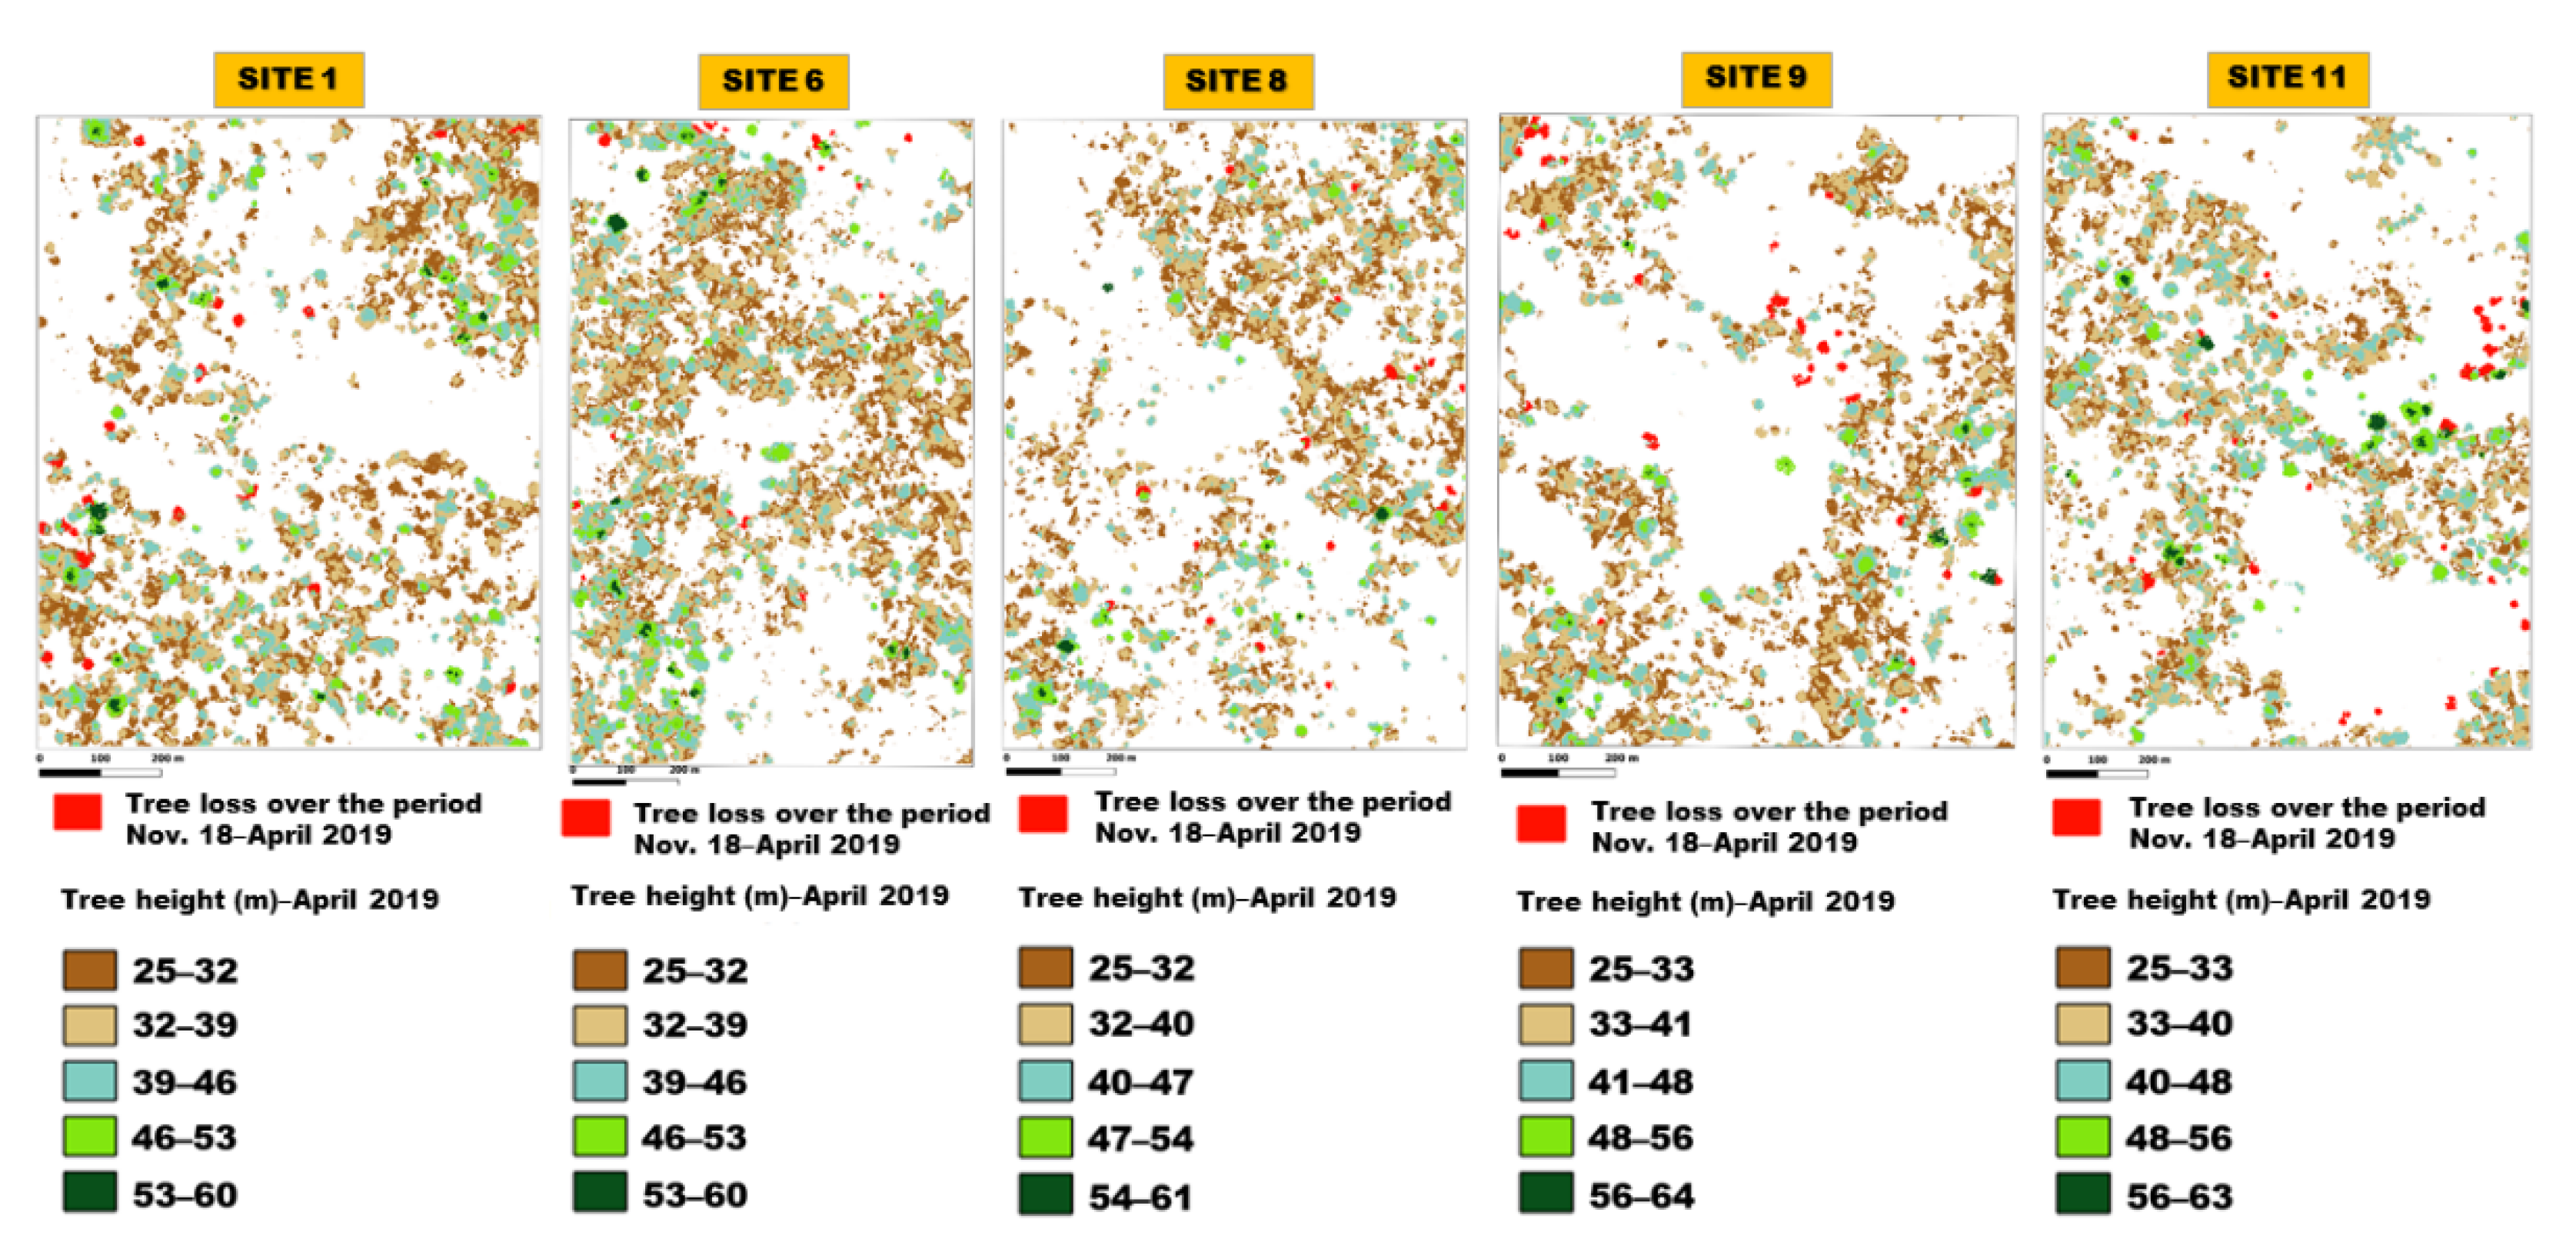
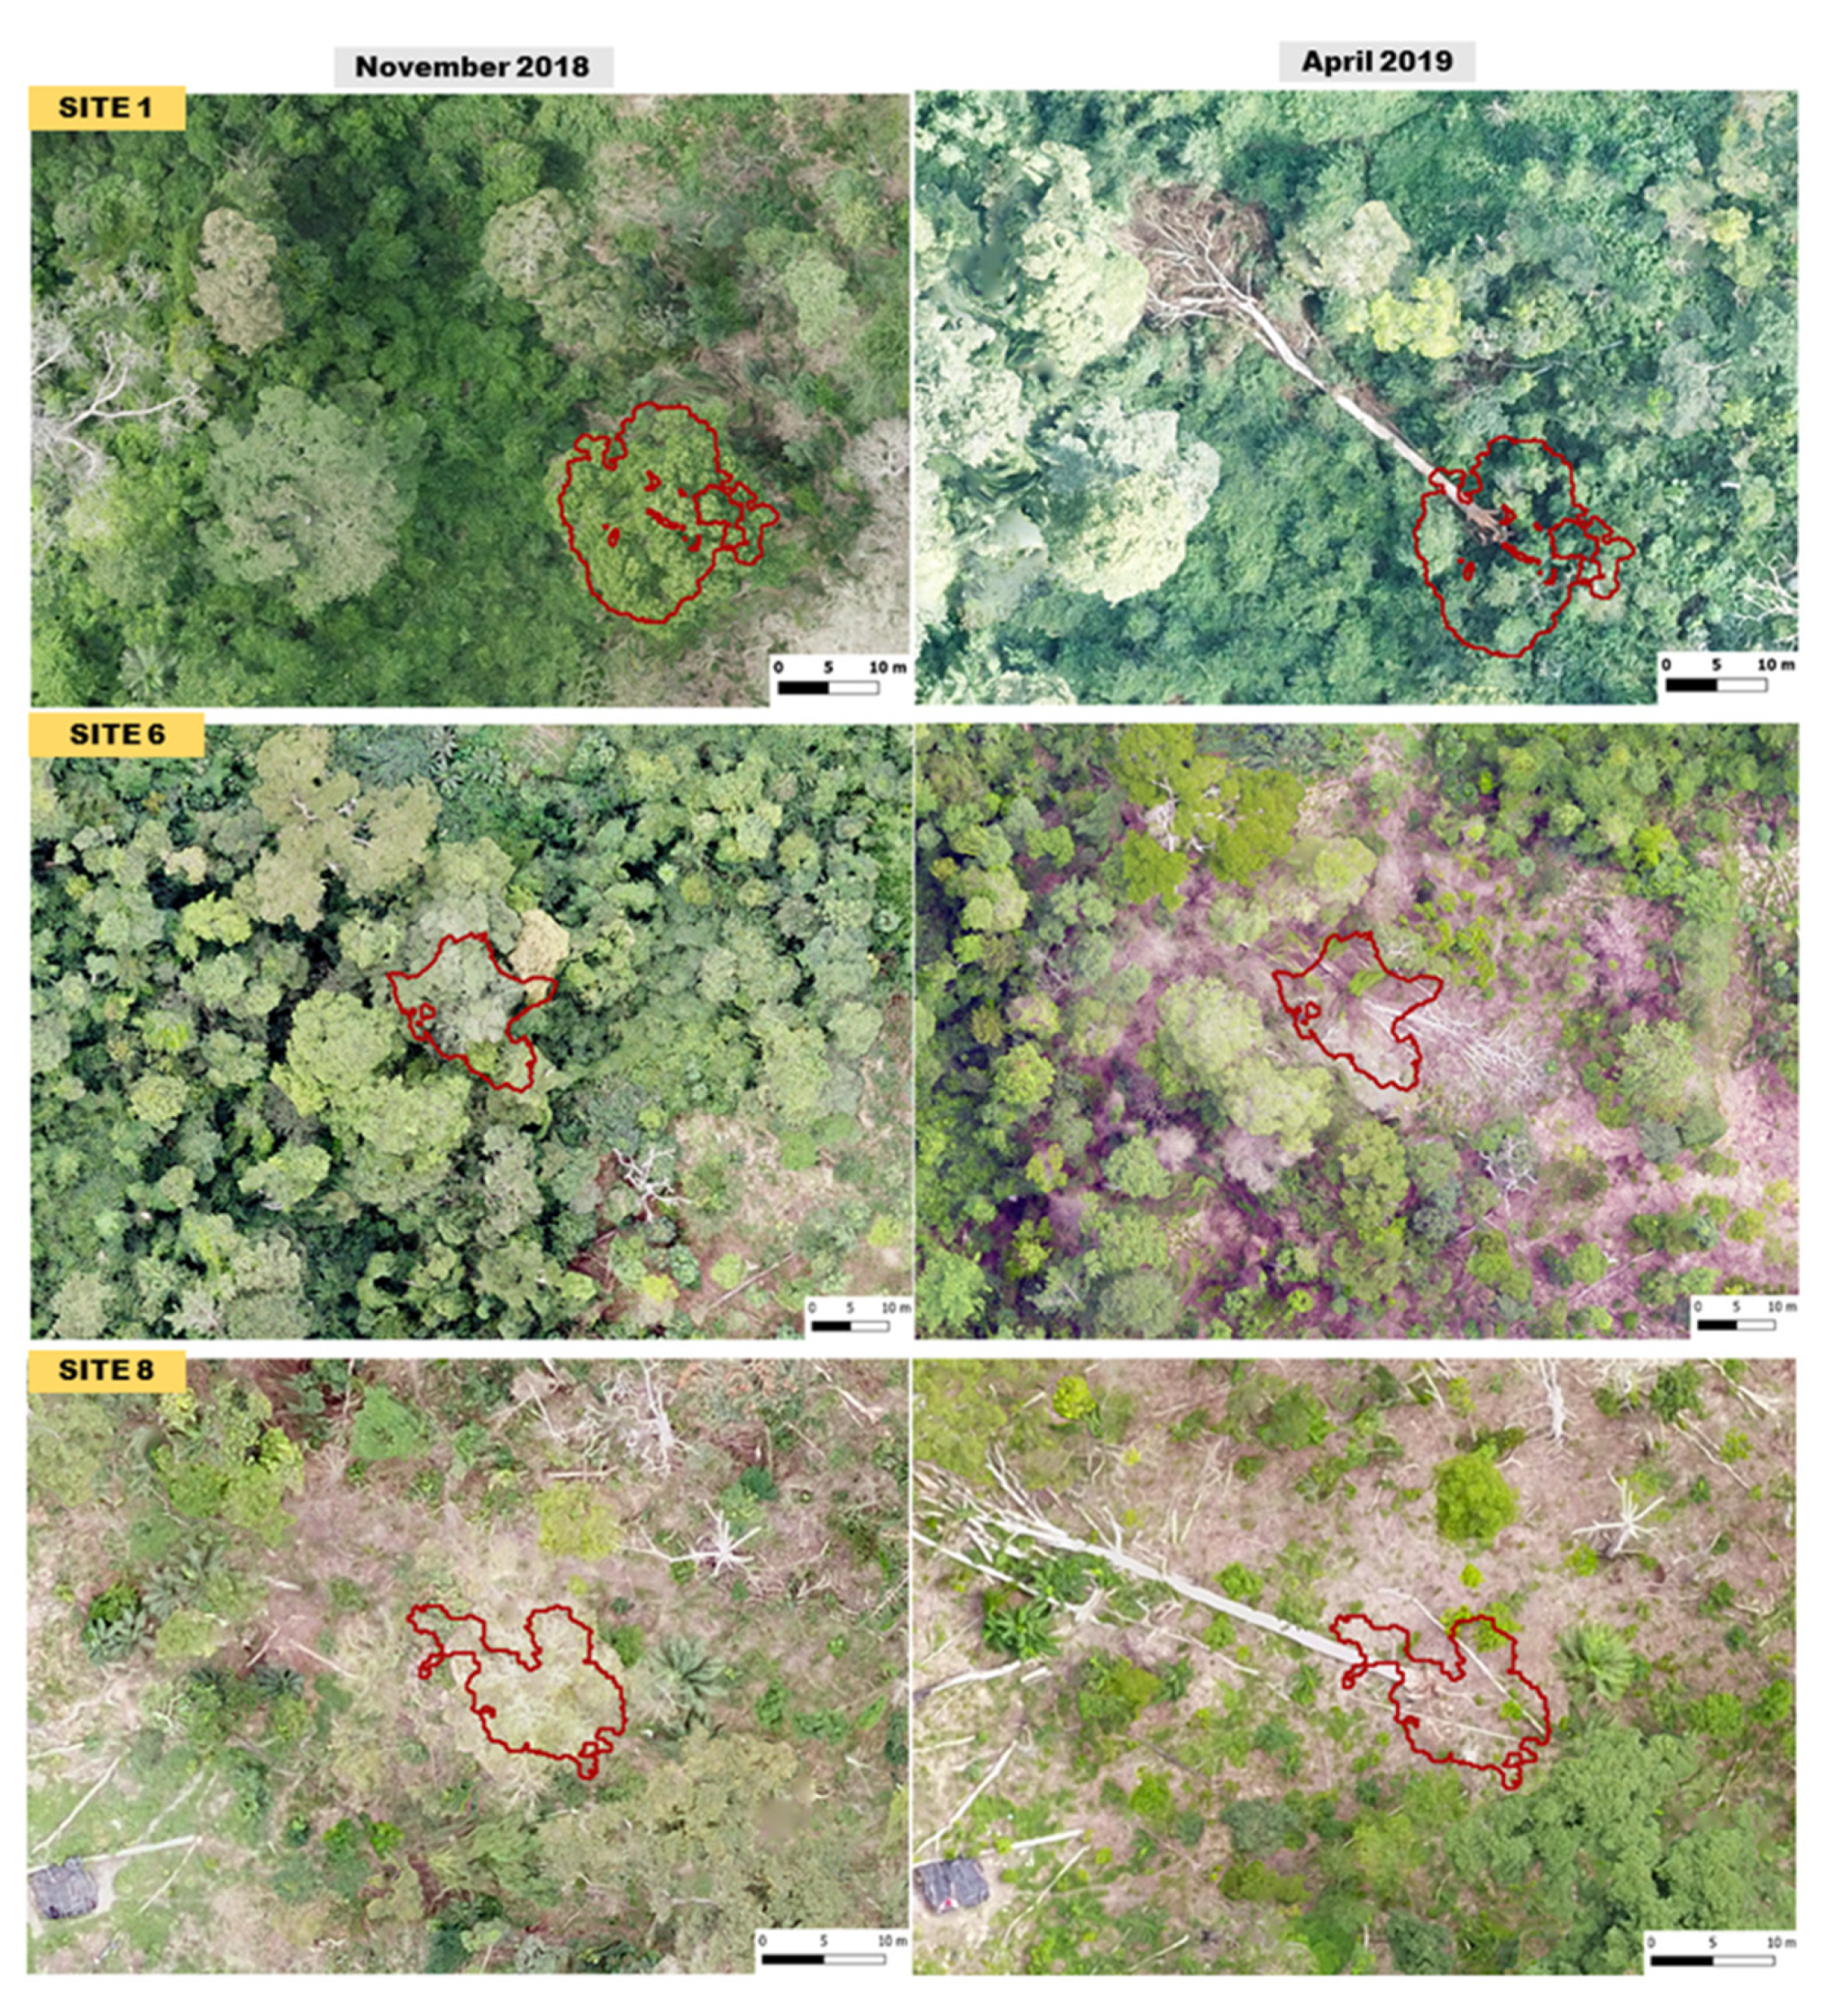
3.6. Detection of Tree Losses by Difference in Vegetation Heights

Tree loss detection is performed based on the difference in vegetation heights (Delta DHM) between November 2018 and April 2019, the minimum tree height (25 m), and the average tree crown area (152 m2). Negative values represent tree losses that correspond to new clearing or tree burning (Figure 14). The identification of tree losses is illustrated on Figure 15. At Site 1, there are a minimum of 19 tree losses associated with an area of 0.4 ha between November 2018 and April 2019. At Site 6, there are a minimum of 16 tree losses associated with an area of 0.2 ha. At Site 8, there are a minimum of 17 tree losses associated with an area of 0.3 ha. At Site 9, there are a minimum of 28 tree losses associated with an area of 0.5 ha. As for Site 11, there are at least 27 tree losses associated with an area of 0.6 ha.

3.7. Quality Assessment of Maps

The quality assessment of all the maps reveals that the overall accuracy (OA) is 97% and the kappa index is 0.95 (Table 6). The user accuracies are estimated at 93% for tree loss, 98% for stable forest, and 99% for stable nonforest. Producer accuracies are estimated at 98% for tree loss, 97% for stable forest, and 97% for stable nonforest.

4. Discussion

4.1. Clearing Timing in Classified Forests and Data Acquisition Strategy

Knowledge of the clearing process in classified forest was necessary for a good spatiotemporal distribution of the drone acquisition campaigns (Figure 16). Clearing is progressive and discrete and is characterized by an anthropic cocoa farming process that can be subdivided into four (4) stages.
From May to August: illegal farmers either broadcast cocoa beans into the forest understory or directly remove the forest understory before direct seeding of beans under the canopy. The first approach is becoming more and more prevalent in the Bossématié classified forest because it is almost impossible to notice the presence of cocoa crops at this stage, whereas in the second case, the ecoguards quickly identify the presence of illegal activities.
From August to September: Once the seedlings appear (2 to 3 months later), they proceed to cut down the undergrowth, leaving the cocoa crop in sight. During this phase, which takes place during the short dry season, the seedlings are maintained. Until then, it is impossible to detect such a disturbance via optical remote sensing (this is the beginning of forest degradation).
From September to October: As the rains pick up again, illegal farmers replace dead cocoa plants with new seedlings and increase the area of their fields.
November to April: Illegal farmers set fire to the base of large trees to cause their death; this is the beginning of tree losses. During this phase which last all along the dry season, it becomes possible to detect such disturbances via optical remote sensing. The trees first lose their foliage, allowing a good amount of light to penetrate for crop growth, before falling (windfall) under the effect of the wind or being cut down with a chainsaw. The resulting cleared areas are usually considerable with a significant loss of biodiversity. It is therefore during this period that overflights must be intensified to detect the burning of the first standing trees and to alert the public to send deterrent patrols.

4.2. Quality of Photogrammetric Models and Maps

The use of the Mavic Pro drone allowed us to map the dynamics of clearings in the Bossématié classified forest on test sites following a methodology already proven in several past studies [28,32,38]. The results of the photogrammetric processing demonstrate that the selected flight altitude and image overlap levels avoid the difficulties very often encountered in the aerial image mosaicking phase, especially in forest areas [26,28]. The quality of the orthomosaics and of the selected digital surface models (reprojection errors between 0.551 pixels and 0.813 pixels) is sufficient to assess the changes in the forest surface with good accuracy. Indeed, refs. [19,39] have shown that errors of 1 to 2 pixels are acceptable. These systematic errors in orthomosaics and digital surface models originate from the instability of the mini-UAVs and the distortion of the digital cameras used [40]. However, image overlap levels in this study (65% and 75%, frontal and lateral) could be increased to improve the quality of orthomosaics. Indeed, several studies show high levels of overlap, such as [28] (90% front overlap), [32] (80% front overlap), and [41] (90% front overlap).
In terms of the production of the set of maps of tree height distribution (April 2019) and tree loss (November 2018–April 2019) in the Bossématié classified forest, the validation reveals an overall accuracy of 97% and a kappa coefficient of 0.95. This indicates that these maps have satisfactory quality levels [42]. This shows the effectiveness of the method used in the detection of losses using aerial images acquired by drone.

4.3. Advantages and Methodological Limitations

In terms of the choice of drone, the small size of the drone used (19.9 cm × 8.3 cm × 8.3 cm) allowed us to transport and launch it from any location in the forest while avoiding trees. Compared with other acquisition platforms, such as satellites or airplanes, the drone used allowed us to acquire images at a higher resolution with a lower operating cost [43]. Although the drone can be affected by cloud cover or fog like other optical sensors, it offered us the flexibility to avoid these. However, the main limitation with the drone used is the size of the area to be covered. Indeed, although, in most cases, the forest areas to be covered easily exceed 1 km2 (i.e., 100 ha), it should be noted that the flight capacity of a multirotor drone rarely exceeds 1 to 2 h of flight. This flight endurance being the greatest limiting factor for forestry use, we must accept that the use of a drone will remain a tool for analysis at the local scale only [16].
In terms of tree crown delineation, this method could be tedious due to manual delineation. Given the number of trees in a forest, this is probably not a viable solution for a national-scale forest preservation project.
In terms of geometric correction of the digital surface models, we propose frame-to-frame georeferencing to reduce errors. The accuracy of the photogrammetric data could have been improved by using ground control points [41].

4.4. Drone versus Sentinel Sensors and Perspectives

The Sentinel-1 and 2 satellite constellations in operation provide multispectral imagery at a very high spatial resolution of 10 m. This opens new possibilities for the mapping and multiple annual monitoring of land use and land cover [12,44]. As shown in Figure 17, these individual sensors may have different potentials for monitoring forest ecosystems. Sentinel-1 radar images do not offer the possibility to distinguish clearings in the middle of a tropical forest, as the radar signal is saturated. Sentinel-2 images can be used to monitor large areas of forest clearing, but their quality is dependent on cloud cover, which is almost always present in tropical forests. Aerial images acquired by drone have strong potential for monitoring forest disturbances. The combination of these three systems should be used in the estimation of forest degradation activities in the reducing emissions from deforestation and forest degradation (REDD+) project.
The drone-based approach discussed in this study can be improved by integrating Lidar solutions and solutions related to the new generation of planet satellites. Indeed, despite the constraints related to cloud cover, the daily revisit rate of planet microsatellites allows us to obtain cloud-free mosaics with a spatial resolution of 3 m to 5 m [45]. The use of planet images would allow for the refinement of forest disturbance early detection using drone data. Lidar solutions should be tested for the early detection of forest understory loss [46]. This is a major limitation of current remote sensing tools and methods to detect cocoa plots under shade. This would allow for intervention on the ground in the early stages of illegal clearings by cocoa farmers infiltrating classified forests and protected areas. The technologies mentioned above would allow Côte d’Ivoire to have innovative tools adapted to its agroforestry context and for the implementation of its current ambitious sustainable development objectives.

5. Conclusions

This study aimed at the early detection of tree losses in the forests of Côte d’Ivoire using aerial photographs taken by drones. The methodological approach was based on the use of aerial images acquired by drones (spatial resolution 6 to 12 cm) to assess tree losses in the classified forest of Bossématié. The choice of this classified forest is justified by the low annual deforestation rate recorded between 2016 and 2019, which is estimated at 0.35%. This approach allowed us to evaluate tree losses in this relatively well-preserved classified forest subjected to strong anthropic pressures with satisfactory accuracy. Indeed, it allowed for the detection of a minimum of 107 tree losses corresponding to a clearing area of 2 ha on all sites studied in the classified forest of Bossématié during the period from November 2018 to April 2019 with a satisfactory overall accuracy of 97%. Therefore, this study shows the interest in using drones in the management and monitoring of classified forests and protected areas in Côte d’Ivoire. The drone is therefore a precise tool whose capabilities are constantly improving. In addition to its proven value in terms of early detection of the first standing tree burns, regular drone overflights are also proving to be a strong deterrent to cocoa farmers infiltrating protected forests, who realize that the forest is under close surveillance.
The results of this work must be integrated into the development and management plans of classified forests and protected areas. Indeed, the use of this spatial tool (the drone) could contribute to the good management of these protected areas through better monitoring of the land (fine and regular mapping, detection of forest disturbances, and early warning of clearings).

Author Contributions

Conceptualization, T.A.O., K.F.K., C.G. and R.V.; methodology, T.A.O., V.-C.J.S., I.C.Z.-B., K.F.K., C.G. and R.V.; software, T.A.O. and C.G.; validation, T.A.O., C.G. and R.V.; formal analysis, T.A.O. and C.G.; investigation, T.A.O., C.G. and R.V.; resources, T.A.O., V.-C.J.S., I.C.Z.-B., K.F.K., C.G. and R.V.; data curation, T.A.O. and C.G.; writing—original draft preparation, T.A.O., V.-C.J.S., I.C.Z.-B., C.G. and R.V.; writing—review and editing, T.A.O., V.-C.J.S., I.C.Z.-B., K.F.K., C.G.; visualization, T.A.O., V.-C.J.S., I.C.Z.-B., K.F.K., C.G. and R.V.; supervision, I.C.Z.-B., K.F.K., C.G. and R.V.; project administration, T.A.O., C.G. and R.V.; funding acquisition, T.A.O., V.-C.J.S. and C.G. All authors have read and agreed to the published version of the manuscript.

Funding

This research was conducted as part of the Mé REDD+ project funded by the Agence Française de Développement (AFD).

Acknowledgments

The authors would like to thank the Agence Française de Développement (AFD) for funding the Mé REDD+ Project, through which this work was conducted. Then the INPROBOIS (Industrie et Promotion du Bois) and the SODEFOR (Société de Développement des Forêts) for allowing us to have access to the Bossématié classified forest.

Conflicts of Interest

The authors declare no conflict of interest.

References

  1. CIRAD. Mémento du Forestier; Ministère de la Coopération et du Développement: Paris, France, 1999; 1168p. [Google Scholar]
  2. FAO. Global Forest Resource Assessment; Main Report; FAO: Rome, Italy, 2010; 341p. [Google Scholar]
  3. BNETD. Analyse Quantitative de la Déforestation en Côte d’Ivoire Sur Les Périodes 1986–2000–2015; BNETD: Abidjan, Côte d’Ivoire, 2016; pp. 8–37. [Google Scholar]
  4. Ministry of Water and Forests. Stratégie Nationale de Préservation, de Réhabilitation et D’extension des Forêts; MINEF: Abidjan, Côte d’Ivoire, 2019; pp. 10–68. [Google Scholar]
  5. Ministry of Water and Forests. Forest Policy Statement; MINEF: Abidjan, Côte d’Ivoire, 2017; pp. 1–6. [Google Scholar]
  6. Oszwald, J. Dynamique des Formations Agroforestières en Côte d’Ivoire (des Années 1980 aux Années 2000). Ph.D. Thesis, Université des Sciences et Technologies de Lille, France, Lille, 2005. [Google Scholar]
  7. Zhang, K. Identification of gaps in mangrove forests with airbome LIDAR. Remote Sens. Environ. 2008, 112, 2309–2325. [Google Scholar] [CrossRef]
  8. Grinand, C.; Rakotomalala, F.; Gond, V.; Vaudry, R.; Bernoux, M.; Vieilledent, G. Estimating deforestation in tropical humid and dry forests in Madagascar from 2000 to 2010 using multidate Landsat satellite images and the random forests classifier. Remote Sens. Environ. 2013, 139, 68–80. [Google Scholar] [CrossRef]
  9. Rakotomalala, F.A.; Rabenandrasana, J.C.; Andriambahiny, J.E.; Rajaonson, R.; Andriamalala, F.; Buren, C.; Rakotoarijaona, J.R.; Parany, B.L.E.; Vaudry, R.; Rakotoniaina, S.; et al. Estimation de la déforestation des forêts humides à Madagascar utilisant une classification multidates d’images Landsat entre 2005, 2010 et 2013. Rev. Française Photogrammétrie Télédétection 2015, 1, 11–23. [Google Scholar]
  10. Grinand, C.; Vieilledent, G.; Razafimbelo, T.; Rakotoarijaona, J.-R.; Nourtier, M.; Bernoux, M. Landscape-scale spatial modelling of deforestation, land degradation, and regeneration using machine learning tools. Land Degrad. Dev. 2019, 31, 1699–1712. [Google Scholar] [CrossRef]
  11. Jofack Sokeng, V.C.; Akpa, Y.L.; Assoma, T.V.; Kouamé, K.F.; Corgne, S.; Rudant, J.P.; Ouattara, T.A.; Sorho, F.M.; Yao, N.; Kouamé, P. Suivi par télédétection des affectations des terres pour la promotion d’une agriculture intégrée au développement forestier en Côte d’Ivoire. In Proceedings of the Conférence OSFACO: Des Images Satellites Pour la Gestion Durable des Territoires en Afrique, Cotonou, Bénin, 13–15 March 2019; 17p. Available online: https://hal.archives-ouvertes.fr/hal-02189403 (accessed on 7 February 2022).
  12. Ouattara, T.A.; Kouamé, K.F.; Zo-Bi, I.C.; Vaudry, R.; Grinand, C. Changements d’occupation et d’usage des terres entre 2016 et 2019 dans le Sud-Est de la Côte d’Ivoire: Impact des cultures de rente sur la forêt. Bois Trop. 2021, 347, 89–104. [Google Scholar] [CrossRef]
  13. Nakouma, S.; Beltrando, G.; Atta, K.L.; Dibi, H.N.; Brou, T. Dynamique forestière et pression urbaine dans le parc national du Banco (Abidjan, Côte d’Ivoire). VertigO 2013, 13, 2. [Google Scholar] [CrossRef]
  14. Barima, Y.S.S.; Kouakou, A.T.M.; Bamba, I.; Sangne, Y.C.; Godron, M.; Andrieu, J.; Bogaert, J. Cocoa crops are destroying the forest reserves of the classified Forest of Haut Sassandra (Ivory Coast). Glob. Ecol. Conserv. 2016, 8, 85–98. [Google Scholar] [CrossRef] [Green Version]
  15. Phiri, D.; Simwanda, M.; Salekin, S.; Nyirenda, V.R.; Murayama, Y.; Ranagalage, M. Sentinel-2 Data for Land Cover/Use Mapping: A Review. Remote Sens. 2020, 12, 2291. [Google Scholar] [CrossRef]
  16. Puliti, S.; Ole Orka, H.; Gobakken, T.; Naesset, E. Inventory of Small Forest Areas Using Unmanned Aerial System. Remote Sens. 2015, 7, 9632–9654. [Google Scholar] [CrossRef] [Green Version]
  17. Shahbazi, M.; Théau, J.; Ménard, P. Recent applications of unmanned aerial imagery in natural resource management. GIScience Remote Sens. 2014, 51, 339–365. [Google Scholar] [CrossRef]
  18. Rango, A.; Laliberte, A.; Herrick, J.E.; Winters, C.; Havstad, K.; Steele, C.; Browning, D. Unmanned aerial vehicle-based remote sensing for rangeland assessment monitoring and management. J. Appl. Remote Sens. 2009, 3, 033542. [Google Scholar] [CrossRef]
  19. Laliberte, A.S.; Jeffrey, E.H.; Rango, A.; Winters, C. Acquisition, orthorectification and object-based classification of unmanned aerial vehicle (UAV) imagery for rangeland monitoring. Photogramm. Eng. Remote Sens. 2010, 76, 661–672. [Google Scholar] [CrossRef]
  20. Getzin, S.; Wiegand, K.; Schöning, I. Assessing biodiversity in forests using very high-resolution images and unmanned aerial vehicles. Methods Ecol. Evol. 2012, 3, 397–404. [Google Scholar] [CrossRef]
  21. Merino, L.; Caballero, F.; Martinez-de-Dios, J.R.; Maza, I.; Ollero, A. An unmanned aircraft system for automatic forest fire monitoring and measurement. J. Intell. Robot. Syst. 2012, 65, 533–548. [Google Scholar] [CrossRef]
  22. Puttock, A.K.; Cunliffe, A.M.; Anderson, K.; Brazier, R.E. Aerial photography collected with a multirotor drone reveals impact of Eurosian beaver reintroduction on ecosystem structure. J. Unmanned Veh. Syst. 2015, 3, 123–130. [Google Scholar] [CrossRef]
  23. Faye, E.; Rebaudo, F.; Yánez-Cajo, D.; Cauvy-Fraunié, S.; Dangles, O. A toolbox for studying thermal heterogeneity across spatial scales: From unmanned aerial vehicle imagery to landscape metrics. Methods Ecol. Evol. 2015, 7, 437–446. [Google Scholar] [CrossRef] [Green Version]
  24. Torres-Sánchez, J.; López-Granados, F.; Serrano, N.; Arquero, O.; Peña, J.M. High-troughput 3-D monitoring of agricultural-tree plantations with unmanned aerial vehicle (UAV) technology. PLoS ONE 2015, 10, e013079. [Google Scholar] [CrossRef] [Green Version]
  25. Linchant, J.; Lisein, J.; Semeki, J.; Lejeune, P.; Vermeulen, C. Are unmanned aircraft systems (UAS) the future of wildlife monitoring? A review of the accomplishments and challenges. Mammal Rev. 2015, 45, 239–252. [Google Scholar] [CrossRef]
  26. Koh, L.P.; Wich, S.A. Dawn of drone ecology: Low-cost autonomous aerial vehicles for conservation. Trop. Conserv. Sci. 2012, 5, 121–132. [Google Scholar] [CrossRef] [Green Version]
  27. Paneque-Gálvez, J.; McCall, M.K.; Napoletano, B.M.; Wich, S.A.; Koh, L.P. Small drones for Community-Based Forest Monitoring: An assessment of their feasibity and potential in tropical areas. Forests 2014, 5, 1481–1507. [Google Scholar] [CrossRef] [Green Version]
  28. Semeki, N.J.; Linchant, J.; Quevauvillers, S.; Kahindo, M.J.-P.; Lejeune, P.; Vermeulen, C. Cartographie de la dynamique de terroirs villageois à l’aide d’un drone dans les aires protégées de la République Démocratique du Congo. Bois Trop. 2016, 330, 69–83. [Google Scholar] [CrossRef] [Green Version]
  29. Kakaes, K.; Greenwood, F.; Lippincott, M.; Meier, P.; Wich, S. Drones and Aerial Observation: New Technologies for Property Rights, Human Rights, and Global Development. A Primer; New America: Washington, DC, USA, 2015; pp. 1–104. [Google Scholar]
  30. Guillaumet, J.L.; Adjanohoun, E. La végétation de la Côte d’Ivoire. In Le Milieu Naturel de la Côte D’ivoire; Avenard, J.M., Eldin, E., Girad, G., Sircoulon, J., Touchebeuf, P., Guillaumet, J.L., Adjanohoun, E., Perraud, A., Eds.; ORSTOM: Paris, France, 1971; pp. 161–262. [Google Scholar]
  31. Kouadio, K.; Kouassi, K.E.; Kouamé, N.F.; Traoré, D. Impact de l’éclaircie sur la régénération naturelle des essences principales, dans la forêt classée de Bossématié (Côte d’Ivoire). Sci. Nat. 2007, 4, 27–35. [Google Scholar] [CrossRef] [Green Version]
  32. Semeki, N.J.; Linchant, J.; Quevauvillers, S.; Kahindo, M.J.-P.; Lejeune, P.; Vermeulen, C. Une méthode simple et rapide pour l’évaluation de statistiques d’occupation du sol à l’aide d’images à très haute résolution acquises par mini-drone. Bois Trop. 2018, 335, 15–23. [Google Scholar] [CrossRef] [Green Version]
  33. Agisoft Photoscan. Manuel de L’utilisateur Agisoft Photoscan Professional Edition, Version 1.4; Agisoft LLC: St. Petersburg, Russia, 2018. [Google Scholar]
  34. Lisein, J.; Bonnet, S.; Lejeune, P.; Pierrot-Deseilligny, M. Modélisation de la canopée forestière par photogrammétrie depuis des images acquises par drone. Rev. Française Photogrammétrie Télédétection 2014, 206, 45–54. [Google Scholar] [CrossRef]
  35. Piney, I. Comparaison de Protocoles de Caractérisation des Trouées de la Canopée sur des Séries Temporelles de Photos Aériennes: Application à la Caractérisation du Régime de Perturbation. Master’s Thesis, Université Paul Verlaine de Metz, Metz, France, 2010. [Google Scholar]
  36. Rameau, J.C.; Mansion, D.; Dumé, G. Flore forestière française: Guide écologique illustré—1 Plaines et collines. In IDF et Ministère de L’agriculture et de la Forêt; Institut Pour le Développement Forestier Éditeur: Paris, France, 1989. [Google Scholar]
  37. Tu, Y.-H.; Phinn, S.; Johansen, K.; Robson, A.; Wu, D. Optimising drone flight planning for measuring horticultural tree crop structure. ISPRS J. Photogramm. Remote Sens. 2020, 160, 83–96. [Google Scholar] [CrossRef] [Green Version]
  38. Gülci, S.; Akgül, M.; Akay, A.E.; Tas, I. Using ready-to Drone images in forestry activities: Case Study of CINARPINAR in Kahramanmaras, Turkey. Int. Arch. Photogramm. Remote Sens. Spat. Inf. Sci. 2017, XLII-4/W6, 51–53. [Google Scholar] [CrossRef] [Green Version]
  39. Wu, J.; Zhongkui, D.; Zhigang, L.; Guoqing, Z. Geo-registration and mosaic of UAV video for quick-response to forest fire disaster. In Proceedings of the SPIE, MIPPR 2007: Pattern Recognition and Computer Vision, Wuhan, China, 15 November 2007; Volume 6788, p. 678810. [Google Scholar]
  40. James, M.R.; Robson, S. Mitigating systematic error in topographic models derived from UAV and ground-based image networks. Earth Surf. Processes Landf. 2014, 39, 1413–1420. [Google Scholar] [CrossRef] [Green Version]
  41. Gülci, S.; Akay, A.E.; Gülci, N.; Tas, I. An assesment of conventional and drone-based measurements for tree attributes in timber volume estimation: A case study on stone pine plantation. Ecol. Inform. 2021, 63, 101303. [Google Scholar] [CrossRef]
  42. Landis, R.J.; Koch, G.G. An Application of Hierarchical Kappa-type Statistics in the Assesment of Majority Agreement among Multiple Observers. Biometrics 1977, 33, 363–374. [Google Scholar] [CrossRef]
  43. Matese, A.; Toscano, P.; Di Gennaro, S.F.; Genesio, N.; Vaccari, F.P.; Primicerio, J.; Belli, C.; Zaldei, A.; Bianconi, R.; Gioli, B. Intercomparison of UAV, Aircraft and satellite Remote Sensing Platforms for Precision Viticulture. Remote Sens. 2015, 7, 2971–2990. [Google Scholar] [CrossRef] [Green Version]
  44. Nagendra, H.; Mairota, P.; Marangi, C.; Lucas, R.; Dimopouluos, P.; Honrado, J.P.; Niphadkar, M.; Mücher, C.A.; Tomaselli, V.; Panitsa, M.; et al. Satellite Earth observation data to identify anthropogenic pressures in selected protected areas. Int. J. Appl. Earth Obs. Geoinf. 2015, 37, 124–132. [Google Scholar] [CrossRef]
  45. Rao, P.; Zhou, W.; Bhattarai, N.; Srivastava, A.K.; Singh, B.; Poonia, S.; Lobell, D.B.; Jain, M. Using Sentinel-1, Sentinel-2, and Planet Imagery to Map Crop Type of Smallholder Farms. Remote Sens. 2021, 13, 1870. [Google Scholar] [CrossRef]
  46. Fayad, I.; Baghdadi, N.; Bailly, J.-S.; Barbier, N.; Gond, V.; Hajj, M.E.; Fabre, F.; Bourgine, B. Canopy Height Estimation in French Guiana with LiDAR ICESat/GLAS Data Using Principal Component Analysis and Random Forest Regressions. Remote Sens. 2014, 6, 11883–11914. [Google Scholar] [CrossRef] [Green Version]
Figure 1. Geographic location of the Bossématié classified forest. Overview of study areas and 2016 land cover [12].
Drones 06 00083 g001
Figure 2. Protocol for acquisition, processing, and analysis of drone data for the early detection of tree loss.
Drones 06 00083 g002
Figure 3. The DJI Mavic Pro Drone and its accessories. (a) DJI Mavic Pro Drone. (b) Holster. (c) Radio control. (d) Battery. (e) Charging hub. (f) Car charger. (g) Propellers.
Drones 06 00083 g003
Figure 4. Overview of the flight plan (Site 1) in the Bossématié classified forest.
Drones 06 00083 g004
Figure 5. Delineation and extraction of a portion of Site 1 from the DSM (left) and orthomosaic (right) of 1 November 2018.
Drones 06 00083 g005
Figure 6. Illustration of the principle of creating the MNH from the MNS and MNT (modified by [35]).
Drones 06 00083 g006
Figure 7. Illustration of the principle of estimating the tree crown area (modified by [35]).
Drones 06 00083 g007
Figure 8. Orthomosaics (A) and 3D (B) and 2D (C) DSMs resulting from photogrammetric processing of flights at Sites 1, 6, 8, 9, and 11 in November 2018 and April 2019.
Drones 06 00083 g008
Figure 9. DTMs (contour lines are shown in pink) obtained at each of the study sites selected for the analyses.
Drones 06 00083 g009
Figure 10. Comparison of altitudinal profiles corresponding to November 2018 (blue profile) and April 2019 (red profile) at Site 1 (left) and Site 9 (right).
Drones 06 00083 g010
Figure 11. Digital height models of vegetation at Sites 1, 6, 8, 9, and 11 in November 2018 and April 2019.
Drones 06 00083 g011
Figure 12. Vegetation height frequency distribution histograms for Sites 1, 6, 8, 9, and 11 in November 2018 and April 2019.
Drones 06 00083 g012
Figure 13. Tree crown area delineated on aerial images acquired by drone.
Drones 06 00083 g013
Figure 14. Distribution of tree heights in April 2019 and tree losses during the period of November 2018–April 2019.
Drones 06 00083 g014
Figure 15. Illustration of the identification of tree losses (the red line materializes the lost tree: new clearings or losses related to the burning of trees) on the orthomosaics from November 2018 and April 2019.
Drones 06 00083 g015
Figure 16. Clearing timing in the classified forests and data acquisition strategy. (A) Forest that appears to be intact but is already sown with cocoa beans. (B) Appearance of cocoa seedlings and felling of the undergrowth. (C) Burning of the base of large trees. (D) Falling or felling of standing dead trees so that cocoa trees grow better.
Drones 06 00083 g016
Figure 17. Illustration of the potential of drone and Sentinel sensors for monitoring forest disturbances. (A) Orthomosaic (Site 1 November 2018). (B) DSM (Site 1 November 2018). (C) Sentinel-2 (Site 1 March 2019, natural colored composition). (D) Sentinel-1 C-band (Site 1 April 2019, colored composition: vv/vh–vh–vh).
Drones 06 00083 g017
Table 1. Characteristics of different study sites in the Bossématié classified forest.
Site NameAcquisition DatesTypes of Land Use and Land Cover in 2016 (ha)Area (ha)Level of Deforestation and Degradation
Acquisition 1Acquisition 2Dense Forest FormationDegraded ForestCrops
Site 101-Nov-1809-Apr-19120.85.74.51318%
Site 201-Nov-1809-Apr 19117.310.53.213110%
Site 301-Nov-1809-Apr-19128.71.80.41312%
Site 402-Nov-1810-Apr-19122.24.84.91327%
Site 503-Nov-1812-Apr-19122.63.63.51305%
Site 603-Nov-1812-Apr-19117.22.311.613111%
Site 703-Nov-1810-Apr-19124.15.82.131326%
Site 803-Nov-1810-Apr-1994.94.731.413128%
Site 904-Nov-1811-Apr-19101.614.315.113122%
Site 1004-Nov-1811-Apr-1976.9920.831.913041%
Site 1104-Nov-1811-Apr-1986.44.739.813134%
Table 2. Evaluation of photogrammetric processing (A: percentage of aerial images correctly aligned; E: aerial image reprojection errors in pixels).
NameNovember 2018April 2019
QualityAEQualityAE
Site 1Good1000.580Good970.551
Site 2Good1000.718Poor1000.739
Site 3Poor1000.738Good1000.717
Site 4Poor690.636Poor730.646
Site 5Good950.689Poor590.653
Site 6Good1000.799Good1000.625
Site 7Good970.626Poor750.622
Site 8Good1000.648Good1000.649
Site 9Good980.655Good980.599
Site 10Poor1000.680Good1000.649
Site 11Good1000.614Good1000.615
Table 3. Statistical distribution of vegetation heights at each study site between November 2018 and April 2019.
NameNovember 2018April 2019
Maximum Height (m)Average (m)Standard Deviation (m)Maximum Height (m)Average (m)Standard Deviation (m)
Site 157.0516.7212.7359.5216.8912.59
Site 659.5921.7412.6359.6222.1512.76
Site 861.2917.9612.1561.1618.1812.06
Site 965.0617.5113.1264.0717.0713.10
Site 1163.4117.7513.6662.6917.5613.66
Table 4. Statistical distribution of tree heights at each site between November 2018 and April 2019 (minimum height of 25 m).
NameNovember 2018April 2019
Maximum Height (m)Average (m)Standard Deviation (m)Maximum Height (m)Average (m)Standard Deviation (m)
Site 157.0534.836.0459.5235.306.34
Site 659.5934.926.2659.6235.386.38
Site 861.2934.296.2761.1634.636.40
Site 965.0635.437.2164,0735.557.15
Site 1163.4137.007.1462.6936.887.05
Table 5. Tree crown area statistics for all study sites.
NameNumber of PolygonsMinimum Area (m2)Maximum Area (m2)Average Surface Area (m2)
Site 12226373166
Site 63123451127
Site 8207487164
Site 92712385113
Site 112425838206
Table 6. Confusion matrix and accuracies for the set of tree height distribution maps in April 2019 and tree loss over the period of November 2018–April 2019.
Tree LossStableForestNonstableForestTotalUser’s AccuracyCommissionError
Tree loss99531070.930.007
Stable forest119632000.980.02
Nonstable forest122012040.990.01
Total101203207511
Producer’s accuracy0.980.970.97 OA = 97%
Omission error0.020.030.03 Kappa = 0.95
Publisher’s Note: MDPI stays neutral with regard to jurisdictional claims in published maps and institutional affiliations.

