1. Introduction
Research into the use of unmanned aircraft vehicles (UAVs, here called drones) in healthcare services has surged over the last decade. Proofs of concept for various purposes have been presented for drone-based transport as part of future healthcare logistics systems. Applications in the health sector as search and rescue following natural disasters, drug and vaccine delivery in rural districts, provision of care technology in emergencies, and transport of blood samples and organs have been topics of study [
1,
2,
3,
4,
5,
6,
7,
8,
9,
10]. The main arguments supporting the use of drones are their ability to avoid ground traffic congestion and maintain service in areas with poor transportation infrastructure and remote regions. Their usefulness in transporting biological materials while preserving quality and their potential use for transporting medications and health equipment to remote areas for home-based healthcare services have been documented.
The drone package delivery market reached USD 680 million by 2020 [
11] and is projected to grow to USD 39 billion by 2030 [
12] in response to the growing demand for fast delivery. The author strongly believes that healthcare also represents a significant potential market for drone transport. However, previous reports have revealed that significant uptake will not be possible until more is known about how drone-based solutions should be organized and funded [
13,
14]. Most studies have focused on single-purpose use and unidirectional transport, and empty drones are not sustainable solutions. Successful business cases for drone-based solutions as a sustainable element of future healthcare logistics are a prerequisite for establishing profitable markets before implementing drones in the healthcare sector. We must also focus on whether drones are merely an alternative mode of transport or represent a disruptive technology leading to new organizational and service models, transforming how logistics services are delivered.
A previous review paper describes eight healthcare applications currently studied in North America [
14]. However, there are serious knowledge gaps related to economic and logistical solutions, and the economic viability of drone-based solutions in healthcare needs to be evaluated scientifically [
13,
14]. The ability of drones to provide more efficient time-critical services than ground-based transport varies across types of demand, locations, and systems. It is easy to quantify the value of the service that Zipline and other providers have delivered over many years in Africa [
15]. The roads are impassable for much of the year, with no service provided. Even when roads are open, drone delivery may be less time consuming and less expensive than ground transport in many locations. A similar situation may also exist in developed healthcare systems that include geographical areas with long transport distances and scattered populations [
16,
17,
18,
19].
Regarding biologic transport, a previous study at Oslo University Hospital (OUS) found that drone transport could theoretically enable the merger of two of the largest laboratories, achieving potential annual savings of NOK 100 million (EUR 9.5 million) [
20]. Although such radical solutions may be uncommon, promising reductions in cost duplications may be achieved if laboratories can be networked. That is, various hospital laboratories can provide services for each other using predictable and sustainable transport solutions, either ground- or drone-based. Such innovations could have a significant influence on the future organization of laboratories. Furthermore, laboratory analyses are undergoing substantial changes, resulting in rapid shifts in the sector. Although the rapid deployment of blood products from centralized blood banks to remote locations may be needed for decades to come, the adoption of point-of-care (POC) testing is rapidly increasing [
21,
22,
23], potentially eliminating the need to transport blood samples for a range of analyses. Other analyses, such as in microbiology, are candidates for rapid responses enabling the prompt commencement of targeted treatment. Speedy drone transport of such samples to specialized microbiological laboratories may provide faster and more precise diagnoses. Timely analysis of such samples may reduce the use of broad-spectrum antibiotics that can create threats from multi-resistant microbes.
Although there are multiple concepts of drones, i.e., fixed wing drones, helicopter-like drones, and others with payload capacities of several tons and fueled by gasoline, resulting in many hours of flight time [
24], these are rather expensive to operate and have not been extensively studied relative to healthcare, although some studies have been presented [
25]. Most studies have focused on electric drones with a limited range and payload capacity and have adopted a conceptual framework of drone utilization based on tandem models and the traveling salesman problem to overcome these limitations [
26,
27,
28,
29,
30]. However, the rapidly developing drone industry is exploring different propulsive solutions, such as hydrogen fuel cells, electric batteries, and solar energy, to extend current range, time, and load limitations. These topics are, in part, a chicken-and-egg problem. Sufficient demand accompanied by a willingness to pay should be present, or at least have the potential, to persuade the drone industry to invest heavily in engines providing the needed range and weight capacities along with solutions for security, weather robustness, and stable takeoff and landing systems. Investments in drone development should therefore be made gradually, with close observation of the market volumes.
Comparing drone solutions with current ground transport reveals several pitfalls. Suboptimal organization of existing ground transport solutions should not be an argument for drone solutions before the existing solutions are optimized. Furthermore, advocating a smaller carbon footprint of electric drone transport compared with current transport may be invalid over longer time horizons because future ground transport may be increasingly based on zero-emission vehicles.
The assessment of drone transport as a sustainable future alternative for scheduled or on-demand biological material transport requires economic evaluation based on systematic input resource identification and measurement against the value outcome. I have not found any previous studies that have undertaken scientific cost–benefit analyses for drone-based services. These evaluations should be performed in parallel with introducing new medications and medical technology, which are only implemented after added value to patients or the overall healthcare system has been scientifically proven.
This report focuses on two topics relevant to the above discussion: time savings and costs.
1.1. Time Savings
How should a given amount of time saved be valued in differing settings? It has not yet been documented how and to what extent drone-based solutions to hospital logistics will create increased patient value. Time-critical services are claimed to be better served by drones than ground transport, but the degree to which this is true may vary across differing demands, locations, and systems. Two minutes saved by a drone carrying a cardiac defibrillator may save a life. However, 60 min saved transporting a routine blood sample may have marginal, if any, clinical significance in certain healthcare systems in which patients may wait for months for their first contact with healthcare provisions. It is also an open question whether such time savings will influence the efficiency of healthcare to any significant degree.
The different types of goods that require transport are also important. The regular transport of vaccines or technical equipment to a remote district or patients’ homes is not necessarily time-critical. Some delays can be tolerated and should be evaluated more by the regularity and costs than transport time. By contrast, on-demand and fast transport may be crucial in delivering prioritized biologic material or samples in emergencies [
31,
32]. Based on such differing demands, we need to ask when, where, and under what framework drones should be used for biologic sample transport [
33]. These considerations must include understanding the total time from when samples are taken to final analyses, i.e., time measures must consist of all time intervals in the process. Economic analyses must capture all relevant utility effects and costs and confirm an increased overall value for society, including both primary and specialist healthcare services.
1.2. Costs
We should realize that our current understanding of how drone-based solutions in healthcare should be organized and funded is lacking. If drone operators are to risk investing in robust technology solutions, they will need detailed knowledge of potential future markets and their requirements. This applies to companies that aim to develop drone solutions for various markets and to ensure that healthcare system stakeholders are willing to pay for these services. The potential for cost savings is promising but not known in detail.
For future drone services to be competitive, the drones must be fully unmanned and able to fly beyond line of sight (BVLOS). A benefit report from New Zealand estimated that BVLOS drones could double the market compared to VLOS flights [
34]. BVLOS flights obviously represent multiple regulatory matters related to airspace control, security and communication, and more mature technology of drones and infrastructures, all representing multiple and differing cost elements. The security topic is both a governmental issue related to safety for air space traffic, no-flight zones, and public hazards if heavy sized and high velocity vehicles should fail, as well as a public acceptance issue related to concerns about noise, surveillance, and privacy [
35,
36,
37]. Detailed risk assessment procedures as defined in the Specific Operations Risk Assessment (SORA) framework developed by the Joint Authorities for Rulemaking on Unmanned Systems, JARUS [
38,
39], will be required. This will impose substantial requirements on the specific technical drone standards and infrastructures. In total, developing, authorizing, and operating such systems will be cost consuming.
An interesting case describing the complexity of developing air space regulations was presented by Lockhart et al. regarding the drone services that have been implemented in Tanzania and Rwanda since 2017 [
40]. The process from unregulated drone applications to a regulated air space to enable regular and advanced medical delivery networks included multiple steps, with re-regulations and closing down airspace demanding substantial invested resources from both governments and stakeholders in the process.
Drones are still considered unreliable aerial vehicles [
41], and safe BVLOS flights piloted by remote flight monitoring systems will need high quality communication solutions to secure continuously updated surveillance and the capability to terminate flights safely. Communication solutions under study, i.e., cellular and satellite technologies, both represent costs depending on the amount of and needed frequency of data transmitted [
41,
42]. This may also represent a challenge related to the ground density of cellular base stations [
42], as such stations may be dense in urban environments but sparser in rural environments. In the cost–benefit report by Zhong et al. [
42], it was suggested that UAS Traffic Management (UTM) may possibly be a pay-for-use service where UTM providers, relying on commercial mobile networks for data communication services, will have to guarantee quality of service. It should be expected that the use of such communication services can be costly and spark the need for cost–benefit analyses to determine service profitability based on a number of service characteristics for a given solution.
Various solutions for controlling risk of air traffic operations and failures of infrastructure have been presented [
41,
43,
44]. These consist of differing technology solutions for detect and avoid, equipping drones with an Independent Fail-safe System (IFS), enabling termination of flights, and deploying a parachute in crash situations [
41,
42].
An additional important perspective is flight routings and trajectories. Most previous studies have considered models with simulations using straight flight lines, which are unrealistic in real settings. Both regulatory matters related to infrastructures such as airports and civil air space, geofencing, buildings, and hot-spots of future airspace may impact trajectories that alter both flight time and energy consumption [
45,
46,
47]. This has obvious consequences for how flights should be planned and monitored, their costs, as well as their value with respect to time savings.
To my knowledge, there are not many scholarly studies of drone service costs in more developed healthcare systems that take into account basic principles of economic evaluation. A previous study from Liberia [
48] concluded that UAS are not viable for routine transport of laboratory samples in west Africa, given the current level of technology, purchase prices, equipment lifespans, and operational flying ranges. However, although their UAS transports were not a viable option for routine short-range transport of laboratory samples, they became increasingly more cost-effective with increasing range and operational lifespans. By contrast, drone-aided healthcare services were found to reduce the shipping costs of blood from the point of origin to centers for post-maternal bleeding emergencies [
49,
50]. Both these studies address the delivery of health services when there is no stable alternative. Although these studies were related to less developed infrastructures, they documented models for lifesaving on-demand transports that may be just as relevant in any modern system.
Different settings may influence the economics of drone services in healthcare. The balance of differing distances, transport volumes, and time constrictions for delivery is significant. For example, Amazon will only set up its drone systems in cities where they are expected to increase efficiency and profitability. Drone systems will likely be costlier and less profitable in low density/low population areas than in high-density/high-population cities [
51]. These expectations may apply to ordinary transport purposes, but other criteria may be more relevant for prioritized transport such as healthcare.
All the above topics related to mechanical structures, navigation, takeoff, landing, and airspace use should be included in assessing drone costs. These are not fully known today because such regular flights have not been implemented in a general system. At present, it is not easy to determine the total costs of an established drone system regularly operating in a framework relevant to our healthcare models. The costs of building more robust drones are unknown and difficult to predict. However, these costs will probably be a function of at least two variables: (i) considerably increased costs related to building more robust equipment based on simple projections of current construction costs, (ii) combined with, and mitigated by, the general drop in technology costs over time [
52,
53].
1.3. Research Focus of the Current Study
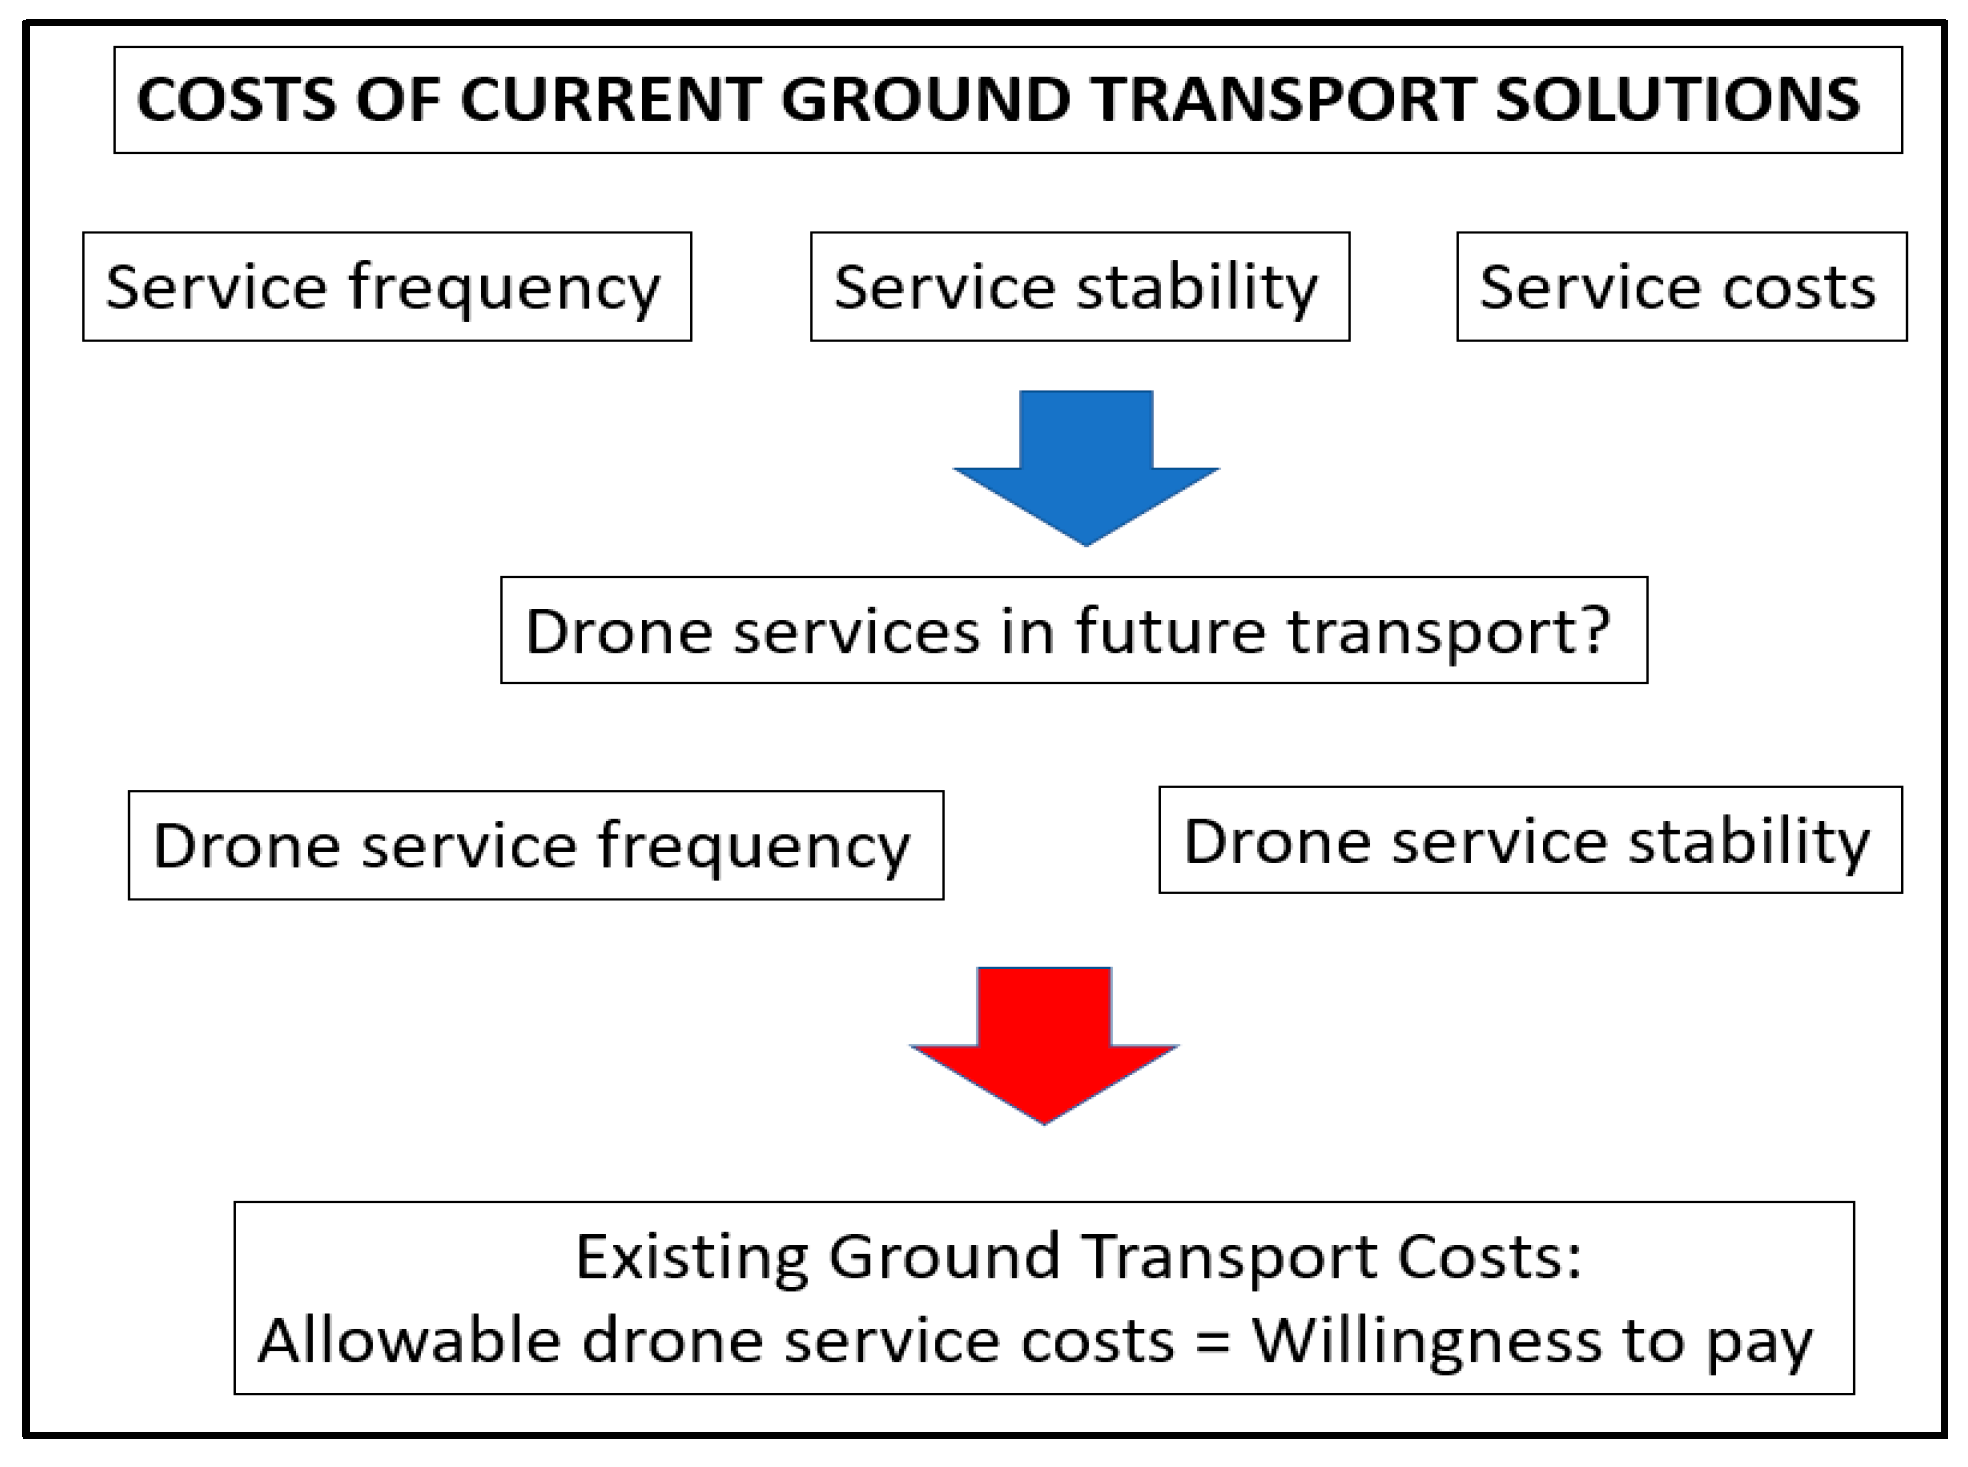
The approach in the present study is to address some general economic principles relevant to the evaluation of drone transport of biologic samples compared with current ground transport. Relating time savings using drones to ground transport costs was used to illustrate the possible costs permitting drone transport to be competitive. Such competitiveness may be assessed either by lower costs for the same transport value, the same costs with increased value (increased reliability or reduced transport times), or, theoretically, increased costs justified by substantial quality increases. This perspective is depicted in
Figure 1.
The detailed costs of current ground transport as a function of service frequency, distances, and service times were assessed and related to the theoretical time savings by simulating drones as a ground transport substitute. Time savings are measured in minutes and relative transport time reductions by replacing ground transport with drones traveling from 60 to 200 km/h.
The present study assumes that the time saved using drones for regular deliveries must also be evaluated relative to the transport volume. For example, saving 30 min transporting 100 samples should be valued differently than similar time savings for 10 samples, and 10 min saved on a 15-min route is valued differently than 10-min savings on a 90-min route. These considerations were the basis for multiple simulations with the percentage of time saved by drones compared with ground transport time, i.e., time value relative to transport volume as characterized by the number of transported samples. These topics were examined by comparing drones with ground transport using two different service models. Model 1 is an urban drone model that substitutes for frequent ground transports of biologic samples between four hospitals at OUS. Model 2 considers drone transport from two medical centers in rural districts to the central laboratory at Innlandet Hospital in Norway. The two rural medical centers represent ground distances of 179 km and 262 km, driving times of 2 h 43 min and 3 h 40 min, and Euclidian distances of 160 km and 186 km. These routes were chosen because of their different ground transport times and transport payloads but similar Euclidean distances and, accordingly, comparable expected drone flight times.
1.4. Research Questions
There are three research aims:
What are the potential time savings of drone transport compared with ground transport over short distances (urban environments) having ordinarily short transport times?
How do differing distances and route frequencies influence the time savings of drone transport for long-distance (rural) transport?
What are the essential elements in assessing costs in such differing future drone solution models to allow them to compete with existing solutions?
2. Materials and Methods
2.1. Background
2.1.1. Model 1
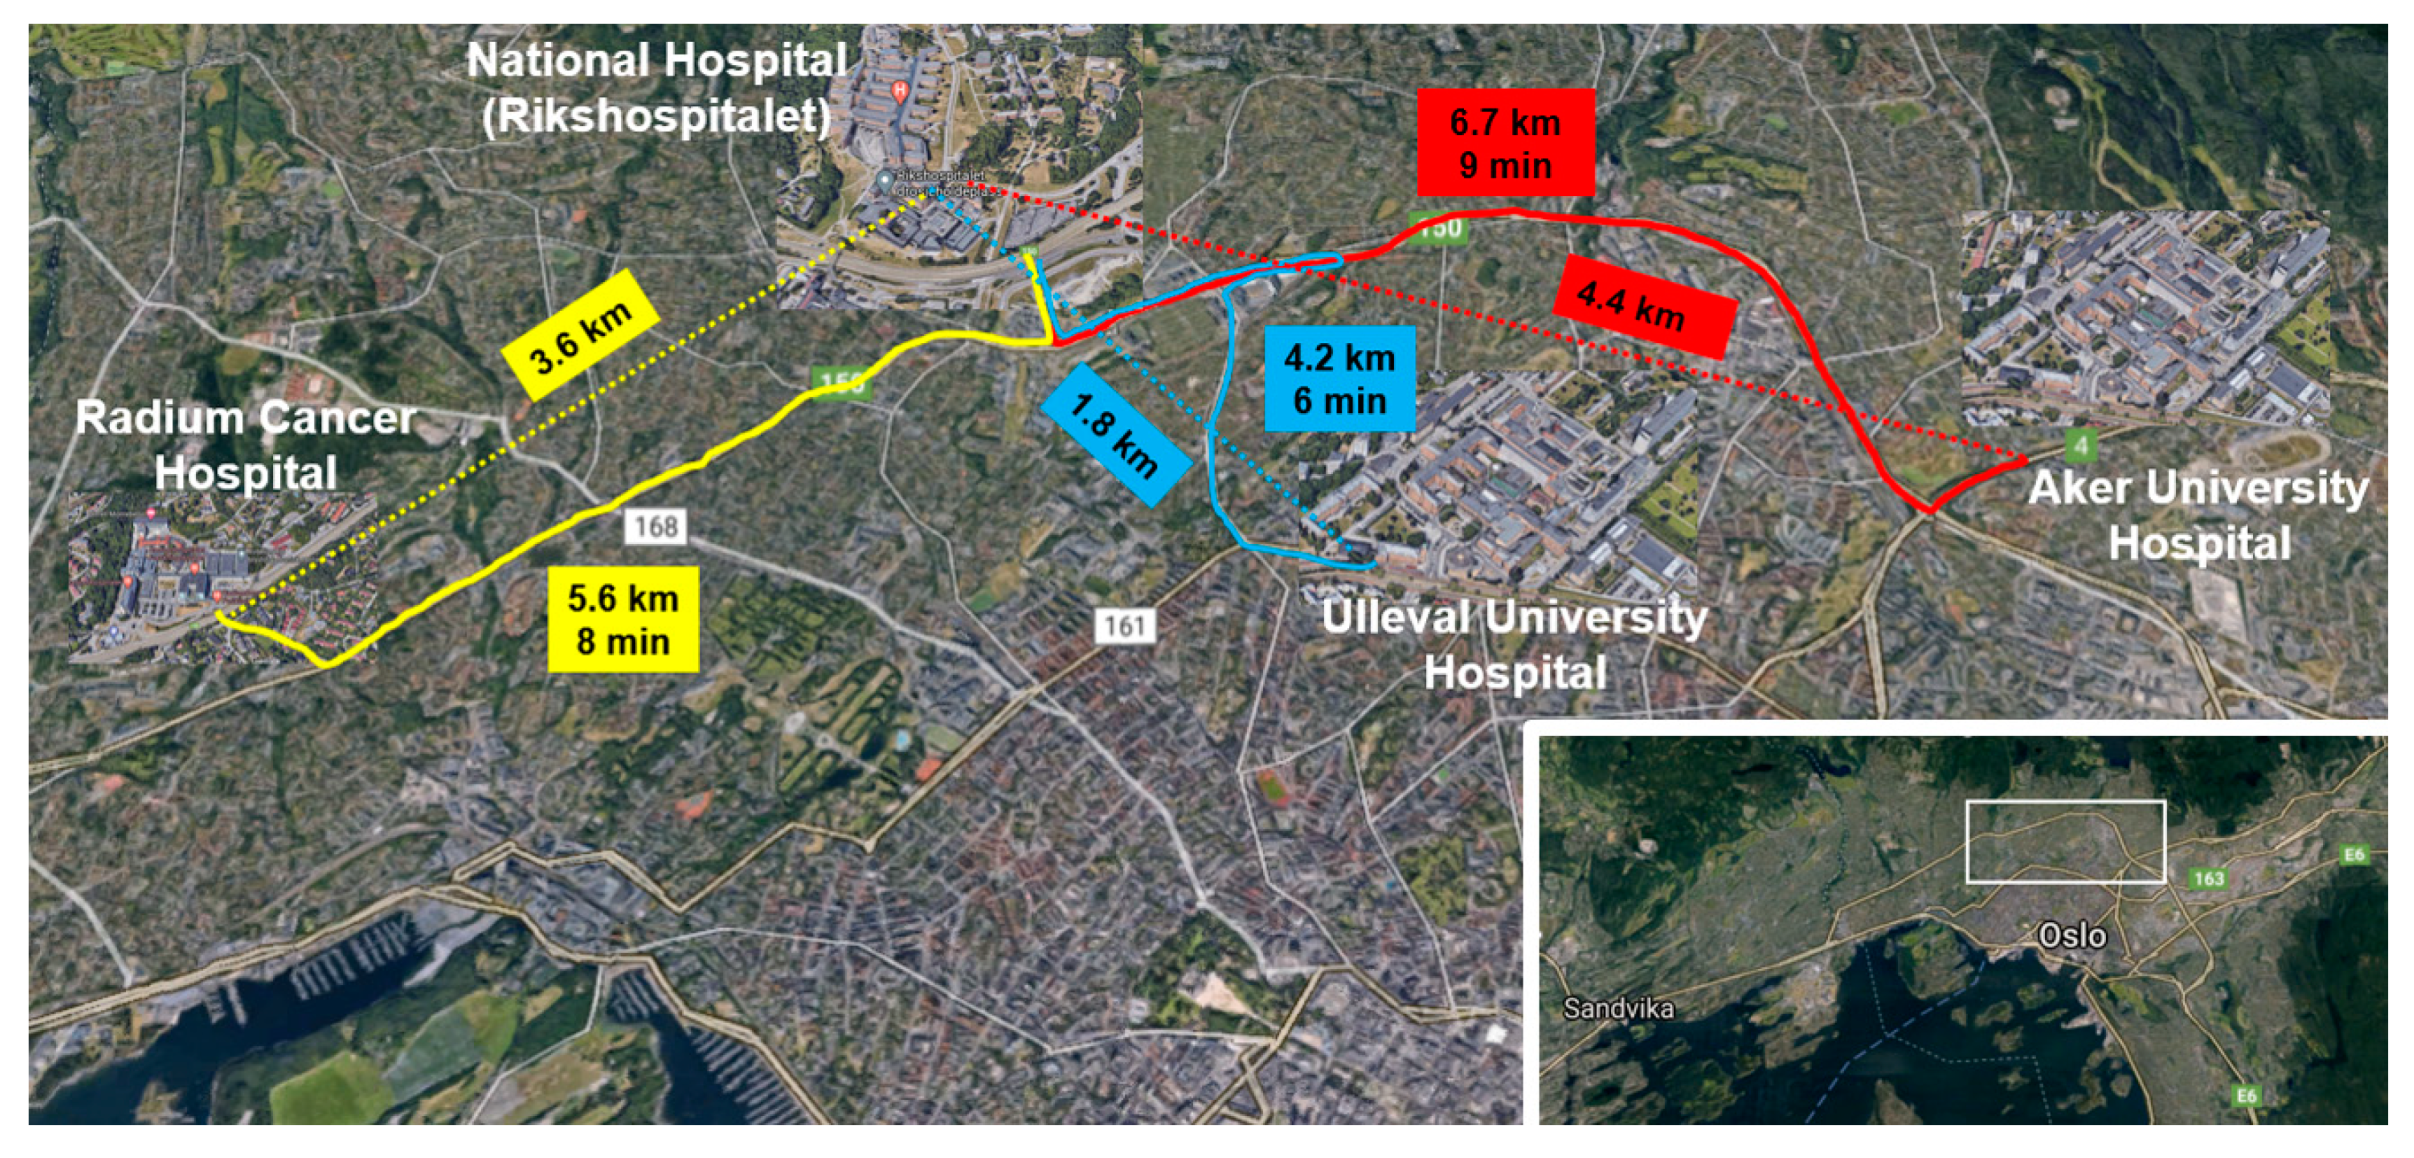
This model is based on transport across four institutions at OUS located within an approximately 7.4 km by 2 km rectangle (
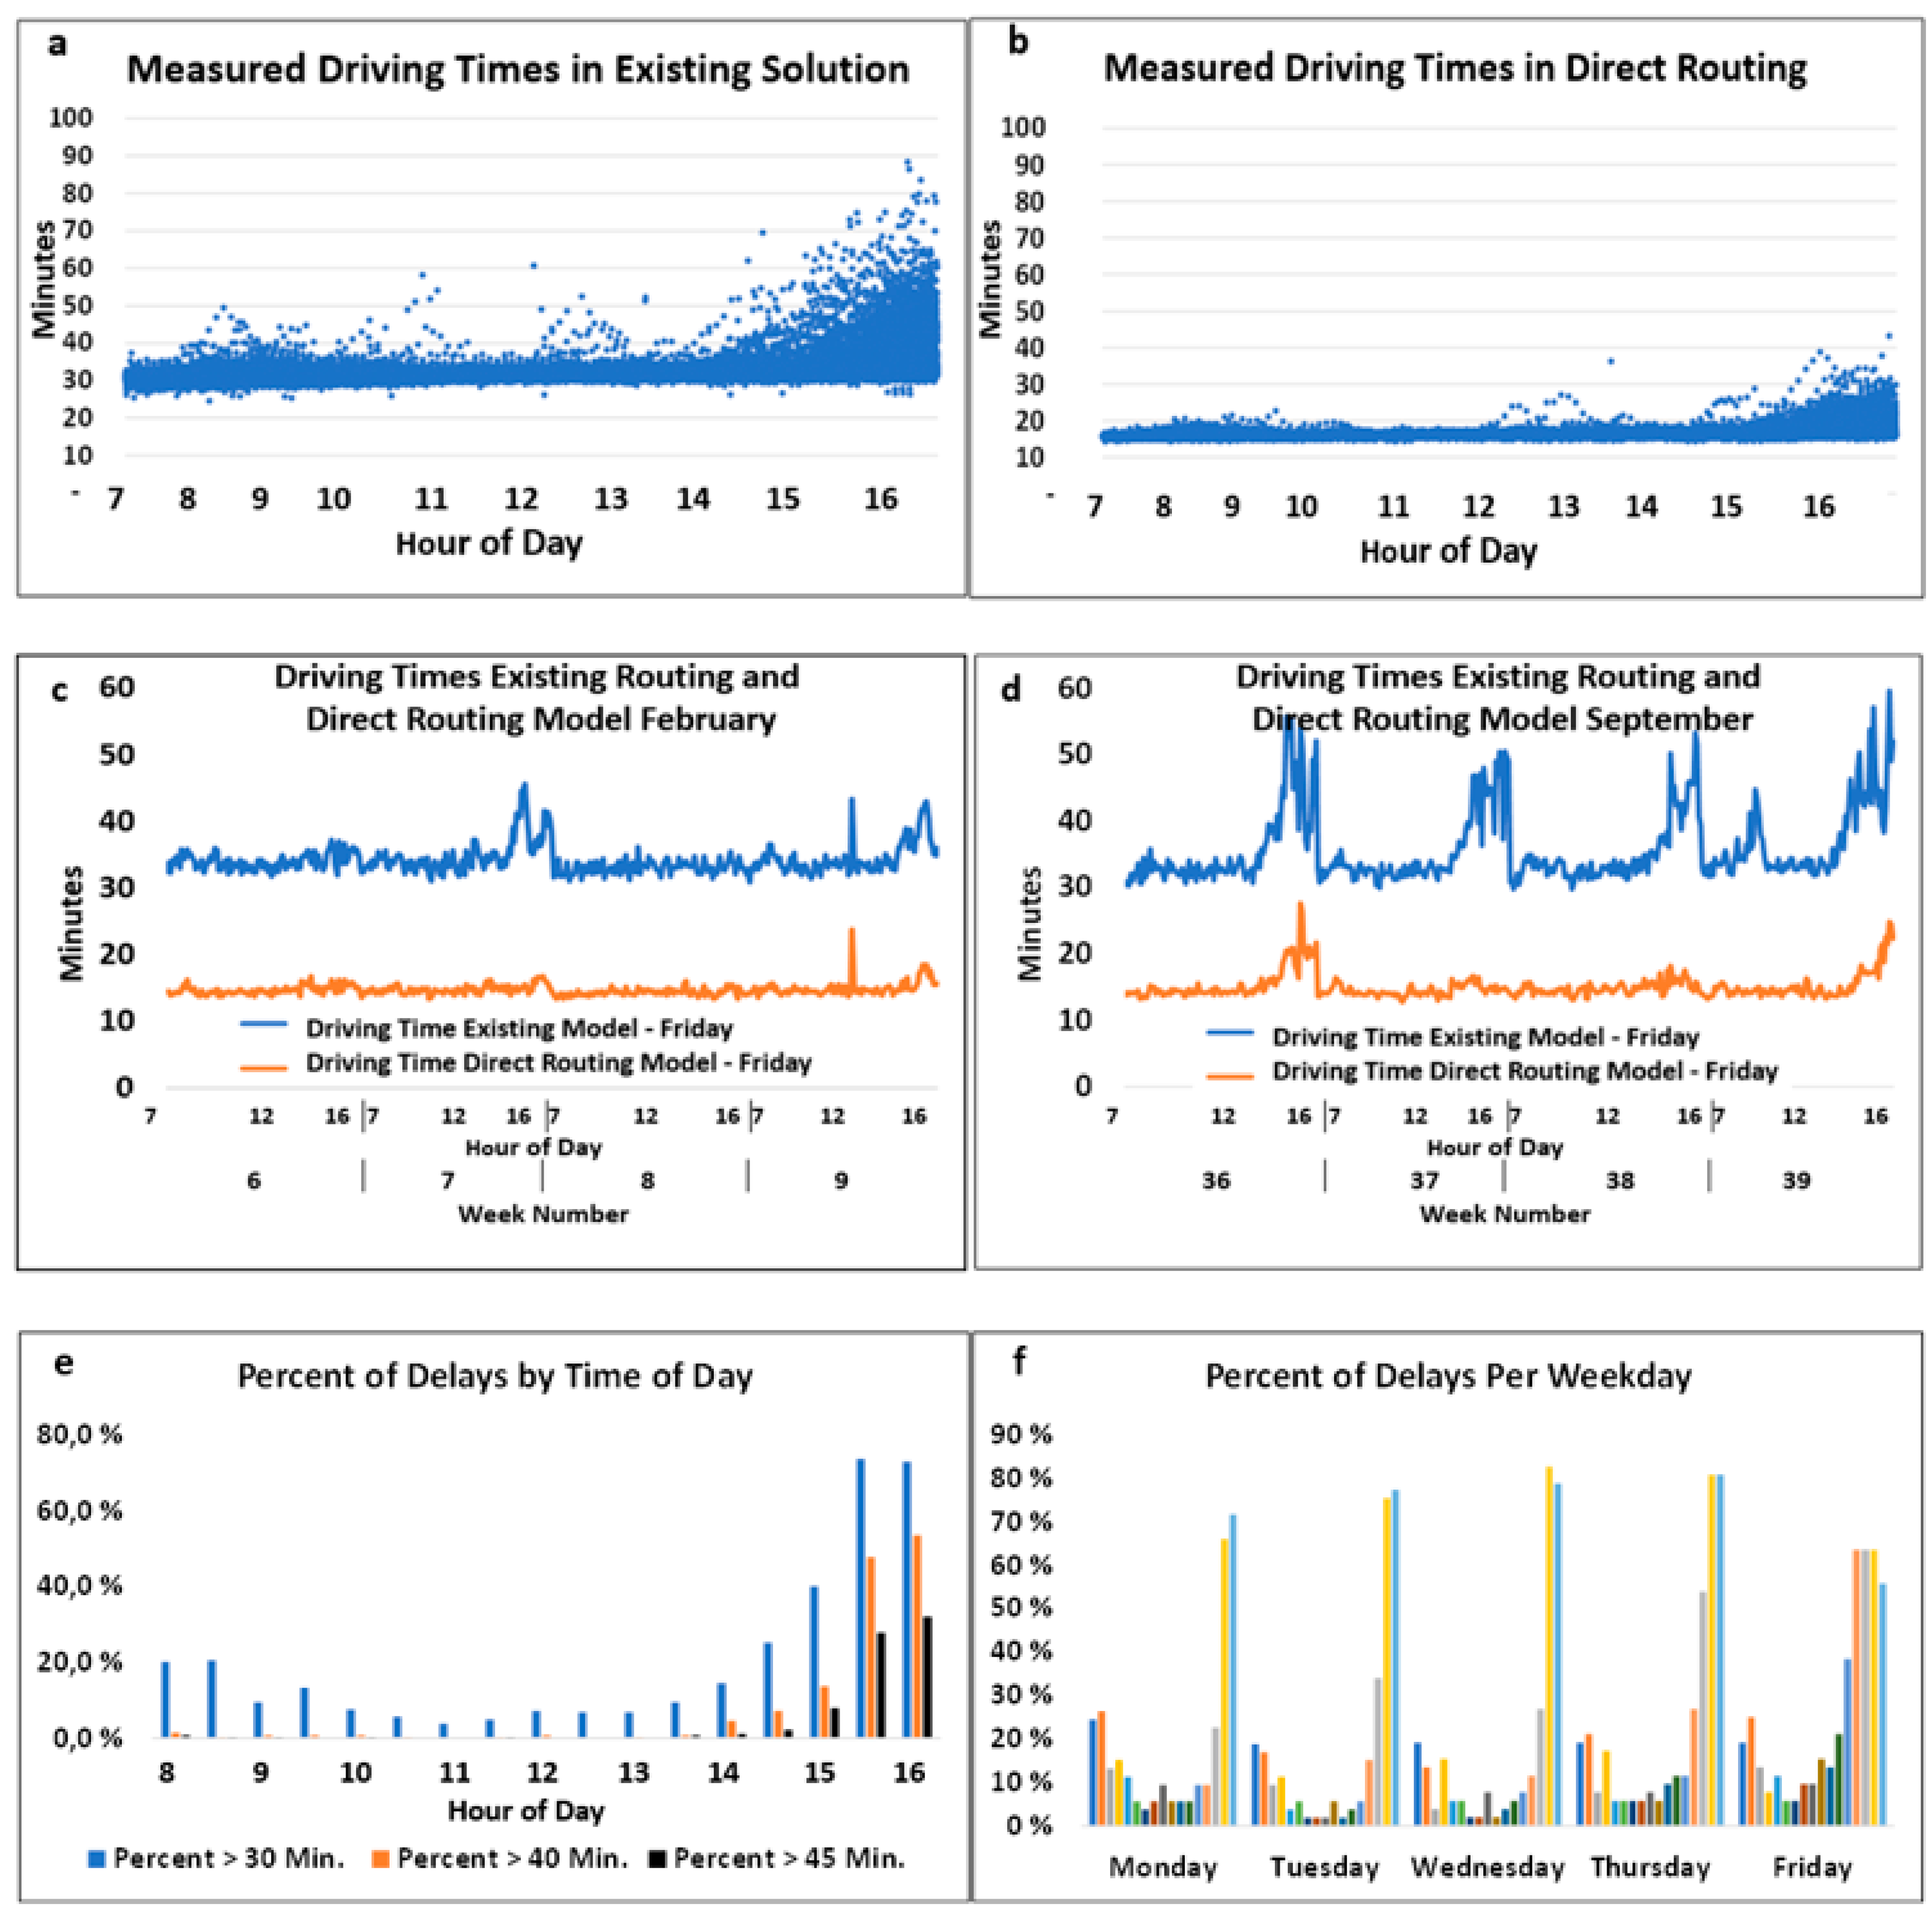
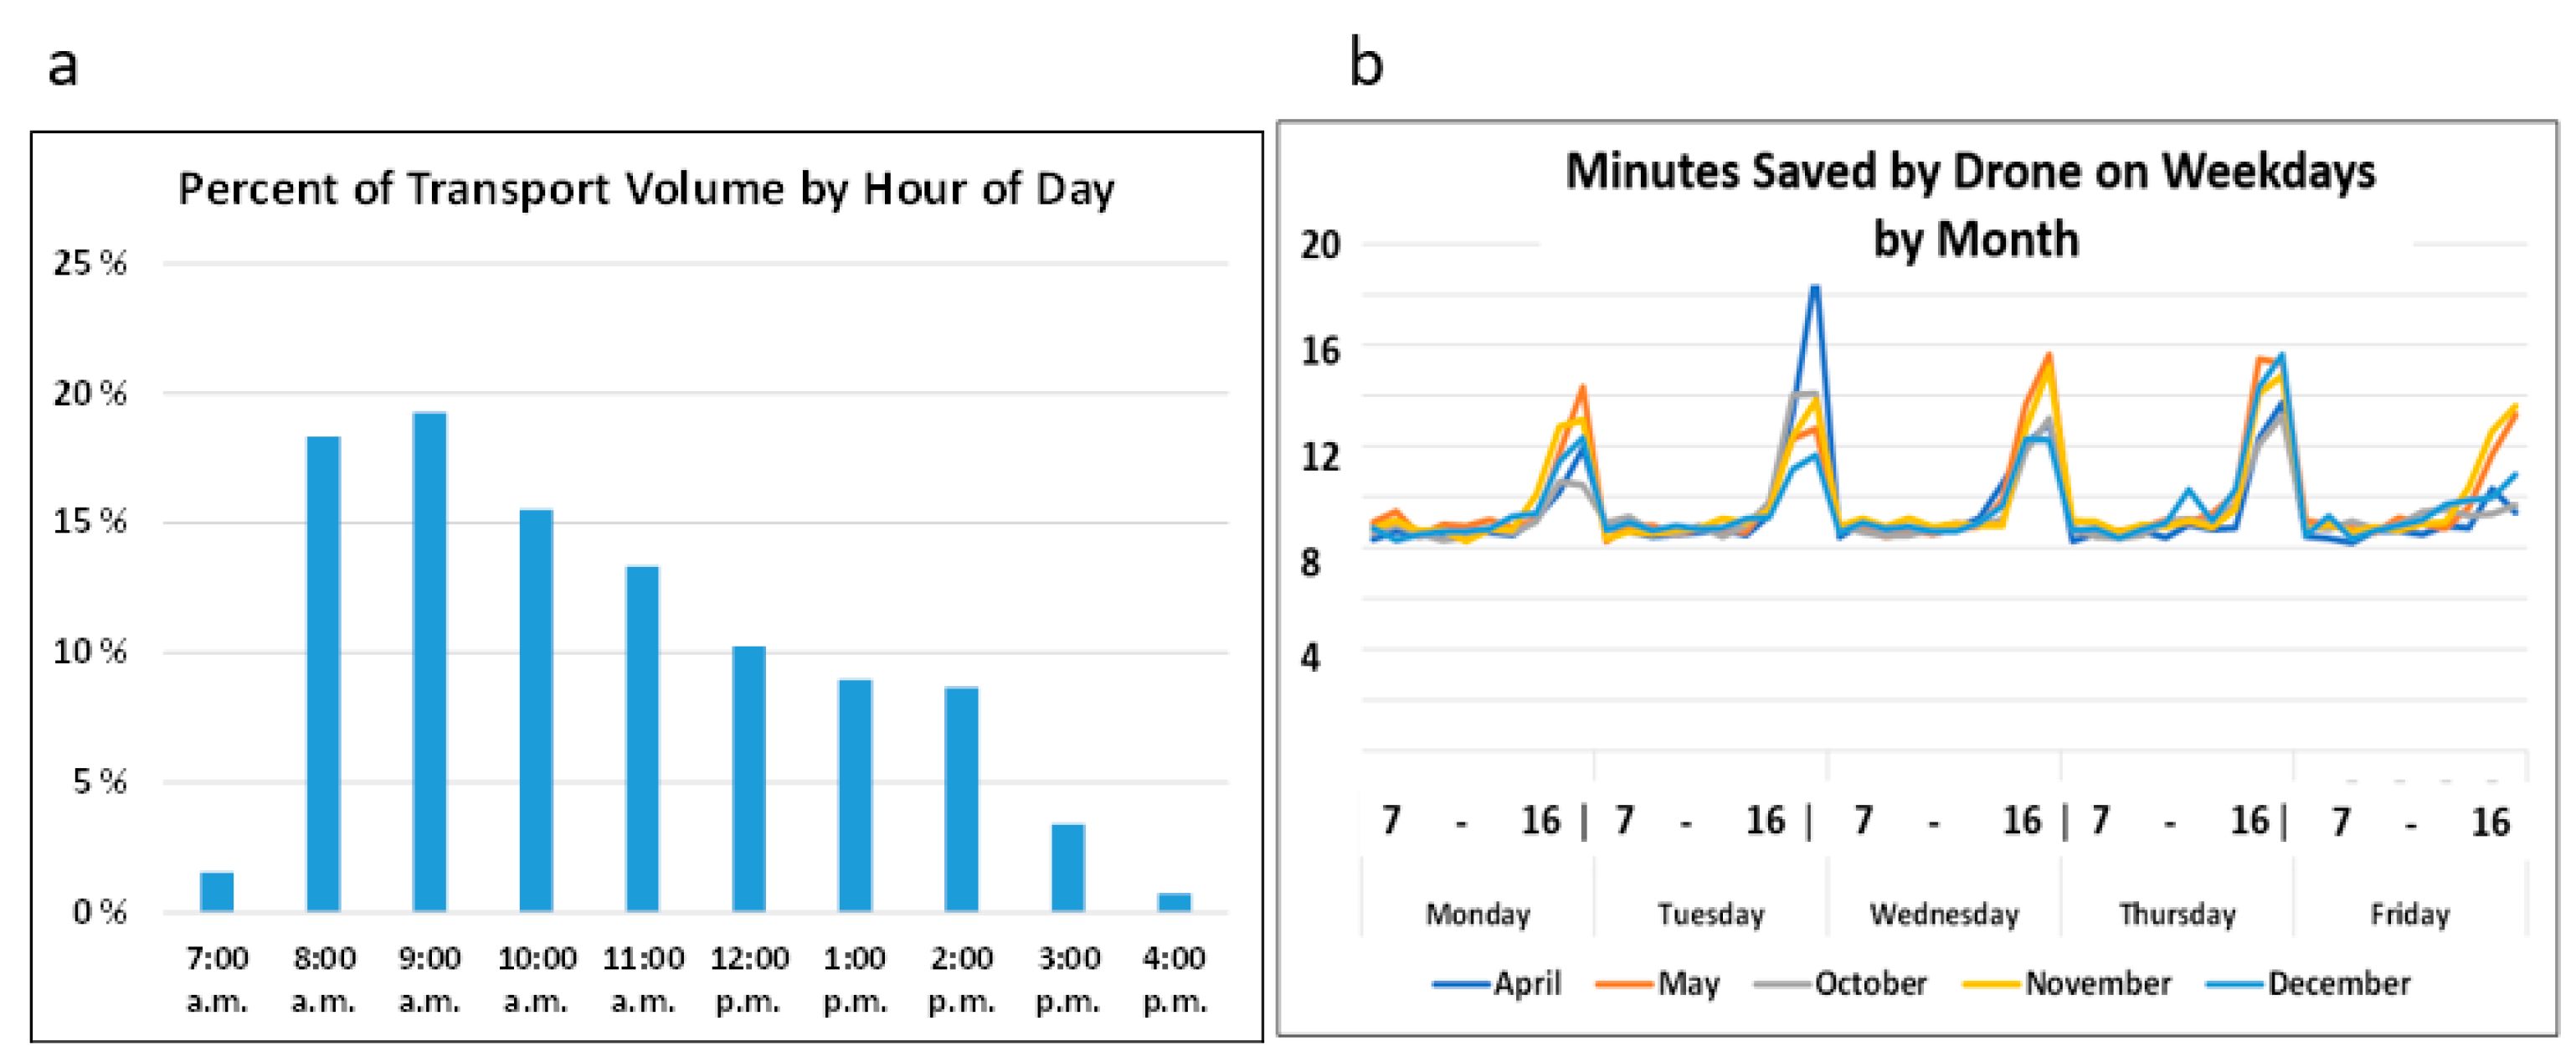
Figure 2). The complete laboratory analytic volume at OUS is 22 million analyses per year, with the largest volume at the National Hospital laboratory, with 12 million analyses. The existing transport volumes across the four institutions between 8 am and 4 pm on weekdays were targeted, consisting of approximately 230,000 samples per year. Road transport times between locations were determined using traffic data sampled every 5 min over 24 h each day for the 12 months from March 2019 to February 2020. These data enabled the construction of driving times for different route frequencies for all routes. The chosen 12-month period was the latest one considered relevant because road traffic was significantly reduced during the COVID-19 pandemic.
Current Ground Transport in Model 1
Biologic sample transport between hospitals was conducted by road transport using dedicated cars with regular deliveries between 8 am and 4 pm and taxis the rest of the day and night. Some routes were point to point, and some were round trips with layovers, carrying samples between multiple locations on the way to their destinations (
Figure 3). Most transports were for routine analyses with less than 3% emergency samples. Transport times were variable owing to traffic congestion and seasonal weather.
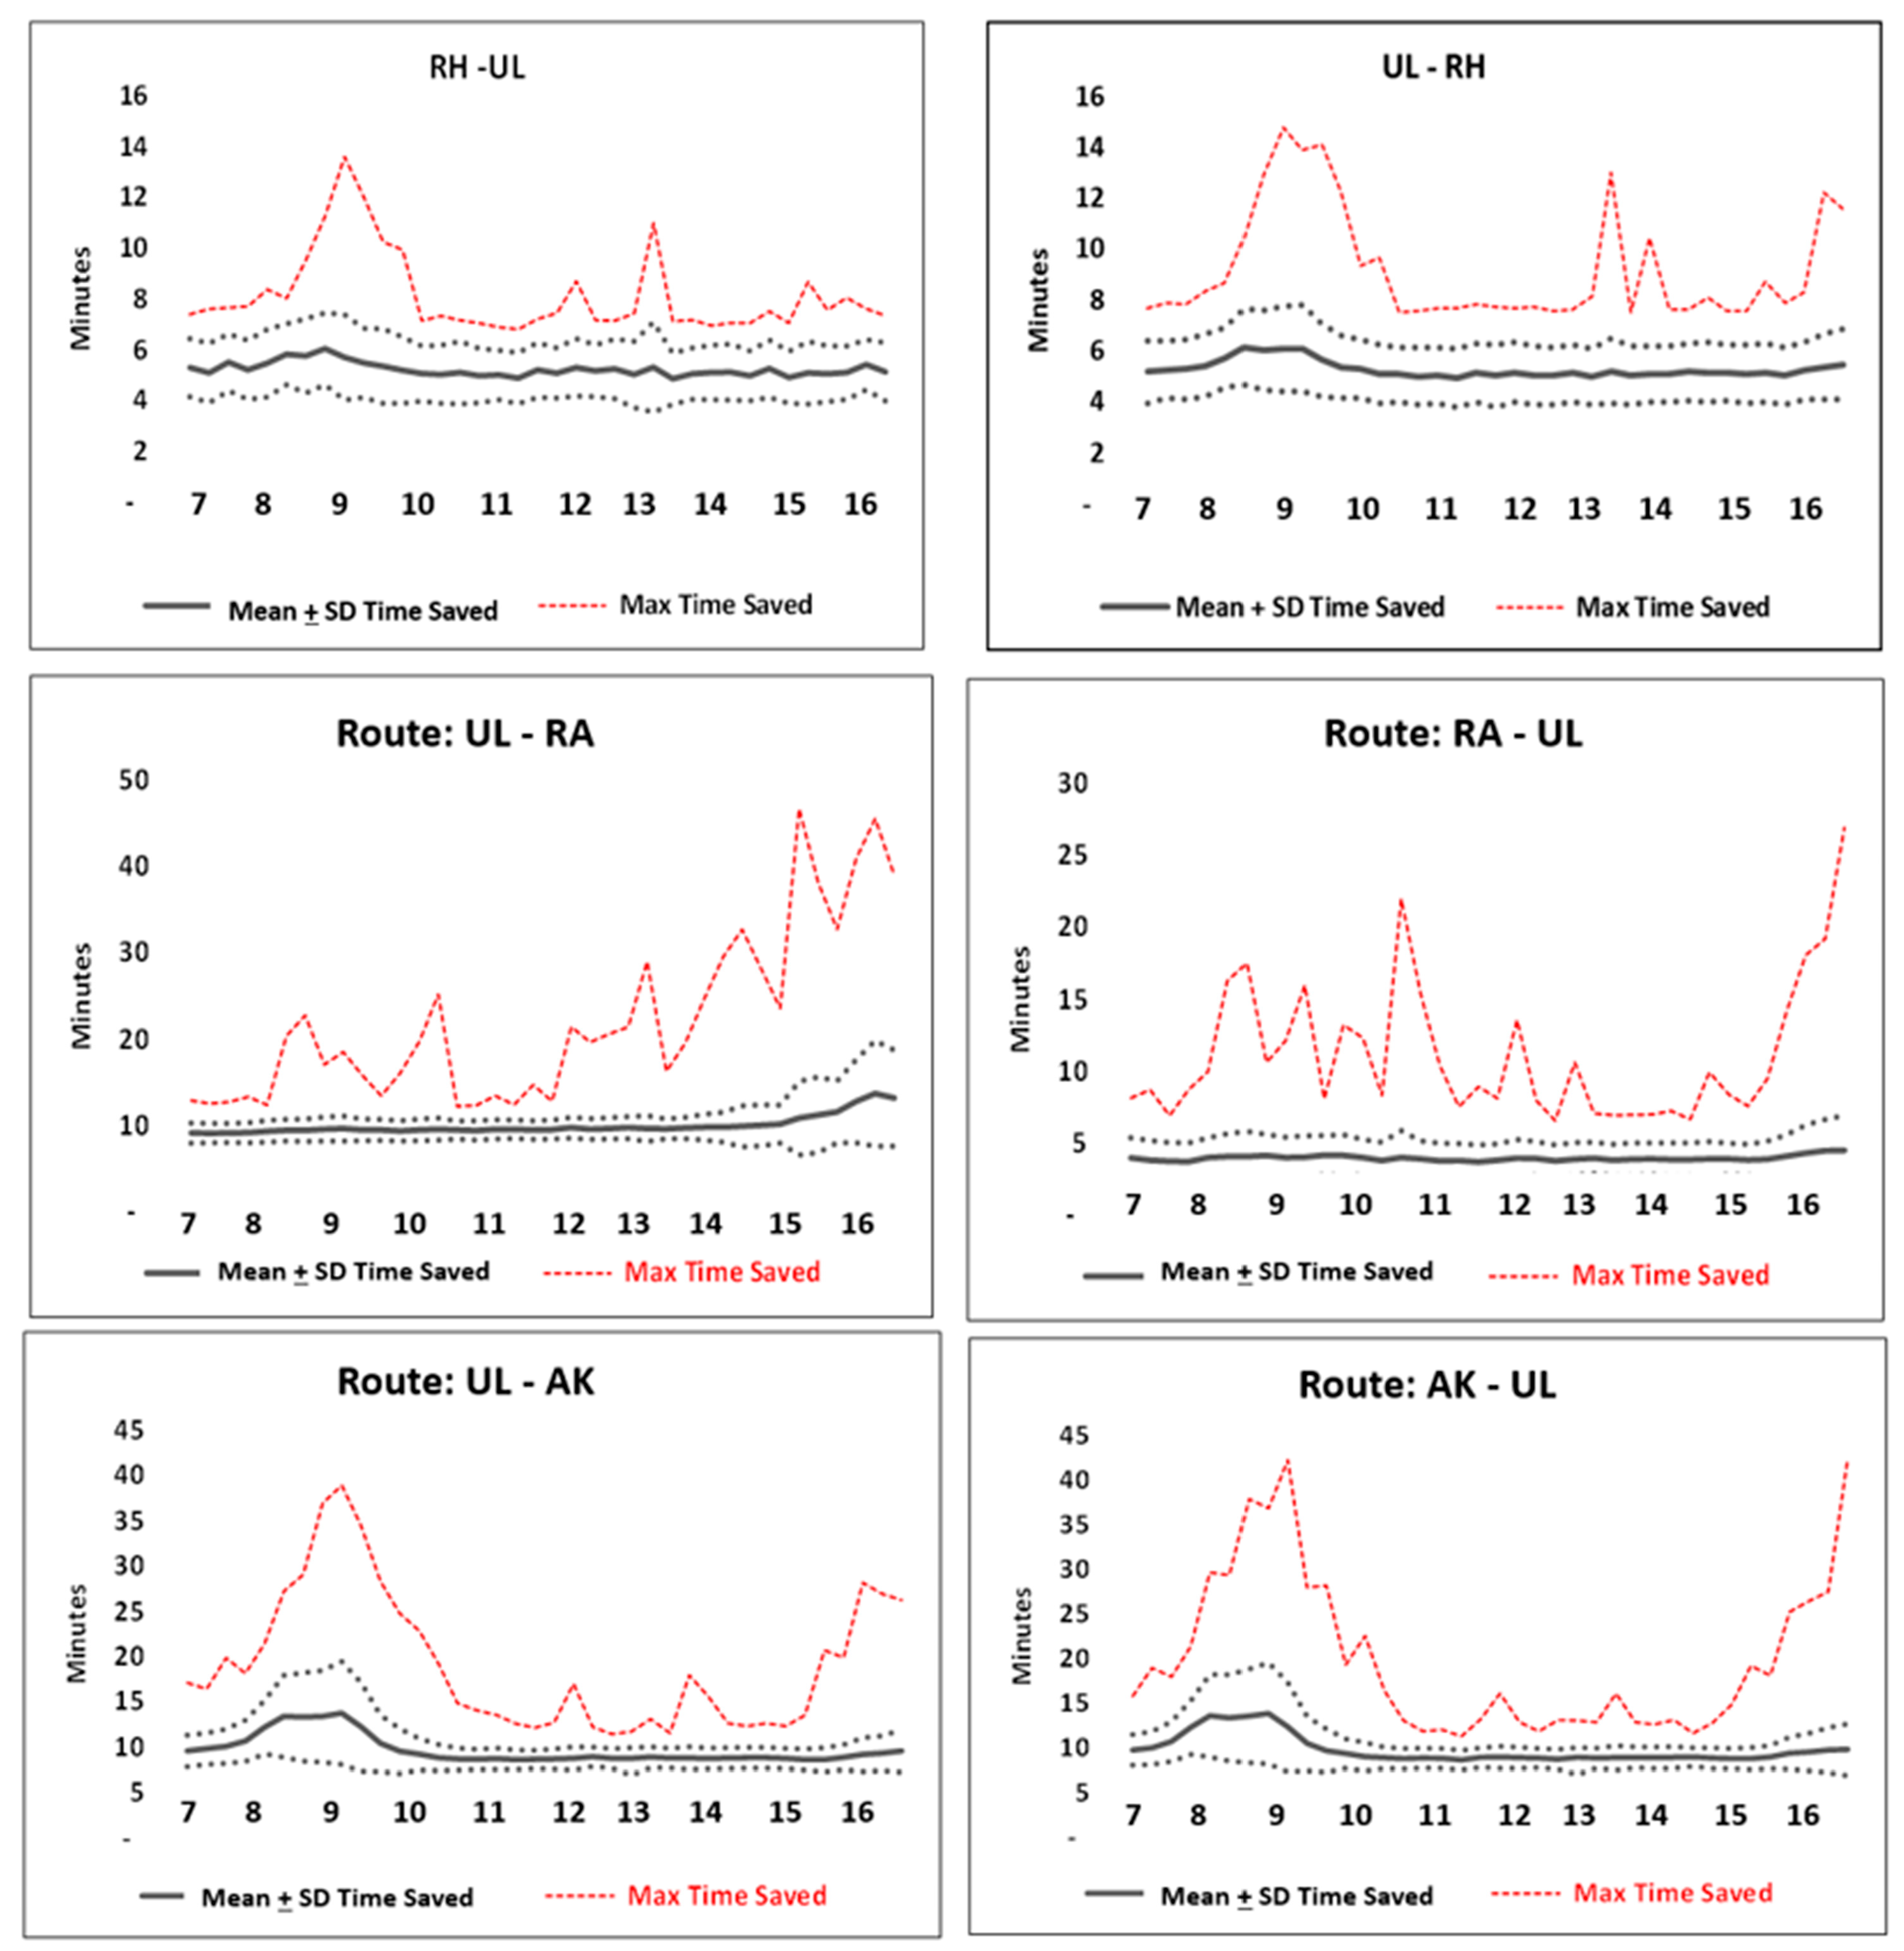
After analyzing all routes, the most complex current route, a four-stop transport from Ulleval Hospital to Aker Hospital, was chosen to illustrate some of the crucial topics in this study (
Figure 3). This route had layovers where samples were carried between multiple locations from Ulleval to the destination at Aker. However, such a route is considered irrelevant for future drone service with short flight times because serial transports include legs with multiple drone takeoffs and landings, involving significant hovering time with delays carried over to later transport segments. Driving times and simulated drone times based on 100 km/h drone speeds were compared for both the existing Ulleval–Aker route and a direct non-stop model, as depicted in
Figure 3. Four-minute hovering times were applied for takeoffs and landings based on previous test flights at OUS.
The needed physical drone capacity depends on the maximum payload transported. The daily payload for this OUS route varied between approximately 2.2–2.8 kg with estimated volume in drone of 3–3.5 L. This defines the needed drone capacity of one daily transport, whereas multiple trips will reduce this drone size proportionally to number of flights.
Transport Times in Existing Routes
The roads between the hospitals consist of a motorway with heavy traffic causing congestion in the mornings and afternoons and streets with ordinary city traffic. The driving times for all routes at five-minute intervals over each day for the entire 12-month period were used to construct driving times for each route based on departure times every 30 and 60 min during daytime hours. The Norwegian Public Roads Administration provided access to traffic registration tower data along the roads under the Norwegian license for public data (NLOD). Data for 1.31 million time points at five-min intervals were downloaded as Microsoft Excel files. The Road Administration is not responsible for the use of the data in this study. Aggregated driving times between the registration towers were used for the relevant distances. The NLOD register did not cover the transport route from Ulleval University Hospital to the National Hospital. These transport times were obtained by analyzing 4700 completed transports through 2019.
During preliminary test flights in the OUS area, it was found that the influence of wind conditions on flight times may cause variations from 0 to 25% of calculated mean times, with tailwinds decreasing and headwinds increasing the flight times. Random variations of ±20% of estimated means were used for all routes in the drone flight time simulations.
2.1.2. Model 2
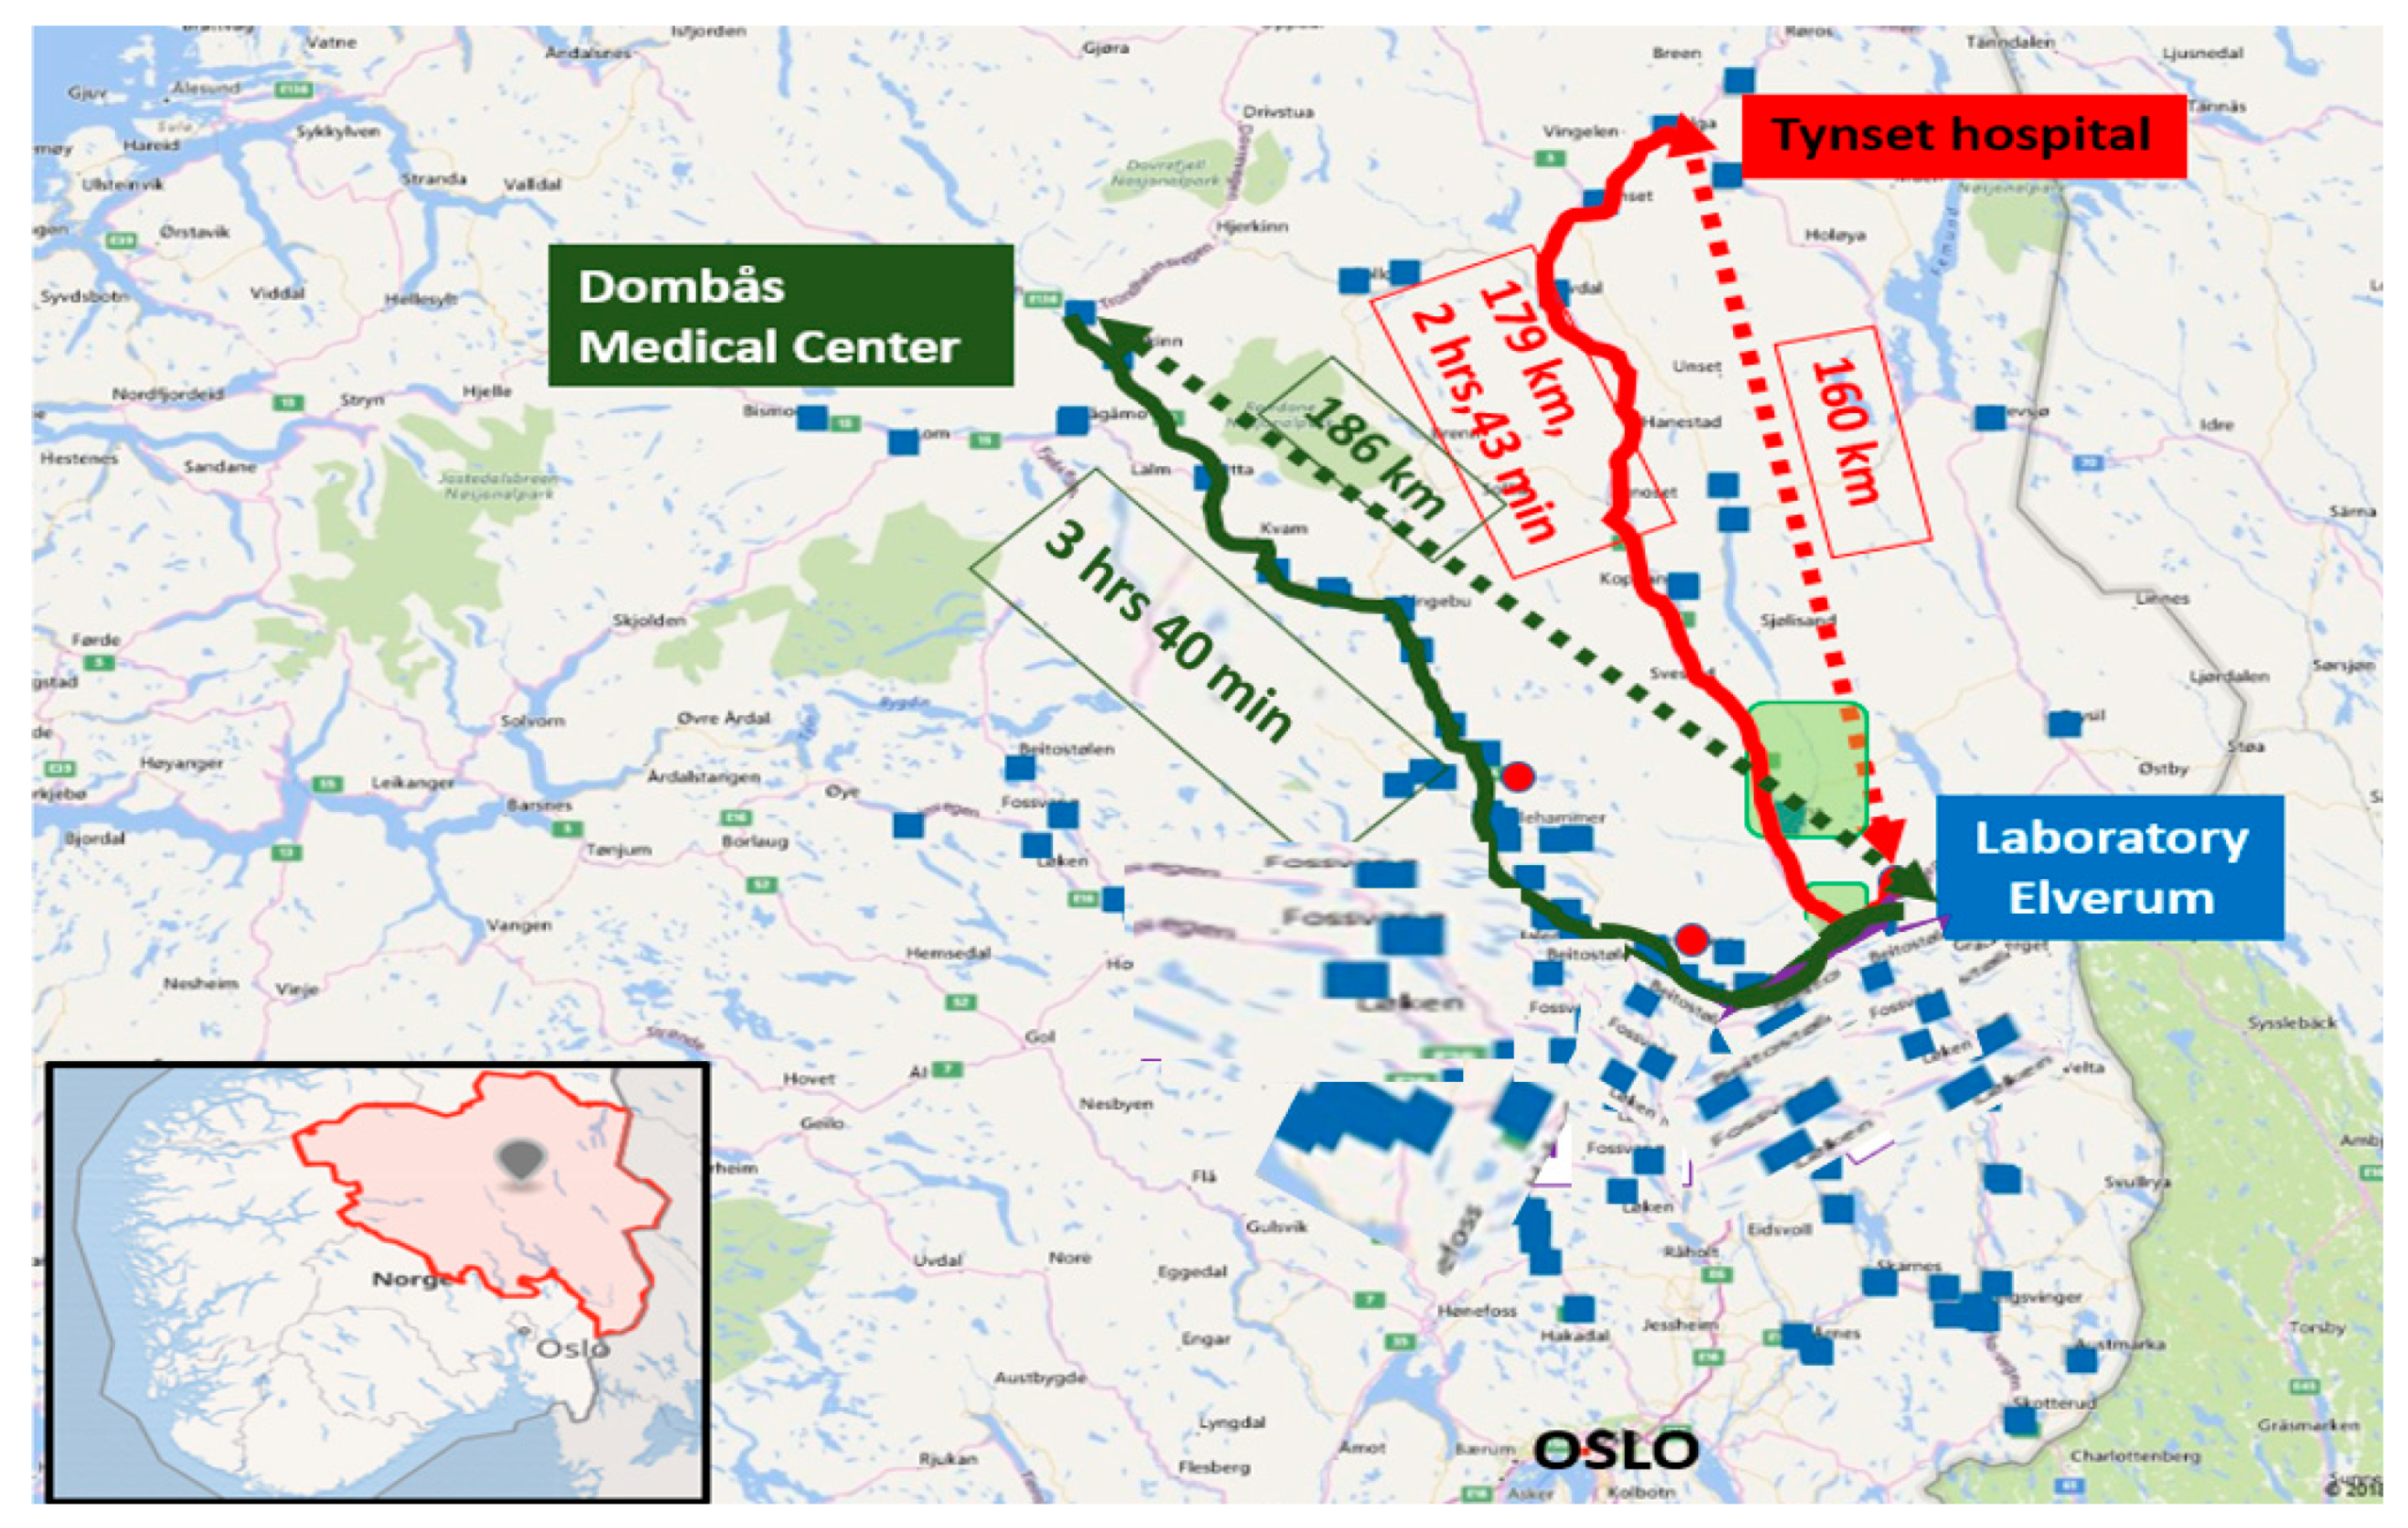
The Central Hospital of Innlandet provides service over a 52,072 km2 area (approximately the size of Denmark), comprising 42 local communities with 370,000 inhabitants. It currently has 8700 employees, with patient treatment at 40 primary locations and 25 emergency stations. The hospital plans to have a centralized structure by 2030, with one primary institution, three additional institutional locations, and a central laboratory at the city of Elverum. Drone services are explored as a transport solution to supplement the current logistics, which conduct transport between their institutional locations and 80 local healthcare centers (i.e., general practitioners).
This model analyzes two long-distance routes with 179 km and 262 km ground distances and driving times of 2 h 43 min and 3 h 40 min, but similar Euclidean distances of 160 km and 186 km relevant to drone transport (
Figure 4).
Current Transport Routes and Times
All transports of biologic samples from the two locations to the laboratory were served by regular car transports carrying other goods, with some routes organized by the hospital and some chartered from transport companies. Existing transport was multi-stop routes with pickups at multiple locations. The current study targeted nonstop ground and drone routes to compare delivery times for controllable and straightforward models.
Since the NLOD system did not fully cover the locations in Innlandet, hourly driving statistics for the model route driving times from Google Maps were used. Hourly data were obtained, but these gave only 5–15 min resolution of the driving times, somewhat larger than the 5-min intervals of the NLOD data. Using a heuristic approach based on distances covered by the NLOD system, driving times were estimated as 0.781 × (Google Maps time) + 8.5 min. These estimates correctly categorized all 649 hourly driving times during the daytime in December to February (expected to have the largest deviations from normal due to winter season) within five-minute intervals, except for seven extreme values of NLOD times. This method was therefore used for all driving times in the model.
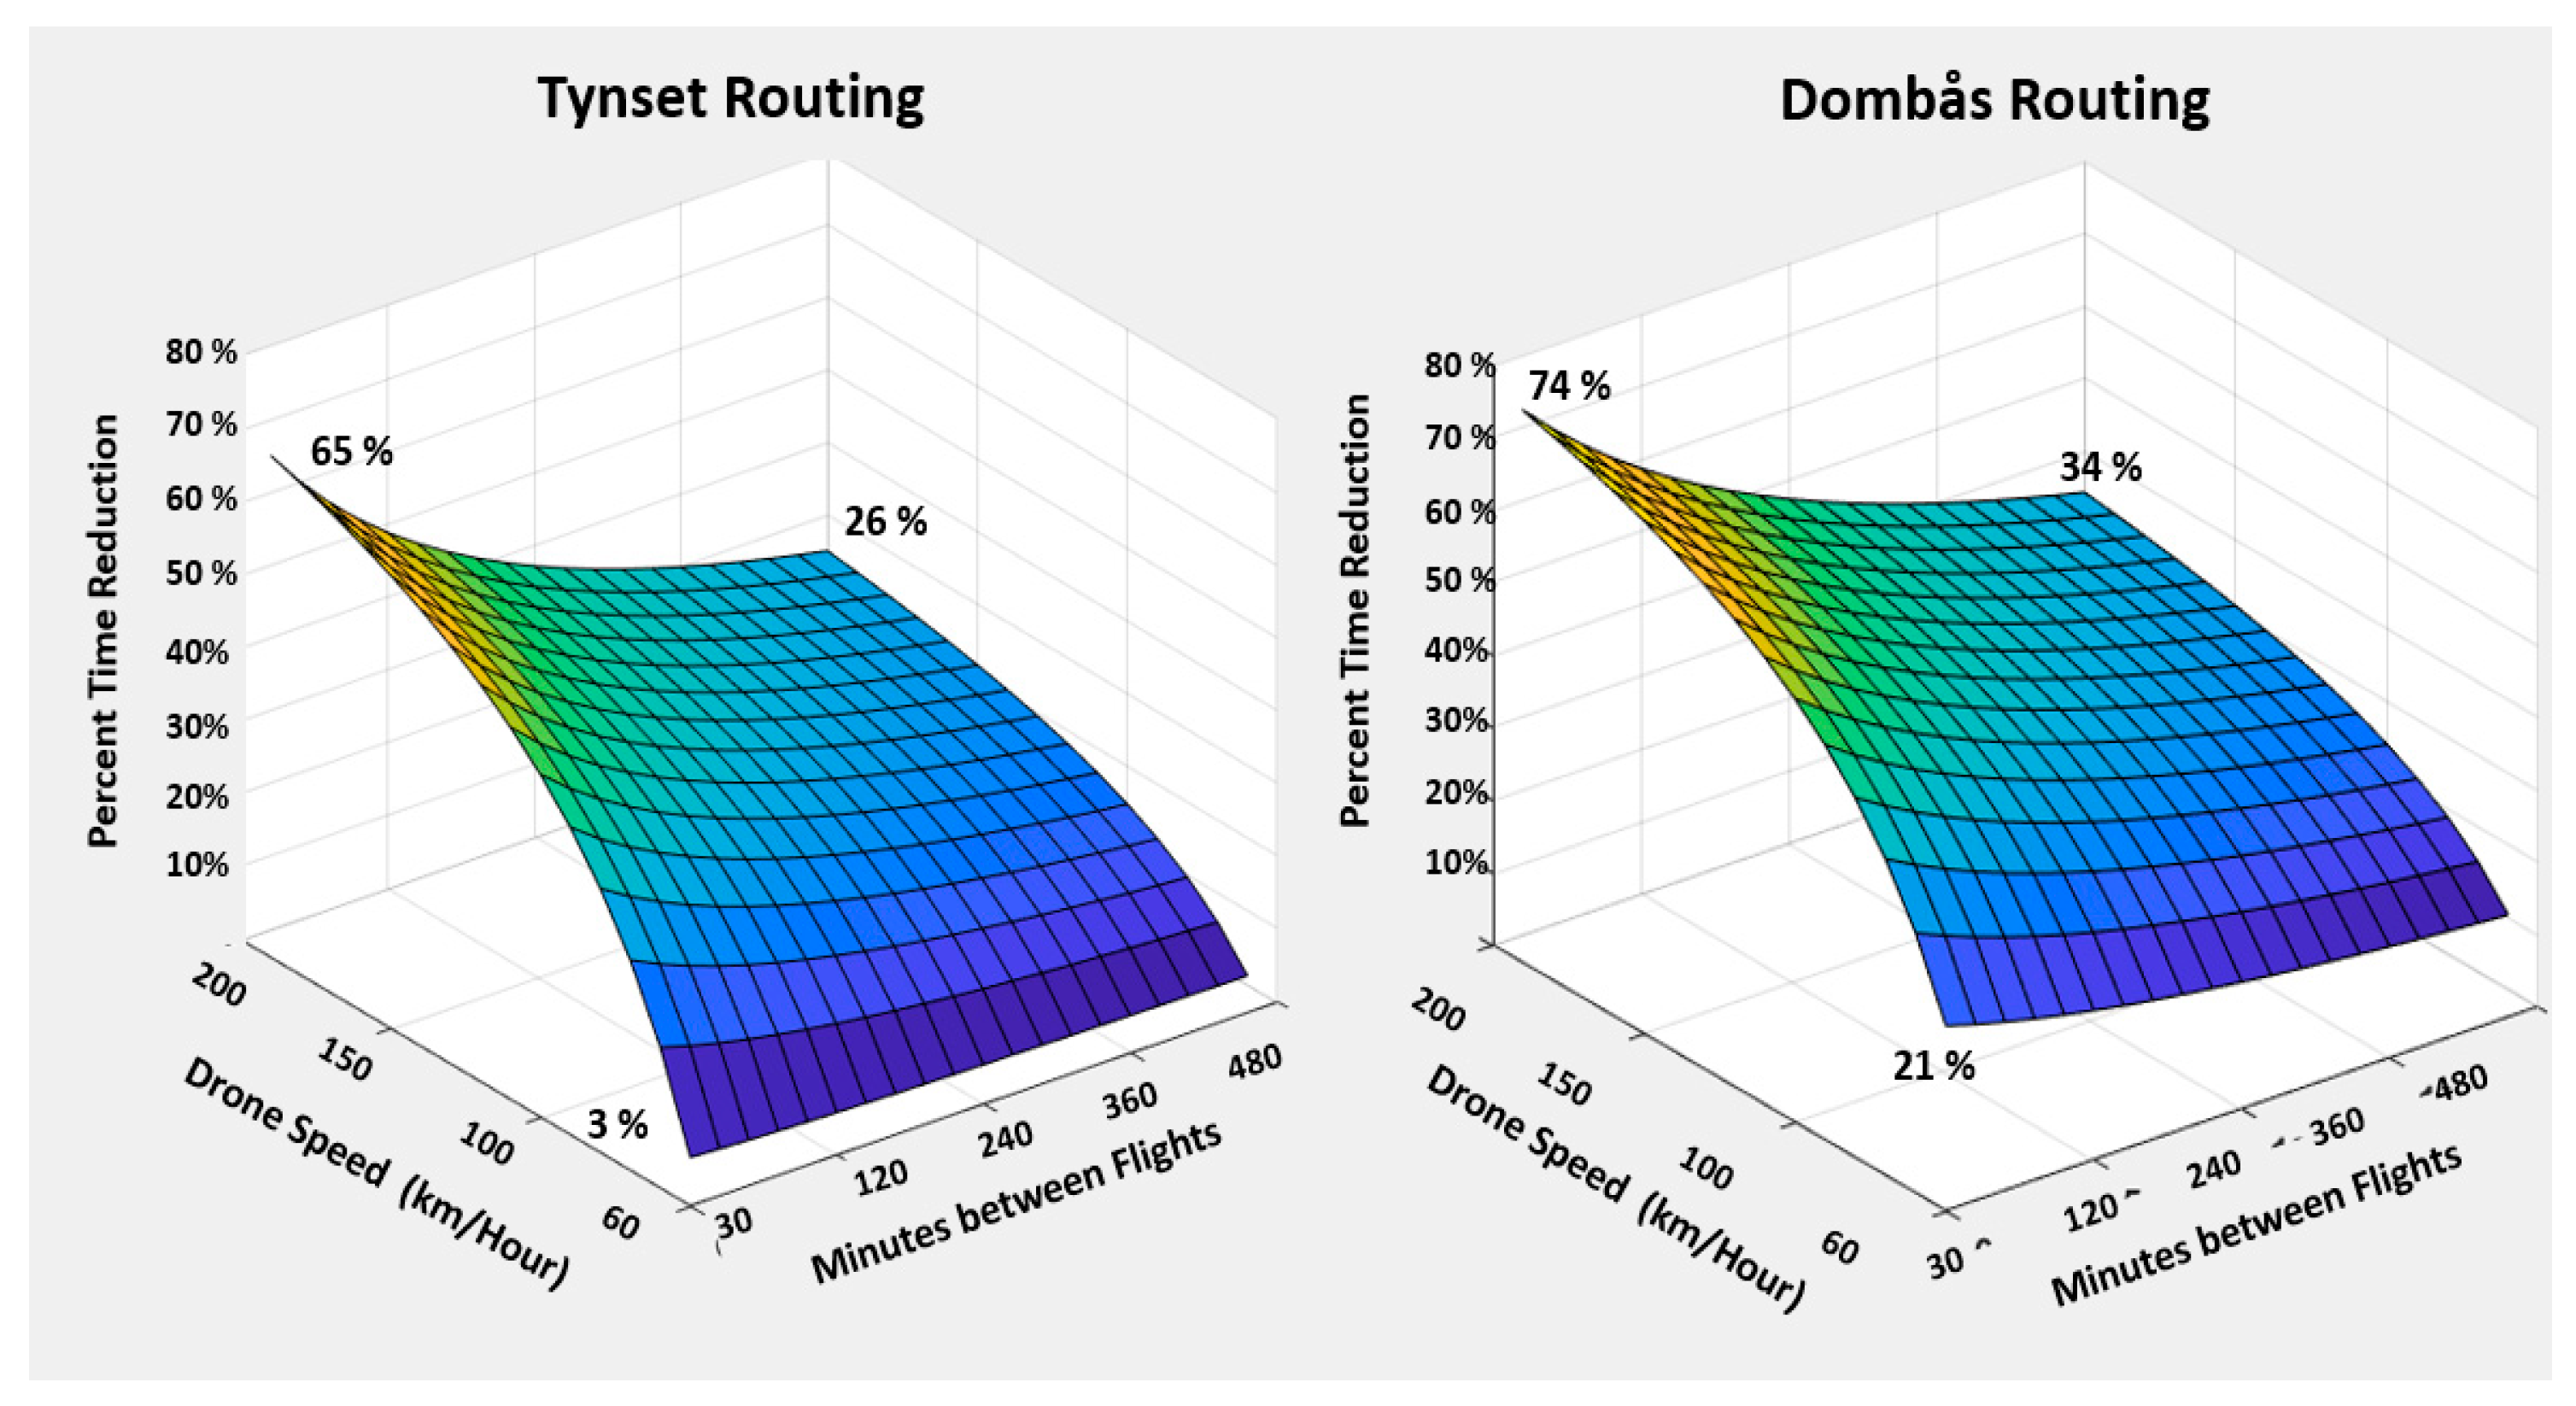
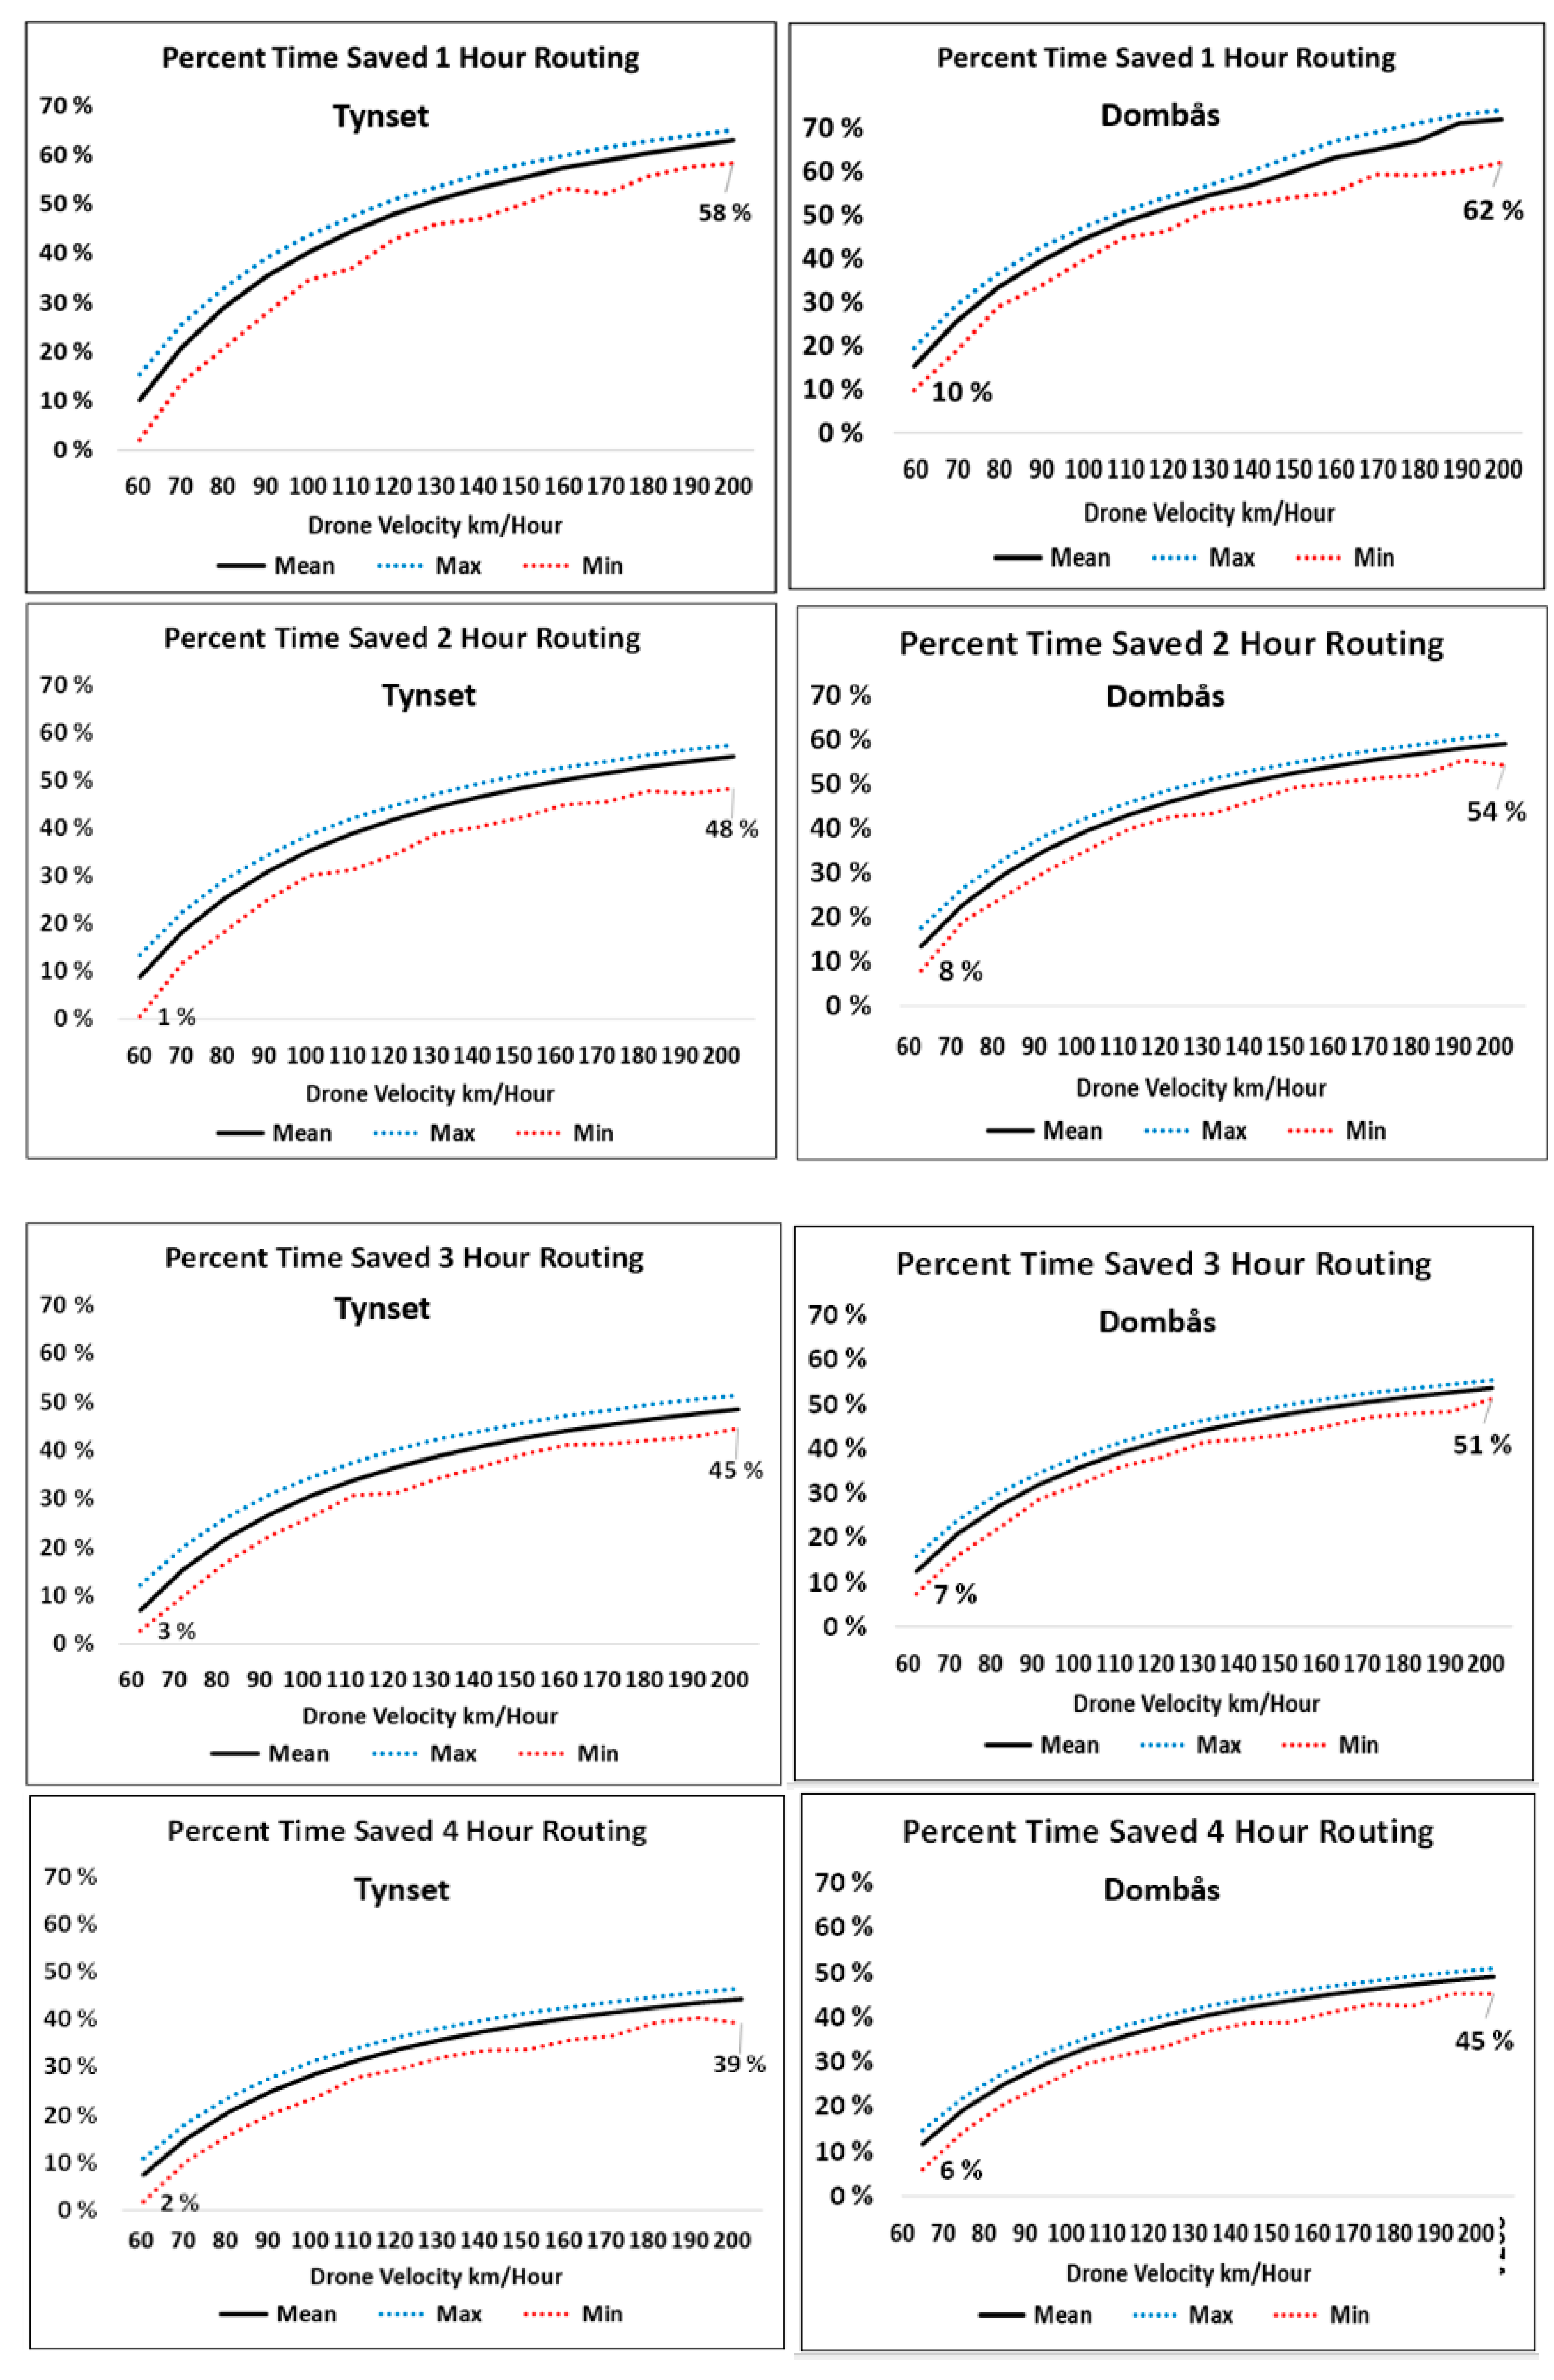
Both Model 2 routes passed through the cities of Lillehammer and Hamar and were subject to the same delays during times of traffic congestion. Based on hourly registrations, 36% of the days from December to February had delays of 15–35 min during afternoons between 2 and 4 p.m. (ignoring four cases with extreme delays caused by closed roads). These delays were mainly caused by traffic in the Hamar city region, part of both routes. The average car speed for 200 trips of each route was computed by dividing distance by actual driving times, resulting in an average of 75 km/h for Dombås and 76 km/h for Tynset. The longest delays in the morning were 15 min, constituting 11% and 6% delays in the Tynset and Dombås routes, respectively. Corresponding delays in the afternoon were 27% and 20%. The sensitivity analyses applied these percentage delays in the morning and afternoon in 10,000 Monte Carlo simulations of each route.
The daily payloads in the Tynset and Dombås routings were approximately 1.2–1.5 kg and 0.18–0.24 kg, respectively, equivalent to drone volumes of 1.7 and 0.32 L. Thus, these routings could be served by smaller drones than the OUS model.
2.2. Ground Transport Costs in the Two Models
Driver costs were based on the standard Norwegian salary for the occupational driver group for all cases. Total hourly wages, including overtime and evening compensation when relevant, were calculated and summed to salary costs for all transports, including salary for mandatory rest periods and employer’s costs. All OUS transports could be conducted during ordinary working hours. The Dombås and Tynset routes could include afternoon salary compensation, depending on the departure time, because the return time could be up to 7 h after normal working hours (until 5 pm) for the latest departures.
The hospitals in the studied models are implementing electric and zero-emission cars according to the political ambition in Norway to reduce CO
2 emissions. This had reached 31% of the cars at OUS in 2021 (some lower percentages were at Innlandet Hospital). By 2022, 90% of new cars sold in Norway will be electric, and with the Norwegian legislation that all new cars shall be electric by 2025, car costs in this study were therefore assessed using electrical cars with a range of 500 km. The standard costing methods for public health enterprises were applied. These cost estimates included depreciation costs based on distance driven, recommended service intervals, insurance costs according to distance, standard service costs, and tire replacement. Standard consumption of electrical power based on information from producers was used, along with electricity costs of NOK 1.15 per kilowatt-hour (average price 2020 according to Nord Pool statistics,
https://www.nordpoolgroup.com, data accessed on 12 October 2021). The reduction in the range of electric cars in cold temperatures was not considered. This factor may cause increased electrical power consumption and thus increase the costs.
2.3. Costs and Time Measures for Comparing Ground and Drone Transport
Drone costs have previously been assessed using multiple variables, including flight hours [
35]. For drone transport to provide economic advantages, drone transport costs should be lower than ground transport costs for existing services, i.e., offer shorter transport time for a given cost. This study was not intended to perform complete economic evaluations. Instead, the approach was to quantify ground transport costs and relate these to the time savings using drones while considering transport volumes, borrowing from the incremental cost-effectiveness ratio (ICER) method often applied for ‘pairwise’ measures between two strategies [
54,
55,
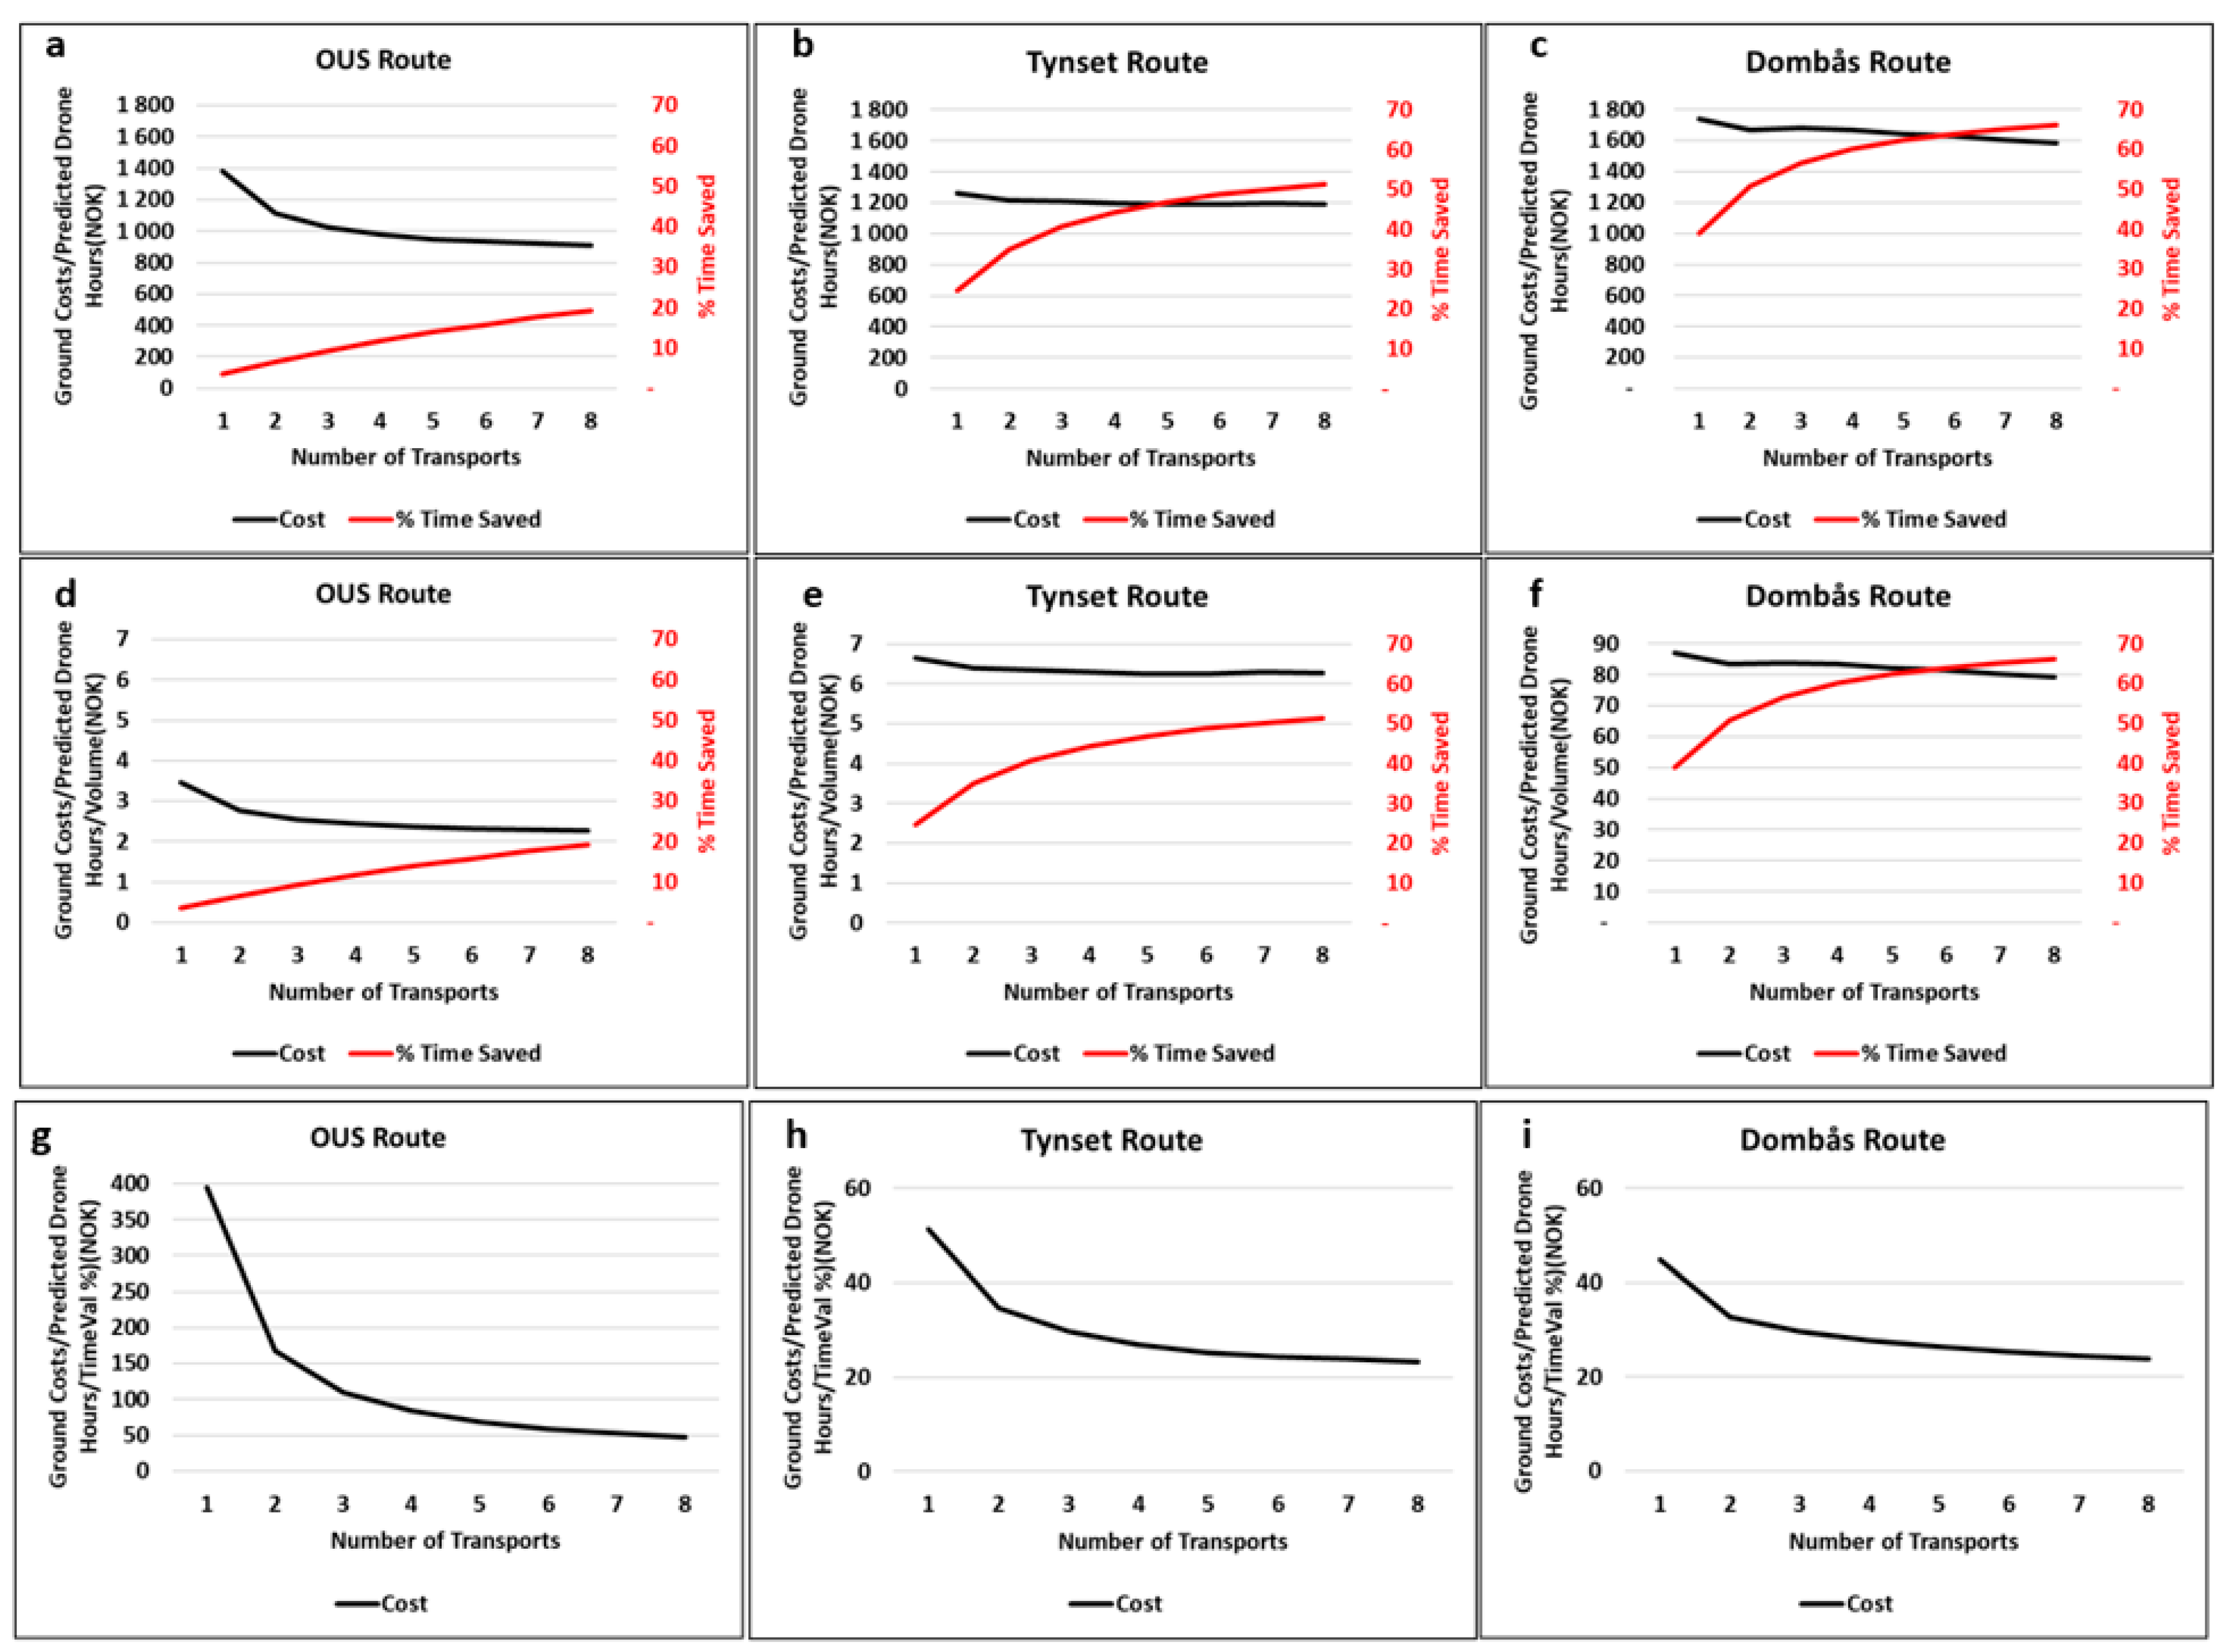
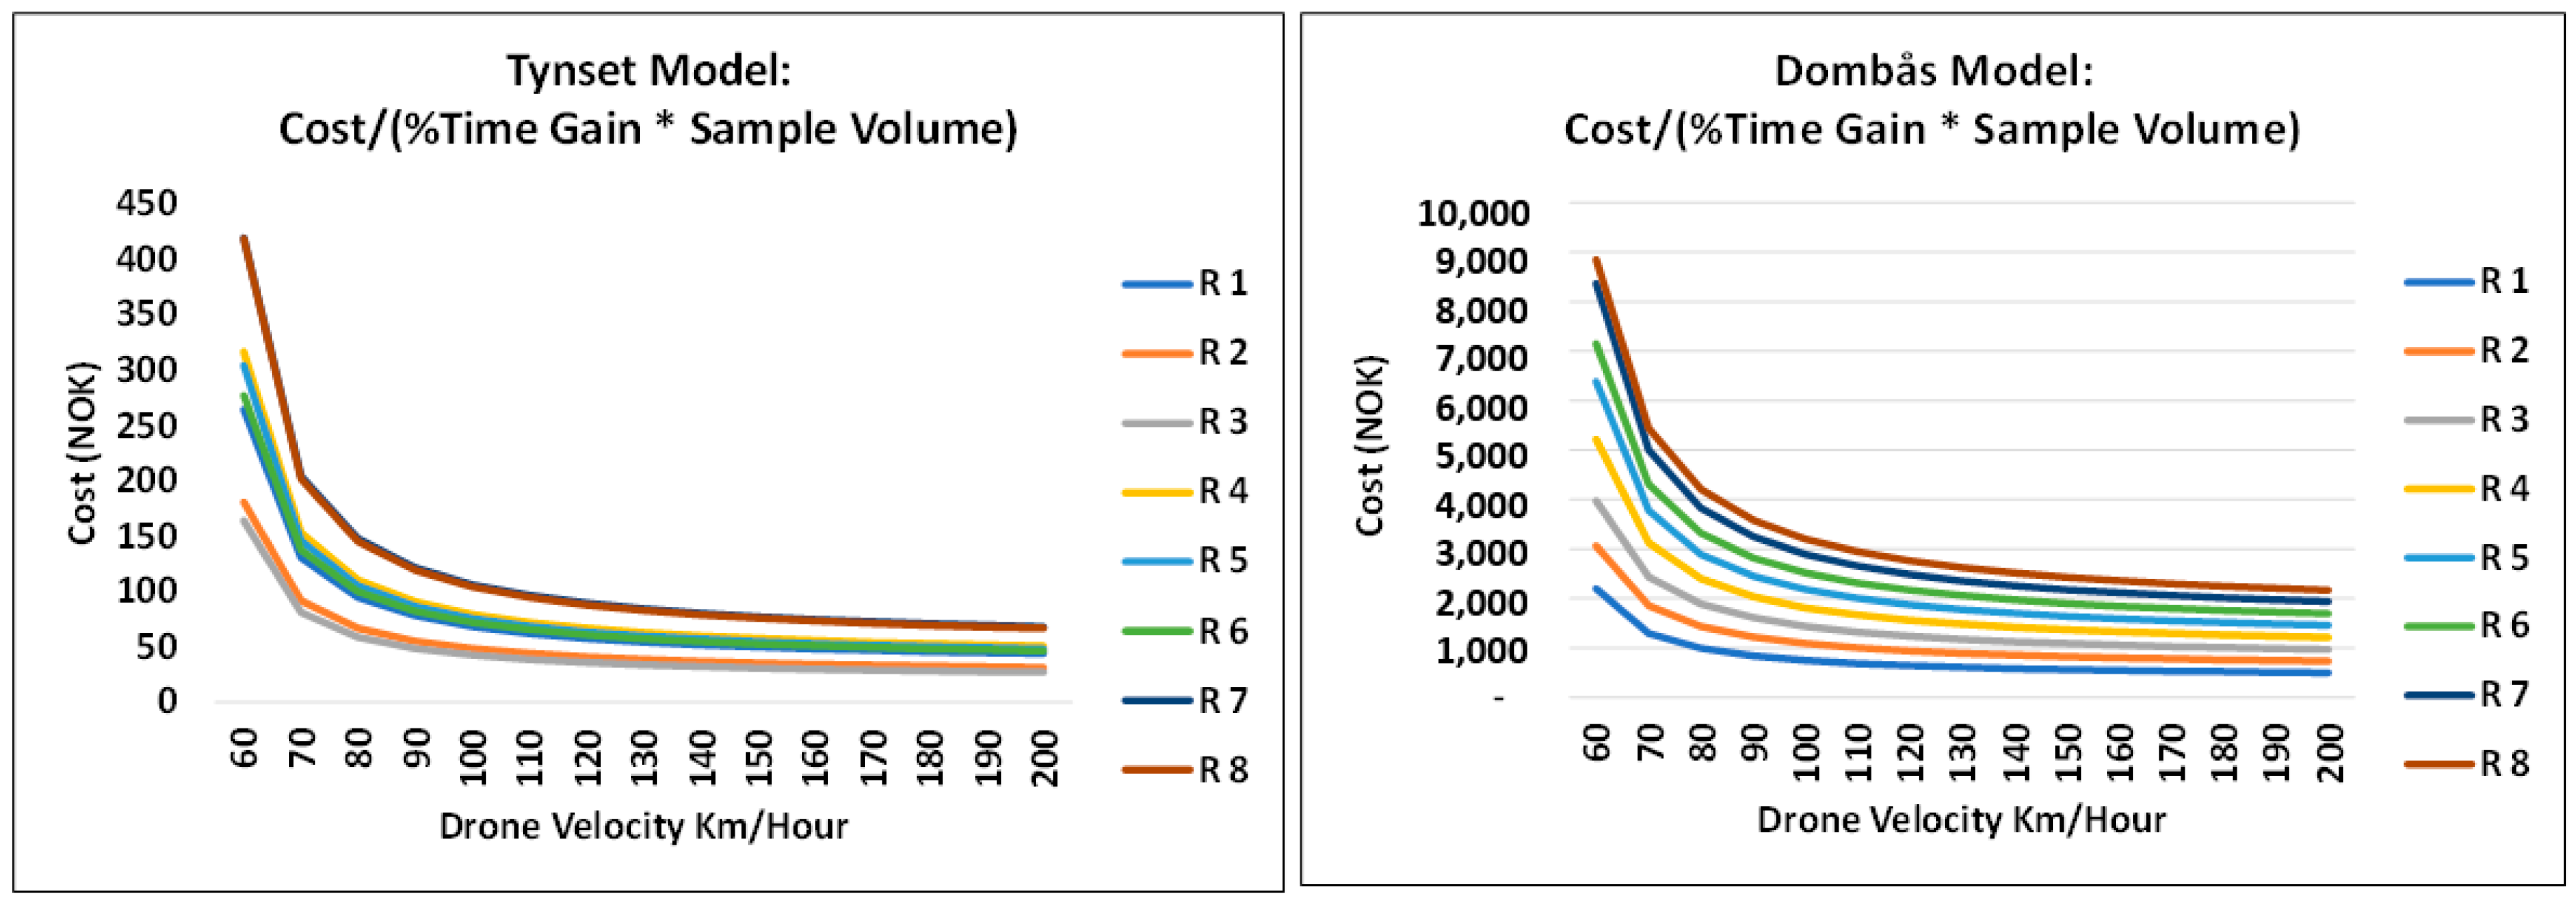
56]. Ground costs were calculated for one to eight ground routes per day and applied per drone flight hour as a proxy for allowed hourly drone costs. This approach presumes that costs related to factors such as the depreciation of drone technology, drone operations, and airspace taxes are linear functions of flight hours. These assumptions may not be precise, but I could not find guidance for more specific estimates.
With an increasing number of routes, the required number of vehicles differed across locations because of the longer driving times for Tynset and Dombås. At OUS, one car could serve eight deliveries per day. At Dombås, one additional car was needed for each additional route, whereas the need for more cars was intermediate and stepwise in the Tynset model. Similarly, one drone could handle all transports in each direct route at OUS, whereas three drones were needed to cover eight routes at Dombås and Tynset.
The time savings using transport frequencies from one to eight routes during an eight-hour day were assessed, assuming that multiple routes were evenly distributed throughout the day. Therefore, for one transport per day, I assume that it occurs at the end of the day (4 pm). For two routes per day, I assume departures at 12 pm and 4 pm (i.e., at a 240-min interval). Based on driver and car costs, total transport costs were calculated at all specific departure times (depending on working time after 5 pm) for all routes, aggregating each route cost when calculating ground transport of multiple routes.
I used Microsoft Excel 2016 with Power Pivot to aggregate the 1.3 million ground driving data points and perform simulations. MATLAB R2021a was used for the 3-D graphics.
2.4. Concept for the Analytic Approach
Consider a medical center operating for T hours per day starting at 8 a.m. as an illustrative model. Assume an even distribution for biologic sample transport demand throughout the day and that the batch in each transport has a similar volume. I only focused on departures within the daily operating hours between 8 a.m. and 4 p.m. in the current models.
Let the cost of a single ground roundtrip between a medical center (origin of biologic samples) and the analyzing laboratory be C. The daily operating hours are T, the daily volume of samples V, and the interval between transport tours is t. Then:
Total costs for all transports
Average number of samples A in each batch is
Let G be the ground driving time and D the drone flight time, and assume that the samples entering a transport container waiting for departure are evenly distributed over the period t. Thus, the average waiting time ω for all samples in a batch before transport is ω = t/2 for the complete batch.
I defined the total time for ground transport by
and the total time for drone transport by
The time saved by drone delivery, assuming ω is equal for ground and drone transport, is then:
Let x be ω as a percentage of G
and let y be D as a percentage G
Then
and the relative time savings value is defined as
As seen from this equation, shorter drone times and lower time between transports relative to ground time result in higher values of TimeValue %.
2.5. Explanatory Illustrations of Concept Using Theoretical Examples
Suppose that C = 1, T = 8 h, and V = 400 samples. The cost per sample in a batch is given by C/A. Let G = 150 min and D = 60 min and consider two cases: (i) a single transport route at the end of an 8-h day; (ii) transports with four routes performed at 2-h intervals. These cases give the results shown in
Table 1.
It is seen from
Table 1 that, whereas costs per sample increase four-fold, total transport time is reduced by 46% with car transport and 60% with drone transport.
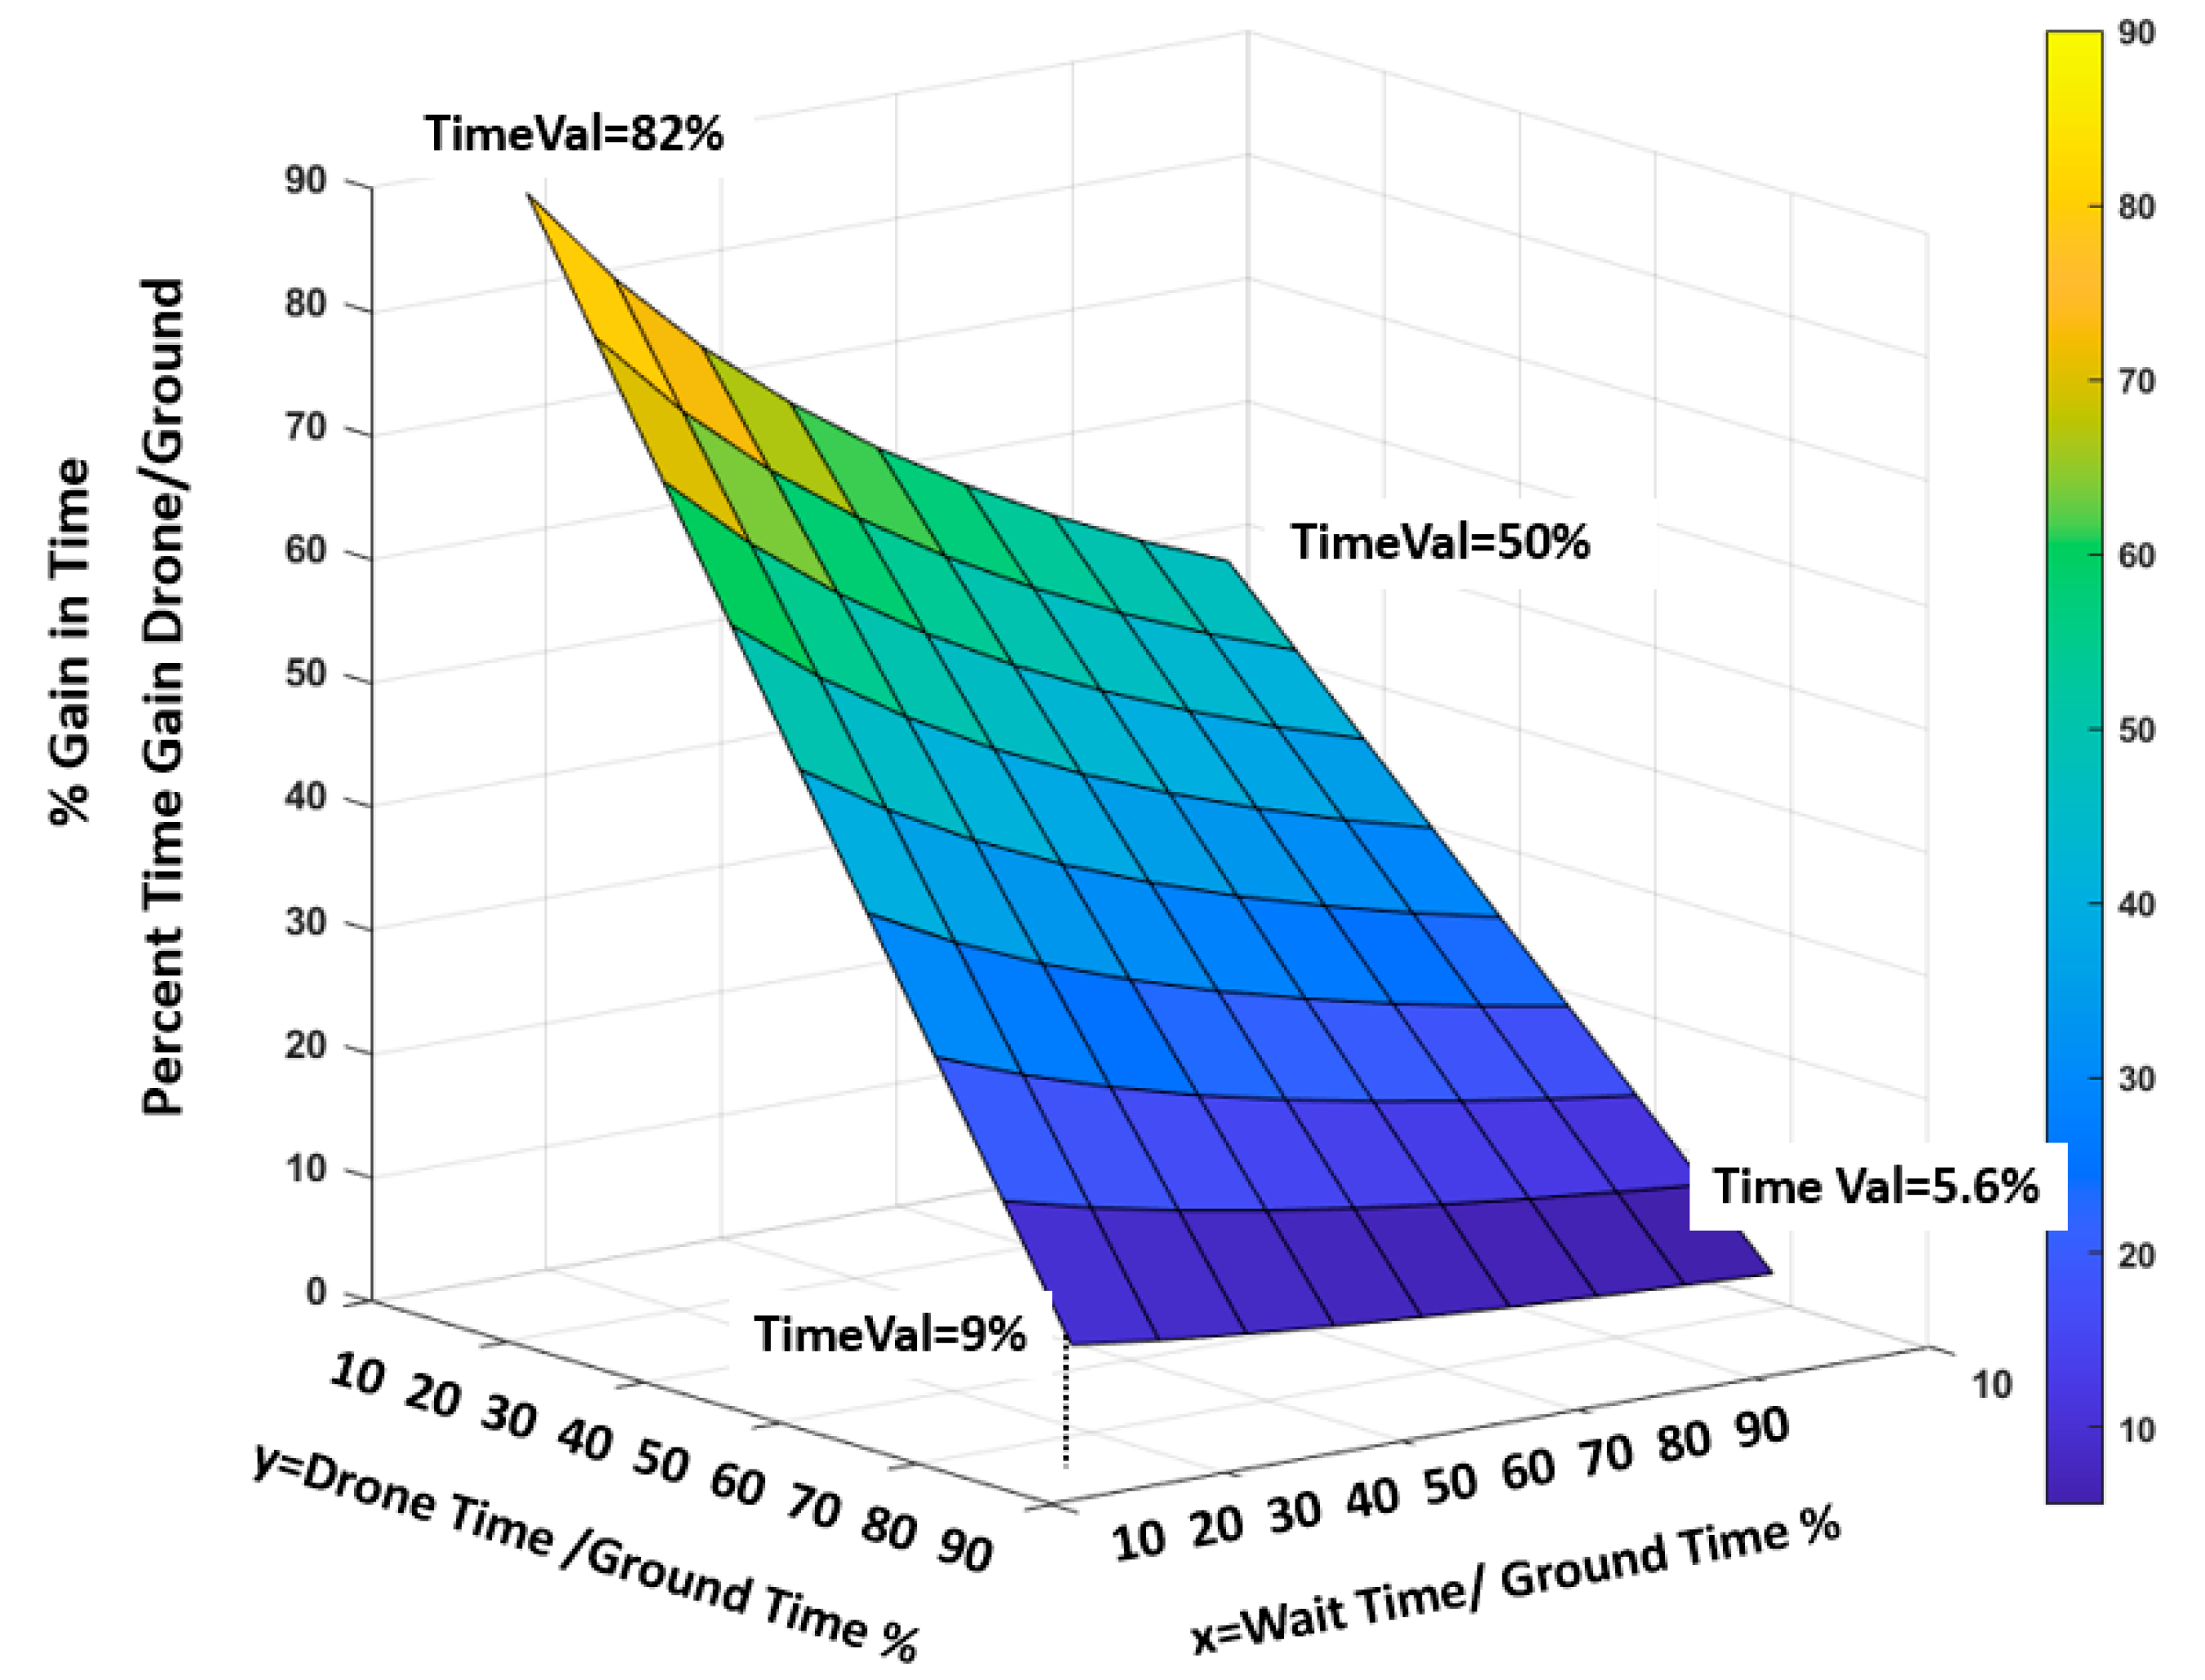
2.6. The Effects of ω and DT Relative to GT
If we set G = 1, Equation (10) may be depicted by the graph in
Figure 5, showing the effects on TimeValue % of y and ω varying from 10% to 90% of ground transport time. The figure illustrates a crucial balance between drone speed (proxied by drone flight time) and transport interval (ω), with longer ω decreasing the percentage of time saved.
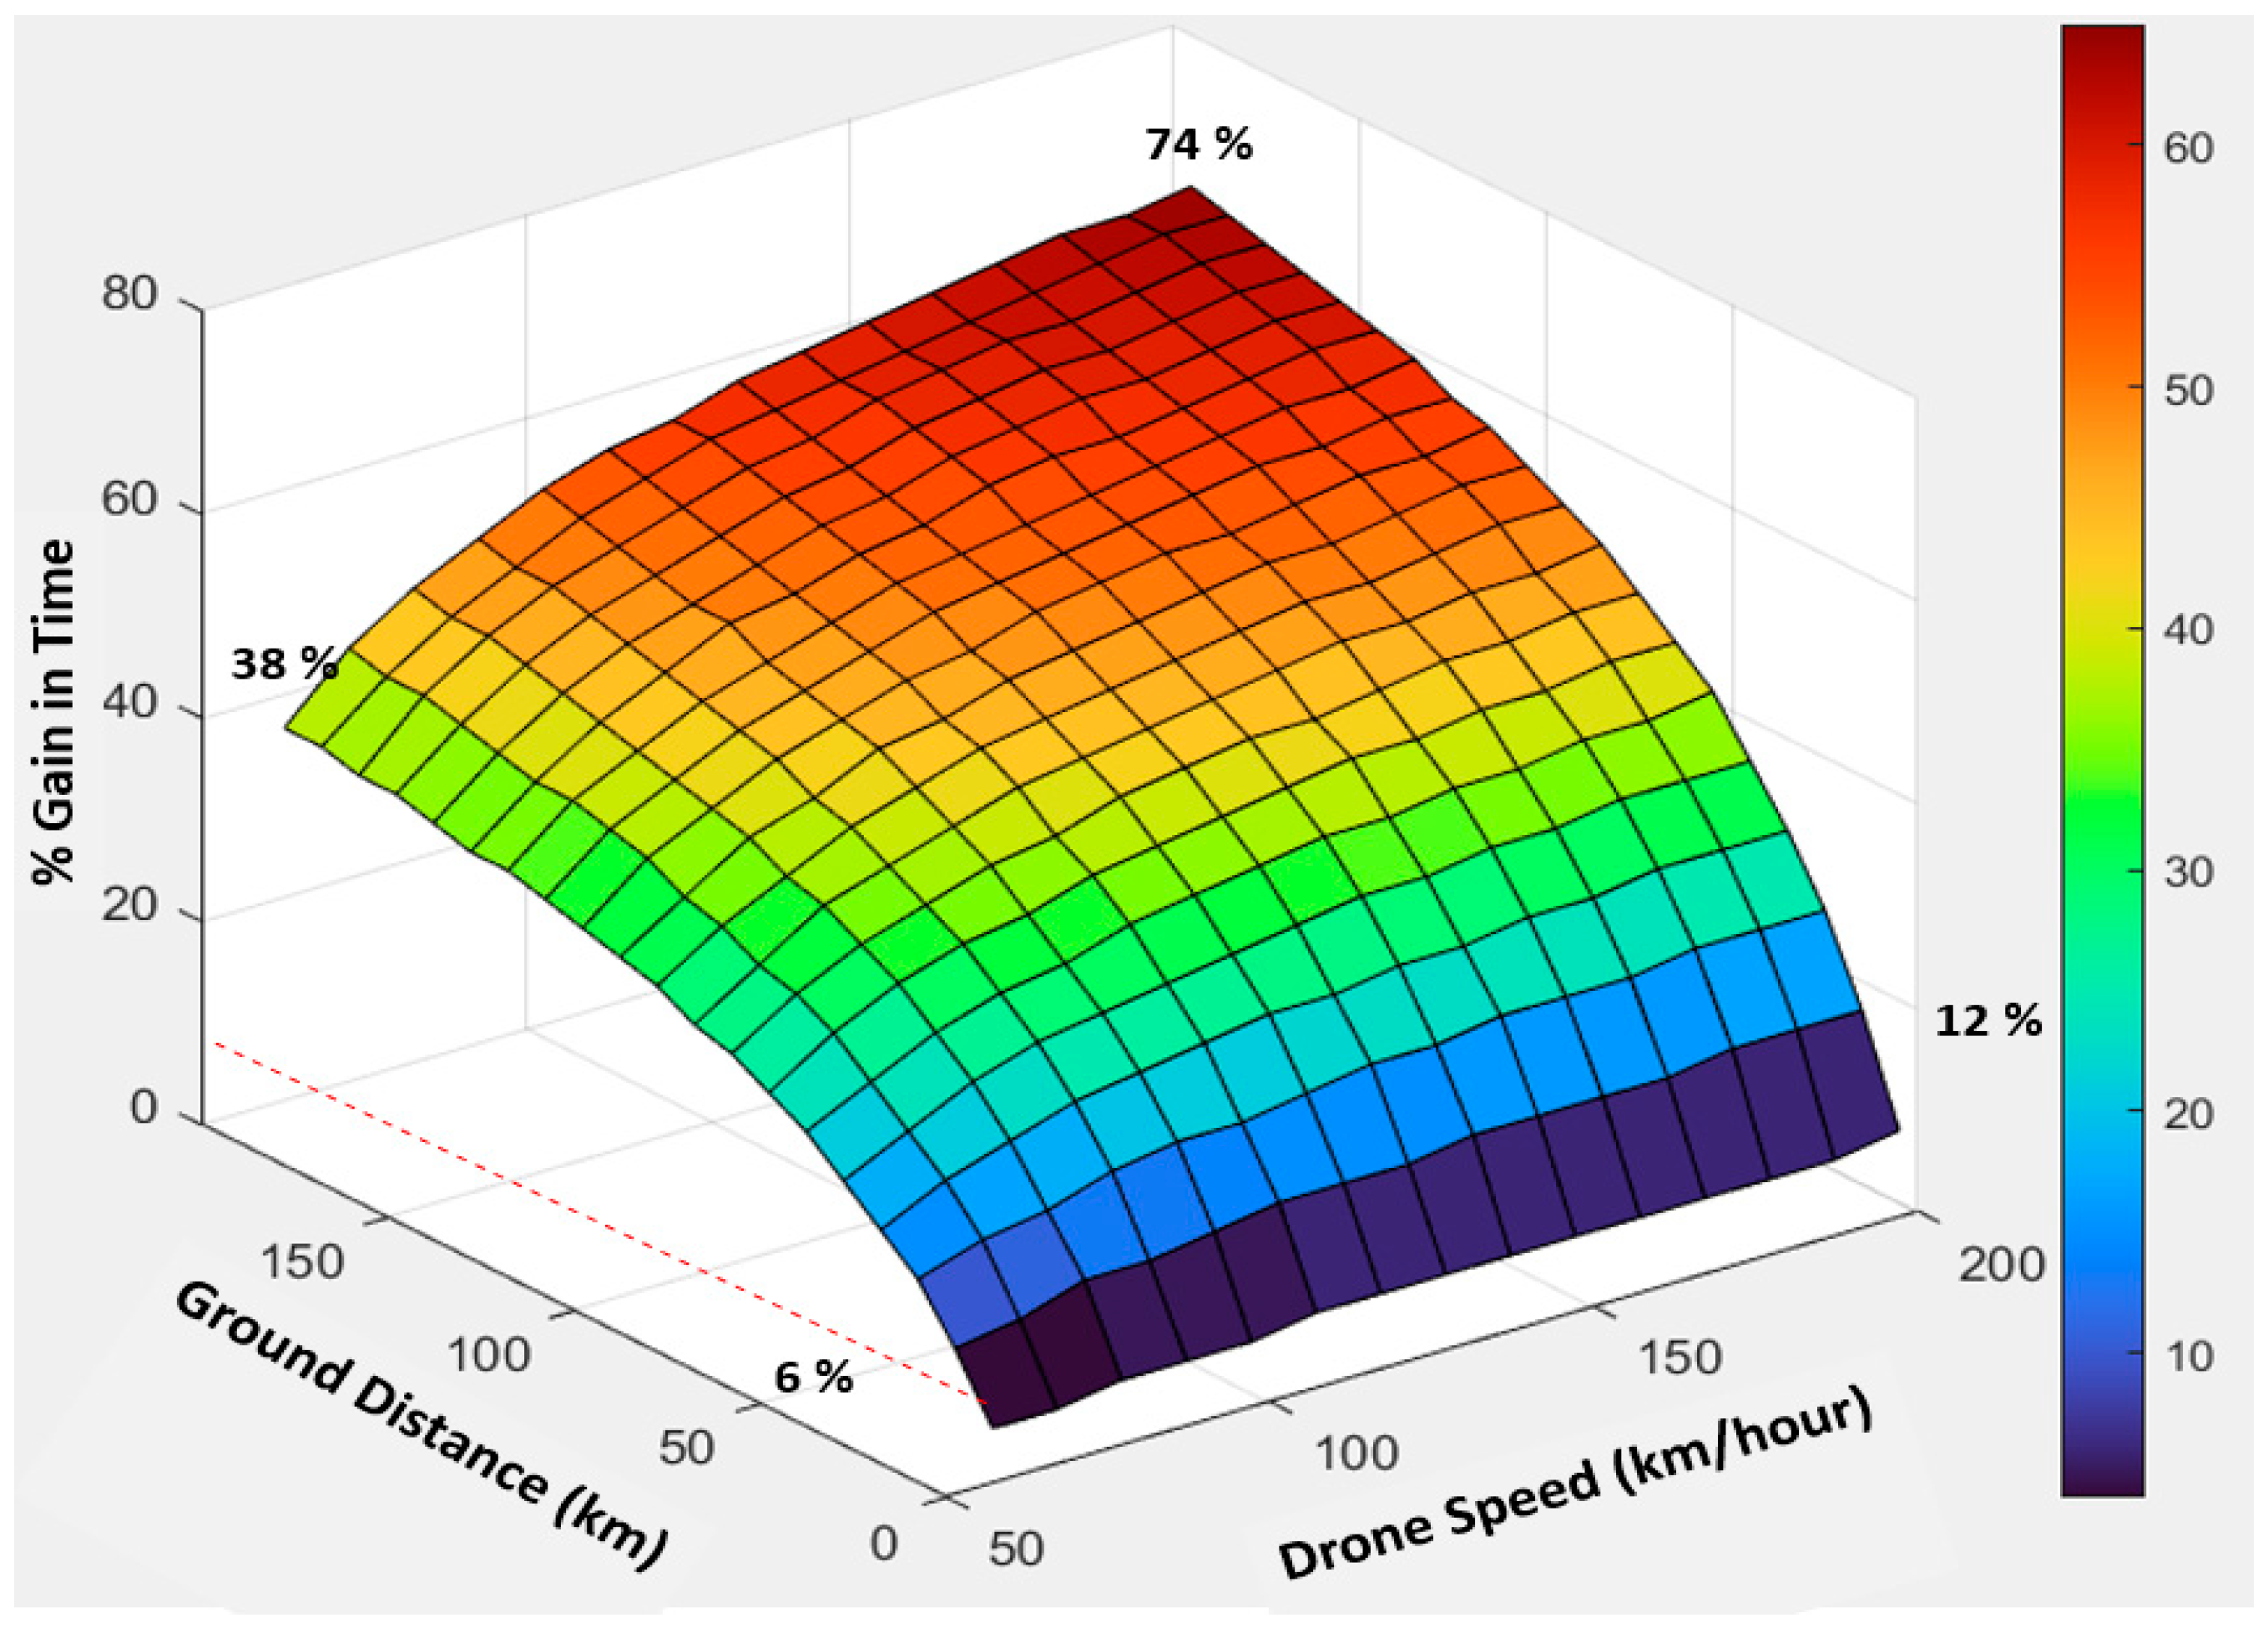
2.7. The Effect of Drone Speed and Distance
Another perspective may be illustrated relative to ground distance and drone speed. I illustrate an example that assumes an average ground speed of 60 km/h, 60-min routes, drone flight distances 60% of the ground distance (an assumption which covers most of the models in this study), and varying drone speeds of 60–200 km/h. The results in
Figure 6 show that drone transport provides marginal gains for short distances, even with the highest drone speeds. For short distances, as in the OUS model, maximum drone speeds of 150–200 km/h may be of little significance because drones use some time to accelerate to and decelerate from their maximum speed. However, more substantial gains are observed for drone speeds of 150–200 km/h and 100 km or higher distances, with an average ground transport speed of 60 km/h.
4. Discussions
Using an extended time context starting from when biologic samples are booked for transport until arrival at their destinations, this study documents that the waiting times between transport departures represent an important factor when assessing drone transport time values. This time is crucial from a clinical perspective and should be included when evaluating drone delivery time reductions compared with ground transport. Waiting times are especially significant for short transport distances, where their relative contribution substantially influences the relative time savings. Therefore, the current study adds to understanding how drone transport of biological material should be planned, organized, and evaluated. The balance between transport frequencies with different distances and drone speeds may be decisive in planning and assessing drone solutions intended to reduce transport time. This balance must also consider that increasing delivery frequencies to reduce total transport times reduces the volume per transport and thus may increase the costs per payload. However, this may be alleviated if smaller drones represent lower costs.
The time savings were rather modest for deliveries in the inner-city model with 6–10 km routes. Although ground transport had prolonged driving times during traffic congestion, most ground transports were completed within acceptable time limits. For the short OUS transport distances, drones decreased the transport times by only 5–15 min, with maximum relative savings of 30–40% during heavy traffic hours. The clinical value of such savings in routine transports is currently unknown and remains to be studied further. I also noted that existing ground transport solutions could be improved considerably and concluded that such improvements should be implemented before judging the value of drone transport.
With the longer transport distances explored with the Innlandet models, time savings were substantially larger, particularly at high drone speeds. However, also in this context, the time savings should be carefully evaluated as a function of the time intervals between different route frequencies and drone speeds. I conclude that the time savings relative to costs must also be considered when planning drone transport service frequencies in remote districts where the volume of emergency samples for time-critical demands may be rather low. Nonetheless, such transport from remote locations may have substantial value if considered by an availability perspective and not primarily time savings.
It is important to observe that the virtual ‘cost per drone flight time’ does not represent costs for drone transport but illustrates the allowable costs for such transport by projecting the ground costs on the drone flight times. Accordingly, the higher ‘costs per drone time’ represent a more spacious budget than the routes with lover costs. However, it still remains to evaluate whether such economic frameworks provide value or not.
Another important time factor in a complete perspective is the time needed for laboratory analyses. Some blood analyses take hours or days to complete, and complex and costly analyses are often batched and not analyzed instantly upon arrival at the laboratory. A recent use case tested for drone solutions since 2020 is the transport of COVID-19 test samples. However, the time factor of drone transport in such cases may also have limited value for tests that take several hours, unless all parts of the process from departure to arrival ensure prioritized handling.
An example of the significant impact of transport distances was illustrated in the Dombås model. As a result of the long driving times, the ground capacity to cover one transport had to be expanded in a one-to-one proportion with increased delivery frequencies, in contrast to drones, which could accommodate multiple deliveries to realize benefits compared with ground transports. In the short-distance OUS model, one car or drone could cover increased frequencies up to eight routes.
The substantial element of driver costs in ground transport may favor unmanned drones flying BVLOS for long distances. However, as discussed in the above review of the literature, this depends significantly on how costs related to operating and surveilling more drone flights are generated, and detailed economic analyses are not possible without knowing the total costs per flight hour. The present results also show that drone speed significantly affects time savings and that these are modest when using simple drones with velocities below 80–100 km/h.
The perspective of time savings versus cost is only one important topic in assessing drone solutions. No doubt, drones may provide services to remote locations that may represent a willingness to pay despite limited time gains. Both for the delivery of biologic products, technology equipment to patients and other goods drones may represent valuable services to otherwise hard-to-reach districts, as the services are increasingly automated and unmanned.
Direct routes were used in this study, which kept the models simple to illustrate basic principles. As discussed in the introduction section, straight line trajectories for drone flights may not be realistic for drone flights in many locations due to airspace restrictions, other air traffic, and weather conditions. Drone services may alternatively be implemented as an integrated supplement with other transport modes and for multiple purposes. Such combinations may also provide backup solutions in cases where drones cannot fly, costs that were not considered in the models studied here. An interesting topic is how to find an optimal balance between routes with multiple stops for pickups of cargo that may increase transport volumes and, thus, improve the cost–volume relationship, and how to assess the disadvantage of such solutions in relation to less time savings. There is rich literature on optimizing complex drone routes [
29,
30,
57,
58,
59,
60]. Although most of these studies have addressed current short-range electric drones, the principles applied are also appropriate if drone route optimization intends to cover more service locations with more powerful drones in the future. Therefore, multiple approaches may realize improvements in the cost–payload relationship. Small drones from remote locations may provide first-mile transport of small volumes to hubs where larger drones with long-distance capacities can be loaded for final, long-range heavy-weight transport [
24]. Although such optimizations will largely challenge the perspective of time-critical transport purposes, they may represent promising alternatives to create economic sustainable solutions.
There were rather small volumes of emergency samples in the models studied in this paper. If the emphasis on time savings is downscaled, an alternative model with bidirectional drone transports may improve the cost–payload balance. Such improvements may include various transport purposes from central institutions to remote locations and provide transport capacities for stakeholders from other non-healthcare sectors [
8,
13,
14,
61]. If the time-critical perspectives are downscaled, combinations across complementary transport needs of different customers may create a willingness to pay from multiple stakeholders and generate an economic basis for profitable services, possibly providing resources for on-demand services for more urgent transport.
There are currently scarce data to perform detailed cost comparisons between ground and drone transport. Significant gaps are related to operational costs, such as airspace use, flight surveillance, and ground facilities management, as discussed above. Three major cost categories common to drone and ground systems are capital, operations, and maintenance. More knowledge is needed on how these may compare. Drone cost changes may result from technological developments, i.e., some future drone parts may need less maintenance and have a longer duration of use than others. Furthermore, although it is expected that the substantial personnel costs related to ground transport will be lower with unmanned drones, it is currently not known to what extent this may apply. It should be expected that fully un-manned services of all steps in drone solutions, i.e., loading/offload, flight surveillance, and more, will take some time before it may be fully implemented.
Whereas this study focused on transporting samples in a routine setting, another concept could be on-demand transport for targeted transport needs. Drone versus ground delivery has been found to provide significant time savings for urgent transport of blood products in a crisis [
32,
49,
50]. Although the time savings in such studies may be modest, time reductions may have significant value in crises caused by disasters, large accidents, epidemics, and more. An interesting concept may be whether a drone park for routine transports can provide on-demand drone resources for emergent needs, which could support a business case for drone use with economic sustainability.
In the present simulations, delays were caused by traffic congestion during ground transport. It is well known that the weather may influence transport with today’s drones, which have limited resistance to wind and precipitations, and differing wind conditions will undoubtedly affect both flight times and route choices [
45,
62,
63,
64,
65] and, possibly, whether today’s drones may fly at all.
4.1. What Measures Are Relevant?
For evaluations based on cost and performance measurements, costs and revenues must be appropriately tracked and allocated to the individual activities incurring them. Performance measures should be allocated to the activities affected by the differing solutions. These may be different allocation objects. The fact that time may have different values for differing purposes may suggest that individual and varying evaluation methods are needed. In particular, high costs needed to save time for small volumes may challenge sustainability, but emergencies and crises may represent settings where there is a particularly high willingness to pay these costs. Furthermore, future robust drone development may provide transport reliability across more extreme weather conditions and longer distances, thereby allowing service regularity that may outperform ground solutions.
4.2. Future Research
There are currently many unknowns related to drone services in healthcare. We certainly need relevant cost estimates of drone operations. These must include all aspects, from drone technology, operations, airspace use, and regulations, and should be based on costs of regularly implemented services, not experimental setups. Studying this in models evaluating differing purposes would be valuable. We need extensive research on assessing costs to quality measures, which may differ considerably across various settings and applications. We should also consider economic models that enlighten utilization efficiency for given equipment and infrastructures. Such considerations should include cost evaluation of both used and unused resources, and time-driven, activity-based costing could be an alternative [
66,
67]. Furthermore, procurement, personnel, training, maintenance, and replacement costs may apply.
5. Limitations
Limited available information left this study to use drone flight time simulations despite accurate driving times for ground transport. Although this may represent inaccuracies in the estimates, the study’s primary purpose was to illustrate crucial perspectives from a clinical viewpoint when assessing drone transport time savings.
The use of electric cars in the presented models may be observed as a limitation with respect to the study’s relevance for systems using traditional petrol/diesel cars. In the Norwegian economic system, electric cars are cheaper both to buy and operate, and drone solutions that are competitive to such vehicles would be competitive to gas powered cars in our system, but this may vary across differing systems. The potential overhead costs of car transport in the hospital costing system were ignored. Whether such overhead costs also are relevant to drone services is unknown. Even if drones are procured as a complete service, some overhead costs may apply and should be evaluated. Furthermore, costs related to infrastructure were also ignored. It should be expected that existing hospital infrastructures cannot accommodate drone landing and takeoff locations and that additional costs will be incurred to develop and maintain such facilities. It will also be important to identify direct versus indirect costs and determine their allocations.
The current approach was based on increased ground transport costs generated by more frequent routes, these costs being projected onto equivalent simulated drone transports and frequencies. The estimates are virtual and should only be considered a proxy and hypothetical economic framework for drone solutions. Nevertheless, the intention to create a perspective of the cost levels needed for drones to become economically competitive should be valid. Promising improvements with drone solutions for long-distance routes were readily apparent.
The relevant performance measures may depend on the model used and the chosen solutions. Internal processing times in clinics and laboratories are often assumed to be independent and indifferent to sample transport times; however, this is not necessarily true. Both clinical procedure times and existing laboratory processes may be a function of transport mode. It should be expected that such internal processing times may influence the overall time perspective from acquiring biologic samples from the patient to final analysis [
20].


