Article

Water Hyacinth (Eichhornia crassipes) Detection Using Coarse and High Resolution Multispectral Data

by
Luís Pádua
1,*,
Ana M. Antão-Geraldes
2,
Joaquim J. Sousa
3,4,
Manuel Ângelo Rodrigues
2,
Verónica Oliveira
5,6,7,
Daniela Santos
7,8,
Maria Filomena P. Miguens
8 and
João Paulo Castro
2
1
Centre for the Research and Technology of Agro-Environmental and Biological Sciences, University of Trás-os-Montes e Alto Douro, 5000-801 Vila Real, Portugal
2
Centro de Investigação de Montanha (CIMO), Instituto Politécnico de Bragança, Campus de Santa Apolónia, 5300-253 Bragança, Portugal
3
Engineering Department, School of Science and Technology, University of Trás-os-Montes e Alto Douro, 5000-801 Vila Real, Portugal
4
Centre for Robotics in Industry and Intelligent Systems (CRIIS), INESC Technology and Science (INESC-TEC), 4200-465 Porto, Portugal
5
New Organic Planet (NOP), 9000-058 Funchal, Portugal
6
Colina Generosa, 6000-193 Castelo Branco, Portugal
7
Research Centre for Natural Resources, Environment and Society (CERNAS), 3045-601 Coimbra, Portugal
8
Escola Superior Agrária-Instituto Politécnico de Coimbra, 3045-601 Coimbra, Portugal
*
Author to whom correspondence should be addressed.
Drones 2022, 6(2), 47; https://doi.org/10.3390/drones6020047
Submission received: 31 December 2021 / Revised: 4 February 2022 / Accepted: 11 February 2022 / Published: 15 February 2022
(This article belongs to the Special Issue Feature Papers for Drones in Ecology Section)

Abstract

:
Efficient detection and monitoring procedures of invasive plant species are required. It is of crucial importance to deal with such plants in aquatic ecosystems, since they can affect biodiversity and, ultimately, ecosystem function and services. In this study, it is intended to detect water hyacinth (Eichhornia crassipes) using multispectral data with different spatial resolutions. For this purpose, high-resolution data (<0.1 m) acquired from an unmanned aerial vehicle (UAV) and coarse-resolution data (10 m) from Sentinel-2 MSI were used. Three areas with a high incidence of water hyacinth located in the Lower Mondego region (Portugal) were surveyed. Different classifiers were used to perform a pixel-based detection of this invasive species in both datasets. From the different classifiers used, the results were achieved by the random forest classifiers stand-out (overall accuracy (OA): 0.94). On the other hand, support vector machine performed worst (OA: 0.87), followed by Gaussian naive Bayes (OA: 0.88), k-nearest neighbours (OA: 0.90), and artificial neural networks (OA: 0.91). The higher spatial resolution from UAV-based data enabled us to detect small amounts of water hyacinth, which could not be detected in Sentinel-2 data. However, and despite the coarser resolution, satellite data analysis enabled us to identify water hyacinth coverage, compared well with a UAV-based survey. Combining both datasets and even considering the different resolutions, it was possible to observe the temporal and spatial evolution of water hyacinth. This approach proved to be an effective way to assess the effects of the mitigation/control measures taken in the study areas. Thus, this approach can be applied to detect invasive species in aquatic environments and to monitor their changes over time.

1. Introduction

Invasive alien species (IAS) are one of the greatest threats to biodiversity and, consequently, the continuity of ecosystem services [1]. In addition to adverse environmental impacts, IAS are also responsible for significant social and economic damage, as in many situations, they reduce returns from agriculture, forestry, fisheries, and tourism. Although only a small percentage of the introduced species become invasive, the damage caused by these species is over EUR 10 billion/year [2]. Indeed, the total costs of invasive species in Europe summed to EUR 116.61 billion between 1960 and 2020, with the majority (60%) being damage related and impacting multiple sectors [3]. IAS can severely threaten freshwater ecosystems contributing to the extinction of individual species, substantially changing the structure of native communities and altering ecosystem functioning [4,5].
Water hyacinth (Eichhornia crassipes) is considered one of the most aggressive and prevalent invasive plant species. In addition, it has been ranked as one of the top 100 exotic species with the highest invasion potential in the world [6]. It is a native of the Amazon basin that has spread globally since the late 19th century due to its ornamental value and is present on all continents except Antarctica [7,8]. It is well adapted to lentic habitats, but the limiting factors for its expansion are low nutrient concentrations, temperatures below 10 °C, and high salinity. Therefore, eutrophic lakes, ponds, reservoirs, the final sections of rivers, and irrigation ditches located at latitudes below 40° N and S are most susceptible to invasion. In Europe, its invasive capacity is currently restricted to the southern regions: Portugal, Spain, Italy, and France (Corsica) [8]. In Portugal, water hyacinth’s first sighting occurred in 1939 in the Tagus basin [9], and nowadays, it is present in almost all mainland regions (“Minho”, “Douro Litoral”, “Beira Litoral”, “Estremadura e Ribatejo”, “Alentejo”, and “Algarve”), even on the island of Azores (“Terceira”) [9,10,11].
The reproductive behaviour of Eichhornia crassipes is characterized by rapid vegetative dissemination (asexual reproduction) and the production of a high number of seeds (sexual reproduction), giving, in invaded environments, competitive advantage to water hyacinth over other native macrophytes [8,12]. Besides, the plant fragments originated by vegetative reproduction, which can survive winter, are carried away by the current and wind, creating new foci of invasion more or less distant from the original population [13]. Therefore, in invaded areas, this plant forms extensive mats that cover the entire water surface, significantly altering aquatic ecosystems, leading to a reduction in phytoplankton, zooplankton, macroinvertebrates, and fish diversity due to habitat degradation caused by reduced light input and dissolved oxygen, increased turbidity, reduced water quality, and elimination of native aquatic macrophytes. It also obstructs irrigation and navigation canals, having impacts on water use, navigation, fisheries, agriculture, tourism, and hydroelectric power generation, by clogging of turbines [7,8,14,15,16]. Water hyacinth is extremely difficult to eradicate once established [14]. Therefore, most management efforts aim to minimize economic costs and ecological damage [7,8].
The use of remote sensing to discriminate water hyacinth infestation from other floating or submerged vegetation, particularly through the use of satellite imagery, is addressed by several authors [17], with data from Landsat 8 and Sentinel-2 being the most widely used also because of their permanent availability at no cost to the user and also their high spectral, temporal, and spatial resolution qualities [18]. Most of the recently published studies rely on supervised pixel-based multispectral image classification involving machine learning (ML) techniques using random forests (RFs), support vector machines (SVMs), artificial neural networks (ANNs), and others [14,16,17]. Damtie et al. [19] assessed the effect of this invasive plant on water loss by evapotranspiration in Lake Tana (Ethiopia) using Sentinel-2 imagery. Mukarugwiro et al. [20] mapped the extent of water hyacinth invasion in aquatic ecosystems in Rwanda with Landsat 8 imagery. Dube et al. [21] were also successful in discriminating aquatic invasive species from other native species at Lake Manyame (Zimbabwe). The higher spatial resolution (10 m) of Sentinel-2 images compared with that of Landsat 8 images (30 m) opens good possibilities for monitoring the expansion of this invasive plant into rivers and narrower channels [21,22]. Ghoussein et al. [23] used a fractional vegetation cover (FVC)-based method [24] and the soil-adjusted vegetation index (SAVI) [25] from Sentinel-2 image time series to determine the temporal dynamics of water hyacinth over 4 years in the Al Kabir River (Lebanon). In addition, Datta et al. [17] foresaw good possibilities in the integration of classical and modern ML techniques for image analysis, especially if complemented by aerial surveys, preferably by low-cost unmanned aerial vehicles (UAVs) equipped with digital cameras, also evidenced by others [26]. Instead of using GPS and a dinghy, as mentioned in Mukarugwiro et al. [20], to collect training and validation data, the field study would have advantage through the use of a UAV. The same classifiers can be applied to multispectral images captured by sensors mounted on UAVs whose technology is never ceasing to excite. For instance, the MicaSense RedEdge-MX multispectral sensor [27] guarantees a ground sample distance (GSD) of 8 cm for each of its bands at a 120 m flight height. Benjamin et al. [28] used this sensor to monitor the effectiveness of aquatic invasive vegetation management on a floating-leaved species in Palm Beach County (USA), improving the discriminant ability through vegetation indices (normalized difference vegetation index (NDVI) [29], visible-band difference vegetation index (VDVI) [30], and visible brightness (VB)). Several successful cases of using UAV-mounted sensors to study terrestrial and/or aquatic vegetation are reported in the literature, in some cases based on UAV-based imagery only (multispectral sensor and derived vegetation indices) and in other cases in combination with satellite imagery and field measurements [31]. In addition, UAV-mounted sensors have already been shown to be useful for collecting formation and validation data to complement satellite imagery [20].
To the best of the authors’ knowledge, there are no studies employing similar approaches for water hyacinth detection. The performance of different ML classifiers in discriminating water hyacinth presence/absence in UAV and satellite multispectral data was assessed. The viability of combining UAV and satellite data to monitor the temporal evolution of water hyacinth is also assessed to further investigate the strengths and limitations of each remote sensing platform for such task. Therefore, in the specific case of this study, it is intended to answer the following questions: (1) Is it possible to accurately identify water hyacinth infestations using coarse- and high-resolution multispectral data in a complementary way? (2) If so, can the temporal dynamics of water hyacinth infestations be monitored by combining UAV and satellite multispectral data?

2. Materials and Methods

2.1. Study Area

The study area is located in the Mondego River basin (Figure 1b), between the cities of Coimbra and Figueira da Foz (Portugal). In this region, the infestation by water hyacinth has been especially intense in the last 4–5 years [16]. Three areas with a high prevalence of water hyacinth were selected to be surveyed by UAV (location in Figure 1). Apart from water hyacinth and water, these areas are populated by riparian trees, agricultural fields, other aquatic species, vegetation, roads, and infrastructures (Figure 1d,e). Area 1 is composed of two hydrographic canals, one in the center, which comes from the north, and an eastern channel, which merge to outlet in the Mondego River main channel. Area 2 is located on the northern canal that continues in Area 1 and includes a secondary derivation canal. Area 3 is located farther from the other two study areas and includes the eastern canal that outlets in Area 1.

2.2. Remotely Sensed Data

2.2.1. Unmanned Aerial Vehicle and Data Acquisition

The Matrice 300 RTK (DJI, Shenzhen, China) was the unmanned aerial system used to collect high spatial resolution data. It is a UAV with four rotors, with real-time kinematic (RTK) navigation capabilities, an approximate weight of 6.3 kg (including the two batteries responsible for its power), and a maximum payload support of 2.7 kg. Data acquisition was performed using the MicaSense RedEdge-MX (MicaSense, Inc.; Seattle, DC, USA) sensor. This sensor has a weight of approximately 232 g and can capture data with a resolution of 1280 × 960 (1.2 megapixels) in five independent spectral bands: blue (475 nm, 20 nm bandwidth), green (560 nm, 20 nm bandwidth), red (668 nm, 10 nm bandwidth), red edge (717 nm, 10 nm bandwidth), and near infrared (842 nm, 40 nm bandwidth). On top of the UAV, a downwelling light sensor 2 (DLS 2) was installed, which is responsible for acquiring the solar radiation during flight. It measures the ambient light and sun angle for each of the five bands and records this information in the metadata of the captured images. This information is later used to correct global lighting changes that may occur during flight. In addition, the DLS 2 is used to supply GPS data to the MicaSense RedEdge-MX sensor for imagery georeferencing.
On 21 July 2021, three flight missions were carried out with the UAV, one in each study area. The images were collected at a flight height of 100 m, providing a spatial resolution of approximately 0.07 m, a suitable resolution for the detail intended in this study, and respecting the legal flight height limit of 120 m. The acquired images had a longitudinal overlap of 80% and a lateral overlap of 70%. Before the flight’s execution, a specific target was used for the radiometric calibration of the sensor. Table 1 presents more details about the missions.

2.2.2. Satellite Data

Satellite data, from the Sentinel-2 Multispectral Instrument (MSI), were also used in this study. From the 13 available spectral bands (B#), B2 (490 nm), B3 (560 nm), B4 (665 nm), B5 (705 nm), and B8 (842 nm) were used, corresponding to the blue, green, red, red edge, and NIR bands, respectively. B2, B3, B4, and B8 had a 10 m spatial resolution, while B5 had a spatial resolution of 20 m. To meet the same spatial resolution, it was opted to resample B5 to 10 m.
Bottom-of-atmosphere data (Level-2A) prior and after the UAV aerial survey, in cloud-free conditions for bands B2, B3, B4, B8, and B5, were downloaded, as well as a visible true color image (TCI) representation. This way, Sentinel-2 MSI data from 13 and 28 July 2021 were selected to be used in this study, corresponding, respectively, to a period of 8 days before and 7 days after the UAV flight campaign.

2.3. UAV Data Processing

The images acquired during the UAV flight campaigns needed to be preprocessed using photogrammetry prior to being appropriate to be analyzed. Pix4Dmapper Pro software (Pix4D SA, Lausanne, Switzerland) was used for the photogrammetric processing of the data acquired in the flight campaigns of each site. Initially, common points among the images were identified points (tie points) according to their geolocation and the camera’s internal and external parameters. After this process, it was possible generate dense point clouds. These were interpolated using the inverse distance weighting (IDW) method to obtain orthorectified products, namely, the radiometrically calibrated and orthorectified reflectance rasters of five bands acquired by the MicaSense RedEdge-MX sensor. Digital elevation models were also generated, but these were not used as they can be deemed inappropriate for the classification tasks intended in the study. The five bands were stacked into a single raster using the geographic information system (GIS) QGIS. Thus, by combining different bands, the creation of different color composites was possible, such as rasterized RGB orthorectified mosaics (Figure 2). They were created by selecting the red, green, and blue bands, and to uniformize the colors, the minimum reflectance value among the three bands was used, along with the maximum reflectance value for each band.

2.4. Water Hyacinth Classification Procedure

For the automatic classification of water hyacinth, an ML approach was used to perform a pixel-level classification of the spectral bands, and different supervised classification methods were used for this purpose, namely, RF, SVM, ANN, Gaussian naive Bayes (NB), and k-nearest neighbours (KNN). The RF had a maximum tree depth of five, a minimum of 10 samples in each node, a maximum number of 100 trees in the forest, and an out-of-bag (OOB) error of 0.01. Regarding the SVM, a linear kernel SVM was used with a value of one set to the cost parameter C [32]. The ANN was trained using a resilient backpropagation algorithm [33] with five neurons in each intermediate layer, a symmetrical sigmoid function for neuron activation with alpha and beta parameters of the activation function set to one, with termination criteria based on a maximum number of 1000 iterations or on an epsilon value of 0.01. In the KNN, the number of neighbours to use was set to 32.
Since supervised learning approaches require a training stage for learning the different classification classes, it is required to have data for training and testing the different classifiers. To support this task, a comprehensive and representative dataset was created. A total of 100 polygons were placed in the three surveyed areas, 50 of which in areas exclusively represented by water hyacinth species and another 50 in other areas, composed of water, roads, other vegetation, and infrastructures. For each polygon, 20 points were randomly extracted, corresponding to one pixel, making a total of 2000 points (658 from area 1, 881 from area 2, and 461 from area 3). The points that fell into pixels representing water hyacinth were assigned a class with a value of 1, and the remainder points were assigned to class 0. As regards the Sentinel-2 MSI data of the dataset, 100 points were extracted in a balanced way, 50 for each class, in the three study areas (40 from area 1, 31 from area 2, and 29 from area 3). The dataset samples were divided into two sets, and 70% were used for training and the remaining 30% for testing. The reflectance values of the five bands (blue, green, red, red edge, NIR) were used as features. It should be noted that the number of samples per class was evenly balanced.
To measure the performance of the different evaluated classifiers, several metrics were withdrawn from the interpretation of the confusion matrices when applying the ML classifiers in the test dataset generated after the training stage, namely, user’s accuracy (UA), producer’s accuracy (PA), kappa coefficient (K), and overall accuracy (OA). The interpretation of K will be according to the intervals proposed by Landis and Koch [34]. For more information about other metrics, please refer to Barsi et al. [35].
The models were trained and tested in the three surveyed areas by using the UAV multispectral data and Sentinel-2 MSI data from 28 July 2021. As regards the final image classification, the effect of using an image input mask was accessed, which enabled us to evaluate the suitability for water hyacinth classification if it was not restrained to the river water channels.

3. Results

3.1. Dataset Characterization

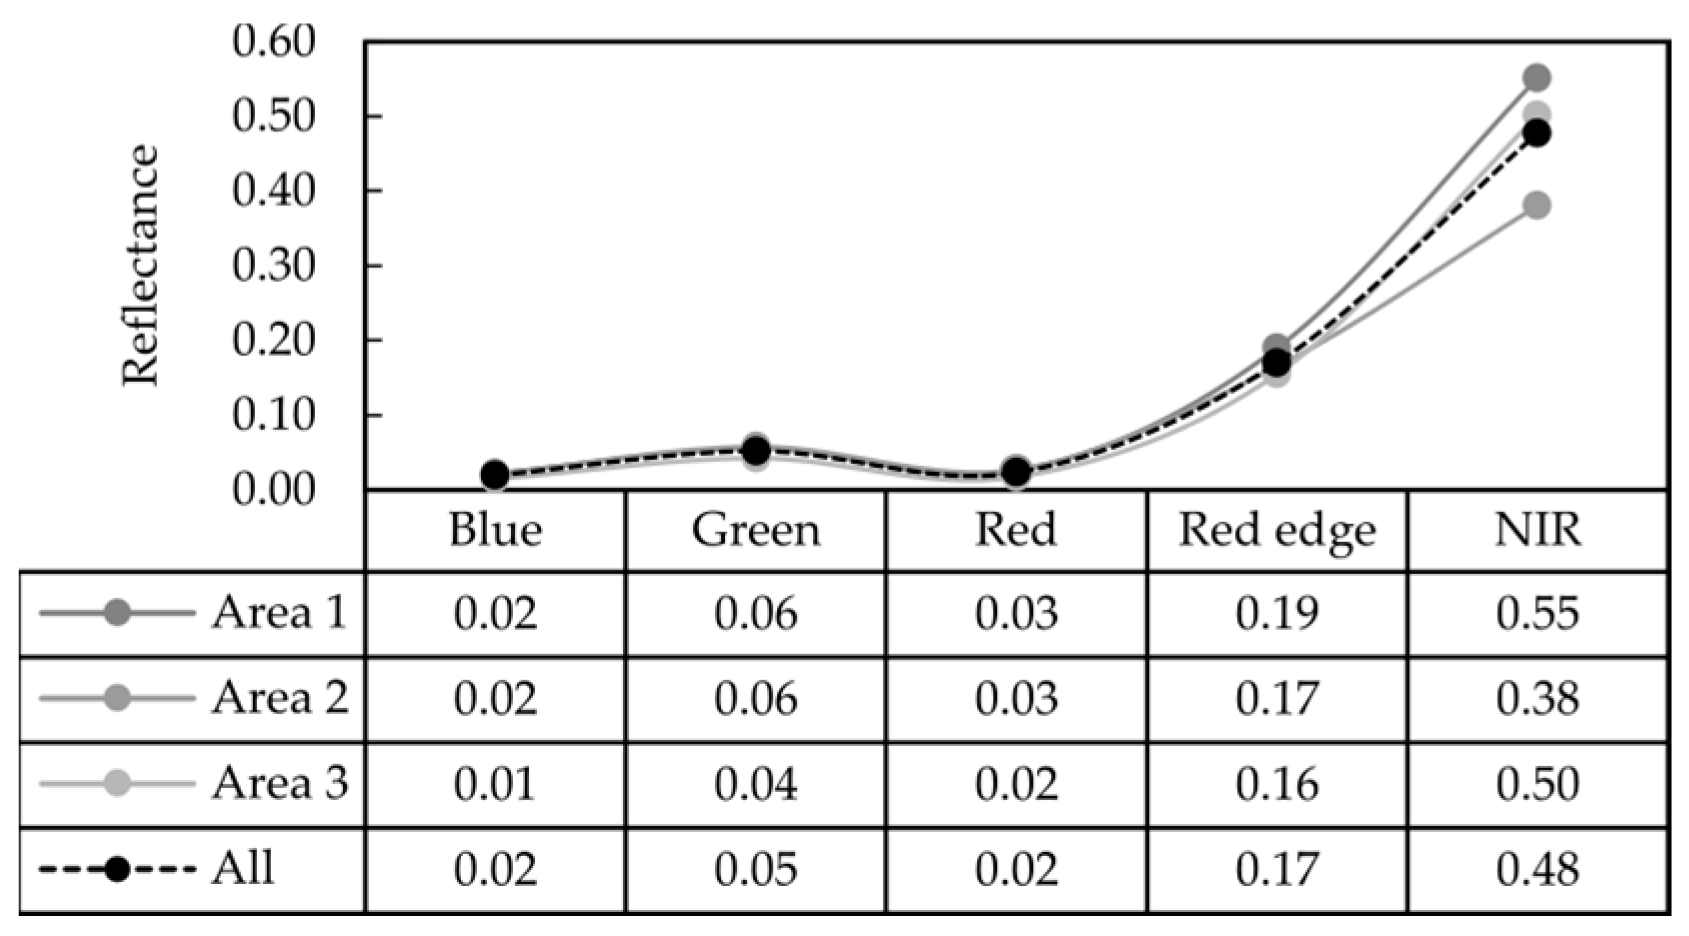
To perform a characterization of the spectral response of the water hyacinth to the various bands acquired by UAV, 25 polygons with measurements of 0.5 m × 0.5 m were created in each of the three areas analyzed, and possible differences in plant reflectance between areas were created. Thus, the average value of the pixels covered by each polygon was calculated for each band (Figure 3).
It was possible to verify that there was a greater difference in the NIR band where the reflectance in the second area was lower than the others. These differences can be due to the fact that the second area part of the plants were in the flowering state. In the third area, a slightly lower reflectance than the other areas in the blue, green, red, and red edge bands was verified. Analyzing the global average of the 75 polygons, it was verified that there was an increase in the reflectance between the blue and green band, decreasing in the red region, and there was a great increase in the red edge and NIR bands. This spectral behavior was in line with the behavior presented by vegetation with some green leaf density.

3.2. Classification Performance of Each Classifier

The results from the models created after training the different classifiers to distinguish water hyacinth from other features present in the survey areas (Figure 1c) are addressed in this subsection.
Regarding the use of UAV-based multispectral data (results in Table 2), when analysing OA, it can be said that results were satisfactory with all classifiers rechecking more than 85%, with the lowest being 87% for SVM, while the highest was reached in the RF, with 94%. The classifiers were arranged in the same order if K was analysed, and only SVM and NB presented values below 0.8, still presenting a good agreement. For the remaining classifiers, it can be stated that K showed a very high concordance level, and the highest value verified was 0.88 for RF. Regarding the presence or absence of water hyacinth at the pixel level, the analysis of UA and PA metrics showed that there was a tendency to mark pixels as water hyacinth in areas that were not the case (false positives), while the inverse was less frequent (false negatives). RF showed the best results for both of these metrics.
As regards the use of Sentinel-2 MSI data for water hyacinth classification, the results (Table 2) showed OA from 83% (SVM) to 90% (RF and ANN) with NB and KNN reaching 87%. Again, K followed the same trend as OA with 0.67 for SVM and 0.73 for NB and KNN, while the remaining classifiers presented a K value of 0.80. When analyzing the UA and PA values for water hyacinth (class 1), UA was usually higher than PA. The RF was the only exception to this fact.

3.3. Prediction of Water Hyacinth Dispersion

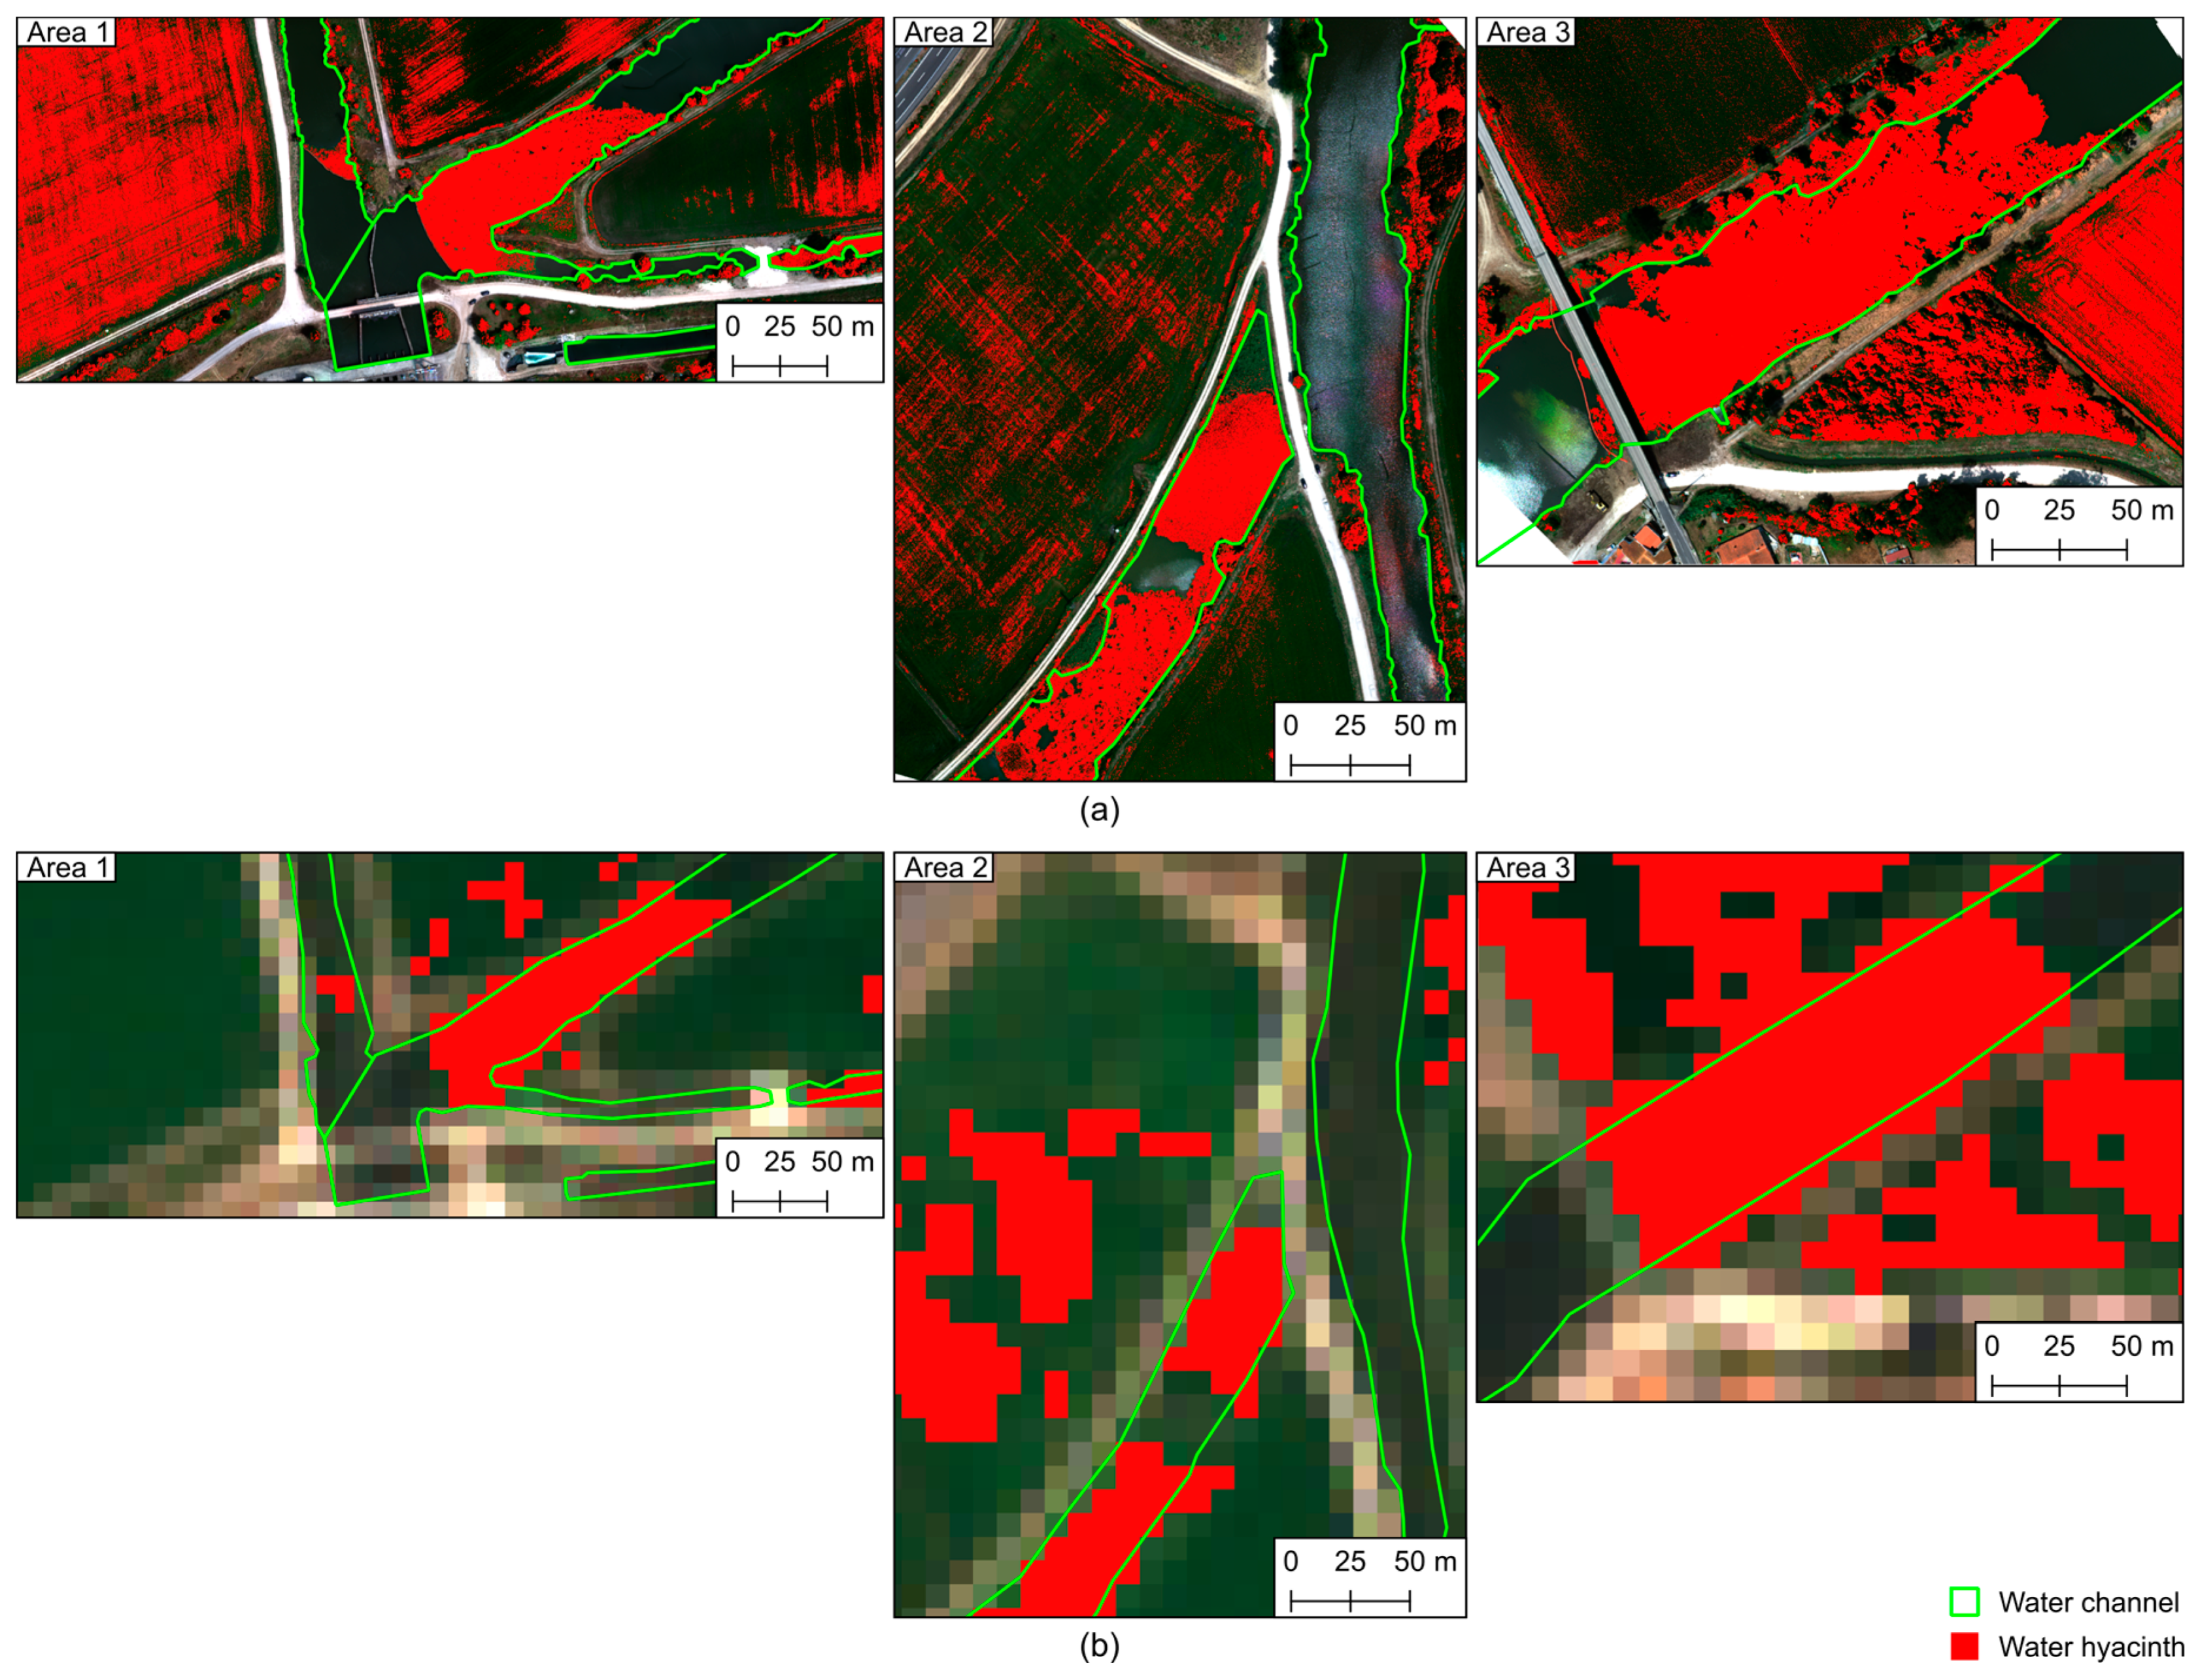
Despite the overall classifiers’ performance being satisfactory using both UAV-based and Sentinel-2 data, the RF classifier presented a better performance in almost all metrics (Table 2) and obtained the smallest number of classification errors. It was therefore decided to use RF to classify the water hyacinth distribution on the surveyed areas. The classification results for the UAV (21 July) and Sentinel-2 (28 July) data are presented in Figure 4. It is noticeable that water hyacinth was successfully detected. On the other hand, it was also classified in areas outside the water channels. This was verified in the data from both platforms.
By using a mask to filter the classification only on the water channels, it was possible to focus the detection of water hyacinth on the water channels of the study areas and monitor its dispersion over time. For this purpose, the RF models trained with the UAV and with the Sentinel-2 data were used to evaluate the changes of water hyacinth extent in the three study areas in a period prior to the UAV survey (13 July 2021), in the UAV data acquisition campaign (21 July 2021), and in a subsequent date available after the survey (28 July 2021). The data before and after the UAV survey were collected using Sentinel-2 MSI. The classification results are shown in Figure 5. It was possible to verify differences in the spatial distribution of water hyacinth plants. In study area 1 in between the first and the second date (from 13 to 21), there were different accumulation zones, and this was especially noticeable in the water channel located in the central part of the area that had no accumulation on 13 July and also showed water hyacinth closer to the end of the water channels (outlet to the main channel of the Mondego River). On 28 July, no major changes were noticeable. Regarding study area 2, whose plants were in the flowering stage at the time of the UAV survey, some differences were presented from 13 to 21 July, and the vast majority of water hyacinth was located in the secondary channel. As regards area 3, it was possible to verify a growing plant accumulation over time.
The water hyacinth dispersion (Figure 5) on the evaluated period allowed us to analyses the surface variations along time. The occupation of water hyacinth is presented in Table 3, and different behaviors can be verified. In all areas, there was at least 20% of occupation of this invasive plant. In study area 1, there was a growth of approximately 1% between the first and the second evaluated date, with a growth of 4% in the last period (from 5300 m2 initially to 6400 m2). Regarding study area 2, there was a 22% increase to 29% from the first to the second analyzed date, and then a 4% drop in the last period. As regards study area 3, the largest increase between dates was observed, 27% from 13 to 21 July, with a decrease of 1% on 28 July.

4. Discussion

By analyzing the spectral reflectance obtained from the UAV-based multispectral data (Figure 3), it can be said that it is in line with the behavior presented by green vegetation with some leaf density [36]. As regards the spectral differences found in the NIR reflectance of study area 2, they can be due to the fact that in this study area most plants were in the flowering stage (Figure 1e).
The performance results from the different classifiers of the UAV-based data showed that the best performance was reached by the RF classifier, while SVM was least performant. Regarding Sentinel-2 classification results, several classifiers reached the same OA, with smaller differences between the classifications of the two classes. When cross-comparing UAV and Sentinel-2 classification (Table 2), it is clearly noticeable that classification using UAV multispectral data achieved better results. This can be justified either by the dataset size used on the classifiers with each data type (2000 for UAV data and 100 for Sentinel-2 data) or by the spatial resolution of the Sentinel-2 data (10 m), meaning that some pixels can contain spectral information from different classes [37]. Thus, pixels with a lower amount of water hyacinth can be misclassified. Nevertheless, the results are in line with those of other published studies. Damtie et al. [19] obtained an OA ranging from 95.1% to 99.7% with K from 0.93 to 0.97 using maximum likelihood classification on Sentinel-2 MSI data. Using Landsat 8 imagery, Mukarugwiro et al. [20] obtained an OA of 85% with k = 0.81 using a RF classifier, better than SVM (OA of 65%; k = 0.57), and Dube et al. [21] achieved an OA of 92% using two ML classification ensembles, discriminant analysis (DA), and partial least squares discriminant analysis (PLS-DA). By using UAV-based multispectral data, Chabot et al. [38] used RF to monitor emergent (OA of 92%; k = 0.88) and submerged (OA of 84%; k = 0.75) invasive aquatic vegetation in shallow waters.
RF was selected as the best performant classifier and was tested to classify the water hyacinth presence in the study areas (Figure 4 and Figure 5). The classification results proved to be satisfactory if an input mask was used, as the RF classifier was able to classify large amounts of water hyacinth but could also detect plants with lower density along the water channels. The fact that there are flowering plants in study area 2 did not prove to be an obstacle to their classification, and they were also correctly classified. However, when not using a mask to restrain the classification area to the water channels (Figure 4)—the only place where water hyacinth plants were located—an over classification was verified. In the UAV-based data, water hyacinth was predicted in agricultural fields (all areas) and trees (areas 1 and 3). A potential explanation for this occurrence can be spectral similarity, as most agricultural fields in the Lower Mondego river basin are used for planting rice [39,40], which also contains a certain water presence level [41]. The same effects were also visible in the classification of the Sentinel-2 MSI data, with differences in the field located in the western part of study area 1, which was not misclassified, and in the fields of the third area, which seemed to have more misclassified pixels. These differences can be explained by the influence of the temporal differences among the data. To improve classification results, the use of different vegetation indices can be assessed since the arithmetic operations performed using the different spectral bands can highlight other features in the areas intended to be studied [42]. Moreover, shortwave infrared (SWIR) bands from Sentinel-2 MSI data can be explored, as in Thamaga and Dube [43], where both vegetation indices and SWIR bands were evaluated.
The Portuguese 2030 National Strategy for Nature and Biodiversity Conservation (Resolução do Conselho de Ministros no. 55/2018 [44]) emphasizes three main strategic vertices: improve conservation state of natural heritage, promote recognition of the value of natural heritage, and foster natural values and biodiversity appropriation by society. In this regard, the authorities responsible for the biological control in canals derived from the Mondego River (Portugal) promote the accumulation of water hyacinth by placing floating containment barriers in strategically located locations, not only to facilitate mechanical harvesting tasks, but also to temporarily minimize the inconvenience of this IAS. The combined use of UAV and satellite data enabled us to conduct a temporal analysis of the water hyacinth dispersion (Figure 5 and Table 3). Indeed, this analysis enabled us to observe the spatial changes along time and to track containment measures taken in the field to control/mitigate the outbreak of this IAS. In study area 1, between 13 and 21 July, two floating containment barriers were installed at the outlet of the two canals, a detail that is clearly evident when viewing the classification results, and on 13 July, the leftmost channel presented almost no accumulation, being located only in the eastern canal. After the floating containment barrier installation, the accumulation started to be established farther away from the outlet area. In the second study area, it appears that the superior spatial resolution provided by the UAV-based data allowed us to observe a greater spatial variability, as there was an area in the central zone populated by water hyacinth that could not be precisely detected when using Sentinel-2 MSI data. This can help explain the observed water hyacinth decrease from 21 to 28 July. Regarding study area 3, where a floating containment barrier was also installed, it was possible to verify the growing retention of plants over time caused by this containment measure. Moreover, since study area 3 was located in the middle of the canal that will outlet into study area 1, this can justify the reduction, although minimal, in the last period analyzed. The large increase observed between the two first periods could be due to the installation of the retention structure, which caused greater accumulation. However, this claim lacks deeper evidence.
It is of particular interest to further extend this research by addressing some unexplored topics. The temporal monitoring of water hyacinth in the Lower Mondego region can be performed by benefiting from the already existent and constant acquisition of Sentinel-2 MSI data, as in Ghoussein et al. [23]. Thus, monitoring activities should continue to assess the effectiveness of the measures applied for the combat/mitigation of this IAS. At the most problematic times of the year, the multispectral images captured by UAV can advantageously complement those obtained by satellite, being able to provide data to determine the effectiveness of mechanical removal, as performed in Lishawa et al. [45]. Although fixed-wing UAVs have a good range compromise and are suitable for studying wetland plant species in estuaries [46], multirotor UAVs are more advantageous in this case [42]. Besides, the feasibility of estimating water hyacinth biomass through remotely sensed data (particularly UAV based) should be explored. Datta et al. [17] advocate that assessing the biomass production potential for a given water body by remote sensing because of profitable exploitation may be the main control measure for water hyacinth infestation, given the ineffectiveness of others. This could create good perspectives for UAVs in localized assessments that require high temporal resolution imagery. The combination of the high spatial, spectral, and temporal resolution of UAV-mounted multispectral sensors poses excellent tools for monitoring the spread of water hyacinth infestation in aquatic ecosystems [47], especially where watercourses are less than 10 m wide, because, even using Sentinel-2 imagery, we will have pixel contamination with areas outside the channel [48]. The optimal spatial resolution should be tested for each case study because the best compromise in classification accuracy may be obtained after some pixel aggregation [49] rather than with the original resolution.

5. Conclusions

The content of this manuscript shows the research work carried out to detect and monitor water hyacinth infestation in the Lower Mondego area (Portugal). The methods employed for the automatic classification of this species using multispectral data collected by UAV and satellite with, respectively, sub-decimeter and decameter spatial resolutions, revealed that the classifier with the best results were the models obtained by the RF classifier, both in the satellite and in the UAV data. Despite some differences on the spatial resolution of the data from the two remote sensing platforms, it is shown that, either by satellite or by UAV, it is possible to monitor changes in the dynamics of this species and that it is also possible to verify the changes caused by the containment and mitigation measures that are being taken in the field.

Author Contributions

Conceptualization, L.P., J.J.S. and J.P.C.; data curation, L.P.; formal analysis, L.P.; funding acquisition, A.M.A.-G., M.Â.R., V.O., D.S., M.F.P.M. and J.P.C.; investigation, L.P., M.Â.R., V.O., D.S., M.F.P.M. and J.P.C.; methodology, L.P.; project administration, V.O.; resources, J.J.S., M.Â.R. and J.P.C.; software, L.P.; supervision, M.Â.R. and J.P.C.; validation, A.M.A.-G. and J.P.C.; visualization, L.P.; writing—original draft, L.P., A.M.A.-G. and J.P.C.; writing—review and editing, J.J.S. All authors have read and agreed to the published version of the manuscript.

Funding

This research activity was funded by POCI-FEDER as part of the project “BioComp_2.0—Produção de compostos orgânicos biológicos para o controlo do jacinto de água e para a valorização de subprodutos agropecuários, florestais e agroindustriais” (POCI-01-0247-FEDER-070123) and by national funds through FCT (Portuguese Foundation for Science and Technology) under the projects UIDB/04033/2020 and UIDB/00690/2020.

Institutional Review Board Statement

Not applicable.

Data Availability Statement

The data presented in this study are available on request from the corresponding author.

Conflicts of Interest

The authors declare no conflict of interest. The funders had no role in the design of the study; in the collection, analyses, or interpretation of data; in the writing of the manuscript; or in the decision to publish the results.

References

  1. Kass, M.J. Summary for Policymakers of the Global Assessment Report on Biodiversity and Ecosystem Services. Nat. Resour. Environ. 2020, 34, 62. [Google Scholar]
  2. Hulme, P.E.; Pyšek, P.; Nentwig, W.; Vilà, M. Will Threat of Biological Invasions Unite the European Union? Science 2009, 324, 40–41. [Google Scholar] [CrossRef] [PubMed] [Green Version]
  3. Haubrock, P.J.; Turbelin, A.J.; Cuthbert, R.N.; Novoa, A.; Taylor, N.G.; Angulo, E.; Ballesteros-Mejia, L.; Bodey, T.W.; Capinha, C.; Diagne, C.; et al. Economic Costs of Invasive Alien Species across Europe. NeoBiota 2021, 67, 153–190. [Google Scholar] [CrossRef]
  4. Gallardo, B.; Clavero, M.; Sánchez, M.I.; Vilà, M. Global Ecological Impacts of Invasive Species in Aquatic Ecosystems. Glob. Change Biol. 2016, 22, 151–163. [Google Scholar] [CrossRef] [PubMed]
  5. Cuthbert, R.N.; Pattison, Z.; Taylor, N.G.; Verbrugge, L.; Diagne, C.; Ahmed, D.A.; Leroy, B.; Angulo, E.; Briski, E.; Capinha, C.; et al. Global Economic Costs of Aquatic Invasive Alien Species. Sci. Total Environ. 2021, 775, 145238. [Google Scholar] [CrossRef] [PubMed]
  6. Lowe, S.; Browne, M.; Boudjelas, S.; De Poorter, M. 100 of the World’s Worst Invasive Alien Species: A Selection from the Global Invasive Species Database; Invasive Species Specialist Group Auckland: Auckland, New Zealand, 2000; Volume 12. [Google Scholar]
  7. Kriticos, D.J.; Brunel, S. Assessing and Managing the Current and Future Pest Risk from Water Hyacinth, (Eichhornia Crassipes), an Invasive Aquatic Plant Threatening the Environment and Water Security. PLoS ONE 2016, 11, e0120054. [Google Scholar] [CrossRef] [PubMed]
  8. Coetzee, J.A.; Hill, M.P.; Ruiz-Téllez, T.; Starfinger, U.; Brunel, S. Monographs on Invasive Plants in Europe N° 2: Eichhornia Crassipes (Mart.) Solms. Bot. Lett. 2017, 164, 303–326. [Google Scholar] [CrossRef]
  9. Duarte, C.; Agusti, S.; Moreira, I. Water Hyacinth (Eichornia Crassipes (Mart.) Solms) and Water Milfoil (Myriophyllum Aquaticum Vell. Verde) in Portugal. In Proceedings of the 3rd Symposium on Weed Problems in the Mediterranean Area; EWRS: Oeiras, Portugal, 1984; Volume 1. Available online: http://hdl.handle.net/10400.5/16306 (accessed on 30 December 2021).
  10. Figueiredo, J.; Duarte, C.; Moreira, I.; Agusti, S. As Infestantes Aquáticas Nos Sistemas de Irrigação e Drenagem Do Ribatejo. Recur. Hídricos 1984, 5, 5–10. [Google Scholar]
  11. Moreira, I.; Monteiro, A.; Ferreia, M.; Catarino, L.; Franco, J.; Rebelo, T. Estudos Sobre Biologia e Combate Do Jacinto Aquático (Eichhornia Crassipes (Mart. Solms-Laub.)) Em Portugal. Garcia Da Horta Série Botânica 1999, 14, 191–198. [Google Scholar]
  12. Albano Pérez, E.; Ruiz Téllez, T.; Sánchez Guzmán, J.M. Influence of Physico-Chemical Parameters of the Aquatic Medium on Germination of Eichhornia Crassipes Seeds. Plant Biol. 2011, 13, 643–648. [Google Scholar] [CrossRef]
  13. Téllez, T.R.; López, E.; Granado, G.L.; Pérez, E.A.; López, R.M.; Guzmán, J.M.S. The Water Hyacinth, Eichhornia Crassipes: An Invasive Plant in the Guadiana River Basin (Spain). Aquat. Invasions 2008, 3, 42–53. [Google Scholar] [CrossRef]
  14. Villamagna, A.M.; Murphy, B.R. Ecological and Socio-Economic Impacts of Invasive Water Hyacinth (Eichhornia Crassipes): A Review. Freshw. Biol. 2010, 55, 282–298. [Google Scholar] [CrossRef]
  15. Patel, S. Threats, Management and Envisaged Utilizations of Aquatic Weed Eichhornia Crassipes: An Overview. Rev. Environ. Sci. Biotechnol. 2012, 11, 249–259. [Google Scholar] [CrossRef]
  16. Stratoudakis, Y.; Correia, C.; Belo, A.F.; de Almeida, P.R. Improving Participated Management under Poor Fishers’ Organization: Anadromous Fishing in the Estuary of Mondego River, Portugal. Mar. Policy 2020, 119, 104049. [Google Scholar] [CrossRef]
  17. Datta, A.; Maharaj, S.; Prabhu, G.N.; Bhowmik, D.; Marino, A.; Akbari, V.; Rupavatharam, S.; Sujeetha, J.A.R.P.; Anantrao, G.G.; Poduvattil, V.K.; et al. Monitoring the Spread of Water Hyacinth (Pontederia Crassipes): Challenges and Future Developments. Front. Ecol. Evol. 2021, 9, 6. [Google Scholar] [CrossRef]
  18. Pádua, L.; Guimarães, N.; Adão, T.; Sousa, A.; Peres, E.; Sousa, J.J. Effectiveness of Sentinel-2 in Multi-Temporal Post-Fire Monitoring When Compared with UAV Imagery. ISPRS Int. J. Geo-Inf. 2020, 9, 225. [Google Scholar] [CrossRef] [Green Version]
  19. Damtie, Y.A.; Mengistu, D.A.; Meshesha, D.T. Spatial Coverage of Water Hyacinth (Eichhornia Crassipes (Mart.) Solms) on Lake Tana and Associated Water Loss. Heliyon 2021, 7, e08196. [Google Scholar] [CrossRef] [PubMed]
  20. Mukarugwiro, J.; Newete, S.; Adam, E.; Nsanganwimana, F.; Abutaleb, K.; Byrne, M. Mapping Distribution of Water Hyacinth (Eichhornia Crassipes) in Rwanda Using Multispectral Remote Sensing Imagery. Afr. J. Aquat. Sci. 2019, 44, 339–348. [Google Scholar] [CrossRef]
  21. Dube, T.; Mutanga, O.; Sibanda, M.; Bangamwabo, V.; Shoko, C. Testing the Detection and Discrimination Potential of the New Landsat 8 Satellite Data on the Challenging Water Hyacinth (Eichhornia Crassipes) in Freshwater Ecosystems. Appl. Geogr. 2017, 84, 11–22. [Google Scholar] [CrossRef]
  22. Thamaga, K.H.; Dube, T. Remote Sensing of Invasive Water Hyacinth (Eichhornia Crassipes): A Review on Applications and Challenges. Remote Sens. Appl. Soc. Environ. 2018, 10, 36–46. [Google Scholar] [CrossRef]
  23. Ghoussein, Y.; Nicolas, H.; Haury, J.; Fadel, A.; Pichelin, P.; Abou Hamdan, H.; Faour, G. Multitemporal Remote Sensing Based on an FVC Reference Period Using Sentinel-2 for Monitoring Eichhornia Crassipes on a Mediterranean River. Remote Sens. 2019, 11, 1856. [Google Scholar] [CrossRef] [Green Version]
  24. Zhang, X.; Liao, C.; Li, J.; Sun, Q. Fractional Vegetation Cover Estimation in Arid and Semi-Arid Environments Using HJ-1 Satellite Hyperspectral Data. Int. J. Appl. Earth Obs. Geoinf. 2013, 21, 506–512. [Google Scholar] [CrossRef]
  25. Huete, A.R. A Soil-Adjusted Vegetation Index (SAVI). Remote Sens. Environ. 1988, 25, 295–309. [Google Scholar] [CrossRef]
  26. Anker, Y.; Hershkovitz, Y.; Ben Dor, E.; Gasith, A. Application of Aerial Digital Photography for Macrophyte Cover and Composition Survey in Small Rural Streams. River Res. Appl. 2014, 30, 925–937. [Google Scholar] [CrossRef]
  27. MicaSense, Inc. The RedEdge-MX Sensor Data Sheet. Available online: https://micasense.com/wp-content/uploads/2019/11/Trifold-Dual-Camera-Product-Sheet.pdf (accessed on 12 December 2021).
  28. Benjamin, A.R.; Abd-Elrahman, A.; Gettys, L.A.; Hochmair, H.H.; Thayer, K. Monitoring the Efficacy of Crested Floatingheart (Nymphoides Cristata) Management with Object-Based Image Analysis of UAS Imagery. Remote Sens. 2021, 13, 830. [Google Scholar] [CrossRef]
  29. Rouse, J.W., Jr.; Haas, R.H.; Schell, J.A.; Deering, D.W. Monitoring Vegetation Systems in The Great Plains with ERTS. In Third Earth Resources Technology Satellite-1 Symposium: Section A; Scientific and Technical Information Office, National Aeronautics and Space Administration: Washington, DC, USA, 1973; Volume 1, pp. 309–317. [Google Scholar]
  30. Xiaoqin, W.; Miaomiao, W.; Shaoqiang, W.; Yundong, W. Extraction of Vegetation Information from Visible Unmanned Aerial Vehicle Images. Trans. Chin. Soc. Agric. Eng. 2015, 31, 152–159. [Google Scholar]
  31. Gómez-Sapiens, M.; Schlatter, K.J.; Meléndez, Á.; Hernández-López, D.; Salazar, H.; Kendy, E.; Flessa, K.W. Improving the Efficiency and Accuracy of Evaluating Aridland Riparian Habitat Restoration Using Unmanned Aerial Vehicles. Remote Sens. Ecol. Conserv. 2021, 7, 488–503. [Google Scholar] [CrossRef]
  32. Chang, C.-C.; Lin, C.-J. LIBSVM: A Library for Support Vector Machines. ACM Trans. Intell. Syst. Technol. 2011, 2, 1–27. [Google Scholar] [CrossRef]
  33. Riedmiller, M.; Braun, H. A Direct Adaptive Method for Faster Backpropagation Learning: The RPROP Algorithm. IEEE Int. Conf. Neural Netw. 1993, 1, 586–591. [Google Scholar]
  34. Landis, J.R.; Koch, G.G. The Measurement of Observer Agreement for Categorical Data. Biometrics 1977, 33, 159–174. [Google Scholar] [CrossRef] [Green Version]
  35. Barsi, Á.; Kugler, Z.; László, I.; Szabó, G.; Abdulmutalib, H. Accuracy Dimensions in Remote Sensing. Int. Arch. Photogramm. Remote Sens. Spat. Inf. Sci. 2018, 42. [Google Scholar] [CrossRef] [Green Version]
  36. Ling, C.; Liu, H.; Ju, H.; Zhang, H.; You, J.; Li, W. A Study on Spectral Signature Analysis of Wetland Vegetation Based on Ground Imaging Spectrum Data. J. Phys. Conf. Ser. 2017, 910, 012045. [Google Scholar] [CrossRef]
  37. Traganos, D.; Reinartz, P. Mapping Mediterranean Seagrasses with Sentinel-2 Imagery. Mar. Pollut. Bull. 2018, 134, 197–209. [Google Scholar] [CrossRef] [Green Version]
  38. Chabot, D.; Dillon, C.; Shemrock, A.; Weissflog, N.; Sager, E.P.S. An Object-Based Image Analysis Workflow for Monitoring Shallow-Water Aquatic Vegetation in Multispectral Drone Imagery. ISPRS Int. J. Geo-Inf. 2018, 7, 294. [Google Scholar] [CrossRef] [Green Version]
  39. Cunha, M.; Marques, J.; Azevedo, J.; Castilho, A. Understanding the Impact of a Major Hydro-Agricultural Project in Low Mondego Area (Portugal). Land 2021, 10, 114. [Google Scholar] [CrossRef]
  40. Marques, J.C.; Graça, M.A.; Pardal, M.Â. Aquatic Ecology of the Mondego River Basin Global Importance of Local Experience; Imprensa da Universidade de Coimbra: Coimbra, Portugal, 2002; pp. 7–12. ISBN 978-989-26-0336-0. [Google Scholar]
  41. Ramadhani, F.; Pullanagari, R.; Kereszturi, G.; Procter, J. Mapping of Rice Growth Phases and Bare Land Using Landsat-8 OLI with Machine Learning. Int. J. Remote Sens. 2020, 41, 8428–8452. [Google Scholar] [CrossRef]
  42. Pádua, L.; Vanko, J.; Hruška, J.; Adão, T.; Sousa, J.J.; Peres, E.; Morais, R. UAS, Sensors, and Data Processing in Agroforestry: A Review towards Practical Applications. Int. J. Remote Sens. 2017, 38, 2349–2391. [Google Scholar] [CrossRef]
  43. Thamaga, K.H.; Dube, T. Testing Two Methods for Mapping Water Hyacinth (Eichhornia Crassipes) in the Greater Letaba River System, South Africa: Discrimination and Mapping Potential of the Polar-Orbiting Sentinel-2 MSI and Landsat 8 OLI Sensors. Int. J. Remote Sens. 2018, 39, 8041–8059. [Google Scholar] [CrossRef]
  44. Presidência do Conselho de Ministros. Resolução do Conselho de Ministros no 55/2018. Diário Da República: I Série No 8 2018, 1835–1880. Available online: https://dre.pt/dre/detalhe/resolucao-conselho-ministros/55-2018-115226936 (accessed on 30 December 2021).
  45. Lishawa, S.C.; Carson, B.D.; Brandt, J.S.; Tallant, J.M.; Reo, N.J.; Albert, D.A.; Monks, A.M.; Lautenbach, J.M.; Clark, E. Mechanical Harvesting Effectively Controls Young Typha Spp. Invasion and Unmanned Aerial Vehicle Data Enhances Post-Treatment Monitoring. Front. Plant Sci. 2017, 8, 619. [Google Scholar] [CrossRef]
  46. Samiappan, S.; Turnage, G.; Hathcock, L.; Casagrande, L.; Stinson, P.; Moorhead, R. Using Unmanned Aerial Vehicles for High-Resolution Remote Sensing to Map Invasive Phragmites Australis in Coastal Wetlands. Int. J. Remote Sens. 2017, 38, 2199–2217. [Google Scholar] [CrossRef]
  47. Government of Western Australia Drones Improve Invasive Weed Surveillance. Available online: https://www.agric.wa.gov.au/news/media-releases/drones-improve-invasive-weed-surveillance (accessed on 21 December 2021).
  48. Zaman, B.; Jensen, A.M.; McKee, M. Use of High-Resolution Multispectral Imagery Acquired with an Autonomous Unmanned Aerial Vehicle to Quantify the Spread of an Invasive Wetlands Species. In Proceedings of the 2011 IEEE International Geoscience and Remote Sensing Symposium, Vancouver, BC, Canada, 24–29 July 2011; pp. 803–806. [Google Scholar]
  49. Liu, M.; Yu, T.; Gu, X.; Sun, Z.; Yang, J.; Zhang, Z.; Mi, X.; Cao, W.; Li, J. The Impact of Spatial Resolution on the Classification of Vegetation Types in Highly Fragmented Planting Areas Based on Unmanned Aerial Vehicle Hyperspectral Images. Remote Sens. 2020, 12, 146. [Google Scholar] [CrossRef] [Green Version]
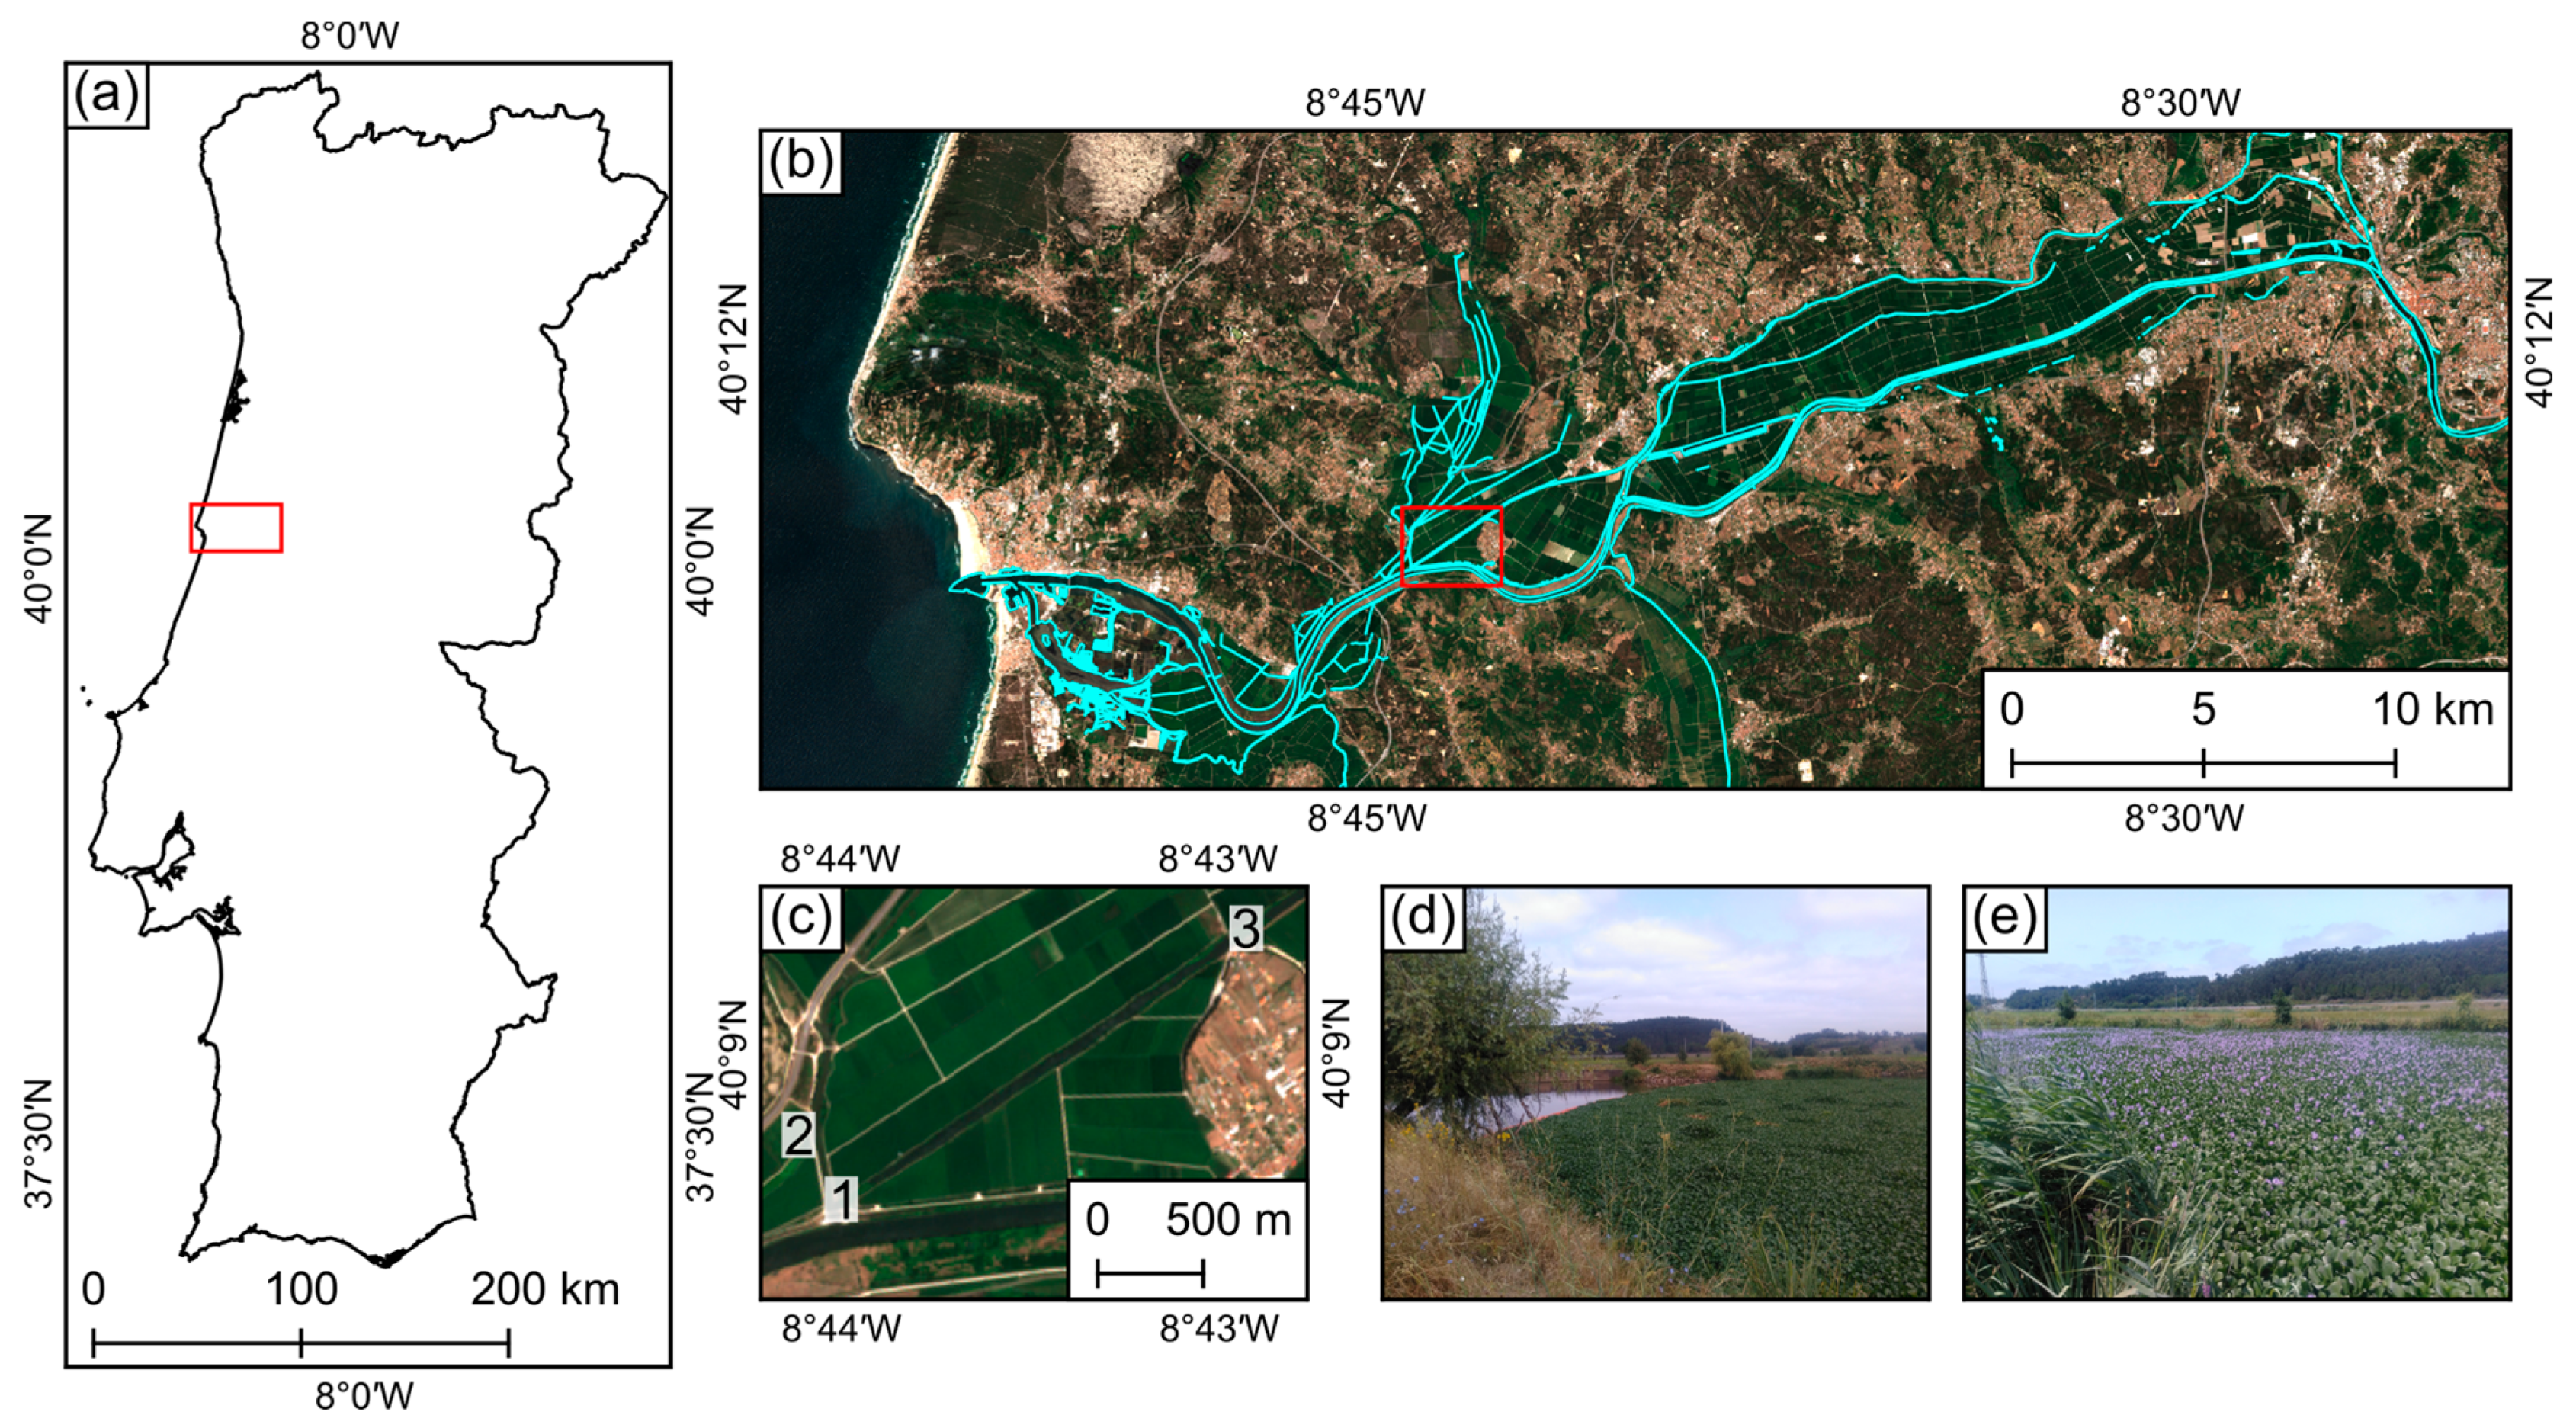
Figure 1. Overview of the study area: (a) its location within mainland Portugal; (b) overview of the Lower Mondego main water canals (in blue); (c) location of the three analysed areas, red polygon highlighted in (b); and (d,e) photographs of study areas 1 and 2, respectively.
Drones 06 00047 g001
Figure 2. Red, green, blue (RGB) composite representation of the orthorectified multispectral data acquired by an unmanned aerial vehicle in the three study areas.
Drones 06 00047 g002
Figure 3. Average reflectance of water hyacinth samples in the three surveyed areas for the five bands acquired by the MicaSense RedEdge-MX sensor with the unmanned aerial vehicle.
Drones 06 00047 g003
Figure 4. Classification of water hyacinth in the three study areas using multispectral data from an unmanned aerial vehicle (a) and from Sentinel-2 (b).
Drones 06 00047 g004
Figure 5. Water hyacinth coverage in the water channels of the surveyed areas in three consecutive dates. Red pixels mark the potential presence of water hyacinth.
Drones 06 00047 g005
Table 1. Flight campaign information of the multispectral data acquired from the unmanned aerial vehicle.
Study AreaCoordinates (Lat., Long.)Altitude (m)Start
Time
Covered Area (ha)Spatial
Resolution (cm)
No. of Images (No. of Captures)
140°8′55″ N
8°44′12″ W
010:3523.37.351955 (391)
240°9′60″ N
8°44′17″ W
211:2910.67.251135 (227)
340°9′38″ N
8°42′47″ W
414:068.97.24910 (182)
Table 2. Validation performed on the models created by the different classifiers with the data acquired by an unmanned aerial vehicle and from Sentinel-2 MSI. Best result in each metric and platform is highlighted in bold. UA: user’s accuracy; PA: producer’s accuracy; K: kappa coefficient; OA: overall accuracy; RF: random forest; SVM: support vector machine; ANN: artificial neural network; NB: Gaussian naive Bayes; KNN: k-nearest neighbors.
ClassifierUAPAKOA
Unmanned aerial vehicle data
RF0.930.960.880.94
SVM0.830.930.740.87
ANN0.870.960.820.91
NB0.820.980.770.88
KNN0.880.930.810.90
Sentinel-2 data
RF0.880.930.800.90
SVM1.000.670.670.83
ANN0.930.870.800.90
NB1.000.730.730.87
KNN0.920.800.730.87
Table 3. Water hyacinth surface coverage estimation in the analyzed areas along time.
Study AreaEstimated Surface (m2)Total Surface (m2)
13 July 202121 July 202128 July 2021
153005524640020,777
241005438470018,790
339008699860018,250
Publisher’s Note: MDPI stays neutral with regard to jurisdictional claims in published maps and institutional affiliations.