Article

System Identification of Heterogeneous Multirotor Unmanned Aerial Vehicle

1
School of Engineering, RMIT University, Melbourne, VIC 3000, Australia
2
School of Electrical, Computer and Telecommunications Engineering (SECTE), University of Wollongong, Wollongong, NSW 2522, Australia
3
Department of Electronic Engineering, NED University, Karachi 75270, Pakistan
*
Author to whom correspondence should be addressed.
Drones 2022, 6(10), 309; https://doi.org/10.3390/drones6100309
Submission received: 4 September 2022 / Revised: 4 October 2022 / Accepted: 18 October 2022 / Published: 20 October 2022
(This article belongs to the Section Drone Design and Development)

Abstract

:
An energy efficient heterogeneous multirotor unmanned aerial system (UAS) is presented in this paper, wherein, the aerodynamical characteristics of both helicopter and quadrotor are obtained in a single multirotor design. It features the energy efficiency and endurance of a helicopter, while keeping the mechanical simplicity, control and maneuverability of a quadrotor; employing a single large central rotor to get majority of the lift and four small arm canted rotors for control. Developing the stable and robust control strategy requires the accurate model of system. Due to the added mechanical complexities of the new design including the existence of couplings and gyroscopics, the modelling through the dynamic equations of the multirotor would not be possible in providing accurate results. Therefore, precise system modelling is required for the development of stable and robust control strategy. This paper proposes a novel system identification method with the objective to experimentally estimation of the precise dynamic model of the heterogeneous multirotor. The approach comprises of the utilization of input excitation signals, frequency sampling filter and derivation of transfer functions through complex curve fitting method. To validate the accuracy of the obtained transfer functions, the experimentally auto-tuned PID controllers are implemented over the transfer functions. Custom designed fight controller is used to experimentally implement the proposed idea. Presented results demonstrate the efficacy of the proposed approach for heterogeneous multirotor UAS.

1. Introduction

Due to the recent technological advancements, multirotor UASs have enjoyed much popularity over the past couple of decades in the multitude of military as well as civilian applications [1,2], because of their numerous extra-ordinary characteristics such as, rapid maneuverability, controllability, diverse applicability, reliability, simple design and economy [3,4]. Paramountcy of the these UAVs was also realized during the peaks of COVID-19 pandemic [5,6,7]. Subsequently, the multirotor UAVs have been intensively studied over the past couple of decades for their advancements in configuration, modelling and control [8,9,10,11]. However, despite of the numerous characteristics, multirotors have been termed as less energy efficient providing less endurance as compared to fixedwing and helicopter counterparts. Which is mainly attributable to inter-propeller interference and effect of scale such as Reynolds number [12,13,14]. Furthermore, the power needed for a rotorcraft to hover has the inverse relation with the rotor disc [15], therefore, for a provided diameter footprint, a single large rotor of helicopter energetically outperforms the numerous small rotors of the multirotor, within a same boundary [16].
In the literature, to overcome the endurance and energetics issues of multirotor UASs, certain approaches are instituted. Wireless charging approach proposed in [17] puts an extra weight of receiving coil structures and also possesses limitations of charging stations to be established at certain points. For the solar power system utilized in [18], weather variations would have a drastic affect, such as overcast and cloudy conditions and also would not be beneficial during the night time. Bounded control framework is presented in [19] to improve the energy efficiency of the multirotor, where the roll and pitch angles are regulated within the predefined ranges based on power consumption analytical model. However, limiting the attitude angles would affect the maneuverability of the multirotor, especially when hard maneuvering is required. Also they have demonstrated the energy saving of only 5% at the cost of pre-defining limits of attitude angles. Authors in [20], proposed to add servo motors at each quadrotor boom in order to introduce the tilting mechanism of the rotor. However, their proposed over-actuated system can only be benefited in the forward flight and would not feature any energy efficiency benefits during the hovering. Out of all previously proposed solutions, maximizing the power transfer efficiency of lifting systems through an efficient rotor configuration is the most feasible solution to improve the energetics performance [21,22].
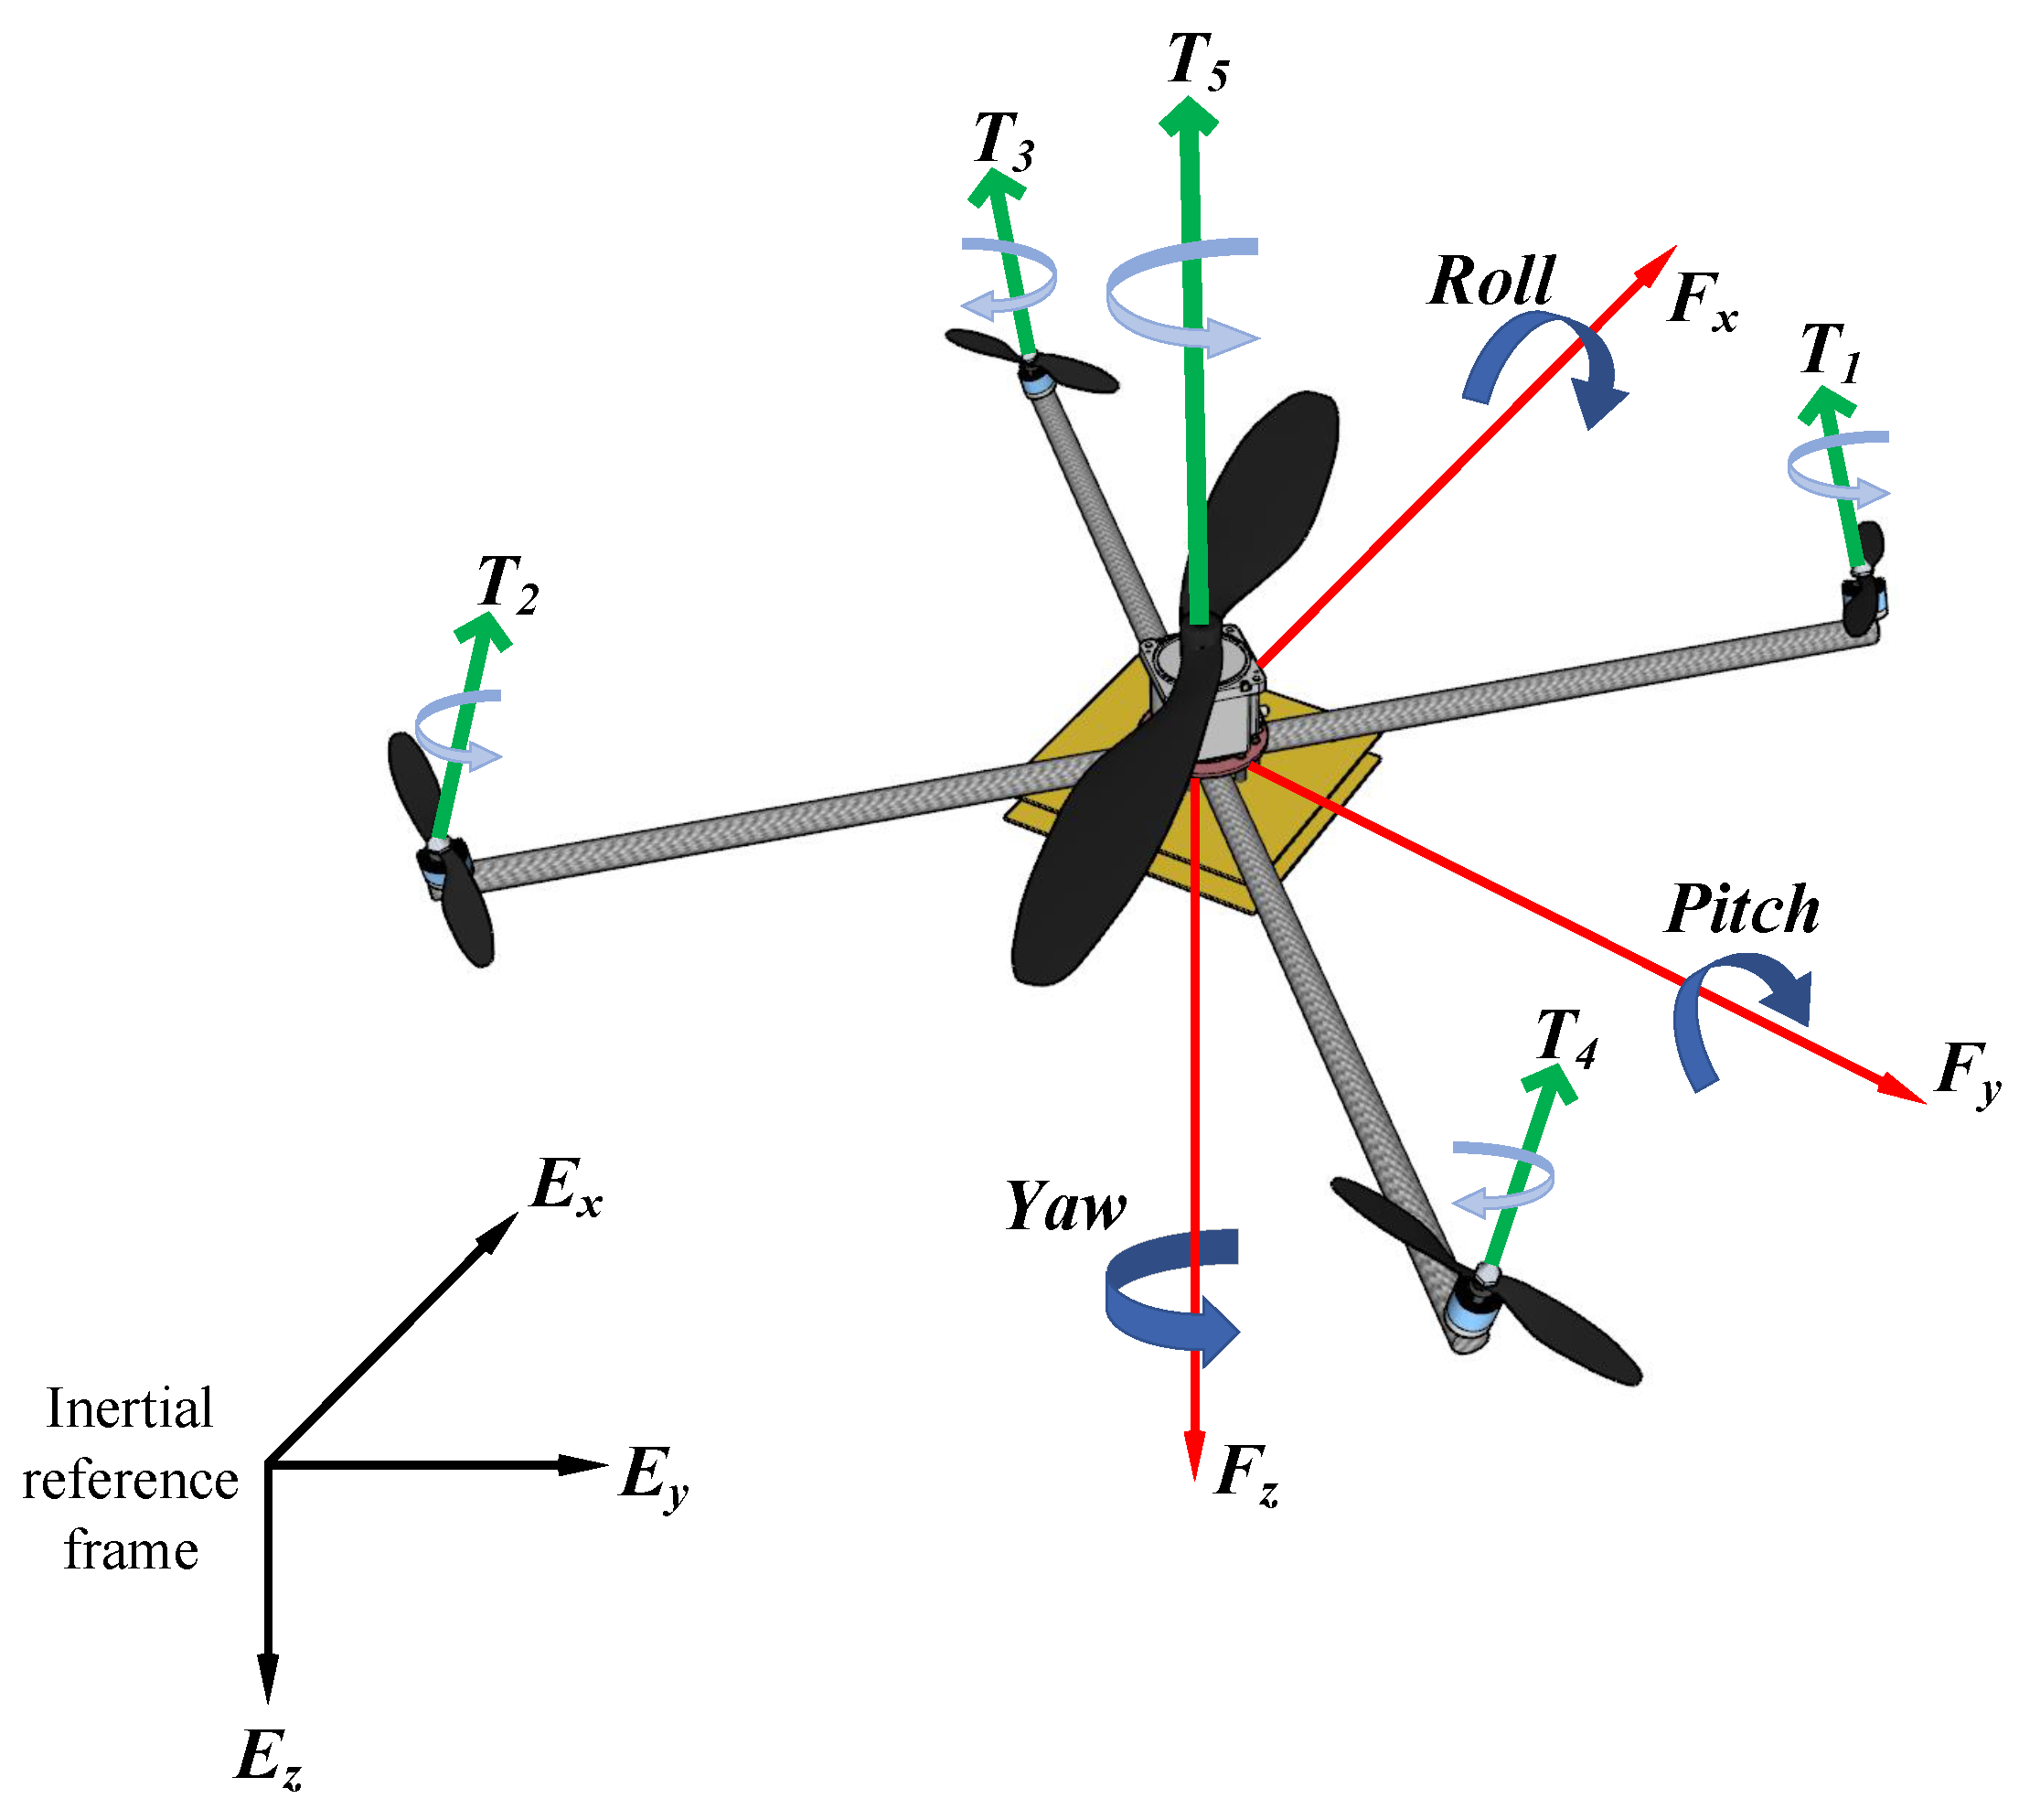
This paper presents a heterogeneous configuration of the multirotor unmanned aerial vehicle that features the combined characteristics of both helicopter and quadrotor in a single multirotor design, featuring the energy efficiency and endurance of a helicopter, keeping the mechanical simplicity, control and maneuverability of a quadrotor. By employing a single large central rotor to get the majority of the lift and four small arm canted rotors for control as shown in the Figure 1. Most of the required thrust is obtained through the central rotor, similar to a helicopter. The control of the maneuverability is executed by the arm rotors, similar to a standard quadrotor. These small arm rotors are marginally angled sideways at a fixed tilt angle to generate a lateral thrust in order to counter the central rotor’s torque, like the small tail rotor in a standard helicopter. The maneuvering moments are attained through the thrust caused by counter-torque rotors. Consequently, through a similar standard quadrotor mechanism, control torques are generated through increasing the speed of specific rotors and subsequently decreasing the speed of other rotors. The in-depth energy analysis of this heterogeneous multirotor design has been presented in [23]. In addition to the improvements in the energy efficiency and endurance of the multirotor, this heterogeneous configuration would also feature enhanced disturbance rejection in presence of a stable control system. As the boom rotors are opted to be much smaller compared to the standard multirotor (of similar size) with a higher Kv rating, which feature the ability of the faster reaction compared to the rotors of standard multirotor of similar size as well as to the central large rotor of this heterogeneous design. This is because of their decreased inertia.
One of the major challenges towards successful flight of this heterogeneous multirotor is the design of a stable and robust control system due to the added dynamical complexities into the system [21,24]. The presented heterogeneous multirotor with six degrees of freedom having only four control inputs is an underactuated system, like a conventional quadrotor [25]. It additionally exhibits complex non-linearities, gyroscopic precession and coupled dynamics. Strong coupling among multiple input multiple output channels exhibited by multirotors is also one of the aspects to be considered during the control system design. Designing a stable and robust control system strategy require the accurate dynamic model of the system. Due to the aforementioned dynamical complexities of the hetergoenous multirotor, modelling through the dynamic equations of the multirotor would not provide accurate results.
System identification approach is proposed in this paper to experimentally acquire the accurate model of the heterogeneous multirotor UAV. Transfer functions for the three attitude axes are derived through the frequency response of the multirotor and through complex curve fitting technique. The series of sinusoidal input signals with multiple frequencies are experimentally injected into the system to excite the multirotor UAV. Responses of the multirotor to each injected sinusoidal signals are measured. The estimated frequency points for each attitude axis are obtained from experimentally acquired input output data using frequency sampling filter. Transfer functions are then derived using magnitude and phase information through complex curve fitting technique. The obtained transfer functions for the attitude system are then validated using the experimentally designed auto-tuned PID controllers through stable performance also in the presence of atmospheric turbulences. The novel contributions of this paper are summarized as follows:
  • System identification is performed over the heterogeneous multirotor UAV. Where the transfer function models are obtained for the dynamically complex multirotor using complex curve fitting technique through experimentally acquired frequency responses. Thus, leading to the accurate system model, that incorporates all of the practical dynamics of the complex system, including large rotor gyroscopics, couplings, as well as sensors and actuators dynamics.
  • A hardware prototype is developed from scratch for an energy efficient multirotor design, which provides the combined aerodynamical characteristics of both helicopter and quadrotor in a single UAV design. Also, the motors generally associated with the racing drones are syncretized with this design, offering higher control bandwidth and faster response time. Which would lead to enhanced disturbance rejection capabilities of this multirotor, with a stable control system.
  • A custom flight controller is designed from the scratch to carry out the proposed experiments over the hardware prototype. Which is coded and implemented through a high-speed processor (ARM Cortex-M4 32-bit).
  • The accuracy of the obtained system models is validated through the auto-tuned PID control controllers which have been experimentally designed using hardware prototype through custom flight controller.

2. System Identification Methodology

2.1. Acquisition of the Plant Responses—Injecting Sinusoidal Excitation Inputs

The first stage of the system identification process starts by the experimentally injecting the range of sinusoidal excitation inputs into the multirotor UAV. The behavior of the multirotor is then recorded against each input signal. The range of the frequencies to be swept is initially selected for each of the attitude axis plant. The fundamental frequencies for each of the attitude axis plant of the multirotor determined through the relay feedback experiments in the [23] have been used as the base, for determining the range of frequencies to be injected into each attitude axis. The lower and higher input frequencies are then swept around the fundamental frequency point to determine the lowest and highest injectable input excitation frequency into the multirotor. The lowest frequencies are selected such that the input signal excites the particular axis of the multirotor within the range of 80 to + 80 . Whereas, the highest frequencies of the input excitation signals is chosen to be that input frequency which excites the particular axis so fast that it exhibits minimal motion. For instance, during the system identification of roll attitude axis. The lowest frequency sinusoidal input would cause the multirotor to swing within the 80 to + 80 of roll angle. Whereas, the highest frequency sinusoidal input would cause the minimal effect on the roll motion such that it will cause a roll maneuvering within the range of less than 5 to + 5 .
The range of the frequencies especially for the lowest and highest frequency of sinusoidal input signals varies for each axis. Which totally depends upon the dynamics of the each attitude axis system. The input frequency range for each axis is determined through the experiments. Table 1 presents the range of the frequencies of the input sinusoidal signals for all three attitude axis system. Which are to be injected into the respective axis system for the further system identification process.

2.2. Frequency Sampling Filter

The next stage of the system identification algorithm is to extract the useful information from the responses of the heterogeneous multirotor for the input excitation signals. Each input sinusoidal input signal actuates the multirotor for the respective motion within a certain angular range. The multirotor tracks the command by the input sinusoidal signal, where the reference tracking and behavior of the vehicle depend upon the frequency of the input signal. However, both the input signal and multirotor’s output response are periodic in nature. For a set of input and output periodic signals, frequency sampling filter (FSF) can be used to extract information from those experimentally acquired input output responses [26,27,28,29]. Hence, implementation of the FSF would provide us the frequency response of the system in form of complex frequency points. Which are further used to derive the transfer function model for each attitude axis.
The set of periodic input ( u ( k ) ) and output ( y ( k ) ) signals is acquired through successful excitation procedure. The output is described utilizing FSF model in relation to input signal as,
y ( k ) = G ( 0 ) f 0 ( k ) + l = ( n 1 ) / 2 ( n 1 ) / 2 G ( e j l ω d ) f l ( k ) + v ( k )
where, l = 1, 2, 3, ..... N. G ( 0 ) and G ( e j l ω d ) are the plant frequency response points. v ( k ) represents the output measurement noise that is supposed to be Gaussian distributed having zero mean and variance σ 2 . Moreover, f l ( k ) is the FSF output vector and f 0 ( k ) is output of FSF at zero frequency, expressed as,
f l ( k ) = 1 N 1 q N 1 q 1 e j l ω d u ( k )
f 0 ( k ) = 1 N 1 q N 1 q 1 u ( k )
q 1 here denotes the back-shift operator, expressed as q 1 x ( k ) = x ( k 1 ) . For a perfect periodic input signal u ( k ) having period N, the fourier analysis [30] suggests that it possesses the odd number of frequencies only and the decaying magnitude with the increasing number. Practically, due to the effect of noise or non-linearity, it is rare for the u ( k ) to be a perfect periodic signal. Hence, the output signal, through neglecting the high frequency terms, is expressed as,
y ( k ) G ( e j 0 ) f 0 ( k ) + G ( e j 1 ω d ) f 1 ( k ) + G ( e j 1 ω d ) f 1 ( k ) + G ( e j 2 ω d ) f 2 ( k ) + G ( e j 2 ω d ) f 2 ( k ) + G ( e j 3 ω d ) f 3 ( k ) + G ( e j 3 ω d ) f 3 ( k ) + v ( k )
Vector having complex parameters and its correlating regressor vector can be presented as,
Θ = [ G ( 0 ) G ( e j ω d ) G ( e j ω d ) G ( e j 2 ω d ) G ( e j 2 ω d ) G ( e j 3 ω d ) G ( e j 3 ω d ) ] *
Φ = [ f 0 ( k ) f 1 ( k ) f 1 ( k ) f 2 ( k ) f 2 ( k ) f 3 ( k ) + f 3 ( k ) ] *
Here, * suggests the transpose of complex conjugate of the concerned variable. Recursive least square algorithm is used to calculate approximated frequency parameter vector such as Θ ^ ( k ) , which is expressed as,
P ( k ) = P ( k 1 ) P ( k 1 ) * Φ ( k ) Φ ( k ) * 1 + P ( k 1 ) Φ ( k ) Φ ( k ) *
Θ ^ ( k ) = Θ ^ ( k 1 ) + P ( k 1 ) Φ ( k ) [ y ( k ) Φ ( k ) * Θ ^ ( k 1 ) ]
where P ( 0 ) and Θ ^ ( 0 ) have been the initial conditions set for recursive least squares algorithm. While, Θ ^ ( k ) possesses parameters for the estimated frequency response.

2.3. Derivation of Transfer Functions

After obtaining the frequency points through frequency sampling filter, transfer function is derived using magnitude and phase information through complex curve fitting technique laid out by [31]. Let G ( s ) be the linear transfer function for an unknown system, with the structure as under,
G ( s ) = A 0 + A 1 s + A 2 s 2 + A 3 s 3 + A 4 s 4 + . . . + A m s m B 0 + B 1 s + B 2 s 2 + B 3 s 3 + B 4 s 4 + . . . + B n s n
The order of the numerator and denominator of system’s transfer function is determined by the values of m and n. Which is estimated through curve fitting method. As s = j ω and j 2 = 1 , G ( s ) from the Equation (9) is then illustrated in its real and imaginary parts as,
G ( j ω ) = ( A 0 A 2 ω 2 + A 4 ω 4 . . . ) + j ω ( A 1 A 3 ω 2 + A 5 ω 4 . . . ) ( B 0 B 2 ω 2 + B 4 ω 4 . . . ) + j ω ( B 1 B 3 ω 2 + B 5 ω 4 . . . )
Equation (10) can also further be simply represented as,
G ( j ω ) = α + j ω β σ + j ω τ = N ( ω ) D ( ω )
Supposing a function F ( j ω ) being the ideal function, possessing the real and imaginary parts which completely fits within the indicated experimental curve, given as,
F ( j ω ) = R ( ω ) + j I ( ω )
Quality of the curve fitting would rely upon the deviation of G ( j ω ) from F ( j ω ) . Which is represented as the error in the fitting and is expressed as,
e ( ω ) = F ( j ω ) G ( j ω )
Substituting G ( j ω ) from Equation (11) into (13),
e ( ω ) = F ( j ω ) N ( ω ) D ( ω ) G ( j ω )
Equation (14) is further solved as,
D ( ω ) e ( ω ) = D ( ω ) F ( j ω ) N ( ω )
The difference expression in the right side of the Equation (15) determines the precision of the estimated transfer function. Which is further explored into its real and imaginary components as,
D ( ω ) e ( ω ) = a ( ω ) + j b ( ω )
Here the functions a ( ω ) and b ( ω ) are related to the frequency ω as well as to unknown coefficients such as A i and B i . The magnitude value of the Equation (16) is calculated as,
| D ( ω ) e ( ω ) | = a 2 ( ω ) + b 2 ( ω )
Considering ω k as the kth frequency point, and substituting into the Equation (17),
| D ( ω k ) e ( ω k ) | 2 = a 2 ( ω k ) + b 2 ( ω k )
Considering J being the function provided in Equation (18), then this approach is aiming at a 2 ( ω k ) and b 2 ( ω k ) values, that result to minimum value of J. Which is due to the fact that the Equation (18) is following minimizing function theory as it is technically derived from the difference equation. Hence, it can be further expressed as,
J = k = 0 m a 2 ( ω k ) + b 2 ( ω k )
Equation (19) can be rewritten utilizing the α k , β k , σ k and τ k , and R k and I k from Equations (11) and (12), respectively, as,
J = k = 0 m [ ( σ k R k ω k τ k I k α k ) 2 + ( ω k τ k R k + σ k I k ω k β k ) 2 ]
Differentiation is used to solve the Equation (20) for J. Which, as per standard mathematical practices, is differentiated with respect to unknown coefficients A i and B i , setting the results equal to zero. Which in fact leads to set of equations to be solved to acquire data for the unknowns, which are presented in matrices form as,
M × N = C
where,
M = λ 0 0 λ 2 T 1 S 2 T 3 0 λ 2 0 S 2 T 3 S 4 λ 2 0 λ 4 T 3 S 4 T 6 T 1 S 2 T 3 U 2 0 U 4 S 2 T 3 S 4 0 U 4 0 T 3 S 4 T 5 U 4 0 U 6 ,
N = A 0 A 1 A 2 B 1 B 2 B 3 , and C = S 0 T 1 S 2 0 U 2 0
The variables used in the above equations are determined as following,
λ h = k = 0 m ω k h S h = k = 0 m ω k h R k T h = k = 0 m ω k h I k U h = k = 0 m ω k h ( R k 2 + I k 2 )
Moreover, with the help of the values of ω k , I k and R k only, the unknown coefficients A i and B i can be determined. Which is due to the linear transformations utilized to obtain the T h , S h and U h values. As the frequency response points for the system are acquired through the experiments. Magnitude and phase information is extracted from the frequency points data, which is further utilized determine the R k and I k as,
R k = ( Magnitude   a t   ω k ) × cos ( Phase   angle   a t   ω k ) I k = ( Magnitude   a t   ω k ) × sin ( Phase   angle   a t   ω k )

3. Experimental Setup

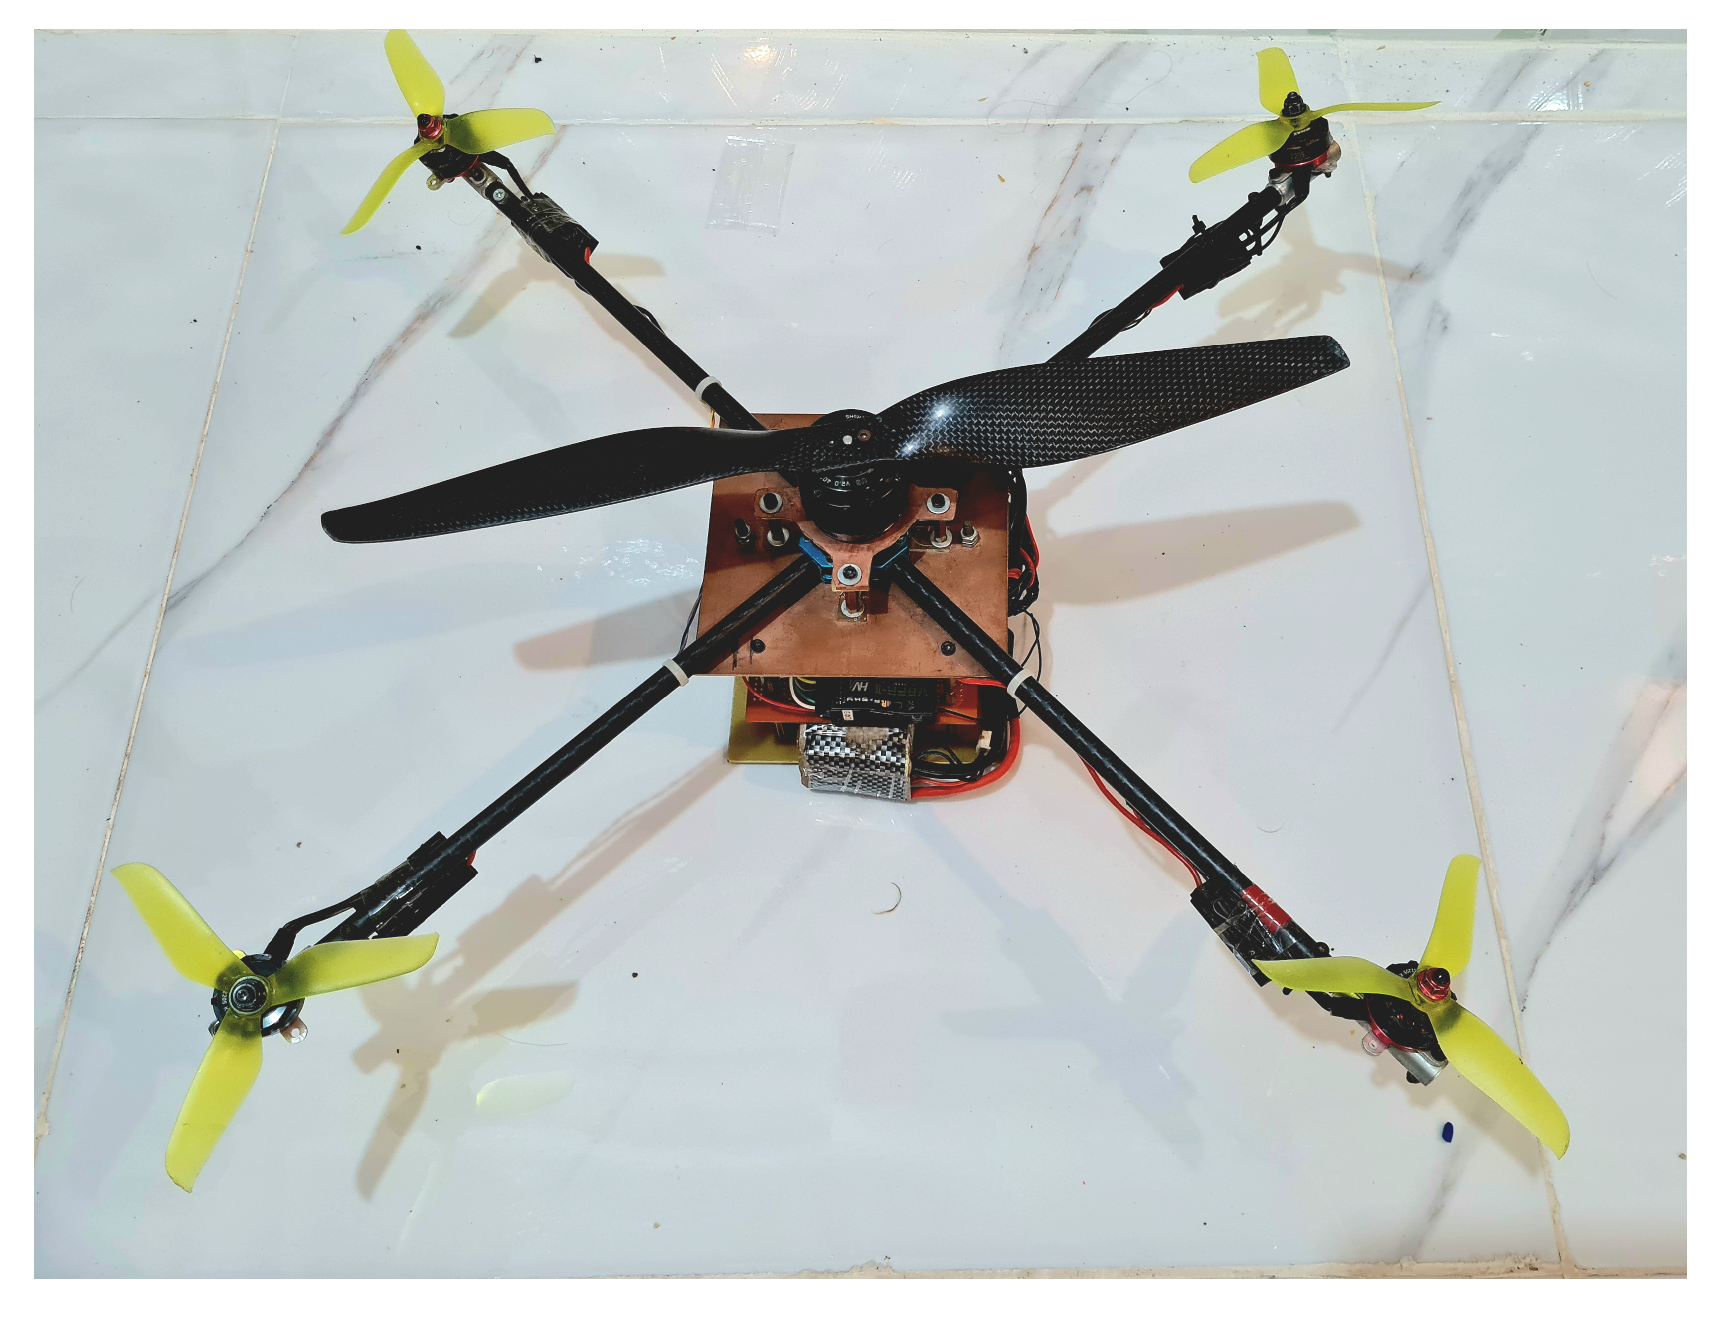
A hardware prototype is designed from scratch to experimentally implement the proposed idea as shown in the Figure 2. The prototype possesses four arms arranged in the cross configuration. The small motors are mounted at the end of the each arm possessing small propellers. The large motor is mounted exactly at the center of the multirotor frame which is fitted with a large propeller. The physical specifications of the multirotor prototype are illustrated in the Table 2. The essence of the heterogeneous multirotor design relies upon the central motor providing the majority of the required thrust, thus featuring the characteristics of a helicopter. As per the energy analysis of the heterogeneous multirotor, the large propeller is to be employed at the central rotor to realize the large rotor disc area for this multirotor. Therefore, the motor is to be carefully chosen which can efficiently be compatible with the selected propeller. Otherwise, the rotor would draw more power to hover which would in fact devalue the very basic theme of this heterogeneous multirotor configuration. Hence, a large sized motor with the lower Kv rating is selected to fulfill this purpose. As a lower Kv motor contains more winding of thinner wire and carry more volts at fewer amperes. It exhibits the ability to generate higher torque and has the ability to efficiently swing the bigger propellers, thus, produces higher thrust. Therefore, keeping in mind the design requirements of the proposed heterogeneous multirotor design. T-motor U5 is used as the central motor, which possesses 400 Kv rating. A big propeller (Tarot 1555-CF) having the diameter of 15 inches is used with the central motor to effectuate the required thrust.
The boom rotors are not required to provide significant thrust but they are required to provide the maneuvering control for the heterogeneous multirotor. For this purpose, fast reacting rotors with minimal response time are required, which not only provide the fast maneuvering control but also effectively counter the gyroscopics of the large central rotor. Therefore, small sized motors with a higher Kv rating are selected to achieve the mentioned objectives. A motor with high Kv rating possess fewer wingdings of thicker wire which can carry more amperes at comparatively fewer volts. It can spin a smaller propeller at much higher revolutions. Therefore, to fulfill the design requirements of the proposed design. Emax-2205 motors are used as the control motors, having 2300 Kv rating. Three-blade propellers (HQProp 5 × 4 × 3 v1s) are used with these small boom motors. These motors exhibit decreased inertia and top end speed as a result offer faster response time and higher control bandwidth. Because of these features, these motors are generally associated with the racing drones.
A high speed micro-controller is required to develop the flight controller for this heterogeneous multirotor, which assesses the attitude information and accordingly provide the control signal to the actuators in order to benefit from the fast reacting boom rotors. Therefore, Cortex M4 processor (32-bit) is used to implement the control system, which can maximally support up to 180 MHz of clock frequency. The controller board Teensy 3.5 used to design the custom flight controller is one the top performing and cost effective solution providing plenty of computational resources needed for this research project. Attitude of the multirotor is robustly estimated through combination of IMU (inertial motion unit) and digital motion processor (DMP). MPU6050 is used as the primary IMU in this prototype, which is a micro electro-mechanical system (MEMS) based 6-axis motion tracking device, consisting of 3-axis gyroscope and 3-axis accelerometer. MPU6050 also incorporates the built-in DMP. The algorithm associated with the DMP fuses the 3-axis gyroscope and 3-axis accelerometer data providing an efficient and sophisticated motion fusion [32]. The DMP computes the results in terms of quaternions, and can convert the results to Euler angles. Moreover, Employing the dedicated DMP features the advantage of providing noise free attitude information and also relieving the main processor from extra motion processing data. The flight controller’s specifications and avionic parts are depicted in Table 3.
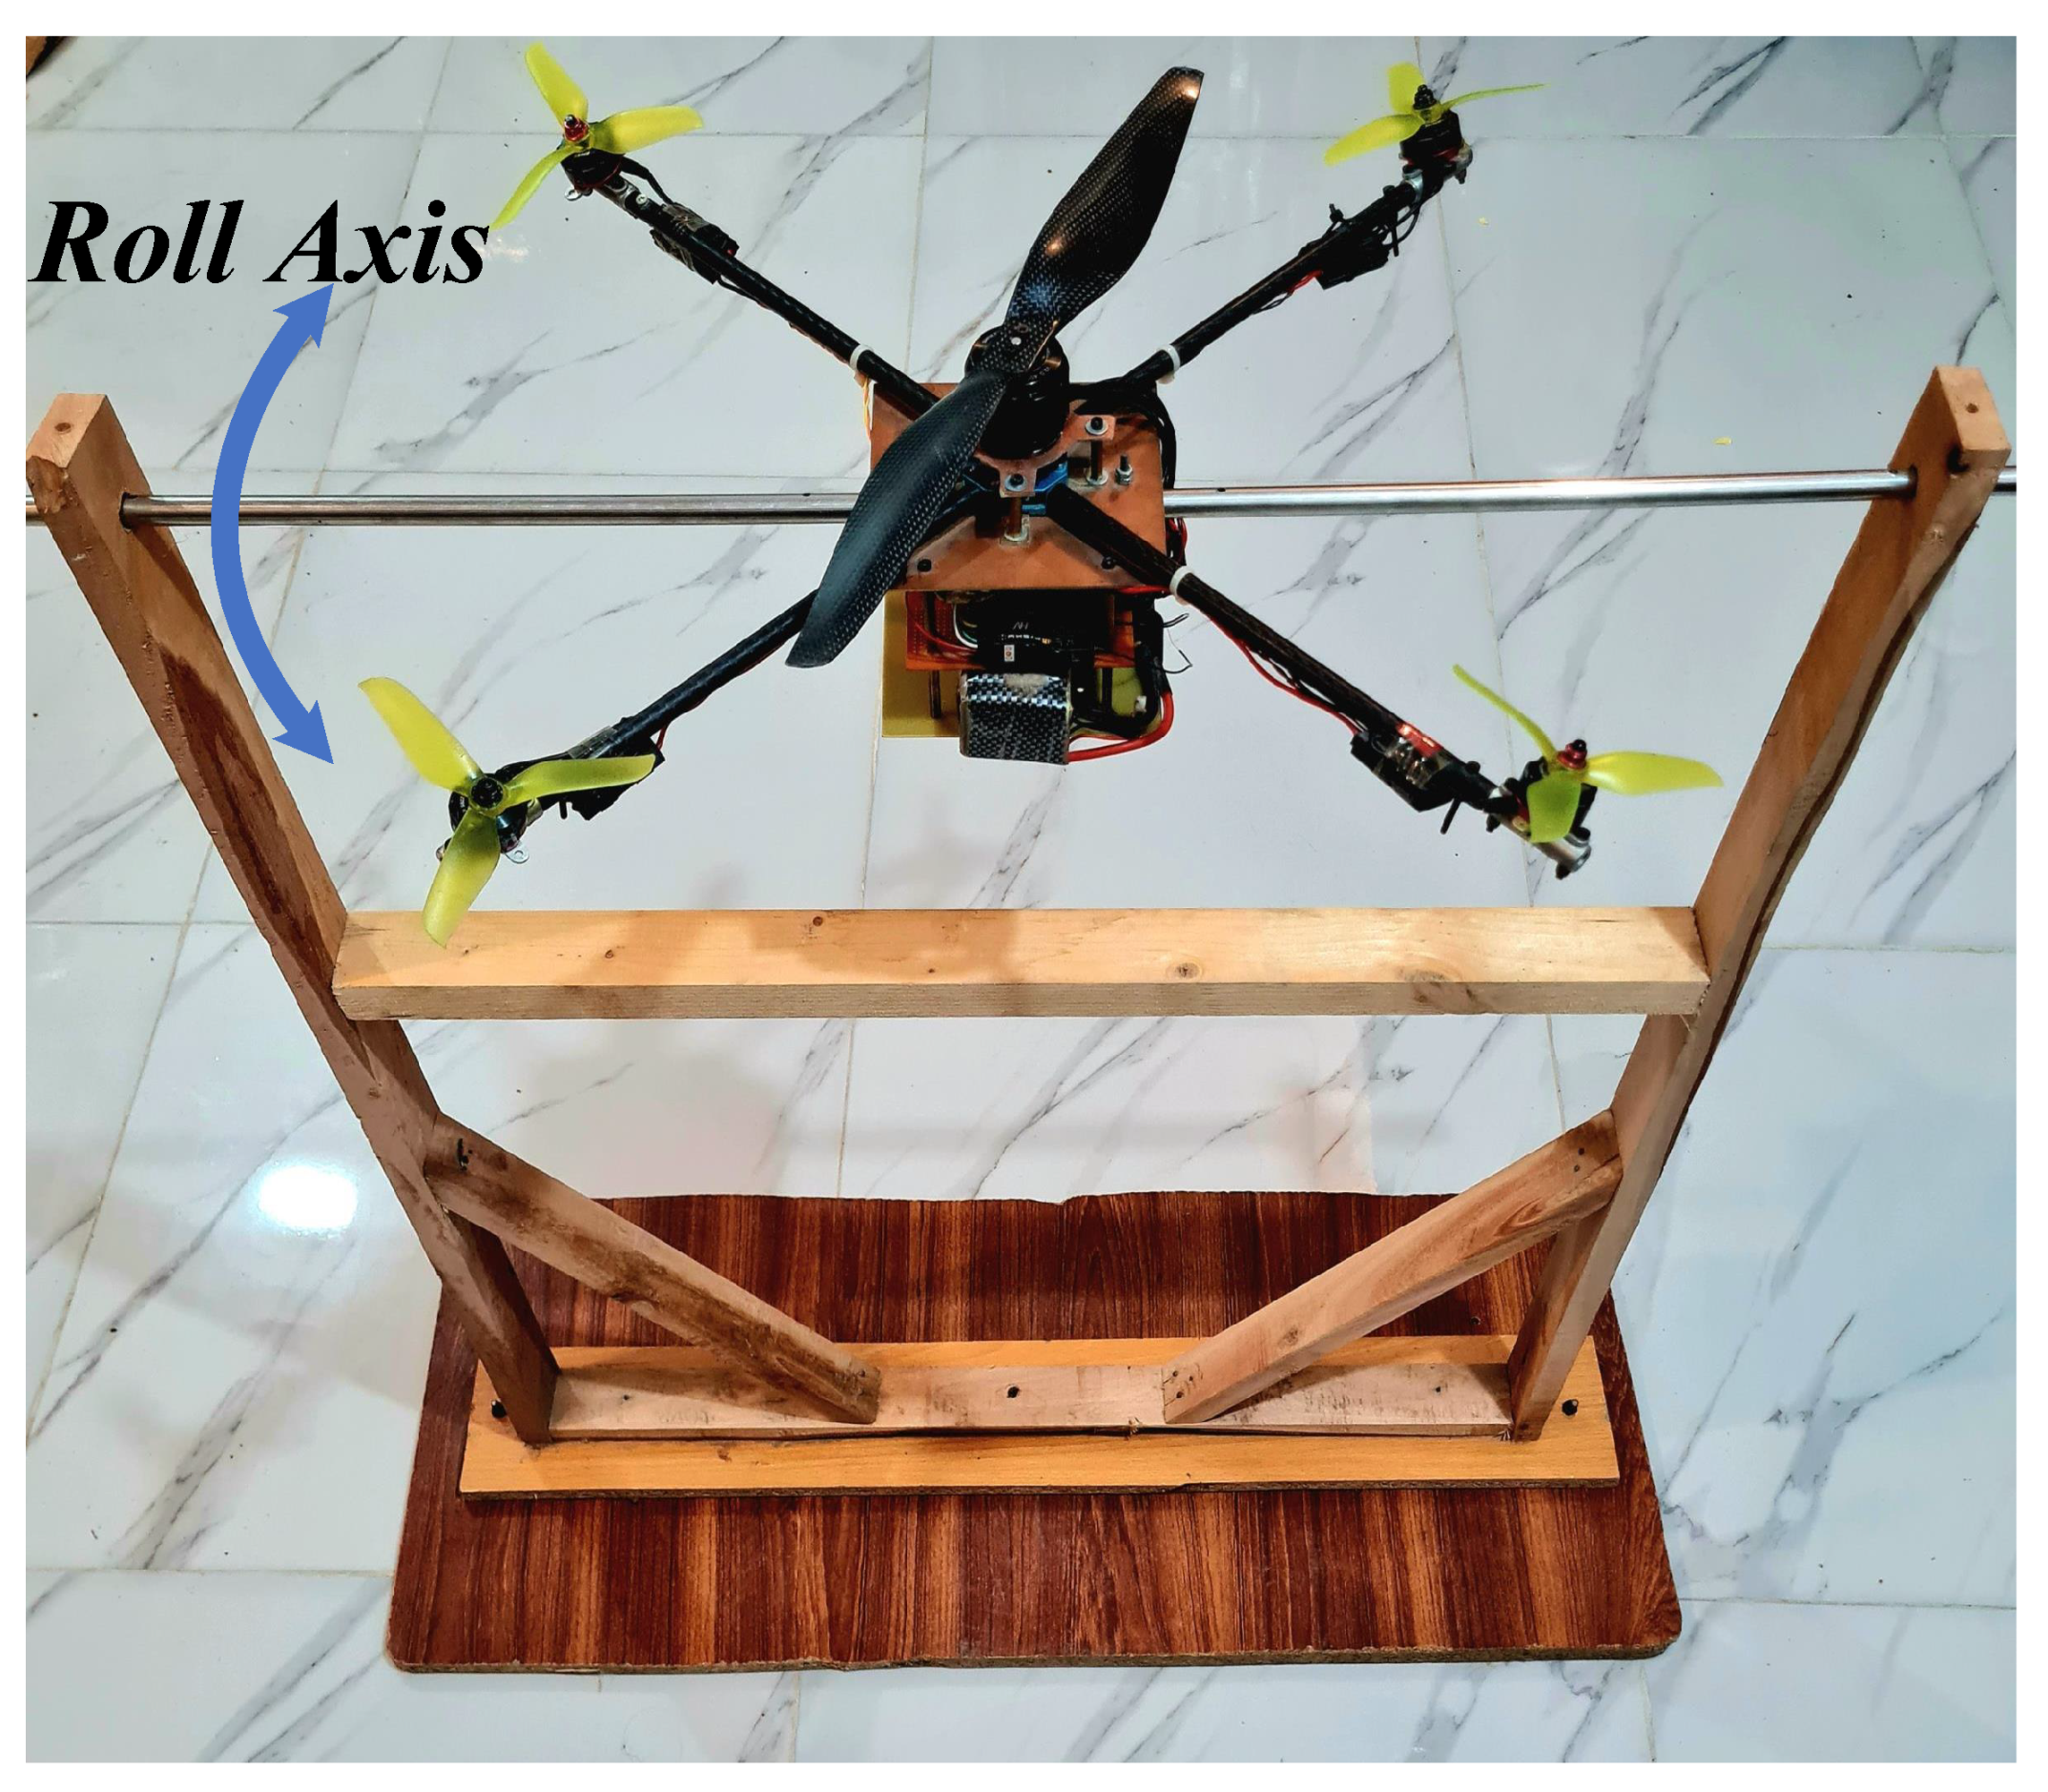
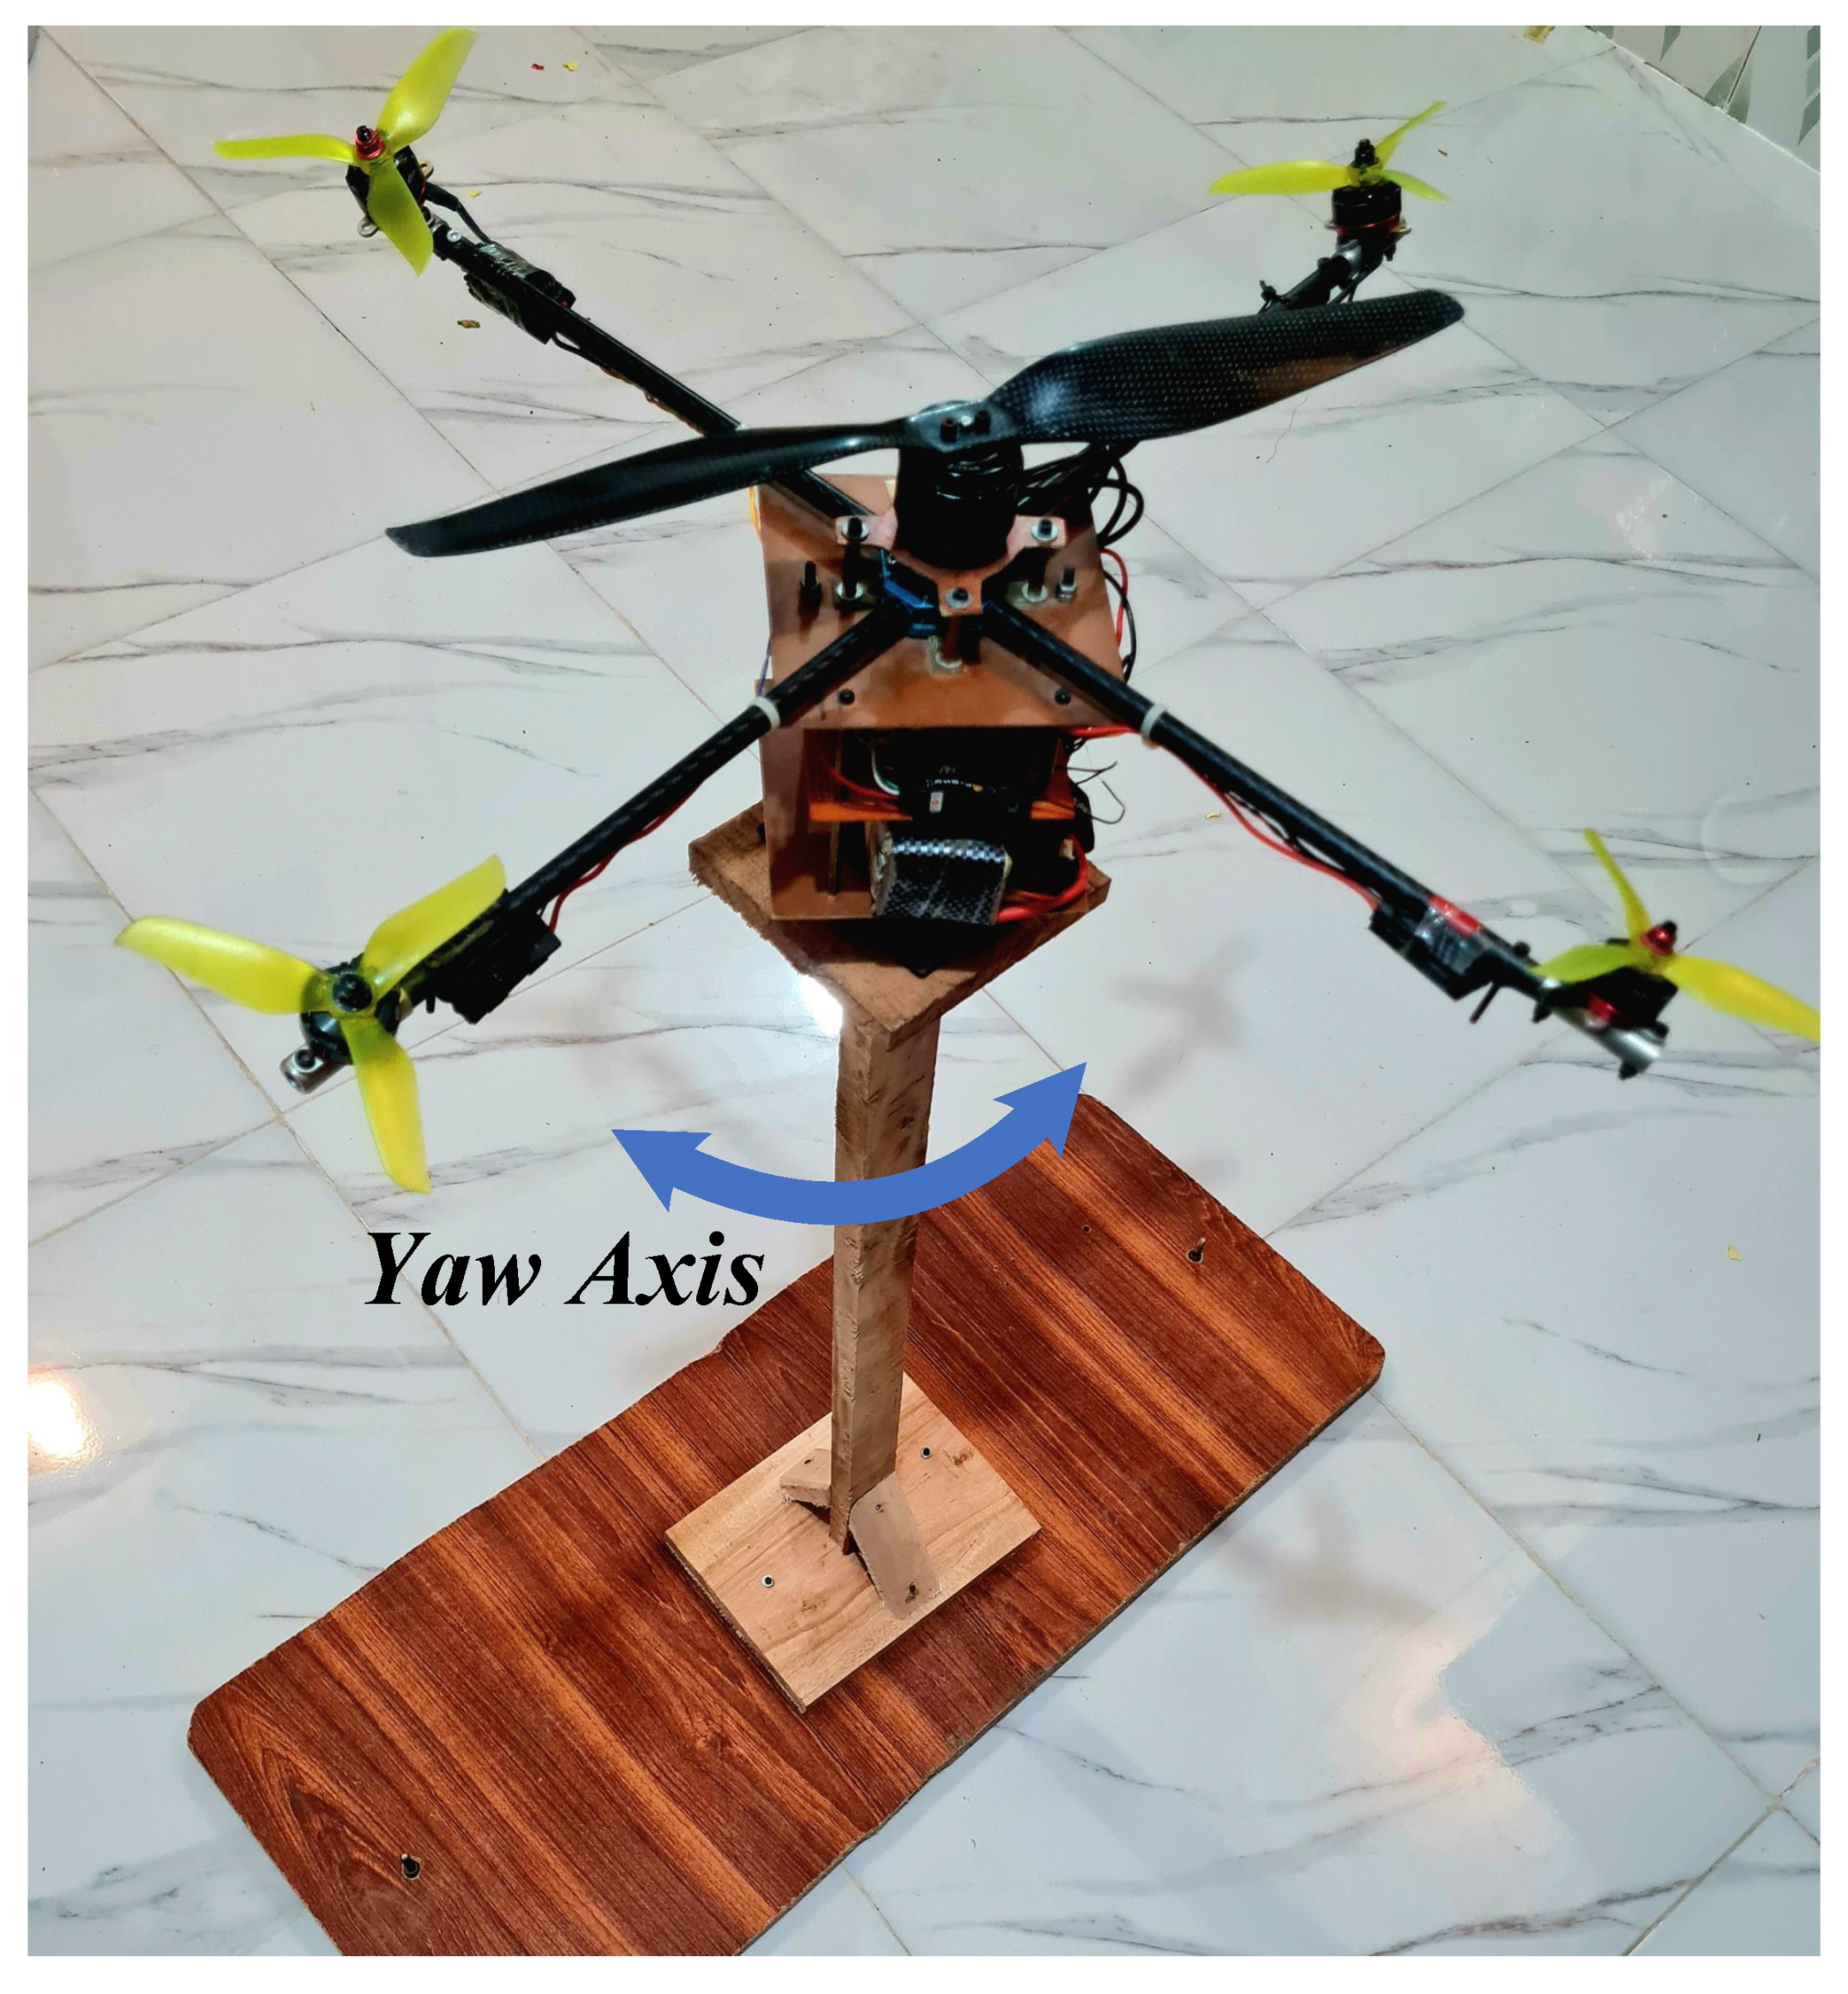
Moreover, the custom-designed test rigs are built to perform the proposed experimentation over heterogeneous multirotor prototype, which replicate the flight conditions in a controlled environment. Multirotor is then fixed on the test rig, along its thrust line, allowing only the specific motion, individually isolating the axis under consideration. Two test rigs are developed for the controller experimental analysis for the heterogeneous multirotor UAS. Figure 3 illustrates the test rig for roll and pitch axes. Whereas, the test rig shown in Figure 4 is used to analyze the attitude of the multirotor for yaw axis.

4. Experimental Analysis

4.1. System Identification of Roll Axis

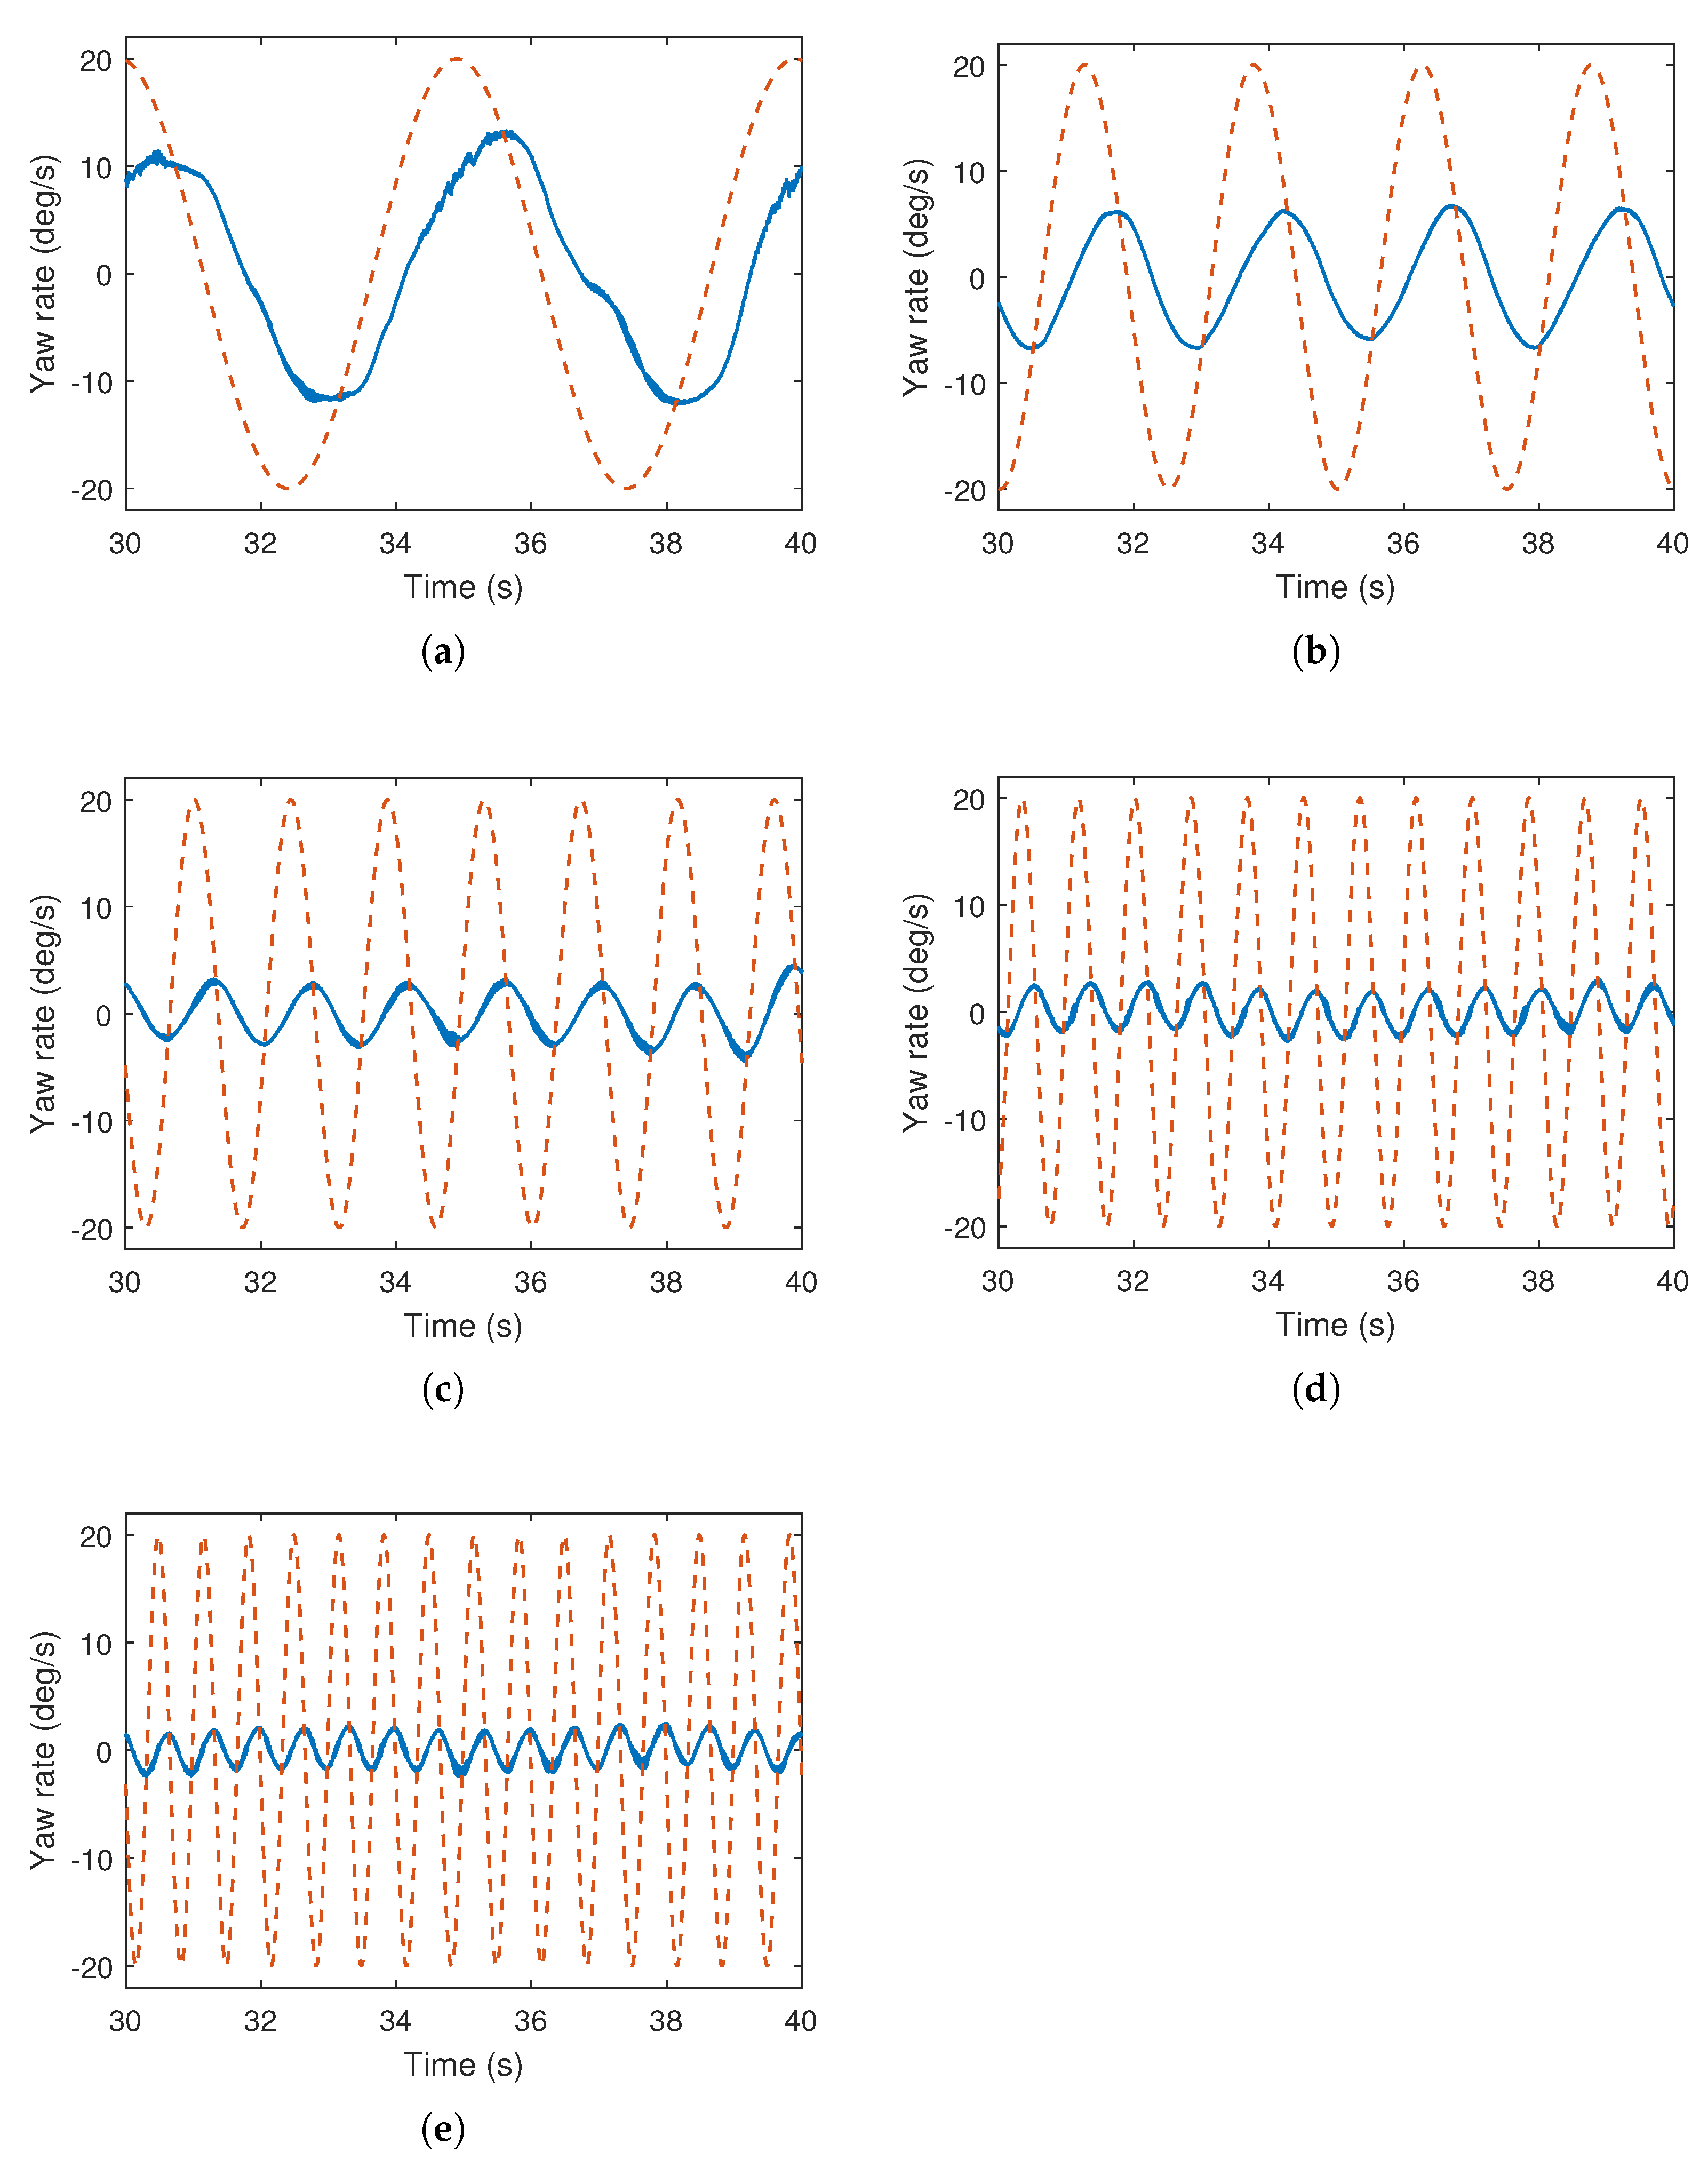
Multirotor prototype is setup on the test rig as shown in Figure 3 to perform the system identification experiments for roll axis. Sinusoidal input signals of various frequencies are injected into the roll axis. The behavior of the system is analyzed through measurement of the actual roll rate response of the multirotor against the each applied sinusoidal signal. The experimental responses of the system are illustrated in the Figure 5, where the system behavior is presented with respect to injected low to high frequencies. It can be observed from the presented responses that at the low frequency such as 0.5 Hz, the multirotor UAV is appropriately following the reference excitation signal. Therefore, the frequencies lower than this input frequency are not considered for the system identification process as in the real flight the roll rate motion of the UAV is not supposed to be slower than this.
It can also further be observed that as the frequency of the input sinusoidal signal increases, the measured roll rate response gets flatter. This is due to the fact that the polarity of the input sinusoidal signal switches at much higher rate with the increasing frequency as a result the multirotor is not able to appropriately catch up with amplitude of the reference signal. It can be analyzed in the higher frequency responses presented in Figure 5 that with the change in the polarity of the input sinusoidal signal, the related control rotors actuate faster and tends to switch the rotorcraft other way around as soon as the multirotor is starting to turn towards the currently referred direction. This behavior of the system practically suggests the highest frequency to be injected into the roll axis plant of this heterogeneous multirotor.
The experimental analysis is tabulated in the Table 4. The series of sinusoidal excitation signals having frequency value ( ω k ) in radians per second at kth frequency point are presented. The obtained magnitude and phase information at each frequency are illustrated. Subsequently, the components R k and I k required for Levy’s curve fitting approach are also evaluated.
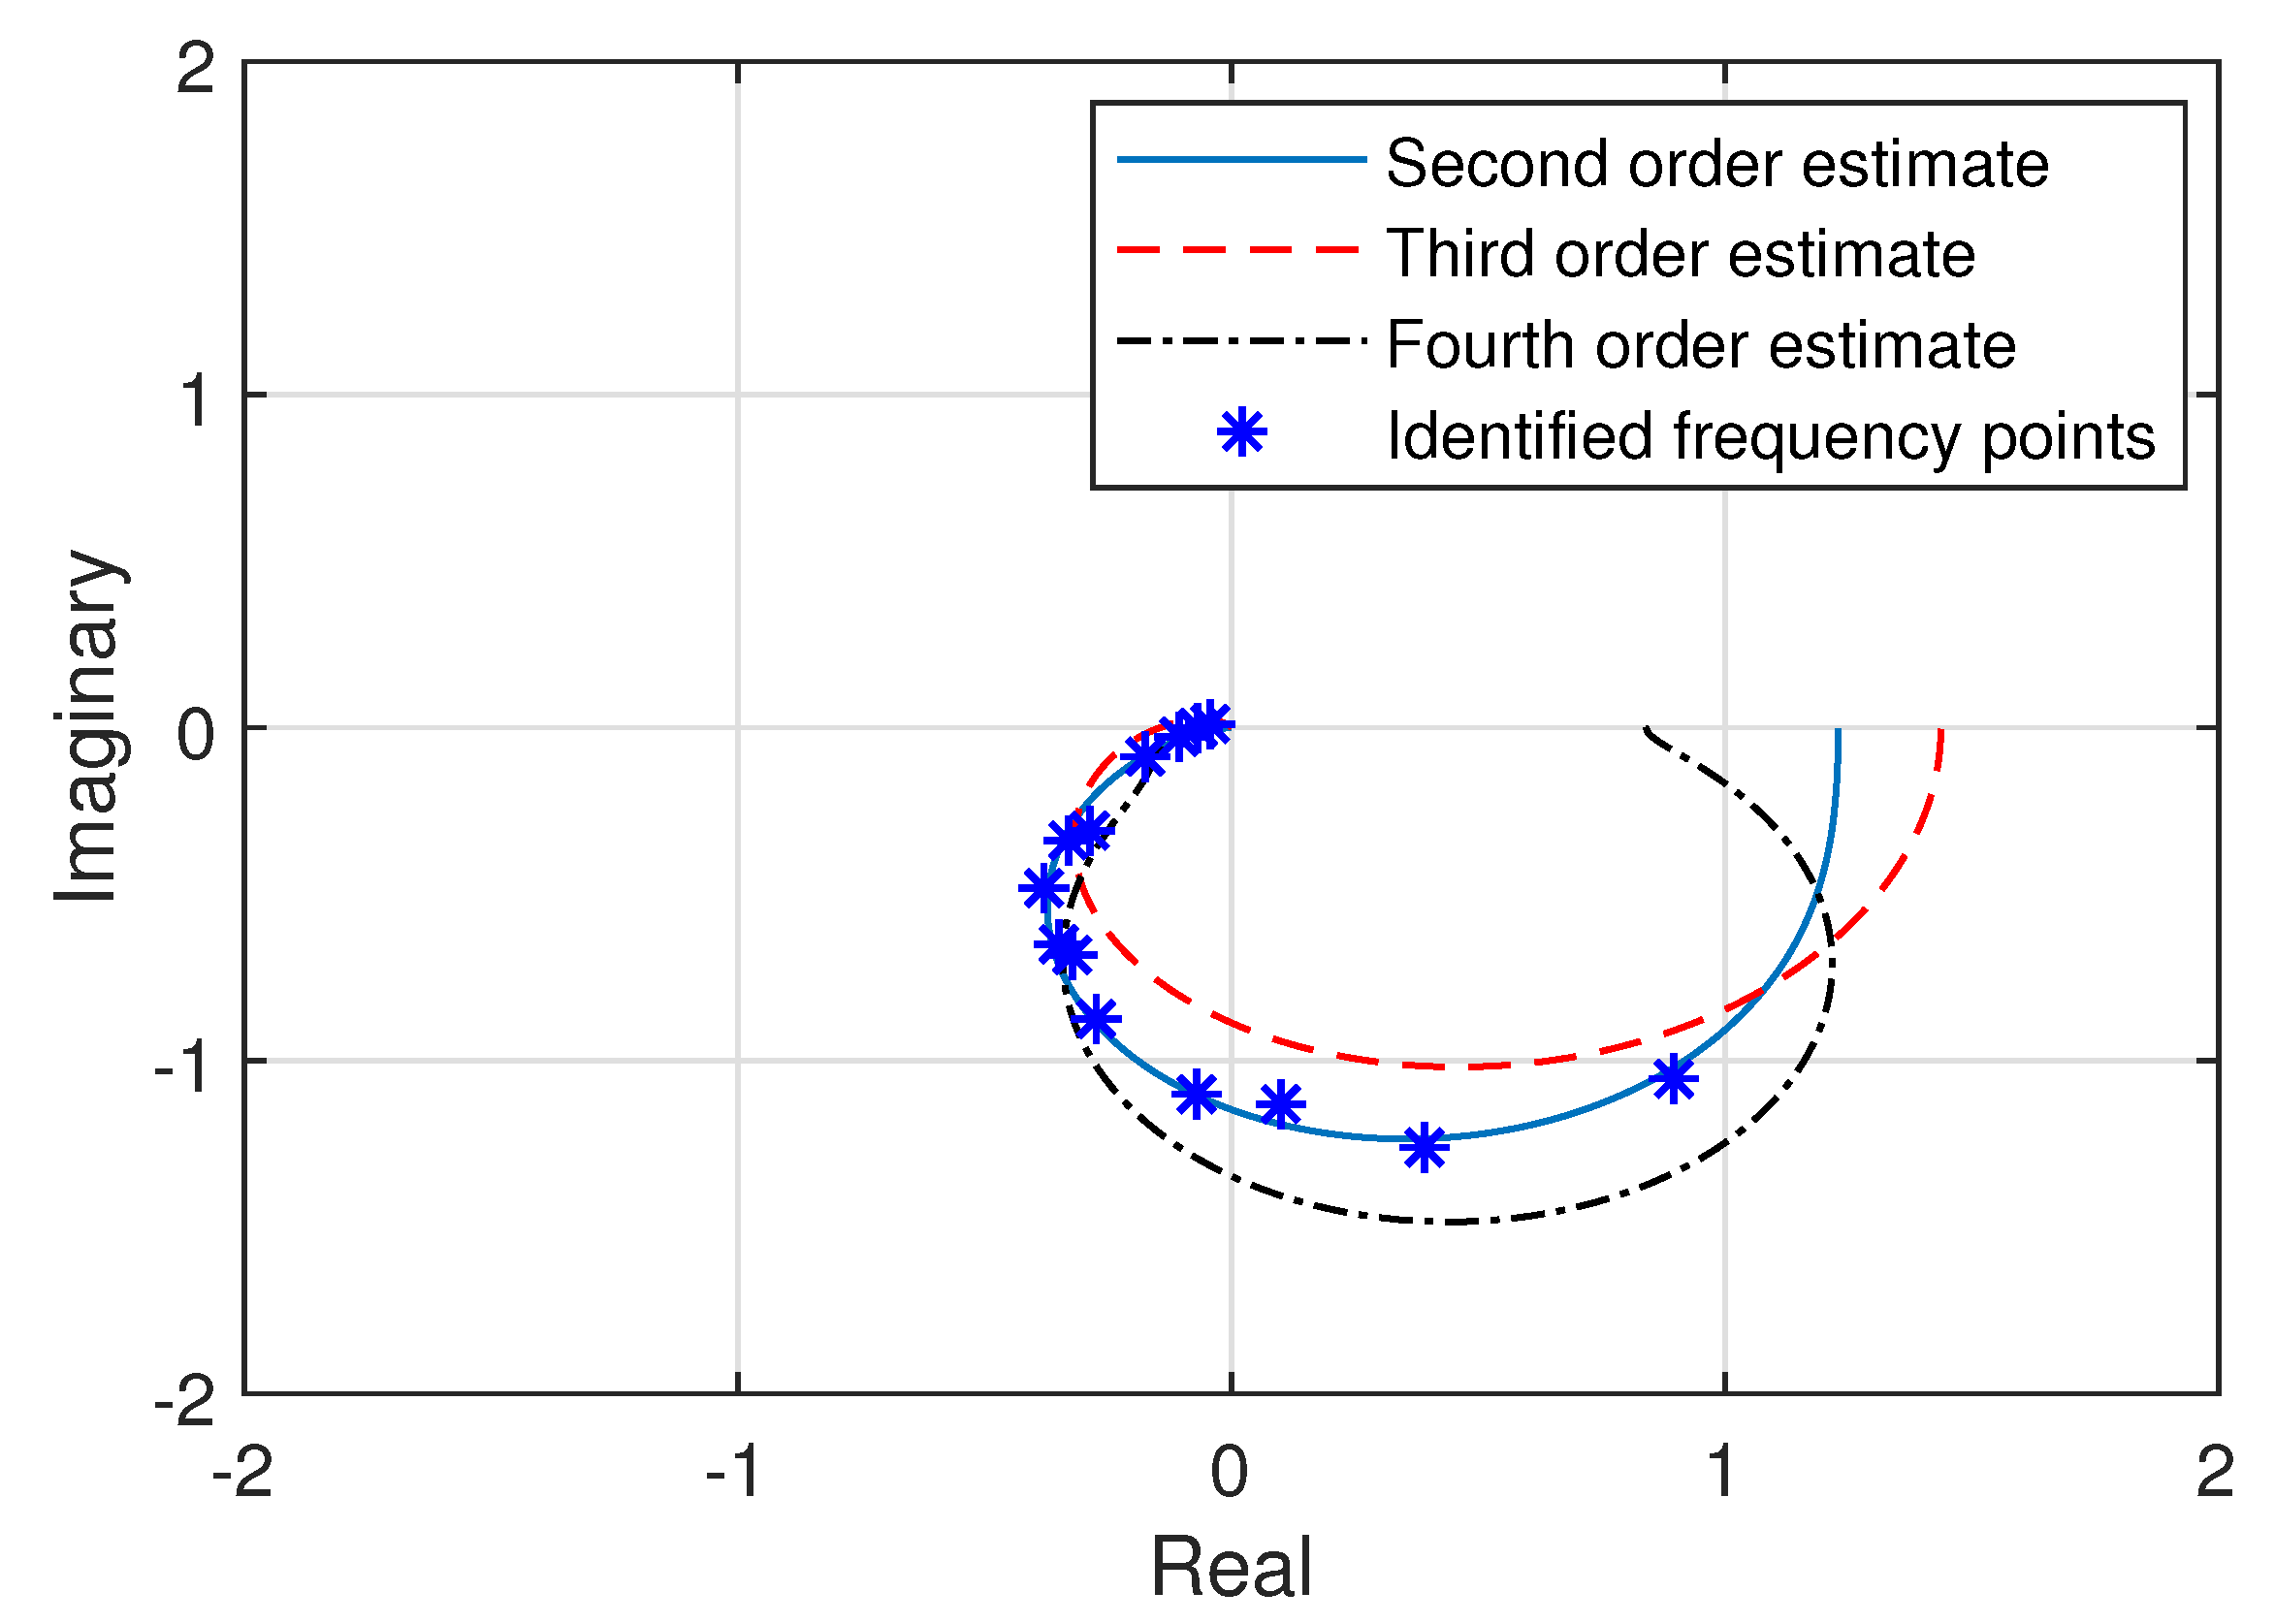
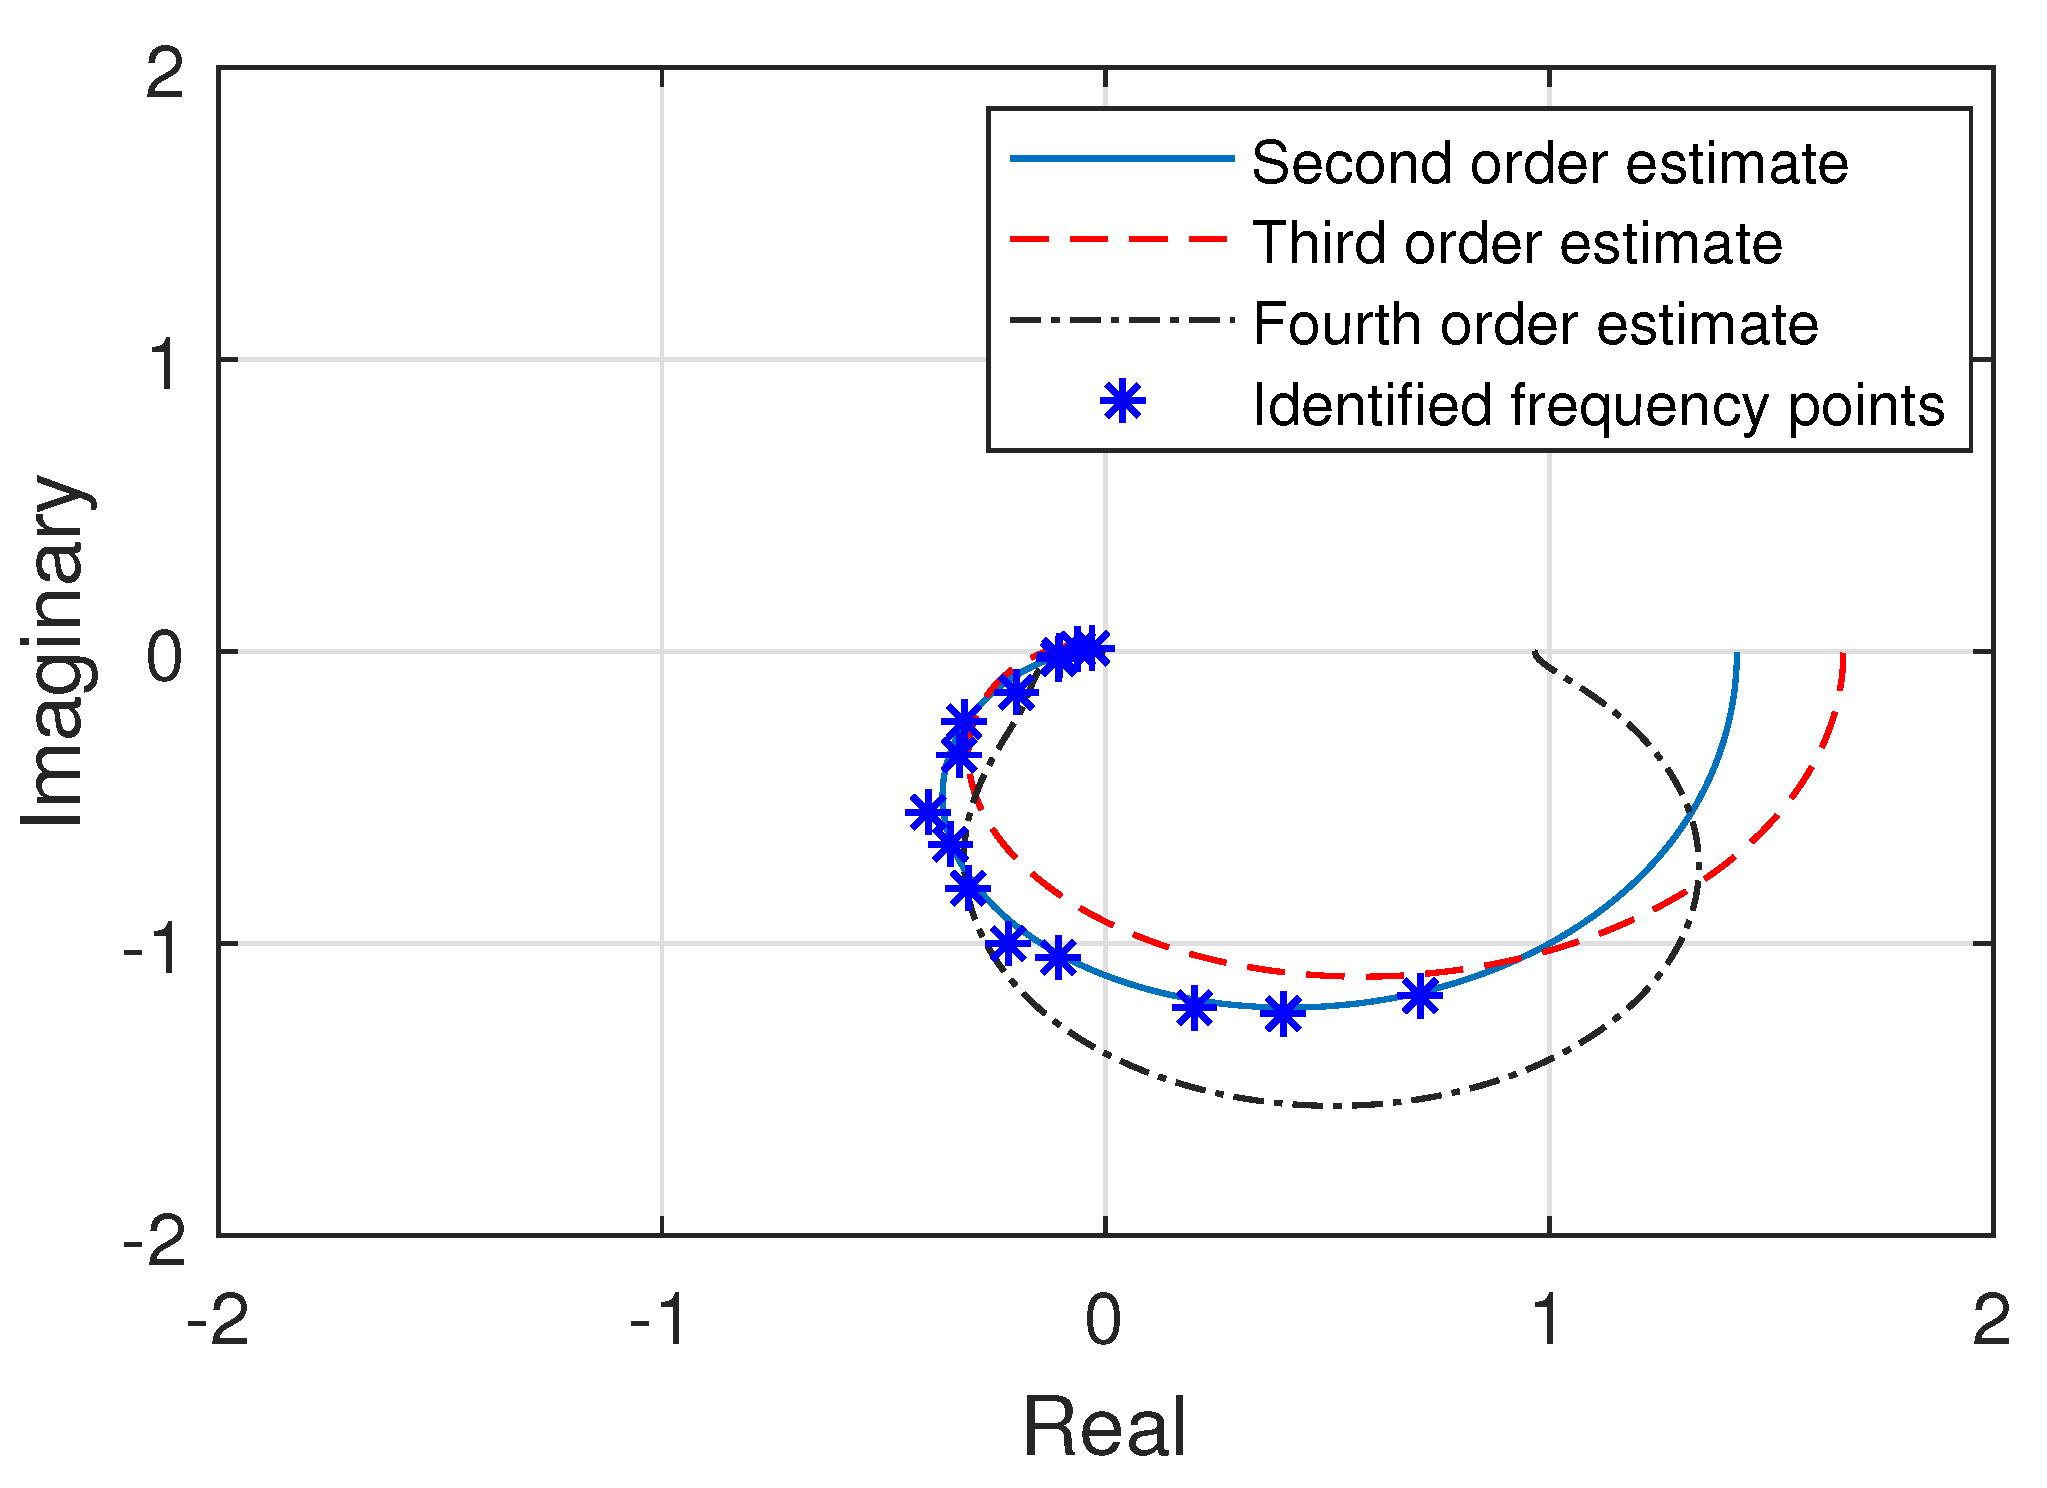
The frequency response points for the roll axis of multirotor attitude system, which are experimentally identified, are presented in Figure 6. The algorithm for the derivation of transfer function discussed in Section 2.3 can be executed through the inverse frequency (invfreqs) function of the MATLAB [33], which is totally designed on the basis of the technique introduced by [31]. Transfer functions for the roll axis are now estimated through the complex curve fitting technique over the experimentally identified frequency response points. After analyzing the various estimated models of different orders, the transfer functions which demonstrated the characteristics comparable to experimentally identified frequency response are illustrated in Figure 6. It can be observed that the second order transfer function estimate provides the best response out of the three presented models of different orders. The frequency response curve of the estimated second order model accurately fits within the experimental frequency points, capturing all of the multirotor dynamics for attitude roll axis. The three estimated transfer functions graphically depicted in Figure 6, are presented as under,
G p ( s ) = 28.19 s 2 + 5.13 s + 22.93
G p ( s ) = 914.3 s 3 + 28.75 s 2 + 241.5 s + 636.2
G p ( s ) = 17.95 s 2 + 609.3 s + 4396 s 4 + 18.77 s 3 + 368.7 s 2 + 1045 s + 5230
where, G p ( s ) represents the transfer function for the roll attitude axis.

4.2. Derivation of Transfer Functions for Pitch Axis

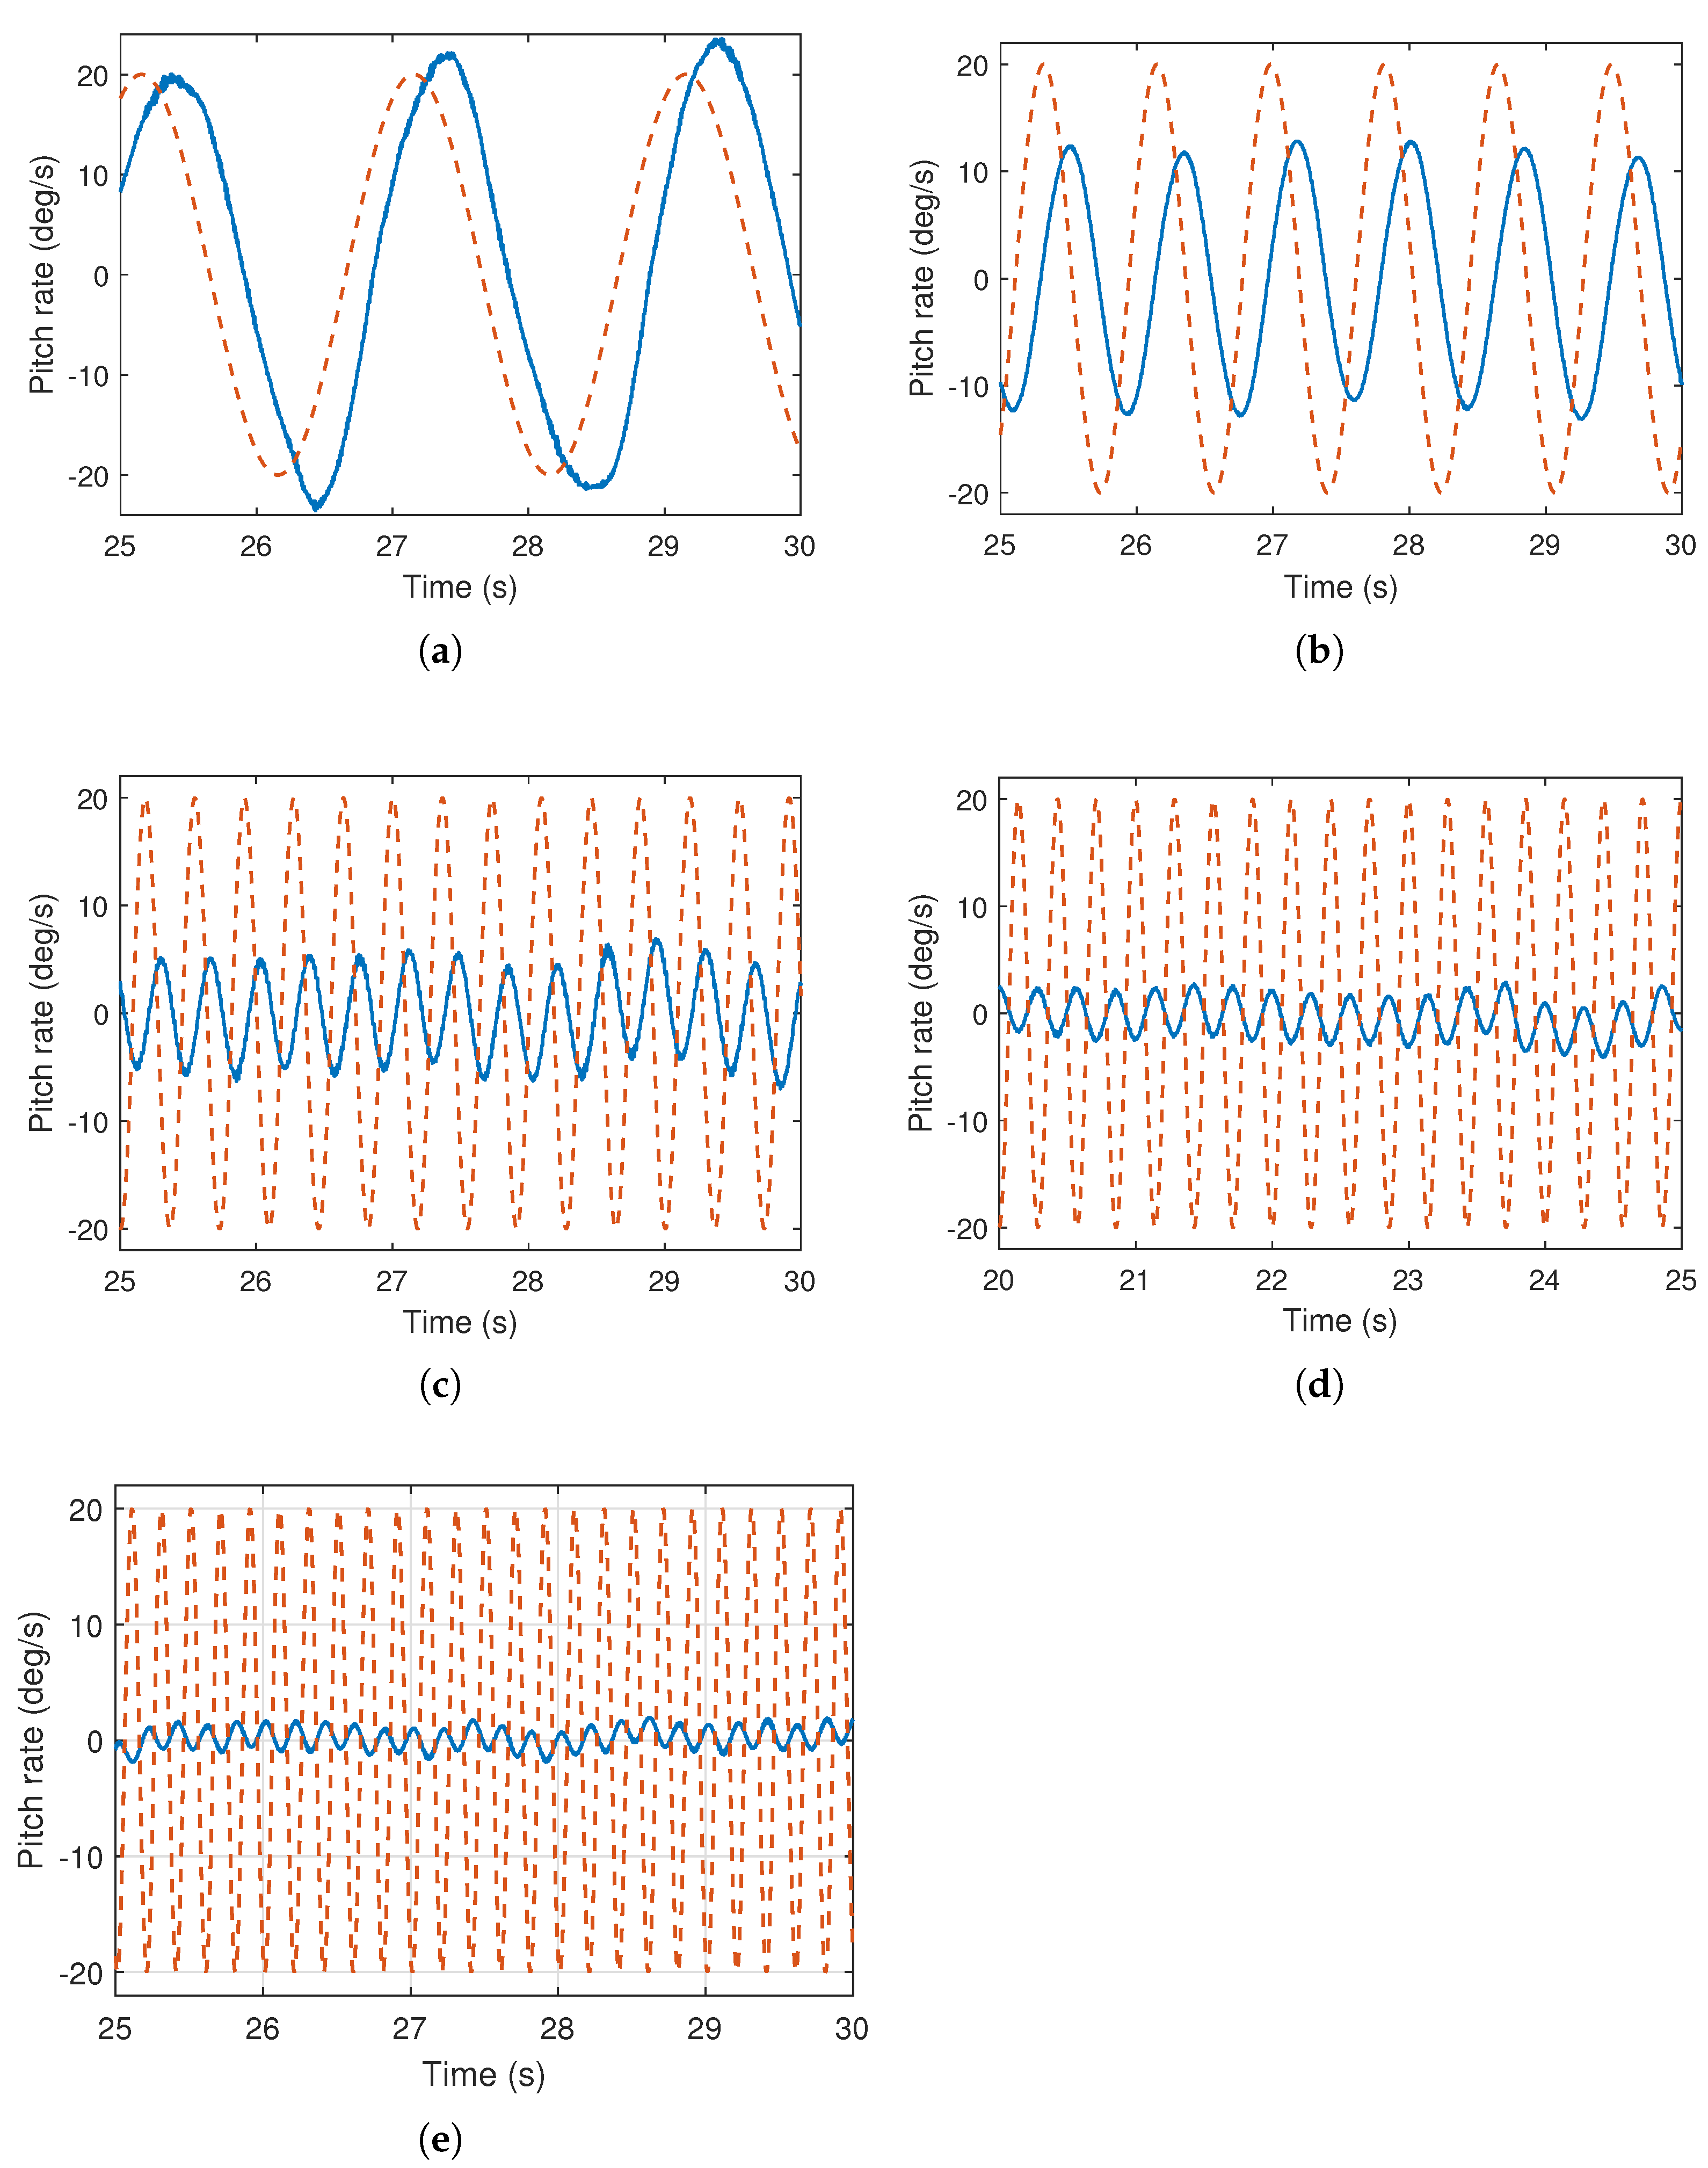
The system identification is performed for the pitch axis in the similar mechanism to previously elaborated roll axis. The test bed shown in the Figure 3 is also used to perform the system identification experiments for pitch axis. The experimental responses of the pitch axis system are illustrated in the Figure 7. Wherein, the behavior of the heterogeneous multirotor for the pitch axis is depicted in presence of series of input sinusoidal signals. As observed in the given responses, the low frequency input signal of 0.5 Hz is appropriately tracked by the multirotor. Whereas, the large phase difference can be observed in the higher frequency responses. As for the higher frequency input signals, the command to the actuator switches quick enough, allowing the multirotor UAV less room for the reaction to the input signal. Which leads to the decision of choosing the highest experimentally injectable frequencies into the multirotor UAV. The experimental analysis is tabulated in the Table 5. The series of sinusoidal excitation signals having frequency value ( ω k ) in radians per second at kth frequency point are presented. The obtained magnitude and phase information at each frequency are illustrated. Subsequently, the components R k and I k required for Levy’s curve fitting approach are also evaluated.
Figure 8 presents the experimentally identified frequency response points for the pitch axis of multirotor attitude system. Transfer functions for the pitch axis are the estimated through the complex curve fitting technique with the help of invfreq algorithm. The various transfer functions had been determined from the experimentally identified frequency points. However, three of them features the frequency response curve comparable to the identified frequency points as presented in the Figure 8.
It can be observed from the frequency responses of the three estimated transfer functions that the second order transfer function estimate provides the best response out of the three presented models of different orders as its complex curve is accurately fitting within the experimental frequency points. These three estimated transfer functions for the pitch attitude axis are mathematically presented as,
G q ( s ) = 33.64 s 2 + 5.374 s + 23.65
G q ( s ) = 1298 s 3 + 33.3 s 2 + 313.2 s + 780.8
G q ( s ) = 17.88 s 2 + 788.6 s + 5101 s 4 + 20.15 s 3 + 413.1 s 2 + 1174 s + 5274
where, G q ( s ) represents the transfer function for the pitch attitude axis.

4.3. Derivation of Transfer Functions for Yaw Axis

For the system identification of the yaw attitude axis model, the multirotor prototype is setup on the yaw test rig as depicted in the Figure 4. The range of sinusoidal excitation signals are then injected into the multirotor which would accordingly actuate the aerial vehicle for the yaw motion. The recommended range of input frequencies which are experimentally defined for the yaw axis system is presented in the Table 1. It is to be noted that the both roll and pitch axes plants of this multirotor exhibit much similar frequency responses and dynamics, which is mainly due to the structural symmetry of the cross quadrotor configuration of the control rotors along these two axes. Whereas, the the dynamics for the yaw attitude axis would be much different from these two axes. Which is also evident in the selected range of input frequencies of the sinusoidal excitation signals.
After injecting the input signals, the behavior of the multirotor for the yaw axis is analyzed through measurement of the actual yaw rate responses with respect to the applied sinusoidal signals. The experimental responses acquired for the yaw axis are illustrated in the Figure 9. It can further be observed from the presented responses that the multirotor is appropriately following the yaw input sinusoidal excitation command at the much lower frequency than the roll and pitch axis, such that at a low frequency of 0.2 Hz, the yaw axis plant is able to produce a comparable response to the reference input. While the yaw rate responses also get flatter with the increasing input frequency. Where the input frequency of 1.5 Hz satisfy the recommended response for the highest feasible input frequency for the system identification.
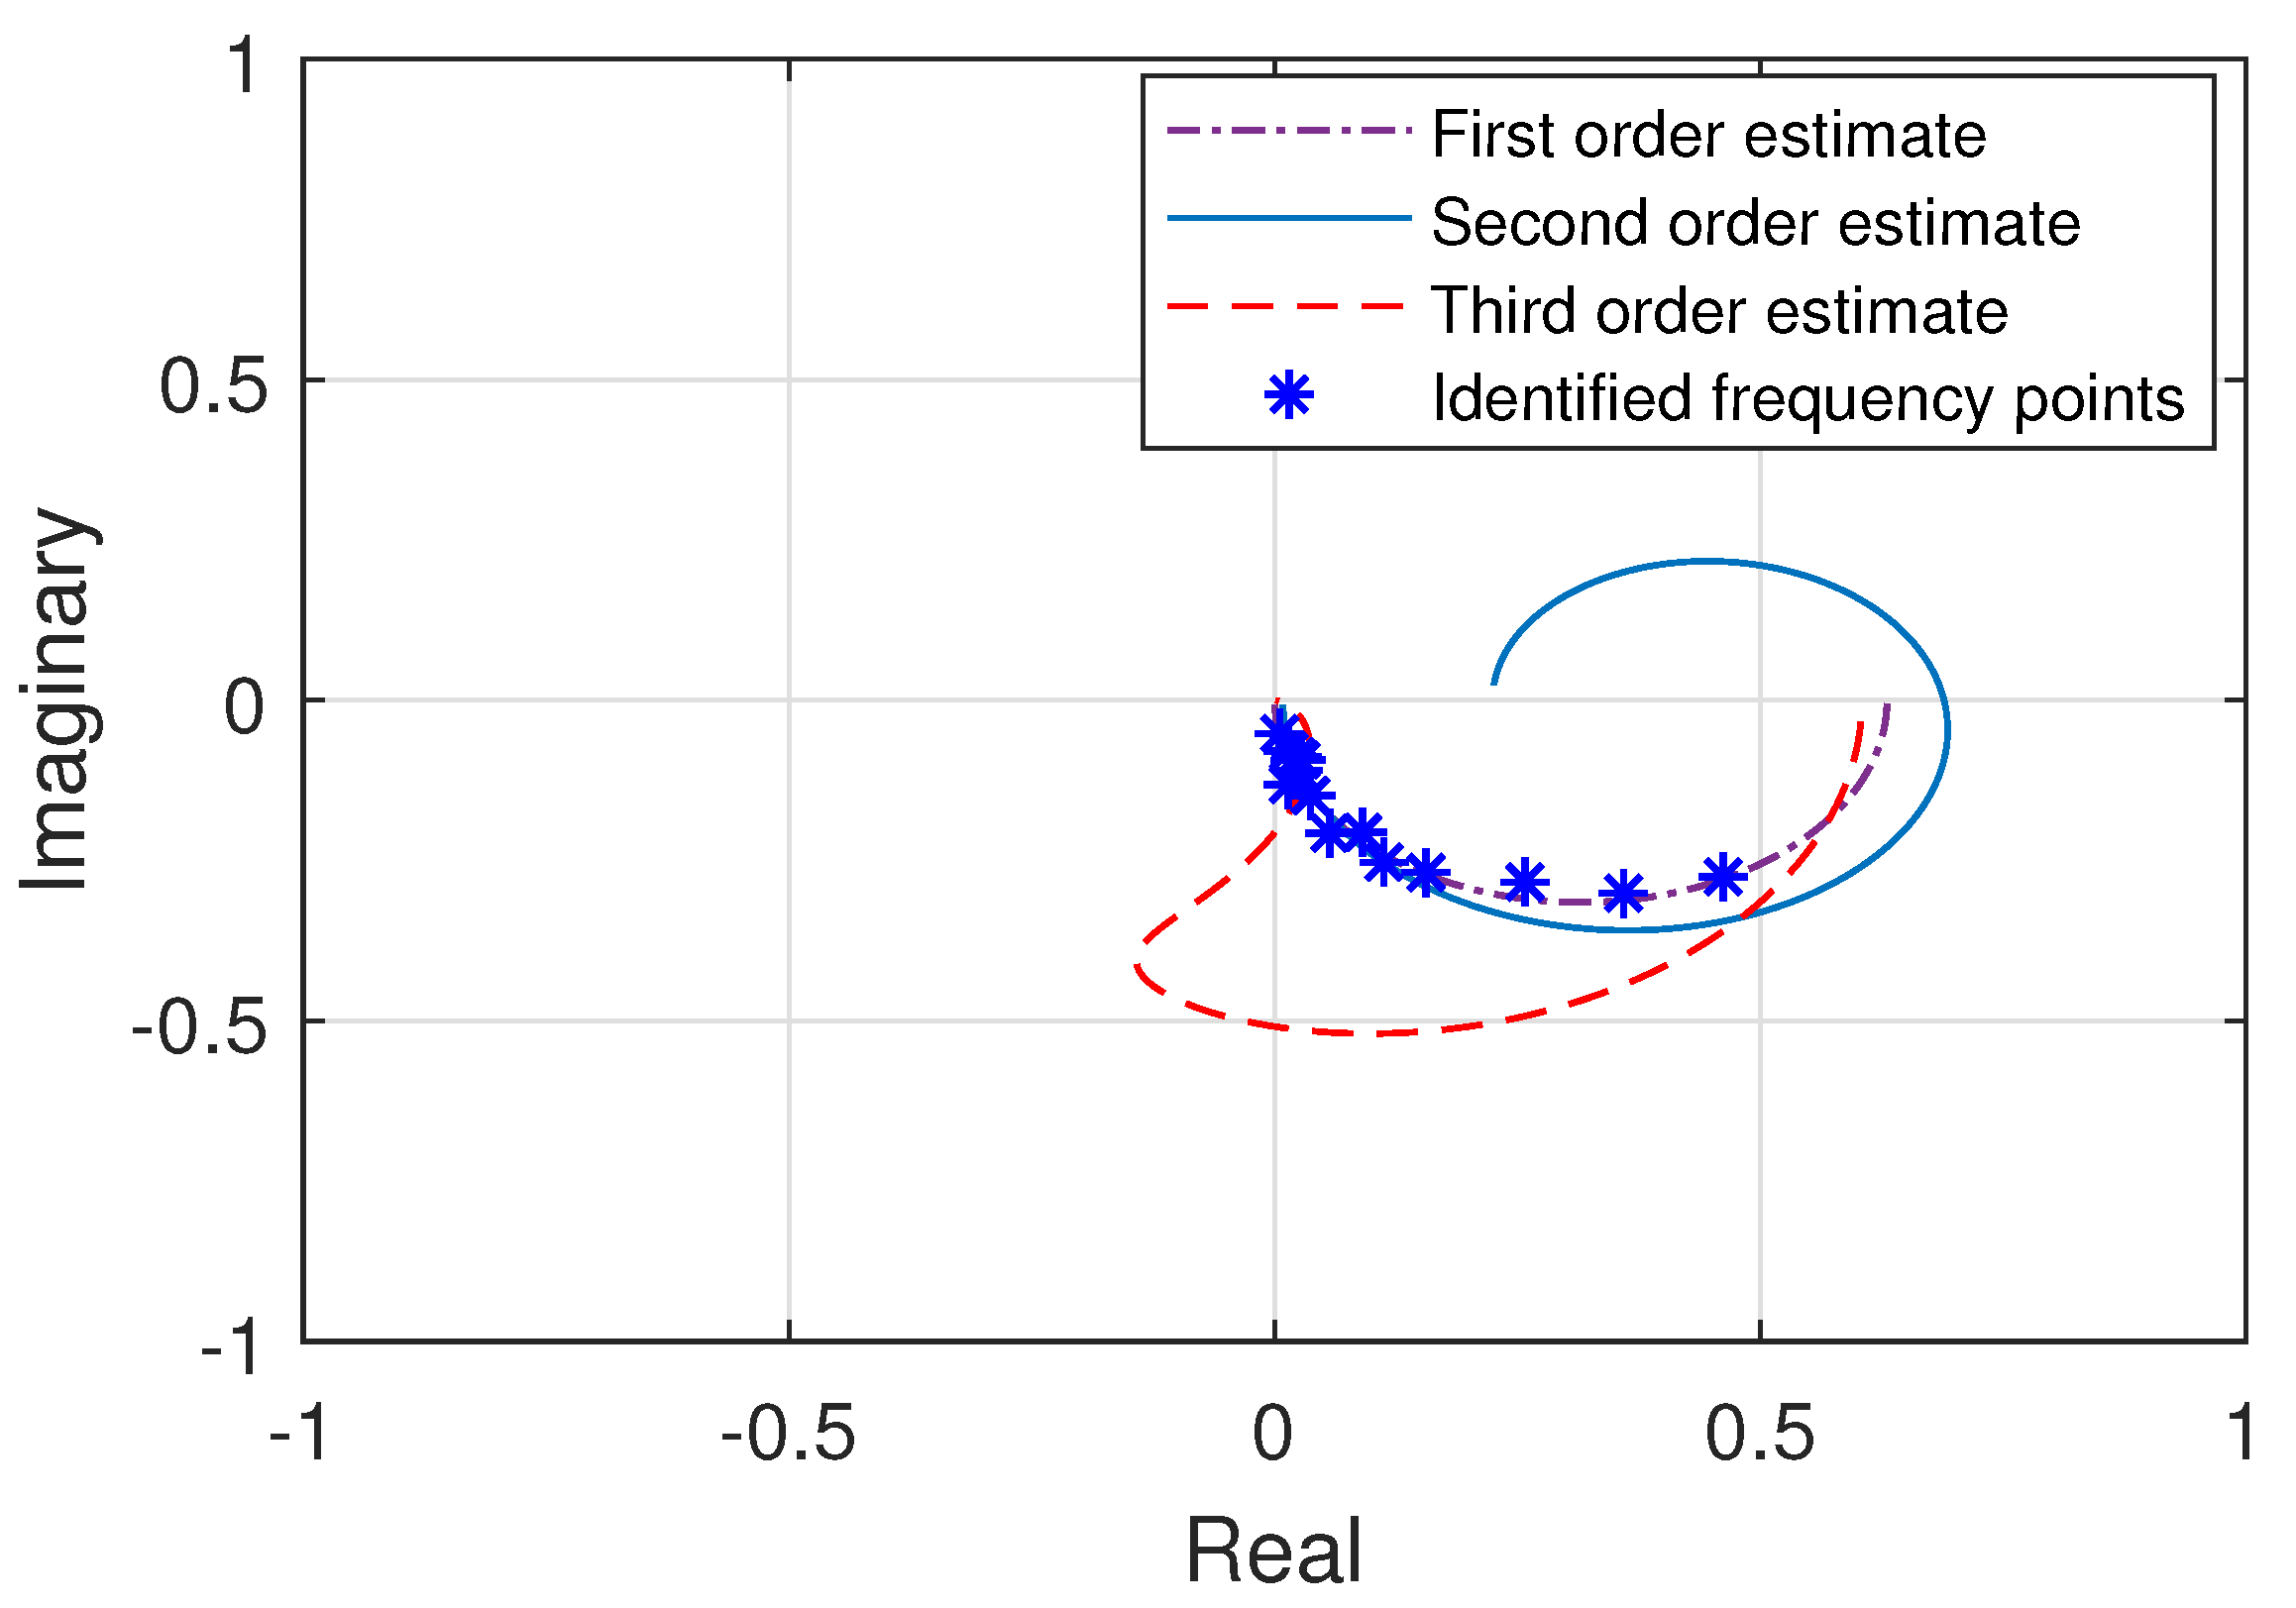
The above experimental analysis for the yaw axis of the heterogeneous multirotor UAV is now tabulated in the Table 6. Where, the series of sinusoidal excitation signals having frequency value ( ω k ) in radians per second at kth frequency point are presented. The obtained magnitude and phase information at each frequency are illustrated. Subsequently, the components R k and I k required for Levy’s curve fitting approach are also evaluated. The frequency sampling filter is then used to extract the frequency response points for the yaw axis from the acquired experimental response. The identified frequency points are presented in Figure 10.
Subsequently, complex curve fitting technique is used to estimate the transfer functions for the yaw axis plant through the experimentally identified frequency response points. After analyzing the various estimated models of different orders, the transfer functions which demonstrated the characteristics comparable to experimentally identified frequency response are illustrated in Figure 10. Where, it can evidently be suggested that the first order transfer function estimate provides the best response out of the three presented models of different orders by accurately fitting within the experimentally identified frequency points, thus capturing all of the multirotor dynamics for the yaw axis. These three estimated transfer functions are then mathematically expressed as,
G r ( s ) = 1.191 s + 1.178
G r ( s ) = 0.008 s 2 + 0.736 s + 0.0471 s 2 + 1.068 s + 0.210
G r ( s ) = 0.810 s 2 + 0.669 s + 18.48 s 3 + 2.555 s 2 + 23.54 s + 30.59
where, G r ( s ) represents the transfer function for the yaw attitude axis.

5. Validation

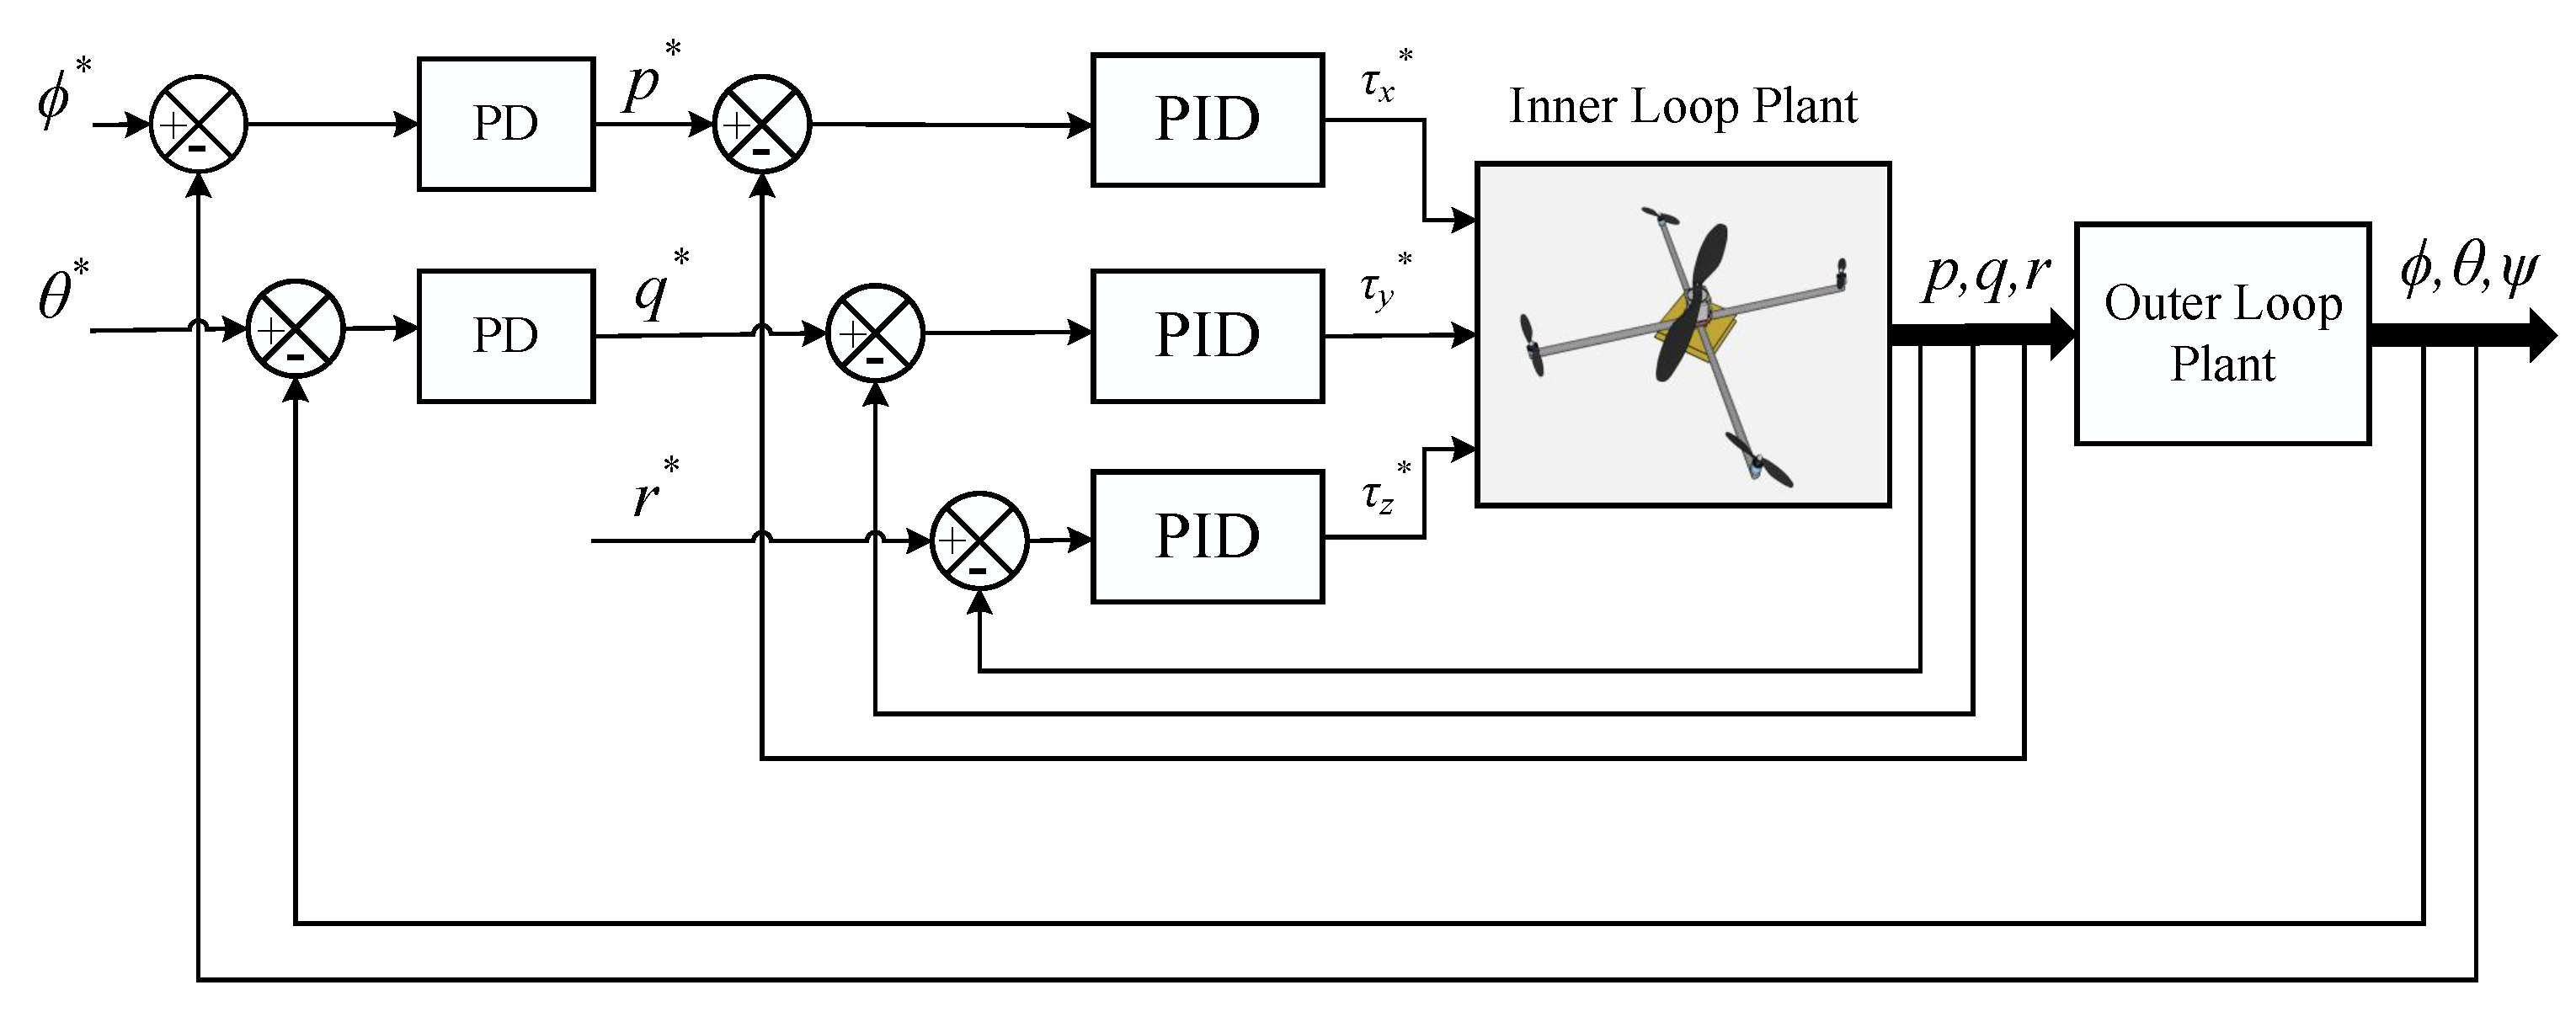
In order to validate the obtained transfer functions for all three attitude axes. Simulations are performed through the transfer functions. The closed-loop control system is configured as presented in the Figure 11. Where, the cascade control approach is used to provide the control for the multirotor. Inner loop of the cascaded structure is used to control the angular rates of the multirotor, which are roll, pitch and yaw rates represented as p, q and r, respectively. Whilst, the outer loop is used to govern the angular positions of the multirotor, which are roll and pitch angles represented as ϕ and θ , respectively. Identified transfer functions are used in the inner loop attitude plant of the multirotor while the outer loop plant is also kept as the integrator (which provides angular position of the multirotor based on angular rate). PID controllers are used to provide the control mechanism for the inner attitude loop whereas the PD controllers are used to control the outer attitude loops of the multirotor. PID parameter values obtained experimentally through the auto-tuning procedure in [23] are used in the control system which are also presented in the Table 7 and Table 8.
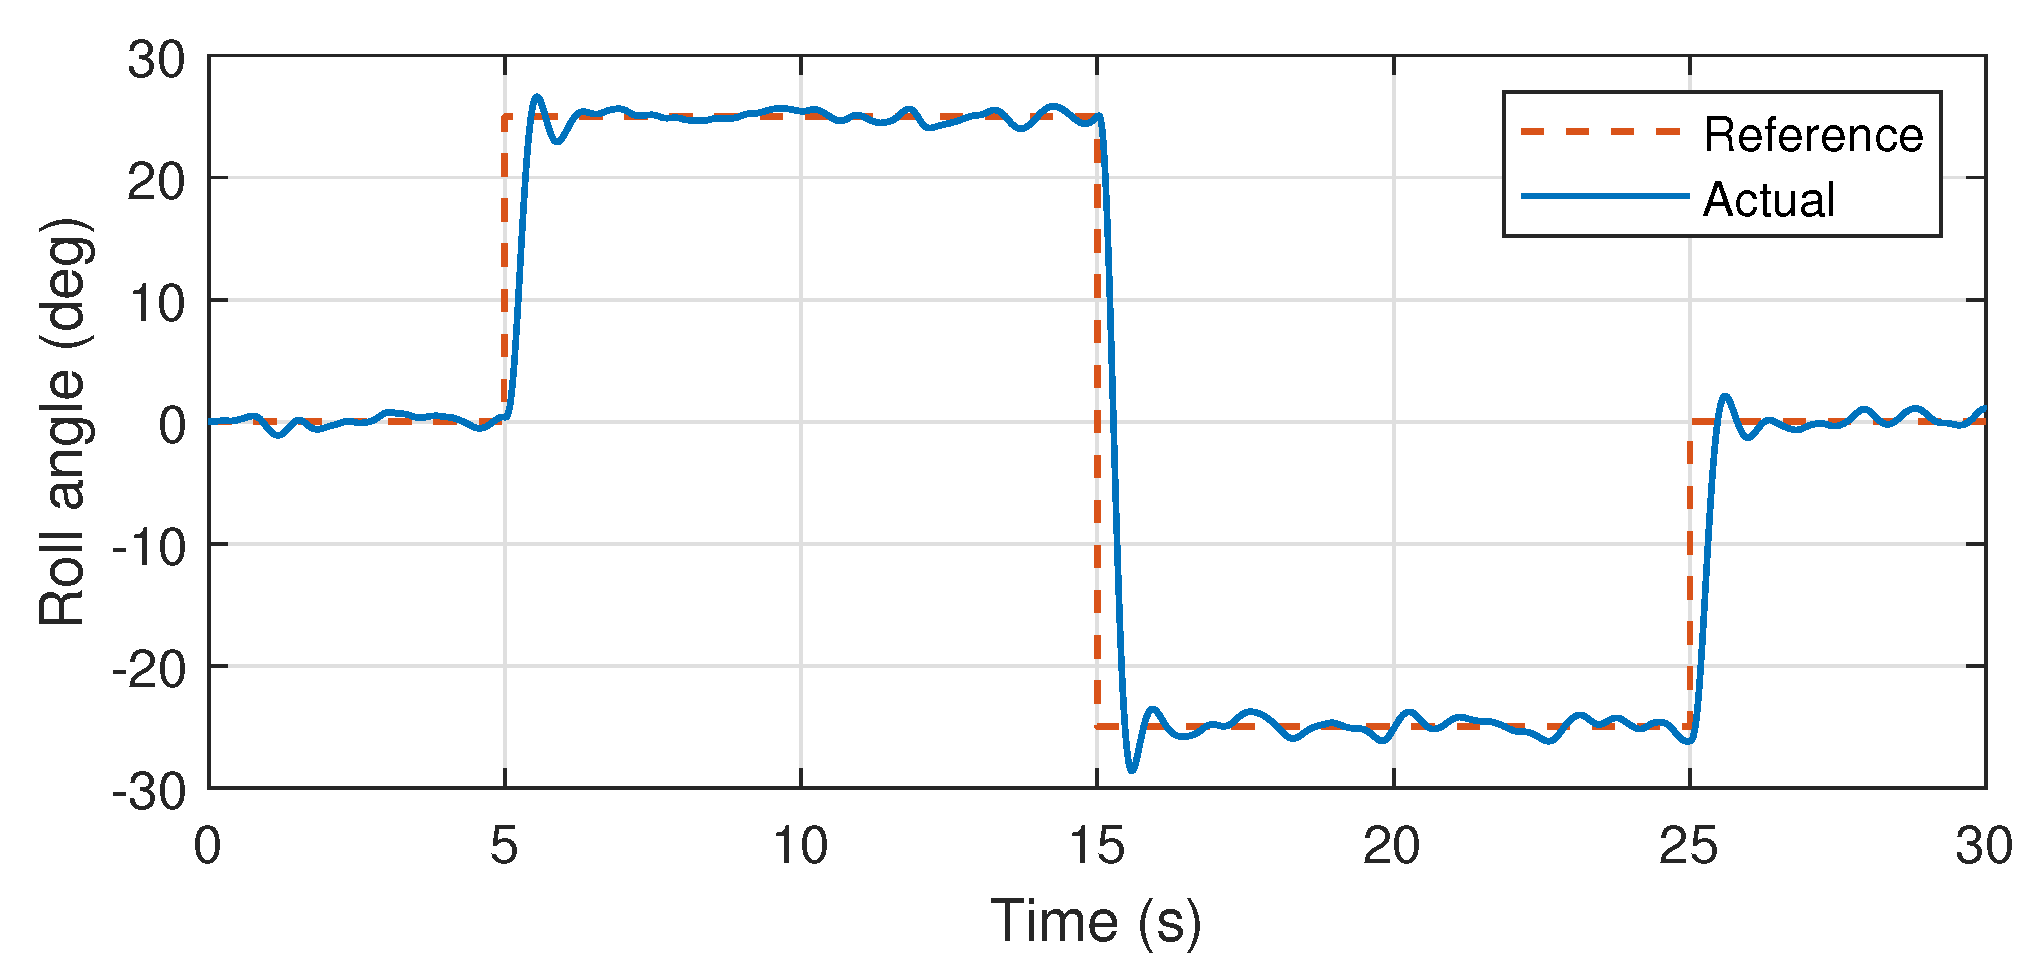
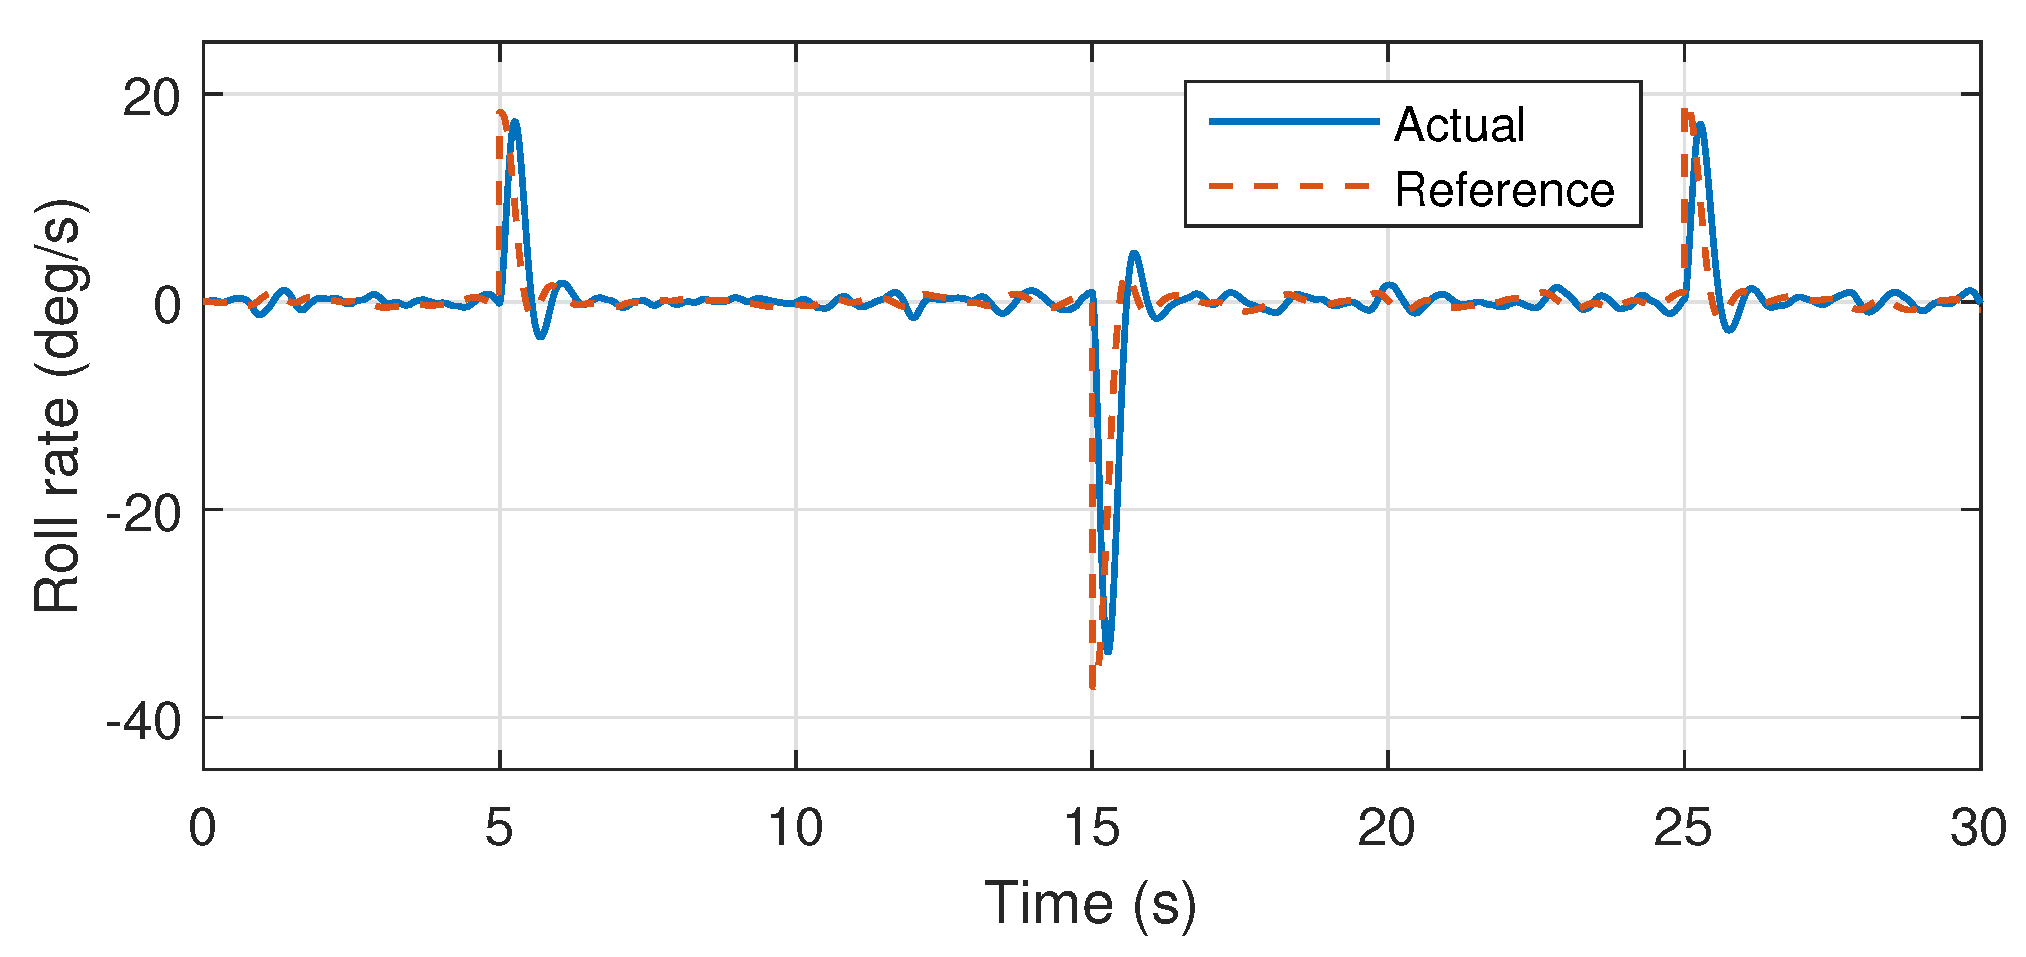
Atmospheric turbulences have also been injected into the system, which are modeled on the basis of Dryden turbulence model as presented in [34,35]. The stable roll attitude responses presented in the Figure 12 and Figure 13 validates the accuracy of the proposed system identification, where the reference signal is effectively followed by the system, rejecting the introduced atmospheric turbulences.
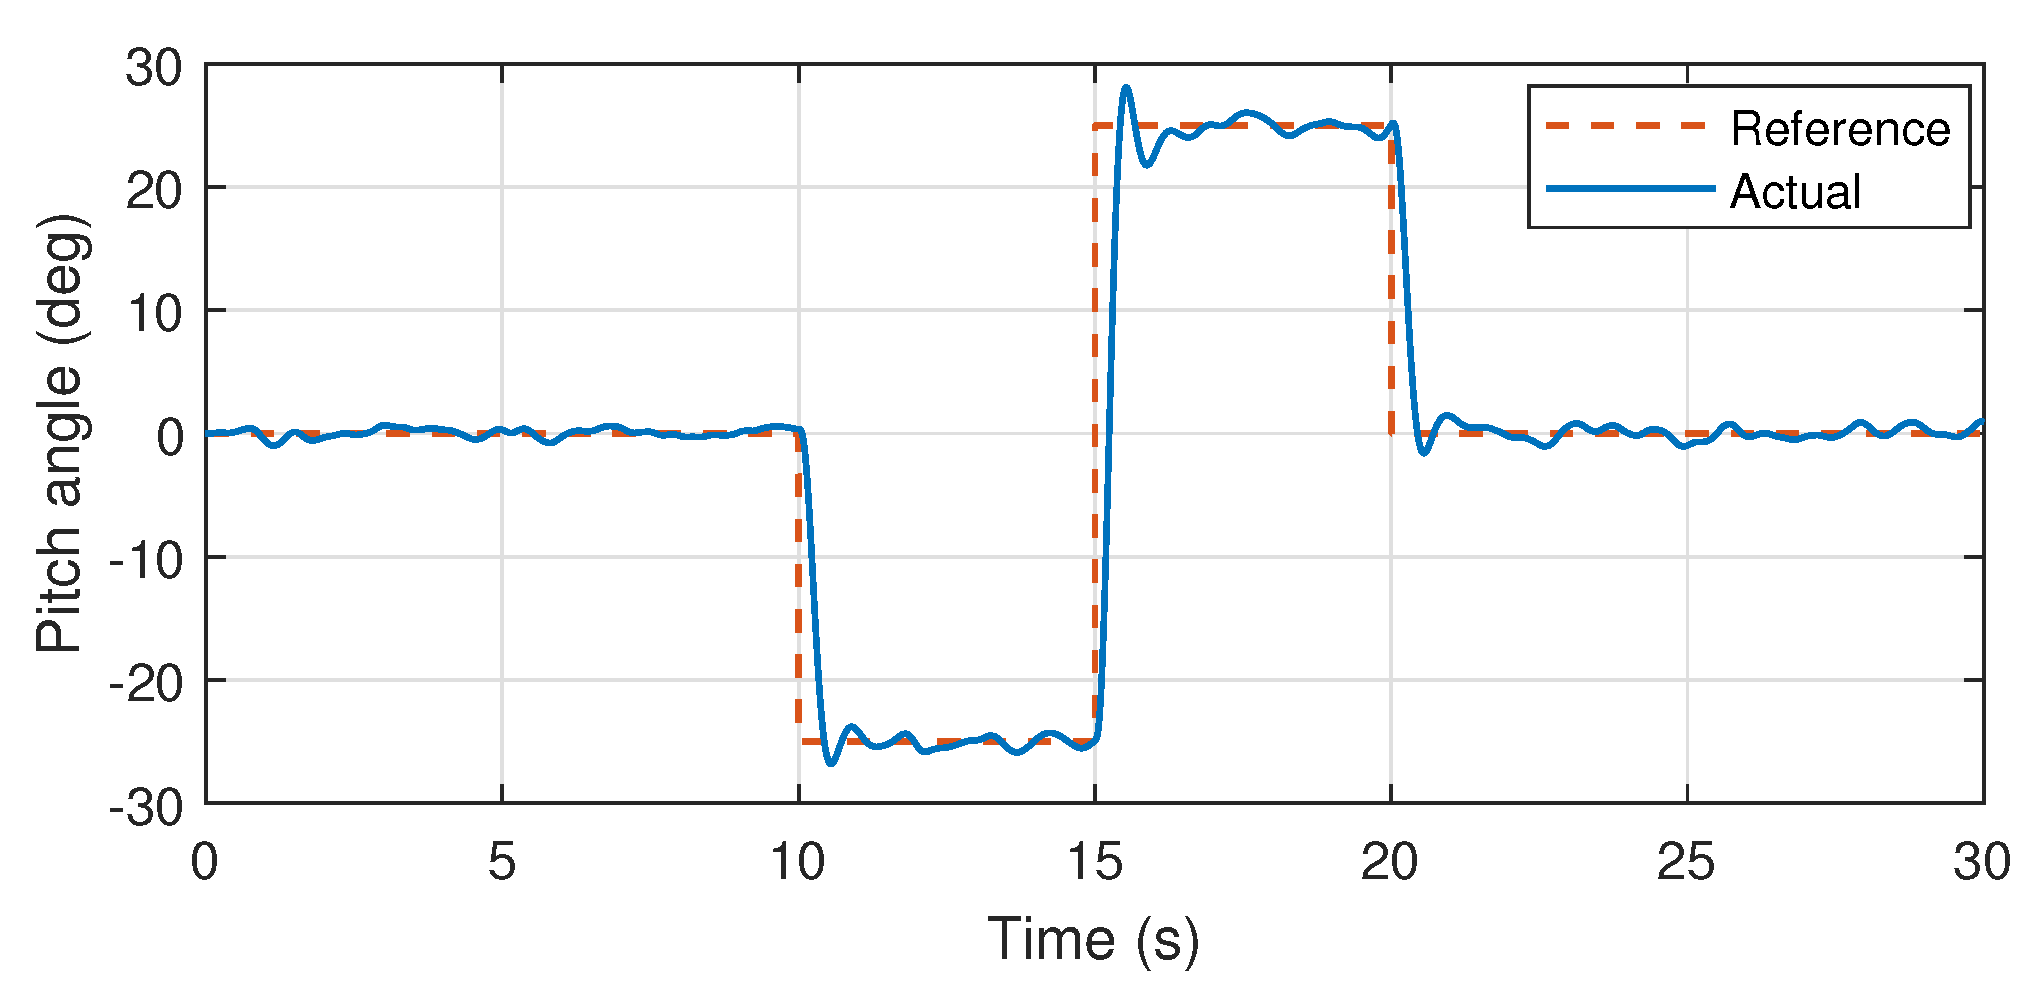
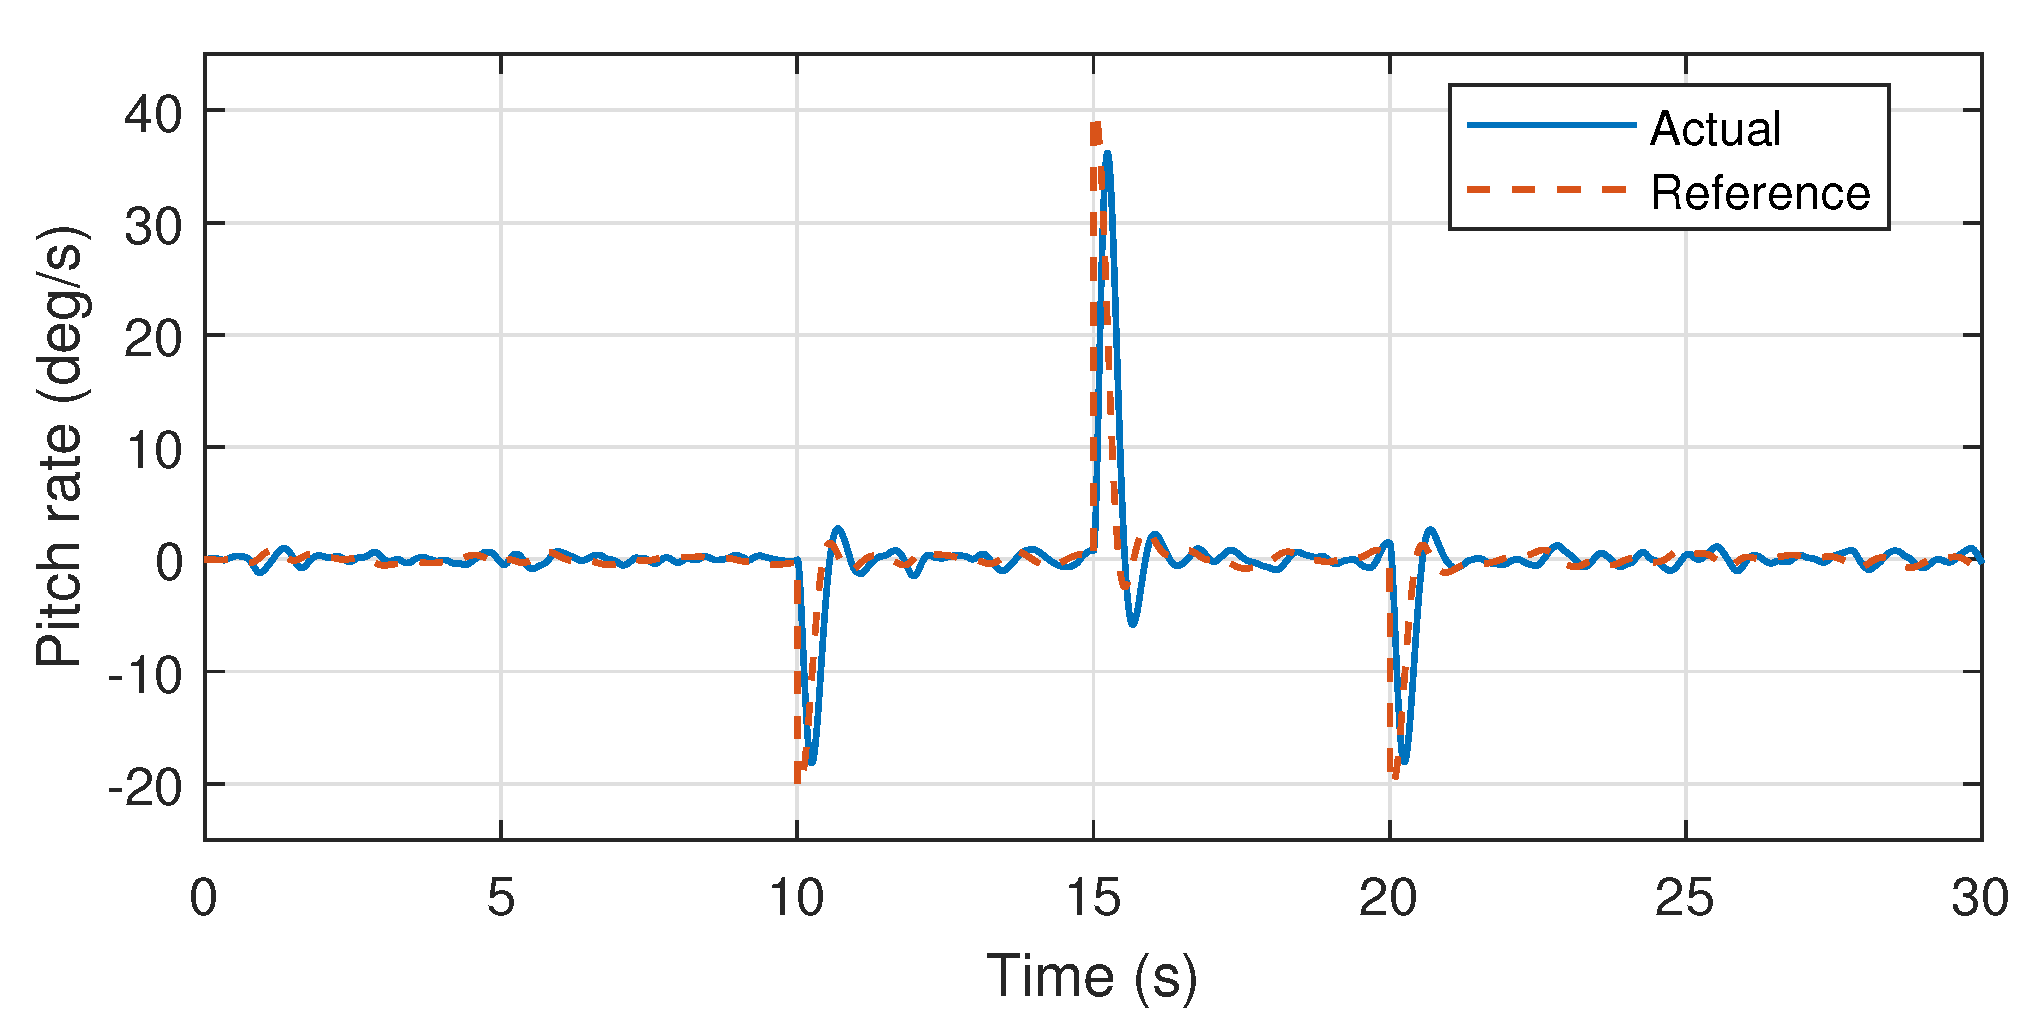
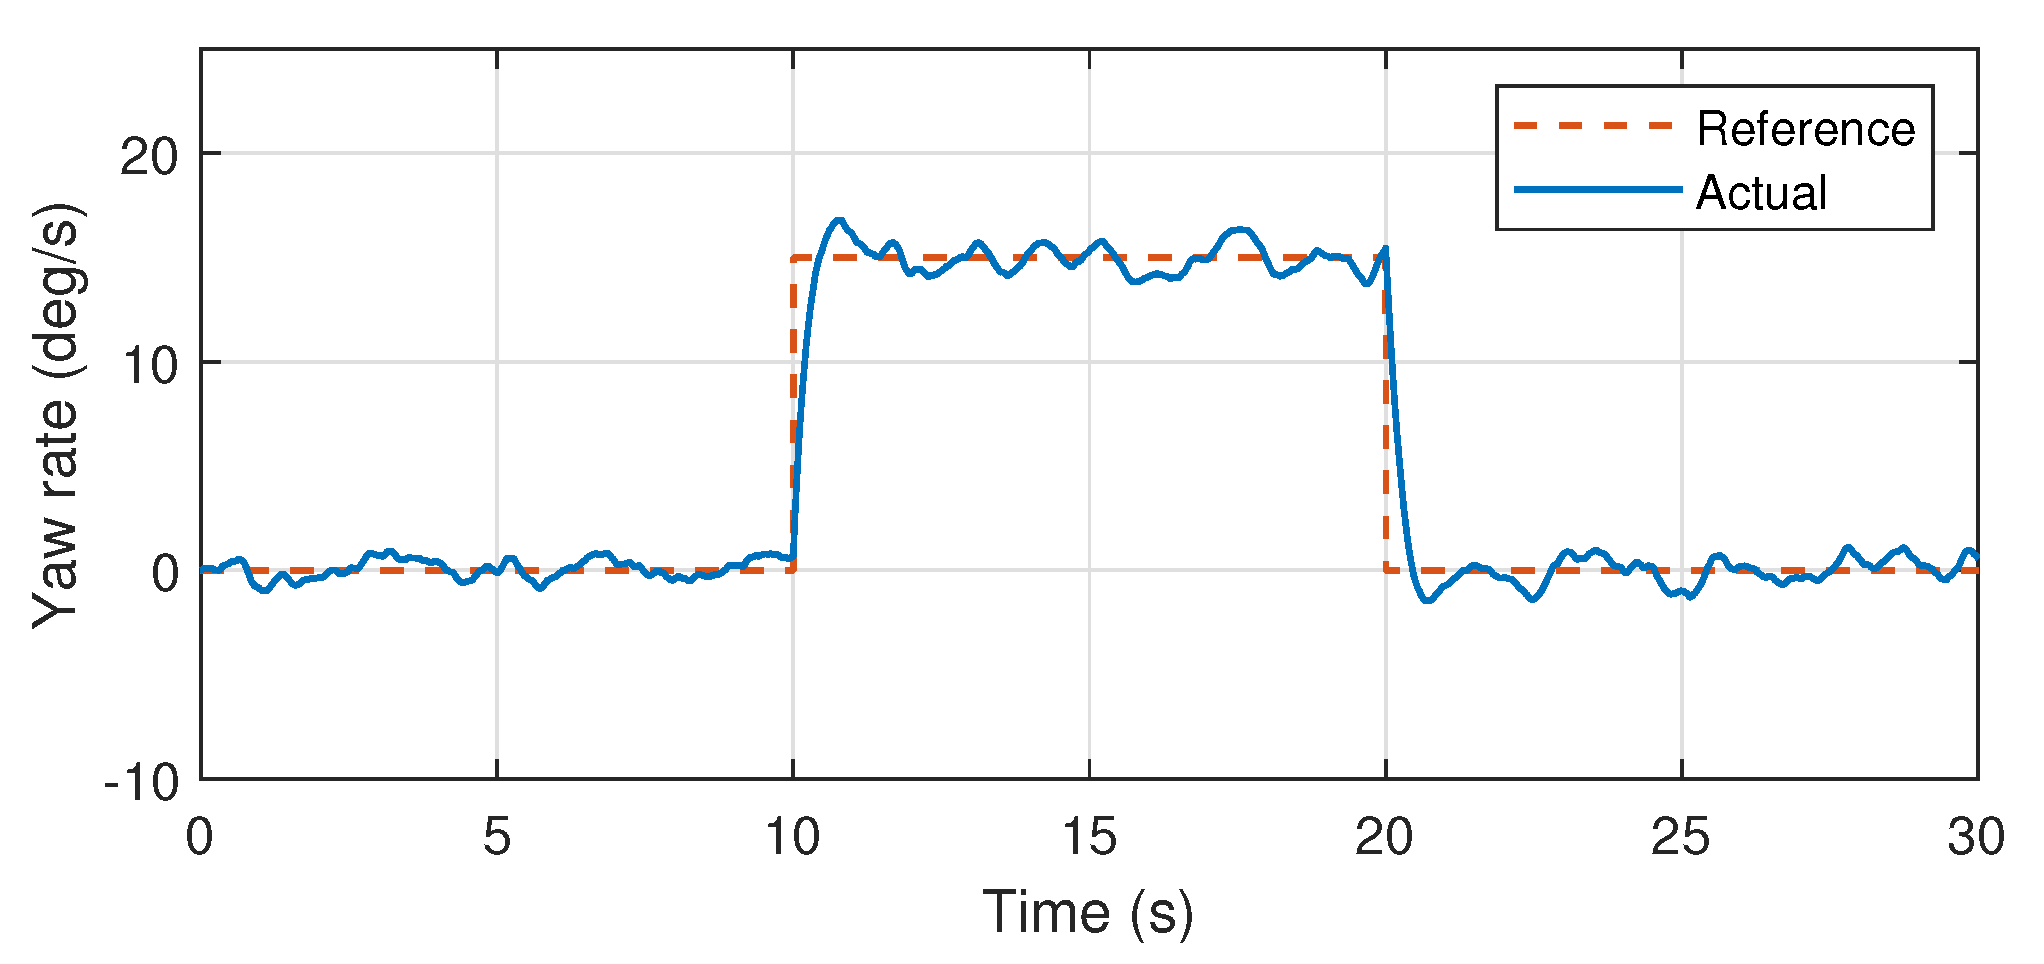
Moreover, it is also noteworthy that the control system mechanism used here and the auto-tuned PID parameters had been experimentally implemented over the heterogeneous multirotor prototype in [23]. Wherein, stable attitude performance was experimentally demonstrated. Therefore, validation through simulations using the same control mechanism and PID values also demonstrates the efficiency of the proposed system identification approach especially for further controller design approaches such as model predictive controllers. Furthermore, the identified pitch and yaw axis transfer functions are also validated through the similar mechanism as presented in the Figure 14, Figure 15 and Figure 16.
Moreover, the authors in [23] have also presented a system identification approach to obtain the estimated dynamics of the multirotor. Wherein integrator plus time delay models were estimated for the attitude system and PID controller design and performance were successfully demonstrated. However, to design and analyze the more sophisticated controllers for this heterogeneous multirotor UAV, such as model predictive controller, higher order transfer functions would be required. Therefore, the accurate higher order transfer function models obtained through the system identification approach proposed in this paper, would lead to the exploration of variety of control systems for these dynamically complex multirotor UAV designs in the future. Additionally, the proposed system identification also provides a low-cost solution to the modelling issues of the heterogeneous multirotor UAV, as the detailed model of the multirotor was identified in [36]. Wherein the authors utilized highly accurate motion capturing system (VICON) and commercial autopilot. That would turn out to be very expensive for the low budget research and development of the multirotors.

6. Conclusions

In this paper, the transfer functions of the attitude system of heterogeneous multirotor UAV are experimentally estimated through the system identification method. Three separate transfer functions for three attitude axes are estimated, i.e., roll, pitch and yaw axes. Each axis model is identified separately, where the multirotor is initially actuated in particular axis by injecting a range of input sinusoidal excitation signals. The feasible range of the input frequencies to be injected into each axis, is also selected first through experimental criterion. Subsequently frequency sampling filter and complex curve fitting technique is used to determine the best fitting transfer functions for each attitude axis system of the multirotor. The identified transfer functions are also validated through the simulations for stable reference following and disturbance rejection using the auto-tuned PID controllers. Furthermore, having the accurate system model of the new heterogeneous multirotor, the advanced control system techniques such as model predictive control can be designed and implemented to explore the control and energetics performance of this class of unmanned aerial vehicles.
Furthermore, the application of the proposed system identification approach is not limited to this heterogeneous multirotor UAV. It can also be effectively utilized to identify the system model for any type of conventional as well as unconventional multirotor and helicopter UAVs of any size. The application of the proposed approach can also be extended to the modelling of the fixed-wing UAVs, using the similar system identification procedure presented in this paper.
Author Contributions

Conceptualization, A.A.H., A.S., L.W.; methodology, A.A.H., L.W., A.S.; software, A.S., A.A.H.; validation, A.A.H., M.H.A.B., A.S.; formal analysis, A.A.H., A.S., S.A.; investigation, A.A.H., L.W., M.H.A.B.; writing, A.A.H.; review and editing, A.S., S.A., M.H.A.B.; visualization, A.A.H.; supervision, L.W. All authors have read and agreed to the published version of the manuscript.

Funding

This research is jointly funded by RMIT University, Australia and HEC, Pakistan.

Data Availability Statement

Not applicable.

Conflicts of Interest

The authors declare no conflict of interest.

References

  1. Floreano, D.; Wood, R.J. Science, technology and the future of small autonomous drones. Nature 2015, 521, 460–466. [Google Scholar] [CrossRef] [PubMed] [Green Version]
  2. Bassolillo, S.R.; D’Amato, E.; Notaro, I.; Ariante, G.; Del Core, G.; Mattei, M. Enhanced Attitude and Altitude Estimation for Indoor Autonomous UAVs. Drones 2022, 6, 18. [Google Scholar] [CrossRef]
  3. Idrissi, M.; Salami, M.; Annaz, F. A Review of Quadrotor Unmanned Aerial Vehicles: Applications, Architectural Design and Control Algorithms. J. Intell. Robot. Syst. 2022, 104, 22. [Google Scholar] [CrossRef]
  4. Nex, F.; Armenakis, C.; Cramer, M.; Cucci, D.A.; Gerke, M.; Honkavaara, E.; Kukko, A.; Persello, C.; Skaloud, J. UAV in the advent of the twenties: Where we stand and what is next. ISPRS J. Photogramm. Remote Sens. 2022, 184, 215–242. [Google Scholar] [CrossRef]
  5. UNICEF, S.D. How Drones Can Be Used to Combat COVID-19; Report; UNICEF: Copenhagen, Denmark, 2020. [Google Scholar]
  6. Kunovjanek, M.; Wankmüller, C. Containing the COVID-19 pandemic with drones-Feasibility of a drone enabled back-up transport system. Transp. Policy 2021, 106, 141–152. [Google Scholar] [CrossRef]
  7. González Jorge, H.; González de Santos, L.M.; Fariñas Álvarez, N.; Martínez Sánchez, J.; Navarro Medina, F. Operational Study of Drone Spraying Application for the Disinfection of Surfaces against the COVID-19 Pandemic. Drones 2021, 5, 18. [Google Scholar] [CrossRef]
  8. Jee, S.H.; Cho, H.C.; Kim, J. The Experimental Modeling of Quad-Rotor Actuators with Undefined Hardware Errors for Safety-Flight. Electronics 2020, 9, 579. [Google Scholar] [CrossRef] [Green Version]
  9. Li, Y.; Yonezawa, K.; Liu, H. Effect of Ducted Multi-Propeller Configuration on Aerodynamic Performance in Quadrotor Drone. Drones 2021, 5, 101. [Google Scholar] [CrossRef]
  10. He, X.; Kou, G.; Calaf, M.; Leang, K.K. In-Ground-Effect Modeling and Nonlinear-Disturbance Observer for Multirotor Unmanned Aerial Vehicle Control. J. Dyn. Syst. Meas. Control 2019, 141, 071013. [Google Scholar] [CrossRef] [Green Version]
  11. Hoshu, A.A.; Fisher, A.; Wang, L. Cascaded Attitude Control For Heterogeneous Multirotor UAS For Enhanced Disturbance Rejection. In Proceedings of the 2019 Australian and New Zealand Control Conference (ANZCC), Auckland, New Zealand, 27–29 November 2019; pp. 110–115. [Google Scholar]
  12. Griffiths, D.; Leishman, J. Dual-rotor interference and ground effects using a free-vortex wake model. In Proceedings of the 58th Annual Forum and Technology Display of the American Helicopter Assoc, Montreal, QC, Canada, 11–13 June 2002. [Google Scholar]
  13. Deters, R.W.; Ananda Krishnan, G.K.; Selig, M.S. Reynolds number effects on the performance of small-scale propellers. In Proceedings of the 32nd AIAA Applied Aerodynamics Conference, Atlanta, GA, USA, 16–20 June 2014; p. 2151. [Google Scholar]
  14. Shukla, D.; Komerath, N. Multirotor drone aerodynamic interaction investigation. Drones 2018, 2, 43. [Google Scholar] [CrossRef]
  15. Leishman, J.G. Development of the autogiro: A technical perspective. J. Aircr. 2004, 41, 765–781. [Google Scholar] [CrossRef]
  16. Leishman, G.J. Principles of Helicopter Aerodynamics with CD Extra; Cambridge University Press: Cambridge, UK, 2006. [Google Scholar]
  17. Junaid, A.; Konoiko, A.; Zweiri, Y.; Sahinkaya, M.; Seneviratne, L. Autonomous wireless self-charging for multi-rotor unmanned aerial vehicles. Energies 2017, 10, 803. [Google Scholar] [CrossRef]
  18. Kingry, N.; Towers, L.; Liu, Y.C.; Zu, Y.; Wang, Y.; Staheli, B.; Katagiri, Y.; Cook, S.; Dai, R. Design, Modeling and Control of a Solar-Powered Quadcopter. In Proceedings of the 2018 IEEE International Conference on Robotics and Automation (ICRA), Brisbane, Australia, 21–25 May 2018; pp. 1251–1258. [Google Scholar]
  19. Wang, Y.; Wang, Y.; Ren, B. Energy saving quadrotor control for field inspections. IEEE Trans. Syst. Man Cybern. Syst. 2020, 52, 1768–1777. [Google Scholar] [CrossRef]
  20. Ryll, M.; Bülthoff, H.H.; Giordano, P.R. A novel overactuated quadrotor unmanned aerial vehicle: Modeling, control, and experimental validation. IEEE Trans. Control Syst. Technol. 2014, 23, 540–556. [Google Scholar] [CrossRef] [Green Version]
  21. Driessens, S.; Pounds, P. The triangular quadrotor: A more efficient quadrotor configuration. IEEE Trans. Robot. 2015, 31, 1517–1526. [Google Scholar] [CrossRef]
  22. Karydis, K.; Kumar, V. Energetics in robotic flight at small scales. Interface Focus 2017, 7, 20160088. [Google Scholar] [CrossRef] [Green Version]
  23. Hoshu, A.A.; Wang, L.; Sattar, A.; Fisher, A. Auto-Tuning of Attitude Control System for Heterogeneous Multirotor UAS. Remote Sens. 2022, 14, 1540. [Google Scholar] [CrossRef]
  24. Qin, Y.; Xu, W.; Lee, A.; Zhang, F. Gemini: A Compact Yet Efficient Bi-Copter UAV for Indoor Applications. IEEE Robot. Autom. Lett. 2020, 5, 3–14. [Google Scholar] [CrossRef]
  25. Emran, B.J.; Najjaran, H. A review of quadrotor: An underactuated mechanical system. Annu. Rev. Control 2018, 46, 165–180. [Google Scholar] [CrossRef]
  26. Wang, L. Automatic tuning of PID controllers using frequency sampling filters. IET Control Theory Appl. 2017, 11, 985–995. [Google Scholar] [CrossRef]
  27. Wang, L. PID Control System Design and Automatic Tuning Using MATLAB/Simulink; John Wiley and Sons: Hoboken, NJ, USA, 2020. [Google Scholar]
  28. Sattar, A.; Wang, L.; Mohamed, A.; Fisher, A. Roll Rate Controller Design of Small Fixed Wing UAV using Relay with Embedded Integrator. In Proceedings of the 2020 Australian and New Zealand Control Conference (ANZCC), Gold Coast, Australia, 26–27 November 2020; pp. 149–153. [Google Scholar]
  29. Sattar, A.; Wang, L.; Mohamed, A.; Fisher, A. System Identification and Heuristic Control of Segmented Ailerons for Enhanced Stability of Fixed Wing UAVs. J. Autom. Mob. Robot. Intell. Syst. 2021, 3–14. [Google Scholar] [CrossRef]
  30. Kreyszig, E. Advanced Engineering Mathematics; John Wiley and Sons: Hoboken, NJ, USA, 2010. [Google Scholar]
  31. Levy, E. Complex-curve fitting. IRE Trans. Autom. Control 1959, 37–43. [Google Scholar] [CrossRef]
  32. InvenSense. Embedded motion driver v5.1.1 apis specification. Doc: SW-EMD-REL-5.1.1, Doc Rev:1.0 2012. Available online: https://www.digikey.com/Site/Global/Layouts/DownloadPdf.ashx?pdfUrl=4012F20DDE8F4095B10E31923C2F7EF2 (accessed on 3 September 2022).
  33. Mathworks. Invfreqs. Available online: https://www.mathworks.com/help/signal/ref/invfreqs.html (accessed on 3 September 2022).
  34. Hoshu, A.A.; Wang, L.; Fisher, A.; Sattar, A. Cascade control for heterogeneous multirotor UAS. Int. J. Intell. Unmanned Syst. 2021. [Google Scholar] [CrossRef]
  35. MIL-HDBK, U.M.H. Flying qualities of piloted aircraft. Stand. Dep. Def. 1997. [Google Scholar]
  36. Gremillion, G.; Humbert, J. System identification of a quadrotor micro air vehicle. In Proceedings of the AIAA Atmospheric Flight Mechanics Conference, Toronto, ON, Canada, 2–5 August 2010; p. 7644. [Google Scholar]
Figure 1. Heterogeneous multirotor model.
Drones 06 00309 g001
Figure 2. Hardware prototype of heterogeneous multirotor UAV.
Drones 06 00309 g002
Figure 3. Test rig for roll and pitch axis.
Drones 06 00309 g003
Figure 4. Test rig for roll and pitch axis.
Drones 06 00309 g004
Figure 5. Roll rate response of heterogeneous multirotor under range of sinusoidal input signals. Solid lines: roll rate, dashed lines: input signal. (a) Input frequency: 0.5 Hz. (b) Input frequency: 1.0 Hz. (c) Input frequency: 2.2 Hz. (d) Input frequency: 3.1 Hz. (e) Input frequency: 4.5 Hz.
Drones 06 00309 g005
Figure 6. Frequency response of the estimated transfer functions for roll axis with respect to experimental frequency points.
Drones 06 00309 g006
Figure 7. Pitch rate response of heterogeneous multirotor under range of sinusoidal input signals. Solid lines: pitch rate, dashed lines: input signal. (a) Input frequency: 0.5 Hz. (b) Input frequency: 1.2 Hz. (c) Input frequency: 2.7 Hz. (d) Input frequency: 3.6 Hz. (e) Input frequency: 4.8 Hz.
Drones 06 00309 g007
Figure 8. Frequency response of the estimated transfer functions for pitch axis with respect to frequency points.
Drones 06 00309 g008
Figure 9. Yaw rate response of heterogeneous multirotor under range of sinusoidal input signals. Solid lines: yaw rate, dashed lines: input signal. (a) Input frequency: 0.2 Hz. (b) Input frequency: 0.4 Hz. (c) Input frequency: 0.7 Hz. (d) Input frequency: 1.2 Hz. (e) Input frequency: 1.5 Hz.
Drones 06 00309 g009
Figure 10. Frequency response of the estimated transfer functions for pitch axis with respect to frequency points.
Drones 06 00309 g010
Figure 11. Cascaded control system for attitude control.
Drones 06 00309 g011
Figure 12. Roll angular response.
Drones 06 00309 g012
Figure 13. Roll angular rate response.
Drones 06 00309 g013
Figure 14. Pitch angular response.
Drones 06 00309 g014
Figure 15. Pitch angular rate response.
Drones 06 00309 g015
Figure 16. Yaw angular rate response.
Drones 06 00309 g016
Table 1. Recommended input signal’s frequency range for heterogeneous multirotor UAV.
AxisLowest Frequency (Hz)Highest Frequency (Hz)
Roll0.54.5
Pitch0.54.8
Yaw0.151.6
Table 2. Heterogeneous Multirotor UAS Specifications.
DescriptionDetails
Main rotor propellerTarot 1555 CF 15 × 5.5
Boom rotor propellersHQProp v1s 5 × 4 × 3
Diameter of arm tube12 mm
Length of arm tube10 inches
Moment arm12 inches
Boom rotors’ tilt angle20 degrees
Mass930 g
Table 3. Parts used in UAS design.
PartsDetails
Micro-controller boardTeensy 3.5
Inertial motion unitMPU6050 with built-in DMP
Small boom motorsEmax-RS2205 (2300 KV)
Small motors’ ESCsEmax, Lightning-30 A BLHELI
Central large motorTMotor-U5 (400 KV)
Central motor’s ESCTMotor Air-ESC 40 A
Data LoggerTeensy 3.5 built-in SD logger
RadioTaranis-x9d plus
ReceiverFrSky-V8FR-II
Table 4. Frequency response analysis for Roll axis.
k ω k (rad/s)MagnitudePhase (rad) R k I k
13.14151.3836−0.86580.8966−1.0538
23.79421.3195−1.26980.3912−1.2602
34.2311.1344−1.48250.1000−1.1300
44.70301.1023−1.6353−0.0711−1.1000
55.23590.9159−1.8746−0.2740−0.8740
65.88310.7380−1.9798−0.2935−0.6771
76.28320.7111−2.0649−0.3372−0.6260
87.85400.6131−2.2394−0.3801−0.4811
99.13250.4728−2.3445−0.3304−0.3382
1010.47190.3315−2.3562−0.2344−0.2344
1113.82790.1950−2.6791−0.1745−0.0870
1216.19380.1093−2.8873−0.1058−0.0275
1319.46510.1008−2.9286−0.0985−0.0213
1421.81660.0683−3.1255−0.0683−0.0011
1528.04990.04542.8940−0.04400.0111
Table 5. Frequency response analysis for Pitch axis.
k ω k (rad/s)MagnitudePhase (rad) R k I k
13.1421.418−0.9810.789−1.179
23.7621.303−1.2590.401−1.242
34.0911.236−1.4080.212−1.223
44.8621.053−1.673−0.107−1.0476
55.4631.024−1.787−0.220−1.011
66.2510.867−1.936−0.312−0.813
76.8260.747−2.058−0.352−0.661
87.5390.680−2.201−0.400−0.550
98.4900.484−2.321−0.330−0.354
109.4050.399−2.497−0.319−0.240
1111.8100.245−2.536−0.202−0.139
1216.9730.109−2.909−0.107−0.025
1318.6680.104−3.0130.104−0.014
1422.6930.0643.007−0.0640.009
1530.1650.0332.790−0.0310.011
Table 6. Frequency response analysis for yaw axis.
k ω k (rad/s)MagnitudePhase (rad) R k I k
10.9060.559−0.5990.462−0.315
21.5950.469−0.6980.3590.301
32.0010.383−0.8340.258−0.284
42.5340.314−1.0450.156−0.269
52.5920.277−1.1520.112−0.253
62.6490.225−1.1570.091−0.206
73.0980.215−1.3040.057−0.207
84.7310.153−1.3280.037−0.148
94.7460.132−1.4660.014−0.132
105.8610.112−1.3520.024−0.109
116.2580.097−1.2870.027−0.093
127.7760.096−1.3530.021−0.094
138.3560.091−1.3220.022−0.088
149.8170.081−1.3920.014−0.080
1510.0110.052−1.4750.005−0.052
Table 7. PID parameters for inner loop.
Axis K c τ I τ D
Roll2.4220.4390.051
Pitch2.3860.4390.048
Yaw7.3930.3970.043
Table 8. PID parameters for outer loop.
Axis K c τ D
Roll1.4880.107
Pitch1.5010.106
Publisher’s Note: MDPI stays neutral with regard to jurisdictional claims in published maps and institutional affiliations.