Article

Supporting Long-Term Archaeological Research in Southern Romania Chalcolithic Sites Using Multi-Platform UAV Mapping

1
Department of Built Environment, HOGENT University of Applied Sciences and Arts, 9000 Ghent, Belgium
2
Department of Geography, Ghent University, 9000 Ghent, Belgium
3
Research Institute of the University of Bucharest (ICUB), University of Bucharest, 050663 Bucharest, Romania
4
Institute of Prehistoric and Protohistoric Archaeology, Kiel University, 24118 Kiel, Germany
5
Lower Danube Museum Călărași, 910001 Calarasi, Romania
6
Bucharest Municipality Museum, 030167 Bucharest, Romania
*
Author to whom correspondence should be addressed.
Drones 2022, 6(10), 277; https://doi.org/10.3390/drones6100277
Submission received: 30 August 2022 / Revised: 15 September 2022 / Accepted: 20 September 2022 / Published: 26 September 2022
(This article belongs to the Special Issue Drone Inspection in Cultural Heritage)

Abstract

:
Spatial data play a crucial role in archaeological research, and orthophotos, digital elevation models, and 3D models are frequently used for the mapping, documentation, and monitoring of archaeological sites. Thanks to the availability of compact and low-cost uncrewed airborne vehicles, the use of UAV-based photogrammetry matured in this field over the past two decades. More recently, compact airborne systems are also available that allow the recording of thermal data, multispectral data, and airborne laser scanning. In this article, various platforms and sensors are applied at the Chalcolithic archaeological sites in the Mostiștea Basin and Danube Valley (Southern Romania). By analysing the performance of the systems and the resulting data, insight is given into the selection of the appropriate system for the right application. This analysis requires thorough knowledge of data acquisition and data processing, as well. As both laser scanning and photogrammetry typically result in very large amounts of data, a special focus is also required on the storage and publication of the data. Hence, the objective of this article is to provide a full overview of various aspects of 3D data acquisition for UAV-based mapping. Based on the conclusions drawn in this article, it is stated that photogrammetry and laser scanning can result in data with similar geometrical properties when acquisition parameters are appropriately set. On the one hand, the used ALS-based system outperforms the photogrammetric platforms in terms of operational time and the area covered. On the other hand, conventional photogrammetry provides flexibility that might be required for very low-altitude flights, or emergency mapping. Furthermore, as the used ALS sensor only provides a geometrical representation of the topography, photogrammetric sensors are still required to obtain true colour or false colour composites of the surface. Lastly, the variety of data, such as pre- and post-rendered raster data, 3D models, and point clouds, requires the implementation of multiple methods for the online publication of data. Various client-side and server-side solutions are presented to make the data available for other researchers.

1. Introduction

Image-based 3D modelling and laser scanning techniques are mature in cultural heritage and archaeology [1,2]. Structure from motion and multi-view stereo algorithms (SfM-MVS) are commonly used for image-based 3D modelling, allowing the processing of large series of uncalibrated and unstructured photographs [3,4]. This processing generates different results, such as orthophotos, digital elevation models (DEMs), or textured 3D models. In archaeology, the technique is used for various applications, such as feature modelling, finds processing, and creating time series of excavations [5]. Furthermore, this technique is used in many scientific disciplines thanks to the high geometric accuracy and resolution of the resulting 3D models. In addition, SfM-MVS is appreciated for the straightforward procedure regarding the acquisition and processing of data, the ability to generate models with photorealistic texture, and the possibility of performing non-contact measurements. Such a highly accurate scientific recording technique is required for all past features since archaeological excavation is a destructive process [6], and revealed features are exposed to many destructive environmental elements.
Additionally, traditional 2D documentation is complemented with a more realistic and attractive 3D representation of the archaeological heritage [7]. However, the introduction of uncrewed aerial systems (UAS) has allowed archaeologists to improve the effectiveness of their modelling work with airborne data [8]. Traditionally, the necessary images for these projects are obtained terrestrially by hand or tripod. The flexibility of image-based modelling platforms, tools, and techniques enables the creation of high-quality 3D reconstructions of a various relics and artifacts. The availability of UASs suitable for photogrammetric applications has increased significantly over the past decades, and the technique is well established for topographic mapping and archaeological documentation [9,10].
Besides image-based 3D modelling, laser scanning is a valuable technique for archaeological applications [11]. Airborne laser scanning (ALS), in particular, is well known for the topographic modelling of landscapes and offers a wide range of point densities and accuracies. For georeferencing the final point cloud, each measurement combines synchronised observations of a position and orientation measurement system (POS). After post-processing, a relatively accurate point cloud is obtained, which can be used for further analysis. Until recently, applications of ALS were limited to systems carried by piloted airplanes or helicopters. The system’s portability was mainly hampered by the price and size, as well as the reasonable energy consumption. However, UAV-based ALS has rapidly evolved over the past five years, and the availability and applications of the systems are increasing [12,13].
Archaeological research in the target area (Mostiștea Basin and Danube Valley) strongly focuses on applying modern methods for acquiring, processing, and interpreting various parameters. Image-based 3D modelling techniques have been essential in many regional projects. Combining these techniques with UAVs (uncrewed aerial vehicles), valuable data sources can be tapped. Moreover, the construction of these data can be essential in the spatial analysis of archaeological sites and cultural landscapes. The University of Bucharest oversees the project, and various platforms and sensors are available to acquire UAV-based data. Experiments and data acquisition are more specifically organised using conventional true colour cameras (RGB), multispectral cameras (MS), thermal cameras, and ALS.
Considering this, the question arises about what type of system should be used for a specific task in terms of possibilities and limitations. Hence, the characteristics of the acquired and processed data should be investigated, and in-depth workflows should be developed. Lastly, the storage and publication of the data should be considered. This aspect is essential for sharing data with other researchers, and data sustainability and outreach.
This paper goes into greater detail on these crucial subjects, starting with an overview of the study area and project outline, and a section dedicated to data acquisition, discussing the used hardware and the flight plan preparation. The fourth section offers a data processing workflow, emphasising enhancing the accuracy of picture geotags and the software used to handle ALS and image data. The results of this research are discussed in the fifth section, along with the quality of the data as well as its storage and publication. Final remarks are given at the end of the paper to better understand the impact of using this kind of technology.

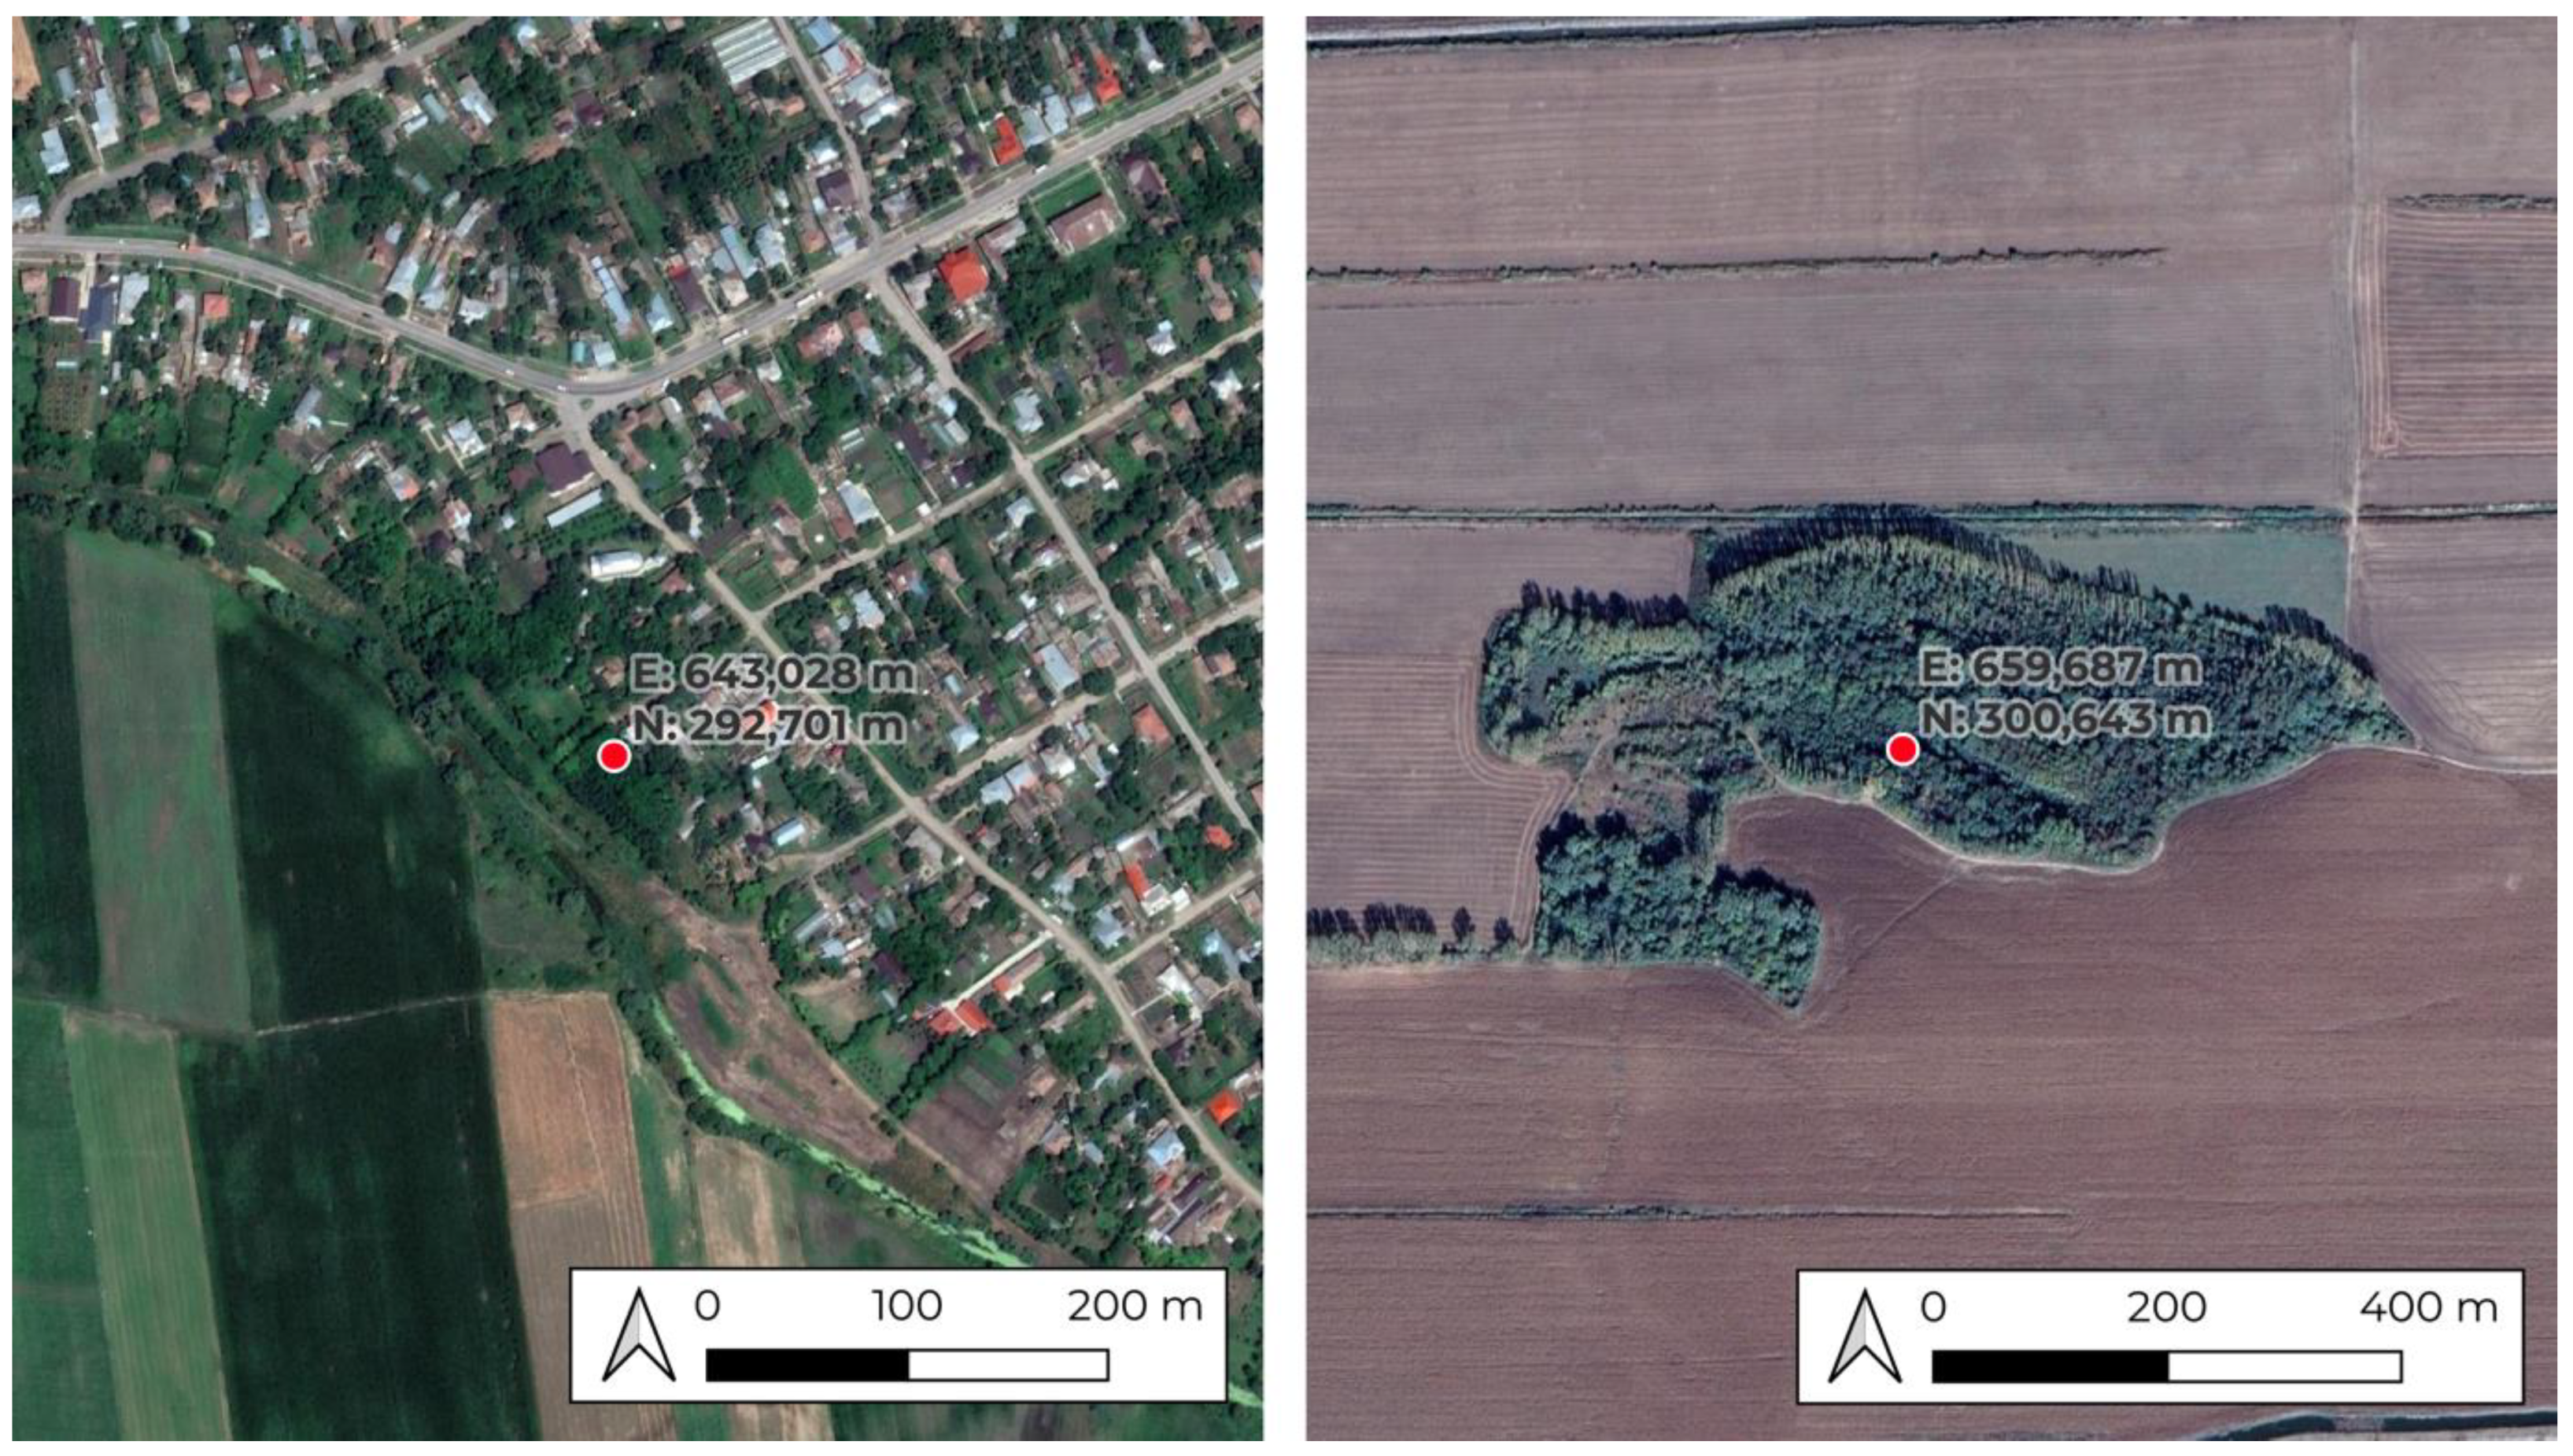
2. Study Area and Project Outline

The targeted area is located in the southeast of Romania, Călărași County, Muntenia Region, one of the most intensively investigated regions in terms of Chalcolithic sites in the Northern Balkans. Geographically, we are dealing with two micro-regions, and the sites investigated are spread across the Mostiștea Basin and Danube Valley, from the cities of Oltenița to Călărași (Figure 1).
The target area was not chosen randomly, as it has been the most investigated region in Romania since the beginning of the 20th century. Romanian archaeologists carried out intensive excavations in the Chalcolithic and Middle/Late Neolithic sites of Călărași County, which formed the basis for the definition of two emblematic prehistoric cultures in the Northern Balkans, the Boian and the Gumelnița [14,15]. Moreover, these investigations contributed to determining the relative chronology of archaeological cultures in Romania. On the other hand, the relief from Mostiștea Valley has changed drastically due to the land and agricultural improvement activities from the Communist Period, which makes the selected area an ideal place to apply the proposed technologies and quantify the landscape changes.
Generally, due to natural processes combined with massive anthropic interventions (planning and execution of land improvement work), a series of lakes were formed along the Mostiștea Valley [16], while the Danube Meadow area has undergone major anthropogenic disturbance with the making of flood protection systems and the recovery of land for farming [17,18]. Along the way, a series of archaeological sites have been drastically affected. In this respect, the current study is a part of a wider research project concerning the integration of laser scanning and image-based 3D modelling methodologies for monitoring and documenting cultural heritage sites in Southern Romania, and also to support the current archaeological investigations.
Our attention was first focused on tell settlements, but the investigation was extended to other kinds of sites belonging to the Chalcolithic period (c. 5000-4000 cal. BCE). Alongside the Mostiștea Basin, we investigated ten sites (three cemeteries, one flat settlement, and six tell settlements). Moreover, from the Danube Meadow region, we investigated six other tell settlements and one small settlement rediscovered during our 2019 survey (Figure 1). This batch of sites provides a reasonable basis for analysis, which has enabled us to push forward the knowledge of landscape changes (human impact and natural processes) in the target area.
From an archaeological perspective, the 5th millennium BC represents the last stage of the Neolithic period, and in Romania and Bulgaria, it is known as the Copper Age, Eneolithic, or Chalcolithic period [19,20,21], or the “golden 5th millennium”. This timespan was the most flourishing development period for the Chalcolithic civilisation from Southeastern Europe, when significant changes and technological advances (e.g., metallurgy) occurred in the human community. This time saw the rise of tell settlements as the main form of habitation, completed by some flat settlements, cemeteries, water sources, and settlements surrounding land used for agriculture, animal breeding, fishing, gathering, and the procurement of other resources [19,20,22,23].
The areas of the Danube River Basin and Mostiștea Valley are fascinating, as some sites have been under archaeological investigations since the beginning of the Romanian Archaeological School. In this respect, in 1923, under the guidance of V. Pârvan, several archaeologists carried out field surveys to complete the few known data about prehistoric communities in the Romanian Plain [24,25,26]. Thus, Sultana-Malu Roșu was the first tell settlement discovered and investigated in 1923 by Andrieșescu [24]. Moreover, R. Vulpe and V. Dumitrescu’s investigation alongside the Mostiștea River and between the village of Dorobanțu and the city of Călărași generated the first map of archaeological sites in this region, when several sites in our study were identified (Cunești, Rasa, Vărăști) [27]. The homonym settlement of the Gumelnița culture was first investigated in 1924 by Vl. Dumitrescu, and based on these investigations, the Gumelnița culture was defined [28,29].
Moreover, some sites were identified and excavated by a German archaeologist team (Chiselet site) led by Leo Frobenius at the end of the First World War [25]. Then, during the interwar period, the tell settlement from Măgureni was investigated [30]. Various land improvement works from the 1970s and 1980s performed in Mostiștea Valley led to the damage of other Chalcolithic sites (Măriuța, Sultana-Valea Orbului, Șeinoiu, Vlădiceasca I-II, Ulmeni). Other times, some natural disasters favoured the research of other sites in the area (Spanțov) [31,32].
In 2006, a European project in collaboration with the AARG (Aerial Archaeology Research Group) turned its attention to the Mostiștea Valley [33]. The project’s intention was to identify new areas of archaeological interest and determine the coordinates of the sites mapped since the 1923 field investigation. Thus, multiple cartographic works, along with satellite images, fieldwalking, and new flights for obtaining new aerial photos, were performed in the targeted area. As a result, at the project’s end, it was possible to introduce more than 200 new sites identified in the investigated area [34,35].
The excavations in the Sultana tell in 2001 and the year-by-year continuation of archaeological research in the area until now, without interruptions, led to a mapping program of the sites in the Mostiștea Basin, which led to the accumulation of new archaeological and geospatial data [14].
In 2021, a new international project entitled “The dynamics of the prehistoric communities located in the Mostiștea Valley and Danube Plain (between Oltenița and Călărași)” was started, organised by the ArchaeoSciences Division of the Research Institute of the University of Bucharest (ICUB) and Kiel University (Germany), in partnership with HOGENT, University of Applied Sciences and Arts (Belgium), Museum of Bucharest, Museum of the Lower Danube Călărași, Museum of Gumelnița Civilization Oltenița, and “Vasile Pârvan” Institute of Archaeology (Romania).
This new project, in addition to the continuation of the geospatial data collection activities, involves an intense program of non-intrusive prospecting (e.g., electrical, seismic, and geomagnetic prospecting) together with coring of the sites in the Danube Basin and the Mostiștea Valley, which will allow a new step in the research program of Chalcolithic sites in the target area.
All these circumstances—some beneficial, others catastrophic—created the context of a complex and intense investigation in the targeted area, but also the accumulation of a set of data that allowed us to move to the next level of analyses presented in this paper.

3. Data Acquisition

In this and other sections, data quality parameters are used in accordance with Uren and Price [36]. Accuracy is defined as the systematic error of the data or the deviation of the data from the true values. As such, this value corresponds to the mean error and is also called the correctness of the data. The precision is used as a measure to quantify the random error, corresponding to the standard deviation of the data. Finally, the resolution, ground sampling distance (GSD), and point densities are used as parameters to describe the minimum detectable object size.

3.1. Airborne Image-Based Sensors

Since the summer campaign of 2018, image-based 3D modelling has been applied in the Mostiștea Basin and the Danube Valley to measure in the visible range of the electromagnetic spectrum, resulting in true colour (RGB) composites and models. Regarding the airborne aspect of these campaigns, a DJI Phantom 4 and DJI Mavic 2 Pro are intensively used for the data acquisition (Table 1) [37]. These systems are commonly used for archaeological prospection and are appreciated by many users for their relatively low cost, flexible deployment, operational time of 20 to 25 min, and reasonable camera specifications [38]. In addition, both systems are compatible with autopilot software developed by the platform producer, which facilitates the systematic execution of flights, given a series of predefined parameters and constraints, such as coverage, flying speed, altitude, and GSD [39].
In addition, new UAVs equipped with thermal and multispectral sensors were deployed during the 2022 summer campaign. For archaeological research, both multispectral and thermal imagery have the potential to identify areas of possible archaeological research interest based on local differences in the spectral signature of the recorded echo, e.g., through applied crop mark detection [40,41] and difference in thermal radiation [42]. The thermal sensor is an Uncooled VOx Microbolometer that allows measurements in the 8–14 μm spectral band and is integrated into a dual-camera system of the DJI Mavic 2 Enterprise system (Table 1).
The specifications of the RGB sensor are not as good as the DJI Mavic 2 Pro, but the system still allows the creation of orthophotos and DEMs with reasonable accuracy (Figure 2 left, middle). The white dots in this image represent the ground control point (GCP) locations. The use of these points is discussed later in this paper. In combination with the new thermal sensor, simultaneous true colour (RGB) and thermal images can be obtained from the study area. Although the resolution of this sensor is limited to 1600 × 1200 pixels, fixing both cameras into one camera body still allows the use of the resulting thermal images in combination with conventional true colour 3D modelling (Figure 2 right). Data processing typically results in an orthorectified projection of pseudo-thermal values presented in a false colour composite.
Another image-based system used in this project is the DJI Phantom 4 Multispectral UAV, which was implemented for the first time during the summer campaign of 2022 (Table 1). Next to a regular visible light (RGB) camera, the mounted camera contains an array of five additional and carefully aligned cameras. The geometrical camera specifications are identical for all six sensors, which are able to capture surface responses in specific spectral bands:
-
Near-infrared (NIR): 840 nm (±26 nm);
-
Red edge (RE): 730 nm (±16 nm);
-
Red (R): 650 nm (16 nm);
-
Green (G): 560 nm (±16 nm); and
-
Blue (B): 450 (±16 nm).
The availability of these bands makes the system useful for vegetation mapping. Therefore, the UAV is frequently used for environmental and agricultural monitoring applications (Candiago et al., 2015). The basis of this research is the calculation of vegetation indices, such as the commonly used normalised difference vegetation index (NDVI). The accurate calculation of these indices requires the correction of solar radiation fluctuations during the acquisition, and an integrated spectral sunlight sensor provides their correction data.

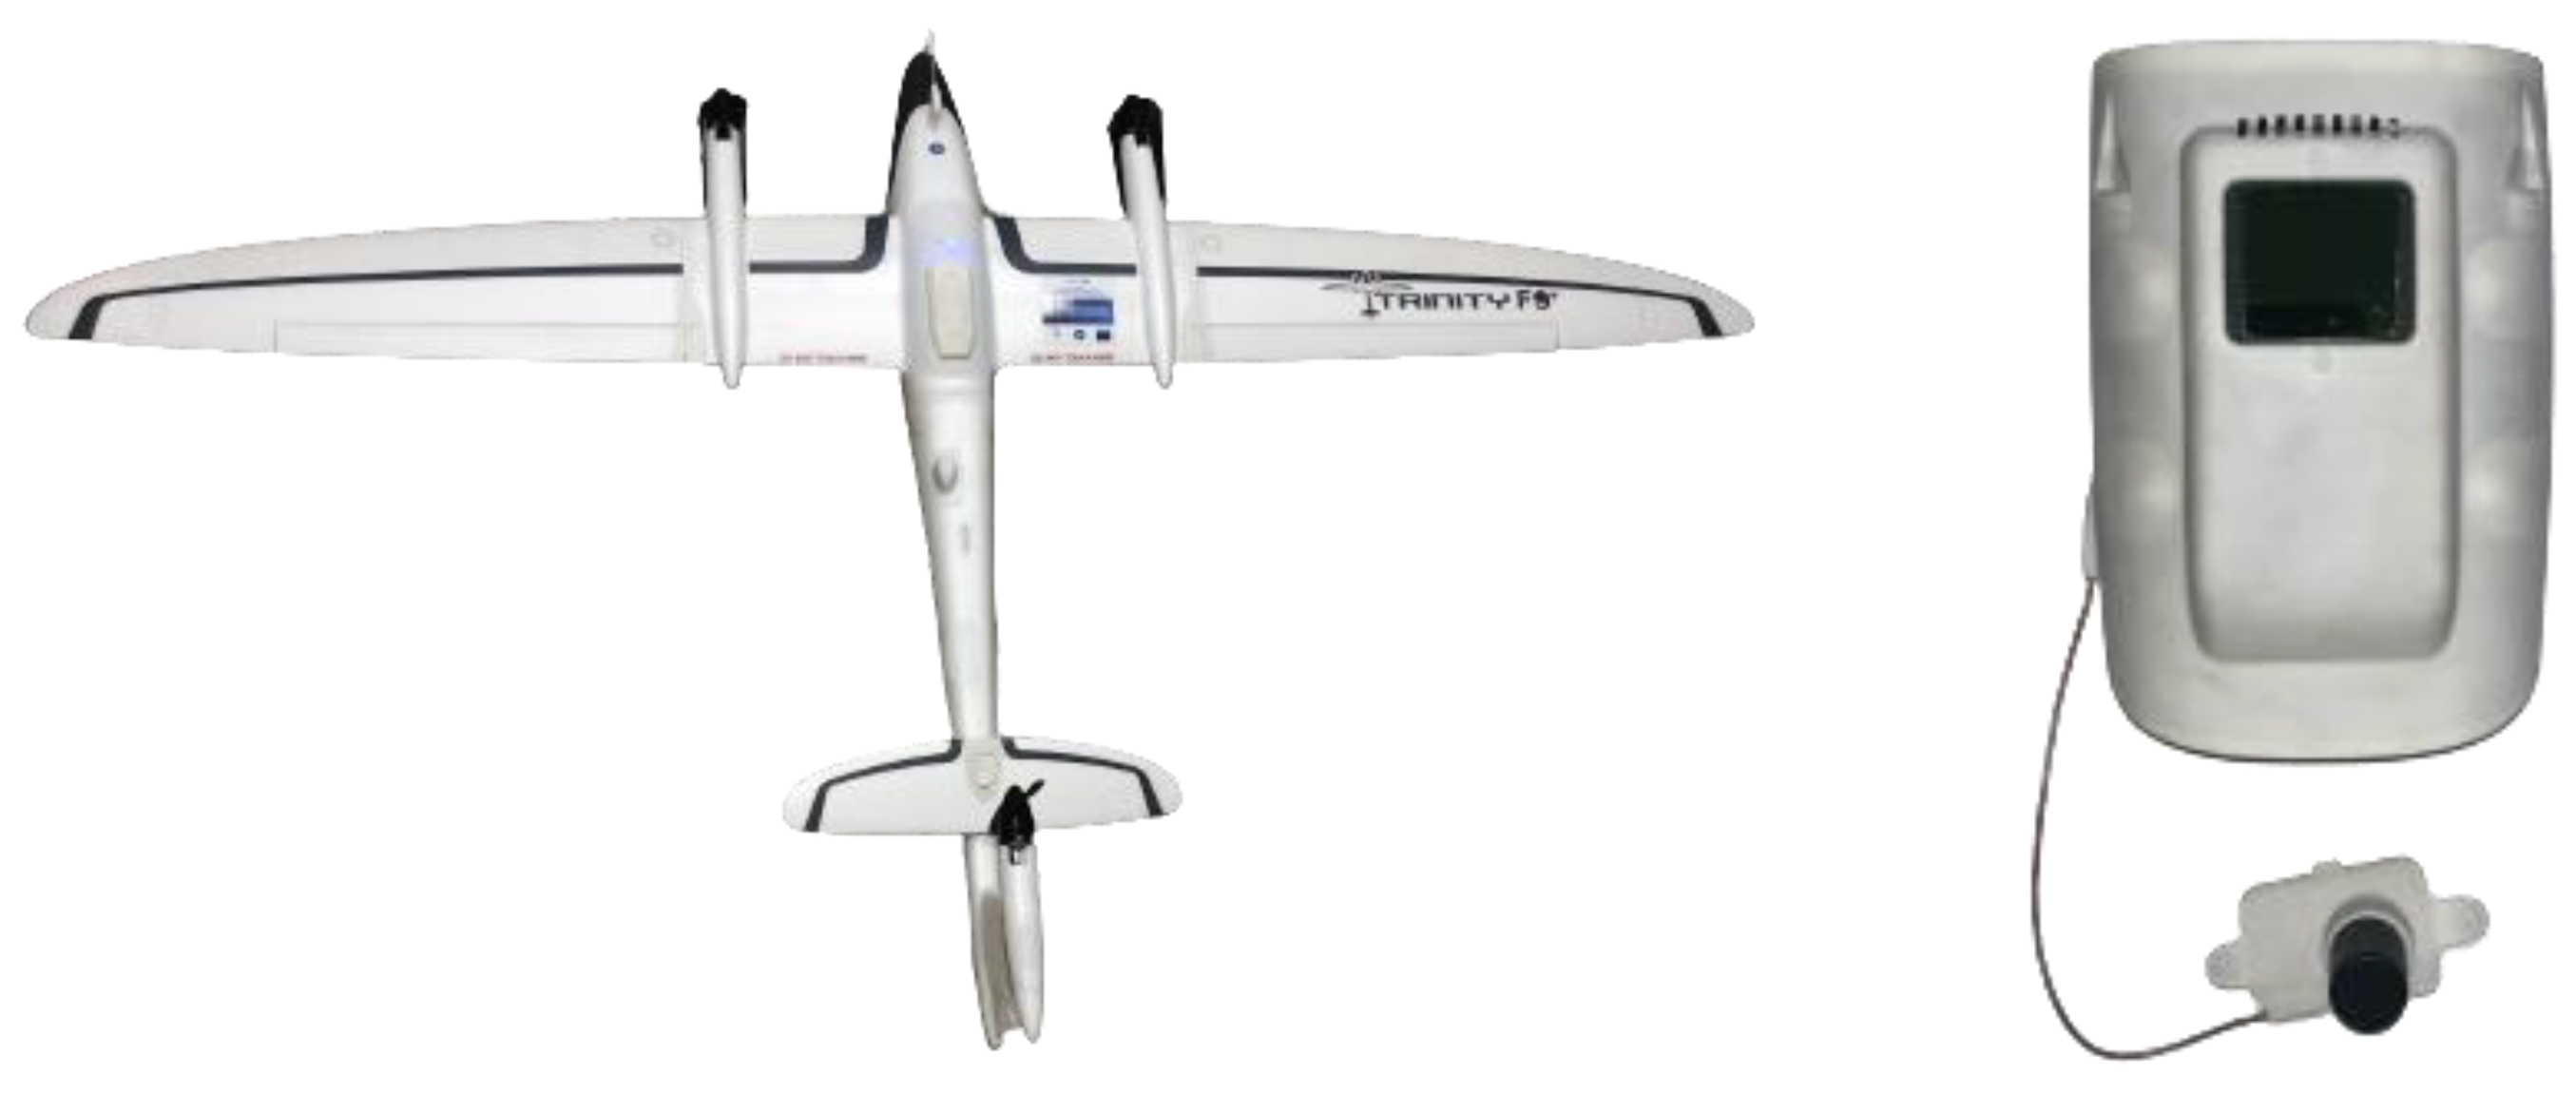
3.2. Airborne Laser Scanning

Since early 2022, the research group has been able to implement its own UAV/ALS combination. The main component of the newly obtained system is the Quantum Trinity F90+ carrier (Figure 3 left). Furthermore, the system contains a reference station for post-processing kinematic (PPK) global navigation satellite system (GNSS) positioning and a control station for flight planning and monitoring. The UAV is a vertical take-off and landing (VTOL) platform with an operational time of more than 90 min, a maximum ground speed of 17 m/s, and a maximum altitude of 3500 m MSL. The platform can carry various payloads, which are offered as different modules. Among others, an airborne laser scanning module is available for this system. This module is a Qube 240 ALS sensor (Figure 3 right). According to the specifications, the system can capture point clouds with a speed of 240 k points per second, having a precision between 1.8 and 2.5 cm and an accuracy of less than 3.0 cm at a height of 140 m above ground level (AGL). The point density and accuracy naturally decrease as a function of the ground speed and flying height [43].
Given these specifications, the system opens opportunities for large-scale projects that were initially challenging or technically impossible using image-based 3D modelling [44,45]. The initial objectives for the use of this system are twofold. At first, the topographic documentation of larger areas around specific archaeological sites is envisioned. Although reasonable areas have already been mapped using image-based 3D modelling, the extension of the covered area allows researchers to understand the micro-topographic aberrations in the landscape in a better way. Furthermore, with the interpretation of local deviations of the NDVI, these topographic aberrations are a proxy for the configuration of the hydrographic network in the Danube Valley. This might give insight into the location of the new site.
A second objective is the documentation of the archaeological site that is covered by vegetation, such as the sites of Spanțov (Figure 4 left) and Vărăști (Figure 4 right). Deciduous trees and low bushes cover both sites. Due to this vegetation, it was impossible to make a DEM of this site during a previous site visit in 2018. However, given the canopy-penetrating capabilities of ALS and the ability of the system to record three echoes per pulse, it is expected that the new platform will allow the generation of a digital representation of the area [46,47]. These new data will facilitate a better understanding of the site’s configuration.

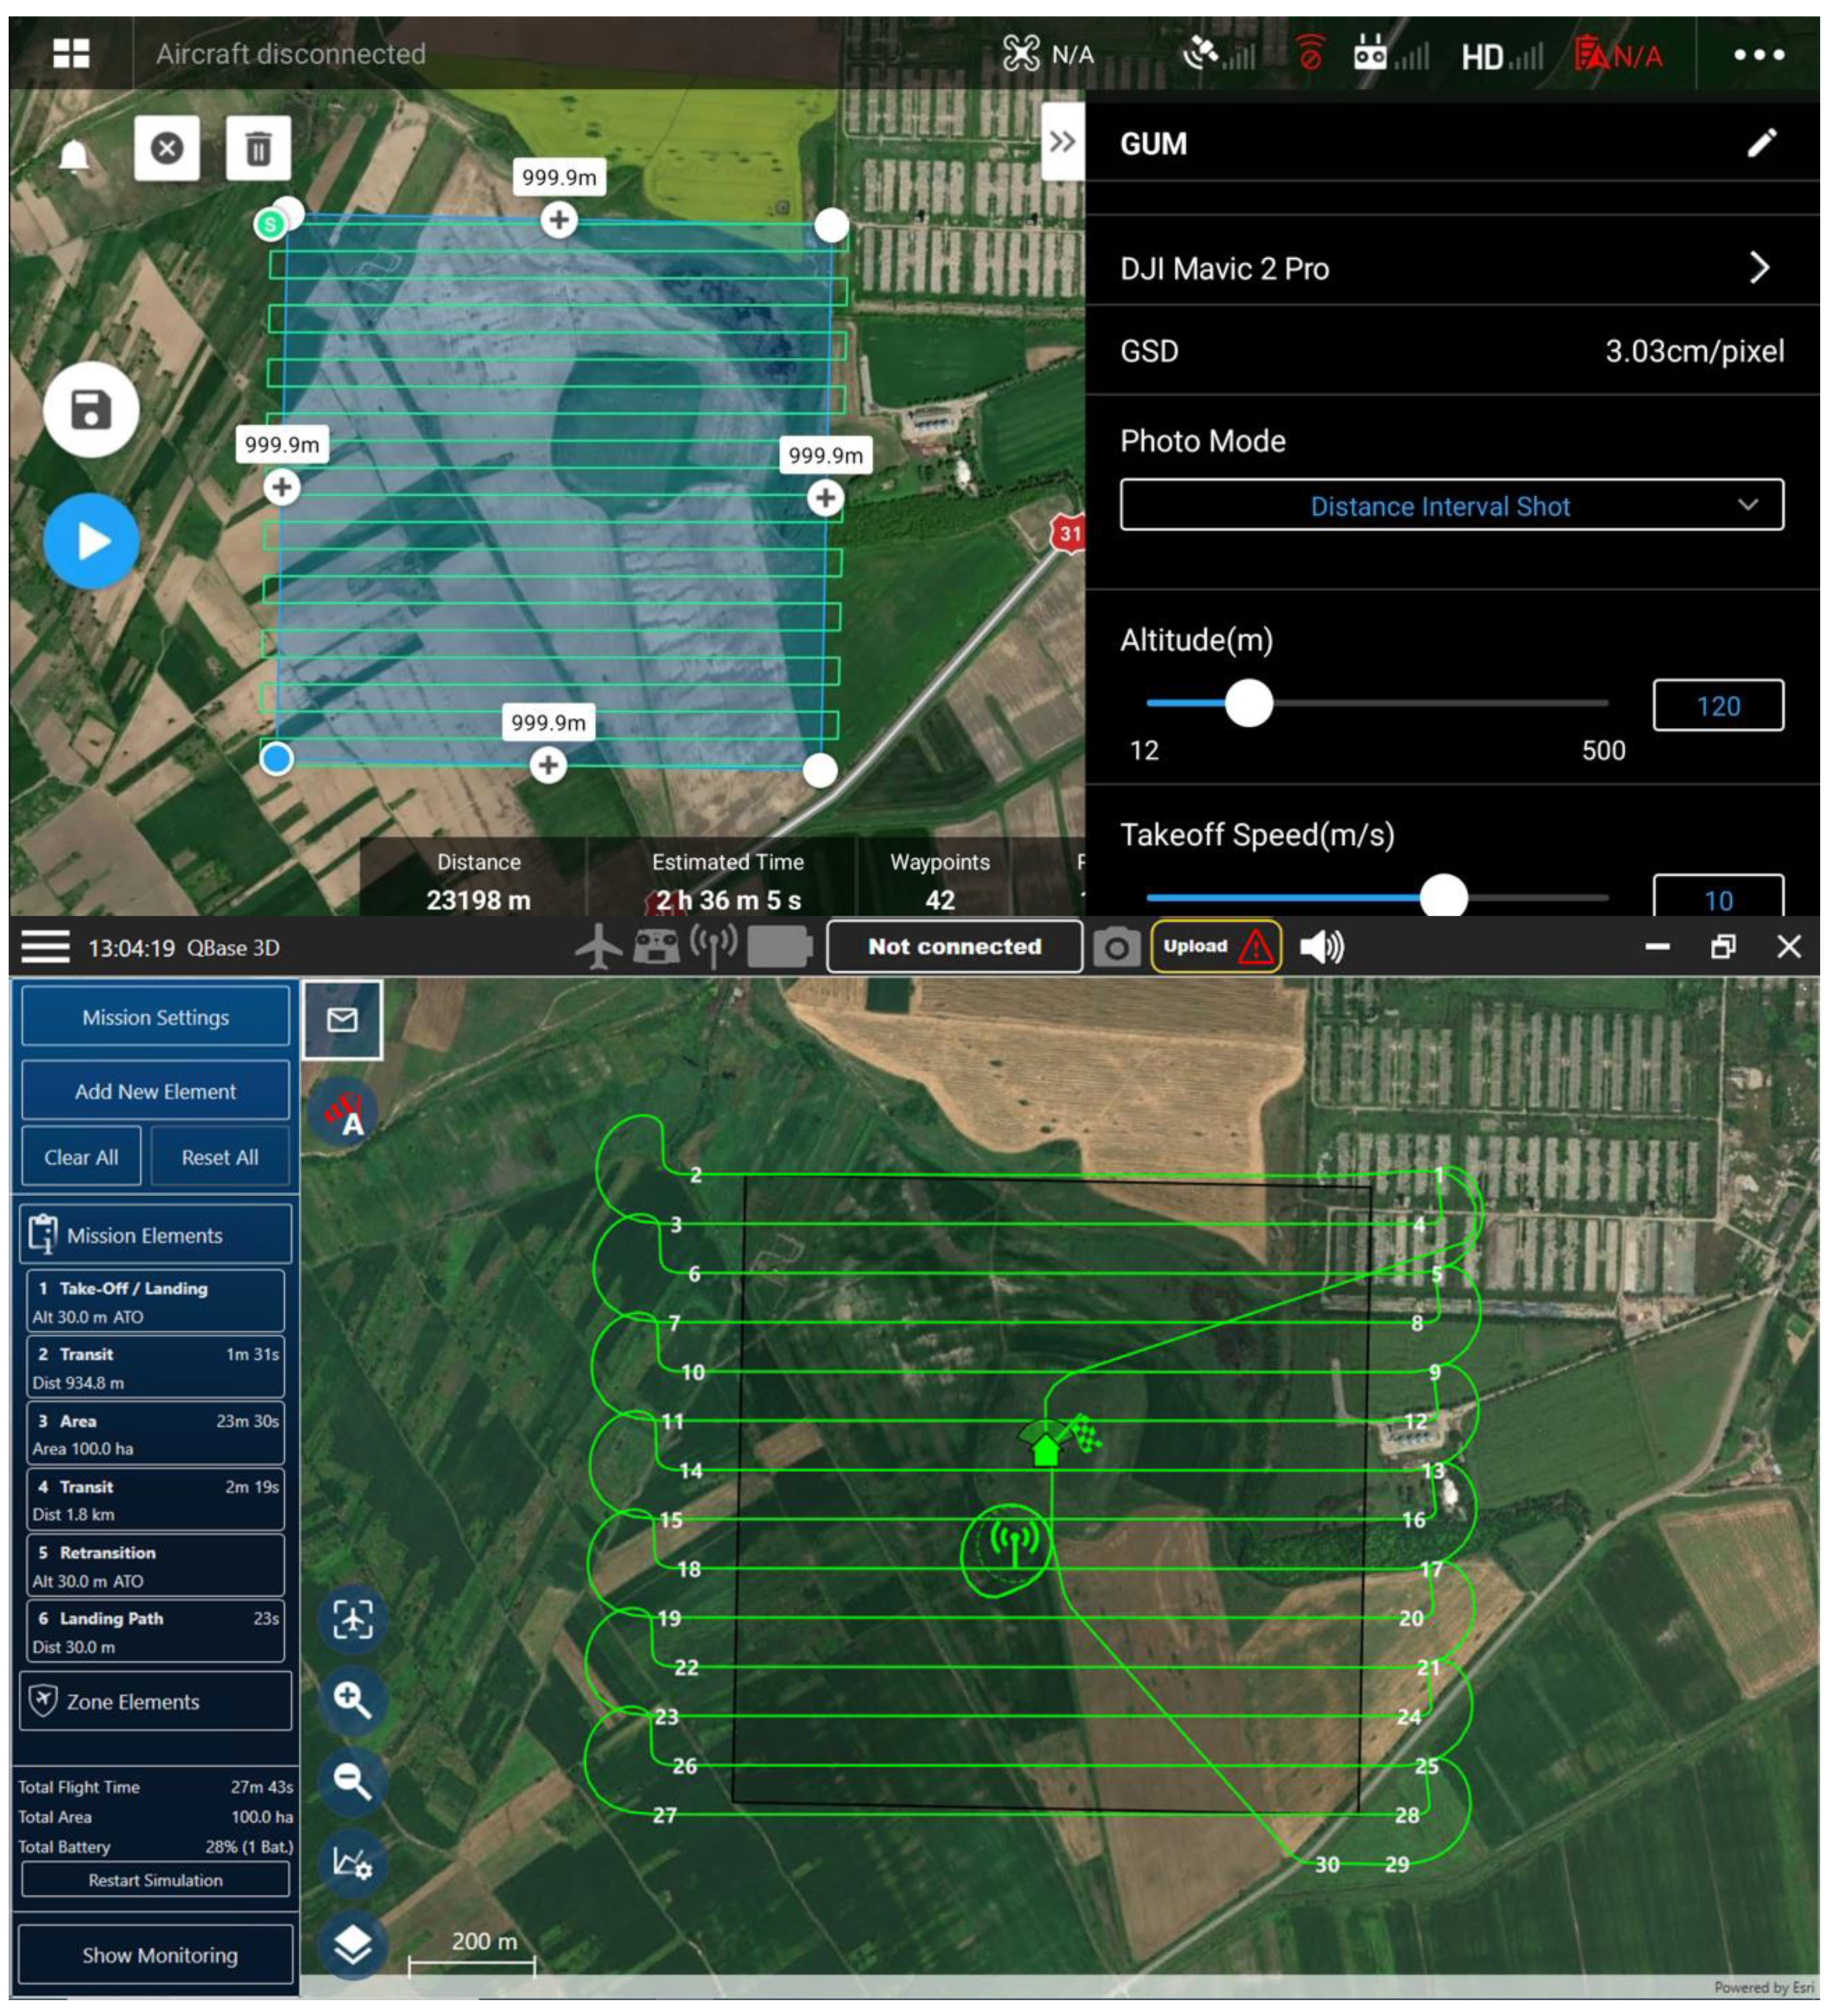
3.3. Flight Plan Preparation and System Comparison
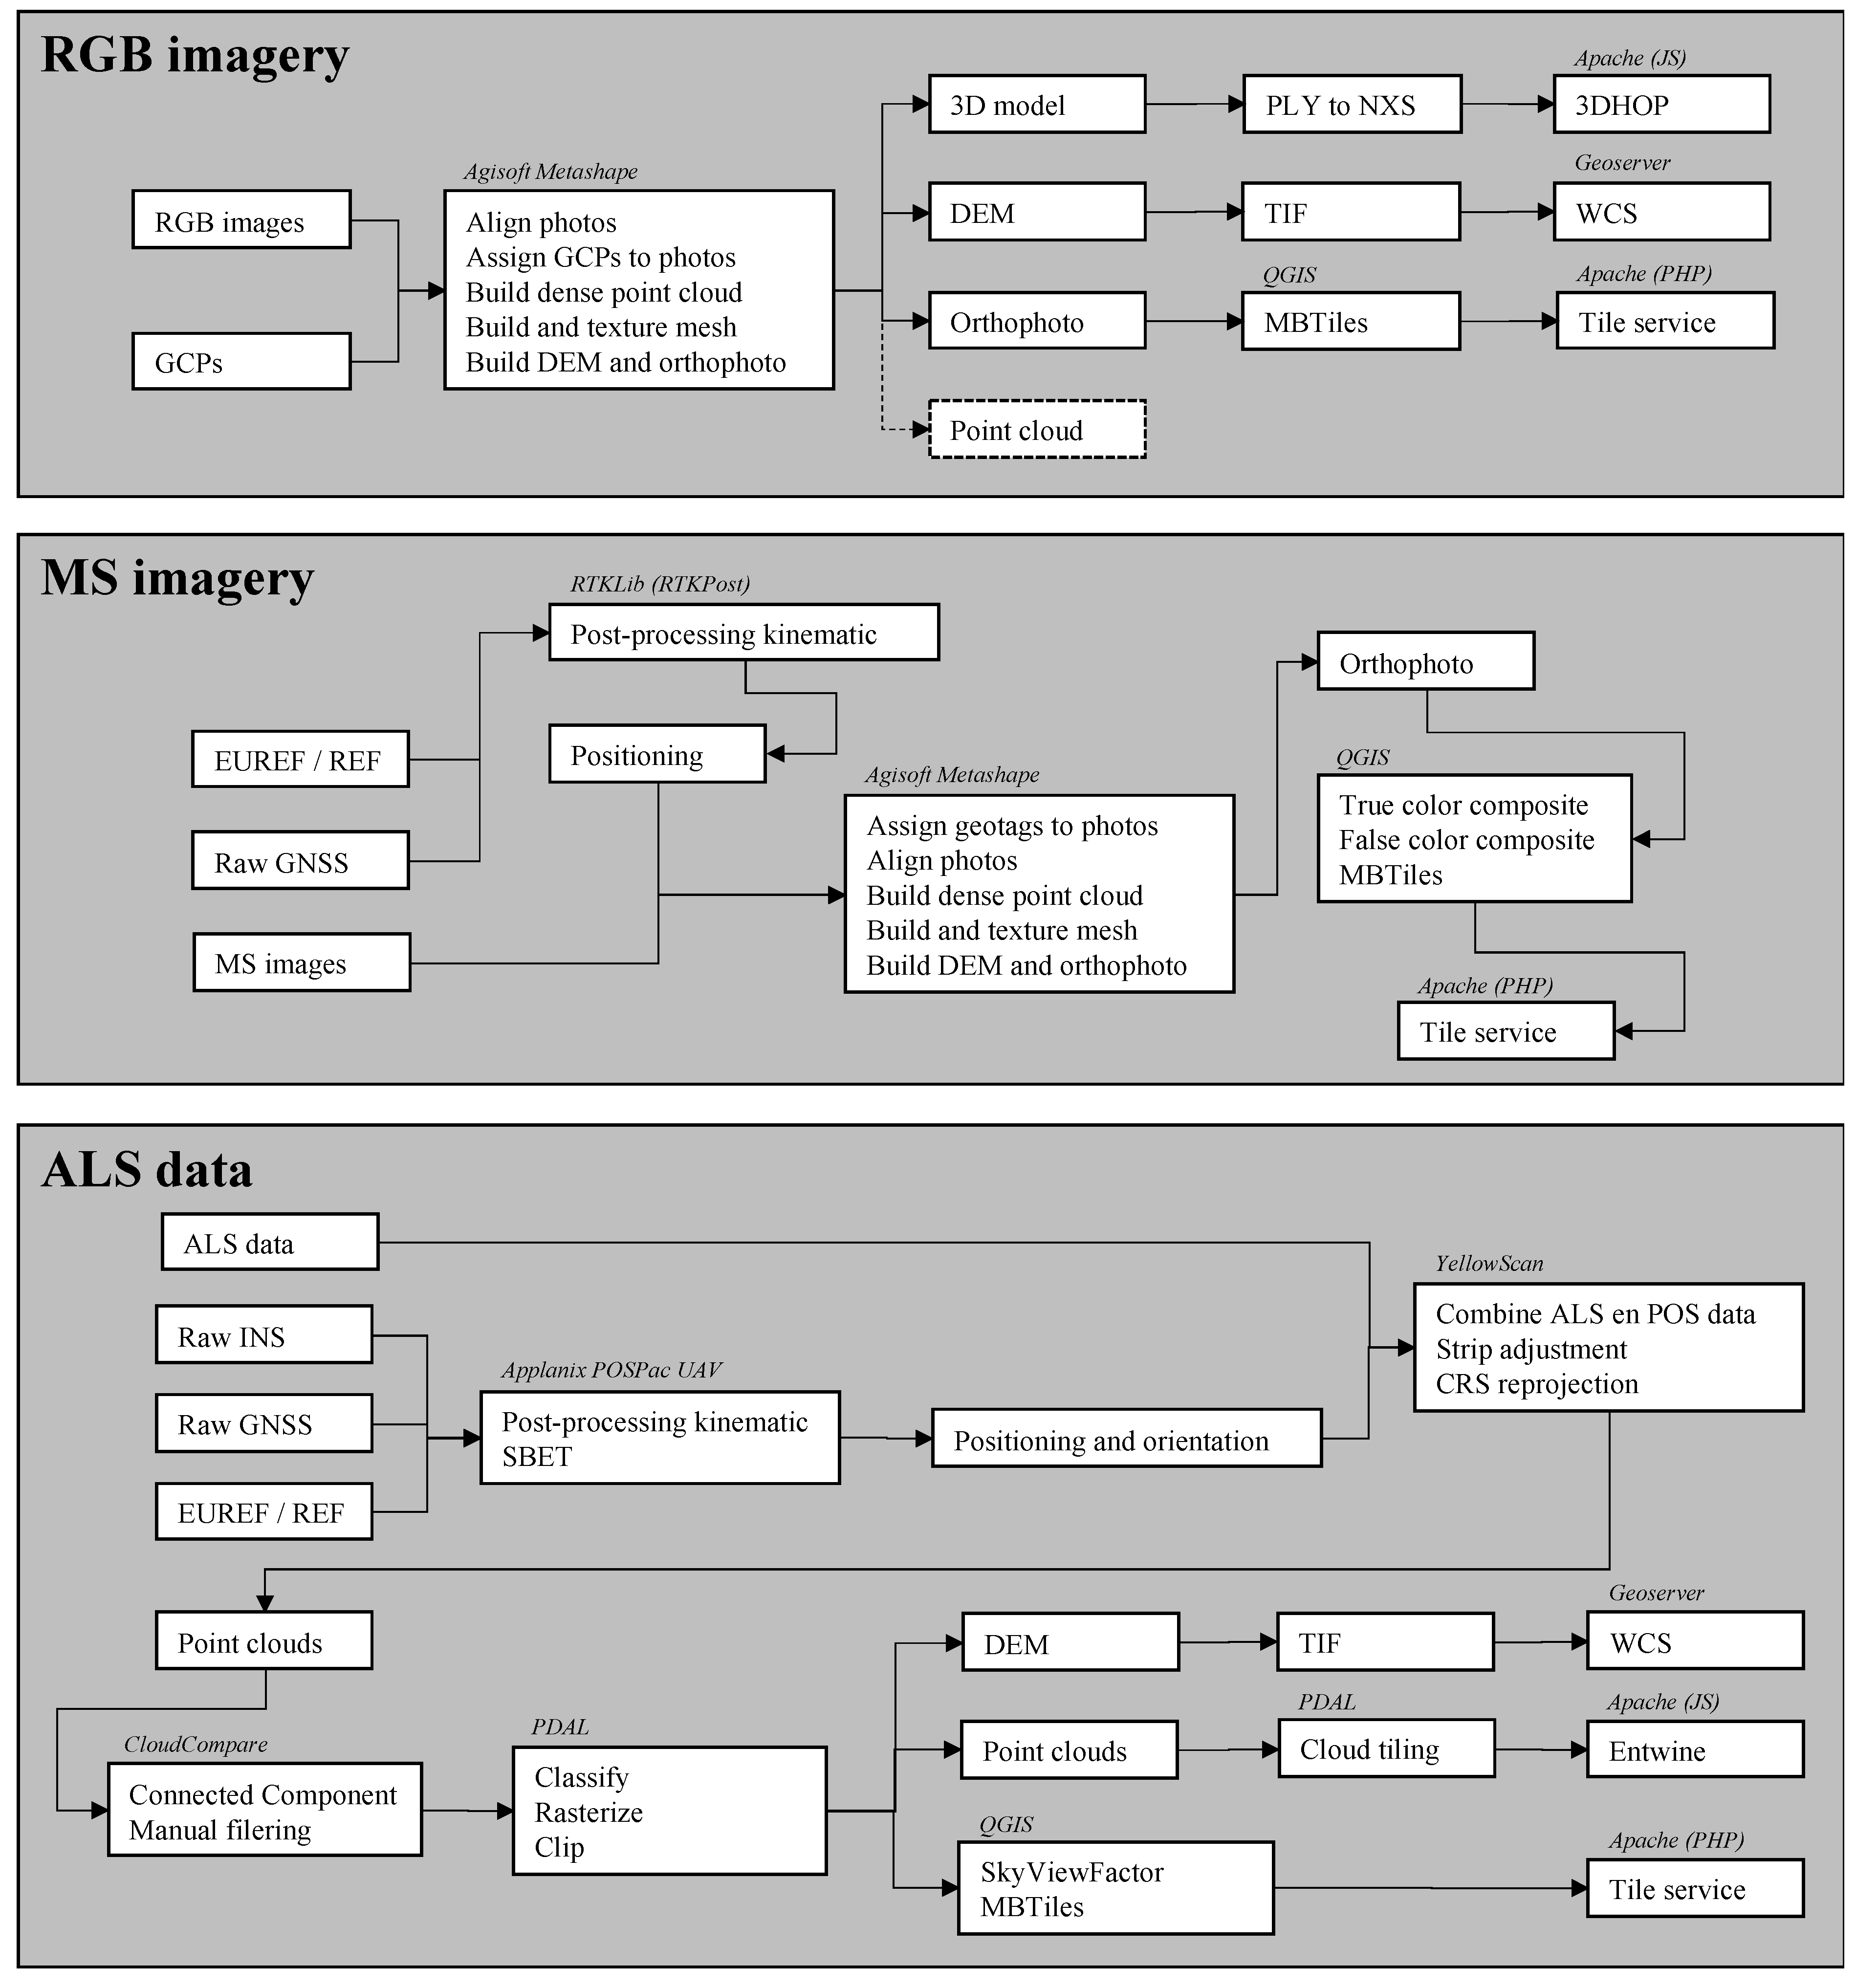
For both the photogrammetric flights, as well as for the ALS flights, specialised flight planning software is used. Depending on the system, software developed by DJI (DJI Pilot; Figure 5 top) or Quantum Systems (QBase; Figure 5 bottom) is used. Among other things, the user is requested to define a study area, image overlap or strip overlap, and ground sampling distance or point density for photogrammetric and ALS flights, respectively. In combination with the knowledge of the used sensors and more specific data acquisition parameters, this software gives useful insight into the coverage of the different sensors and platforms.
In all cases, clearance of the study area by the local aviation authorities should be taken into account. Furthermore, the flying height is limited to 120 m AGL for European flights, including the flights in Romania. Otherwise, special licenses for the pilot and prior permission are required. Given the advised operational height of 100 m AGL for the Qube 240 ALS system, this regulated maximum altitude does not play a sizeable restrictive role in data acquisition. However, for image-based data acquisition, this constraint can be a limiting factor for the coverage of a larger area where a relatively low GSD is acceptable.
Based on the specifications, a maximum flight time of 25 min is considered for the DJI Mavic 2 Pro and the DJI Phantom Multispectral. For the ALS platform, the maximum operation time is limited to 60 min. Given these values, combined with other values from the specifications, a theoretical comparison can be made between the different systems regarding the covered area and GSD or point density. For this comparison, two rectangular study areas of 1 × 1 km and 250 × 250 m are considered, situated at the site of Gumelnița. The extent of this area is imported into the various autopilot software as a KML file, where a flight plan is calculated for 80 m, 100 m, and 120 m, using the default settings for the systems (e.g., 80% and 70% frontal and side overlap, respectively, for the image sensors, and 30% strip overlap for the ALS sensor). For image acquisition, the speed is set to 2.5 m/s for all cases. The results are presented in Table 2 for both the 1 × 1 km (top) and the 250 × 250 m (bottom) test sites.
Based on these data, it seems evident that the ALS system is beneficial for the topographic mapping of large areas at relatively low flying heights. According to the specifications of the Trinity 90+ and Qube 240, the minimal flying altitude of the platform is limited to 40 m. ALS flights at this height will result in a point density of 240 pts/m2, which is, therefore, the maximal point density obtained by the system. This value is lower than the GSD of 1.0 cm and 2.2 cm when using the DJI Mavic 2 Pro and the DJI Phantom 4 MS, respectively. In contrast, the coverage of large areas using image-based systems is time-consuming and requires many additional batteries. For study areas where the maximum operational flying height is unconstrained or at least less constrained, more similar results will be obtained for this comparison. For example, at a flying altitude of 395 m AGL, a GSD of 10.0 cm can be obtained using the DJI Mavic 2 Pro, which is similar to the point density obtained at 90 m with the Trinity 90+ platform, and the Qube 240 ALS sensor might be considered inefficient. In that case, a study area of 1 × 1 km can be accomplished using three batteries.

4. Data Processing

The different data processing workflows are presented in Figure 6 and are discussed in more detail in the following sections.

4.1. Georeferencing UAV Images

The DJI Mavic 2 Pro does not contain an advanced system for registering high-quality GNSS data. As a result, a series of GCPs must be measured on-site using topographic equipment. Black-and-white targets have been plotted on a series of plastic fabrics scattered over the area to be documented before the flights take place. Depending on the availability of the hardware, these GCPs are measured using either a GNSS (Leica GS12) or a total station (Leica TS06). These points are used as reference points to obtain absolute 3D geo-referencing of the model. These control points are essential in order to be able to test the accuracy of the model [48]. This approach reduces the absolute error from typically a few meters to a few centimetres.
In contrast with the RGB images, the DJI Phantom 4 MS can use the raw RINEX data and a separate file with a time stamp for each image obtained during the image acquisition. These data allow the correction of the standard geotags of the images with an accuracy of a few centimetres using reference data. These reference data can be extracted from a GNSS reference station (e.g., a national implementation of a kinematic GNSS network such as FLEPOS, or an international implementation such as EUREF). Another option is the use of GNSS data acquired with an on-site reference station. In both cases, the reference station coordinates are required in a known coordinate reference system (CRS). The correction of the GNSS data acquired from the platform using PPK will minimise errors caused by ionospheric and tropospheric aberrations of the speed of light. In addition, if the time between the data acquisition and the data processing is extended by a few days, clock errors and corrections of the satellite ephemerides can be considered [49].
For this study, the position of each photo is calculated using a post-processed kinematic (PPK) based on reference data provided by EUREF. For the sites in the Danube Plains, the reference station at Bucharest is situated at 50 to 70 km, which is still acceptable under the assumption of similar meteorological conditions [50]. The coordinates of this station are obtained, and GNSS observation and navigation data are downloaded from [51]. These data are combined with the rover data obtained with the UAV using RTKPOST. This open-source program within the RTKLIB suite allows the calculation of accurate GNSS-based points [52]. The result of this procedure is a list of coordinates in WGS’84 with ellipsoidal heights, accompanied by a time stamp and values for the accuracy of each point. The last step is to align the newly generated series of coordinates with the file with time stamps for each image. Since both the camera and GNSS sensor data are not completely temporally coherent, a Python script was created to find the coordinate closest to the capture of a particular image.

4.2. AGISOFT

After acquiring and downloading all UAV-based images, data processing took place using Agisoft Metashape [53]. This commercial SfM-MVS-based 3D modelling software is frequently used in comparative research [4,7,54]. The software semi-automatically processes the photographs to produce a 3D reconstruction of the images. More details on the processing steps and parameters to take into consideration are presented by Verhoeven (2011). By default, the software used the geotags available in the images in WGS’84. However, it should be mentioned that, in accordance with the previous section, images from the Mavic 2 Pro are georeferenced using topographically measured GCPs. First, the coordinates of these points are manually assigned to the corresponding pixels. Then, the corrected geotags are directly assigned to the correct image within the software for the multispectral imagery. Next to textured 3D models that can be used in dedicated software (e.g., Meshlab) or web viewers (e.g., SketchFab), the data processing results in a series of conventional orthophotos and DEMs. This orthophoto provides a multi-band image made from multispectral data that enables the production of numerous composites. All data are exported in the Romanian Pulkovo 1942(58)-Stereo70 coordinate reference system (EPSG:3844) [55]. In existing cases, the elevations are converted from ellipsoidal heights to Romanian orthometric heights using offsets obtained from the Romanian geoid model (ROvT4).

4.3. ALS

The ALS data processing contains three steps. At first, the GNSS readings from the sensor on board the platform should be corrected based on reference data using post-processed kinematic (PPK). Then, the GNSS data for the ALS are processed following the same methodology as the MS data, as described above.
The second step of the data post-processing encompasses the calculation of the Smooth Best Estimated Trajectory (SBET) using the corrected GNSS data and INS readings. The implemented algorithm allows the estimation of the position and orientation of the ALS sensor at any moment during the data acquisition. Since the sensor measures points in an intrinsically local coordinate system, the SBET is required as a starting condition for further post-processing steps.
The third step comprises the actual extraction of a point cloud using the previously calculated SBET and the raw ALS data. Initially, each local origin of a specific laser scanning swath is assigned to the corresponding SBET position and orientation. Then, distances between neighbouring strips are minimised using an iterative strip adjustment algorithm. After applying this technique, the mean distance between points in consecutive strips is typically limited to less than a decimetre. Individual points in the resulting optimised point cloud can optionally be classified into ground points and non-ground points (vegetation, buildings, etc.). Furthermore, digital elevation models (digital surface and digital terrain models) can be extracted with a given resolution. It is also possible to export the processed point clouds in the LAS file format.
For our study, Applanix POSPac UAV software was used for the GNSS and INS data processing. For ALS data processing, YellowScan was used. As with the image-based data, the ALS data are projected in the Pulkovo 1942(58)-Stereo70 coordinate reference system (EPSG:3844) [55]. In addition, ellipsoidal elevations are converted to orthometric heights using the ROvt4 geoidal model. Thus, it is assumed that all data are spatially coherent. After exporting the point clouds, data cleaning was performed using CloudCompare [56] using automated connected component labelling and manual data filtering.
A DEM was generated for each flight with a resolution of 25 cm using PDAL [57]. Instead of using a conventional interpolator, it was decided to consider the minimum elevation value as a parameter to save in each pixel. Based on these models, an additional raster with the sky view factor (SVF) [58] was generated using SAGA GIS [59]. Since SVF is a frequently used topographic feature enhancement technique, it is handy to visualise archaeological features.

5. Results and Quality Analysis
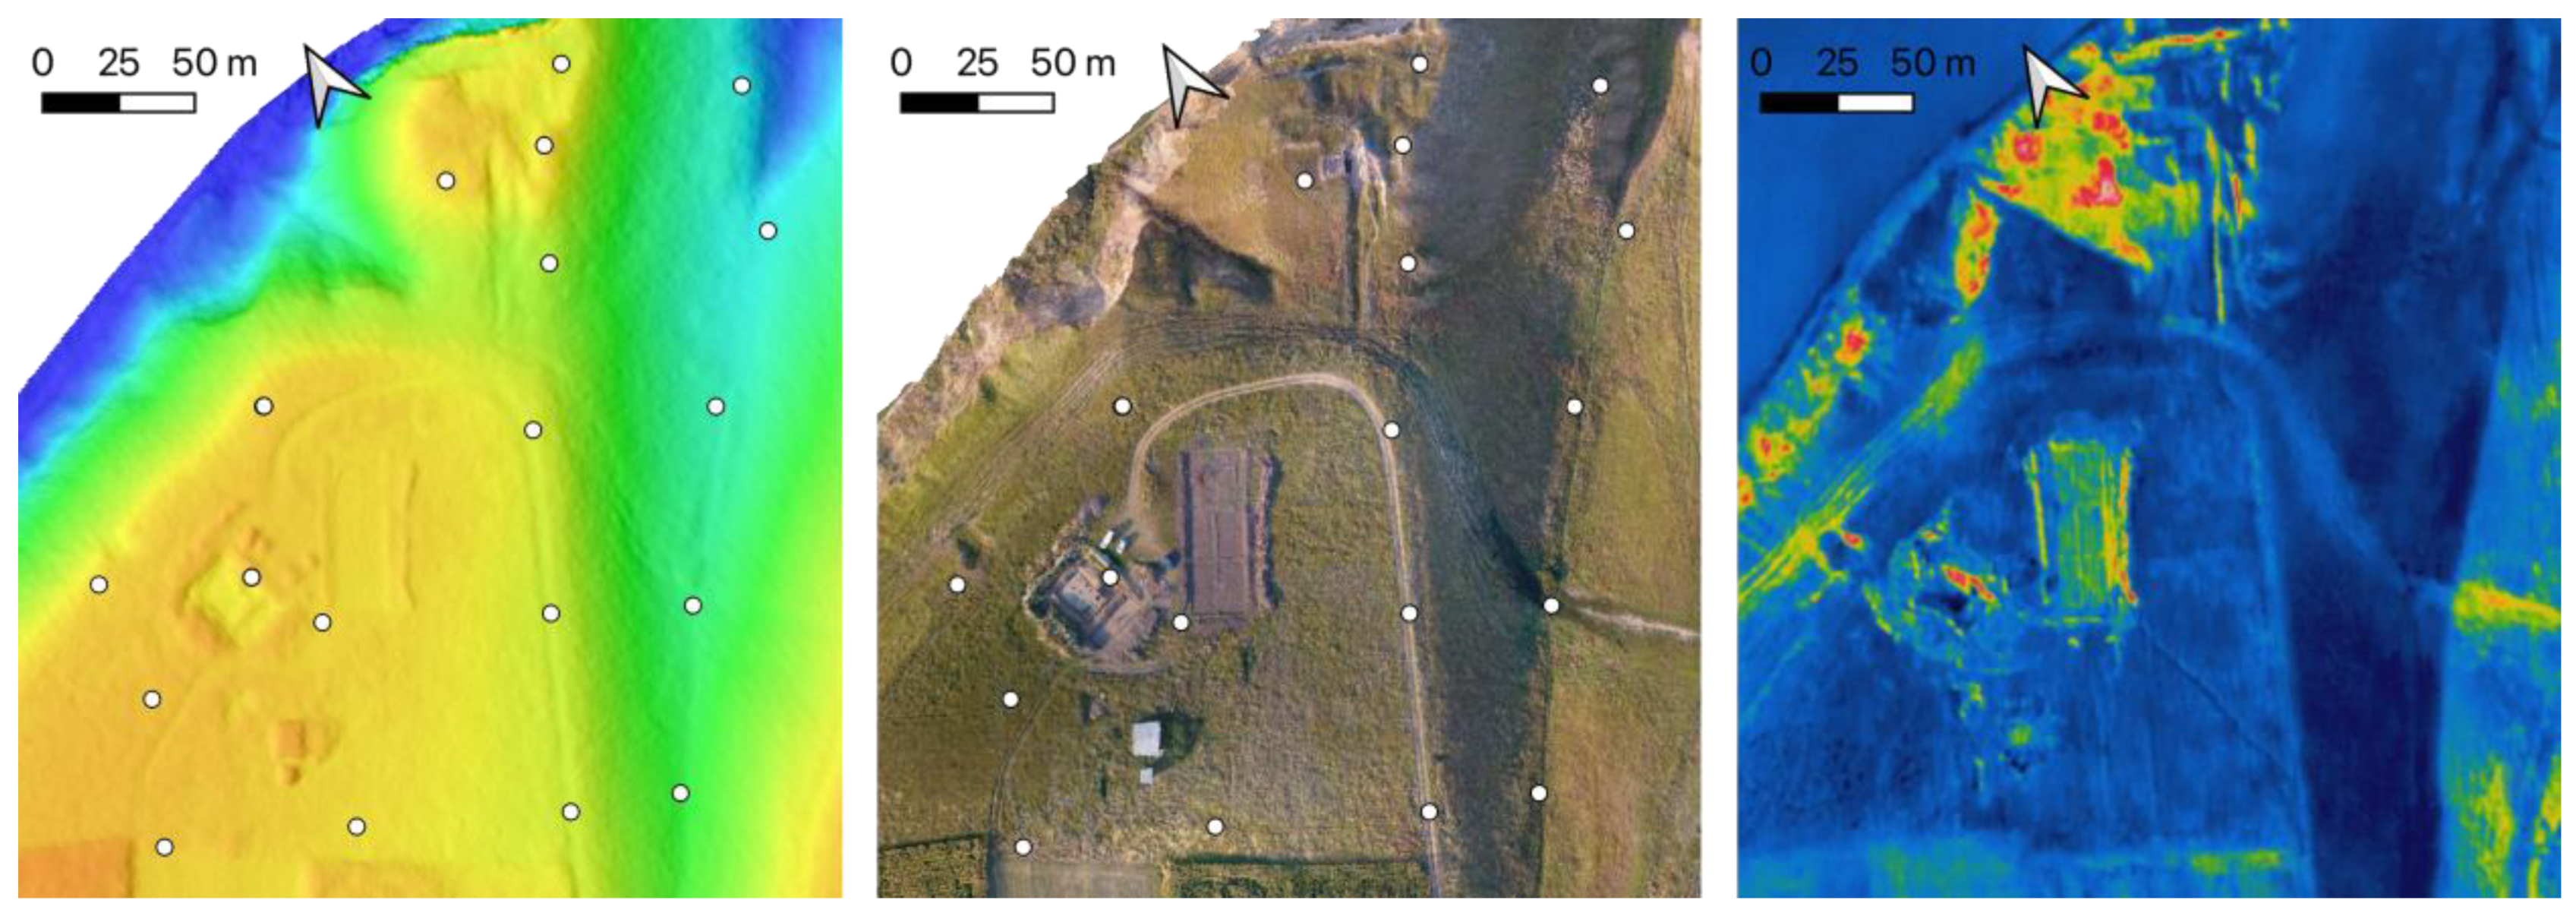
5.1. Sultana

Within the framework of the archaeological fieldwork in the Mostiștea Basin and Danube Valley, many sites have been recorded using airborne image-based 3D modelling in previous years, such as Sultana Malu Roșu, Gumelnița, Ulmeni, Spanțov, Șeinoiu, Măriuța, and so forth. It is worth mentioning that two relatively large areas were covered during the previous campaign in the summer of 2021. In Sultana, an update of the 2018 overview model was generated for the entire plateau containing the tell settlement, the flat settlement, and the acropolis (Figure 7). The flight resulted in a series of photos with a GSD of 2.5 cm, which is also the resolution of the final orthophoto. These data not only allow the documentation of the archaeological fieldwork that took place during the campaign but will also be included in the time series initiated in 2018 to investigate the magnitude of the erosion processes of the cliff.

5.2. Chiselet

Another significant contribution to the project concerns mapping the area around the Chiselet tell settlements in the Danube Valley. An ALS flight was organised to cover an area of approximately 1600 × 2550 m with a point density of 94 points/m2. The result is converted to a rasterised DEM with a resolution of 25 cm. A hillshade of this DEM is presented in Figure 8 left. The multispectral sensor also covers the same area, which allowed the calculation of true and false colour composites, as discussed earlier. An example of such a false colour composite is presented in Figure 8 right. The hillshade map and the false colour composite cover the plane east of the settlement and reveal some old river channels presented in the area before systematic cultivation in the last century. Thus, these data are used to put the archaeological site in a larger spatial and historical context, which will be helpful for future research (e.g., extending the results presented by Covataru et al. [15]).
The tell settlement has also been covered by a series of images with a GSD of less than 2 cm (Figure 9). For completeness, an illustrative cross-section was added to this figure, demonstrating a simple example of the usage of these DEMs. As with other flights for this project, an extensive series of GCP have been measured in the area, facilitating the spatial alignment of the different flights and the georeferencing of the data in the Pulkovo 1942(58)-Stereo70 coordinate reference system (EPSG:3844).

5.3. Overview of the Obtained Data

An overview of the various flights that will be considered for publication in the next section is presented in Table 3.

5.4. Quality Analysis

5.4.1. ANOVA Using Checkpoints

The quality of the different elevation models is assessed using a series of 96 checkpoints, which are measured using RTK GNSS at the site of Chiselet. One of these points corresponds to the geodetic reference point located on the top of the tell settlement. To minimise the effect of different implementations of the geoid model, resulting in a possible offset of the altitudes, all altitudes are corrected as a function of this geodetic point. The accuracy of the checkpoints is 0.03 m, which is higher than the theoretical accuracy of the image-based DEMs, as well as the ALS-based DEM.
The corresponding elevations from the different DEMs are extracted for each checkpoint using the point sampling tool in QGIS. The resulting values are evaluated using a one-way analysis of variance (ANOVA) [60] using JASP [61,62]. In order to perform the ANOVA, homogeneity of variances between the dataset should be assumed. This assumption is tested by calculating Levene’s statistic [63]. The comparison of the variances using JASP results gives (0.05 < p < 0.92), which states the assumption of homogeneity of variance. The use of ANOVA is, therefore, fully justified.
According to the null hypothesis (H0), all mean elevation values (μ) of the different datasets are equal. On the other hand, the alternative hypothesis (HA) states that, at least for one dataset, the mean elevation is different from another dataset:
H0: μRTK-GNSS = μRGB = μMS = μALS
and
HA: at least one μ value is different from the rest.
The results of the ANOVA are given in Table 4. Based on the results in the table, the null hypothesis can be accepted with a 95% significance level for each study area. The calculated F-values are smaller than the critical F-values, with a 95% confidence interval. This means that no significant difference can be detected between the checkpoints generated by RTK-GNSS, RGB-based photogrammetry, MS-based photogrammetry, and ALS (0.05 < p < 0.95). In other words, the variance of the different datasets is not significantly different.

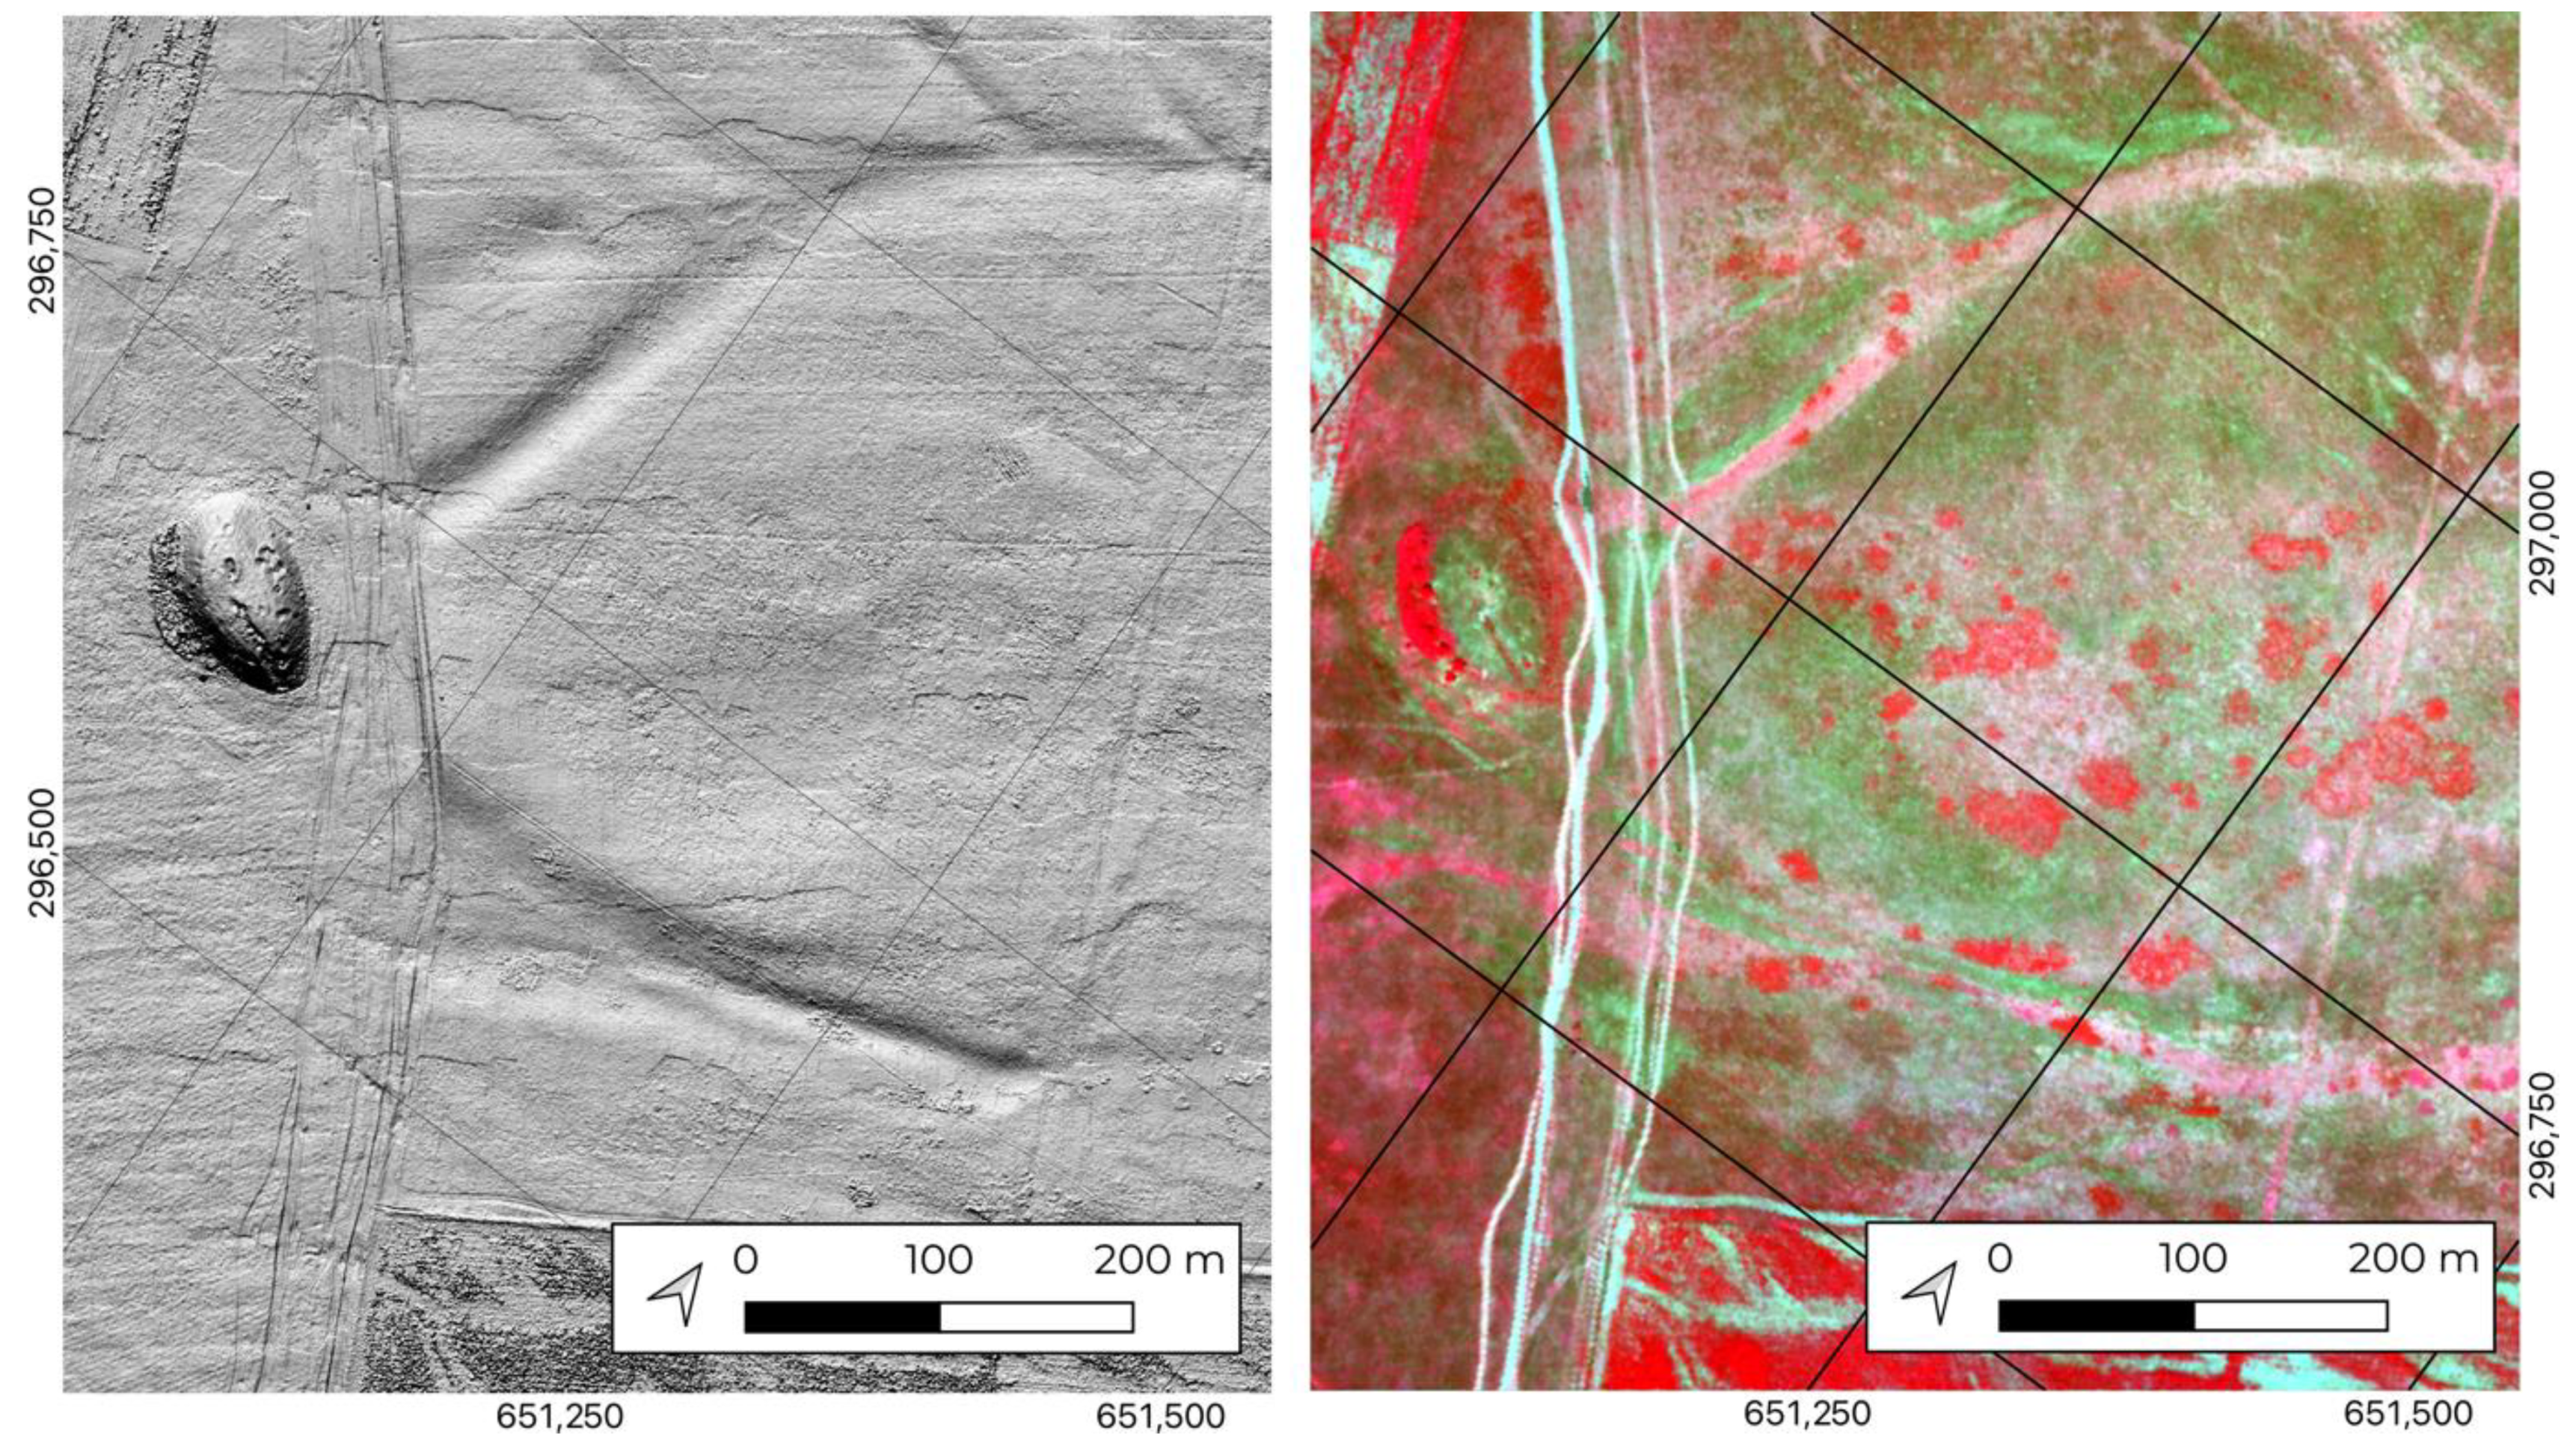
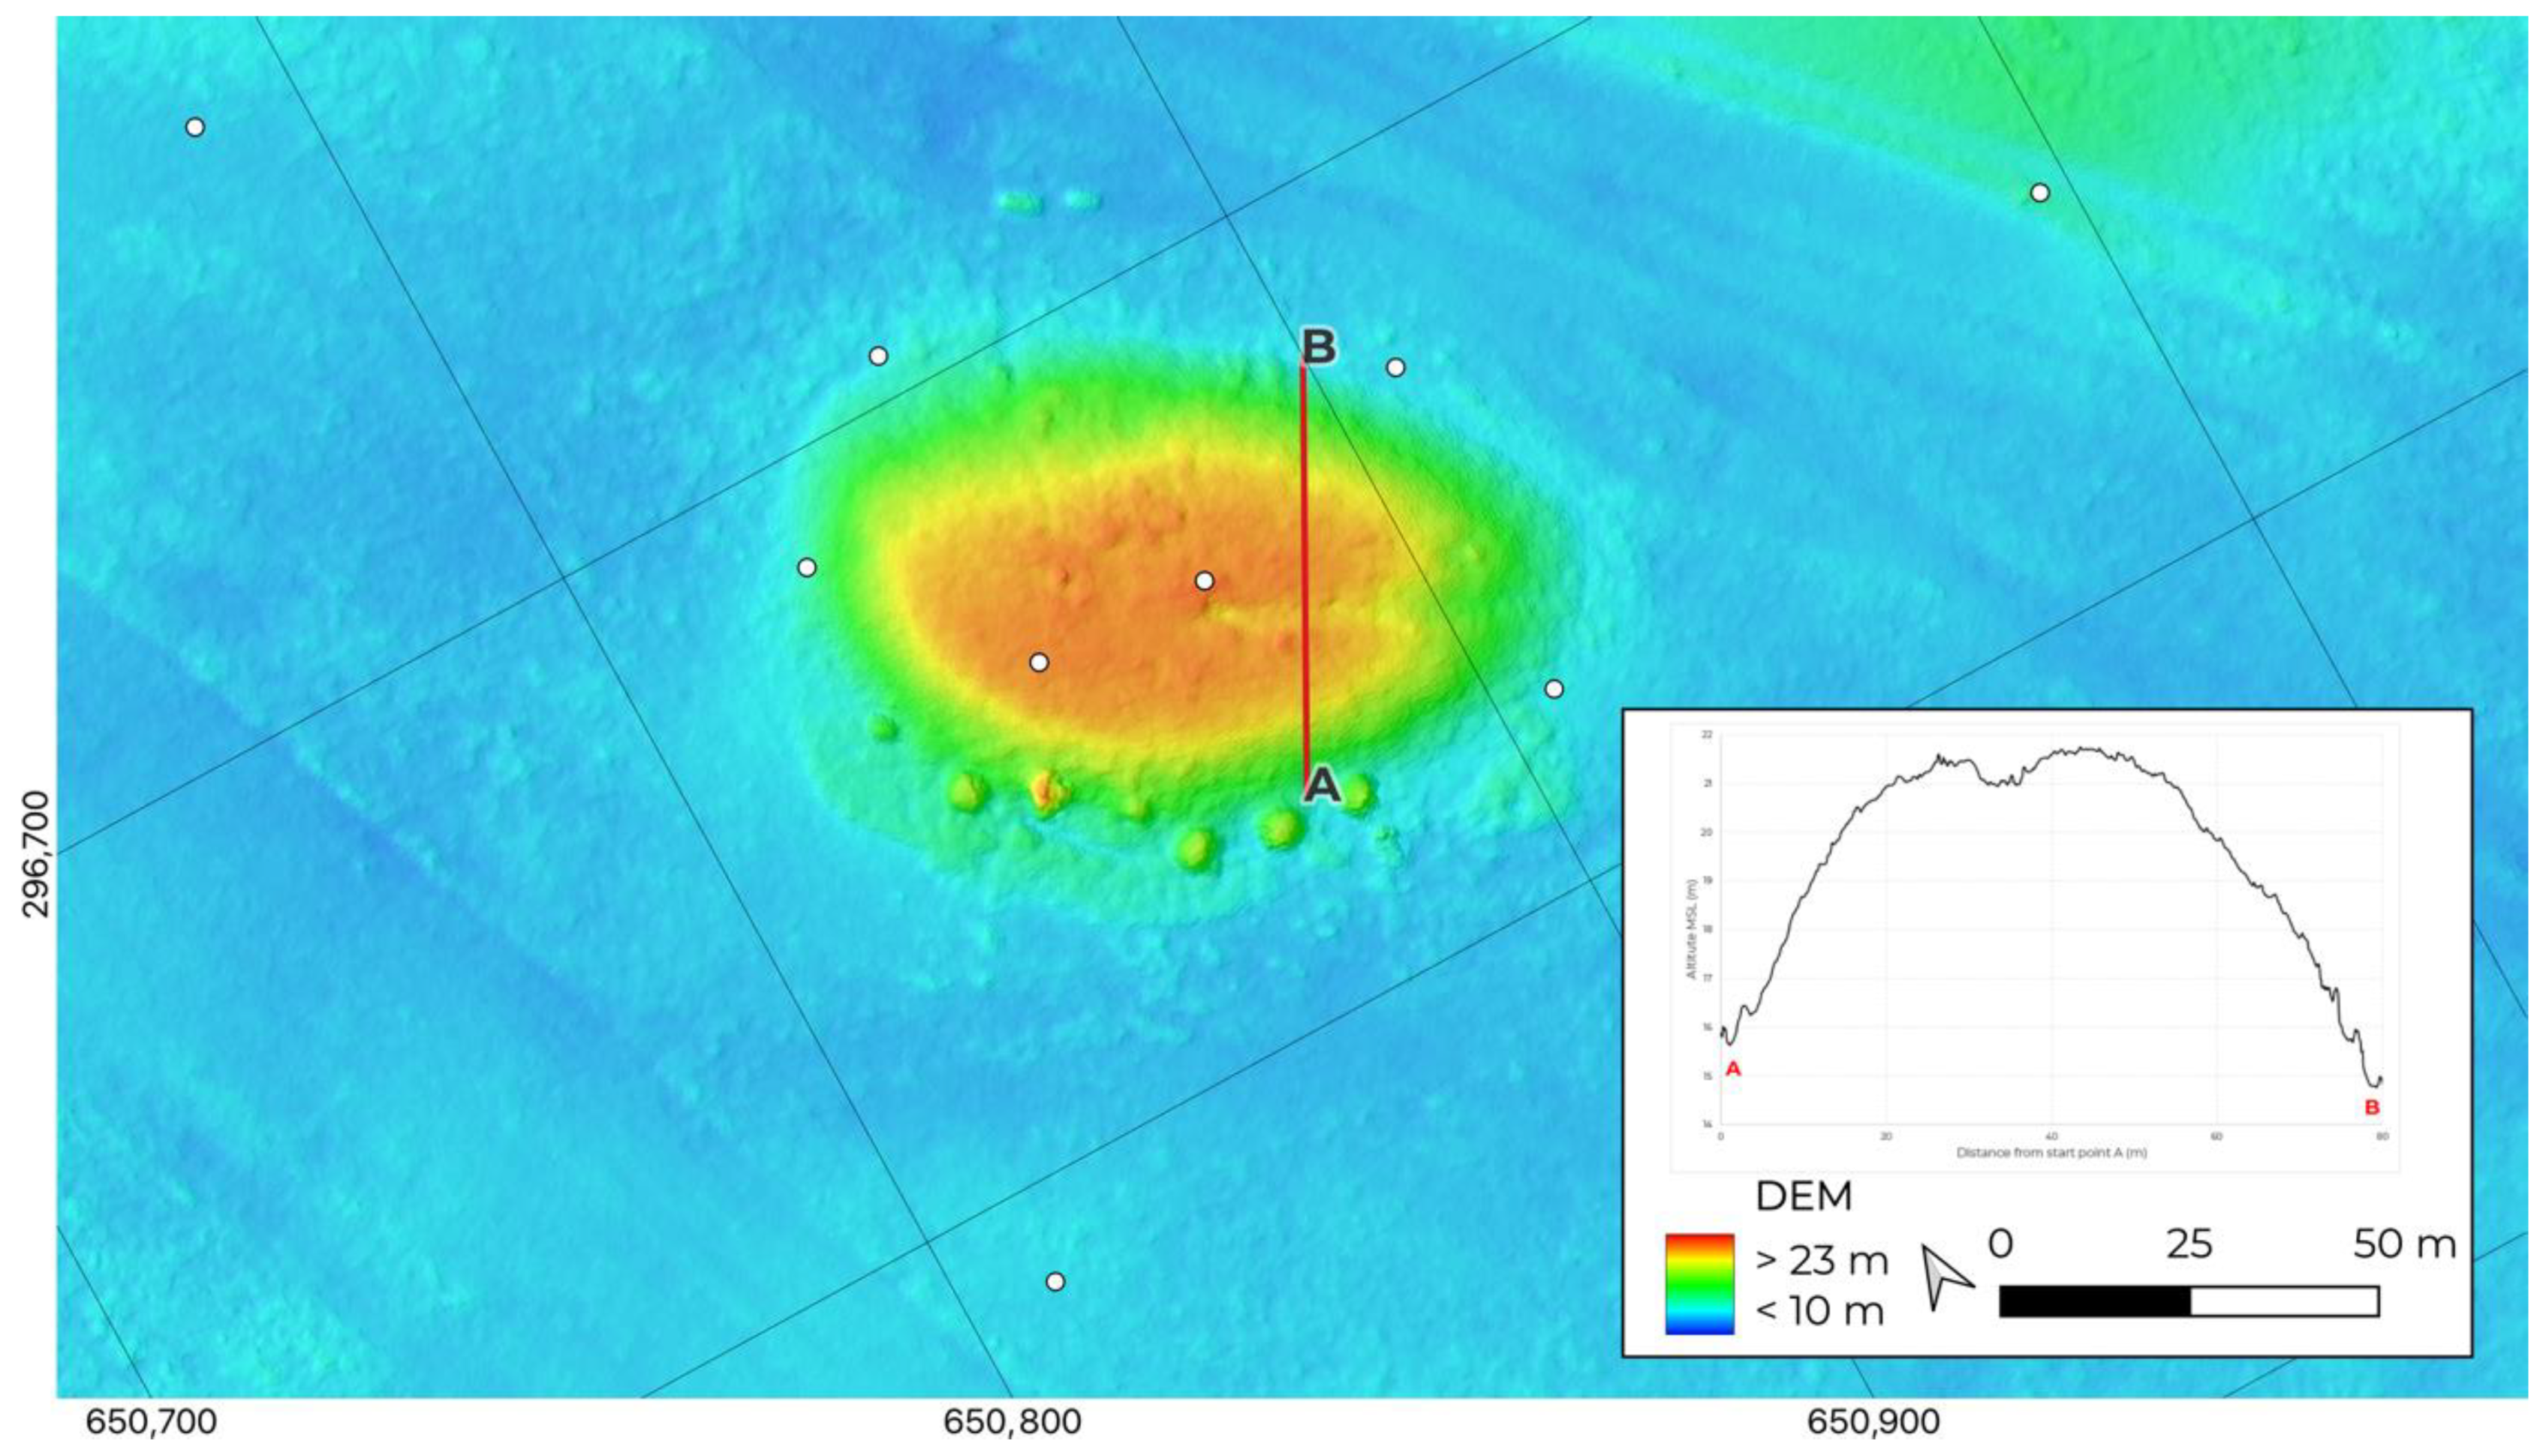
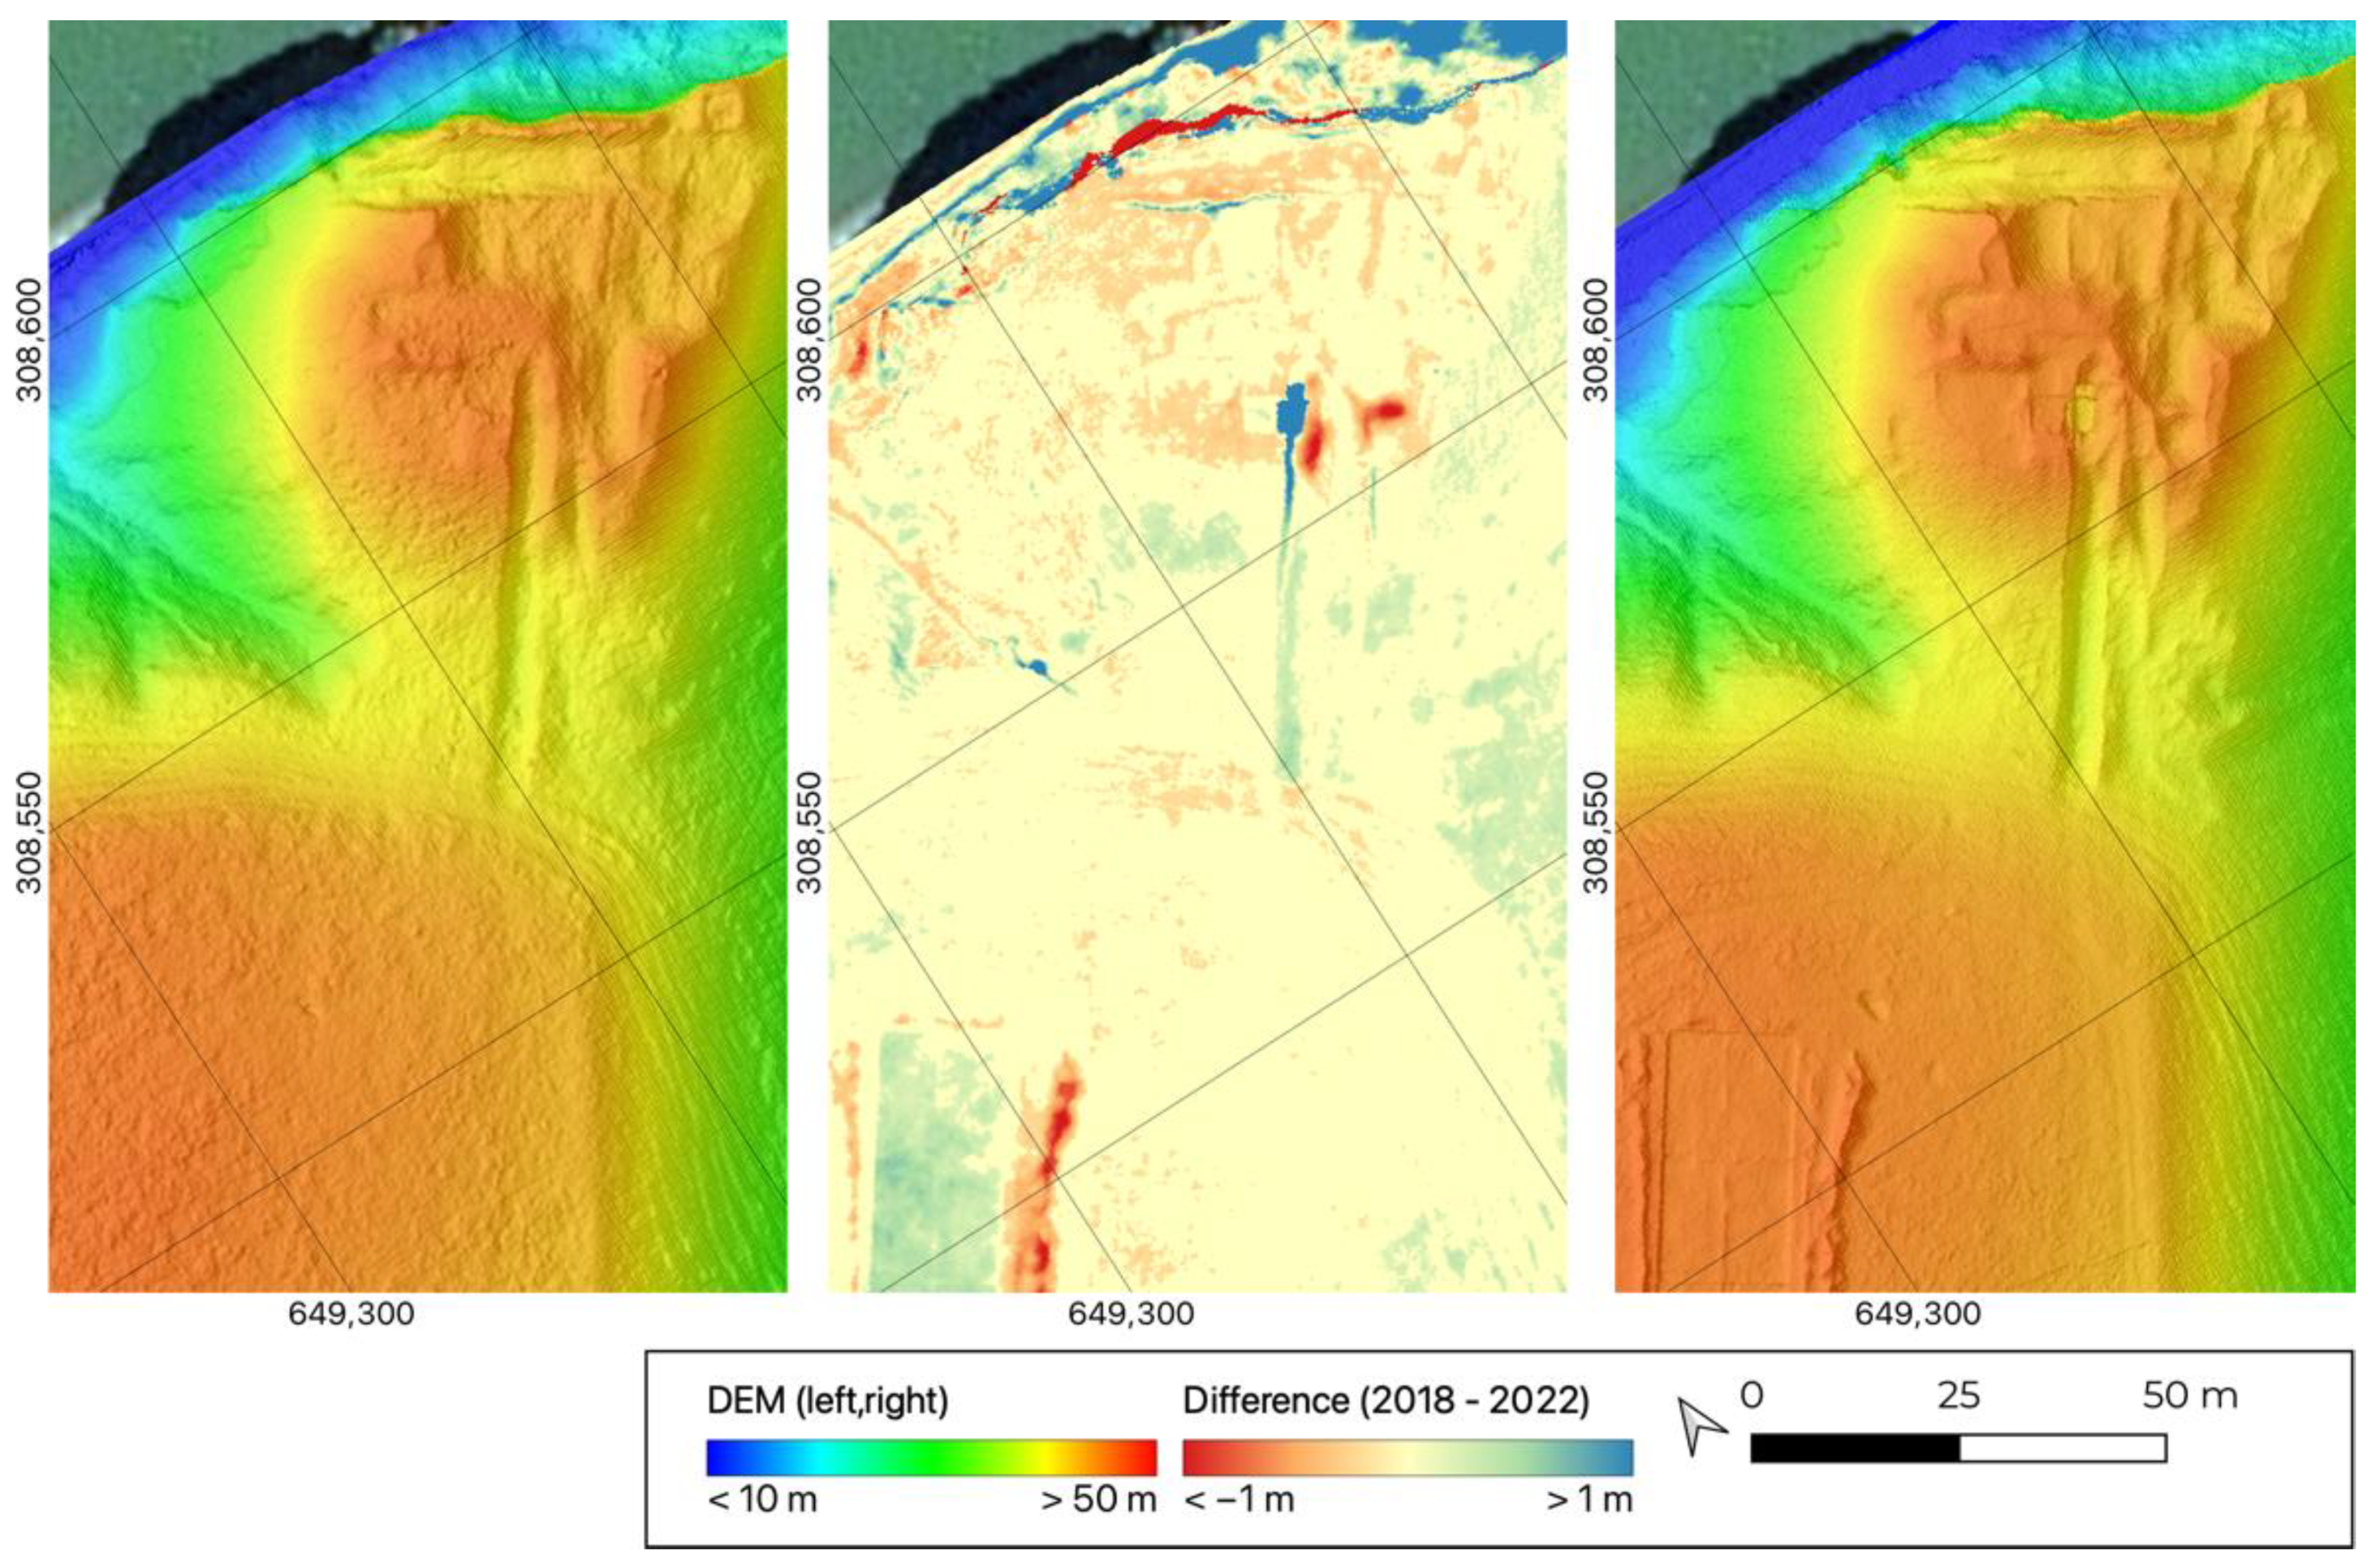
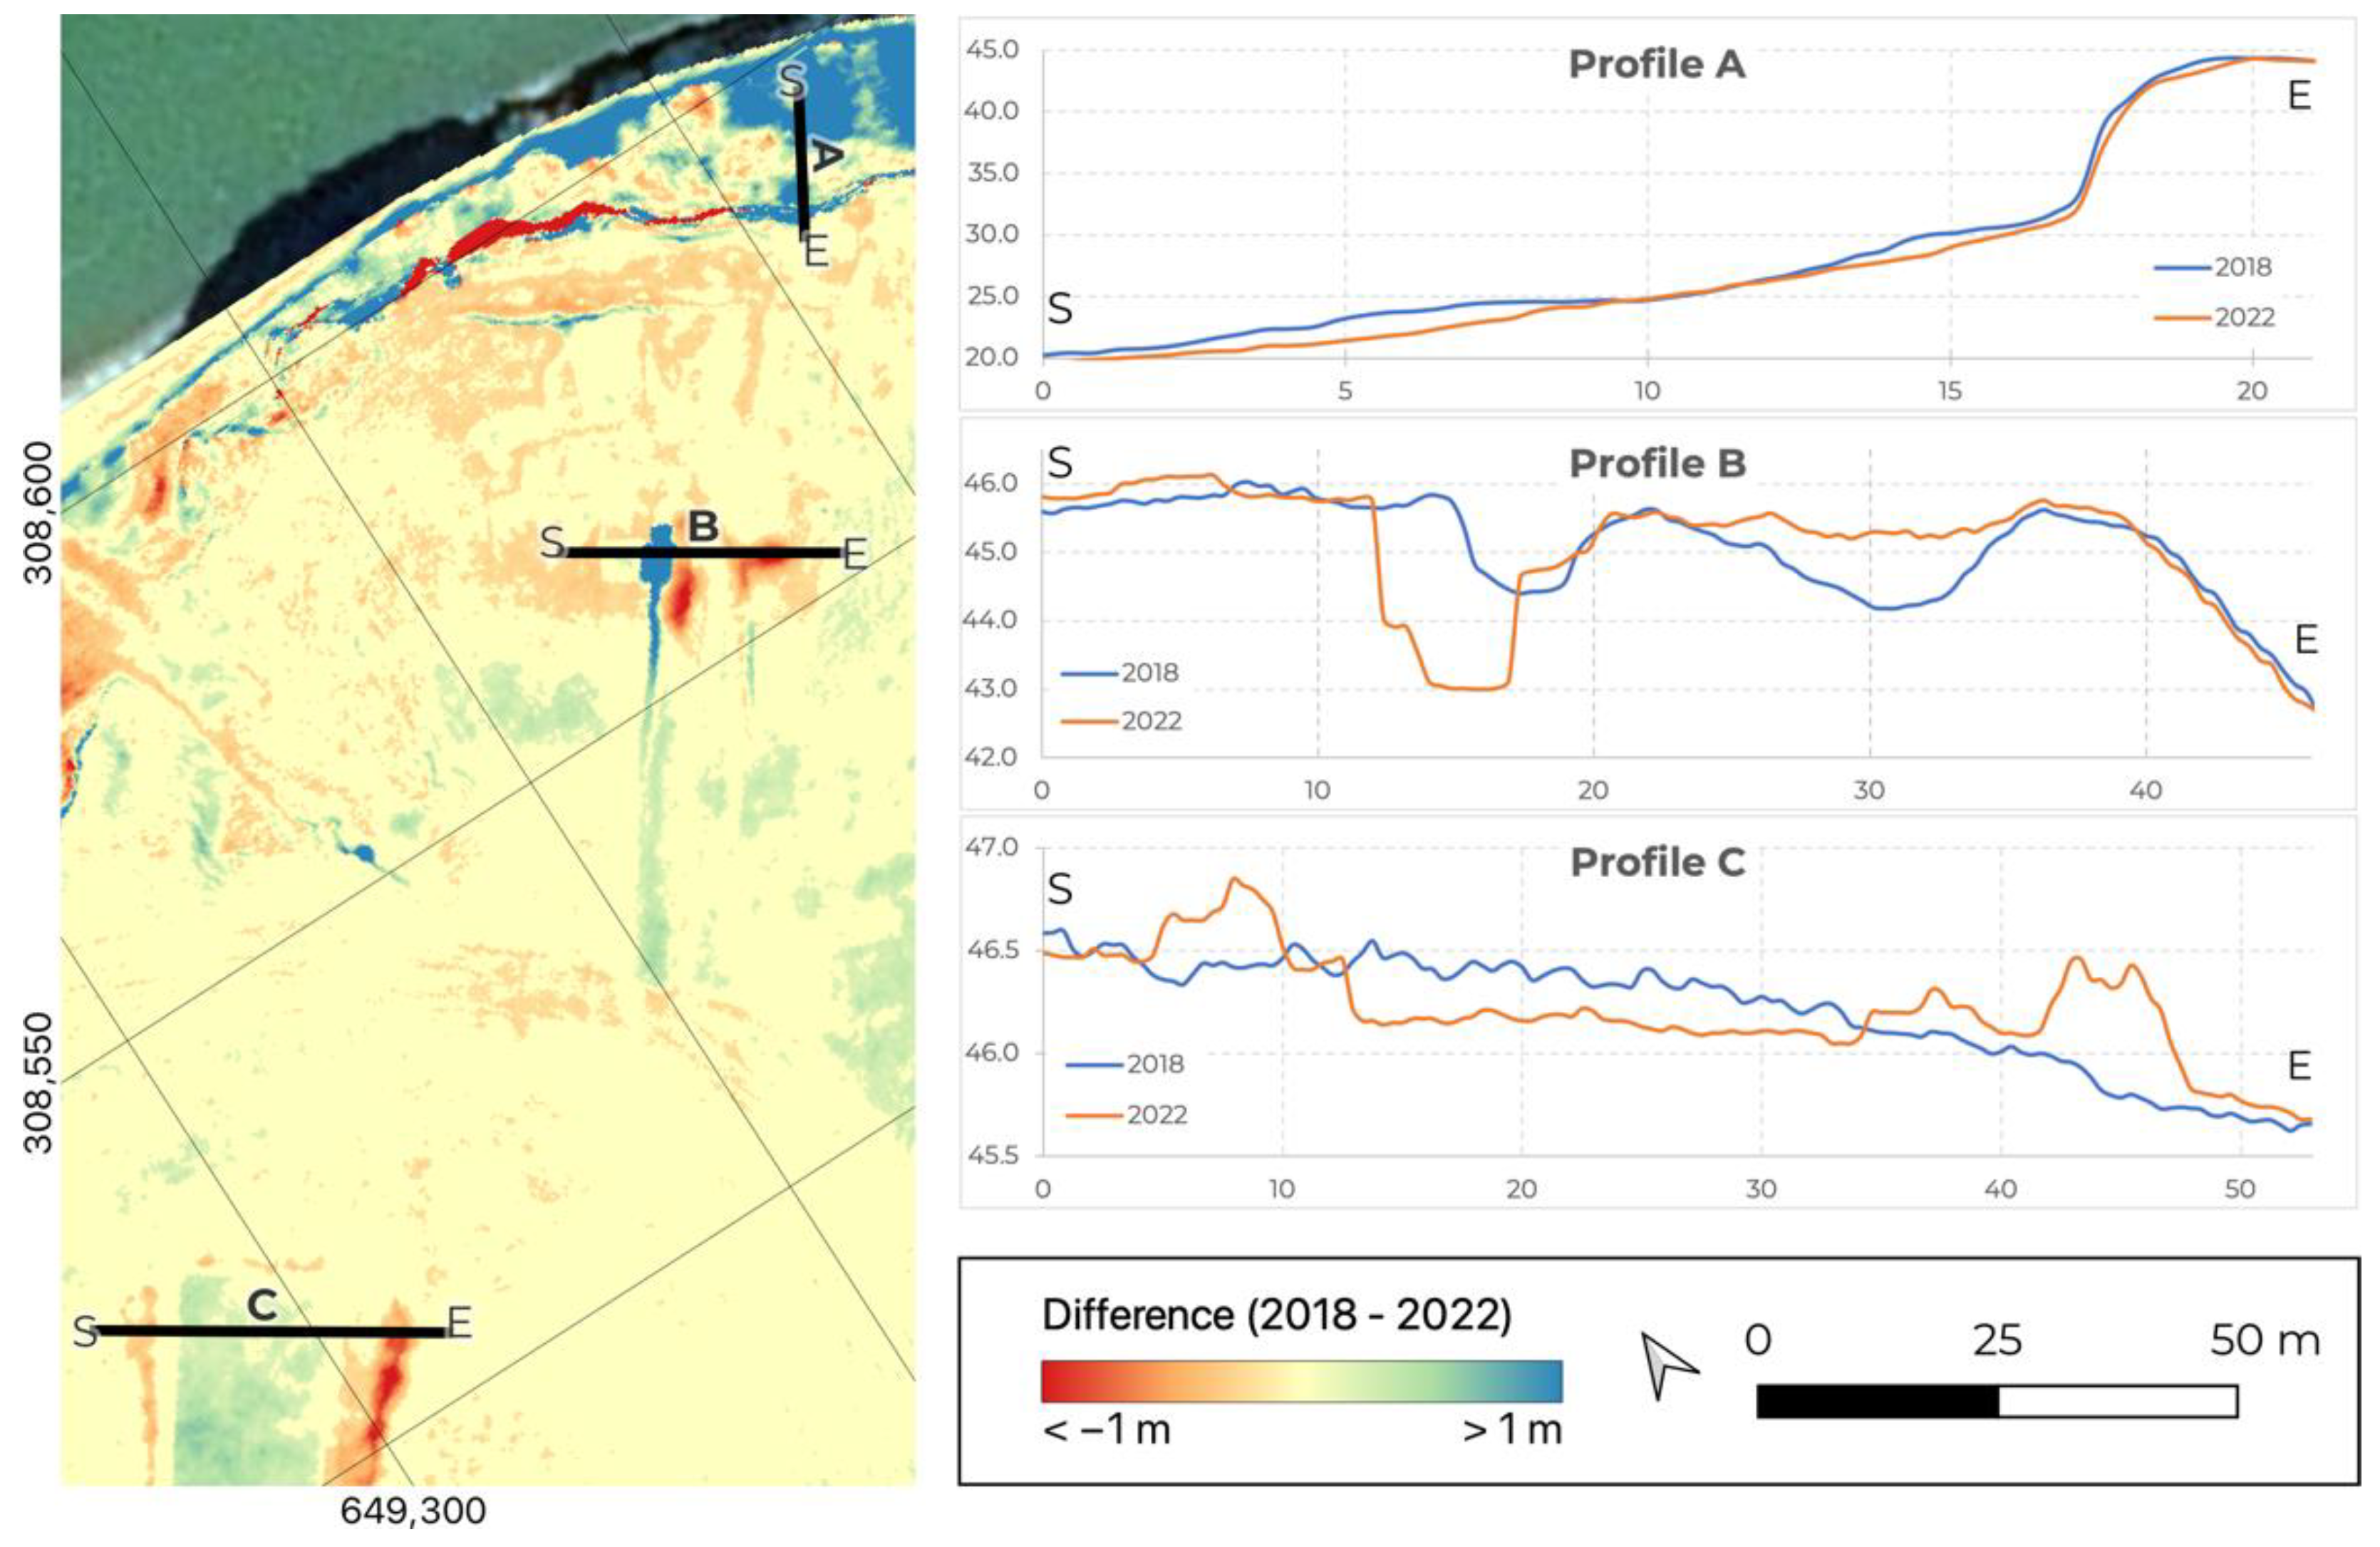
5.4.2. Qualitative Comparative Analysis of DEMs and Time Series Analysis

Assuming that the data are spatially coherent and the variance of the different datasets is not significantly different, DEMs obtained in various years can be used to construct time series. This concept is illustrated by the data obtained at the site of Sultana (Figure 10).
For this analysis, the photogrammetry-based DEM from 2018 is compared with the ALS-based DEM from 2022. Given the registration errors presented in Table 3, a mask is applied to the resulting difference model where the threshold values are based on the minimum level of detection (LoD). These values are calculated using [8]:
LODmin = t (σ21 + σ22)
where σ21 and σ22 correspond to the registration error of the DEMs obtained in 2018 (7.4 cm) and 2022 (5.0 cm), respectively, and where t corresponds to the Student t-values for the required confidence interval (t = 1.96 for 95% confidence interval). As a result, all pixels where the difference is within the interval [−17.5 cm; 17.5 cm] are caused by noise in the model with a 95% confidence interval. These pixels are masked with a yellow colour in Figure 10 and Figure 11. The overall correspondence between the two models can be visually stated, with most pixels being situated within this interval.
Nonetheless, some artifacts are visible in the model, as well. In general, some scattered patches of positive and negative differences can be observed, caused by the absence or presence of new vegetation in the area. For some other exciting features, profiles are presented in Figure 11. Profile A shows a section at the cliff below the site, which is also clearly visible in the 3D model presented in Figure 7. This cliff is heavily affected by erosion processes, endangering the site. Indeed, at this specific location, material loss between 2018 and 2022 can be observed. Profile B and profile C correspond to two excavations organised in the summer of 2021 and 2022, respectively. The trenches (positive difference) and dump areas (negative difference) are visible in these two profiles.

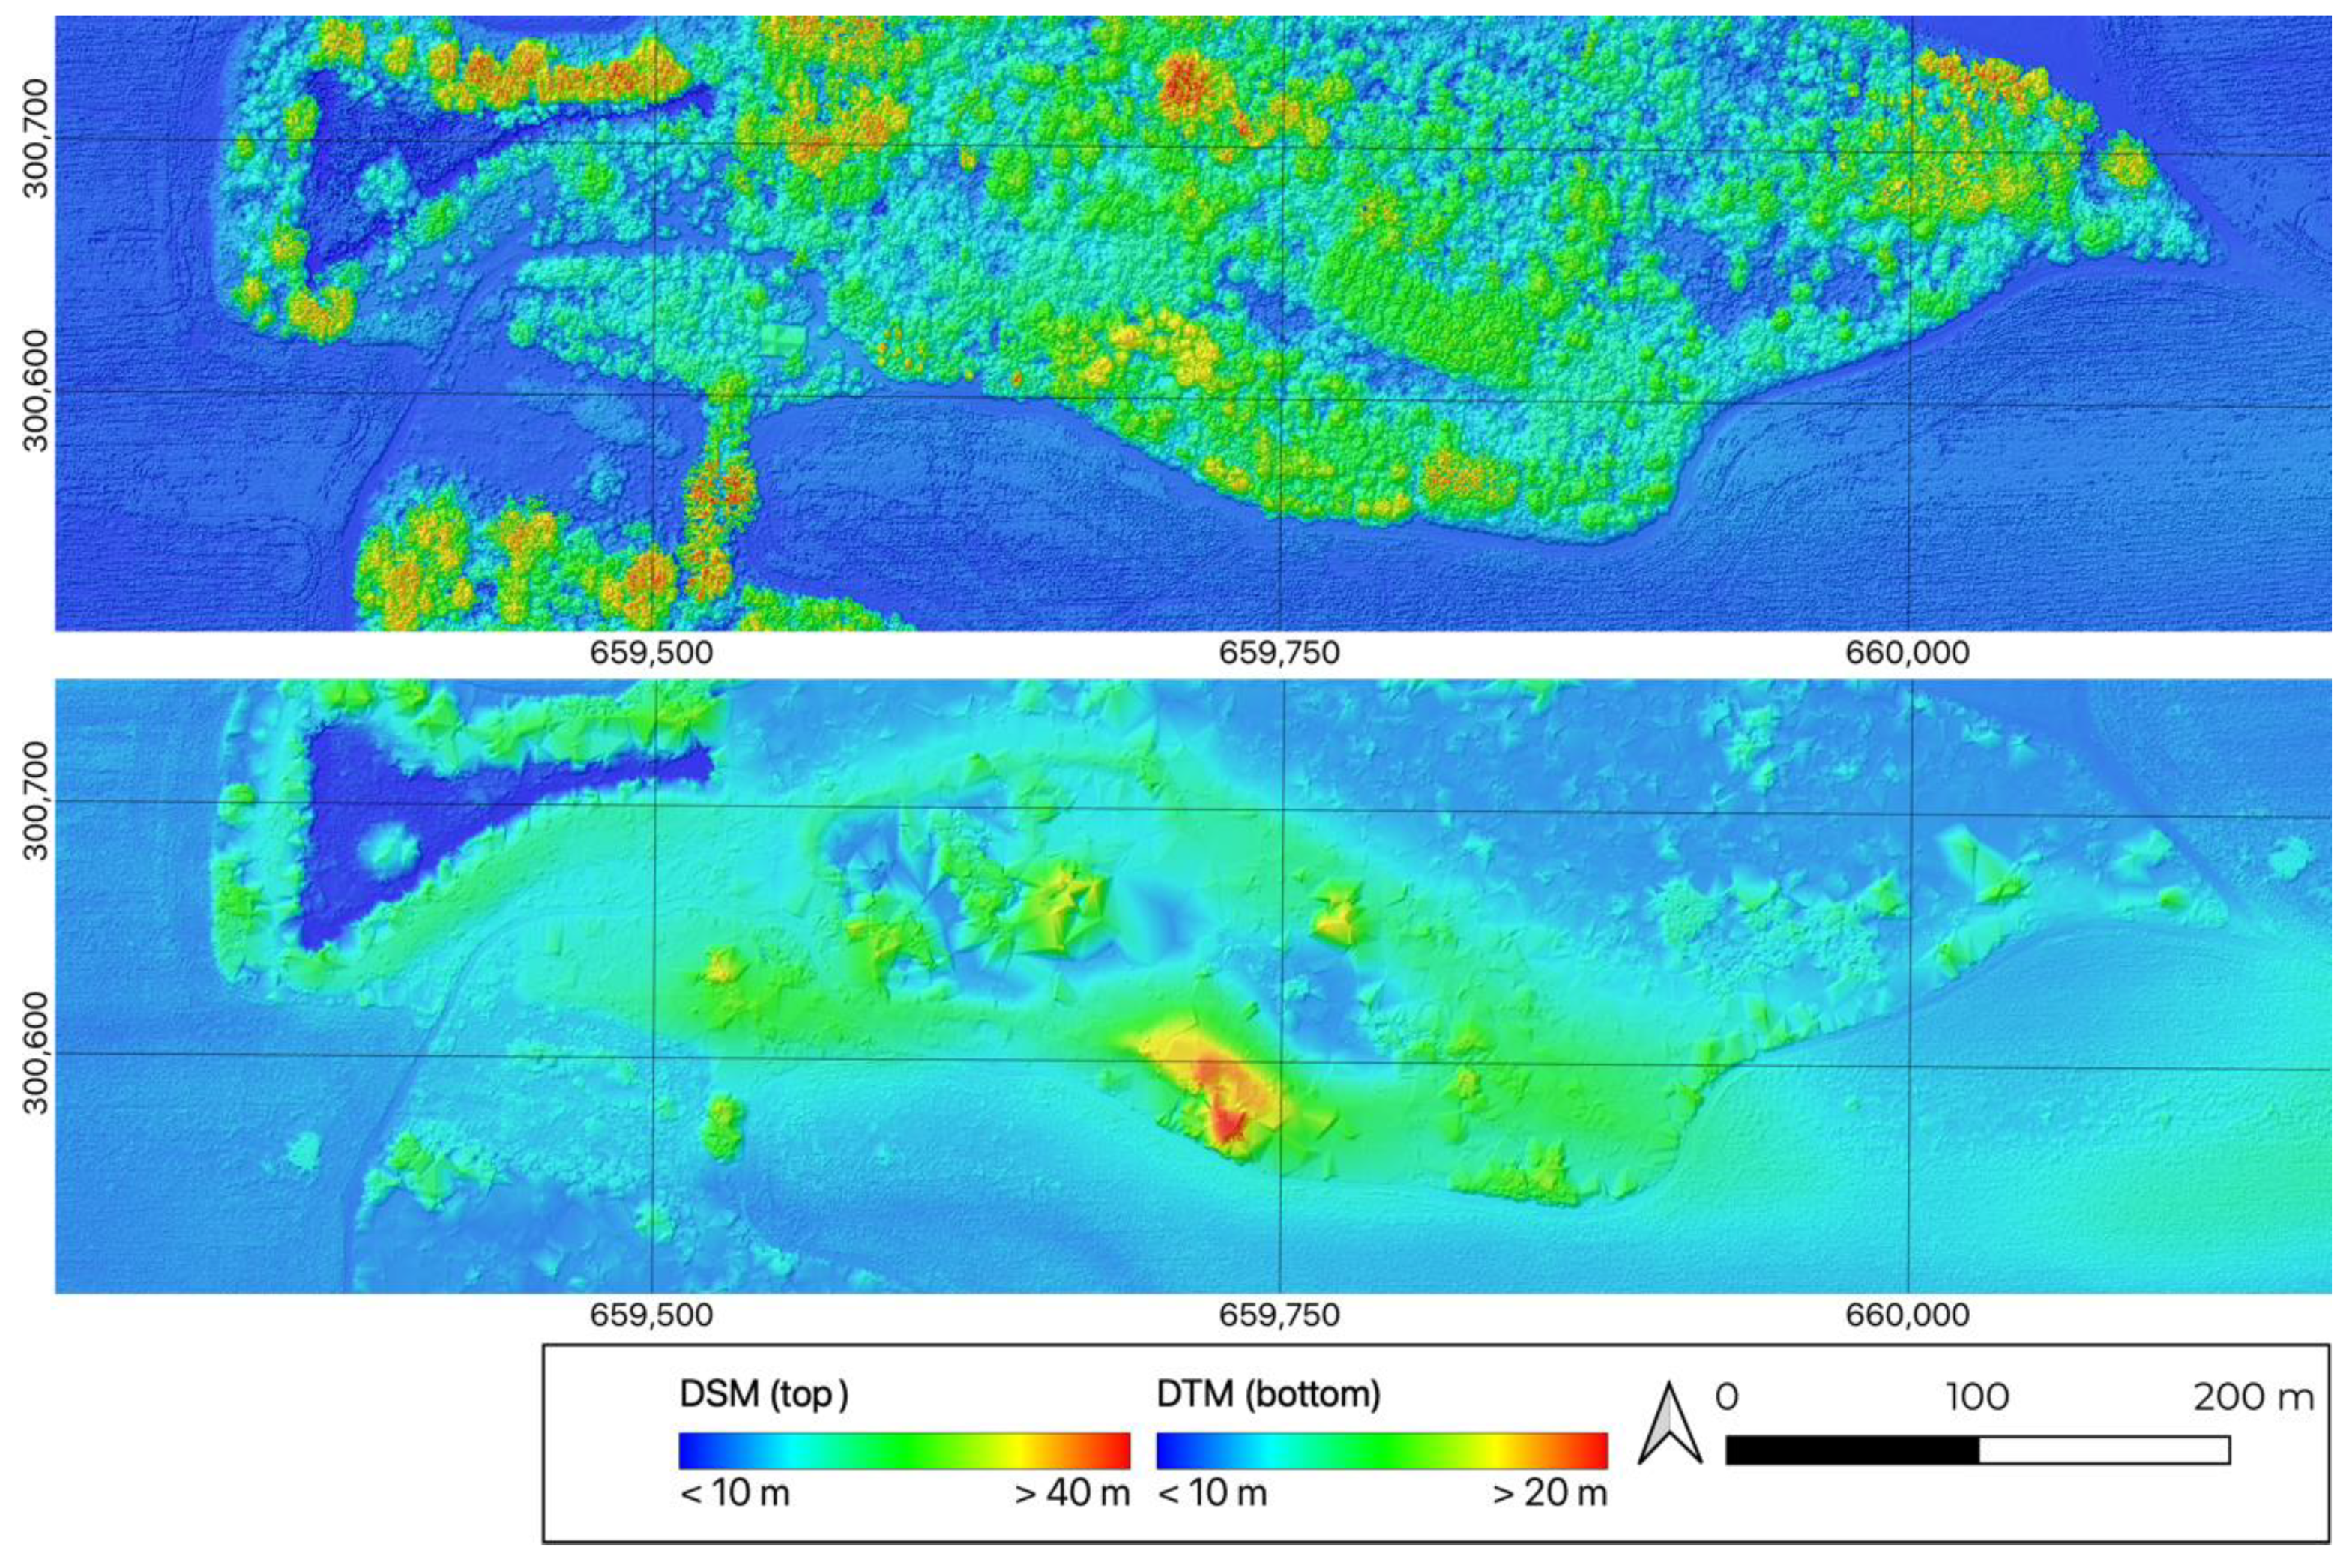
5.4.3. Evaluating Point Clouds of Vegetated Sites

Among others, one of the objectives of the use of the UAV with ALS was the documentation of two archaeological sites at Vărăști and Spanțov. Point clouds were generated for both sites using the procedure described above. In addition, the ability to generate a digital terrain model (DTM) of the topographic under the canopy was assessed for the site at Vărăști. As mentioned above, this opportunity is made possible because the used ALS sensor records multiple echoes per pulse. Various point cloud classifiers were applied to the acquired point cloud using PDAL [57]. The used classifier uses a statistical outlier removal and will distinguish between ground points and non-ground points using deviations and variability within a specific kernel [64].
As visualised in Figure 12, the used ALS system indeed allows the penetration of the canopy, revealing some topographic artifacts under the vegetation. However, the density of the ground points is relatively low, resulting in spikes and large interpolated areas. These are not only caused by the relatively low number of recorded echoes but also due to the dense undergrowth vegetation in the area. As a result, it is advised to use scan vegetated areas during winter, when the canopy is free of leaves. For the mapping of agricultural land, an additional advantage of this suggestion is the presence of crop-free parcels around the study area.

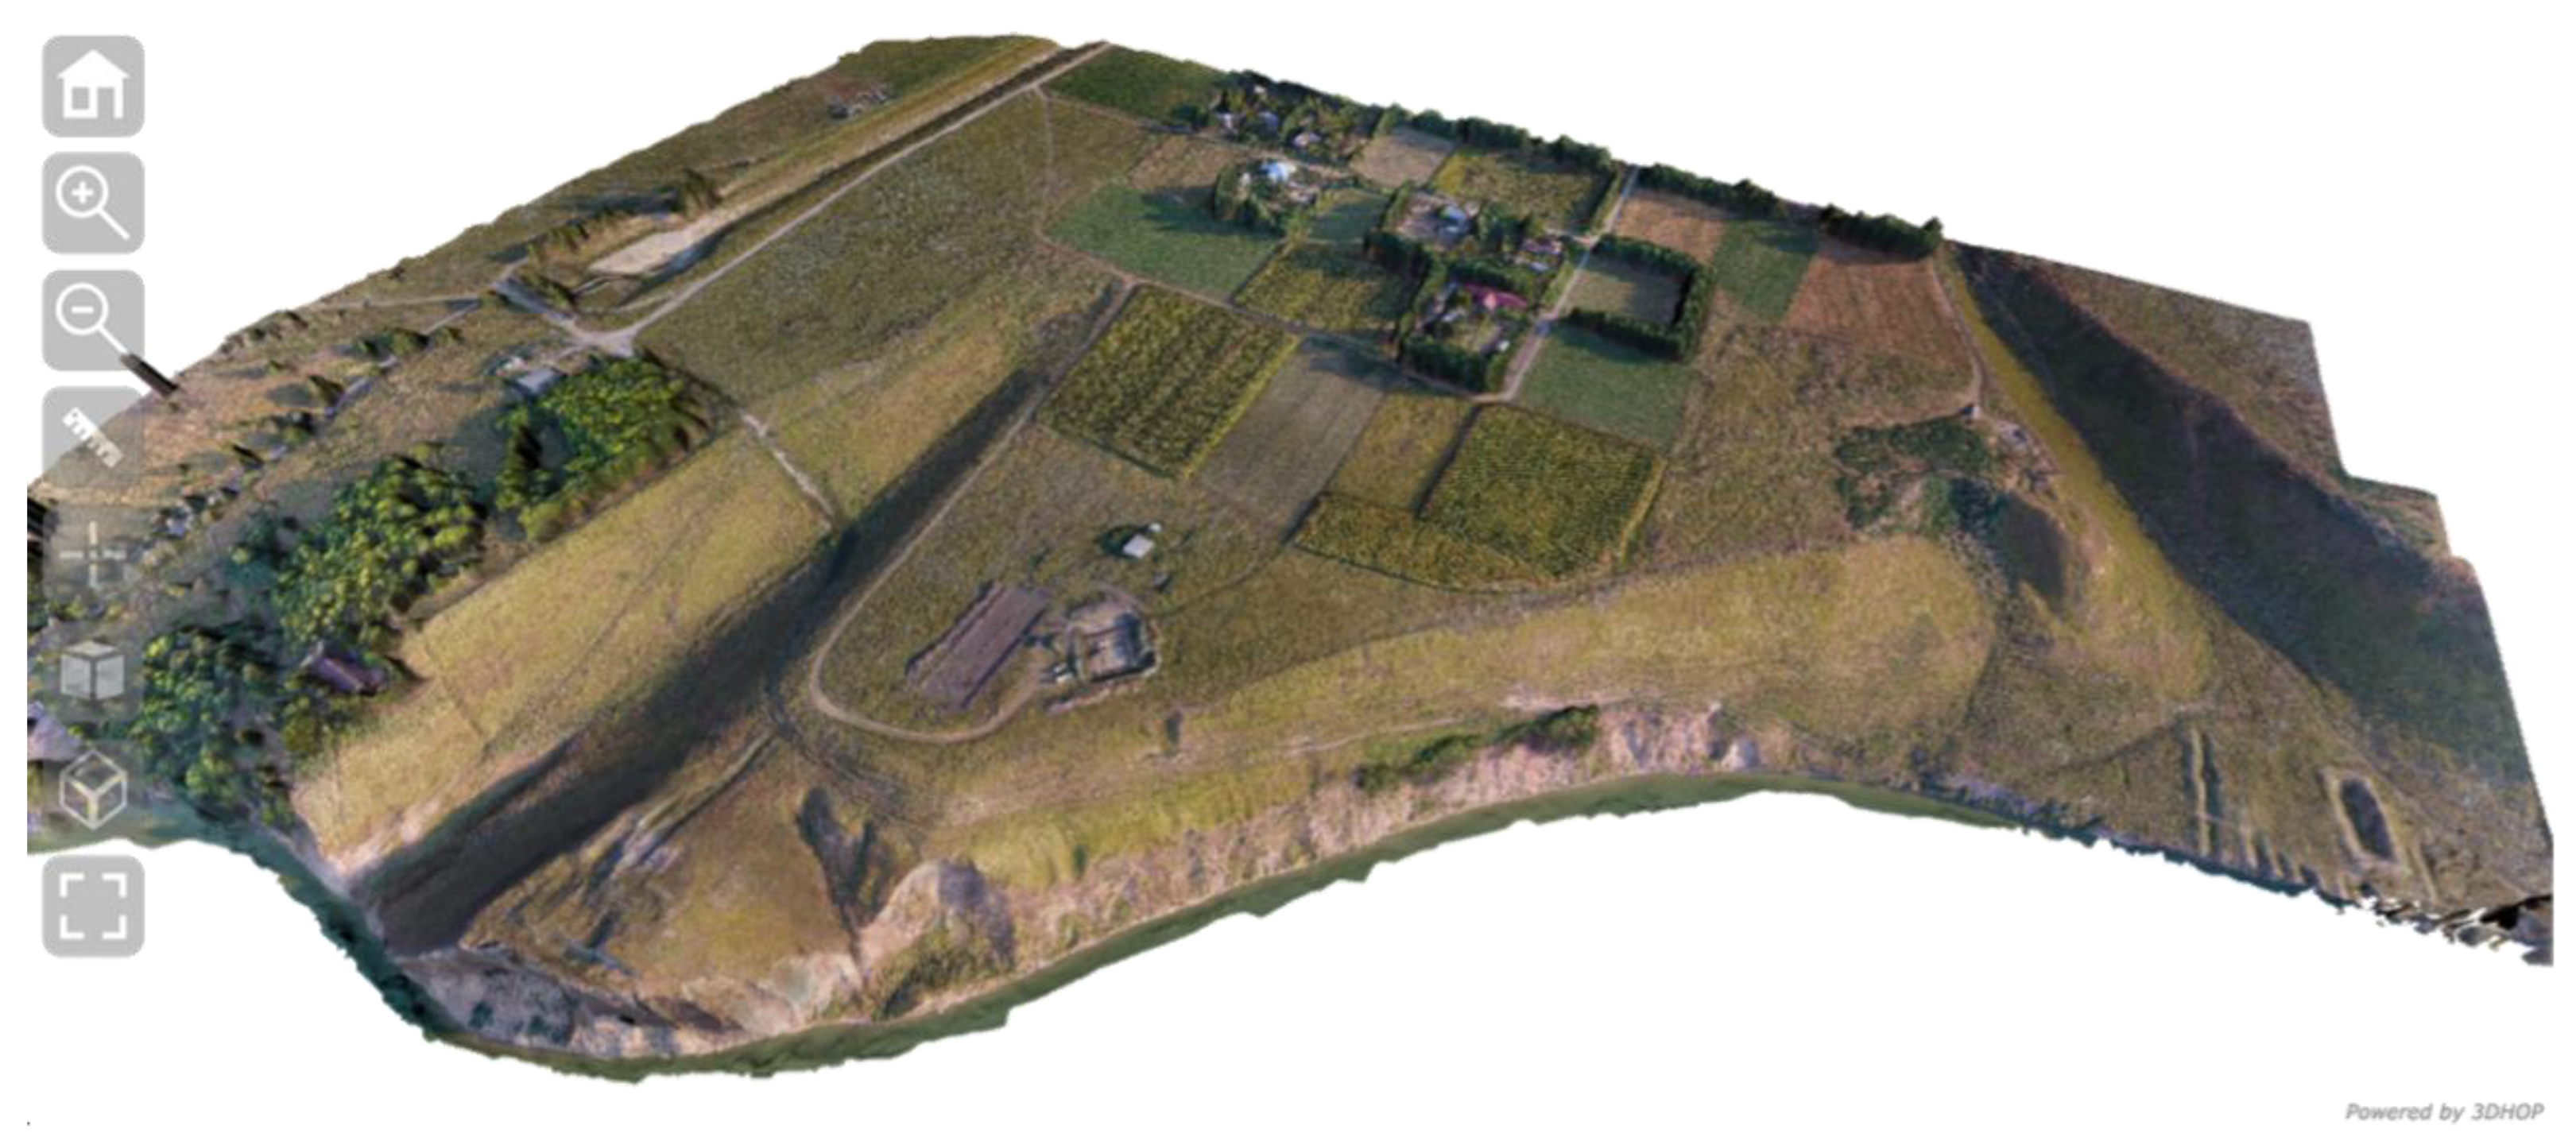
5.5. Data Publication

Data sharing is a crucial element of open and sustainable research. Various tools and platforms were selected to make the data obtained for this research available. The backbone of the implementation of this data sharing is the use of the Zenodo platform [65]. Zenodo is a multidisciplinary open access (OA) research data repository, assigning a digital object identifier (DOI) to any type of uploaded data. Data are available publicly and are findable and reusable thanks to this unique identifier. The service has been operational since 2013 and is recognised by the European Commission for referencing [66]. All generated DEMs are published on Zenodo (Dataset S1), as well as the MS-based orthophotos (both true colour and false colour composites, Dataset S2) and the 3D models (Dataset S3).
Furthermore, various deliverables are available as XYZ-tile services, web coverage services (WCS), or simply through front-end viewers. A website has been developed to facilitate this data sharing, which can be accessed via https://geo.hogent.be/sultana (accessed on 10 September 2022). On this website, the following data are available for public access (Dataset S4):
Image-based 3D models using 3DHOP: 3D models are made available using 3D Heritage Online Presenter (3DHOP) as an interactive model viewer [67]. After exporting the textured 3D model from Agisoft Metashape, the data should be converted to an NXS multi-resolution model. This model is saved in a single file containing the geometry, the texture maps, and the relations between these two elements. The resulting NSX file is called by the 3DHOP JavaScript library, which organises the proper visualisation of the model.
Raster data using MBTiles and XYZ-services: True colour composites, false composites, and SVF maps (sky view factor, calculated using unclassified ALS data) are presented using Leaflet [68]. All data are available through an XYZ-file service, which can also be used in other desktop GIS software. These services are based on the conversion of cartographic composites of the data in the Pseudo-Mercator CRS (EPSG:3857) to a system of rows and columns. Each cell in this system is linked to a specific zoom level. Data are prerendered for each zoom level, and the discrete definition of row–column-based coordinates makes this approach fast and convenient for online map visualisations [69]. The data for the tile services are prepared in QGIS 3.26 [62] and comprise the definition of uniform symbology and the calculation of the bounding in Pseudo-Mercator. Then, the composite is converted to an MBTiles-file, a specific version of an SQLite database for spatial raster data. Data access is facilitated on the backend by implementing a PHP script that requires the name of the MBTiles-file, rows, columns, and zoom level. The script will reply with the corresponding map as an image, which can be rendered in an online viewer or desktop GIS.
Point clouds using Entwine and derived DEMs using WCS: As mentioned above, the full datasets are available as compressed LAZ files (site per site and strip per strip) on Zenodo. After compressing the original LAS files to LAZ files, the file size is reduced by a factor of 7–8. The visualisation of the data is possible without downloading these large datasets. The point clouds are made available online using Entwine [70,71]. Entwine is an extension or optimisation of PoTree [72] and allows the visualisation of very large point clouds using WebGL [71]. Per the study area, the original point clouds are converted to Entwine point tiles (EPT) using PDAL [57]. The client requests these indexed tiles through JavaScript. In addition, PDAL has also been used to rasterise the point cloud and generate a series of DEMs with a resolution of 25 cm. These DEMs are available using a web coverage service (WCS), which allows the consultation and further processing of the data in other software, such as desktop GIS.

6. Discussion

Archaeological research has been supported by geomatics for a long time. While a theodolite, camera, or total station were conventionally part of the standard equipment, more advanced techniques such as photogrammetry and laser scanning are increasingly applied during fieldwork. Within the framework of the archaeological research in Mostiștea Basin and Danube Valley (Southern Romania), various platforms and sensors are available for the mapping, documentation, and site monitoring on different scales.
Both UAV-based ALS and photogrammetry allow the creation of fast and accurate 3D models of the covered topography. While UAV-based photogrammetry allows the creation of spatial datasets with a very high resolution for relatively small areas, UAV-based ALS can cover considerably more extensive areas. Although the point density of the used ALS system is significantly lower than the values obtained with photogrammetry, the density is still considered high compared to most nationally provided conventional ALS point clouds (e.g., 16 point/m2 in Flanders, Belgium, 10 points/m2 in The Netherlands, and so forth [73]. Thanks to PPK GNSS and SBET, no GCPs are required, which limits the time required for on-site flight preparations. However, the sensor only results in a point-based representation of the surface, and no colour information is added to the data set.
Using PPK GNSS is also a significant added value for the data acquisition using the MS sensor. Data processing is less complex than ALS since only photos must be georeferenced. The sensor gives excellent insight into the condition of vegetation, which can be used as a proxy for detecting subsurface archaeological features. As with regular UAV RGB photogrammetry, the area covered by the system is small compared to the used ALS system. Nevertheless, these systems offer considerable flexibility for the fast acquisition of imagery at various flying heights. Since all data are georeferenced in a standard coordinate reference system (CRS), data publication is possible using cartographic facilities of geographic information systems (GIS). Furthermore, given this CRS, coherence between UAV-based data and additional spatial data is guaranteed, allowing the use of these data as a base layer for data management and an extensive range of multidisciplinary spatial analysis.
Since the systematic implementation of UAVs in archaeological research in the early 2000s for photogrammetric purposes, many technological developments have improved the performance and quality of the acquired data. Moreover, innovative sensors created opportunities for the formation of new datasets with variables that were out of reach for many decades. Implementing efficient methodologies for data processing and publication has also contributed to the sustainability of research and the broader availability of research data.

7. Conclusions

The main objective of this paper is to provide an overview of the various aspects of 3D data acquisition for UAV-based mapping in archaeological applications. With multiple platforms and systems tested at the Chalcolithic archaeological sites in the Mostiștea Basin and Danube Valley (Southern Romania), an appropriate selection of a specific sensor and platform can be made. In this article, the use of conventional photogrammetric sensors (DJI Mavic 2 Pro and DJI Phantom 4), multispectral sensors (DJI Phantom 4 MS), and airborne laser scanning (Quantum Trinity F90+ and Qube 240) is elaborated. Furthermore, the flight preparation and execution, as well as the data processing, are discussed, with particular attention to the use of highly accurate GNSS positioning for spatial coherence of the data. This coherence, as well as the general quality properties of the various data sets, are described in this manuscript.
Both photogrammetry and laser scanning data acquisition campaigns resulted in extensive datasets. Hence, a procedure for storing and publishing the data was presented, focusing on data sustainability and open access. In addition, the implementation of multiple methods for online data publication is recommended, given the variety of data types, such as pre- and post-rendered raster data, 3D models, and point clouds. Finally, various client-side and server-side solutions are presented to make the data available for other researchers.
Based on the conclusions drawn in this article, it is stated that photogrammetry and laser scanning can result in data with similar geometrical properties when acquisition parameters are appropriately set. However, the used ALS-based system outperforms the photogrammetric platforms regarding operational time and the area covered. On the other hand, conventional photogrammetry provides flexibility that might be required for very low-altitude flights or emergency mapping. Furthermore, as the used ALS sensor only provides a geometrical representation of the topography, photogrammetric sensors are still required to obtain true colour- or false colour composites of the surface.
This approach undoubtedly allows us to follow the transformative processes of the archaeological sites and the landscape from proximity, enabling us to create a highly accurate image of the scale of transformation of the area inhabited 6000 years ago by various human communities in order to better understand how Chalcolithic human communities integrated, adapted, and survived in the surrounding environment. Undoubtedly, the resulting data will serve as the basis for a more in-depth understanding of the complex processes (natural and anthropogenic) that are documented in the targeted area, and the non-intrusive investigations and the logs from “The dynamics of the prehistoric communities located in the Mostiștea Valley and Danube Plain (between Oltenița and Călărași)” project will provide complementary data for this broader understanding of the prehistoric realities.
Finally, starting with the statement that spatial data play a crucial role in archaeological research, and that orthophotos, digital elevation models, and 3D models are frequently used for the mapping, documentation, and monitoring of archaeological sites, it is concluded that recent developments in UAVs and compact sensors have and will have a considerable impact on archaeological research. Applications of geomatics in archaeology will contribute to a better understanding and knowledge of various research topics, and the connection between these two disciplines strengthens as data acquisition methods and data processing capabilities evolve.

Supplementary Materials

The following supporting information can be downloaded at: Dataset S1: DEMs: Stal, C.; Covataru, C.; Müller, J.; Parnic, V.; Ignat, T.; Hofmann, R.; Lazar, C. 2022. ALS-based DEMs (100 cm): the dynamics of the prehistoric communities located in the Mostiștea Valley and Danube Plain (between Oltenița and Călărași); Zenodo; https://doi.org/10.5281/zenodo.7083094. Dataset S2: Orthophotos: Stal, C.; Covataru, C.; Müller, J.; Parnic, V.; Ignat, T.; Hofmann, R.; Lazar, C. 2022. MS-based orthophotos (50 cm): the dynamics of the prehistoric communities located in the Mostiștea Valley and Danube Plain (between Oltenița and Călărași); Zenodo; https://doi.org/10.5281/zenodo.7104676. Dataset S3: 3D models: Stal, C.; Covataru, C.; Müller, J.; Parnic, V.; Ignat, T.; Hofmann, R.; Lazar, C. 2022. 3D models: the dynamics of the prehistoric communities located in the Mostiștea Valley and Danube Plain (between Oltenița and Călărași); Zenodo; https://doi.org/10.5281/zenodo.7104694. Dataset S4: Orthophotos, point clouds, and 3D models: Stal, C. 2022. Sultana; https://geo.hogent.be/sultana (accessed on 10 September 2022).

Author Contributions

Conceptualization, C.S. and C.C.; methodology, C.S., C.C., T.I. and C.L.; software, C.S. and C.C.; validation, C.S., C.C., T.I. and C.L.; formal analysis, C.S.; investigation, C.S., C.C. and C.L.; resources, C.L., T.I. and V.P.; data curation, C.S.; writing—original draft preparation, C.S., C.C. and C.L.; writing—review and editing, C.S., C.C., J.M., V.P., T.I., R.H. and C.L.; visualization, C.S., C.C. and C.L.; supervision, J.M., T.I., R.H. and C.L.; project administration, C.C., V.P., T.I. and C.L.; funding acquisition, J.M. and C.L. All authors have read and agreed to the published version of the manuscript.

Funding

The work of Cristina Covataru, and Catalin Lazar was supported by a grant from the Ministry of Research, Innovation, and Digitization, contract number 41PFE/30.12.2021, within PNCDI III. The work of Robert Hofmann and Johannes Müller and the fieldwork was supported by the Deutsche Forschungsgemeinschaft (DFG), Collaborative Research Centre 1266 “Scales of Transformation” (project number 2901391021). The work of Cornelis Stal was supported by the HOGENT Department of Real Estate, the Center for Sustainable Land Use and Mobility (DRUM), and the Center for Applied Data Science (CADS).

Data Availability Statement

The DEMs presented in this study are openly available in Zenodo at doi:10.5281, reference number 7083094. The orthophotos presented in this study are openly available in Zenodo at doi:10.5281, reference number 7104676. The 3D models presented in this study are openly available in Zenodo at doi:10.5281, reference number 7104694. Other publicly available datasets (orthophotos, point clouds, and 3D models) can be found here: https://geo.hogent.be/sultana (accessed on 10 September 2022). Other data and code discussed in this study are available on request from the corresponding author.

Acknowledgments

Fieldwork from the 2021–2022 seasons (e.g., UAV flights, geospatial data collection, field walking, etc.) was carried out under the umbrella of the joint project “The dynamics of the prehistoric communities located in the Mostiștea Valley and Danube Plain (between Oltenița and Călărași)”, organised by the ArchaeoSciences Division of the Research Institute of the University of Bucharest (ICUB) and Kiel University (Germany), in partnership with HOGENT, University of Applied Sciences and Arts (Belgium), Museum of Bucharest, Museum of the Lower Danube Călărași, Museum of Gumelnița Civilization Oltenița, and “Vasile Pârvan” Institute of Archaeology (Romania), under the “Sultana School of Archaeology” initiative. Cristina Covataru thanks the “Simion Mehedinţi-Nature and Sustainable Development” Postgraduate Program, Faculty of Geography, University of Bucharest, Romania, for the academic and financial support for her Ph.D. Last but not least, some UAV flights and aerial photos from 2018 to 2021 were taken by our former colleague Ovidiu Frujina, whom we thank in this way.

Conflicts of Interest

The authors declare no conflict of interest.

References

  1. Haala, N.; Alshawabkeh, Y. Combining Laser Scanning and Photogrammetry: A Hybrid Approach for Heritage Documentation. In Proceedings of the 7th International Symposium on Virtual Reality, Archeology and Cultural Heritage, Nicosia, Cyprus, 30 October–4 November 2006; pp. 163–170. [Google Scholar]
  2. Remondino, F. Heritage Recording and 3D Modeling with Photogrammetry and 3D Scanning. Remote Sens. 2011, 3, 1104–1138. [Google Scholar] [CrossRef]
  3. Stal, C.; Bourgeois, J.; de Maeyer, P.; de Mulder, G.; de Wulf, A.; Goossens, R.; Hendrickx, M.; Nuttens, T.; Stichelbout, B. Quality Analysis of Structure from Motion in Archaeological Airborne Applications. In Proceedings of the 32nd EARSeL Symposium on Advances in Geosciences, Mykonos, Greece, 21–24 May 2012; pp. 1–11. [Google Scholar]
  4. Verhoeven, G.; Doneus, M.; Briese, C.; Vermeulen, F. Mapping by Matching: A Computer Vision-Based Approach to Fast and Accurate Georeferencing of Archaeological Aerial Photographs. J. Archaeol. Sci. 2012, 39, 2060–2070. [Google Scholar] [CrossRef]
  5. Ferdani, D.; Demetrescu, E.; Cavalieri, M.; Pace, G.; Lenzi, S. 3D Modelling and Visualization in Field Archaeology. From Survey to Interpretation of the Past Using Digital Technologies. Groma. Doc. Archaeol. 2020, 4, 1–21. [Google Scholar] [CrossRef]
  6. Lucas, G. Destruction and the Rhetoric of Excavation. Nor. Archaeol. Rev. 2001, 34, 35–46. [Google Scholar] [CrossRef]
  7. Stal, C.; van Liefferinge, K.; de Reu, J.; Docter, R.; Dierkens, G.; de Maeyer, P.; Mortier, S.; Nuttens, T.; Pieters, T.; van den Eijnde, F.; et al. Integrating Geomatics in Archaeological Research at the Site of Thorikos (Greece). J. Archaeol. Sci. 2014, 45, 112–125. [Google Scholar] [CrossRef]
  8. Hendrickx, M.; Gheyle, W.; Bonne, J.; Bourgeois, J.; de Wulf, A.; Goossens, R. The Use of Stereoscopic Images Taken from a Microdrone for the Documentation of Heritage: An Example from the Tuekta Burial Mounds in the Russian Altay. J. Archaeol. Sci. 2011, 38, 2968–2978. [Google Scholar] [CrossRef]
  9. Field, S.; Waite, M.; Wandsnider, L. The Utility of UAVs for Archaeological Surface Survey: A Comparative Study. J. Archaeol. Sci. Rep. 2017, 13, 577–582. [Google Scholar] [CrossRef]
  10. Wyard, C.; Beaumont, B.; Grippa, T.; Georganos, S.; Hallot, E. UAVs for Fine-Scale Open-Source Landfill Mapping. In Proceedings of the 2021 IEEE International Geoscience and Remote Sensing Symposium IGARSS, Brussels, Belgium, 11–16 July 2021; pp. 8217–8220. [Google Scholar]
  11. Roman, A.; Ursu, T.M.; Lăzărescu, V.A.; Opreanu, C.H.; Fărcaş, S. Visualization Techniques for an Airborne Laser Scanning-Derived Digital Terrain Model in Forested Steep Terrain: Detecting Archaeological Remains in the Subsurface. Geoarchaeology 2017, 32, 549–562. [Google Scholar] [CrossRef]
  12. Lin, Y.; Hyyppa, J.; Jaakkola, A. Mini-UAV-Borne LIDAR for Fine-Scale Mapping. IEEE Geosci. Remote Sens. Lett. 2011, 8, 426–430. [Google Scholar] [CrossRef]
  13. Dominika, S.; Bartłomiej, Ć.; Krzysztof, W.; Dąbek, P.B.; Bastante, J.M.; Izabela, W. Inca Water Channel Flow Analysis Based on 3D Models from Terrestrial and UAV Laser Scanning at the Chachabamba Archaeological Site (Machu Picchu National Archaeological Park, Peru). J. Archaeol. Sci. 2022, 137, 105515. [Google Scholar] [CrossRef]
  14. Andreescu, R.R.; Lazăr, C. Valea Mostiștei. Așezarea Gumelnițeană de la Sultana Malu Roșu. Cercet. Arheol. 2008, 15, 55–76. [Google Scholar] [CrossRef]
  15. Covataru, C.; Stal, C.; Florea, M.; Opriș, I.; Simon, C.; Radulescu, I.; Călin, R.; Ignat, T.; Ghiță, C.; Lazăr, C. Human Impact Scale on the Preservation of the Archaeological Sites from Mostiștea Valley (Romania). Front. Environ. Sci. 2022, 10, 1065. [Google Scholar] [CrossRef]
  16. Ghiță, C. The Microrelief as Result of Morphohydroclimatic Conditions in Mostistea River Basin. Rev. De Geomorfol. 2008, 10, 103–111. [Google Scholar]
  17. Buzea, E. Flooded Areas and Their Importance in Maintaining Biodiversity. Meadow Lower Danube. J. Wetl. Biodivers. 2011, 1, 23–46. [Google Scholar]
  18. Tetecu, C. Lunca Dunării Între Olteniţa Şi Călăraşi: Studiu Privind Calitatea Mediului; University of Bucharest, Department of Geography: Bucharest, Romania, 2008. [Google Scholar]
  19. Ursulescu, N.; Petrescu Dîmbovița, M.; Mohan, D. Neo-Eneoliticul. In Moştenirea Timpurilor Îndepărtate; Istoria Românilor I; Editura Enciclopedica: Bucharest, Romania, 2001; Volume 1, pp. 111–197. [Google Scholar]
  20. Todorova, H. The Neolithic, Eneolithic and Transitional Period in Bulgarian Prehistory. In Prehistoric Bulgaria: Monographs in World Archaeology; Bailey, D.W., Panayotov, I., Alexandrov, S., Eds.; Prehistory Press: Madison, WI, USA, 1995; Volume 22, pp. 79–98. [Google Scholar]
  21. Bailey, D.W.; Tringham, R.; Bass, J.; Stevanović, M.; Hamilton, M.; Neumann, H.; Angelova, I.; Raduncheva, A. Expanding the Dimensions of Early Agricultural Tells: The Podgoritsa Archaeological Project, Bulgaria. J. Field Archaeol. 1998, 25, 373–396. [Google Scholar] [CrossRef]
  22. Bréhard, S.; Bălăşescu, A. What’s behind the Tell Phenomenon? An Archaeozoological Approach of Eneolithic Sites in Romania. J. Archaeol. Sci. 2012, 39, 3167–3183. [Google Scholar] [CrossRef]
  23. Chapman, J.; Higham, T.; Slavchev, V.; Gaydarska, B.; Honch, N. The Social Context of the Emergence, Development and Abandonment of the Varna Cemetery, Bulgaria. Eur. J. Archaeol. 2006, 9, 159–183. [Google Scholar] [CrossRef]
  24. Andrieșescu, I. Les Fouilles de Sultana. Dacia 1924, I, 51–107. [Google Scholar]
  25. Dumitrescu, H. Rapport Sur Les Sondages de Grădiștea-Fundeasca. Dacia 1927, III–IV, 150–156. [Google Scholar]
  26. Christescu, V. Les Stations Préhistoriques Du Lac de Boian. Dacia 1925, II, 249–303. [Google Scholar]
  27. Vlădescu-Vulpe, R. Pentru Harta Arhaeologică a României Ridicată de Direcția Muzeului Național de Antichități I. Regiunea Mostiştea-Călăraşi. Bul. Comisunii Monum. Istor. 1924, 17. [Google Scholar]
  28. Dumitrescu, V. Découvertes de Gumelnița. Dacia 1924, I, 325–342. [Google Scholar]
  29. Dumitrescu, V. Oameni și Cioburi. Contribuții La Istoria Contemporană a Arheologiei Românești; Muzeul Dunării de Jos: Călăraşi, Romania, 1993. [Google Scholar]
  30. Șerbănescu, D.; Șandric, B. Tell-Uri Eneolitice În Regiunea Valea Mostiștei. O Privire Generală. Archaeol. Debates 2012, 2, 103–150. [Google Scholar]
  31. Bucur, M.; Puda, C.; Morintz, S.; Mateescu, C. Șantierul Spanțov. Stud. Și Cercetări Istor. Veche 1953, 4, 220–239. [Google Scholar]
  32. Morintz, S.; Preda, C. Săpăturile de La Spanțov (r. Oltenița, Reg. București). Mater. Şi Cercetări Arheol. 1959, 5, 163–173. [Google Scholar] [CrossRef]
  33. Oberländer-Târnoveanu, I.; Bem, C. România: Un Viitor Pentru Trecut. Fotografiile Aeriene În Repertorierea Siturilor Arheologice”. In Arheologie Aeriană: În România şi în Europa; Palmer, R., Oberländer-Tărnoveanu, I., Eds.; CIMEC, Institutul de Memorie Culturală: Bucharest, Romania, 2009; pp. 62–88. [Google Scholar]
  34. Palmer, R.; Oberländer-Tărnoveanu, I. Arheologie Aeriană: În România Şi În Europa; CIMEC, Institutul de Memorie Culturală: Bucharest, Romania, 2009. [Google Scholar]
  35. Oberländer-Târnoveanu, I. Proiecte de Arheologie Aeriană În România. Angvstia 2010, 14, 389–412. [Google Scholar]
  36. Uren, J.; Price, W.F. Surveying for Engineers; Palgrave Macmillan: Basingstoke, UK, 2010; ISBN 1137052791. [Google Scholar]
  37. DJI. Available online: www.dji.com (accessed on 10 September 2022).
  38. Adami, A.; Fregonese, L.; Gallo, M.; Helder, J.; Pepe, M.; Treccani, D. Ultra Light Uav Systems for the Metrical Documentation of Cultural Heritage: Applications for Architecture and Archaeology. Int. Arch. Photogramm. Remote Sens. Spat. Inf. Sci. 2019, XLII-2/W17, 15–21. [Google Scholar] [CrossRef]
  39. Bates-Domingo, I.; Gates, A.; Hunter, P.; Neal, B.; Snowden, K.; Webster, D. Unmanned Aircraft Systems for Archaeology Using Photogrammetry and LiDAR in Southwestern United States; Embry-Riddle Aeronautical University: Daytona Beach, FL, USA, 2021. [Google Scholar]
  40. Agapiou, A.; Hadjimitsis, D.; Alexakis, D. Evaluation of Broadband and Narrowband Vegetation Indices for the Identification of Archaeological Crop Marks. Remote Sens. 2012, 4, 3892–3919. [Google Scholar] [CrossRef]
  41. Verhoeven, G. Near-Infrared Aerial Crop Mark Archaeology: From Its Historical Use to Current Digital Implementations. J. Archaeol. Method Theory 2012, 19, 132–160. [Google Scholar] [CrossRef]
  42. Šedina, J.; Housarová, E.; Raeva, P. Using RPAS for the Detection of Archaeological Objects Using Multispectral and Thermal Imaging. Eur. J. Remote Sens. 2019, 52, 182–191. [Google Scholar] [CrossRef] [Green Version]
  43. Quantum Systems. Available online: https://www.quantum-systems.com (accessed on 10 September 2022).
  44. Baltsavias, E. A Comparision between Photogrammetry and Laser Scanning. ISPRS J. Photogramm. Remote Sens. 1999, 54, 83–94. [Google Scholar] [CrossRef]
  45. Puliti, S.; Dash, J.P.; Watt, M.S.; Breidenbach, J.; Pearse, G.D. A Comparison of UAV Laser Scanning, Photogrammetry and Airborne Laser Scanning for Precision Inventory of Small-Forest Properties. For. Int. J. For. Res. 2020, 93, 150–162. [Google Scholar] [CrossRef]
  46. Pfeifer, N.; Mandlburger, G. LiDAR Data Filtering and DTM Generation. In Topographic Laser Ranging and Scanning: Principles and Processing; Shan, J., Toth, C., Eds.; CRC Press: Boca Raton, Fl, USA, 2018; pp. 307–333. [Google Scholar]
  47. Trier, Ø.D.; Cowley, D.C.; Waldeland, A.U. Using Deep Neural Networks on Airborne Laser Scanning Data: Results from a Case Study of Semi-automatic Mapping of Archaeological Topography on Arran, Scotland. Archaeol. Prospect. 2019, 26, 165–175. [Google Scholar] [CrossRef]
  48. de Reu, J.; de Smedt, P.; Herremans, D.; van Meirvenne, M.; Lalooc, P.; de Clercq, W. On Introducing an Image-Based 3D Reconstruction Method in Archaeological Excavation Practice. J. Archaeol. Sci. 2014, 41, 251–262. [Google Scholar] [CrossRef]
  49. Montenbruck, O.; Steigenberger, P.; Hauschild, A. Broadcast versus Precise Ephemerides: A Multi-GNSS Perspective. GPS Solut. 2015, 19, 321–333. [Google Scholar] [CrossRef]
  50. Stal, C.; Poppe, H.; Vandenbulcke, A.; de Wulf, A. Study of Post-Processed GNSS Measurements for Tidal Analysis in the Belgian North Sea. Ocean. Eng. 2016, 118. [Google Scholar] [CrossRef]
  51. EUREF Permanent GNSS Network. Available online: https://www.epncb.oma.be/ (accessed on 11 September 2022).
  52. Chambers, D.; Schröter, J. Evaluation of RTKLIB’s Positioning Accuracy Using Low-Cost GNSS Receiver and ASG-EUPOS. J. Geodyn. 2011, 52, 333–343. [Google Scholar] [CrossRef]
  53. Agisoft Metashape. Available online: www.agisoft.com (accessed on 11 September 2022).
  54. Donato, E.; Giuffrida, D. Combined Methodologies for the Survey and Documentation of Historical Buildings: The Castle of Scalea (CS, Italy). Heritage 2019, 2, 2384–2397. [Google Scholar] [CrossRef]
  55. Ilie, D.; Balotă, O.L.; Iordan, D.; Nicoară, P.S. Algorithm and Application Development for Precise and Accurate Transformation of Lidar Point Clouds into National Coordinate Systems of Romania Using Official Equations and Quasigeoid Model. ISPRS Ann. Photogramm. Remote Sens. Spat. Inf. Sci. 2022, V-4-2022, 181–188. [Google Scholar] [CrossRef]
  56. Girardeau-Montaut, D. CloudCompare. Available online: www.cloudcompare.org (accessed on 11 September 2022).
  57. Butler, H.; Chambers, B.; Hartzell, P.; Glennie, C. PDAL: An Open Source Library for the Processing and Analysis of Point Clouds. Comput. Geosci. 2021, 148, 104680. [Google Scholar] [CrossRef]
  58. Zakšek, K.; Oštir, K.; Kokalj, Ž. Sky-View Factor as a Relief Visualization Technique. Remote Sens. 2011, 3, 398–415. [Google Scholar] [CrossRef]
  59. Böhner, J. SAGA: System for Automated Geoscientific Analyses. Available online: https://saga-gis.sourceforge.io (accessed on 11 September 2022).
  60. Stal, C.; de Wulf, A.; de Maeyer, P.; Goossens, R.; Nuttens, T.; Tack, F. Statistical Comparison of Urban 3D Models from Photo Modeling and Airborne Laser Scanning. In Proceedings of the International Multidisciplinary Scientific GeoConference (SGEM), Albena, Bulgaria, 16–22 June 2012; Volume 2, p. 8, (on CD-ROM). [Google Scholar]
  61. Wagenmakers, E.; Ly, A.; Boutin, B. JASP. Available online: https://jasp-stats.org (accessed on 11 September 2022).
  62. QGIS. Available online: www.qgis.org (accessed on 11 September 2022).
  63. Kutner, M.; Nachtsheim, C.; Neter, J.; Li, W. Applied Linear Statistical Models; McGray-Hill: New York, NY, USA, 2005. [Google Scholar]
  64. Podobnikar, T.; Vrecko, A. Digital Elevation Model from the Best Results of Different Filtering of a LiDAR Point Cloud. Trans. GIS 2012, 16, 603–617. [Google Scholar] [CrossRef]
  65. CERN Zenodo. Available online: https://zenodo.org (accessed on 11 September 2022).
  66. Peters, I.; Kraker, P.; Lex, E.; Gumpenberger, C.; Gorraiz, J.I. Zenodo in the Spotlight of Traditional and New Metrics. Front. Res. Metr. Anal. 2017, 2, 13. [Google Scholar] [CrossRef]
  67. Potenziani, M.; Callieri, M.; Dellepiane, M.; Corsini, M.; Ponchio, F.; Scopigno, R. 3DHOP: 3D Heritage Online Presenter. Comput. Graph. 2015, 52, 129–141. [Google Scholar] [CrossRef]
  68. Horbiński, T.; Lorek, D. The Use of Leaflet and GeoJSON Files for Creating the Interactive Web Map of the Preindustrial State of the Natural Environment. J. Spat. Sci. 2022, 67, 61–77. [Google Scholar] [CrossRef]
  69. Zunino, A.; Velázquez, G.; Celemín, J.; Mateos, C.; Hirsch, M.; Rodriguez, J. Evaluating the Performance of Three Popular Web Mapping Libraries: A Case Study Using Argentina’s Life Quality Index. ISPRS Int. J. Geoinf. 2020, 9, 563. [Google Scholar] [CrossRef]
  70. Entwine. Available online: https://entwine.io (accessed on 11 September 2022).
  71. Schutz, M.; Krosl, K.; Wimmer, M. Real-Time Continuous Level of Detail Rendering of Point Clouds. In Proceedings of the 2019 IEEE Conference on Virtual Reality and 3D User Interfaces (VR), Osaka, Japan, 23–27 March 2019; pp. 103–110. [Google Scholar]
  72. Schütz, M. Potree: Rendering Large Point Clouds in Web Browsers; Technische Universität Wien: Vienna, Austria, 2016. [Google Scholar]
  73. Kakoulaki, G.; Martinez, A.; Florio, P. Non-Commercial Light Detection and Ranging (LiDAR) Data in Europe; Publications Office of the European Union: Luxemburg, 2021. [Google Scholar]
Figure 1. Situation of the study area and test sites in Romania (source: OpenTopoMap, coordinates in EPSG:4326).
Drones 06 00277 g001
Figure 2. Sultana site: DEM (left), orthophoto (middle), and thermal composite (right) based on Mavic 2 Enterprise data of the archaeological site of Sultana (illustrative, the white dots represent the locations of the GCPs).
Drones 06 00277 g002
Figure 3. Quantum Trinity F90+ carrier (left) and the Qube 240 ALS sensor (right).
Drones 06 00277 g003
Figure 4. The sites of Spanțov (left) and Vărăști (right) are covered by vegetation (source: Google Satellite, coordinates in EPSG:3844).
Drones 06 00277 g004
Figure 5. Gumelnița site. Screenshots of the used flight preparation and autopilot software: DJI Pilot (top) and QBase (bottom).
Drones 06 00277 g005
Figure 6. Overview of the data processing workflow for the different data sources.
Drones 06 00277 g006
Figure 7. Sultana site: Overview of the 3D model of the archaeological habitation features.
Drones 06 00277 g007
Figure 8. Chiselet site: Hillshade DEM (left) and false colour composite (right) of the larger extent of the tell settlement (coordinates in EPSG:3844).
Drones 06 00277 g008
Figure 9. Chiselet site: Detailed DEM of the tell settlement with an illustrative profile. The white dots represent the locations of the GCPs. The letters ‘A’ and ‘B’ on the map correspond with the start and end of the profile respectively (coordinates in EPSG:3844).
Drones 06 00277 g009
Figure 10. Sultana site: Time series analysis based on a DEM obtained in 2018 (left) and 2022 (right) results in a difference model (middle) (coordinates in EPSG:3844).
Drones 06 00277 g010
Figure 11. Sultana site: Difference model (left) and various profiles illustrating topographic changes between 2018 and 2022 (coordinates in EPSG:3844, profile units in meters).
Drones 06 00277 g011
Figure 12. Vărăști site: Digital surface model (DSM, top) and digital terrain model (DTM, bottom). (coordinates in EPSG:3844).
Drones 06 00277 g012
Table 1. Specifications of the used image acquisition hardware [37].
DJI Phantom 4DJI Phantom 4 (MS)DJI Mavic 2 ProDJI Mavic 2 Enterprise
Resolution (px)4000 × 30001600 × 13005472 × 30784056 × 3040
Sensor size (mm)6.2 × 4.94.9 × 4.013.8 × 7.76.17 × 4.55
Pixel size (μm)1.563.042.531.51
Focal length (mm) 3.65.710.04.5
Table 2. Comparison of flight duration, number of batteries, and point density (PD)/GSD for two test sites and various platforms.
1 × 1 kmTrinity 90+ and Qube 240DJI Mavic 2 ProDJI Phantom 4 MS
Height AGL(m)801001208010012080100120
Duration (hh:mm:ss)00:27:4300:23:2600:20:3203:43:5003:02:3702:36:0506:02:3304:55:3104:08:32
Number of batteries111987151210
PD/GSD118 pts/m294 pts/m278 pts/m22.0 cm2.5 cm3.0 cm4.3 cm5.4 cm6.5 cm
250 × 250 mTrinity 90+ and Qube 240DJI Mavic 2 ProDJI Phantom 4 MS
Height AGL. (m)801001208010012080100120
Duration (hh:mm:ss)00:05:3200:05:1400:06:0000:17:2100:15:5500:14:2000:29:2800:24:1100:22:56
Number of batteries111111211
PD/GSD118 pts/m294 pts/m278 pts/m22.0 cm2.5 cm3.0 cm4.3 cm5.4 cm6.5 cm
Table 3. Overview of some of the data acquired within the framework of this research, with reference to the next section.
LocationYearTechniqueGSD/ResolutionArea (Ha)Registration Error (3D, cm)
Sultana2018RGB2.3 cm97.4
2019RGB2.7 cm32.7
2021RGB2.5 cm103.1
2022MS27.5 cm2199.5
2022ALS104 pts/m25775.0
Chiselet2019RGB2.7 cm32.7
2021RGB2.5 cm103.1
2022MS27.5 cm2199.5
2022ALS93 pts/m25775
Valea Orbului2022MS27.5 cm2199.5
2022ALS93 pts/m25206.2
Măriuța2022MS27.5 cm2199.5
2022ALS93 pts/m25775
Gumelnița2018RGB2.3 cm97.4
2019RGB2.7 cm32.7
2021RGB2.5 cm103.1
2022MS27.5 cm2199.5
2022ALS93 pts/m25775
Table 4. Results of the ANOVA, where the four different datasets are compared with each other (SS is the sum of squares; df is the number of degrees of freedom; MS is the mean square; F is the F-value; p is the probability value; Fcrititcal is the critical F-value).
Source of VariationSSdfMSFpFcritical
Between groups1.11630.3720.0470.9872.628
Within groups3017.4513807.941
Total3018.667383
Publisher’s Note: MDPI stays neutral with regard to jurisdictional claims in published maps and institutional affiliations.

