Abstract
The rapid development of Internet of Things (IoT) technology, together with mobile network technology, has created a never-before-seen world of interconnection, evoking research on how to make it vaster, faster, and safer. To support the ongoing fight against the malicious misuse of networks, in this paper we propose a novel algorithm called AMDES (unmanned aerial system multifractal analysis intrusion detection system) for spoofing attack detection. This novel algorithm is based on both wavelet leader multifractal analysis (WLM) and machine learning (ML) principles. In earlier research on unmanned aerial systems (UAS), intrusion detection systems (IDS) based on multifractal (MF) spectral analysis have been used to provide accurate MF spectrum estimations of network traffic. Such an estimation is then used to detect and characterize flooding anomalies that can be observed in an unmanned aerial vehicle (UAV) network. However, the previous contributions have lacked the consideration of other types of network intrusions commonly observed in UAS networks, such as the man in the middle attack (MITM). In this work, this promising methodology has been accommodated to detect a spoofing attack within a UAS. This methodology highlights a robust approach in terms of false positive performance in detecting intrusions in a UAS location reporting system.
1. Introduction
The "information age" has provided infinite possibilities of interconnecting various devices. Nowadays, networks have extended to every corner of our lives, thanks to their accessibility and versatility. Network technologies that used to be mission-specific and platform-restricted are now becoming more open and free of charge for general, day-to-day applications. However, the rapid growth of networks also creates bubbles, especially from the Internet of Everything (IoE) perspective. By adopting off-the-shelf components and off-the-git software, the development of IoE has greatly accelerated, with network security continuing to be a critical factor. Securing a network is considered just as challenging as constructing the network itself. Network attacks with similar characteristics can be targeted to various networks of markedly different physical entities. Among the different kinds of network attacks, the denial of service (DoS) flooding attacks and MITM/spoofing attacks are both commonly found in network systems, such as UAS and RADAR systems. These attacks have brought various challenges to the network developer and administrators. Recently, studies on UAS IDS dedicated to flooding anomalies [1] have been conducted. This type of attack severely disrupts the normal operation of a network by injecting an enormous amount of traffic into the network, paralyzing the entire system. While it has been demonstrated that an accurate model-based IDS dedicated to DoS attacks can perform adequately, such attacks are detectable by MF analysis [2,3] with better performance. Spoofing is another more elaborate form of attack that targets specific data packets within specific system communications. This malicious intrusion aims to disrupt the normal operation of a system by altering crucial information transmitted between subsystems. In a complex system such as a UAS, once the network security is compromised, the condition in which to generate either type of attack is reached.
Additionally, in recent years, the number and diversity of applications involving UAS have grown rapidly. Swarms of UAVs are gaining popularity in commercial applications, such as drone light shows. Despite their magnificent and striking appearance, the related security issues are concerning. In critical situations where a cyber-attack is introduced into a wireless drone network, the physical UAS can be threatened, which can cause the whole swarm to crash. This concern has led to increased interest from the network community to design anomaly detection systems (ADS) or IDS for this specific situation. Furthermore, operations within an agglomeration, fully autonomous operations, and out-of-sight UAV operations are currently subject to strict regulations such as [4] for the European Union (EU) and [5] in the United States. In addition, there is the General Data Protection Regulation (GDPR) in the EU [6]. Further regulations exist for UAV categorization, certification, and integration into civil airspaces, such as the road maps in the EU [7] and the relevant regulations reviewed in [8]. We can conclude that there is a clear need for a reliable communication network for UAS with robust measures implemented to counter network intrusions and better protect the physical system of the UAS and the confidentiality of the data being transmitted through the UAANET. Thus, it is imperative to ensure the safe and healthy development of the future UAS, in compliance with the current and prospective regulations.
Motivated by the practical problems encountered with UAS network security, we aimed to further develop the potential of the IDS methodology that we proposed in [1], a methodology that takes advantage of the randomly varying nature of network statistics to detect network intrusions, by accomplishing it with a ML classification algorithm. In this article, we propose using the improved methodology to detect spoofing attacks for UAS location reporting systems. Guided by both WLM and ML principles, this new algorithm theoretically has a robust approach in terms of false positives in order to determine intrusions in a location reporting system.
As a preliminary result of this paper, the newly designed algorithm has been successfully applied to some relevant practical problems, such as a low intensity MITM attack in RADAR traces. Results are provided to illustrate the performance and potential of this algorithm.
The rest of the paper is structured as follows. The presentation in Section 2 of the methodology explains the general framework of the proposed IDS system. In addition, the theoretical background involved is clarified. Section 3 examines the application and simulation of the proposed methodology, detailing the specific simulation environment, data treatment and dataset generation from realistic RADAR traces obtained from a real Air Traffic Management (ATM) RADAR network system. In Section 4, we present the results and discuss the performance of this methodology based on the results. In Section 5, we present a state-of-the-art summary of current research prior to the Conclusion, to allow the reader to better evaluate our proposal against existing works; and finally, in Section 6, we conclude and present proposals for the future development of the project.
2. The Proposed Intrusion Detection Methodology
2.1. IDS Framework
To take into account a modern type of intrusion which is particularly covert, such as an MITM attack within a location report and control packets, the research efforts have been shifted from network statistics to the payloads of network packets (e.g., the geo-position packets). The IDS methodology is based on a two-step process (as shown in Figure 1). In general, the IDS framework works starting by collecting information from the network by means of network sensors that are running capturing devices (either distributed or centralized sensors depending on the topology of the network). The collected data are then properly treated within the pre-treatment step to better expose the features of interest. This stage of processing is unique to each problem. In the demonstration shown in Section 3, the particular pre-treatment step was achieved by a moving sample window and an algorithm used to calculate the moving Euclidean distance of each aircraft. Then the first stage of IDS (step 1) is dedicated to traffic characterization. Its objective is to obtain a specific signature of the signal we seek to analyze. The next stage (step 2) is the automatic classification of the signatures via a neural network model, the objective being to provide a binary trigger to either alert the administrator or start countering mechanisms, such as an IPS.
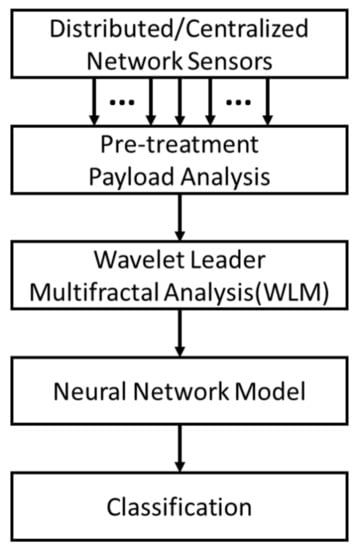
Figure 1.
General framework of the proposed IDS system.
2.2. Wavelet Leader Multifractal Analysis
In our previous research, the WLM analysis for a UAV network was introduced [1]. Here we demonstrate the advantageous capability of the tool at capturing different density levels of singularities of the signal at different time scales and statistical moments of analysis. We show that this method can be efficient against flooding attacks within the UAS wireless network. Network signals of the same system, during different times of day and time scales, should share similar MF characteristics; for example, when zooming in and out of different time scales, in a time series, the distribution of local Höder exponent h should exhibit similar patterns.
MF analysis is essentially a mathematical term used for measuring or estimating the function of MF spectrum of a certain time series. Instead of trying to describe the process by one constant scaling exponent (Fractal dimension D), the intention of the MF analysis is to provide a way to describe the distribution of the local Höder exponents.
For a random process , at each point , its local Höder exponent can be given as . Then its iso-Höder set with respect to different values of h can be expressed as:
Thus, the MF spectrum of such process can be defined as the Hausdorff (or fractal) dimension of the iso-Höder set:
The direct numerical determination by computing the MF spectrum is impractical because it requires the calculation of the local Höder exponent at each point. Hence, the MF formalism is introduced, and describes the MF spectrum by the Hurst dimension when analyzing the signal at different scales q. The MF spectrum is related to the Hurst dimension through a Legendre transformation, as described in [9]:
where d is the dimension of the signal.
The wavelet leader (WL) coefficient is one of many multi-resolution quantities that can be used to estimate the MF spectrum . This is achieved thanks to the multi-resolution properties of the structure function of the WL coefficient. This allows the accurate approximation of by replacing with . The MF spectrum estimated by the WL structure function provides a tight upper bound of the actual MF spectrum:
For simplicity, throughout the rest of the paper, the estimated MF spectrum is denoted as as the MF spectrum signature of the signal.
WLM analysis is frequently used to quantify the variability of any time series we wish to characterize: we focus here on the geo-position information of aerial vehicles. This method was first introduced by Dr. Herwig Wendt to analyze dynamical turbulence data (see [3,9,10,11,12] for details), and has the advantage of capturing the complexity of traffic for different time scales and different moments of analysis. This analysis then returns a numerical signature used to find the difference between legitimate traffic and traffic that contains an attack. Comparing this to the more traditional discrete wavelet method, this method not only shares the same advantageous performance boost, because they both rely on orthogonal wavelet decomposition and benefit from fast decomposition algorithms, but it also correctly estimates the MF spectrum at negative moments.
However, it is noted that when defining a fractal or self-similar system, it is necessary to verify the existence of the most significant scale which dominates the random process. Instead, for other types of random systems which only exhibit fractal behaviors in some individual ranges, the multifractal spectrum is a powerful tool for analyzing and characterizing the processes.
In this case, it is important to verify the similarity and patterns that emerge from the collected test samples of normal and abnormal data, as shown in Figure 5. It is quite apparent that even though it is not strictly proven that the moving traces acquired in this chapter are multifractal, the MF signature is still capable of distinguishing the differences.
The WLM (currently revised as the wavelet p-leader and bootstrap based multifractal analysis (PLBMF)) MATLAB toolbox, designed by Wendt et al., provides a simple and straightforward solution for estimating the MF spectrum by calculating the scaling function with the wavelet leader coefficient at given moments and then estimating the MF spectrum. It returns multiple attributes, which show different aspects of the multifractality of the analyzed signal, such as the set of structure functions S, the scaling exponent , the scope of local Höder exponents, and the estimated MF spectrum .
2.3. Machine Learning Signature Classification
The next step after signature acquisition is to compare the signatures of the normal traffic to that of the traffic containing malicious intrusion, and then to observe the patterns that emerge from the different intensities of attack.
When considering the applicable methods, we first investigated the possibility of applying analytical methods, such as the curve matching algorithm proposed in [13], which is similar to our previous approach [1]. However, this was found to be inefficient. Such a method can be effectively applied to detecting a DoS attack due to the fact that this attack can significantly deviate the signature of the signal from that of the normal ones, thereby making it apparent in the similarity score. In addition, in the literature [14,15,16,17,18,19], we found that machine learning classification outperforms the analytical method. More sophisticated neural networks have also been proposed to directly address the IDS problem as a whole, such as the one proposed in [20].
For the purpose of this research—to demonstrate the possibility of achieving an automatic alert when an intrusion is detected within the system—we first considered supervised learning, such that a binary trigger can be obtained from the classification. We selected the long short term memory (LSTM) network as the classification method, as it is simple and relatively easy to implement with good results for time series classification. Nevertheless, it is also possible to apply other classification methods, such as the support vector machine (SVM) or the convolution neural network (CNN) and treat the signatures as 2D images.
LSTM is a modified recurrent neural network (RNN), frequently used for time series, voice, and text classification. In comparison to the more conventional feed-forward neural network structures, such as CNN, RNN allows the modification of its internal states based on the output of the previous state, thereby forming a feedback structure. Classic RNN structures suffer from a gradient vanishing problem. To solve this, recent research has widely suggested using LSTM cells, as they can retain memory for an arbitrary duration and potentially solve this problem.
As shown in Figure 2, a typical LSTM neural unit consists of a cell, an input gate, an output gate, and a forget gate. This structure allows the network to preserve information from the previous state (past) with a weight. The cell state (c) is constantly updated by the gates according to the input state (X) and the hidden state (h). First, the forget gate (F) decides to what extent the information in the cell state will be preserved. Next, the input gate (I) decides which individual values in the cell state are to be updated, along with the levels of modification. Finally, the output gate (O) makes a filtered copy of the cell state to pass to the next state.
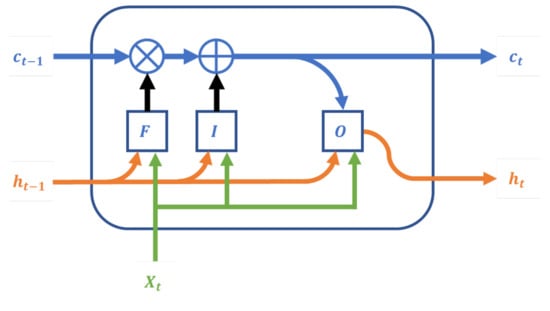
Figure 2.
A simplified LSTM unit.
The particular LSTM network we made has a bidirectional LSTM (BiLSTM) network structure, typically used for sequence and time series classification. A BiLSTM basically duplicates and stacks an additional LSTM layer alongside the original LSTM layer and makes it run in the opposite direction (backward), which allows the network to preserve information from the next state, as shown in Figure 3. This method of implementation increases the network’s ability to understand the context of the signal. A BiLSTM will generally outperform a regular unidirectional LSTM of similar complexity in tasks such as classification and forecasting, as illustrated in [21,22,23,24]. Our proposed model consists of a 1D sequence input layer, a BiLSTM layer of 500 hidden units, a fully connected layer, and a softmax layer.
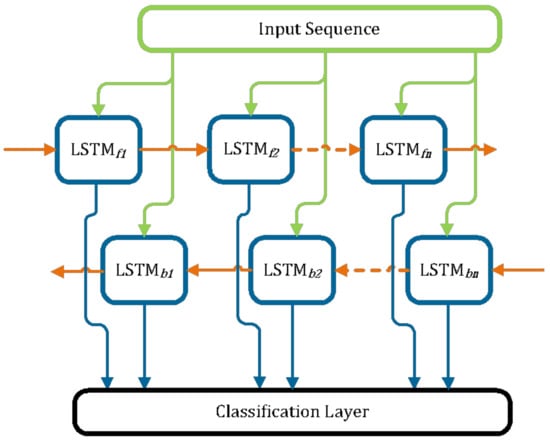
Figure 3.
Typical architecture of a Bi-LSTM.
3. Application to Experimental Data
3.1. UAS Mobility Simulation
To demonstrate the feasibility of such a methodology, in the absence of a physically operating UAS, we have designed a test bench based on pre-recorded RADAR network recordings. Instead of applying random walk mobility models that have been employed in other research, we considered the mission profiles and mobility patterns of modern aircraft to be more suitable representations of a complex UAS. Thus, we considered that the RADAR recordings are viable representations of what a UAS ground control station would observe in a UAS network for the following reasons:
- Payload Each UAV would report its geographical position at a certain time period either for displaying or back-feeding purposes to allow its back-end control and path planning.
- Mobility The individual UAVs can join and leave the network at random times. The RADAR traces capture this behavior approximately by observing aircraft entering and exiting the scope of the RADAR.
- Infrastructure A UAS, like any other modern complex system, relies heavily on modern infrastructures, such as ports, stations, and check points, which closely resemble what is available in an existing civil aviation system.
- Mobile patterns The movement patterns of planes are similar to those of a drone system in an operational condition.
3.2. Pre-Treatment Euclidean Distance
Before the actual test, the individual recordings were processed to calculate the Euclidean distance: The output array consists of the moving distance that each UAV has traveled between each consecutive recording. Within the original recordings, each UAV position is defined using polar coordinates, such as:
[] where
We then define a function : is detailed thereafter:
where is the reporting interval of each individual UAV.
The pseudo-code of Euclidean distance array calculation from UAV positions is detailed in Algorithm 1.
| Algorithm 1: Euclidean distance from UAV position. |
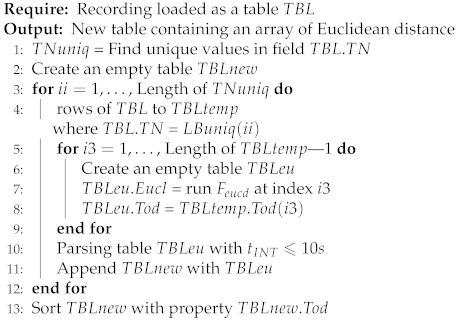 |
As shown in Algorithm 1, each recording file was loaded as a table () with fields, such as position in and , packet destination (), flight number (), and time of day (). The purpose of Algorithm 1 is to obtain a new table to record the calculated travel distance of each UAV. We achieved this by calculating the Euclidean distance of each UAV between two consecutive records and saving this information in a field of a new table . The of the latter record was used as the time stamp.
We iterated according to Algorithm 1 for each recording file, obtaining the —the list of random aircrafts’ travel distances recorded at time t. This process better compresses the data and better exposes the abnormal moving patterns induced by the intruders.
3.3. Test Environment
Instead of focusing on variations in the network traffic, in this study, we only partially took into account the payload of the network, such as the coordinates and time. We excluded the physical effects of the network, such as propagation delay, network congestion, and packet loss, as considered in [1].
In this test, we considered the link between the drone and the GCS to be compromised and the malicious user to be initiating an MITM attack by intercepting packets from UAVs, changing the coordinates, and transmitting the forged packets to their original destination. Such an attack is particularly interesting because it is silent and trivial. Network traffic is not significantly modified, and the normal operation for the network itself remains mostly unaltered. We needed to exploit the internal pattern within the payload of each packet instead of the statistics of the network. The received packets on the receiver side were all stored and processed in a.csv file, with each row containing one polar coordinate record of a UAV’s position, time of scan, flight number, and frame number.
In this test, we considered to be a random time variable close to the physical period of the RADAR which indicates the time interval of the radar scanning through the same aircraft twice.
Note that, in this particular case, only 10 s was taken into account as one trajectory: It is possible for the network to lose packets or for the aircraft to leave and re-join the network at different times of day and at different points of exit and re-entry. There are also cases where after an aircraft has left the network for a long period of time; the flight number is reassigned to a new aircraft entering the scope. Hence, it is important to filter the RADAR recordings to avoid taking into account the erroneous traces of aircraft flashing from one point to another in the RADAR’s scope due to inaccurate recordings. The 10 s time window was selected to eliminate records that share the same but are actually missing more than two frames.
3.4. Datasets
The simulation environment was constructed based on the RADAR records. In total, 31 RADAR records were processed, which corresponded to one month of data. Each original recording contained around 800,000 samples. Each original recording was then used to generate 36 versions of traces with different levels of attack. The simulated attacks were conducted by randomly selecting a number of aircraft with the specific TN, then altering the recorded trajectories by a random amount between 0 and 10%. Each original or modified recording was then scanned by a moving window with a length of 100,000 samples, and the moving step was 10,000 samples. The process of dataset generation is illustrated in Figure 4.
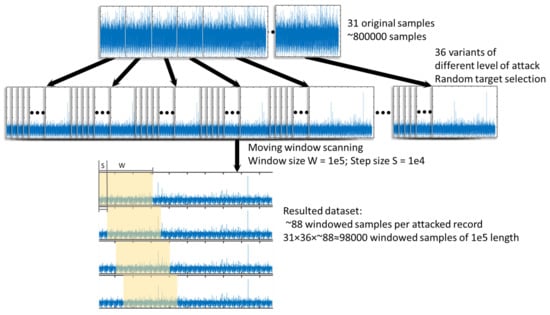
Figure 4.
The process of dataset generation.
The windowed samples, which contained belonging to the selected attack list, were set to label 1, indicating that they were attacked records, and those that did not contain such were labeled as 0, accordingly, indicating that they no attack took place.
To avoid significantly out-weighting the normal set with the attacked set, a number of traces with a miniature attack (1 A/C, 1–10%) were also generated for the training set and considered as normal records. Due to the limited number of recordings available, the number of samples for a normal recording was around 25,000. To finally balance the dataset, the normal samples were padded by duplicating the normal dataset by a factor of 3, thereby creating a normal set of around 75,000 samples. The exact distribution of the datasets is given in Table 1.

Table 1.
Distribution of samples in the dataset.
For verification purposes, the dataset generation process was replicated to generate a performance verification set, excluding the consideration of balancing.
4. Results
4.1. WLM Signatures
We show two sets of sample MF spectrum signatures obtained from the WLM toolbox, as discussed in Section 3. As shown in Figure 5, during our test, we found that the signatures of the Euclidean distance records of attacked traffic deviated from the normal ones. For the normal signal, the level of multifractality is relatively consistent, as shown by the span of h, which mostly ranges between 0.6 and 1, as shown on the left-hand side of Figure 5. The span of h is much wider, however, ranging between 0.3 and 1 in the sampled abnormal signal, as shown on the right-hand side of Figure 5. The MF spectrum also shows different trends, as the curves appear to be mirrored. Some twisting patterns are also visible. Such twists are observed in the extreme cases where a high-intensity attack with large modifications is present in the signal. This kind of attack will disrupt the originally monotonic descending behavior of the Hurst dimension , making it become non-monotonic, thereby creating the twist in the estimated MF spectrum.
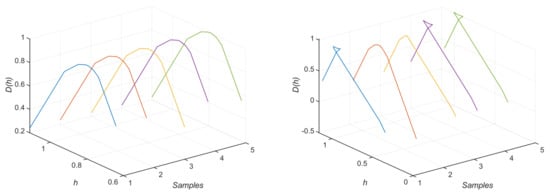
Figure 5.
WLM signatures of: (left) normal traces, (right) abnormal traces.
The signatures, though containing visually distinguishable features, are extremely difficult to identify by applying the curve matching algorithm mentioned in [1,13], because it is almost impossible to set a correct detection threshold without significantly sacrificing the accuracy or the false positive rate, particularly in cases where the attack level is low enough. In addition, the twisting behavior exhibited in the abnormal signatures is not correctly taken into account by the curve matching algorithm, hence our motivation for applying more advanced classification methods, such as the LSTM.
4.2. Machine Learning Classification
To apply a machine learning classifier to our problem, we first had to train with the training dataset. Since the training set was relatively balanced, it did not provide a significantly biased classification result.
The performance of the methodology was firstly measured by the following evaluation matrices:
- True positive (TP): attacked record that returned 1 from our IDS;
- True Negative (TN): non-attacked record that returned 0 from our IDS;
- False positive (FP): non-attacked record that returned 1 from our IDS;
- False Negative (FN): attacked record that returned 0 from our IDS;
The matrices are typically compiled as one matrix, called a confusion matrix. From this, the detection accuracy (ACC) is defined:
The verification performance is shown in Figure 6.
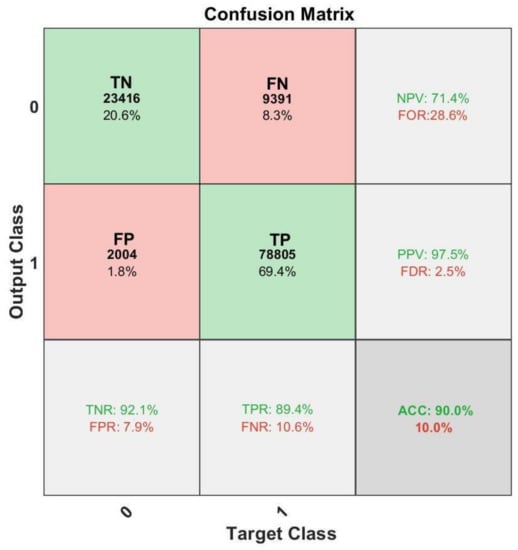
Figure 6.
Confusion matrix of the performance verification with LSTM.
The IDS performance was also measured against attacks with different intensities (dictated by the number of A/C attacked). This is represented by an accuracy vs. inaccuracy matrix in percentages, as shown in Figure 7.
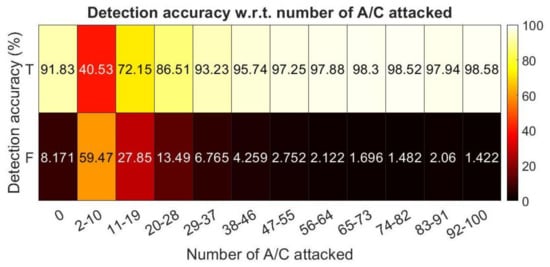
Figure 7.
Verification with LSTM at different intensities.
As for Figure 6, the main confusion matrix is plotted in red vs. green boxes, where the number of samples and overall probability of samples falling into particular categories are shown. The additional performance indexes are provided in the corresponding gray boxes.
- True positive rate (TPR), positive predictive value (PPV);
- False negative rate (FNR, false discovery rate (FDR);
- True negative rate (TNR), negative predictive value (NPV);
- False positive rate (FPR), false omission rate (FOR);
The overall accuracy was around 90.0%, whereas the relative FP and FN rates were 7.9% and 8.3%, respectively. Due to the way in which the modification levels are generated, 600 aircraft of different TN were presented on average. The attack intensity is mostly dependent on the number of A/C attacked. It is apparent in Figure 7 that with a higher intensity of attack, it was extremely easy to distinguish the malicious recordings from the normal ones. In the scenarios where only a small number of A/C were spoofed, the proposed methodology struggled to provide a valid classification. When there were zero A/C attacked, as shown on the far left of Figure 7 (which means the input samples contained no which appeared on the attack list), the method was able to return a good accuracy regarding true negatives.
Aside from the LSTM classification mentioned above, to better establish a performance baseline and demonstrate the advantages of LSTM, the experiment was replicated with another commonly used ML classification algorithm: SVM.
The IDS performance was also measured against attacks with different intensities (dictated by the number of A/C attacked). This is represented by an accuracy vs. inaccuracy matrix in percentages, as shown in Figure 8.
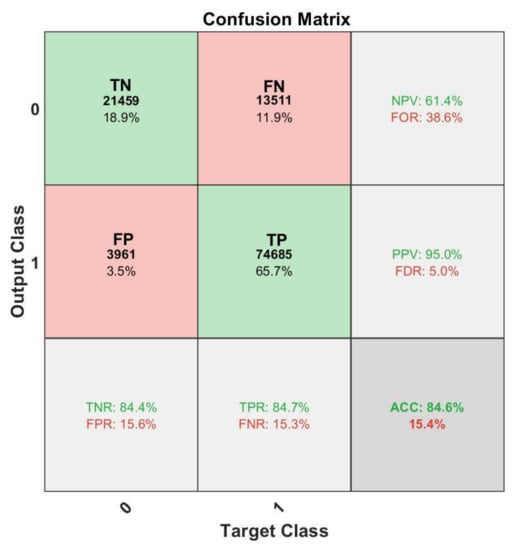
Figure 8.
Confusion matrix of the performance verification with SVM.
As shown in Figure 8 and Figure 9, the performance demonstrated here with SVM was slightly worse compared to the ones obtained with LSTM, although it should be noted that the performance matrices are dependent on the design and optimization of the ML schemes. With proper design, the performances of the two classification tools can be improved. Thus, the purpose of bringing SVM classification into the picture was to provide a better empirical perspective into the possible performance with an IDS of a similar methodology.
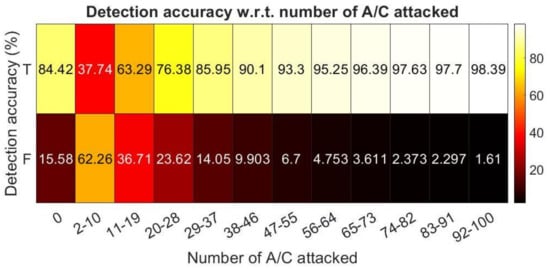
Figure 9.
Verification with SVM at different intensities.
5. Related Work
The surge in the growth of network attached devices has led to an urgent need for IDS and IPS advancements. In recent years, IDS has become a hot topic in the network community. Due to the complex nature of networks and their related security concerns, various research fields, including statistics, cybernetics, optimization, and machine learning, are all working to find ways to thwart intrusions from inside various networks. Here we provide a comprehensive state-of-the-art summary of the different research recently published on these related topics.
In [25], Asharf et al. provides a thorough and recent review of the state-of-the-art of IoT-related IDS. The authors provide a comprehensive introduction to the structures of current IoT systems. The challenges and corresponding IDS research are presented.
In [26], a global overview of multiple research areas and application domains regarding general anomaly detection is presented by Chandola et al. The authors provide a well categorized review of different anomaly detection technologies and their fields of application. We note that the anomaly detection methods in the field of biology vastly differ from those in the field of telecommunications, although the underlying principles are interlinked and the template the authors provide is thought provoking. Among the fundamental methods, deep learning and neural networks dedicated to intrusion detection received considerable attention in recent years in terms of the various models and performance evaluations.
In [27], Aldweesh et al. reviewed the recent advancements in deep learning-based IDS. The authors provide a clear overview of a variety of deep learning-based IDS of differing taxonomies. Their article is an excellent guide for popular deep learning algorithms for IDS.
In [14], Shi et al. propose an interesting approach for network traffic classification. The authors employ the traditional wavelet coefficients-based multifractal energy spectrum teamed with a neural network based on a multi-layer perceptron neural network. This is structurally similar to our approach but with a different target. They were able to confirm the accurate classification of three networking application classes (Http, Streaming, P2P).
In [28], the authors demonstrate a powerful intrusion detection and prevention system (IDPS) based on distributed sensors and a software-defined network (SDN), called BroFlow. The proposed BroFlow system was simulated in a virtual network and showed excellent performance against DoS attacks. The proposed methodology is of great interest to us, as we plan to adopt a similar structure in our future research to achieve an automatic IPS based on SDR driven by our IDS. Besides this, rich literature can be found regarding IDS designs based purely on machine learning principles. For instance, in [15], Gwon et al. provide a clear implementation of an LSTM-based IDS design with feature embedding. The model was tested against the UNSW-NB15 dataset. A performance comparison against other methods is provided.
In [16], Kasongo et al. proposes using a deep LSTM (DLSTM) network-based classifier to solve classic IDS problems proposed in public datasets, such as the NSL-KDD intrusion detection dataset. The advantageous performance of a DLSTM in comparison with several other traditional neural network models is presented.
In [19], X. Zhou et al. propose a novel approach to solving the industrial big data anomaly detection problem by applying a variational LSTM (VLSTM) framework, which incorporates an LSTM based encoder–decoder structure with a variational reparameterization module and an estimation module. This is particularly interesting because the purpose of the compression network is to extract interesting features from a raw data input, and the hidden variables are used to fulfill the estimation and classification purposes. The VLSTM framework allows for the extraction of a variety of features, and thus allows for the detection of various types of anomalies.
Some propose to use another recurrent neural network model, such as the Gated Recurrent Unit (GRU), to solve IDS problems, as they are easier to train and do not require memory units.
In [17,18], the authors demonstrate a novel IDS based on a GRU recurrent neural network and present its superior performance over the more traditionally used LSTM network.
In [29], Amouri et al. propose using distributed network sensors and supervised learning methods to construct an IDS within a Wireless Sensor Network (WSN) and a mobile ad-hoc network (Mannet), which has improved accuracy. Within the literature, contributions were also found regarding rule-based IDS methods, which assisted us with envisioning the overall structure of our IDS design.
In [30], the authors provide an insightful overview of IDS design in general and also demonstrate an advanced pattern matching technique and its application in the Snort IDS framework. It is also worth noting that a number of articles were found to be inspiring for the future improvement of our IDS design.
In [31], Zhang et al. present an interesting implementation of two deep learning networks consisting of a teacher–student network structure, which shows promising perspectives for implementation in a mobile environment. The proposed network is relatively lightweight, allowing it to be integrated into a low-power platform, such as a UAV, while being able to perform accurate traffic image classification.
In [32], Shafique et al. provide a new insight into a new type of network intrusion, called ranking attack, which mostly targets the IoT devices employing IPv6. The authors provide an in-depth discussion on the attack, along with a method of IDS with good accuracy.
In [20], A. Abdelkefi. propose a complete approach for network traffic anomaly detection and root-cause analysis called SENATUS. SENATUS also takes advantage of the traffic statistics which require the minimum amount of knowledge of the packets. The method was successfully applied to practical problems such as DoS/DDoS attacks with good accuracy.
To the best of our knowledge, our proposed method is unique in solving an MITM problem in a wireless network that exhibits mobile proprieties. Our contribution differentiates itself from the methods proposed in [16,18,19,20,31] and others reviewed in [25,26,27]. Our method eliminates the use of a deep neural network, which is advantageous in terms of scalability, interpretability, and computational overheads.
6. Conclusions and Perspectives
In this paper, we proposed an innovative approach to achieve network spoofing attack detection. We proposed this new methodology with an improvement over our previously designed IDS: incorporating neural network classification. We designed a test bench and demonstrated the preliminary performance results, showing the effectiveness of this new design. As shown in Section 4, this new design permits us to achieve high detection accuracy while keeping a low false positive rate. Compared to the literature in Section 5, it is noted that our proposed method targets a very specific type of intrusion, which is commonly observed in mobile networks, such as the UAS network. Our method’s positive overall performance enables us to further investigate it and its implementation possibilities.
As a next step, we are looking to achieve increased performance by fine-tuning the WLM toolbox for better feature extraction and by applying different neural network models to lower the computational costs further and achieve lower latency. In addition, we plan to apply training and working performance comparisons between it and other existing IDS. Beyond that, we propose to optimize the WLM toolbox for the mobile communication network environment. Finally, we plan to implement this system within a working UAS, to further investigate research possibilities of embedded IDS in a drone swarm.
Author Contributions
Conceptualization, R.Z. and J.-P.C.; methodology, R.Z.; software, R.Z.; validation, R.Z., J.-P.C. and E.L.; writing—original draft preparation, R.Z.; writing—review and editing, R.Z.; visualization, R.Z.; supervision, J.-P.C. and E.L.; project administration, J.-P.C. and E.L. All authors have read and agreed to the published version of the manuscript.
Funding
This research received no external funding.
Institutional Review Board Statement
Not applicable.
Informed Consent Statement
Not applicable.
Data Availability Statement
Not applicable.
Acknowledgments
The authors would like to express their most sincere gratitude to Nicolas Larrieu for sharing his knowledge during numerous discussions, Herwig Wendt for sharing his expertise in multifractal analysis, and the TÉSA laboratory, Toulouse, France, for the support of this research project.
Conflicts of Interest
The authors declare no conflict of interest.
References
- Condomines, J.-P.; Zhang, R.; Larrieu, N. Network Intrusion Detection System for UAV Ad-hoc Communication from methodology design to real test validation. Ad Hoc Netw. 2018. Available online: https://www.sciencedirect.com/science/article/abs/pii/S1570870518306541 (accessed on 9 December 2021).
- Barry, R.L.; Kinsner, W. Multifractal characterization for classification of network traffic. In Proceedings of the Canadian Conference on Electrical and Computer Engineering 2004 (IEEE Cat. No.04CH37513), Niagara Falls, ON, Canada, 2–5 May 2004; Volume 3, pp. 1453–1457. [Google Scholar] [CrossRef] [Green Version]
- Fontugne, R.; Abry, P.; Fukuda, K.; Veitch, D.; Cho, K.; Borgnat, P.; Wendt, H. Scaling in Internet Traffic: A 14 Year and 3 Day Longitudinal Study, with Multiscale Analyses and Random Projections. IEEE/ACM Trans. Netw. 2017, 25, 2152–2165. [Google Scholar] [CrossRef] [Green Version]
- EU. Commission Implementing Regulation (EU) 2019/947 of 24 May 2019 on the rules and procedures for the operation of unmanned aircraft (Text with EEA relevance) C/2019/3824. Off. J. Eur. Union 2019, 45–71. Available online: https://eur-lex.europa.eu/legal-content/EN/TXT/?uri=CELEX%3A32019R0947 (accessed on 9 December 2021).
- FAA. Small Unmanned Aircraft Systems (UAS) REGULATIONS (Part 107). Small Unmanned Aircraft Systems (UAS) Regulations (Part 107) vert Federal Aviation Administration. 2020. Available online: https://www.faa.gov/newsroom/small-unmanned-aircraft-systems-uas-regulations-part-107 (accessed on 9 December 2021).
- EU. Regulation (EU) 2016/679 of the European Parliament and of the Council of 27 April 2016 on the protection of natural persons with regard to the processing of personal data and on the free movement of such data, and repealing Directive 95/46/EC (General Data Protection Regulation) (Text with EEA relevance). Off. J. Eur. Union 2016, 1–71. Available online: https://eur-lex.europa.eu/eli/reg/2016/679/oj (accessed on 9 December 2021).
- EU. Commission Implementing Regulation (EU) 2021/664 of 22 April 2021 on a regulatory framework for the U-space (Text with EEA relevance) C/2021/2671. Off. J. Eur. Union 2021, 161–183. Available online: https://eur-lex.europa.eu/legal-content/EN/ALL/?uri=CELEX%3A32021R0664 (accessed on 9 December 2021).
- Stöcker, C.; Bennett, R.; Nex, F.; Gerke, M.; Zevenbergen, J. Review of the Current State of UAV Regulations. Remote. Sens. 2017, 9, 459. [Google Scholar] [CrossRef] [Green Version]
- Wendt, H. Contributions of Wavelet Leaders and Bootstrap to Multifractal Analysis: Images, Estimation Performance. Dependence Structure and Vanishing Moments. Confidence Intervals and Hypothesis Tests. 2008. Available online: https://www.semanticscholar.org/paper/Contributions-of-Wavelet-Leaders-and-Bootstrap-to-Wendt/35c37137b8b51bd302967e0af861ce99347932a2 (accessed on 9 December 2021).
- Wendt, H.; Abry, P.; Jaffard, S. Bootstrap for Empirical Multifractal Analysis. IEEE Signal Process. Mag. 2007, 24, 38–48. [Google Scholar] [CrossRef]
- Wendt, H.; Abry, P. Multifractality Tests Using Bootstrapped Wavelet Leaders. IEEE Trans. Signal Process. 2007, 55, 4811–4820. [Google Scholar] [CrossRef] [Green Version]
- Wendt, H.; Roux, S.G.; Jaffard, S.; Abry, P. Wavelet Leaders and Bootstrap for Multifractal Analysis of Images. Signal Process. 2009, 89, 1100–1114. [Google Scholar] [CrossRef] [Green Version]
- Grim, A.; O’Connor, T.; Olver, P.; Shakiban, C.; Slechta, R.; Thompson, R. Automatic Reassembly of Three-Dimensional Jigsaw Puzzles. Int. J. Image Graph. 2016, 16, 1650009. [Google Scholar] [CrossRef]
- Shi, H.; Liang, G.; Wang, H. A novel traffic identification approach based on multifractal analysis and combined neural network. Ann. Telecommun. Ann. Télécommun. 2014, 69, 155–169. [Google Scholar] [CrossRef]
- Gwon, H.; Lee, C.; Keum, R.; Choi, H. Network Intrusion Detection based on LSTM and Feature Embedding. arXiv 2019, arXiv:1911.11552. [Google Scholar]
- Kasongo, S.M.; Sun, Y. A Deep Long Short-Term Memory Based Classifier for Wireless Intrusion Detection System. 2020, pp. 98–103. Available online: https://www.sciencedirect.com/science/article/pii/S2405959519301699 (accessed on 9 December 2021).
- Chen, Z.; Zhang, W.; Xie, Z.; Xu, X.; Chen, D. Recurrent Neural Networks for Automatic Replay Spoofing Attack Detection. In Proceedings of the 2018 IEEE International Conference on Acoustics, Speech and Signal Processing (ICASSP), Calgary, AB, Canada, 15–20 April 2018; pp. 2052–2056. [Google Scholar]
- Xu, C.; Shen, J.; Du, X.; Zhang, F. An Intrusion Detection System Using a Deep Neural Network with Gated Recurrent Units. IEEE Access 2018, 6, 48697–48707. [Google Scholar] [CrossRef]
- Zhou, X.; Hu, Y.; Liang, W.; Ma, J.; Jin, Q. Variational LSTM Enhanced Anomaly Detection for Industrial Big Data. IEEE Trans. Ind. Inform. 2021, 17, 3469–3477. [Google Scholar] [CrossRef]
- Abdelkefi, A.; Jiang, Y.; Sharma, S. SENATUS: An Approach to Joint Traffic Anomaly Detection and Root Cause Analysis. In Proceedings of the 2018 2nd Cyber Security in Networking Conference (CSNet), Paris, France, 24–26 October 2018. [Google Scholar]
- Siami-Namini, S.; Tavakoli, N.; Namin, A.S. The Performance of LSTM and BiLSTM in Forecasting Time Series. In Proceedings of the 2019 IEEE International Conference on Big Data (Big Data), Los Angeles, CA, USA, 9–12 December 2019; pp. 3285–3292. [Google Scholar]
- Graves, A.; Fernández, S.; Schmidhuber, J. Bidirectional LSTM Networks for Improved Phoneme Classification and Recognition. In Proceedings of the Artificial Neural Networks: Formal Models and Their Applications—ICANN 2005, Warsaw, Poland, 11–15 September 2005; pp. 799–804. [Google Scholar]
- Graves, A.; Schmidhuber, J. Framewise phoneme classification with bidirectional LSTM networks. In Proceedings of the 2005 IEEE International Joint Conference on Neural Networks, Montreal, QC, Canada 31 July–4 August 2005; Volume 4, pp. 2047–2052. [Google Scholar]
- Graves, A.; Schmidhuber, J. Framewise phoneme classification with bidirectional LSTM and other neural network architectures. Neural Netw. 2005, 18, 602–610. [Google Scholar] [CrossRef] [PubMed]
- Asharf, J.; Moustafa, N.; Khurshid, H.; Debie, E.; Haider, W.; Wahab, A. A Review of Intrusion Detection Systems Using Machine and Deep Learning in Internet of Things: Challenges, Solutions and Future Directions. Electronics 2020, 9, 1177. [Google Scholar] [CrossRef]
- Chandola, V.; Banerjee, A.; Kumar, V. Anomaly detection: A survey. ACM Comput. Surv. (CSUR) 2009, 41, 15. [Google Scholar] [CrossRef]
- Aldweesh, A.; Derhab, A.; Emam, A.Z. Deep learning approaches for anomaly-based intrusion detection systems: A survey, taxonomy, and open issues. Knowl. Based Syst. 2020, 189, 105124. [Google Scholar] [CrossRef]
- Lopez, M.A.; Mattos, D.M.F.; Duarte, O.C.M.B. An elastic intrusion detection system for software networks. Ann. Telecommun. 2016, 71, 595–605. [Google Scholar] [CrossRef]
- Amouri, A.; Morgera, S.D.; Bencherif, M.A.; Manthena, R. A Cross-Layer, Anomaly-Based IDS for WSN and MANET. Sensors 2018, 18, 651. [Google Scholar] [CrossRef] [PubMed] [Green Version]
- Abbes, T.; Bouhoula, A.; Rusinowitch, M. On the fly pattern matching for intrusion detection with Snort. Ann. Télécommun. 2004, 59, 1045–1071. [Google Scholar] [CrossRef]
- Zhang, J.; Wang, W.; Lu, C.; Wang, J.; Sangaiah, A.K. Lightweight deep network for traffic sign classification. Ann. Telecommun. 2020, 75, 369–379. [Google Scholar] [CrossRef]
- Shafique, U.; Khan, A.; Rehman, A.; Bashir, F.; Alam, M. Detection of rank attack in routing protocol for Low Power and Lossy Networks. Ann. Telecommun. 2018, 73, 429–438. [Google Scholar] [CrossRef]
Publisher’s Note: MDPI stays neutral with regard to jurisdictional claims in published maps and institutional affiliations. |
© 2022 by the authors. Licensee MDPI, Basel, Switzerland. This article is an open access article distributed under the terms and conditions of the Creative Commons Attribution (CC BY) license (https://creativecommons.org/licenses/by/4.0/).