1. Introduction
The goal of a search and rescue (SAR) operation is to find a lost person alive and to provide the necessary assistance as soon as possible. Therefore, time is a key factor in this step. Reducing the search duration can be significantly achieved by using Unmanned Aerial Vehicles (UAVs or drones) for automated and reliable recording of the search area. In order to exploit the full potential of drones in this context, it is necessary to properly use the data from their sensors. This implies the need to develop a system that would allow automatic person detection in images collected using drones during SAR operation.
Thus, the main goal of this research is to develop a model for person detection in aerial images that could be used as a support method in real SAR operations, and that achieves better results than currently used or proposed models. Research presented in this paper is based on the previous research presented in [
1], which uses static aerial images and contextual information as the input to the multimodel neural network architecture that is used for person detection in aerial images of non-urban terrain gathered by an UAV. This model achieved a recall value of 94.66% and a precision value of 68.90%. However, these results could be further improved, especially in terms of precision value. Indirectly, a lower precision value is caused by a larger number of false positive detection. Hence, our further research is focused on reducing the amount of false positive detection and increasing the precision value. Thus, we propose an approach that uses image sequences as the input to the system. The proposed approach is based on the fact that an object detected in multiple consecutive images is more likely a true positive detection, while those objects that are detected in only one of consecutive images is probably a false positive detection. Three different types of algorithms based on person detection in image sequences are proposed, and all of them achieved improved results compared to the model presented in [
1].
This model was trained and tested on the HERIDAL database (
http://ipsar.fesb.unist.hr/HERIDAL%20database.html, accessed on 18 November 2021), specially designed for the purpose of detection of humans and other targets in aerial images and presented in [
2]. The HERIDAL dataset contains 1684 aerial images of nonurban areas taken with drones in a simulated scenario of SAR operation at different locations. All images contain at least one person in different poses. A total of 1583 images were used for model training, while 101 images were used for testing purposes. Due to the lack of image sequences in the HERIDAL database, which is crucial for this part of the research, a new set of aerial images that simulate situations in SAR operations has been collected. These new images were grouped in sequences and then used for the testing of the original model. This model has not been retrained, so the improvement of the results of person detection in aerial images is a consequence of the new algorithms that are proposed and presented in this paper. Therefore, our main contributions are as follows:
A new, improved model for person detection in aerial image sequences for a SAR scenario;
A model that uses the information about the location of an object detected in consecutive images in order to retain or discard the detected region;
By this approach, improved results in comparison with current state-of-the-art methods for person detection in aerial images.
This paper is organized as follows.
Section 2 describes literature related to this specific problem.
Section 3 presents a state-of-the-art model for person detection in aerial images of wilderness: RFCCD—RPN+FPN+Classification+Context +Deviation [
1]. The application of this model on the HERIDAL database along with the results obtained is also presented in this section. This model serves as the basis for this research. Therefore, in
Section 4, the results of this model used in a completely new set of image sequences collected for the testing purposes of this research are presented. The following section presents the algorithm for improving the results of the RFCCD model using information about vector displacement between detected objects in two consecutive images.
Section 6 contains the results obtained using different types of proposed algorithms, along with a detailed description. The last section provides the overall conclusion.
2. Related Work
SAR operation is a process that aims to find and provide adequate assistance to a lost person. This process consists of four basic steps: locate, access, stabilize, and transport the lost person [
3]. There are several categories of SAR, depending primarily on the geography or terrain, which could be roughly classified as urban search and rescue (USAR) or wilderness search and rescue (WiSAR). USAR involves rescuing from demolished buildings or other urban facilities, where persons are often trapped underneath collapsed structures. The reason may be various natural disasters (earthquakes, floods, tornado, hurricane, etc.), but also those caused by humans (war, terrorist attacks, etc.). Another type of SAR operation (WiSAR) involves searching for a missing person in a non-urban area (in caves, at sea, in the mountains, in a lowland area, etc.). This paper is concerned with wilderness SAR.
All types of SAR operations have the following requirements in common: they must be addressed quickly and efficiently to prevent further injury or death because any delay can have direct, dramatic consequences for human life [
4]. In many cases, rescue efforts are hampered by the simple inability to pinpoint the location of the lost person, which means that the first step of this process (locating the missing person) results in valuable time being wasted.
As time is a crucial factor, it is necessary to continuously develop new techniques to speed up the search process. For this purpose, the use of Unmaned Aerial Vehicles (UAVs) is becoming an integral strategic part of SAR operations [
5,
6]. UAVs can provide detailed aerial imagery quickly and efficiently and thus directly enable advance decision making processes, which provides considerable support for an SAR team [
7].
Many published papers in the field of UAVs used for SAR purposes are based on the use of thermal cameras that can detect the human body, due to the difference in temperature between the human body and the background [
8,
9,
10]. The authors in [
10] used a combination of two cameras, thermal and colour, and performed detection aboard UAVs. They first analyzed infrared images in order to find a human silhouette and then used colour image regions to classify human bodies. Images collected during the SAR operation should be processed aboard the UAV or forwarded for further processing. However, processing high-resolution images causes high computational complexity, which is difficult to perform on the UAV due to the limited computational resources. While transferring images from the UAV to the ground station, the images should not be compressed because compression causes a loss of information, which can have negative impacts in that it requires further processing to find a very small object of interest. Although lossless compression techniques exist, they also demand significant computing power on the UAV to execute a compression algorithm on high-resolution images, which is often impractical and requires additional time. Therefore, it is more applicable to transfer original images from the UAVs to the ground station for further processing. An effective system for the transmission of high-resolution images is presented in [
11].
The problem of person detection in aerial images of non-urban terrain can be classified as a problem of small object detection due to the high altitude of recording. Flying at a higher altitude allows a wider shooting area, so it takes less time to capture the entire geographical area which needs to be searched. These images contains extremely complex background where person covers less than 0.1% of the whole image, which requires high resolution images. In this case, images are 4000 × 3000 px. In general, the term “small objects” refers to those objects that are represented by a very small number of pixels in the image (less than 1% of the image). In recent years, small object detection has attracted much attention from researchers in the field of computer vision precisely, because it is widely applied in everyday life, e.g., autonomous driving [
12], traffic monitoring [
13], landfill monitoring [
14], robotics [
15], and video surveillance [
16]. However, object detection in aerial images is not an ordinary problem of small object detection. It is a challenging task primarily because of the small size of objects, but also because of the densely distributed different objects (objects that are not of interest, such as stones and vegetation), variations in the viewing angle and lighting, and often the partial or complete concealment of objects of interest. Observing the development of methods for object detection throughout history [
17], we can say that one of the major milestones was made with the rapid development of deep convolutional neural networks. The use of non-neural-network-based approaches requires first the use of techniques to extract the features (such as edges, corners and shapes) and then the classification techniques, while approaches based on neural networks are able to do end-to-end object detection, without specifically extracting features, so the latter are also commonly used for small object detection [
18,
19,
20,
21].
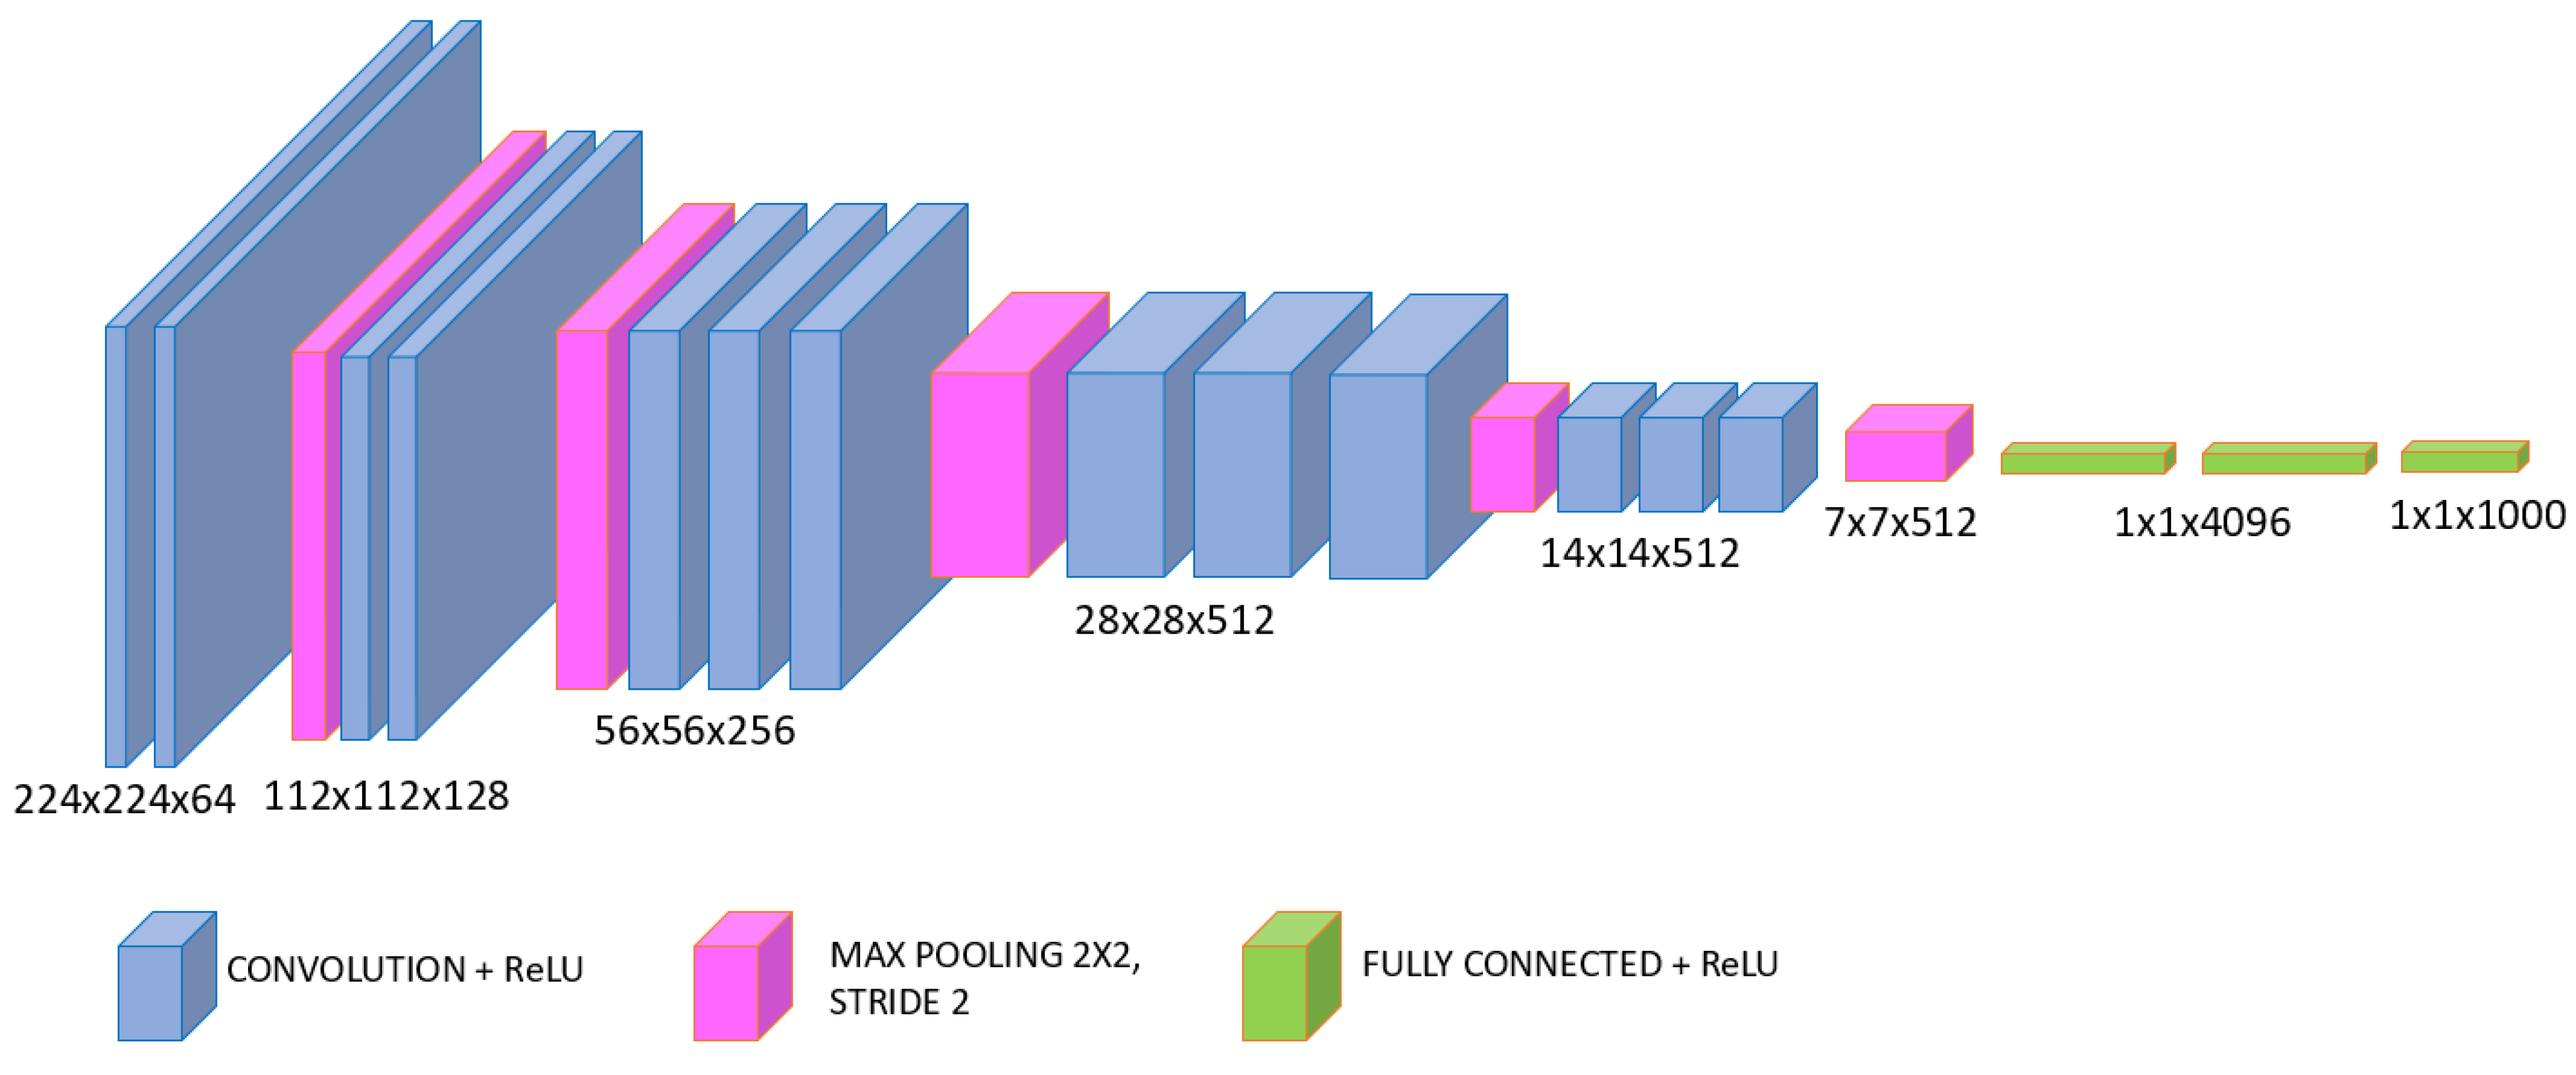
Various deep-learning-based approaches for object detection use foundational layers of the Convolutional Neural Network (CNN)—convolutional layers and pooling layers. A convolutional layer generates a feature map that records the precise position of the feature in the input. This means that the minor changes of the feature in the input image (e.g., rotation, cropping, etc.) would generate a different feature map. Pooling layers are used to generalize by summarizing the features from one region in a feature map. A new feature map contains all important elements, while fine details are discarded. This leads to down-sampling, which reduces the number of parameters that need to be learned. However, this could be a problem in small object detection. For example, an object of 32 × 32 pixels in an original image after five pooling layers with a stride of 2 would be represented by only one pixel, which often causes a failure in the detection of such objects. To better understanding down-sampling, an example of a typical CNN architecture, VGG16 [
22], is shown in
Figure 1. This architecture contains five pooling layers with a stride of 2, which means that the last feature map is downsampled five times to the first.
This is also the reason why even the performance of state-of-the-art methods for object detection such as Fast Region-Based Convolutional Neural Network (RCNN) [
23] and Faster RCNN [
24] often have a problem with small object detection [
25]. To address this problem, standard deep learning methods are often modified in various ways to be able to perform small object detection and thus achieve noticeable results [
26,
27,
28]. A comprehensive review of recently developed deep learning methods for small object detection is presented in [
29]. In the particular task of object detection in an aerial image, one of the challenges is to recognize the object from a different aerial perspective and angles, in various poses, even when it is partially occluded or while it is in motion. Human can recognize an object in an image even if it is rotated, scaled, translated, or partially obstructed from view. However, this task is far more complex in computer vision systems because of the way computers handle this problem. Additionally, human detection in aerial images can result in significant number of false positive detections. Since captured images during SAR operation are sequential, continuity of detected object in more than one image could be used to eliminate false positive alarms [
30,
31]. Image sequence analysis is widely used in computer vision due to the fact that the sequence of images contains more information than a single image, including dynamic aspects. This is useful especially in video object detection [
32], autonomous vehicles [
33], object tracking [
34,
35], etc. However, there are some differences between aerial target tracking technology and standard ground target tracking technology because of small number of pixels that represent the object, occluded targets, weak contrast between background and targets features, etc. [
36]. In order to reduce false alarms, some authors proposed a moving object detector using spatial and temporal information. In [
37], temporal saliency is used to get a coarse segmentation, and spatial saliency is used to obtain object details in candidate motion region. However, this method still has high false alarm rate in complicated conditions such as cluttered-background, occlusion and illumination. The approach in [
38] also consists of two stages—the first stage combines the motion and appearance information within the CNN and proposes a regions of interests which are in the second stage processed to localize the vehicles. This approach is powerless for smaller targets because visual features such as color, shape, and texture are difficult to identify.
3. RFCCD Model for Person Detection
Person detection in aerial images in an SAR scenario is very specific problem, and publicly available datasets suitable for use for this purpose are limited. Therefore, the authors in [
2] developed a new dataset named HERIDAL, which contains aerial images of non-urban terrain. To collect images that simulate real SAR scenarios, the authors used statistics and expert knowledge in SAR operations [
39]. This dataset was also used in our previous research, in which the main goal was to develop a multimodel deep learning approach for human detection in aerial images for supporting SAR operations. For this purpose, different deep learning methods were used, and a completely new approach was proposed. The new approach consists of multiple neural networks in the region proposal stage as well as in the classification stage. The approaches were as follows:
RPNC (RPN+Classification)—a standard RPN (Region Proposal Network) model [
24] used in the region proposal stage, and regions proposed by the RPN model were classified using a new neural network for binary classification, which is trained and tested on patches from the HERIDAL dataset;
FPNC (FPN+Classification)—a similar approach to RPNC with a difference in the region proposal stage where FPN (Feature Pyramide Network) [
40] was used;
RFC (RPN+FPN+Classification)– a new proposed multimodel approach where both architectures, RPN and FPN, are used in the region proposal stage;
RFCC (RPN+FPN+Classification+Context)—a new proposed multimodel approach like RFC but with an addition in the classification stage, which is, in this approach, also multimodel—proposed regions were classified using two different neural networks;
RFCCD (RPN+FPN+Classification+Context+Deviation)—a new proposed multimodel approach that uses RFCC and additionally rejects regions with a low standard deviation value in order to reduce the number of false positive detections.
To evaluate the results of all used methods, standard measures of precision and recall were used. Precision is a measure that expresses the ratio of the number of true positive detections to the number of total detections (both false positives and true positives). Recall is a measure that expresses the ratio of true positive detections in relation to the total number of objects of interest from ground truth labels, i.e., objects that should be detected. Equations for the calculation of these measures are given in Equation (
1), in which True Positive (TP) represents the number of true positive detections (detected objects that correctly represent an object of interest), False Positive (FP) is the number of false positive detections (objects that are detected but are not actually objects of interest), and False Negative (FN) is the number of false negative detections (objects of interest that are not detected).
A higher recall value implies a larger number of TP detections (a smaller number of FN detections), while a higher value of precision implies a smaller number of FP detections. Due to the specificity of this research, where the focus is on finding a lost person in an image and any FN detection means that the person in the image is not detected, undoubtedly the number of TP detections is the most important. On the other hand, any FP detection directs rescuers to the wrong location, which wastes time and human resources. Hence, the mail goal is to achieve results with some sort of balance between recall and precision measures. For this purpose, the F score measure is used in order to show how precise and how robust the system is. This measure is an aggregated indicator that actually represents the harmonic mean of the precision and recall measures in the way shown in Equation (
2).
The standard F measure is often called the
measure, where the number 1 denotes the equal importance of the precision measure and the recall measure. However, it is possible to assign greater importance to one of these measures by using a more general formula for the
measure, as shown in Equation (
3), where the parameter
shows the extent to which the recall measure is more important than the precision measure.
If a higher value of the precision measure is the main goal, it is better to have a low total number of detected objects rather than more FP detections. On the other hand, a higher recall issues a large number of TP detections regardless of the amount of FP detections. Since TP detections implies found persons, undoubtedly it can be concluded that the recall measure is more important in this specific task, but it’s hard to determine the extent. Therefore, in addition to the standard
measure, measures
,
, and
were used to present the results (even if the recall measure is 2, 5, or 10 times more important than the precision measure). The complete results for all used methods on images from the HERIDAL dataset are shown in
Table 1, where GT represents Ground Truth (the number of people in the images that need to be detected).
Observing the obtained results, it is noticeable that the RPNC method achieved better results in terms of recall, but still yielded a large number of FP detections and consequently a low value of precision. Oppositely, the FPNC method yielded a more optimal number of FP detections and thus predominated in terms of precision. However, it simultaneously reduced the number of TP detections (increasing the number of FN detections). Due to the specificity of this problem, where the focus is on finding a lost person in an image and any FN detection means that the person in the image is not detected, undoubtedly the number of TP detections is the most important. Therefore, it cannot be argued that this method is the best choice for use in actual SAR operations. On the other hand, any FP detection directs rescuers to the wrong location which wastes time and human resources. Thus, the main goal is to obtain results with a maximized number of TP detections but also a minimized number of FP detections.
To keep the benefits of the RPNC method, which achieves a large number of TP detections, as well as the FPNC method, which reduces the number of FP detections, we proposed a new multimodel approach named RFC. The proposed model takes full advantage of the RPNC model; it results in the same number of TP detections as RPNC and, equally important, reduces the number of FP detections thanks to the FPNC method. Since the achieved value of the recall measure is high enough, further research is aimed at reducing the number of FP detections. Accordingly, an RFCC approach is proposed in which contextual information is used in addition to the RFC approach in the classification stage. This is performed by the use of a pixel-based context [
41]. The obtained results show that including contextual features of the surrounding regions in the classification stage significantly reduced the number of FP detections while maintaining the maximal number of TP detections, achieved using RPNC. Furthermore, an additional reduction in the number of FP detections was achieved by discarding detected regions that have a low standard deviation at the pixel level (RFCCD model). Although the number of TP detections was slightly reduced, due to an improvement in the value of the precision measure, this approach achieved the most optimal results. Therefore, it can be concluded that, among all proposed methods, RFCCD is the most suitable for use in real SAR operations.
3.1. RFCCD Architecture
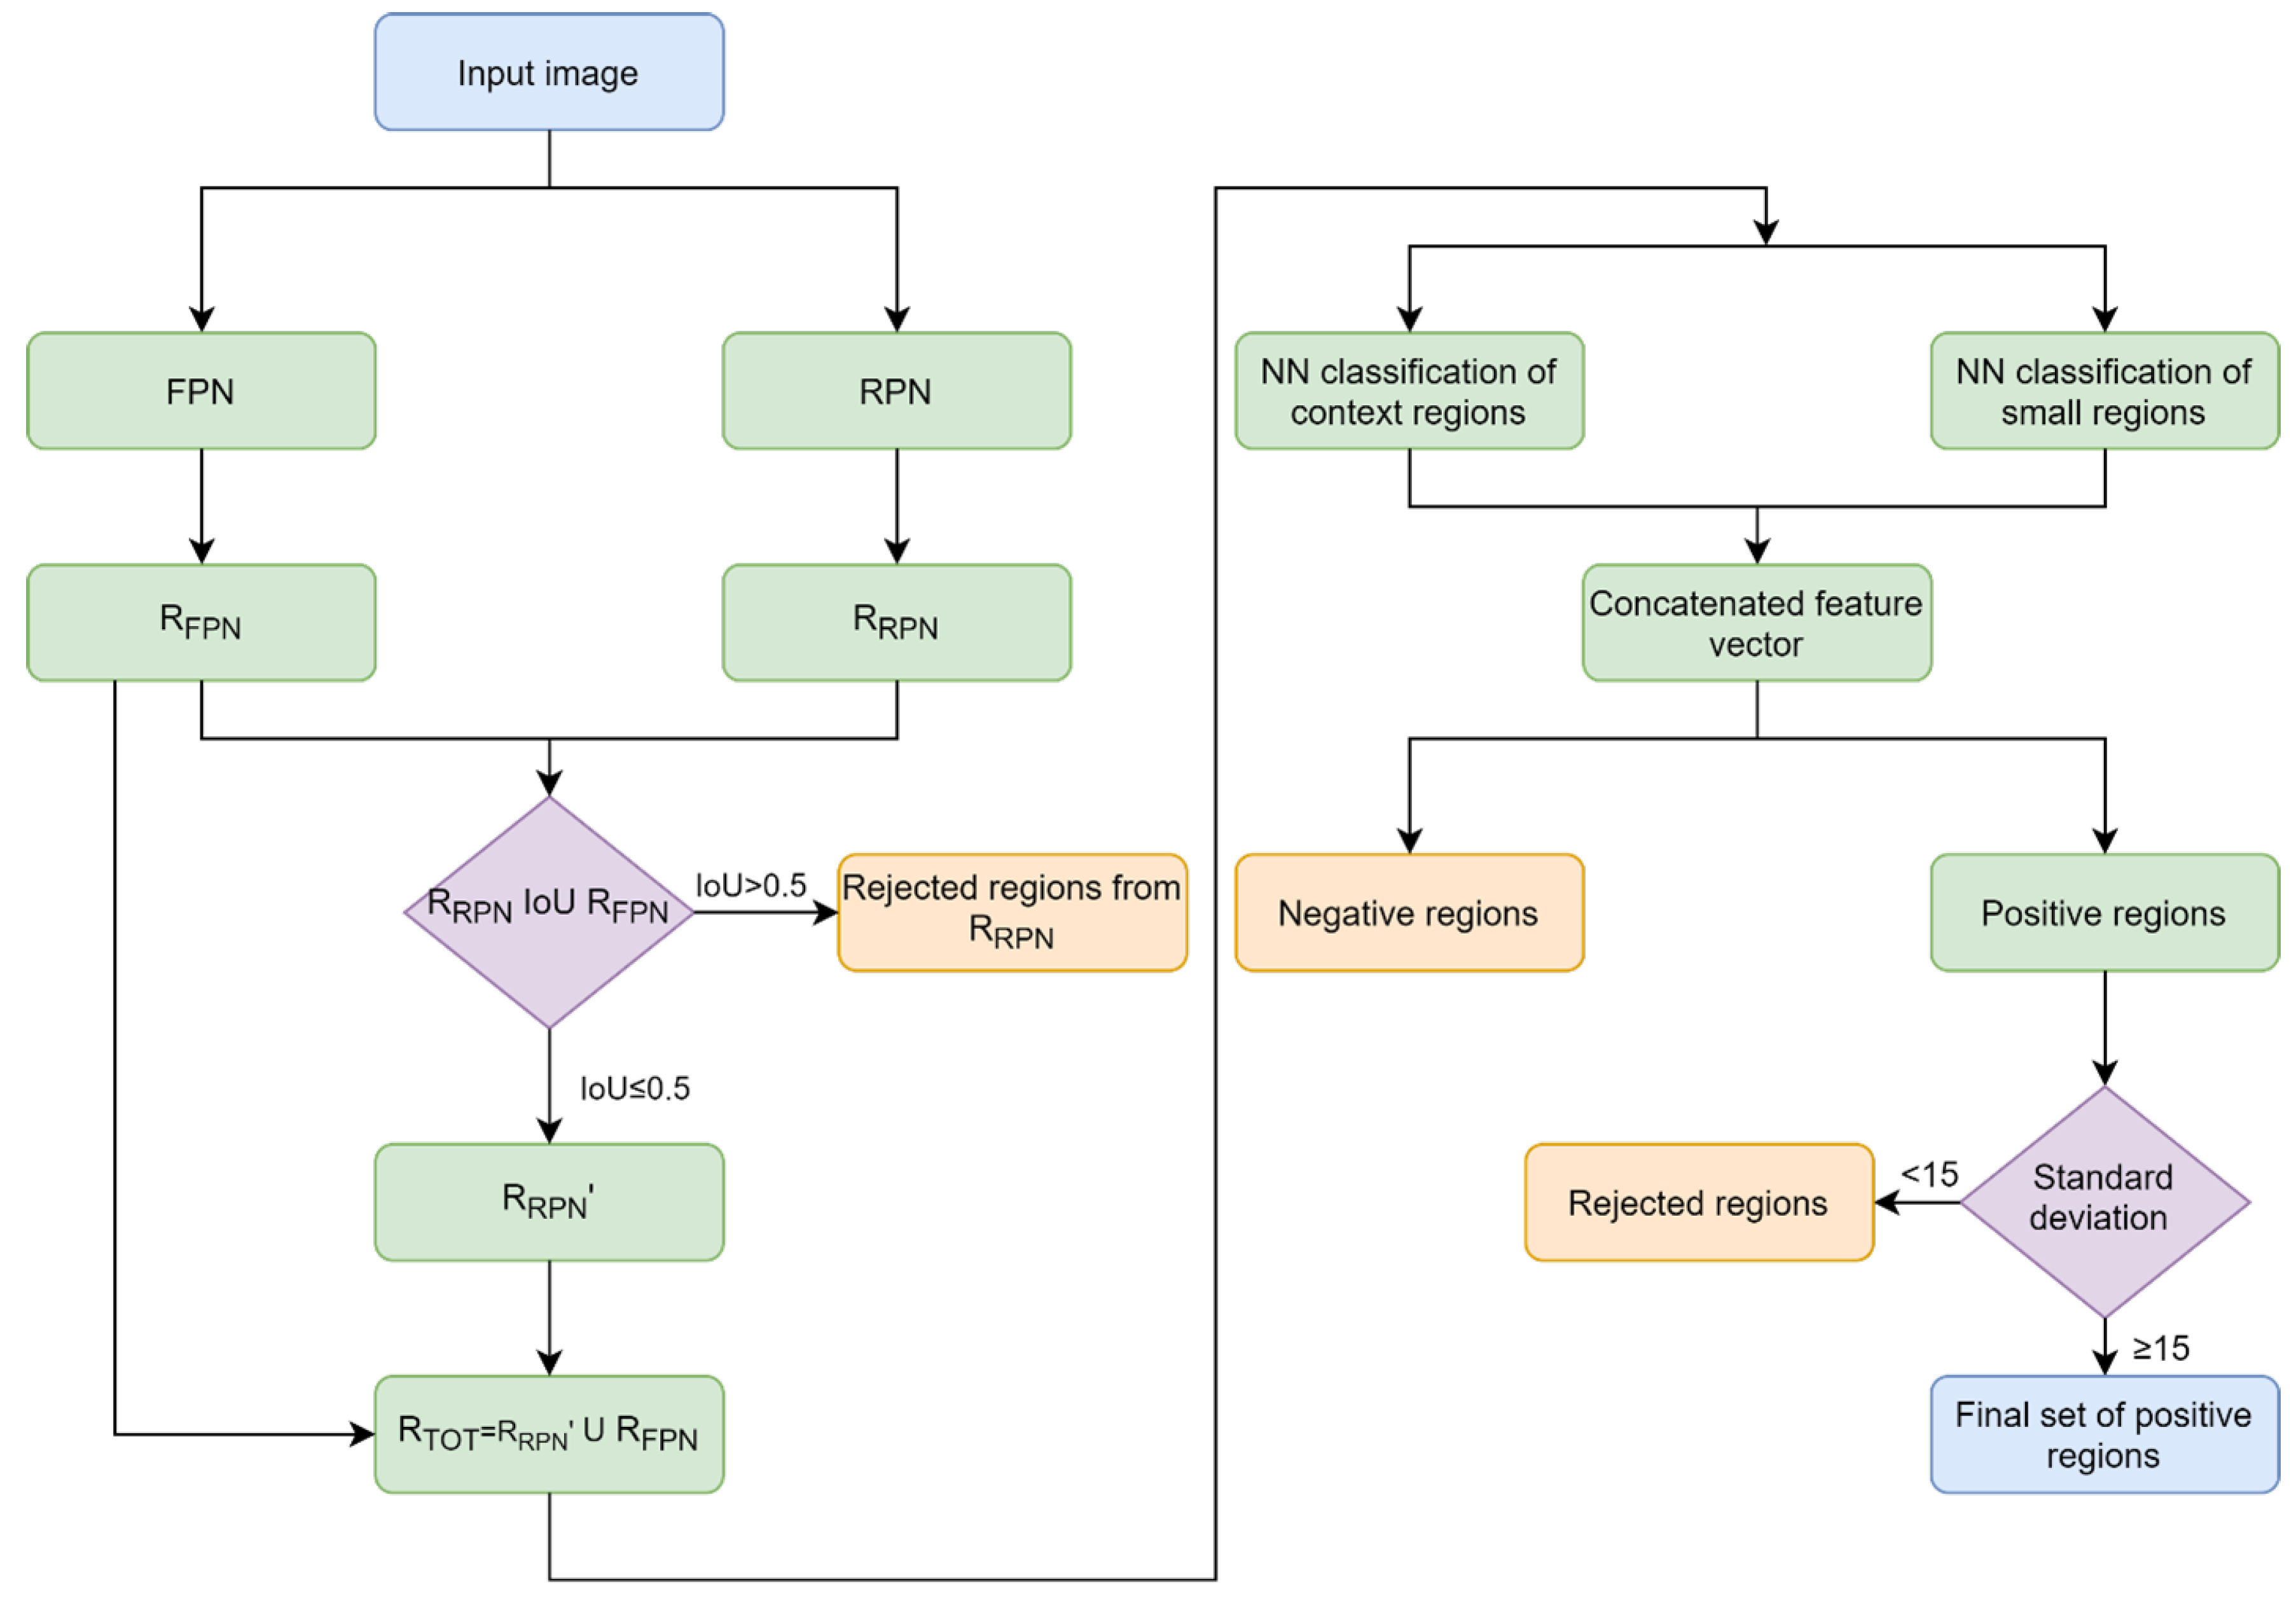
A diagram of the proposed multimodel approach is shown in
Figure 2 and can be summarized in a few steps:
Input images are divided into blocks of 500 × 500.
RPN and FPN methods are applied to image blocks to propose regions of interest.
Intersection over Union (IoU) metrics (area of the overlap of two bounding boxes, divided by the area of union) are calculated between all regions from the set of regions proposed by the RPN model and the set of regions proposed by the FPN model. If the IoU measure is greater than 0.5, those regions are rejected from the set of regions proposed by the RPN model, since they are similar to those from another set. This is done in order to avoid double detections of the same objects (true positive or false positive detection). Other regions from this set along with all regions proposed by the FPN model are combined into a unique set for further use.
Once the set of proposed regions is completed, the regions are forwarded to the classification stage.
From the central pixel of the proposed region, a square region measuring 81 × 81 is generated, and it is classified with the help of a neural network specially designed for this task. The first layer is convolutional with 32 filters followed by a pooling layer (3 × 3 with Step 3), then another convolutional layer with 32 filters, and then another pooling layer (3 × 3 with an offset of 3). This is followed by two convolutional layers with 64 filters and then a fully connected layer. This neural network is empirically designed, trained, and tested on patches from the HERIDAL dataset and achieved an accuracy of 99.21%.
In parallel, a region of dimensions 243 × 243 (also based on the central pixel of the proposed region) is generated, which also contains contextual information in the form of the environment of the detected object, and it is classified with the help of the VGG16 network, with the use of transfer learning. Transfer learning is a technique where stored knowledge is gained during the training network for one problem and can be used as a starting point for a training network for another task. In this case, we used weights from the VGG16 network trained on the ImageNet dataset [
42] for the task of person classification as a basis for training the same network for the classification of our contextual regions. This improved the results of the classification stage.
Both classifications are executed only up to the step of the feature vector, and the feature vector obtained from both classification networks is then merged into one, followed by a fully connected layer and a softmax classification layer.
In the last step, for all regions classified as positive, the standard deviation at the regional level is calculated. All regions with a standard deviation of less than 15 are discarded, and all others represent detected objects.
5. Proposed Algorithms for Improving Results of the RFCCD Model
In order to improve results obtained with the RFCCD model, in this paper, three types of algorithm are proposed. All of them are based on the correlation between consecutive images. In accordance with the detected objects in one image and the calculated correlation between images, the algorithm predicts the location of those objects in the next image using displacement vector estimation. Therefore, calculation of the correlation is the first step.
After calculating the correlation, detected regions in one image are translated to the other two consecutive images based on the displacement vector. The IoU measure is then calculated between real detections in one image that are the product of the RFCCD model and those detections that are translated from another image. If the IoU is greater than 0.5, it is considered that the detected regions overlap, which means that the same object is detected in both images. Additionally, due to the possibility of error in calculating the correlation between images, it was necessary to add tolerance, which actually means expanding the area within detected objects in successive images are considered the same. In this case, the tolerance was empirically determined to be 200 px.
The assumption is that a detected object in at least two of three consecutive images is most likely a true positive detection because it is unlikely that the detection model will find the same false positive detection in both images. Based on this assumption, we proposed three types of algorithms that could improve the results obtained with the RFCCD model. Algorithms differ in the way they reject or add a detected object as follows:
RFCCD + Displacement Vector (RFCCD+DV)—discarding detected regions that appear in only one of three consecutive images;
RFCCD + Displacement Vector and Adding (RFCCD+DVA)—discarding detected regions that appear in only one of three consecutive images and adding detected regions that appear in two consecutive images to the third consecutive image;
RFCCD + Displacement Vector and Adding with Classification (RFCCD+DVAC)—discarding detected regions that appear in only one of three consecutive images and adding detected regions that appear in two consecutive images to the third consecutive image, but only if the detected object is located in an area covered with trees or forest shrubs.
The proposed methods are explained in more detail below.
5.1. Calculating the Correlation between Consecutive Images
If
represents a set of consecutive images, and
represents images contained in the set, the algorithm takes pairs of images
and calculates the displacement vector presented in the form of the distance and direction of displacement. In the first step of this algorithm, the transformation of a higher spectral image is performed in the form of a two-dimensional matrix
, where the three-dimensional vector
represents the light intensity over a given spectrum with RGB components
in the interval
into the one-dimensional vector
. The process of converting a multi-spectral image into an intensity image is shown in Equation (
4).
A convolution operator is applied on both images
.
is defined as an operator of the Fourier transform, and according to the convolution theorem, Equation (
5) is valid.
In order to obtain a similarity measure of two images, it is necessary to calculate cross-correlation. Considering that cross-correlation is a convolution in which the second signal is mirrored horizontally and vertically, we rotated the second image by
. To calculate the distance between two images in the form of displacement
D and the angle of displacement
, it is necessary to calculate the measure of auto-correlation or self-similarity
and then the cross-correlation between two images
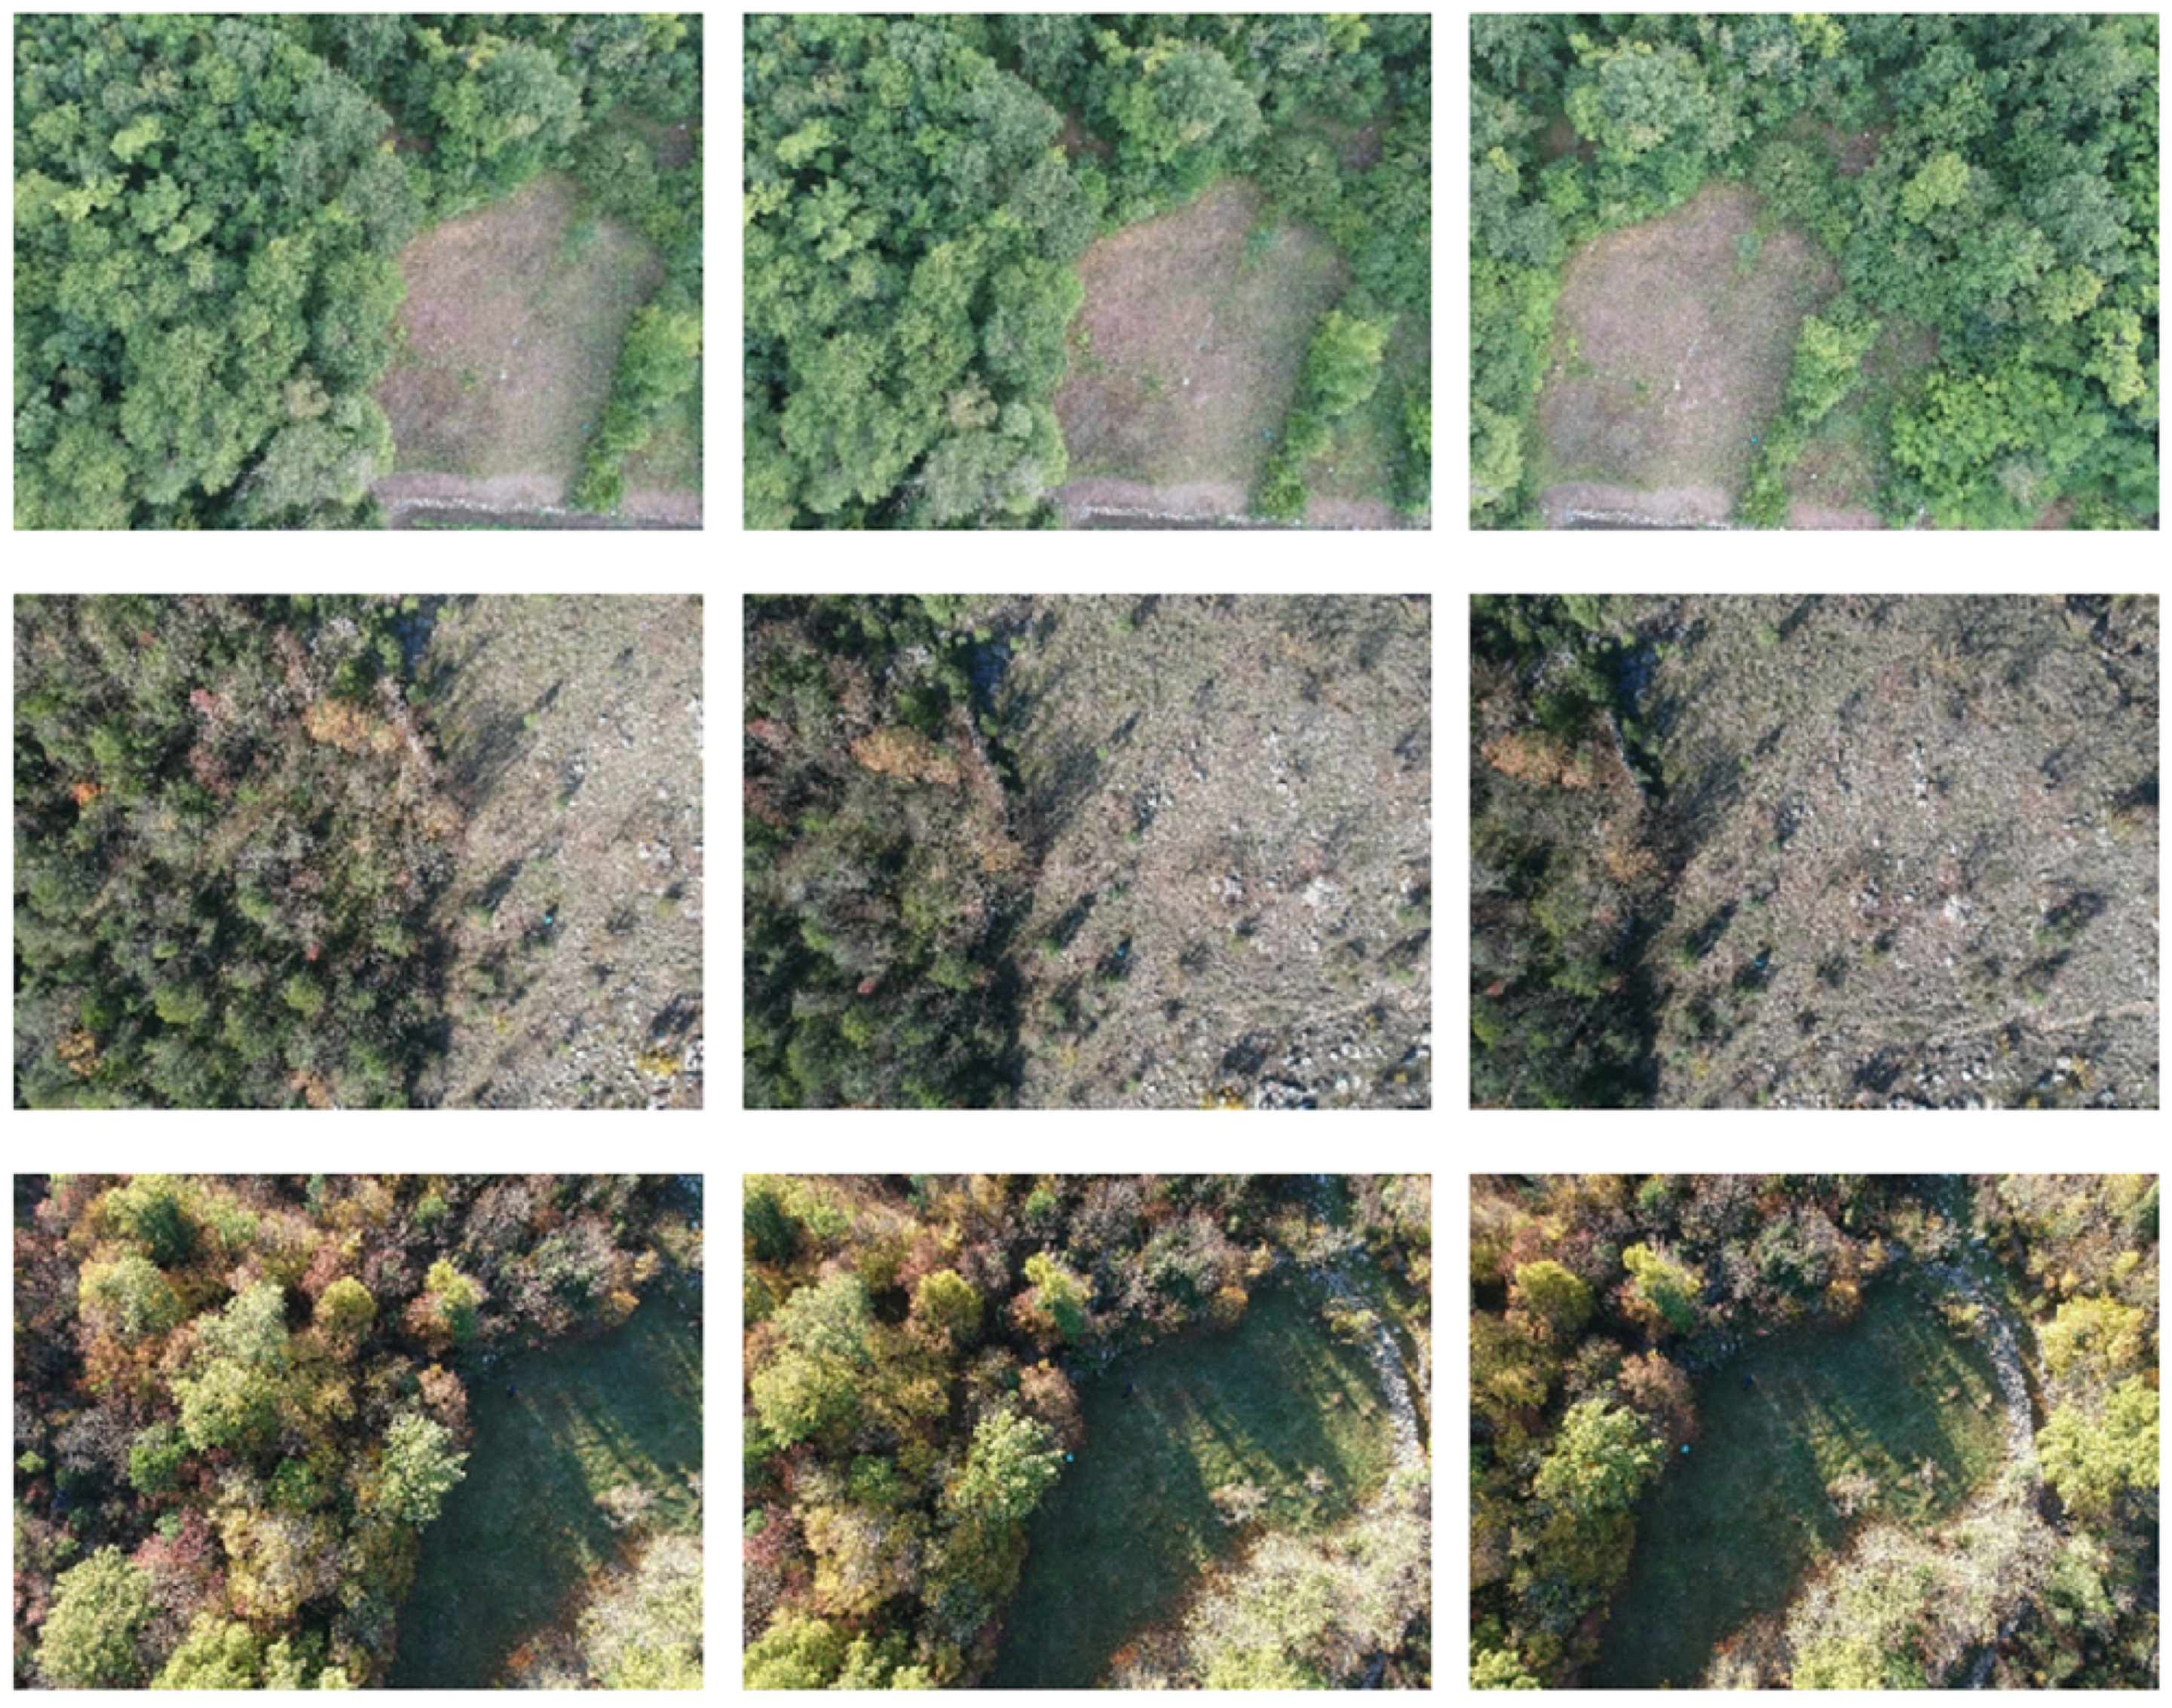
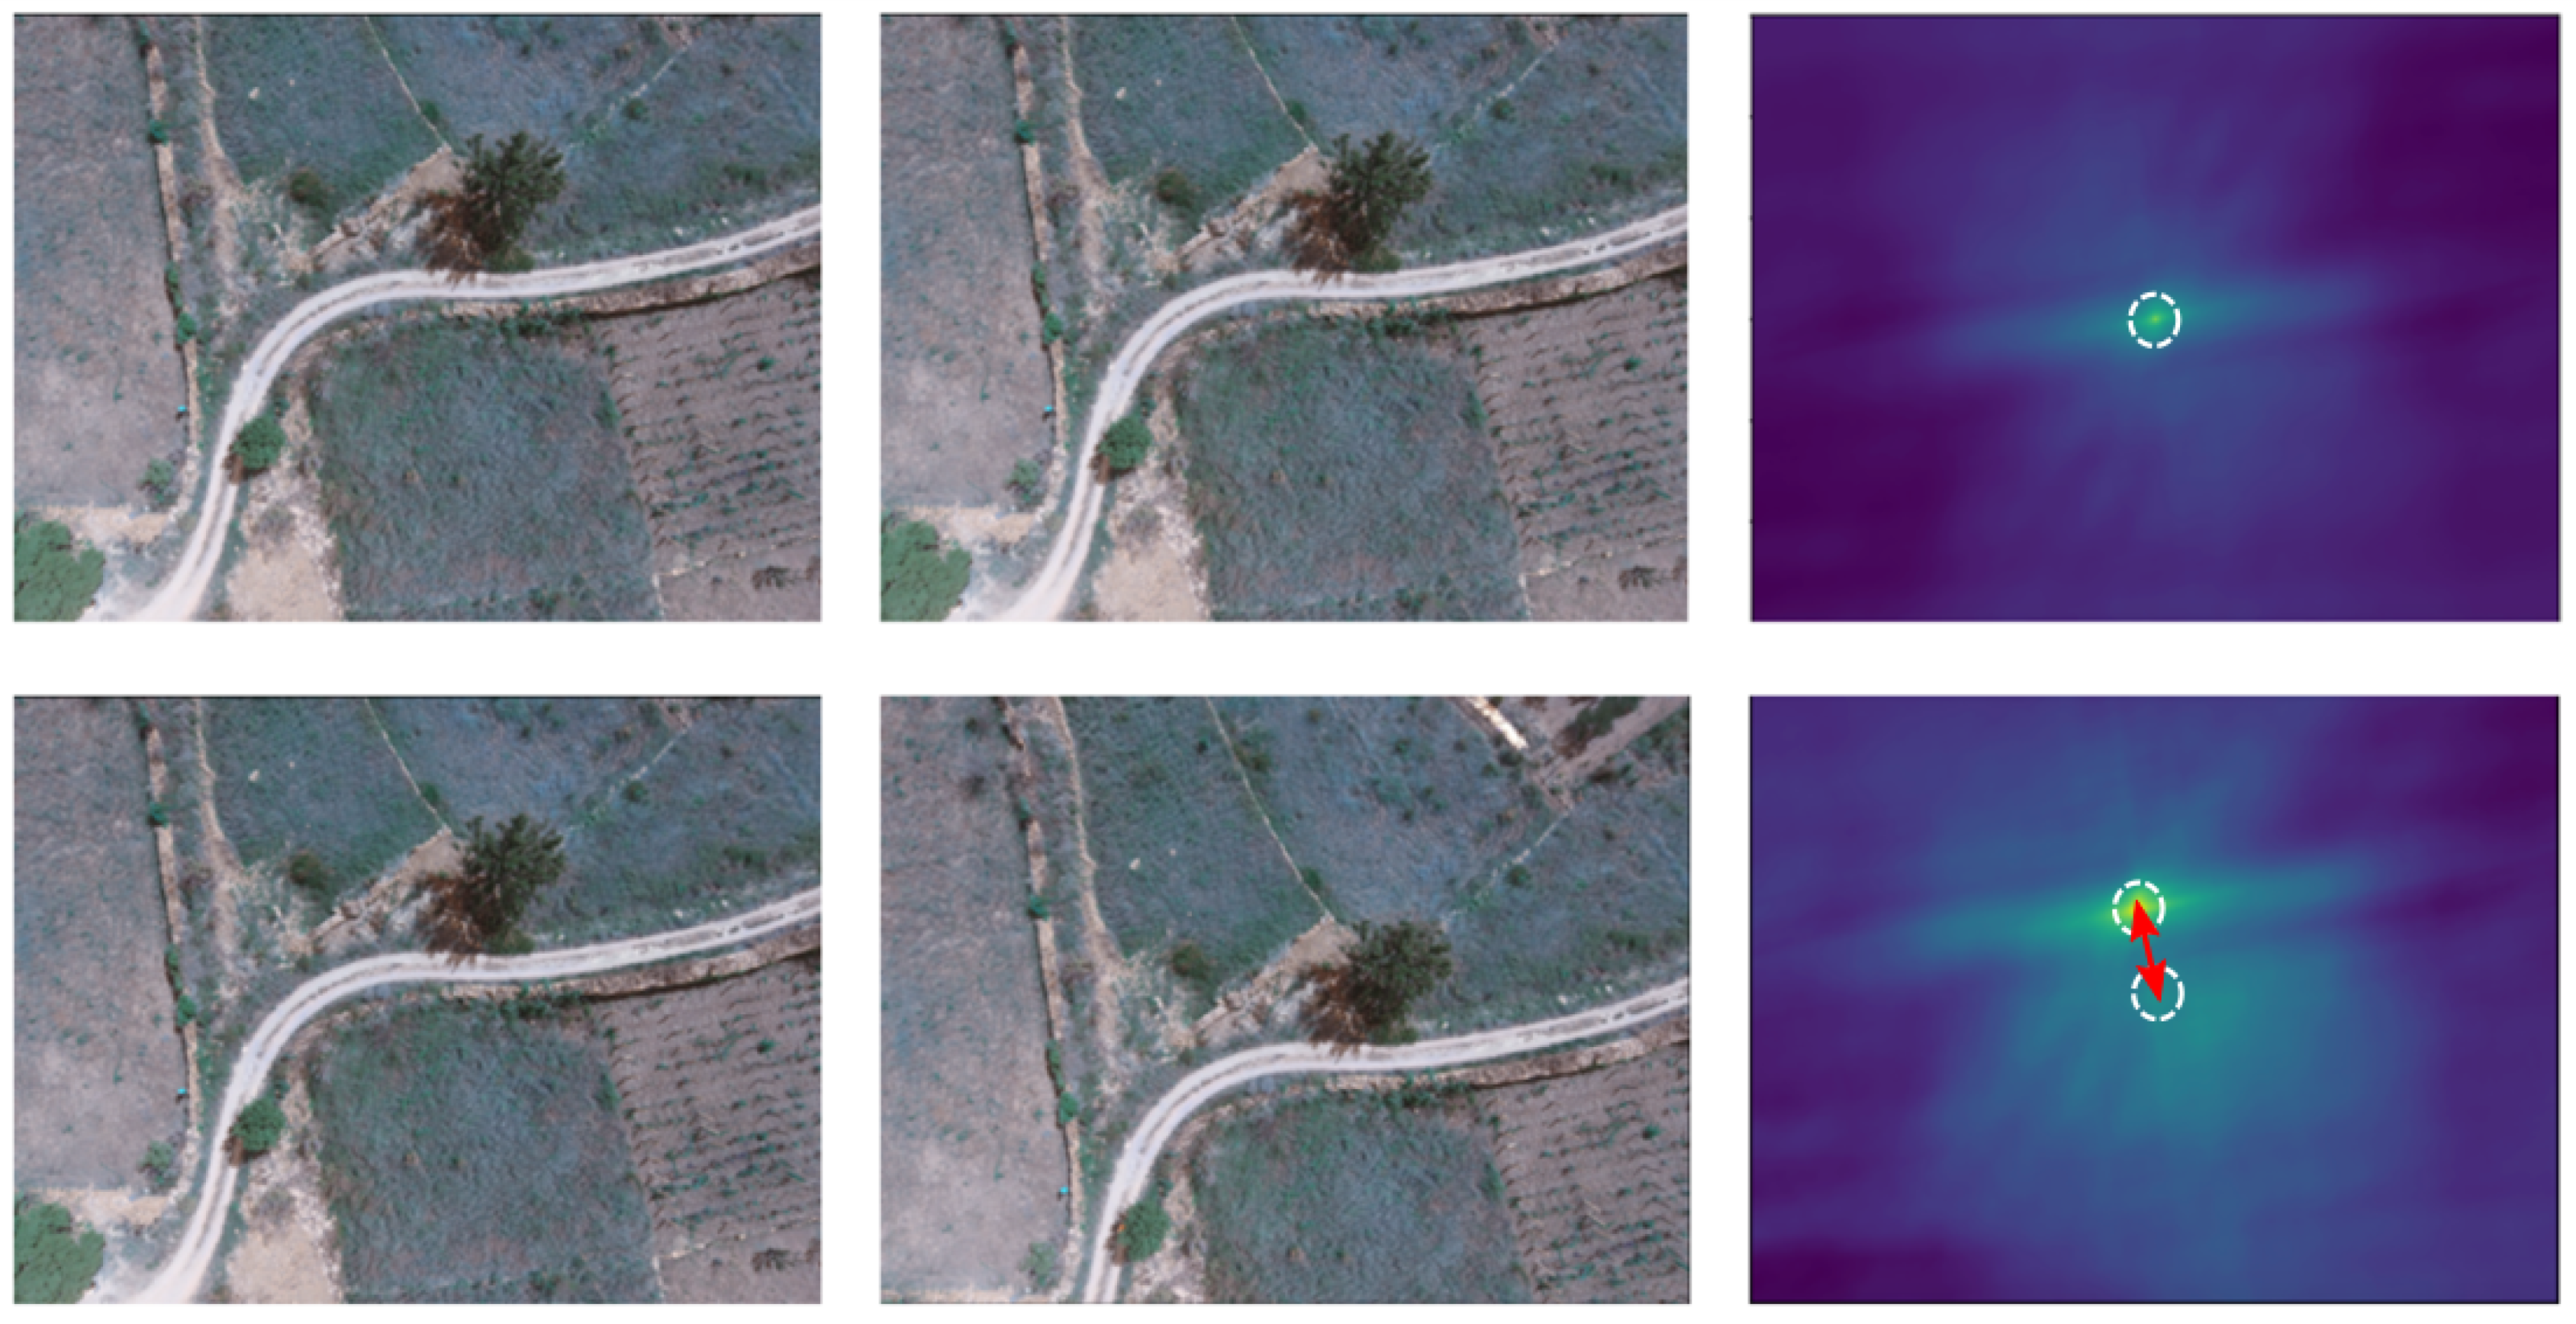
. An example of the results of these two measured is shown in
Figure 4, along with images used to calculate these measures. An example of the auto-correlation is shown above, while the measure of cross-correlation between two images is shown below.
The first step in obtaining the displacement
D and the angle of displacement
between two images
and
is to find the point of highest intensity. This point is obtained by calculating the Euclidean distance of the maximum argument function for the auto-correlation function
, where
represents the point of maximum intensity. The same applies for the cross-correlation
. The calculation of the distance of points
and
, which represents the displacement
D and the angle of displacement
, is shown in Equations (
6) and (
7). This calculation of
D and
is performed for all pairs of images within the set of images S.
Based on these parameters, the translation of detected regions from one image to another was performed. The detected regions are actually regions of interest defined as
, where
s is the total number of proposed regions in one image. After this, we can check which regions of interest match in images
and
by calculating the cross section between all pairs of regions of interest. The operator for validating the cross section is defined with a function that translates all regions of interest from one image to another using the displacement vector, as shown in Equation (
8).
It is also important to define the distance of the two regions using the Euclidean distance of the point of the upper left corner of the region of interest, as shown by Equation (
9).
Applying this function to all regions from the set of
yields an approximation of the regions of interest that should be in the figure
. A key role in finding overlaps between regions have a cross-section operator shown in Equation (
10).
5.2. Using Correlation for Estimating Detection Accuracy
Based on the assumption that detections that appear in only one of three consecutive images are most likely false positive detections, the first idea was to reject those detections from the set of detected objects. This approach is called “RFCCD+DV” (RFCCD + Displacement Vector). On a set of detected objects using the RFCCD model, this algorithm applies the correlation calculation between consecutive images as described in
Section 5.1. It is important to mention that the correlation is calculated between all pairs of images from one set (the first and second images, the second and third images, and the first and third images). Translation of the detected objects in one image to other images is then applied, followed by a calculation of the overlap with the tolerance between those translated detections and the real detections from that image. If overlap exists in at least two of three images, it is considered that it is the same object. Those detections are retained, while all others that appear in only one image are rejected from the set of detected objects. This is the simplest and at the same time optimal solution that significantly reduces the number of false positive detections while maintains true positive detections at the same level. This can be seen in the results presented in
Section 6.
During the implementation of this algorithm, it is noticed that some objects that are detected in two of three consecutive images are actually persons that are not detected in the third image. Therefore, we proposed a new algorithm, RFFCD + Displacement Vector + Adding (RFCCD+DVA), that works as the previous one, but with one addition—namely, due to the assumption that the objects detected in two images are true positive detections, it is possible to add those detections in the third image in order to increase the number of true positive detections as well as the recall measure. For this purpose, information about vector displacement is also used in the step of adding detections in the third image. Based on the values of the displacement vector between the first and second images or between the second and third images, translations of the detection are performed from one image to another, and this actually determines the location where the object should be in the third image. This location is added to the set of detected objects. Using this algorithm, the recall measure is increased, but the precision is reduced, as shown in
Section 6. The reason for the decreased precision is the high number of added false positive detections.
Obviously, some of the detected objects in two consecutive images are not true positive detections, so marking these objects in the third image also increases the number of false positive detections. It is assumed that the results of the above approach could be further improved if we take into account the type of the environment of the detected object. To address this problem, we proposed a new algorithm, RFFCD + Displacement Vector + Adding with Classification (RCFFD+DVAC). The idea is to classify the environment of the detected object. The assumption is that the person found in clear terrain would be detected using the proposed RFCCD model, but if the terrain is forested, there is a possibility that the person is covered by the tree and is not visible in one of the consecutive images from the set (i.e., the system does not detect it). That is why we need to determine if the environment of the detected object is forest or clear terrain. The decision about adding detections in the third image depends on the results of classification. Accordingly, the idea is to not add detections to the third image if it appears in the other two images unless the environment of the object is a forest. Therefore, it is necessary to develop a precise model for the classification of the environment and to define the architecture of the neural network that will perform this task optimally.
It is important to emphasize that the model must primarily be fast and simple because a complex architecture would further slow down the system and make this approach unusable. Therefore, the classification problem is simplified as a binary problem, where one class is “forest” and the other one is “other”. The class “forest” includes all regions that contain a large number of trees or something similar (shadows, etc.) that might cover an object of interest (person), while the second class “other” includes all other regions that cannot camouflage the object of interest (low vegetation, meadows, roads, etc.).
5.3. Classification of the Detected Object Environment
A neural network that has already shown good results in the task of binary classification is explained in
Section 3.1, Step (5). Due to the good results it achieves in the problem of classifying, and due to its simplicity, it was used in this part of the model as well. The first step was to define a dataset for training and testing. For this purpose, different aerial images were divided into blocks with dimensions of 300 × 300 px. From the obtained set of blocks, 4857 blocks were selected for use. These blocks were divided into two groups: a training set and a validation set. In the training set, 1886 blocks were in the class “forest”, while 2028 of them were in the class “other”. In the validation set, 472 blocks were in the “forest” class, and 471 were in the “other” class. The proposed network is relatively shallow, and as input it receives image blocks with dimensions of 300 × 300. The network consists of convolutional filters and a ReLu nonlinear activation function [
43]. At the output of the neural network are two fully connected layers where one uses ReLu activation and the other uses sigmoid activation function. The neural network was trained in 50 iterations. During each iteration, a batch size of 32 images was used. The binary cross entropy loss function [
44] was used. After training the neural network, a gained model was used to test it on blocks from the validation set. The achieved precision measure was 82%, while the recall measure was 79%. The reason for the somewhat worse results is that there is no clear boundary between these two defined classes. Namely, very often an image showing lower vegetation has the same features as the one with higher vegetation, so it is difficult even for the human eye to distinguish to which class each block belongs.
This model was further used in the step of adding the detected region to the third image. When the RFCCD model yields a detection of the same object in two consecutive images, it is necessary to add this detection to the third image if the object environment is classified as “forest”. For this purpose, it is necessary to classify eight regions surrounding the detected region. This process is implemented by calculating the central pixel of the detected region, also in dimensions of 300 × 300 px. The central pixel moves 450 pixels to the left and 450 upwards, which marks the initial window of the environment in which the translated region is located, and the moving window generates nine regions (3 × 3). Eight of the proposed 9 regions are classified because the central region is excluded from the classification (it is actually a detected region). If any of the regions are classified as “forest”, then that region is added to the third image where it is not detected because there is a possibility that the object of interest is located there, but it is not detected because it is sheltered by the trees. Although the classification model does not yield approximately the same results as the person classification model, it has been experimentally determined that this approach nevertheless improves the results. Namely, compared to the previously proposed model in which the region was added to the third image regardless of its environment, this model results in a smaller number of false positive detections, which was the primary goal.
6. Results Obtained with the Proposed Algorithms
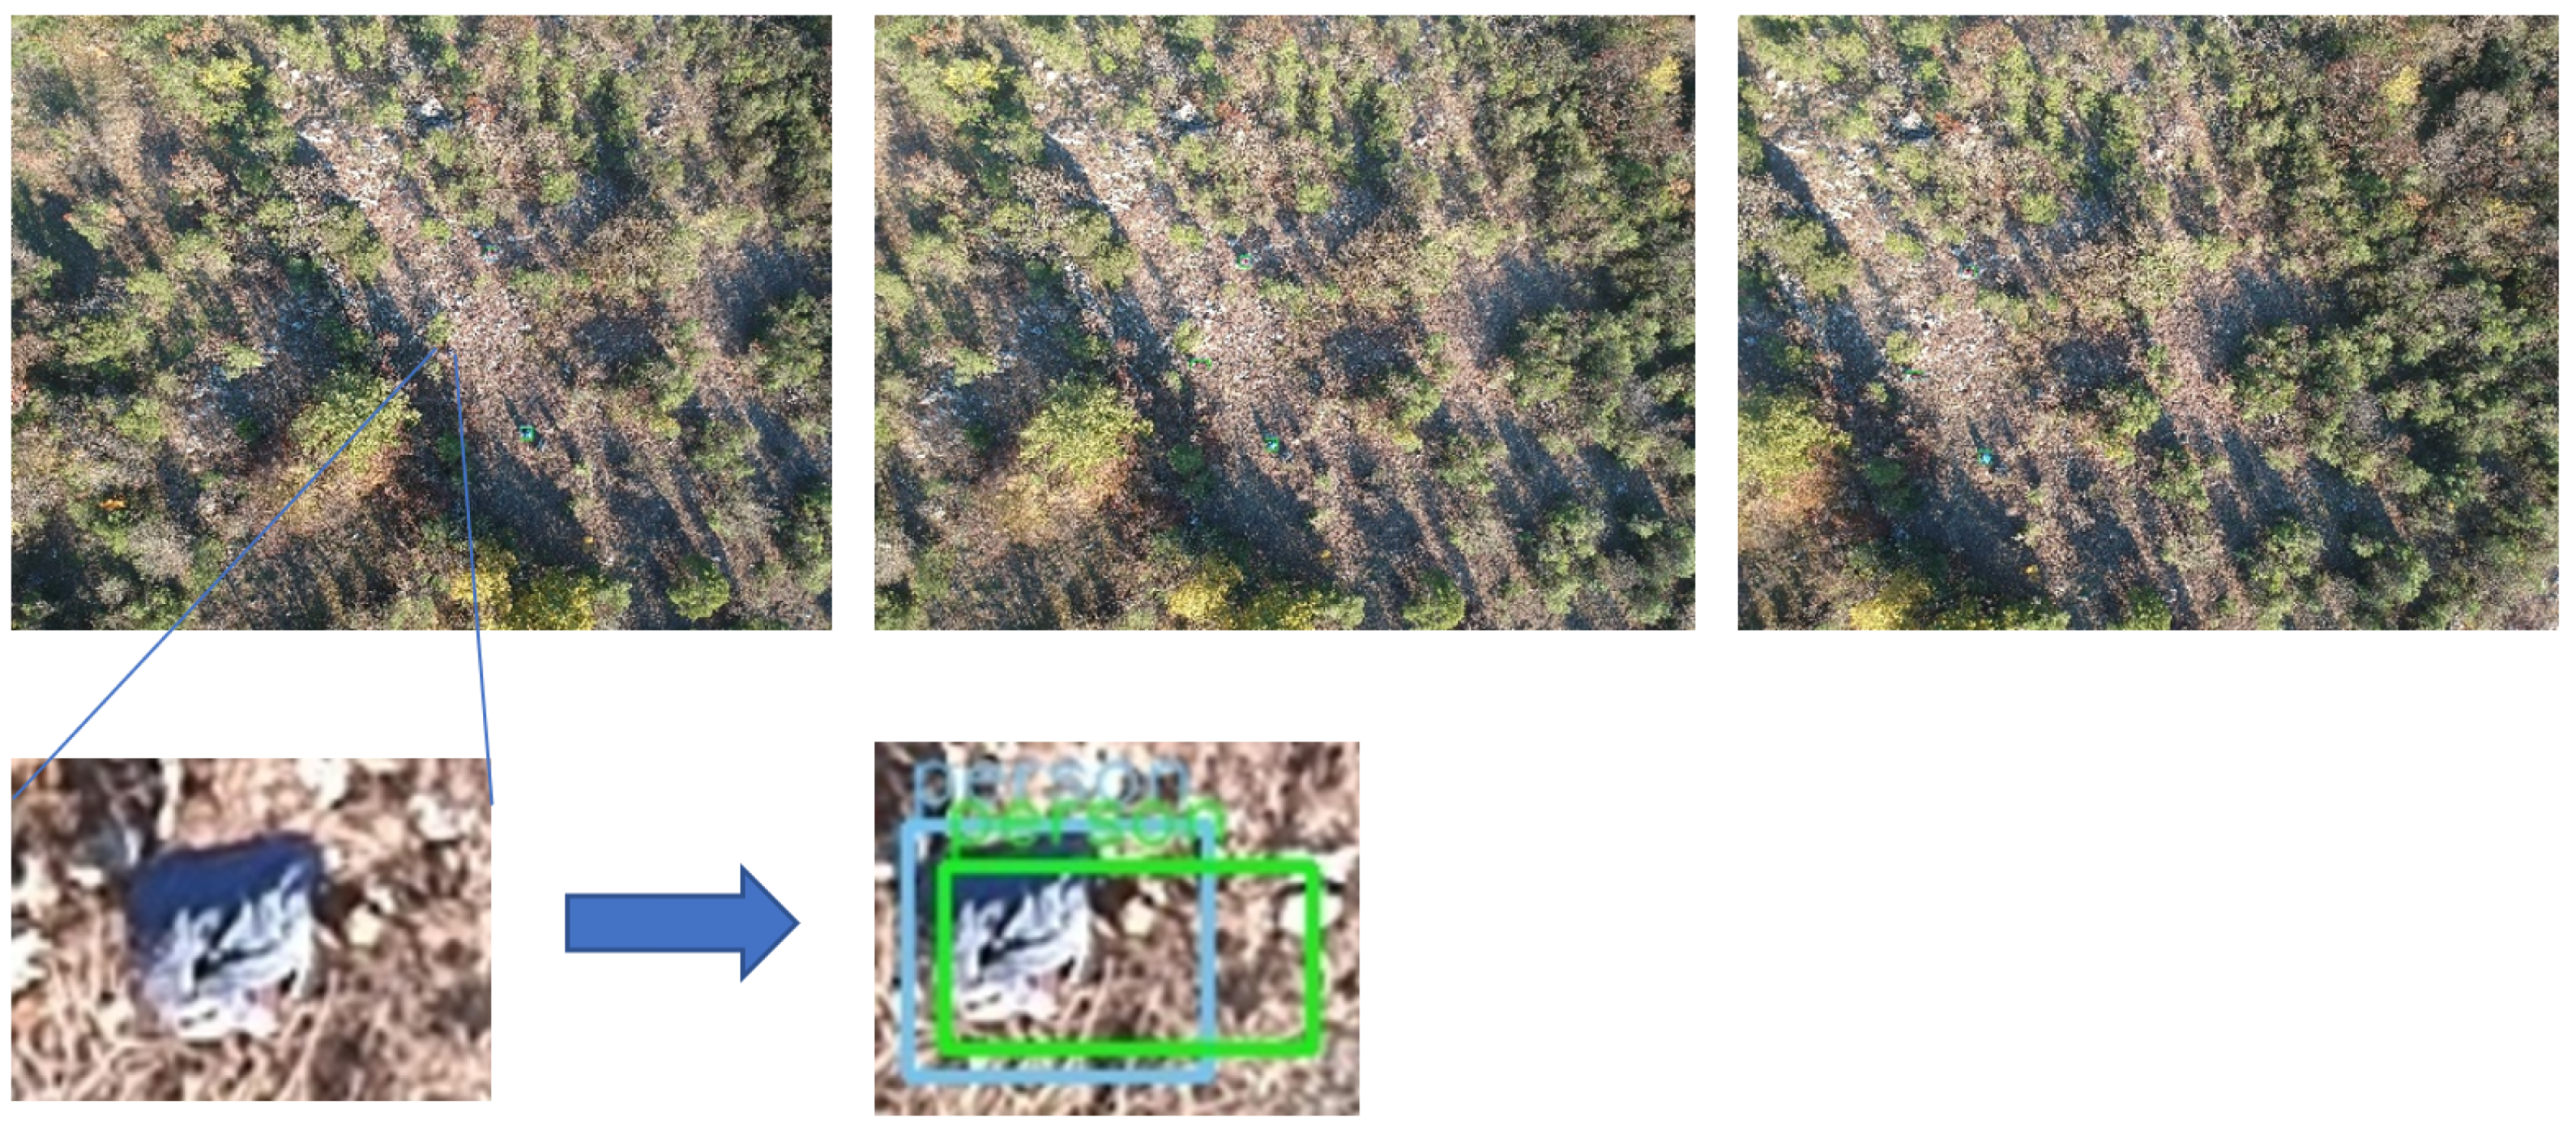
Table 3 shows the results obtained with the proposed algorithms based on the vector displacement in image sequences. For comparison, the table also shows the results obtained using the RFCCD model on this set of images. The RFCCD model yields many false positive detections, which means that further improvement is desirable. For this purpose, three different algorithms based on the displacement vector of consecutive images are proposed. The obtained results show that all three proposed algorithms improve the results in relation to those obtained with the RFCCD approach. The first proposed algorithm is “RFCCD+DV”, in which all detections that do not appear in at least two of three consecutive images are discarded. Compared with RFCCD, this model achieved a significant improvement in the precision, while the recall measure was not decreased. Accordingly, F-measures were also improved. This means that this algorithm eliminates all false positive detections that appear in only one images. Since detected objects that appear in at least two images are considered true positive detections, we could additionally improve recall by adding those detections to the third image. Thus, the second algorithm is proposed, RFCCD+DVA, where detections that appear in only one image are rejected, while those that appear in two images are also added to the third image. An example of one added TP detection is shown in
Figure 5. Every image in this set contains three persons. The RFCCD model detected two persons in all three images, while one person was detected in the second and third images, but not in the first image. After performing the RFCCD+DVA algorithm, TP detection was added to the first image.
This algorithm improved the recall measure, but precision was lower because the algorithm added 30 false positive detections. Thereby, all F-measures, except F10, were decreased. In order to address the problem of adding false positive detections, a third algorithm is proposed, RFCCD+DVAC. The idea is to add to the third image only detections of those objects that are surrounded by forest, large trees, or similar features, since, in such an environment, those objects could be obstructed in one or more consecutive images. Therefore, the environment of the detected object is classified, and those objects surrounded by forest are added to the third image, while other objects are not. This algorithm achieved a better precision than RFCCD+DVA, while recall was slightly worse (1 more missed true positive detection).
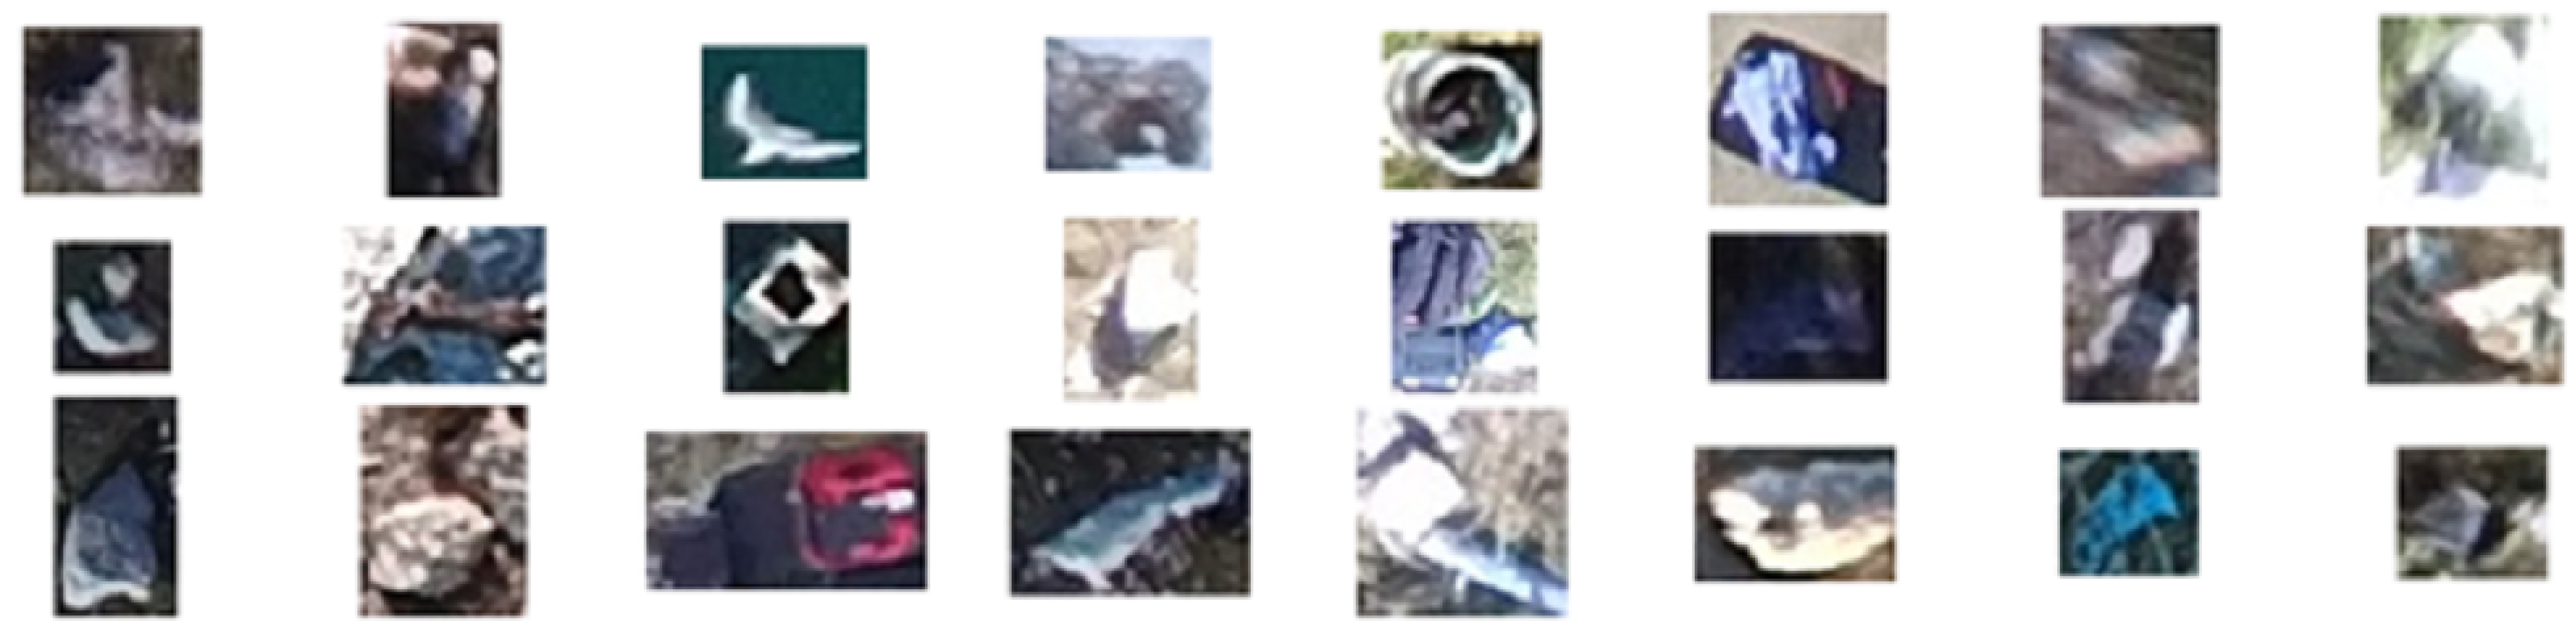
Observing these results, it can be noticed that the first proposed approach, RFCCD+DV, retains the same number of TP detections as the RFCCD and hence the value of the recall measure. At the same time, it also significantly reduces the number of FP detections by 65% and consequently significantly improves the precision measure by almost 20%. FP detections that are not discarded using this algorithm are detected in at least two consecutive images with a high probability score. These are actually objects which, in aerial images, look almost the same as the person. Some of them are hard to distinguish from TP detections, even by ocular observation. Examples of FP detections are shown in
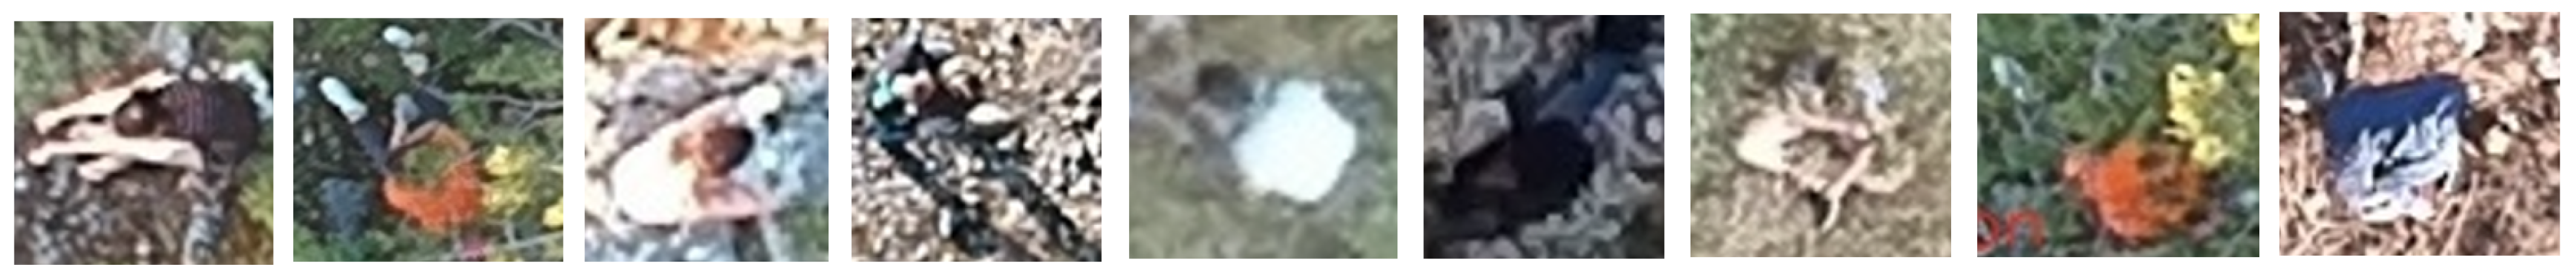
Figure 6. Additionally,
Figure 7 shows all 9 FN detections. It can even be observed that some FP detections are more similar to the human shape then some FN examples. This is due to the variations in occlusion, viewpoint, shape, and illumination.
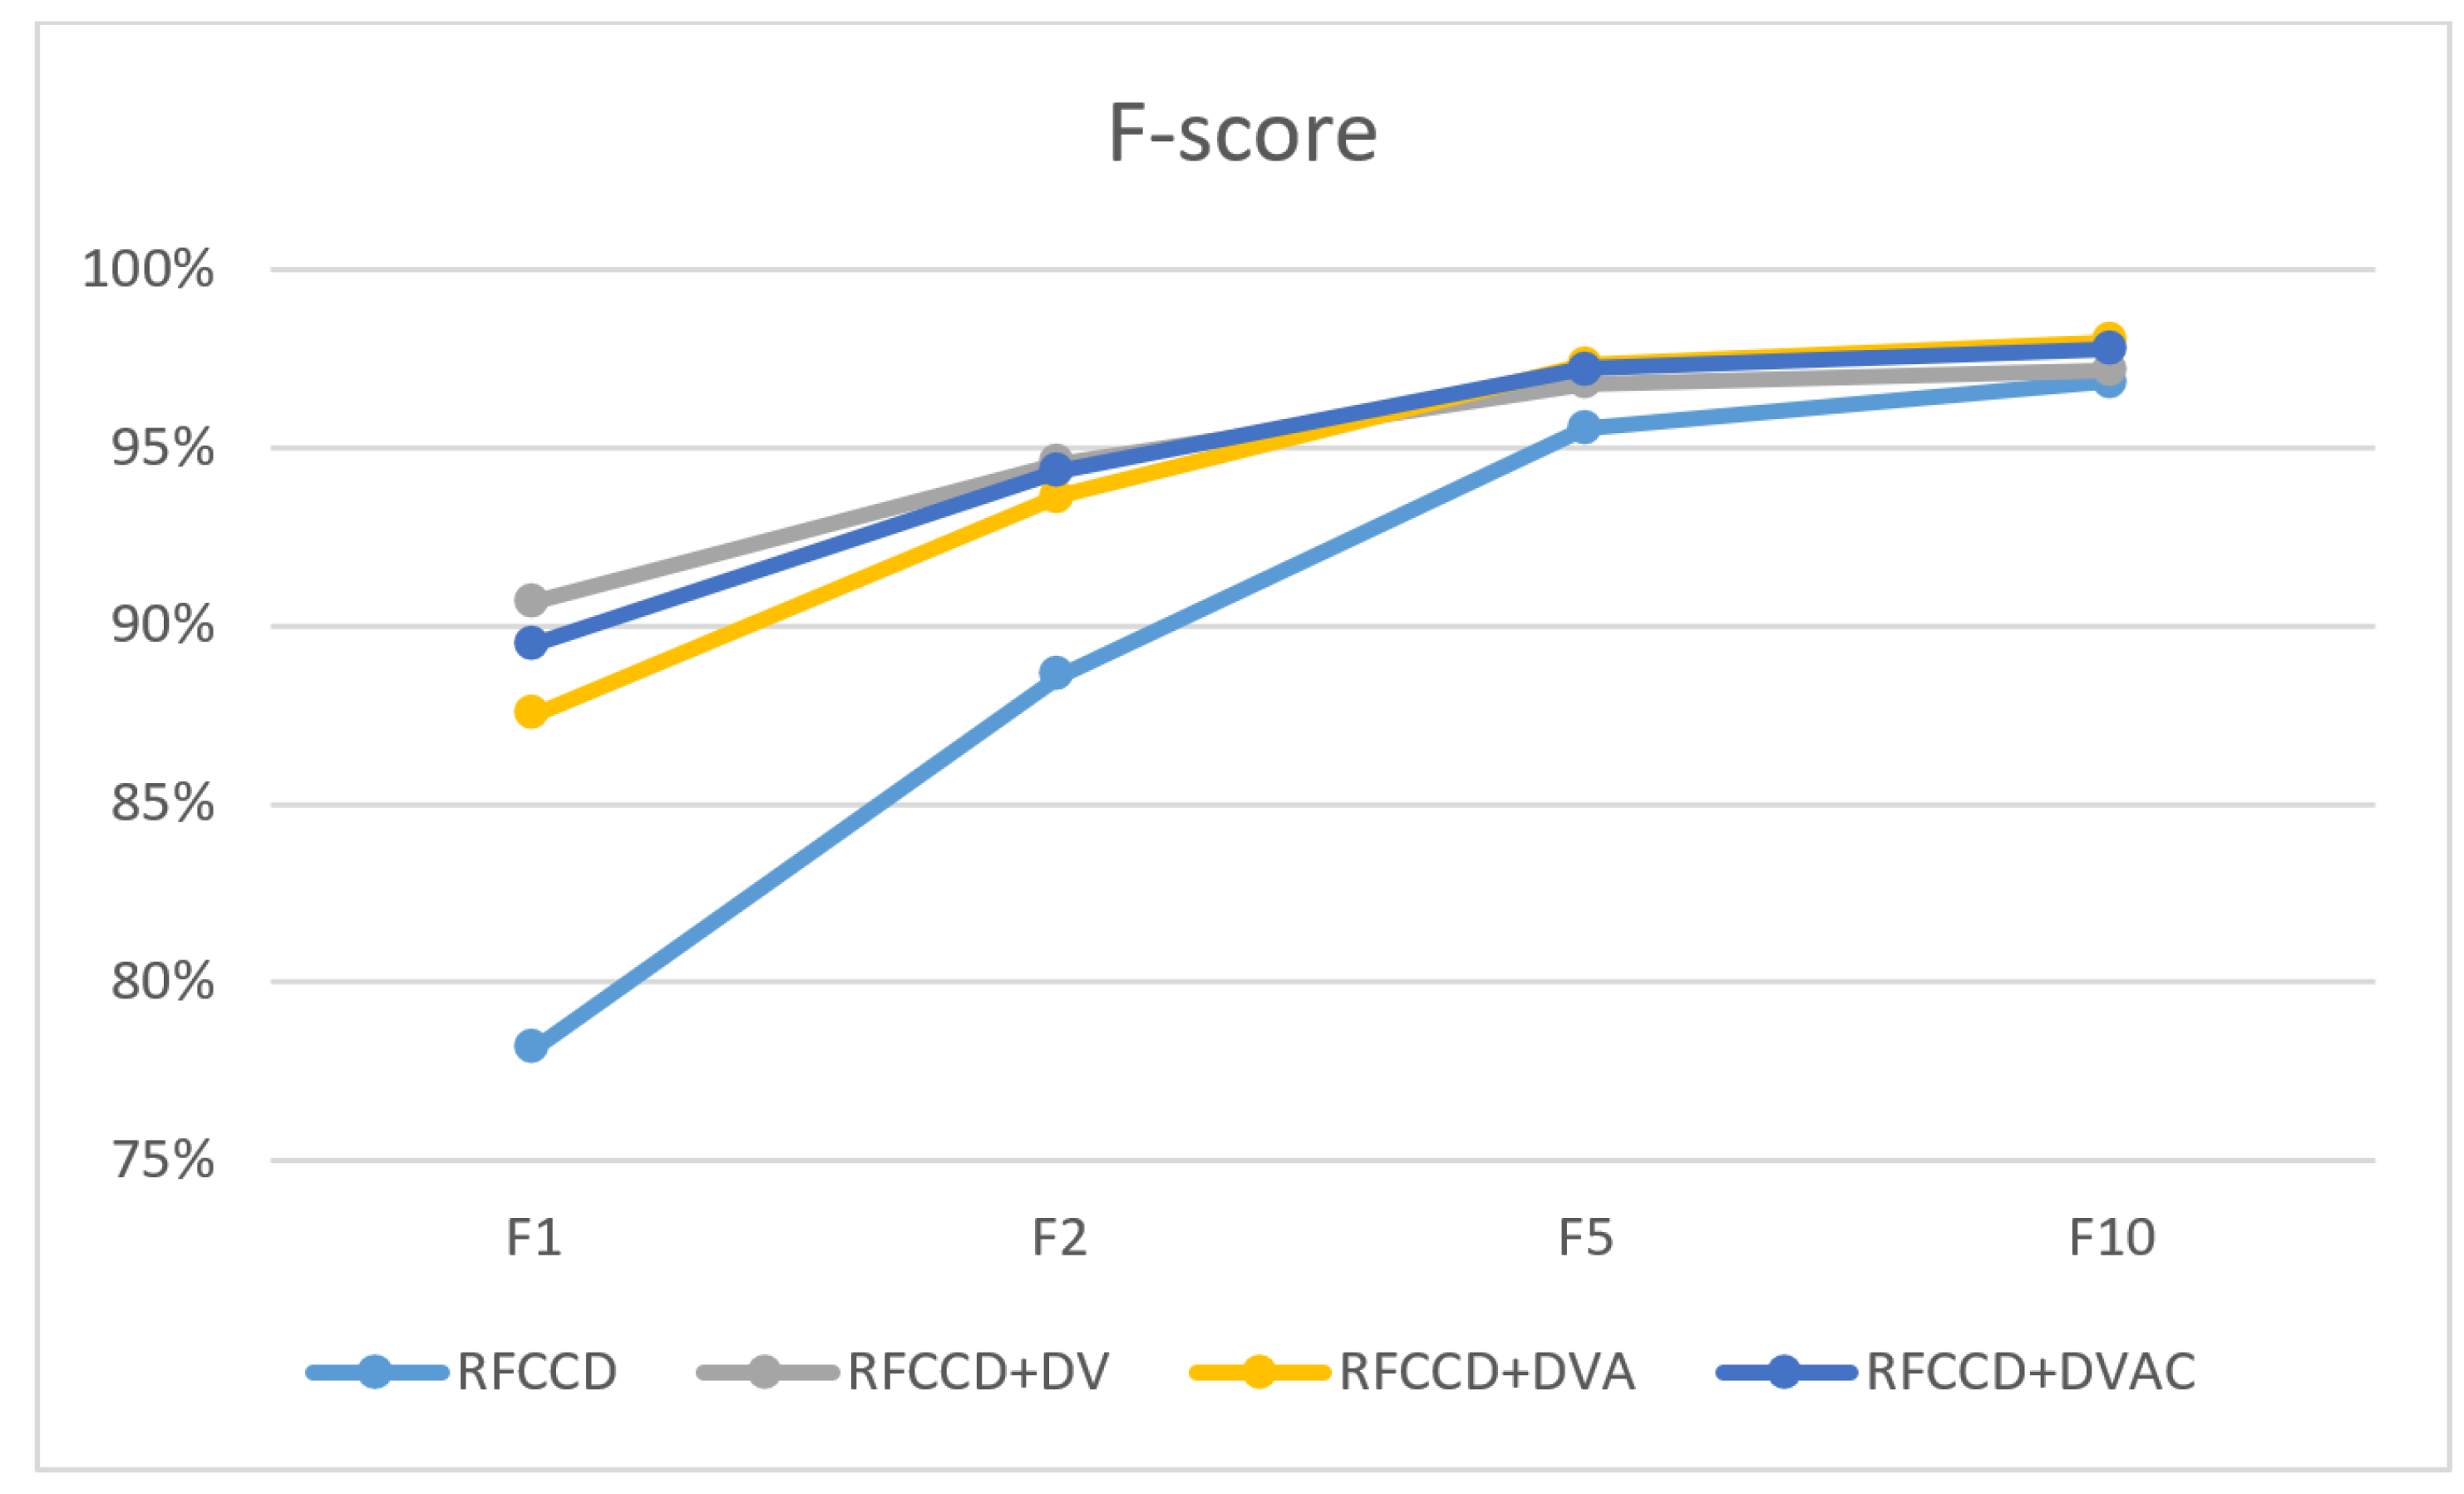
Additionally, it is noticeable that this algorithm achieves the same or only slightly reduced values of all F measures compared to the other proposed algorithms. Regarding the F-score values,
Figure 8 shows that all three proposed algorithms achieved more optimal values of the F-score (for each value of the parameter
) compared to the RFCCD approach. It is also noticeable that the most stable growth of the F-score values for different parameters
was achieved using the RFCCD+DV algorithm. As it is difficult to determine which
parameter is optimal, this stable growth contributes to the advantage of this algorithm because it shows its low dependence on the value of the
parameter (for each
parameter, the F score value is quite high). Furthermore, the advantage of this algorithm is in its simplicity of execution, because any further analysis of the detected objects and its environment is not required, thereby reducing execution time, which plays a crucial role in saving lives [
4]. Thus, it can be concluded that the proposed algorithm RFCCD+DV is the most optimal for use in SAR operations.
7. Summary and Conclusions
In this paper, we propose a set of algorithms for improving the results of person detection in aerial image sequences in an SAR scenario. All proposed algorithms are based on the use of displacement vector information in order to reduce the number of false positive detections. During real SAR operations, false positive detections direct rescuers to the wrong location and thus waste time. In real SAR operation this method could be used as an auxiliary method which means that all processed images should be visually inspected in order to check potential location of the lost person. If there is a lot of FP detections in one image, it would cause additionally waste of time for visual inspection because every FP detections needs to be checked. These aerial images are very specific high resolution (4000 × 3000) images with complex content and there is a lot of potential FP detections (rocks, shadows, birds, etc. that from aerial perspective from high altitude looks like person). The RFCCD model provided quite good results with 176 FP detections in 99 images (around 1.7 FP per image in average) which means that is possible to relatively fast execute visual inspection. However, considering the fact that many images are collected in real SAR operations due to the wide geographical area that needs to be searched, the goal is to reduce the number of false positive detections in an image as much as possible in order to save time.
The algorithms proposed in this paper successfully and significantly reduce the number of false positive detections to less than 1 per image while maintaining the number of true positive detections. Although all three proposed algorithms increase precision and keep recall at the same or higher level, the RFCCD+DV algorithm is still considered the most acceptable. There are two reasons for this. The first reason is that this algorithm reduces the number of false positive detections by the most, and the second reason is that it is computationally the simplest. Simplicity is most evident in the time required to process a single image, which needs to be reduced as much as possible. The application of the RFCCD+DV algorithm requires a minimum of additional time compared to the other proposed algorithms. Therefore, we believe that this algorithm may be applicable in actual SAR actions as an additional method. Due to the complexity of the proposed algorithm, it is not applicable for real-time use aboard UAVs. Since in SAR operations, the most important requirement for proposed solutions is to find a lost person, the focus of this paper was to achieve the most accurate results. However, this process needs to be completed as soon as possible, so increasing processing speed is our future research goal.


