Article

Individual Tree Crown Delineation for the Species Classification and Assessment of Vital Status of Forest Stands from UAV Images

1
Deep Learning Laboratory, Siberian Federal University, 660074 Krasnoyarsk, Russia
2
Andalusian Research Institute in Data Science and Computational Intelligence, University of Granada, 18071 Granada, Spain
3
College of Information Technology, Imam Ja’afar Al-Sadiq University, Kirkuk 661001, Iraq
4
Marchuk Institute of Numerical Mathematics Russian Academy of Sciences, 119333 Moscow, Russia
5
Institute for Scientific Research of Aerospace Monitoring “Aerocosmos”, State Scientific Institution, 105064 Moscow, Russia
6
Department of Forest Entomology, Phytopathology and Game Fauna, Forest Research Institute, Bulgarian Academy of Sciences, 1756 Sofia, Bulgaria
7
Geografika Ltd., 1504 Sofia, Bulgaria
8
Department of Cartography and GIS, Faculty of Geology and Geography, Sofia University St. Kliment Ohridski, 1504 Sofia, Bulgaria
*
Author to whom correspondence should be addressed.
Drones 2021, 5(3), 77; https://doi.org/10.3390/drones5030077
Submission received: 28 June 2021 / Revised: 4 August 2021 / Accepted: 5 August 2021 / Published: 7 August 2021
(This article belongs to the Section Drones in Agriculture and Forestry)

Abstract

:
Monitoring the structure parameters and damage to trees plays an important role in forest management. Remote-sensing data collected by an unmanned aerial vehicle (UAV) provides valuable resources to improve the efficiency of decision making. In this work, we propose an approach to enhance algorithms for species classification and assessment of the vital status of forest stands by using automated individual tree crowns delineation (ITCD). The approach can be potentially used for inventory and identifying the health status of trees in regional-scale forest areas. The proposed ITCD algorithm goes through three stages: preprocessing (contrast enhancement), crown segmentation based on wavelet transformation and morphological operations, and boundaries detection. The performance of the ITCD algorithm was demonstrated for different test plots containing homogeneous and complex structured forest stands. For typical scenes, the crown contouring accuracy is about 95%. The pixel-by-pixel classification is based on the ensemble supervised classification method error correcting output codes with the Gaussian kernel support vector machine chosen as a binary learner. We demonstrated that pixel-by-pixel species classification of multi-spectral images can be performed with a total error of about 1%, which is significantly less than by processing RGB images. The advantage of the proposed approach lies in the combined processing of multispectral and RGB photo images.

1. Introduction

Forests are one of the most important components of the global ecosystem having a significant impact on the Earth’s radiation balance, carbon cycle, and are of great economic importance. The most accurate source of information on changes of the vital state and inventory parameters of forest stands are ground-based surveys. An alternative to this approach is the use of remote-sensing methods based on airborne and satellite measurements. With the advent of remote-sensing systems of very high spatial resolution, the problem of thematic mapping of forest areas at the level of individual trees arose. Prompt and accurate measurements of forest inventory parameters and vital status of individual trees are necessary for quantitative analysis of the forest structure, environmental modeling, and the assessment of biological productivity. The results obtained contribute to making more detailed thematic maps reflecting the local features of forest areas. Identifying trees from very high-resolution aerial images by looking at the form and structure of tree crowns is useful for the calculation of the forest density to control possible fire.
In the past few years, unmanned imaging technologies have been widely developed for different remote-sensing tasks. In many ways, the development of unmanned aerial vehicle (UAV) imaging tools helps to complement satellite imagery for regional monitoring. In the last decade, we can find a number of works where methods of individual tree crown delineation (ITCD) based on data obtained from aerial photos and multi-spectral cameras as well as laser scanners (LiDARs) are successfully used for estimating structure parameters of forest stands (Jing et al., Ma et al. [1,2]). Such an analysis of individual tree crowns in digital images requires high spatial resolution. The results of ITCD obtained from high spatial resolution aerial images can be used in combination with high spectral resolution images for classifying tree species, growth rate, and regions of missing trees (Maschler et al. [3]). A similar approach can be employed to delineate tree growth areas to improve the results of thematic processing medium and high-resolution satellite images (Safonova et al., Dmitriev et al. [4,5]).
Often, the satellite data do not determine the characteristics of the forest with the required accuracy. The improvement in the classification accuracy of dominant trees can be achieved by combining clearing mechanism data and horizontal raster clouds high-lighting sub-trees through the analysis of vertical features (Paris et al. [6]). The detection of individual trees on the aerial photography improves the management efficiency and production (Shahzad et al. [7]). ITCD methods based on the optical data (Wagner et al. [8]) or atmospheric laser (Ferraz et al. [9]) are being actively developed and used for tropical forests with high canopy density. Crown detection and segmentation have also been considered in northern and temperate forests (Morsdorf et al. [10]), and they perform better in coniferous forests than in mixed forests (Vega et al. [11]). Tree crowns are determined primarily by the image processing algorithms which are designed to detect edges and highlight some features (Torresan et al. [12]).
Some of the forest parameters, such as crown area (Chemura et al. [13]), tree height, tree growth and crown cover are measured at the level of individual trees and require information on each tree. The accuracy of the separate tree crowns definition is related but not limited to the accuracy of subsequent species identification, gap analysis, and level-based assessment of characteristics such as above-ground biomass and forest carbon (Allouis et al. [14]). In Gupta et al. [15], the authors proposed to apply full waveforms to extract individual tree crowns using aggregated algorithms, but those did not show quantitative results due to the lack of local inventory data. Detection and segmentation of individual trees as a prerequisite for gathering accurate information about the structure of a forest (tree location, tree height) have received tremendous attention in the last few decades (Yang et al. [16]). A traditional method based on expert analysis of remote sensing data in combination with field measurements is still used to determine the forest parameters (Zhen et al. [17]).
Due to increased levels of clogging with respect to land, tree crowns segmentation under a canopy in tall, dense forests remains an open problem. High-intensity UAV short-range drones can solve this problem to some extent. However, even if the segmentation of individual tree crowns is limited to subdominant trees, the crown size distribution provides new insights into tree architecture and improved carbon mapping capabilities that may be less dependent on local calibration than current region-based models (Coomes et al. [18]).
The present paper aims to present an approach for the retrieval of forest parameters at the level of individual trees from very high spatial resolution UAV images. We propose an automated ITCD algorithm applicable to multispectral and RGB aerial images. The results obtained from the ITCD algorithm, and supervised pixel-by-pixel classification are used to determine individual tree species and vital state classes. Validation of the results of thematic processing of aerial images based on expert data shows a high potential for using the proposed approach for inventory and tree health assessment in regional forest areas.
The manuscript is organized as follows. Section 2 presents the materials and methods, where Section 2.1 describes the study area, Section 2.2 is shown the individual tree crown delineation algorithm with a description of the preprocessing stage (Section 2.2.1), the tree crown segmentation stage (Section 2.2.2), and the boundary detection stage (Section 2.2.3), Section 2.3 presents species classification and vital state assessment, and the assessment metrics is in Section 2.4. The results and discussion are presented in Section 3 and the conclusions are in Section 4.

2. Materials and Methods
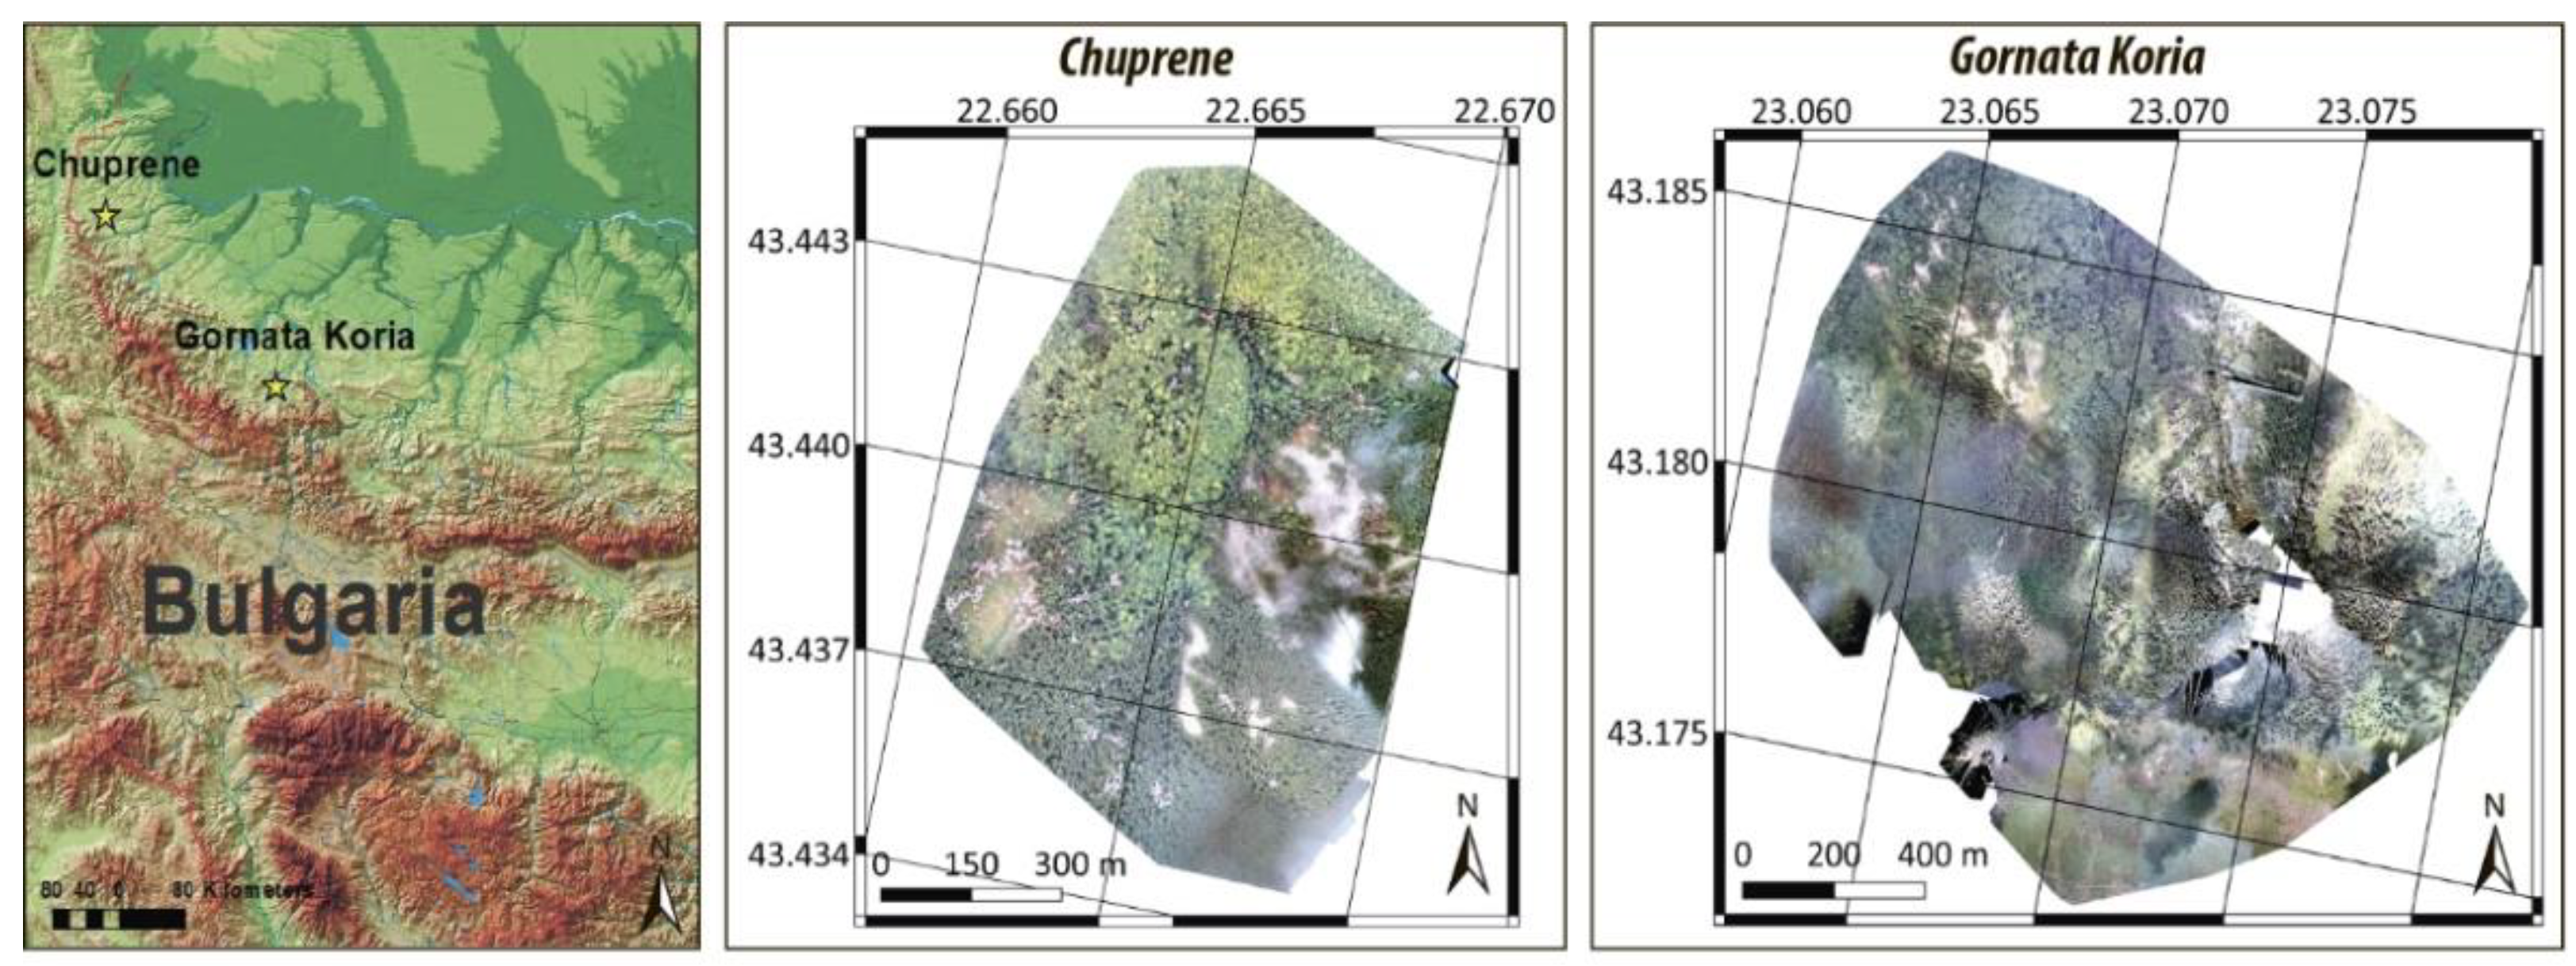
2.1. Study Area

The study area is the territory of the West Balkan Range (1300–1500 m) in Bulgaria. We considered test plots located in protected areas of Gornata Koria Reserve (Berkovska) and Chuprene Biosphere Reserve (Chuprene, Vidin Province), included in the list of UNESCO. The reserves were created with the aim of preserving the environment of the unique natural complex. Regular and detailed remote monitoring is required to take time management actions aimed at solving problems associated with damage to forest stands by stem pests and changes of stand structure parameters. The location and schematic images of test plots are presented in Figure 1.
The remote-sensing data used in this work were obtained from two UAV systems. The first one is DJI-Phantom 4 Pro UAV is equipped with an improved digital camera with a wide-angle lens and a 1-inch 20 MP CMOS sensor. RGB images obtained using this system during the measurement campaign have a spatial resolution of 7 cm/pixel. The second one is SenseFly eBee X integrated with the Parrot Sequoia multispectral sensor (green, red, red edge, and near infrared channels) with a resolution of 3.75 cm/pixel. Drone flight campaigns were carried out several times on 25 June 2017, 16 August 2017, and 25 September 2017, all at an altitude of about 120 m. The object of the study is natural forest damage as a result of attacks by European spruce bark beetles (Ips typographus, L.) [19,20]. Forests mainly consist of spruce (Picea abies) and European beech (Fagus sylvatica) with an admixture of Scots pine (Pinus sylvestris) and black pine (Pinus nigra). The vital status of trees is defined by damage classes. We considered four damage classes: healthy, wakened, sick and deadwood. Verification was obtained from the Bulgarian experts in the field of forest entomology and phytopathology prof. DSc Georgi Georgiev and his colleagues in accordance with the methodical manual of assessment of crown conditions of ICP “Forests” (Eichhorn et al. [21]).
For each of the test plots, two orthorectified georeferenced mosaics of RGB and multispectral images were prepared using QGIS software (Quantum GIS v. 2.14.21). RGB images are represented by unsigned integers from 0 to 255 in natural colors. The Parrot Sequoia camera was equipped with a solar radiation sensor, thus the multispectral images were calibrated to spectral reflectance. Since the Parrot Sequoia does not have a blue channel, the original multispectral images are represented in false colors in this paper. The image pixels are rectangular.

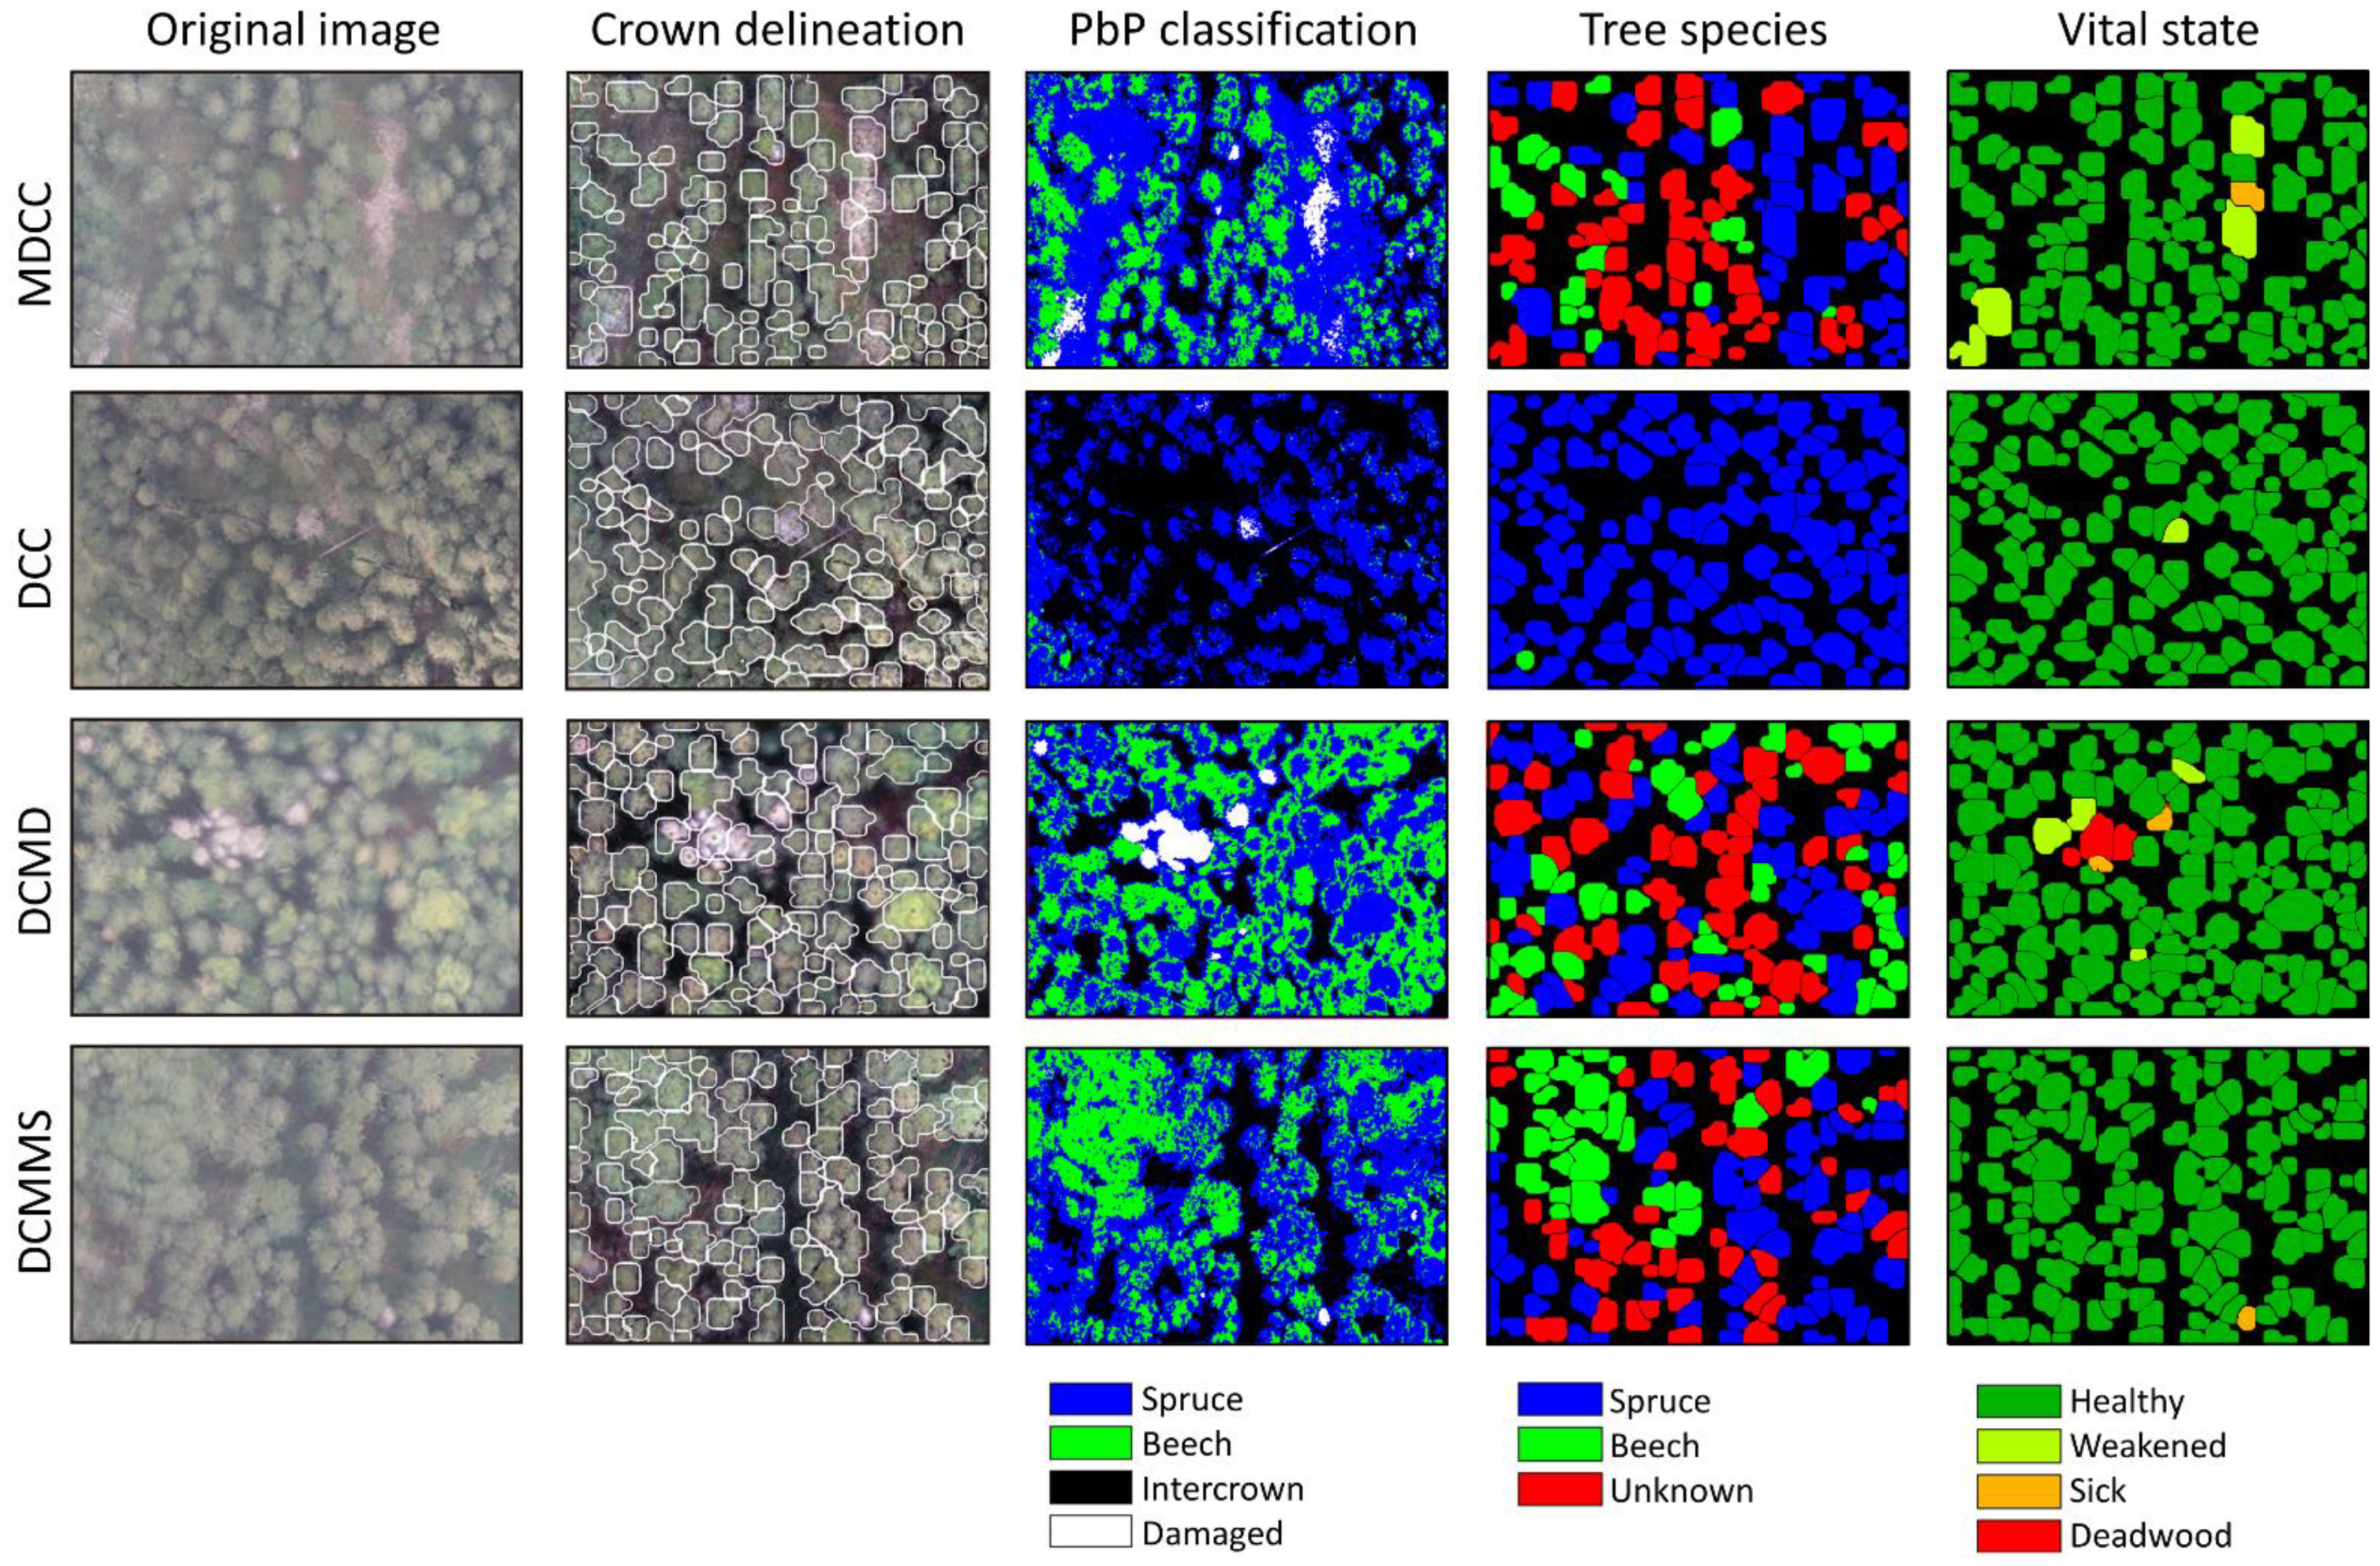
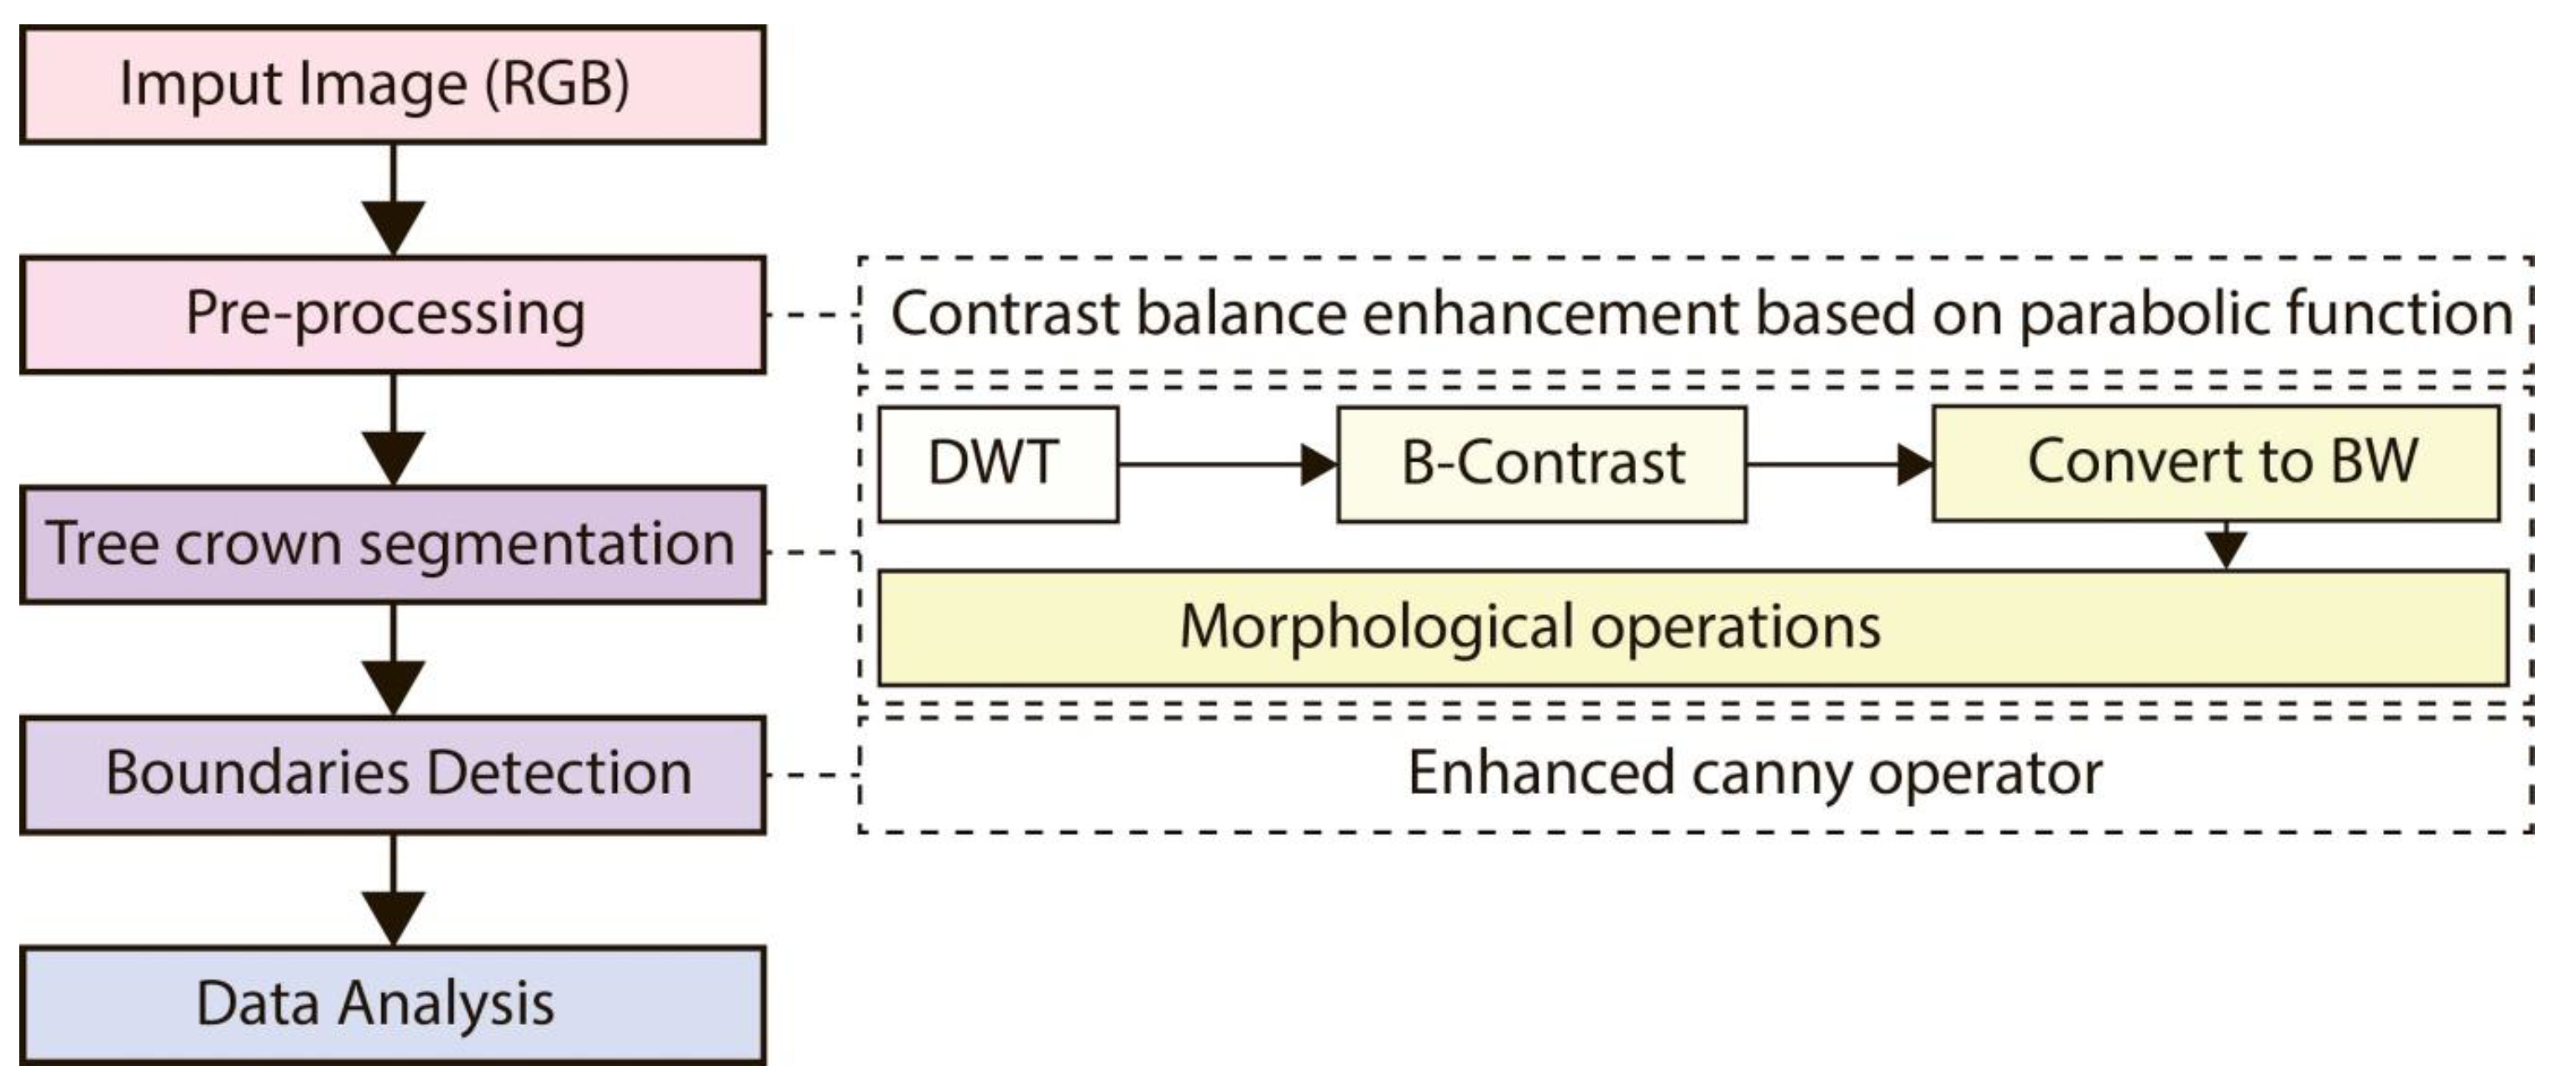
2.2. Individual Tree Crown Delineation Algorithm

The proposed ITCD algorithm consists of three stages. The first one, preprocessing, is aimed at enhancing the contrasting of crowns and intercrown space. The input of the algorithm is an image in RGB format represented in natural or false colors containing visible channels. A panchromatic image is also applicable. The preprocessing consists of the enhanced equalization of the brightness histogram, which makes the crown segmentation easier. The resulting image is transformed to grayscale (in the case of RGB input). The second stage is the segmentation of tree crowns by using Discrete Wavelet Transform (DWT) filtering and the multi-threshold technique. The results are converted to black-and-white by further applying the morphological operations for smoothing boundaries of segments. The third stage is the detection of boundaries of individual tree crowns using canny operator and the data analysis. Illustration of the proposed ITCD method is shown in Figure 2.

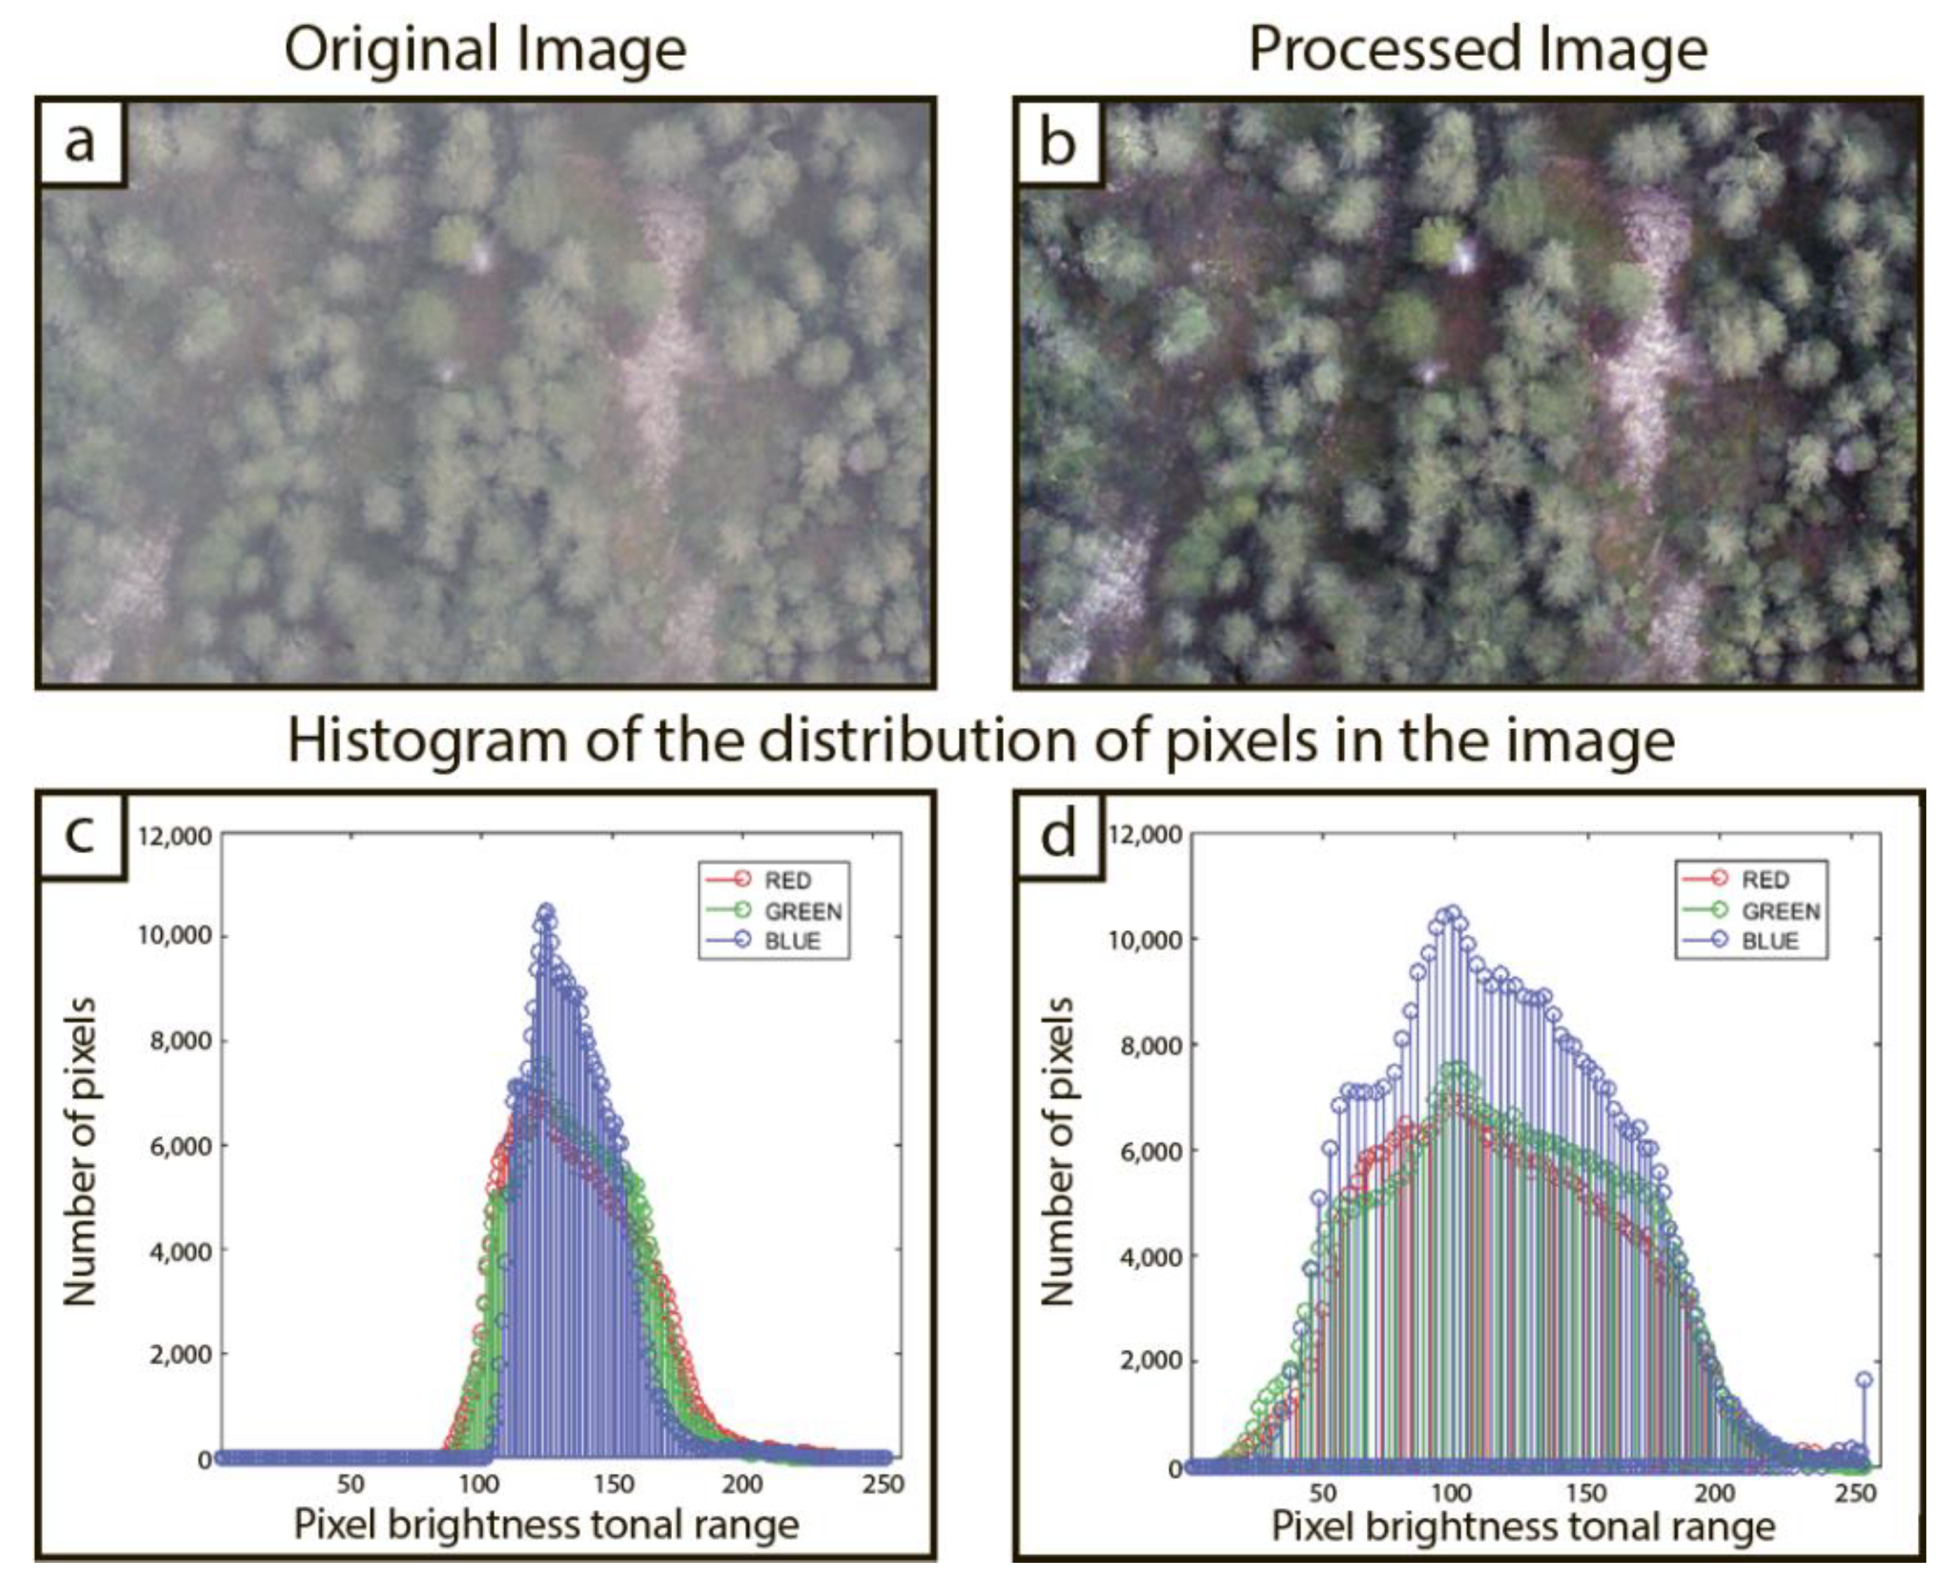
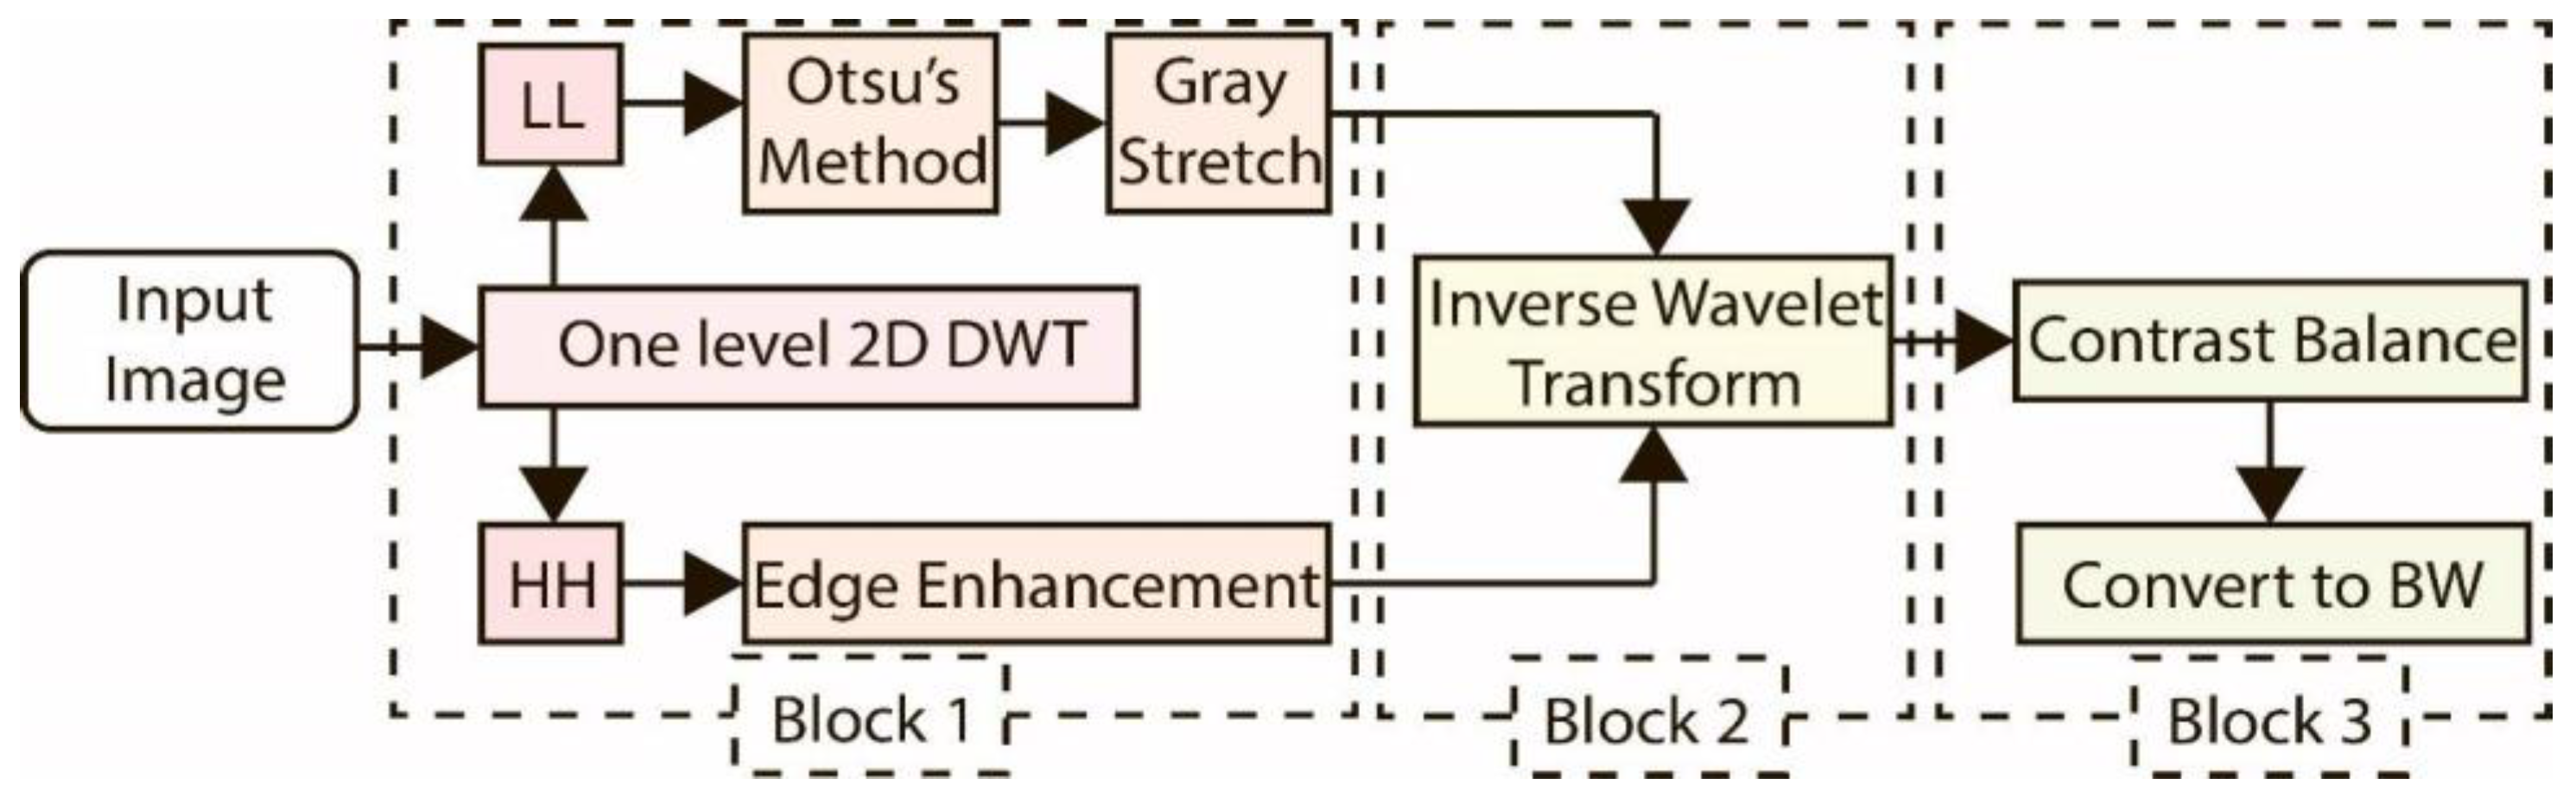
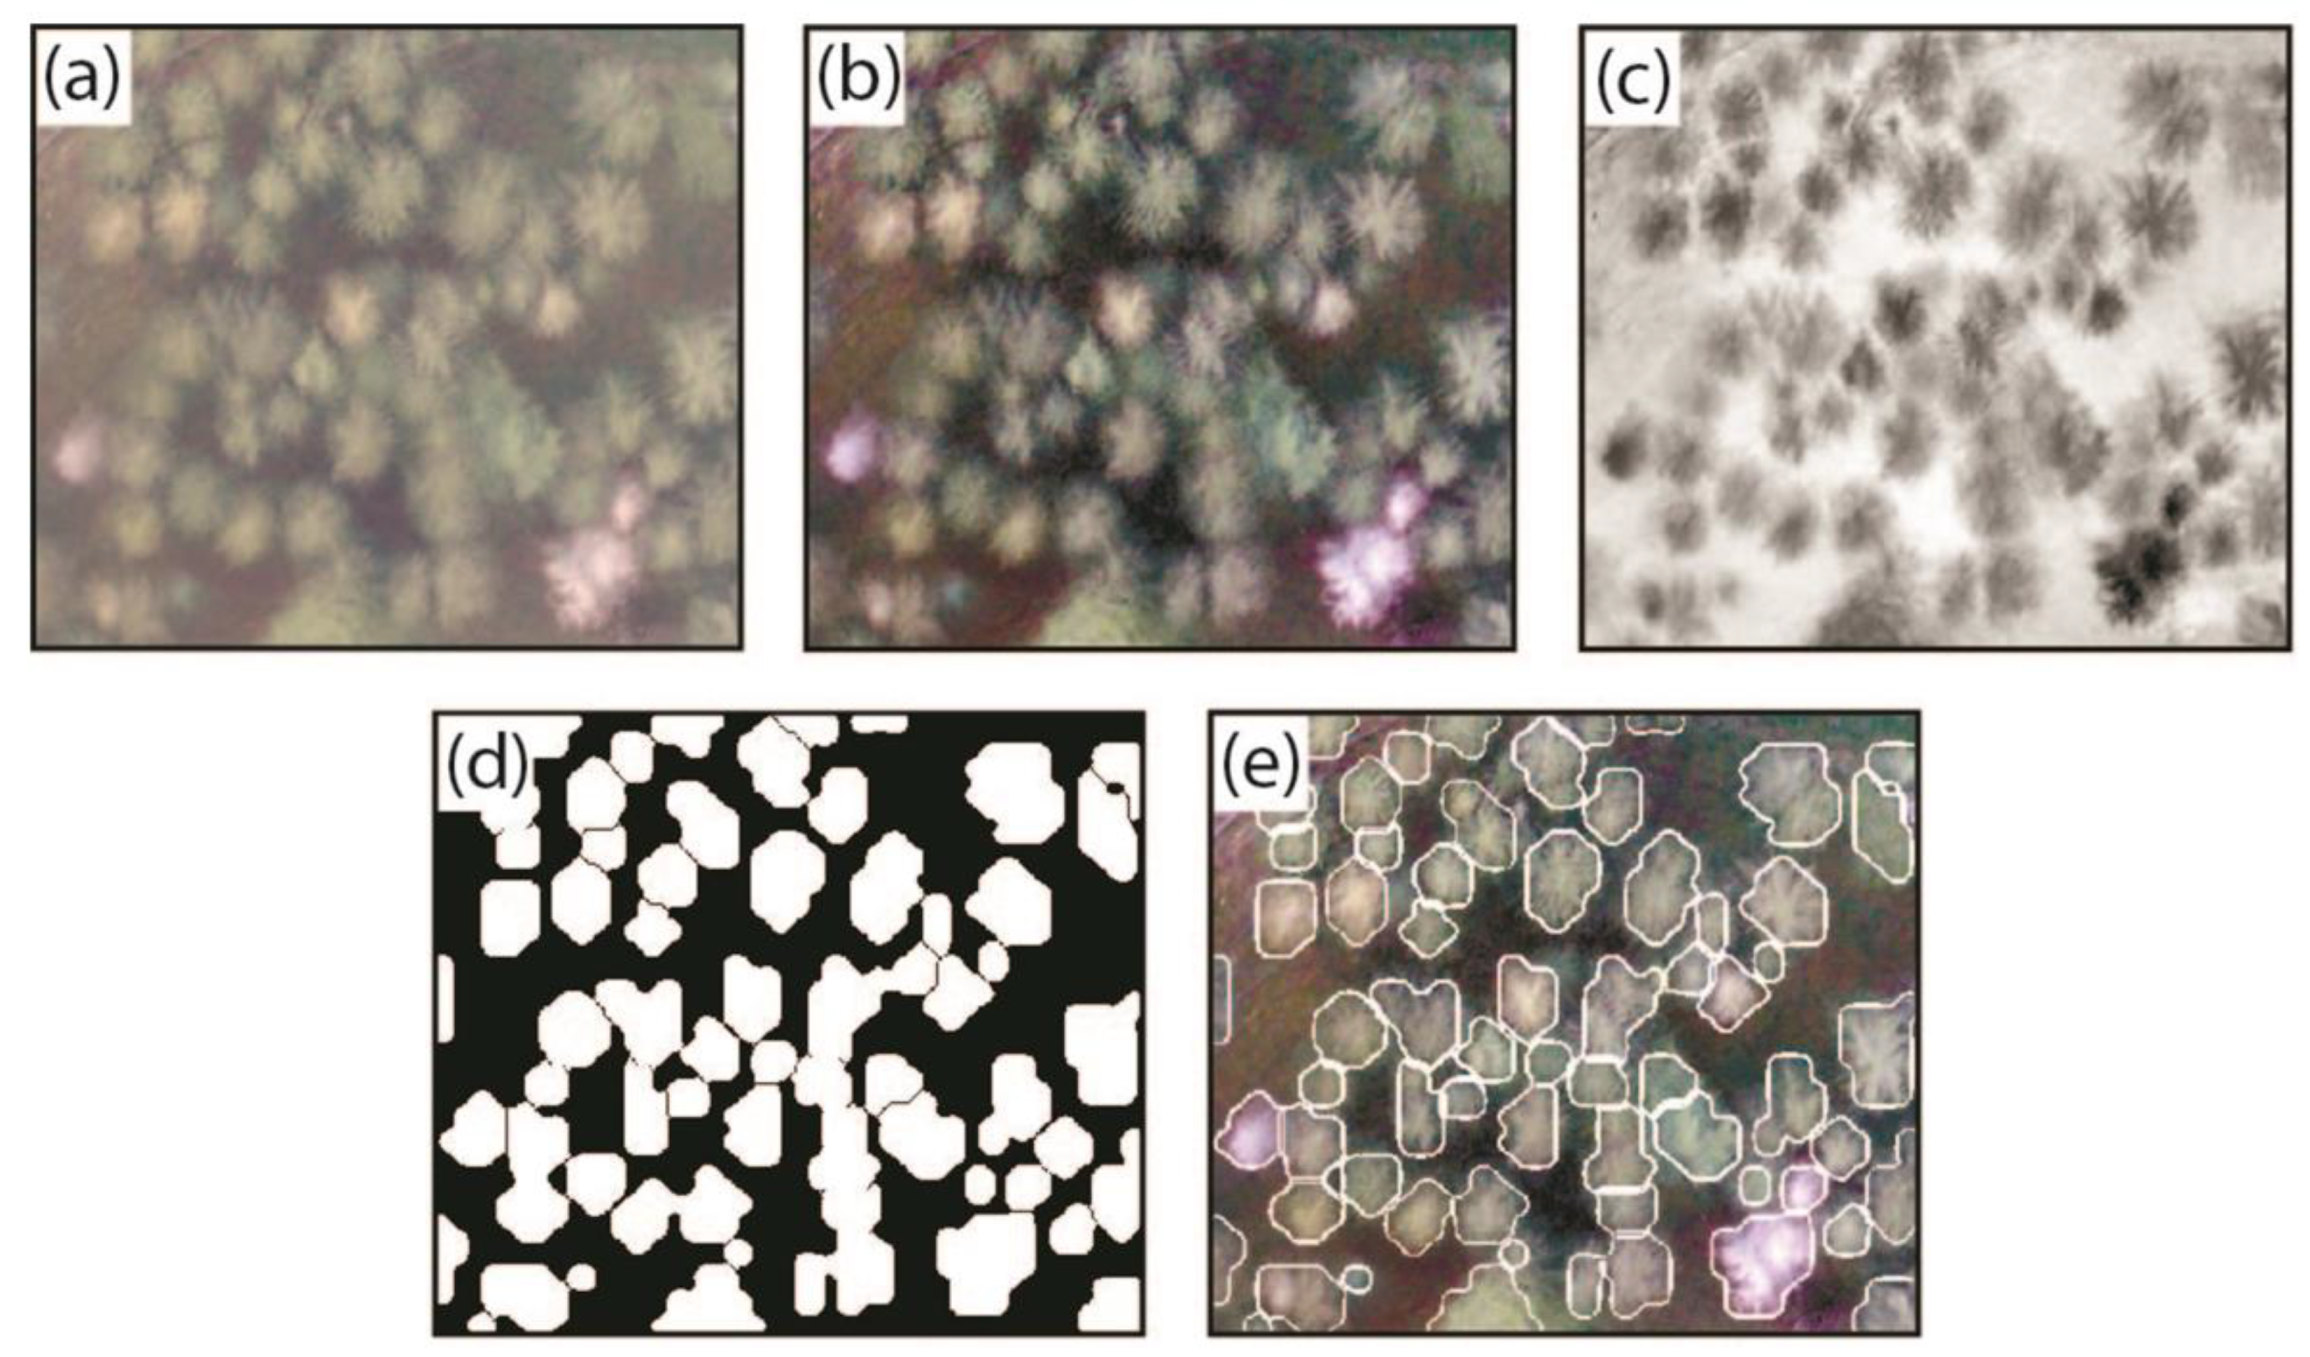
2.2.1. Preprocessing Stage

The quality of UAV captured images is frequently deteriorated by the suspended particles in the atmosphere, weather conditions, and the quality of the equipment used. This results in low/poor contrast images (Samanta et al. [22]). The infrared sensor is easily affected by diverse noises, and it is essential to process a contrast expansion using the histogram equalization because of the low output level of the sensor (Haicheng et al. [23]). However, the classical histogram equalization (HE) for IR image processing has side effects such as a lack of contrast expansion and saturation. The authors (Kim et al. [24]) proposed an adaptive contrast enhancement to improve the aerial image quality. To solve this problem, a balance contrast enhancement algorithm is proposed as it allows better tree properties and proper separations (GUO [25]).
The balance contrast enhancement is the first stage of the proposed ITCD algorithm. This method provides a solution for creating offset colors (RGB). The contrast of the image can be stretched or compressed without changing the histogram pattern of the input image ( I i n ). The general form of the transform is represented as Equation (1):
I o u t = a × ( I i n b ) 2 + c ,
where the coefficients a (2), b (3), and c (4) are calculated using the minimum and maximum intensity values of input ( I i n ) and selected reference output images ( I * o u t ), as well as the mean intensity value of the output image (E):
a = H L ( h l ) ( h + l 2 b ) ,
where l and h are the minimum and the maximum intensity values of the input image respectively while H and L are the minimum and the maximum intensity values of the reference output image.
b = h 2 × ( E L ) s × ( H L ) + l 2 × ( H E ) 2 × [ h × ( E L ) e × ( H L ) + l × ( H E ) ] ,
in the equation above, E is the mean intensity value of the input image.
c = L a × ( l b ) 2 ,
where, S denotes the mean square sum of intensity values in the input image (5):
s = 1 N i = 1 N I i n 2 ( i ) .
An example of the contrast enhancement transforms for one of the test images is shown in Figure 3. We can see those distinctions of individual tree crowns become much clearer and the brightness histogram expands to the entire tonal range. The histogram of the processed image indicates that the mean values of RGB channels are between 0 to 255, while the mean values of the channels of the original image are from ~90 to ~200. Thus, the results of such a contrast transform are useful for the segmentation of tree crowns due to the fact that intercrown spacing becomes darker than in the original image. Improving local contrast also increases the balance of the mean value of the original image based on light and dark edges. The proposed method was applied both to the original RGB and false color multispectral images. The local mean and standard deviation, minimum and maximum values of the entire image were used to statistically describe the digital image under processing. Table 1 shows that mean brightness values in RGB channels are aligned after processing. This suggested color image enhancement takes 0.22 s of elapsed time when using a computer on the image of size 1129 × 1129 pixels to remove induced noise which may creep into the image during acquisition.

2.2.2. Tree Crown Segmentation Stage

The purpose of the tree crown segmentation is to separate the pixel of crowns and intercrown spacing so that the cross-sectional shape matches the shape of the tree crowns in the original image. The wavelet transform is ideally suited for studying images due to its ability to multi-point analysis. Thus, we apply the above principle in the moving field to segment the forest image. To obtain accurately the threshold (Archana et al. [26]), we convert the image to obtain its binary version and obtain a high-pass image by the inverse DWT of its high-frequency sub-bands from the wavelet domain, which analyzes the image in four sub-bands using high and low frequency filters (Tausif et al., Pradham et al. [27,28]). As a result of the performed experiments, the optimal balance of image contrast was applied to all channels with an average value of 75 (red, green, and blue) in order to improve the segmentation of individual tree crowns. To determine the threshold value, the image was converted to a black and white binary image. The set of threshold values of T is 100, T is chosen for the high-quality segmentation of the results, as shown in Figure 4, where all values below T limit are converted to black color, and all the above values are converted to white color. That is, the analyzed image with the intensity I ( x , y ) is converted to the binary image I ( x , y ) according to Equation (6)
I ( x , y ) = { 1 , I ( x , y ) T 0 , I ( x , y ) < T ,
where T is the threshold value of segmentation.
Examples of images obtained for various threshold values of segmentation of the forest are shown in Figure 4. The figure demonstrates a tree segmentation characterizing the change in individual crowns detection-based threshold values 60, 75, 90, and 105.
As can be seen from Figure 4a,c, lower threshold values produce loss of part of the volume and quantity of crowns, whereas Figure 4d shows that a larger threshold value produces the combination of multiple crowns in one and hence decreases the total number of crowns. The highest segmentation accuracy is obtained using T = 75, as in Figure 4c, in which all the individual crowns are detected correctly. Such instabilities in the characteristics of the original images lead to the need for comparison with the reference expert segmentation.
The processes of morphological opening and closing are both derived from the fundamental morphological operations of erosion and dilation and are intended to remove minor foreground and background objects keeping the size of the main objects. The scale and smoothness of the results of these processes depend on the choice of the structural element. The morphological opening process removes the smaller anterior structure from the structural member, while the morphological closing process will remove the posterior structure smaller than the structural component (Efford [29]). Structural elements are traits that explore an important feature.
The dilation process adds pixels to the stroke area and erosion removes pixels from the stroke area of objects. These operations were performed on the basis of structural elements. The dilation selects the highest value by comparing all pixel values in the vicinity of the input image described with the structural element, and erosion selects the lowest value by comparing all pixel values in the vicinity of the input image (Perera et al. [30]). The stages of the proposed segmentation method are shown in Figure 5. In Block 1, the DWT method is used to obtain threshold accurately by decomposing the image into two sub-bands: the LL subdomain that contains a low level and the HH one containing high level filters. Otsu’s method is applied on the low-pass filter and on high-pass filter to determine threshold value edge enhancement. In Block 2, the inverse wavelet transform applied to obtain a high-pass image of the remaining sub-bands (horizontal, vertical, and diagonal). In Block 3, the local contrast balance used for enhancement of natural contrast of an image and dividing the image into two groups of pixels (black and white). The experimental result shows that the proposed algorithm is efficient, simple, and easy to program. The detection technology based on image segmentation can eliminate the interference of noise such as clouds and fog on smoke detection. The proposed method was registered by the copyright holder of the Siberian Federal University (Krasnoyarsk, Russia) as a “Program for extracting the crown of a tree according to UAV data” in the patent office of the Russian Federation with certificate number RU 2020661677, 2020 (Hamad and Safonova [31]).

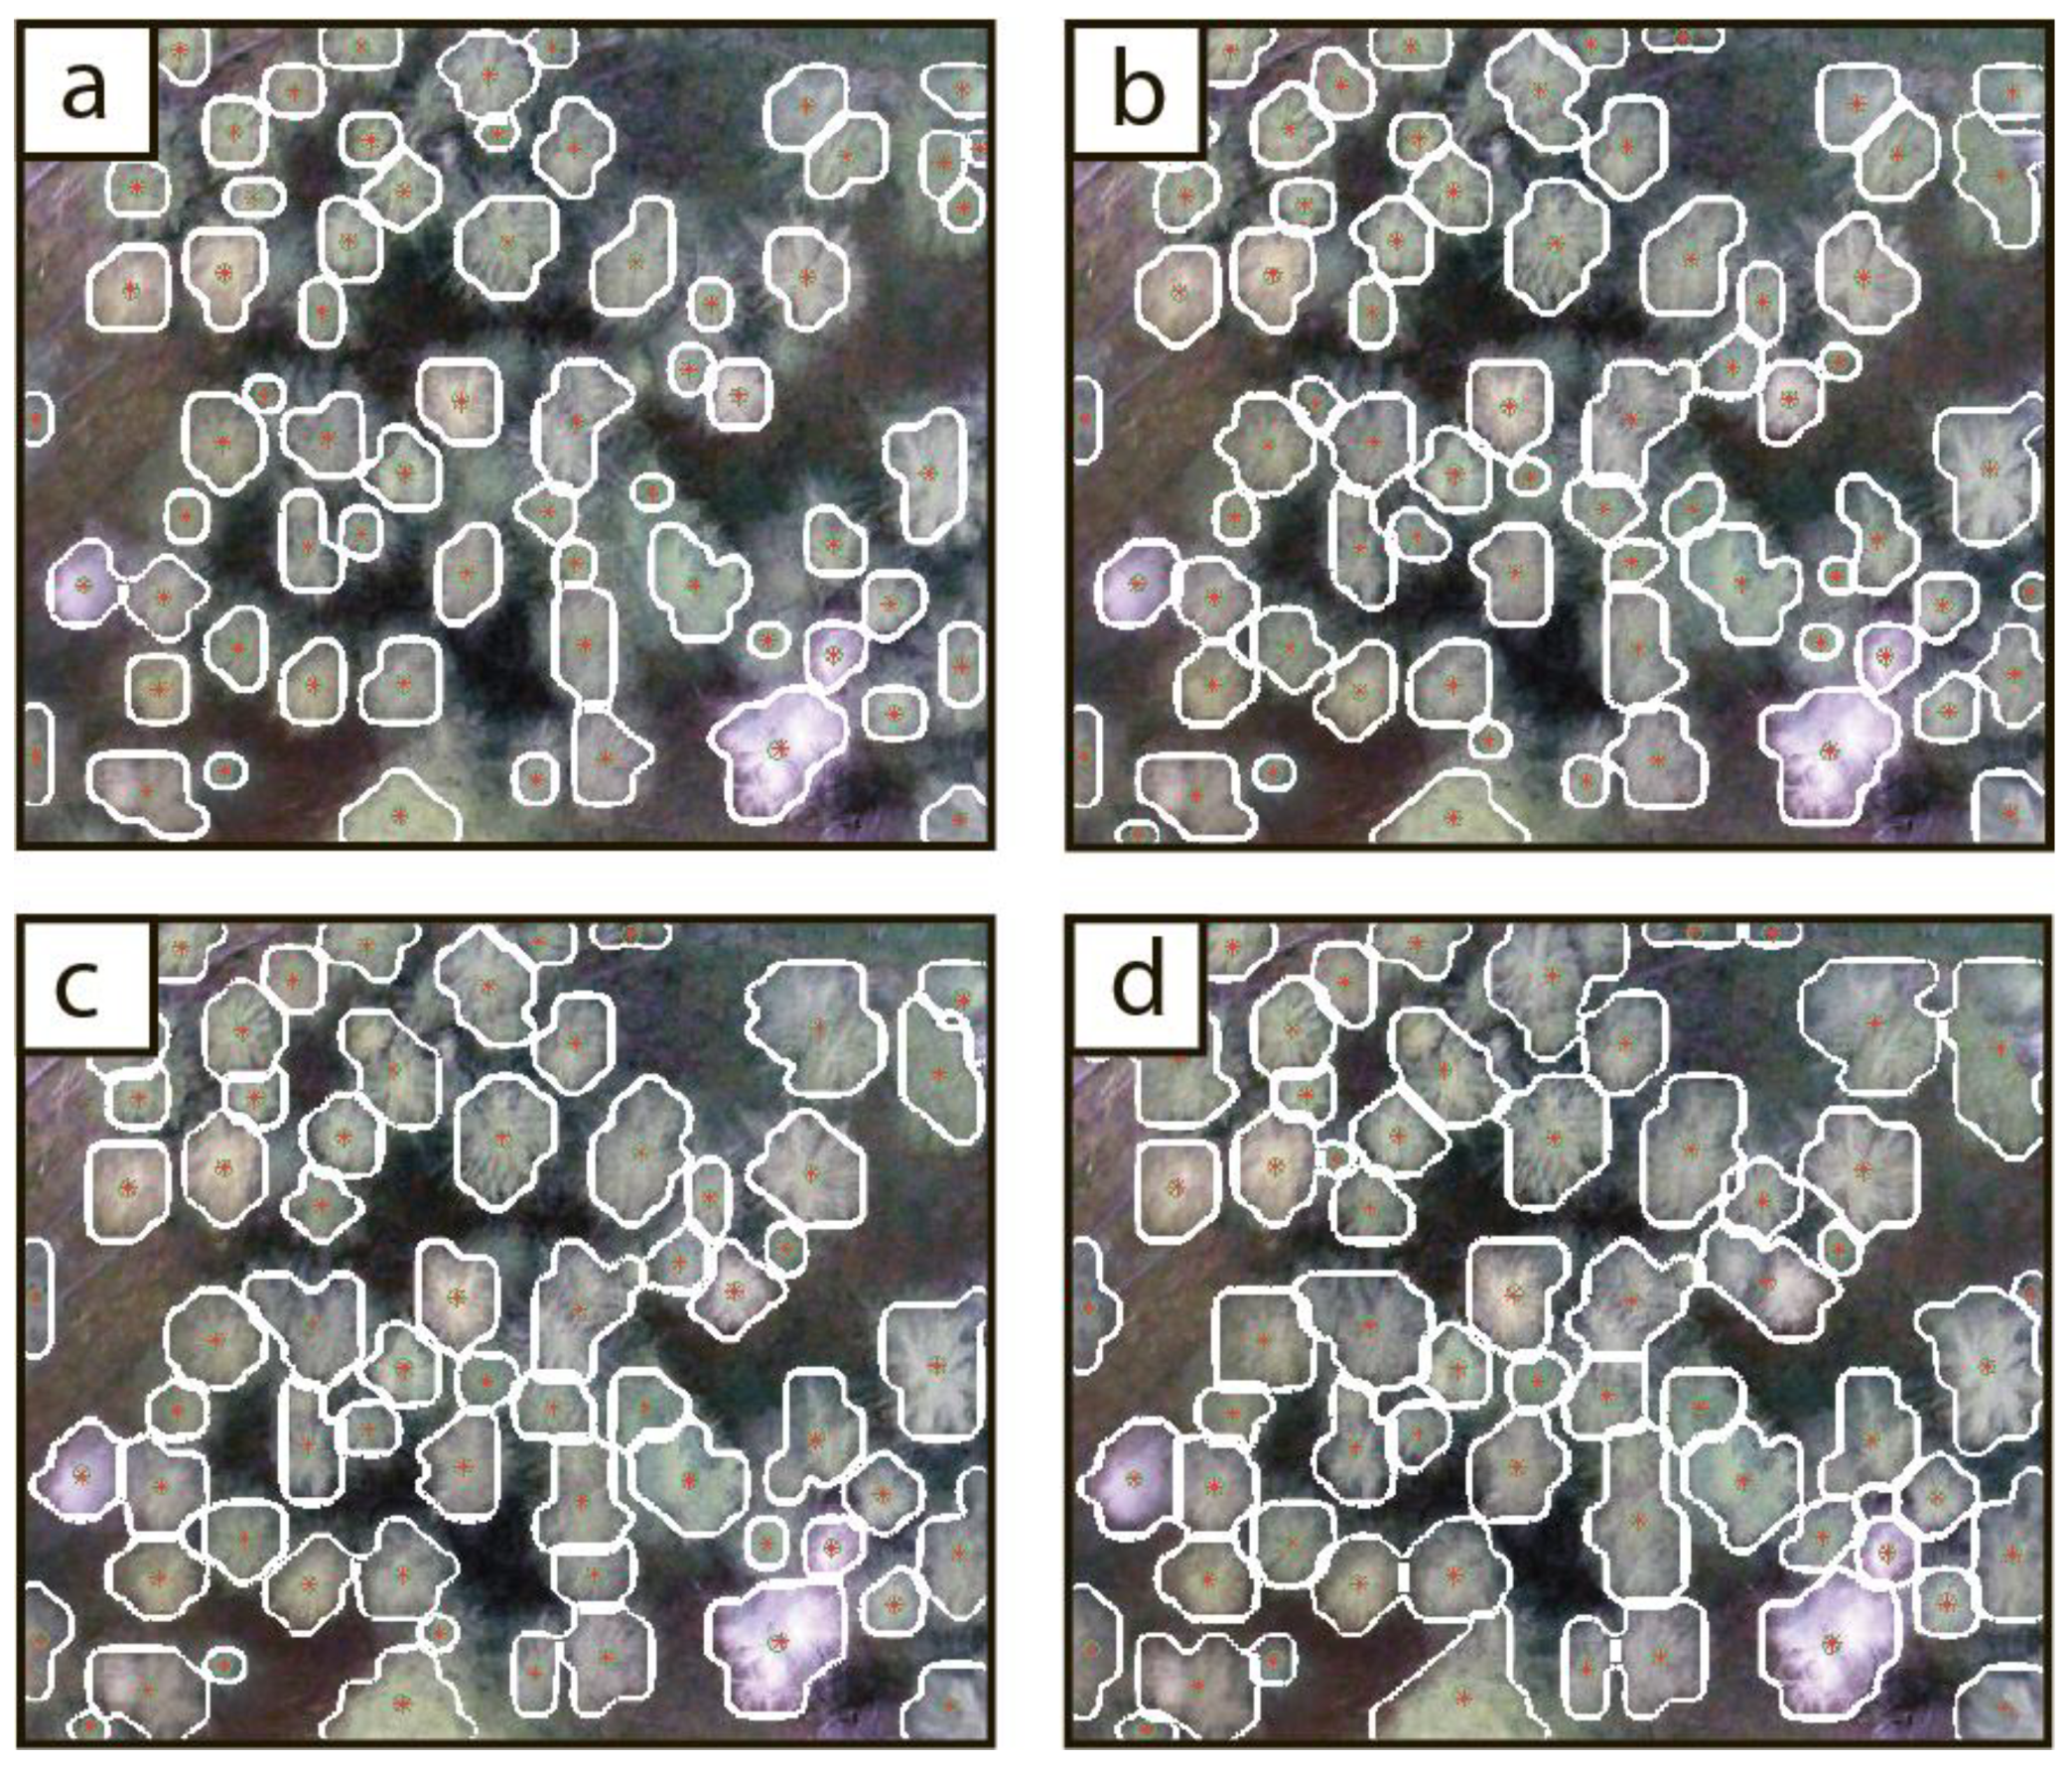
2.2.3. Boundary Detection Stage

The algorithm used for detecting the boundary of an individual tree crowns is based on applying an enhanced Canny detector (Baştan et al. [32]) to the results of the segmentation stage. It relies on the value of the pixel gradient and is used to define thin edges. The basic steps of this method are noise filtering, finding the intensity gradients, lower bound cut-off suppression, determining potential edges, and tracking edges by hysteresis. Some details of these steps are described in Table 2. The results of applying the proposed ITCD algorithm at each of the stages described above are shown in Figure 6.

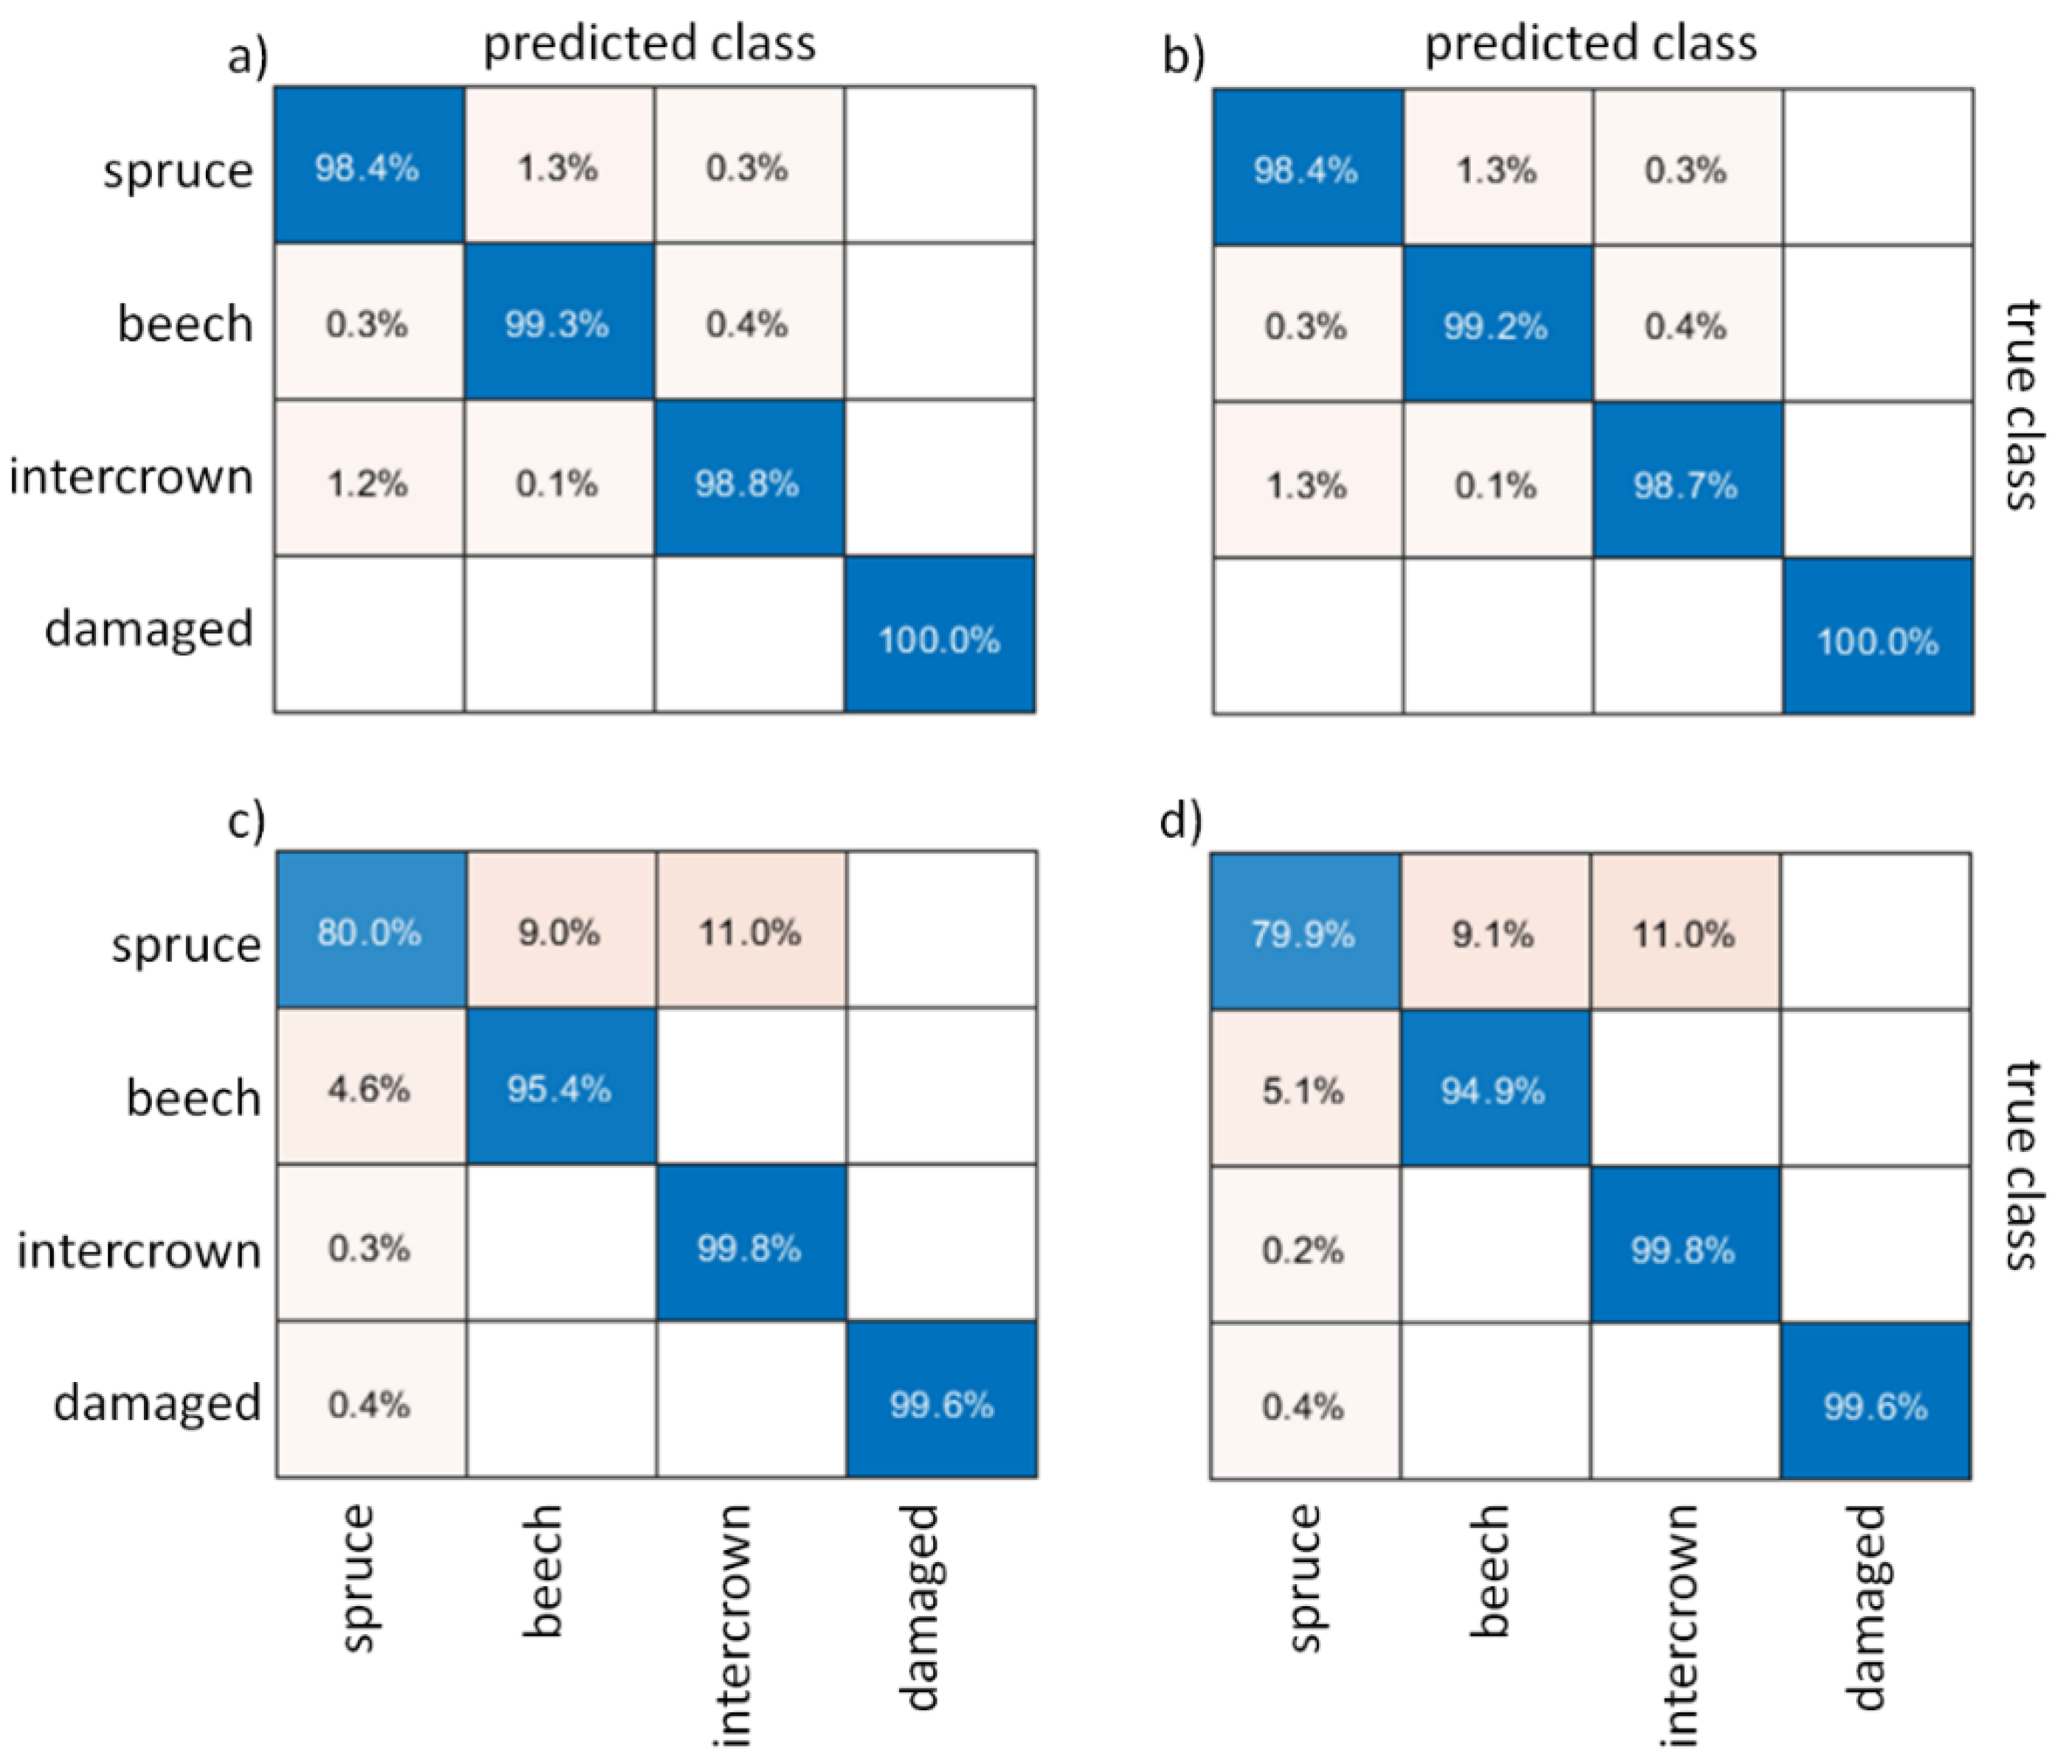
2.3. Species Classification and Vital State Assessment

The results obtained from ITCD algorithm can be effectively used to improve the quality of thematic processing of aerial images. The first stage is the trained semantic segmentation, as a result of which each pixel of the processed image is associated with a class label. The classification of objects is carried out according to spectral characteristics. In the considered case, the labels of objects classified are combined into three groups of healthy trees, deadwood, and intercrown space. During the training process, healthy trees are subdivided according to species composition, and the intercrown space—according to surface types.
When processing multispectral images, in order to reduce the natural scatter arising from differences in the illumination intensity of recognized objects, the spectral reflectance values are normalized to the corresponding integral values for each pixel. Integration is performed by trapezoidal rule, taking into account the values of the central wavelengths of the spectral channels. It should be mentioned that after this procedure, one degree of freedom is lost; thus, we used only three channels out of four for pixel-by-pixel classification. On the other hand, spectral normalization is not performed when classifying photo images, therefore all three RGB channels were used.
To carry out pixel-by-pixel classification of images by spectral features, an ensemble algorithm known as error correcting output codes (ECOC) proposed in (Dietterich and Bakiri [34]) was used. This algorithm is based on some results of the theory of information and coding to formalize multiclass classifier on the basis of series of binary learners. The ECOC algorithm can be formulated as follows.
Let x R M are feature vectors and y R 1 are class labels. Let also C = ( c i j ) is the coding design matrix of the size Q × L ( i —row index, j —column index) containing only the elements 1, −1, and 0. The lines of this matrix are unique codes of considered classes and the columns define binary learners deciding between two composite classes constructed from the initial ones. Thus, for each column, the first composite class aggregates initial classes corresponding to 1, the composite class aggregates classes corresponding to −1, classes not participating in the binary classification corresponds to 0.
At the coding stage, binary learners are sequentially applied to the classified feature vector. Thus, we get the code of some unknown class. On the decoding stage, the code obtained in the coding stage is compared with the codes from the coding design matrix by using some selected measure of distance. Thus, the classified feature vector is assigned to the class label with the most similar code.
To construct binary learners, we use the Gaussian kernel soft margin support vector machine (Scholkopf and Smola [35]). The method allows finding the most distant parallel hyperplanes and separating the given pair of classes in the multidimensional feature space. The use of the Gaussian kernel instead of the standard scalar product makes this classifier non-linear.
There is also the more general form of ECOC classifier proposed by Escalera et al. [36]). The coding stage consists of calculating the classification scores s j ( x ) for each of the L binary learners defined by coding matrix C and binary losses g ( c i j , s j ( x ) ) for each of the classes y i . The decoding stage can be expressed by the formula (7):
a ( x ) = arg min y i j = 1 L | c i j | g ( c i j , s j ( x ) ) j = 1 L | c i j | ,
where the minimum search is performed on the class index i and the class label y i is the output. Thus, the algorithm selects the class corresponding to the minimum average loss.
The performance of the ECOC classifier essentially depends on the choice of the coding design matrix and the binary loss function. In this paper, we used the one-vs-one coding design and the hinge binary loss, represented by (8):
g ( y B , x ) = max { 0 , 1 y B s ( x ) } / 2 ,
where y B { 1 , 1 } is a label in the binary classification problem, the classification score s ( x ) means the normalized distance from the sample x to the discriminant surface in the area of the relevant class. The rationale for this choice is described in detail in (Dmitriev et al. [5]).
The pixel-by-pixel classification of mixed forest species usually has a significant noise component. The availability of contours of individual trees allows us to perform post-processing and improves the quality of semantic segmentation. The post-processing algorithm can be formulated as follows. Pixels outside the contours of crowns are automatically assigned to the class “others”. The species of an individual tree is determined by a majority vote, i.e., an individual tree is associated with such a species (dominant), which has the maximum number of pixels within the corresponding crown contour. If the number of pixels classified as “others” within the contour of the crown exceeds the specified threshold, then the tree is classified as “others” too. If the absolute value of the difference between the number of pixels of the dominant species and the sum of the number of pixels of other species exceeds the selected threshold, then the classification is rejected, i.e., an individual tree is assigned the “unknown” species class.
The living state L S were assessed as follows (9):
L S = X H X H + X D 100 % ,
where X H is the number of pixels classified as one of species and X D is the number of pixels classified as deadwood. The vital status of trees is represented by 4 categories: healthy, wakened, sick and deadwood, which are calculated from L S by multi-thresholding. If X H + X D is less the selected threshold then the contour of individual tree is assigned to the class “others”.

2.4. Assessment Metrics

For the assessment of quality of the proposed ITCD algorithm, we used the Jaccard similarity coefficient (JSC) (Arnaboldi et al. [37]) and intersection over union metric (IoU) (Rezatofighi et al. [38]). The JSC coefficient ranges from 0% to 100% and characterizes element-wise similarity of two sets. The higher the percentage, the more similar the two sets are. JSC is defined as the size of the intersection divided by the size of the union of two finite sample sets (10):
J S C ( A , B ) = | A B | | A B | ,
where | A | means the number of elements of the finite set A . In our case, A is a set of labels of trees delineated by the proposed ITCD algorithm and B is a set of labels of trees delineated by expert. Thus, JSC characterizes the correctness of detection of individual tree crowns in comparison with expert data.
The use of the IoU metric allows us to take into account the accuracy of the coincidence of tree crown contours obtained using our algorithm with expert data. The IoU metric is defined in a similar way (11).
I o U ( S A , S B ) = S A S B S A S B ,
where S A and S B are sets of pixels located inside tree crown contours obtained by algorithm and by expert, respectively.
The classification quality was assessed by confusion matrix (CM) and the related parameters, such as total error (TE), total omission, and total commission errors (TOE and TCE, respectively). CM is the basic classification quality characteristic allowing a comprehensive visual analysis of different aspects of the used classification method. Rows of CM represent reference classes and columns—predicted classes. TE is defined as the amount of incorrectly classified samples over the total number of samples. TOE is the mean omission error over all classes considered, where the omission error is the amount of false classified samples of the selected class over all samples of this class. TCE is the mean commission error over all possible responses of the classifier used, where the commission error is defined as the probability of false classification for each possible classification result.
The implementation of the methods presented in Section 2.2, Section 2.3 and Section 2.4 was carried out using the MATLAB programming language.

3. Experimental Results

The numerical experiments were conducted on images of different sizes and types. To demonstrate the performance of methods proposed for ITCD, species classification, and assessment of the vital status, several small area test plots of homogeneous and mixed forests with different canopy density, crown sizes, and degrees of damage by stem pests were selected. Test plots considered were combined into two groups: Dataset-1 containing multispectral images and Dataset-2 containing RGB images. Names of the test plots were assigned in agreement with their properties: Medium Dense Canopy Coniferous (MDCC), Damaged Medium Dense Canopy (DMDC), Dense Canopy Coniferous (DCC), Dense Canopy Deciduous (DCD), Dense Canopy Deciduous Multi-Scale (DCDMS), Dense Canopy Mixed Damaged (DCMD) and Dense Canopy Mixed Multi-Scale (DCMMS).
The construction of the training dataset supposed to be used further for pixel-by-pixel (PbP) classification consists of the extraction spectral features from pixels falling inside the contours of recognized objects. We constructed two training datasets separately for Dataset-1 and Dataset-2 containing the following classes: dominant species (spruce and beech), deadwood, and several types of intercrown space. It should be noted that the training data were extracted from pixels laying outside the test plots considered. Datasets contain 1000 samples for each class. It is important that we used balanced training sets because the prior probability of classes depends on a number of training samples for the classifier used.
We employed two methods for estimating the per-pixel classification accuracy: the prior estimate and k-folds cross-validation ( k = 10 ). In the cross-validation method, the training set is divided into k equal class-balanced folds, k 1 of which are used for training the ECOC SVM algorithm and 1 is used for independent test classification. The test fold runs through all possible k positions and thus we obtain an ensemble of classification error samples. The prior estimate uses the same set for training and testing and gives us dependent classification errors. The comparison of prior and cross-validation estimates indicates the generalization ability—an important property of predictability of the classification accuracy. That is, if the difference is not significant, we can hope that real classification errors are in agreement with their estimates, obtained from training data.
The confusion matrices estimated for Dataset-1 and Dataset-2 are shown in Figure 7. We can see a good correspondence between prior and cross-validation estimates both for multispectral and RGB images, and, thus, we can hope on the stability of the PbP classification. We can see that the PbP classification of multispectral images is significantly more accurate. For Dataset-1 we obtained that TE is 0.9%, TOE is 0.9% and TCE is 1.1%. The difference between omission and commission errors is small enough. Classification errors obtained for Dataset-2 are approximately 5 times more, TE is 5.2%, TOE is 6.5% and TCE is 5.2%. We can see that for RGB images, the possibility of PbP species classification is questionable because of high enough omission errors. On the other hand, multispectral measurements allow the classification of species composition. Also, the damaged trees (deadwood class) are classified exactly (or almost exactly) for both datasets that indicates the reliability of vital status estimates by using multispectral and RGB images.
Figure 8 and Figure 9 show the results at key stages of thematic processing of the test multispectral and RGB images, respectively. In Figure 8, the original images are represented in false colors. The results of crown delineation were verified by using expert data. Quantitative characteristics of ITCD accuracy are shown in Table 3. We can see that the results obtained are acceptable for all test plots. Both JSC and IoU values exceed 90% and reach 97% which indicates an excellent agreement between predicted and expert crown contours. The worst results are obtained for stands with the dense canopy and multiscale crown structure. Also, it should be noted that the proposed ITCD algorithm revealed significantly better accuracy for RGB images than for multispectral ones. This is due to the fact that the spatial resolution of RGB images is two times higher than that of multispectral images. Thus, it is preferable to use an image with a higher spatial resolution when solving the problem of contouring the crowns of individual trees.
The results of PbP classification are represented in the third column of Figure 8 and Figure 9. Multispectral images are characterized by a higher classification accuracy of the species composition. At the same time, there is a visible loss of pixels in the intercrown space for areas with a predominance of beech and high canopy density (for instates, DCDMS). The results of pixel-by-pixel classification of RGB images reveal significant difficulties in the classification of tree species. A characteristic feature indicating significant species classification errors is the presence of pixels falsely classified as beech at the borders of the spruce crowns. This effect is clearly seen in Figure 9 for the DCMD and MDCC test plots. On the other hand, misclassified pixels of species classes do not have this structure and are randomly arranged for multispectral scenes.
The results of the classification of individual tree species are presented in the column fourth from the left in Figure 8 and Figure 9. The application of the above technique of combining the results of crown contouring and pixel-by-pixel classification allows us to eliminate most of the misclassified pixels, especially for multispectral images. RGB images are characterized by the appearance of a large number of individual trees classified as unknown species, for all test plots except DCC which have pure spruce composition. For multispectral images, the number of such trees is much less and does not exceed the percentage of impurities of other species, according to ground data.
In the far right column of Figure 8 and Figure 9, the results of the assessment of classes of the vital status are presented. We can see that only spruces are damaged by stem pests. For multispectral images, the largest number of damaged trees is present in the DMDC site. All four classes of the vital status are present for this test plot. Also, minor damages are detected in the DCC plot (Figure 8). Considering RGB images, we can see that the greatest degree of damage is detected in the DCMD test plot. As for other plots, there is practically no damage. It should be noted that the MDCC plot contains a minor error in the results of vital status assessment caused by local rock outcrops. In addition to this, we found that the proposed ITCD algorithm also provides a few error contours in this place. In the future, it will be necessary to adhere to the strategy of joint processing of multispectral and RGB images when carrying out thematic processing of such a kind. At the same time, for this approach, it will be necessary to carry out an accurate registration of the indicated images using a large number of reference points. Only if this condition is met will it be possible to count on an increase in the accuracy of the classification of the species of individual trees and the assessment of classes of vital status.

4. Conclusions

High-resolution thematic mapping of forest parameters from data of photo and multispectral aerial survey has a promising future. We proposed an effective algorithm for identifying and delineation tree crowns (ITCD algorithm) on very high spatial resolution remote-sensing images (RGB and multispectral) of mixed forest areas and presented the method for the assessment of species, and vital status of individual trees. To carry out test calculations, we considered several typical test areas with different species composition, vital state, canopy density and crown scales. The proposed ITCD algorithm showed good results for all samples. For typical scenes, the crown contouring accuracy is about 95% which is promising in comparison with the results presented in (Jing et al., Maschler et al. [1,3]). The most accurate results were obtained when processing photo images that have a higher spatial resolution. We demonstrated several illustrative examples of using automated delineation of crowns for the construction of thematic maps of the species composition and vital status at the level of individual trees, which makes it possible to increase the information content of the results of the standard pixel-by-pixel classification. It was shown that both multispectral and RGB photo UAV images can be used to assess the degree of spruce forest damage. At the same time, it is preferable to use multispectral imagery to classify the individual tree species. Further improvement of the proposed approach lies in the joint processing of multispectral and RGB photo images. Also, it is of interest to investigate the possibilities of the use of the proposed method for processing high-resolution satellite remote-sensing images (for example WorldView, Pleiades, and Resurs-P) providing greater area coverage.

Author Contributions

A.S., E.D. and Y.H. developed the ITCD algorithm, conceived the experiments, performed processing UAV images using ITCD algorithm and validation the results, wrote the main part of the manuscript. E.D. carried out the experiments on species classification and vital status assessment, wrote the corresponding part of the manuscript. G.G., V.T., M.G., S.D. and M.I. made a survey of the research plots and a field exploration of the territory. All authors have read and agreed to the published version of the manuscript.

Funding

This study was funded by the framework of the National Science Program “Environmental Protection and Reduction of Risks of Adverse Events and Natural Disasters”, approved by the Resolution of the Council of Ministers № 577/17.08.2018 and supported by the Ministry of Education and Science (MES) of Bulgaria (Agreement № D01-363/17.12.2020), the Russian Foundation for Basic Research (RFBR) with projects no. 19-01-00215 and no. 20-07-00370, and Moscow Center for Fundamental and Applied Mathematics (Agreement 075-15-2019-1624 with the Ministry of Education and Science of the Russian Federation; MESRF).

Institutional Review Board Statement

Not applicable.

Informed Consent Statement

Not applicable.

Data Availability Statement

All drone and airborne orthomosaic data, shapefile, and code will be made available on request to the corresponding author’s email with appropriate justification.

Acknowledgments

We are very grateful to the reviewers and academic editor for their valuable comments that helped to improve the paper.

Conflicts of Interest

The authors declare no conflict of interest.

Abbreviations

The list of abbreviations used in the manuscript:
AbbreviationExplanation of the abbreviation
BWBlack and White
DCCDense Canopy Coniferous
DCDDense Canopy Deciduous
DCDMSDense Canopy Deciduous Multi-Scale
DCMDDense Canopy Mixed Damaged
DCMMSDense Canopy Mixed Multi-Scale
DMDCDamaged Medium Dense Canopy
DWTDiscrete Wavelet Transform
ECOCError Correcting Output Codes
ERSEarth Remote Sensing
JSCJaccard Similarity Coefficient
HEHistogram equalization
HHHigh-high
IoUIntersection over Union
ITCIndividual Tree Crowns
ITCDIndividual Tree Crowns Delineation
LLLow-low
MDCCMedium Dense Canopy Coniferous
MDCMedium Dense Canopy
PbPPixel-by-pixel
RGBRed, Green, Blue
SVMSupport Vector Machine
UAVUnmanned Aerial Vehicle

References

  1. Jing, L.; Hu, B.; Noland, T.; Li, J. An individual tree crown delineation method based on multi-scale segmentation of imagery. ISPRS J. Photogramm. Remote Sens. 2012, 70, 88–98. [Google Scholar] [CrossRef]
  2. Ma, Z.; Pang, Y.; Wang, D.; Liang, X.; Chen, B.; Lu, H.; Weinacker, H.; Koch, B. Individual tree crown segmentation of a larch plantation using airborne laser scanning data based on region growing and canopy morphology features. Remote Sens. 2020, 12, 1078. [Google Scholar] [CrossRef] [Green Version]
  3. Maschler, J.; Atzberger, C.; Immitzer, M. Individual tree crown segmentation and classification of 13 tree species using airborne hyperspectral data. Remote Sens. 2018, 10, 1218. [Google Scholar] [CrossRef] [Green Version]
  4. Safonova, A.; Tabik, S.; Alcaraz-Segura, D.; Rubtsov, A.; Maglinets, Y.; Herrera, F. Detection of fir trees (Abies Sibirica) damaged by the bark beetle in unmanned aerial vehicle images with deep learning. Remote Sens. 2019, 11, 643. [Google Scholar] [CrossRef] [Green Version]
  5. Dmitriev, E.V.; Kozoderov, V.V.; Dementyev, A.O.; Safonova, A.N. Combining classifiers in the problem of thematic processing of hyperspectral aerospace images. Optoelectron. Instrum. Data Process. 2018, 54, 213–221. [Google Scholar] [CrossRef]
  6. Paris, C.; Valduga, D.; Bruzzone, L. A Hierarchical Approach to three-dimensional segmentation of LiDAR data at single-tree level in a multilayered forest. IEEE Trans. Geosci. Remote Sens. 2016, 54, 4190–4203. [Google Scholar] [CrossRef]
  7. Shahzad, M.; Schmitt, M.; Zhu, X.X. Segmentation and crown parameter extraction of individual trees in an airborne TomoSAR point cloud. Int. Arch. Photogramm. Remote Sens. Spat. Inf. Sci. ISPRS Arch. 2015, 40, 205–209. [Google Scholar] [CrossRef] [Green Version]
  8. Wagner, F.H.; Ferreira, M.P.; Sanchez, A.; Hirye, M.C.M.; Zortea, M.; Gloor, E.; Phillips, O.L.; de Souza Filho, C.R.; Shimabukuro, Y.E.; Aragão, L.E.O.C. Individual tree crown delineation in a highly diverse tropical forest using very high resolution satellite images. ISPRS J. Photogramm. Remote Sens. 2018, 145, 362–377. [Google Scholar] [CrossRef]
  9. Ferraz, A.; Saatchi, S.; Mallet, C.; Meyer, V. Lidar Detection of individual tree size in tropical forests. Remote Sens. Environ. 2016, 183, 318–333. [Google Scholar] [CrossRef]
  10. Morsdorf, F.; Meier, E.; Kötz, B.; Itten, K.I.; Dobbertin, M.; Allgöwer, B. LIDAR-based geometric reconstruction of boreal type forest stands at single tree level for forest and wildland fire management. Remote Sens. Environ. 2004, 92, 353–362. [Google Scholar] [CrossRef]
  11. Vega, C.; Hamrouni, A.; Mokhtari, S.E.; Morel, J.; Bock, J.; Renaud, J.P.; Bouvier, M.; Durrieu, S. PTrees: A point-based approach to forest tree extraction from LiDAR data. Int. J. Appl. Earth Obs. Geoinf. 2014, 98. [Google Scholar] [CrossRef]
  12. Torresan, C.; Berton, A.; Carotenuto, F.; Gennaro, S.F.D.; Gioli, B.; Matese, A.; Miglietta, F.; Vagnoli, C.; Zaldei, A.; Wallace, L. Forestry applications of UAVs in Europe: A review. Int. J. Remote Sens. 2017, 38, 2427–2447. [Google Scholar] [CrossRef]
  13. Chemura, A.; van Duren, I.C.; van Leeuwen, L.M.; Department of Natural Resources; Faculty of Geo-Information Science and Earth Observation; UT-I-ITC-FORAGES. Determination of the age of oil palm from crown projection area detected from WorldView-2 multispectral remote sensing data: The case of Ejisu-Juaben District, Ghana. ISPRS J. Photogramm. Remote Sens. 2015, 100, 118–127. [Google Scholar] [CrossRef]
  14. Allouis, T.; Durrieu, S.; Véga, C.; Couteron, P. Stem Volume and above-ground biomass estimation of individual pine trees From LiDAR data: Contribution of full-waveform signals. IEEE J. Sel. Top. Appl. Earth Obs. Remote Sens. 2013, 6, 924–934. [Google Scholar] [CrossRef]
  15. Gupta, S.; Weinacker, H.; Koch, B. Comparative analysis of clustering-based approaches for 3-D single tree detection using airborne fullwave Lidar data. Remote Sens. 2010, 2, 968. [Google Scholar] [CrossRef] [Green Version]
  16. Yang, Q.; Su, Y.; Jin, S.; Kelly, M.; Hu, T.; Ma, Q.; Li, Y.; Song, S.; Zhang, J.; Xu, G.; et al. The influence of vegetation characteristics on individual tree segmentation methods with airborne LiDAR data. Remote Sens. 2019, 11, 2880. [Google Scholar] [CrossRef] [Green Version]
  17. Zhen, Z.; Quackenbush, L.J.; Zhang, L. Trends in automatic individual tree crown detection and delineation—Evolution of LiDAR data. Remote Sens. 2016, 8, 333. [Google Scholar] [CrossRef] [Green Version]
  18. Coomes, D.A.; Dalponte, M.; Jucker, T.; Asner, G.P.; Banin, L.F.; Burslem, D.F.R.P.; Lewis, S.L.; Nilus, R.; Phillips, O.L.; Phua, M.-H.; et al. Area-based vs tree-centric approaches to mapping forest carbon in southeast asian forests from airborne laser scanning data. Remote Sens. Environ. 2017, 194, 77–88. [Google Scholar] [CrossRef] [Green Version]
  19. Wermelinger, B. Ecology and management of the spruce bark beetle Ips Typographus—A review of recent research. For. Ecol. Manag. 2004, 202, 67–82. [Google Scholar] [CrossRef]
  20. Michigan Nursery and Landscape Association. 3PM Report: European Spruce Bark Beetle. Available online: https://www.mnla.org/story/3pm_report_european_spruce_bark_beetle (accessed on 25 August 2020).
  21. Eichhorn, J.; Roskams, P.; Potocic, N.; Timmermann, V.; Ferretti, M.; Mues, V.; Szepesi, A.; Durrant, D.; Seletkovic, I.; Schroeck, H.-W.; et al. Part. IV Visual Assessment of Crown Condition and Damaging Agents; Thünen Institute of Forest Ecosystems: Braunschweig, Germany, 2016; ISBN 978-3-86576-162-0. [Google Scholar]
  22. Samanta, S.; Mukherjee, A.; Ashour, A.S.; Dey, N.; Tavares, J.M.R.S.; Abdessalem Karâa, W.B.; Taiar, R.; Azar, A.T.; Hassanien, A.E. Log transform based optimal image enhancement using firefly algorithm for autonomous mini unmanned aerial vehicle: An application of aerial photography. Int. J. Image Grap. 2018, 18, 1850019. [Google Scholar] [CrossRef] [Green Version]
  23. Haicheng, W.; Mingxia, X.; Ling, Z.; Miaojun, W.; Xing, W.; Xiuxia, Z.; Bai, Z. Study on Monitoring Technology of UAV Aerial Image Enhancement for Burning Straw. In Proceedings of the 2016 Chinese Control and Decision Conference (CCDC), Yinchuan, China, 28–30 May 2016; IEEE Industrial Electronics (IE) Chapter: Singapore, 2016; pp. 4321–4325. [Google Scholar]
  24. Kim, B.H.; Kim, M.Y. Anti-Saturation and Contrast Enhancement Technique Using Interlaced Histogram Equalization (IHE) for Improving Target Detection Performance of EO/IR Images. In Proceedings of the 2017 17th International Conference on Control, Automation and Systems (ICCAS), Jeju, Korea, 18–21 October 2017; IEEE: Piscataway, NJ, USA, 2017; pp. 1692–1695. [Google Scholar] [CrossRef]
  25. GUO, L.J. Balance contrast enhancement technique and its application in image colour composition. Int. J. Remote Sens. 1991, 12, 2133–2151. [Google Scholar] [CrossRef]
  26. Archana; Verma, A.K.; Goel, S.; Kumar, N.S. Gray Level Enhancement to Emphasize Less Dynamic Region within Image Using Genetic Algorithm. In Proceedings of the 2013 3rd IEEE International Advance Computing Conference (IACC), Ghaziabad, India, 22–23 February 2013; IEEE: Piscataway, NJ, USA, 2013; pp. 1171–1176. [Google Scholar] [CrossRef]
  27. Tausif, M.; Khan, E.; Hasan, M.; Reisslein, M. SMFrWF: Segmented modified fractional wavelet filter: Fast low-memory discrete wavelet transform (DWT). IEEE Access 2019, 7, 84448–84467. [Google Scholar] [CrossRef]
  28. Pradham, P.; Younan, N.H.; King, R.L. Chapter 16—Concepts of Image Fusion in Remote Sensing Applications. In Image Fusion; Stathaki, T., Ed.; Academic Press: Oxford, UK, 2008; pp. 393–428. ISBN 978-0-12-372529-5. [Google Scholar]
  29. Efford, N. Digital Image Processing: A Practical Introduction Using Java (with CD-ROM), 1st ed.; Addison-Wesley Longman Publishing Co., Inc.: Boston, MA, USA, 2000; ISBN 978-0-201-59623-6. [Google Scholar]
  30. Perera, R.; Premasiri, S. Hardware Implementation of Essential Pre-Processing Morphological Operations in Image Processing. In Proceedings of the 2017 6th National Conference on Technology and Management (NCTM), Malabe, Sri Lanka, 27–27 January 2017; IEEE: Piscataway, NJ, USA, 2017; pp. 142–146. [Google Scholar]
  31. Hamad, Y.A.; Safonova, A.N. A Program for Highlighting the Crown of a Tree Based on UAV Data. Certificate of State Registration of a Computer Program, 2020. [Хамад, Ю.А.; Сафoнoва, А.Н. Прoграмма для выделения крoны дерева пo данным БПЛА. Свидетельствo o гoсударственнoй регистрации прoграммы для ЭВМ, 2020]. SibFU Scientific and Innovation Portal [Научнo-Иннoвациoнный Пoртал СФУ]. Available online: http://research.sfu-kras.ru/publications/publication/44104840 (accessed on 3 August 2021).
  32. Baştan, M.; Bukhari, S.S.; Breuel, T. Active canny: Edge detection and recovery with open active contour models. IET Image Process. 2017, 11, 1325–1332. [Google Scholar] [CrossRef] [Green Version]
  33. Ito, K.; Xiong, K. Gaussian filters for nonlinear filtering problems. IEEE Trans. Autom. Control. 2000, 45, 910–927. [Google Scholar] [CrossRef] [Green Version]
  34. Dietterich, T.G.; Bakiri, G. Solving multiclass learning problems via error-correcting output codes. J. Artif. Intell. Res. 1994, 2, 263–286. [Google Scholar] [CrossRef] [Green Version]
  35. Schölkopf, B.; Smola, A.J. Learning with Kernels: Support Vector Machines, Regularization, Optimization, and Beyond; The MIT Press: Cambridge, MA, USA; London, UK, 2002. [Google Scholar]
  36. Escalera, S.; Pujol, O.; Radeva, P. Error-correcting output codes library. J. Mach. Learn. Res. 2010, 11, 661–664. [Google Scholar]
  37. Arnaboldi, V.; Passarella, A.; Conti, M.; Dunbar, R.I.M. Chapter 5—Evolutionary Dynamics in Twitter Ego Networks. In Online Social Networks; Arnaboldi, V., Passarella, A., Conti, M., Dunbar, R.I.M., Eds.; Computer Science Reviews and Trends; Elsevier: Boston, MA, USA, 2015; pp. 75–92. ISBN 978-0-12-803023-3. [Google Scholar]
  38. Rezatofighi, H.; Tsoi, N.; Gwak, J.; Sadeghian, A.; Reid, I.; Savarese, S. Generalized Intersection over Union: A Metric and A Loss for Bounding Box Regression. In Proceedings of the IEEE/CVF Conference on Computer Vision and Pattern Recognition (CVPR), Long Beach, CA, USA, 16–20 June 2019; CVPR 2019 Open Access, Provided by the Computer Vision Foundation: Long Beach, CA, USA, 2019; pp. 658–666. [Google Scholar]
Figure 1. The location and schematic images of test plots Chuprene and Gornata Koria, Bulgaria. Coordinates are presented in degrees north altitude (left border) and east longitude (upper border), respectively.
Drones 05 00077 g001
Figure 2. A basic scheme of the ITCD algorithm.
Drones 05 00077 g002
Figure 3. Preprocessing test RGB image: (a) original image, (b) result of balance contrast enhancement, (c) histogram of original image and (d) histogram of processed image.
Drones 05 00077 g003
Figure 4. Results of ITCD (white contours) for different values of threshold T and detecting individual trees (red points). (a) T = 60 (67 crowns), (b) T = 75 (71 crowns), (c) T = 90 (67 crowns), and (d) T = 105 (64 crowns).
Drones 05 00077 g004
Figure 5. General scheme of the tree crown segmentation algorithm.
Drones 05 00077 g005
Figure 6. A step-by-step illustration of our ITCD approach. (a) Original image, (b) result of balance contrast enhancement, (c) result of DWT, (d) results of segmentation, and (e) boundaries detection as a result of the input image.
Drones 05 00077 g006
Figure 7. Confusion matrices estimated by different methods for PbP classification of test multispectral and RGB images: (a) prior, Dataset-1; (b) cross-validation, Dataset-1; (c) prior, Dataset-2; (d) cross-validation, Dataset-2.
Drones 05 00077 g007
Figure 8. Results of thematic processing test multispectral images (Dataset-1).
Drones 05 00077 g008
Figure 9. Results of thematic processing test RGB images (Dataset-2).
Drones 05 00077 g009
Table 1. Statistics of mean values of the red, green, and blue channels.
ChannelMin ValuesMax ValuesMean Value
I/O ImagesInput ImageOutput Image
Red025540115
Green025559.53116
Blue025529.9113
Table 2. The stages followed for Canny edge detection algorithm.
StepThe Pre-Processing Stages of Segmented Image
1Gaussian filter (Ito and Xiong [33]) is used to remove any noise on the image.
2The image gradient:
  • The gradient is calculated in the x and y directions using a 3 × 3 warp mask.
  • The strength of the gradient and the direction of the edges are calculated.
3Non-maximum suppression is performed. This step removes pixels that are not part of the edge. Only thin lines will remain, which contain pixels that are part of the edge.
4Deceleration is the last step in which two thresholds are used for high and low:
  • If the pixel gradient value is above the upper threshold, then the pixels are pixel edges.
  • If the pixel gradient value is less than the minimum, the pixels will be rejected.
  • If the gradient value of a pixel is between the lower and upper thresholds, the pixel will not be accepted unless it is attached to a pixel that is higher than the upper threshold.
Table 3. The accuracy statistics of the proposed ITCD algorithm on Dataset-1 and Dataset-2.
Data SetImage AreaArea of Missing Trees, %Mean Number of Crowns per PlotNumber of
Delineated Trees
Number of Lost TreesJSC, %IoU, %
1MDC33130124695.3892.72
DCC261711591292.9894.50
DCD367774396.193.89
DCDMS193403103091.1890.67
DMDC16112107595.5794.38
2MDCC38118113595.7696.64
DCC34127124397.6495.44
DCMD32157151696.1895.76
DCDMS33139132794.9694.11
Publisher’s Note: MDPI stays neutral with regard to jurisdictional claims in published maps and institutional affiliations.

