1. Introduction
One way to cope with disasters and security situations is to use drones to search for where events occur [
1,
2], which can provide visual information by taking images from the sky. In general, drone imaging has been used for military purposes, and it is also the most commercially used method for video production. The usability of drones has already been demonstrated, and as the operating area gradually gets closer to humans, there is a demand for new detection methods beyond existing mission equipment that only provides images. One new method is to detect sounds.
Acoustic-based detection methods in disaster and security situations can complement the limitations of image-based target detection methods. In addition, acoustic-based detection methods are needed in situations where image identification is needed at night, in bad weather, and over complex terrain with features that can be difficult to identify [
3,
4]. This technology extends detection methods by adding human hearing-like sensations to drones. In particular, it is considered to be a necessary technology for detecting the location of explosions in disaster situations such as fires or detecting distress signals for lifesaving situations.
The technology of detecting targets using acoustic signals has been previously studied in a variety of fields [
5,
6,
7], from implementing a robot that detects sounds by mimicking human ears to noise source instrumentation systems for the analysis of mechanical noise. Prior to the development of radar, this technique was used to detect the invasion of enemy aircraft by sound to defend against anti-aircraft. In recent years, it has also been applied to systems that track where guns are fired. Recently, it has become an essential technology for low noise research and has been used to detect and quantify acoustic sources of noise generated by transport vehicle systems such as automobiles and aviation. This technique is based on the principle of detecting acoustic sources by reconstructing acoustic pressure measured by the concept of phase difference using microphone arrays.
The most significant problem associated with detecting external noise by mounting microphones on a drone is the noise of the drone when it operates. The main noise generated by a drone is aeroacoustics noise generated mainly by rotating rotors [
8]. Depending on the mechanism of occurrence, a significant factor that affects the tonal or broadband frequency band is related to the blade passing frequency [
9,
10]. A typical drone has more than four rotors, which creates a more complex noise field environment [
11,
12]. Furthermore, the operating noise of a drone in close proximity to a microphone can cause the sound to be masked and indistinguishable. Therefore, robust denoising techniques are essential for identifying external sounds in highly noisy environments. It is ideal for a drone to reduce its own noise in terms of operability, but this is difficult to implement immediately with the current technology; therefore, signal processing that reduces noise from signals acquired from microphones is realistic. Spectrum subtraction is a method of eliminating noise and obtaining clean sound to improve the signal-to-noise ratio in a noisy environment. This is one of the methods of background noise suppression and has been studied for the purpose of clarifying voices in the field of voice recognition [
13,
14]. In general, background noise is removed by using statistical characteristics of background noise, but applicable methods are also being studied in non-stationary noise environments [
15,
16,
17]. In addition, there are cases that are effective in improving the signal-to-noise ratio in sound detection such as impact sound [
18].
Beamforming methods are well known as methods for estimating the direction of arrival of acoustic sources [
19,
20,
21,
22]. Beamforming is the principle of calculating beam power by using multiple microphones to correct the phase difference of signals according to the geometric positional relationships among the microphones and estimating the direction of arrival of the source from that intensity [
23]. The direction of arrival estimation performance of the beamforming method is determined by the number of microphones, the form of the array, and an improved algorithm. Beamforming methods can also reduce the strength of uncorrelated signals by phase difference correction and increase the strength of the signal of interest to enhance the signal-to-noise ratio by reducing noise. Generally, the greater the number of microphones and the higher the caliber, the better the performance; however, limited number and size microphone arrays are used considering real-time processing and hardware performance.
Recently, studies have been conducted to detect sound sources by installing microphone arrays in drones. Although the use of microphone arrays to detect or distinguish sound sources is common, there are various results depending on the hardware that makes up the array and the array signal processing algorithms. In [
24,
25], the authors studied how to attach microphone arrays to drones and embedded systems for signal acquisition. In [
26,
27,
28], the authors presented an arrival angle detection algorithm for sound sources based on beamforming. In addition, valid results for the detection of sound sources were shown through verification experiments on near-field sound sources in a well-refined indoor environment. There are also sound source detection studies on the actual operation of drones in outdoor environments. In [
29,
30], detection studies were conducted on whistles and voices. These studies confirmed the performance of sound source detection in terms of the signal-to-noise ratio of sound source and background noise, and showed that it is possible to detect nearby sound sources located about 20 m away from drones.
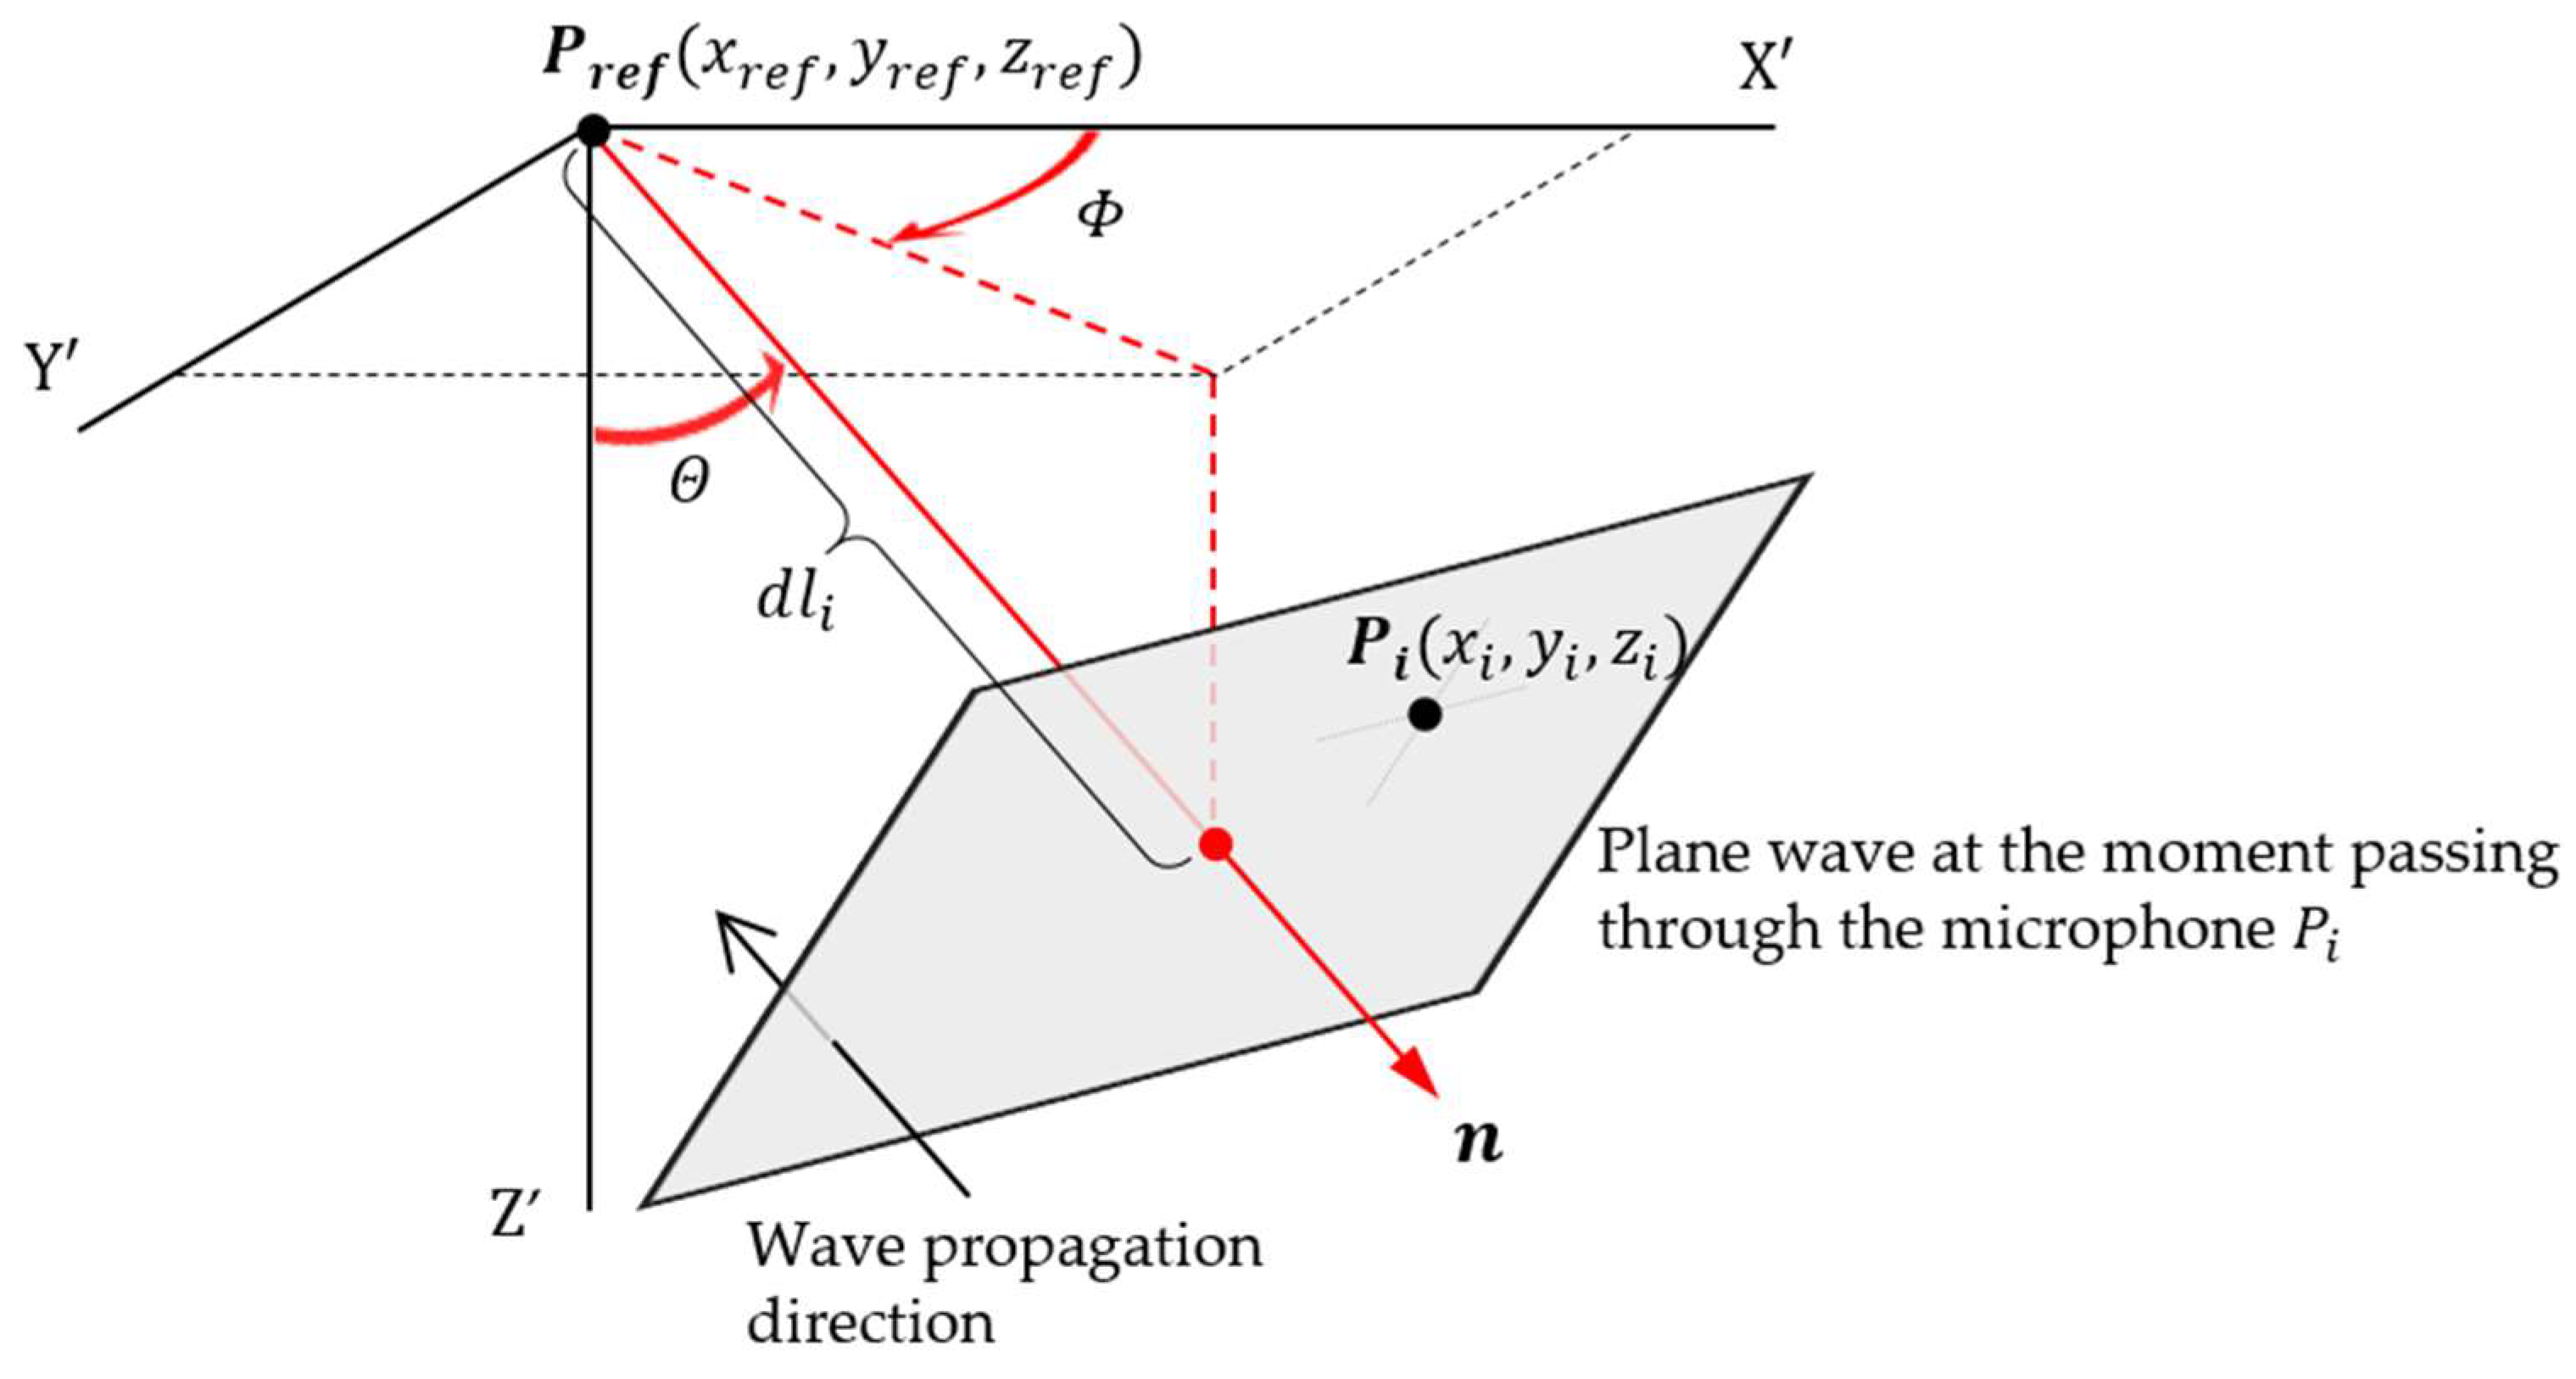
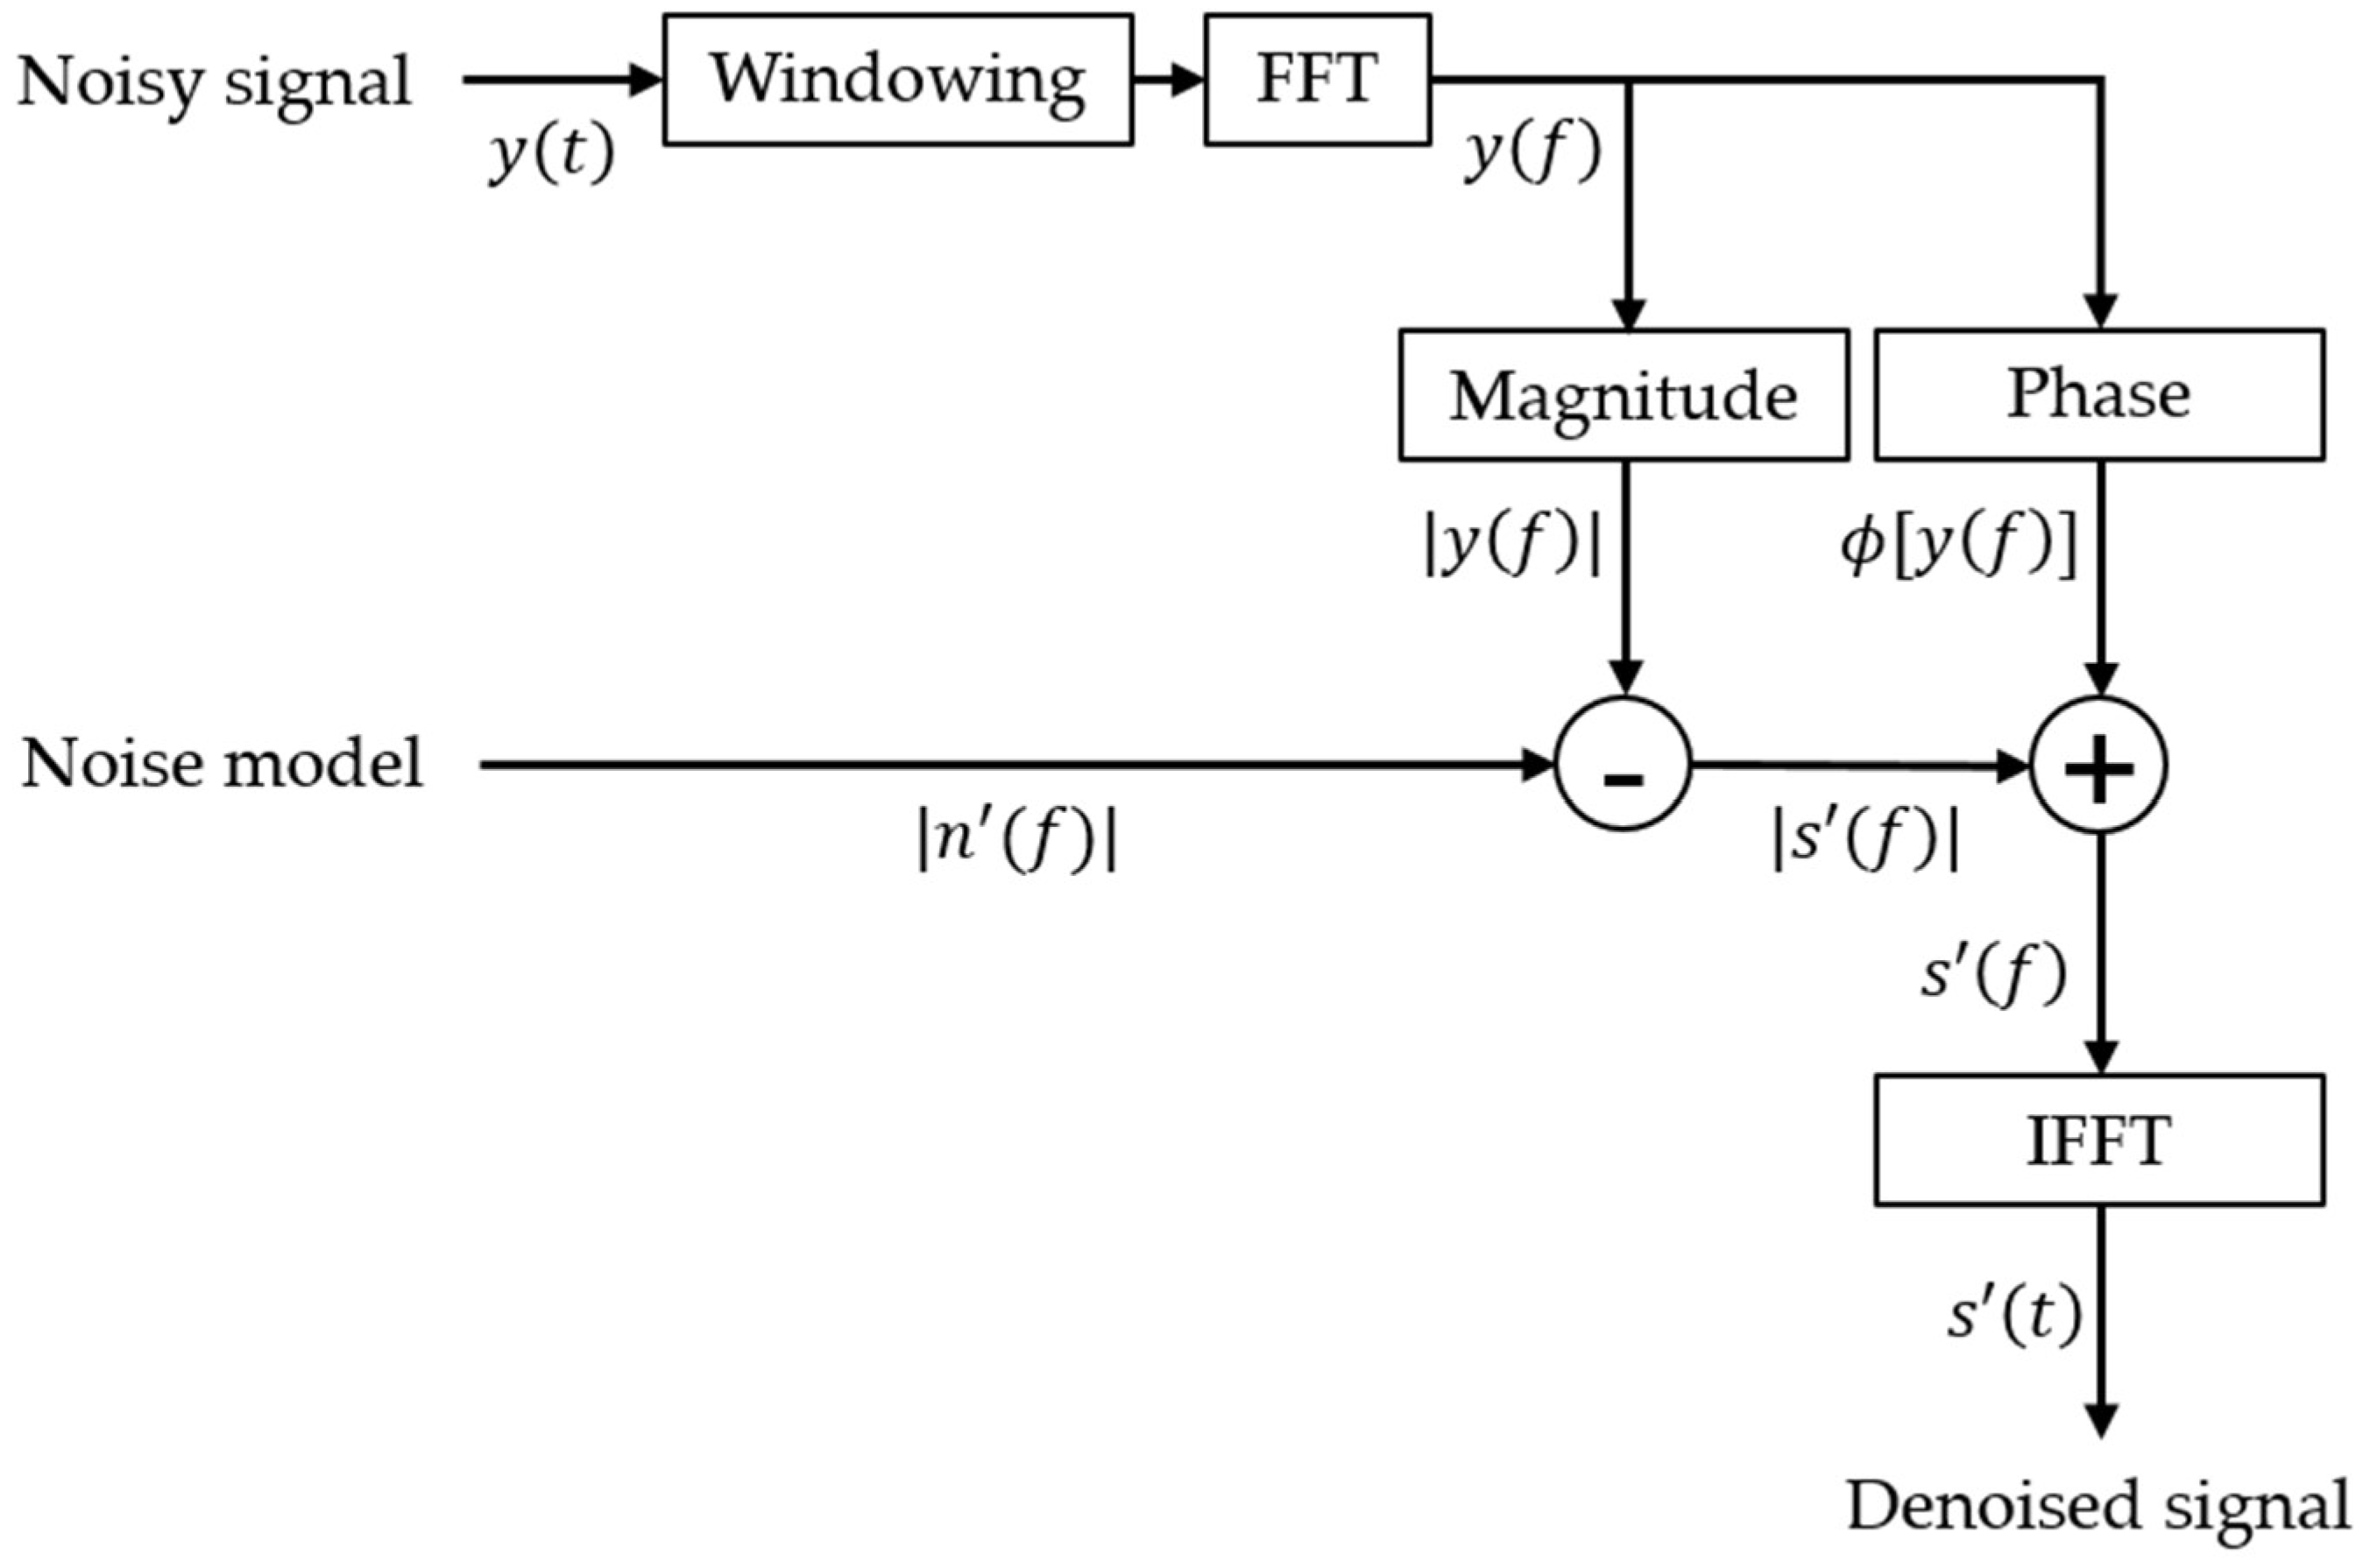
In this study, a method is proposed for detecting sound sources generated above the ground using a drone-mounted phased microphone array. Especially, we tried to effectively remove noise caused by rotors from the microphone signal and to confirm the expectation of the accuracy of the sound source localization in detection mission that occurs during flight. Each of the techniques needed to detect the sound source suggested a major perspective that must be addressed. The goal is to confirm the expected performance of the location detection of sound sources by actually implementing the process of connecting techniques. Since microphones are so close to the drone, the sound of interest is distorted by noise generated when the drone operates, and the spectral subtraction method is used to improve the signal-to-noise ratio. The application of the general spectral subtraction method applies the average model in the entire frequency band. However, in order to effectively remove the drone noise that is an obstacle to us, we separated the spectral band with clear spectral characteristics and applied the subtraction method through different models. The separated bands are divided into bands due to the main appearance of BPF and other noises, including turbulent flow, and are designed to be effective in reducing drone noise.
We distinguished impact sound through spectral subtraction. Spectral reduction has been shown to be effective in restoring acoustic signals of impact sounds. Using this denoised signal, we detected the direction of arrival for ground impact sounds by beamforming methods based on microphone arrays. We applied a method of representing the direction of arrival as absolute coordinates for the ground source, measured on the basis of the microphone array coordinates mounted on a drone, and a data fusion method that can detect the location of sound sources by correcting the changing posture in real time using drone flight information. The entire algorithm for detecting sound sources experimentally identifies detection performance using a 32-channel microphone array. To verify the proposed methods, a clear detection sound source was needed. We focused on identifying the localization error for point sound sources with a clear signal such as impulse. In the verification experiment, the localization performance was confirmed by limiting the impact sound using a firecracker.
In
Section 2, we describe how to detect the location of a ground acoustic source. We describe a spectral reduction method to improve the signal-to-noise ratio for acoustic sources of interest, a beamforming method to estimate the direction of arrival of acoustic sources, and a method to represent the direction of arrival of acoustic sources detected by drones with geographical information above the ground. In
Section 3, we describe the experiments to verify the location detection performance for ground acoustic sources. We describe the microphone array system and experimental environment mounted on a drone. In
Section 4, we address the analysis of data measured through the experiments and the estimation performance of ground acoustic sources.
3. Experiment
Experiments to verify the acoustic source localization performance were conducted in a stadium at Chungnam National University. The experimental environment is shown in
Figure 7, indicating the locations of the acoustic sources, i.e., firecrackers, and where the drone was hovering in place. To quantify the locations of the sources, a line in the soccer stadium was referred to and the absolute location was measured using GPS. The Universal Transverse Mercator Coordinate System (UTM) using the WGS84 ellipsoid was used to derive plane coordinates based on the central position (Location 4) of the soccer stadium. The locations of the acoustic sources on this plane coordinate and the location of the drone are defined as absolute coordinates, and the results of estimating the location of the acoustic source based on the drone’s GPS information can also be expressed.
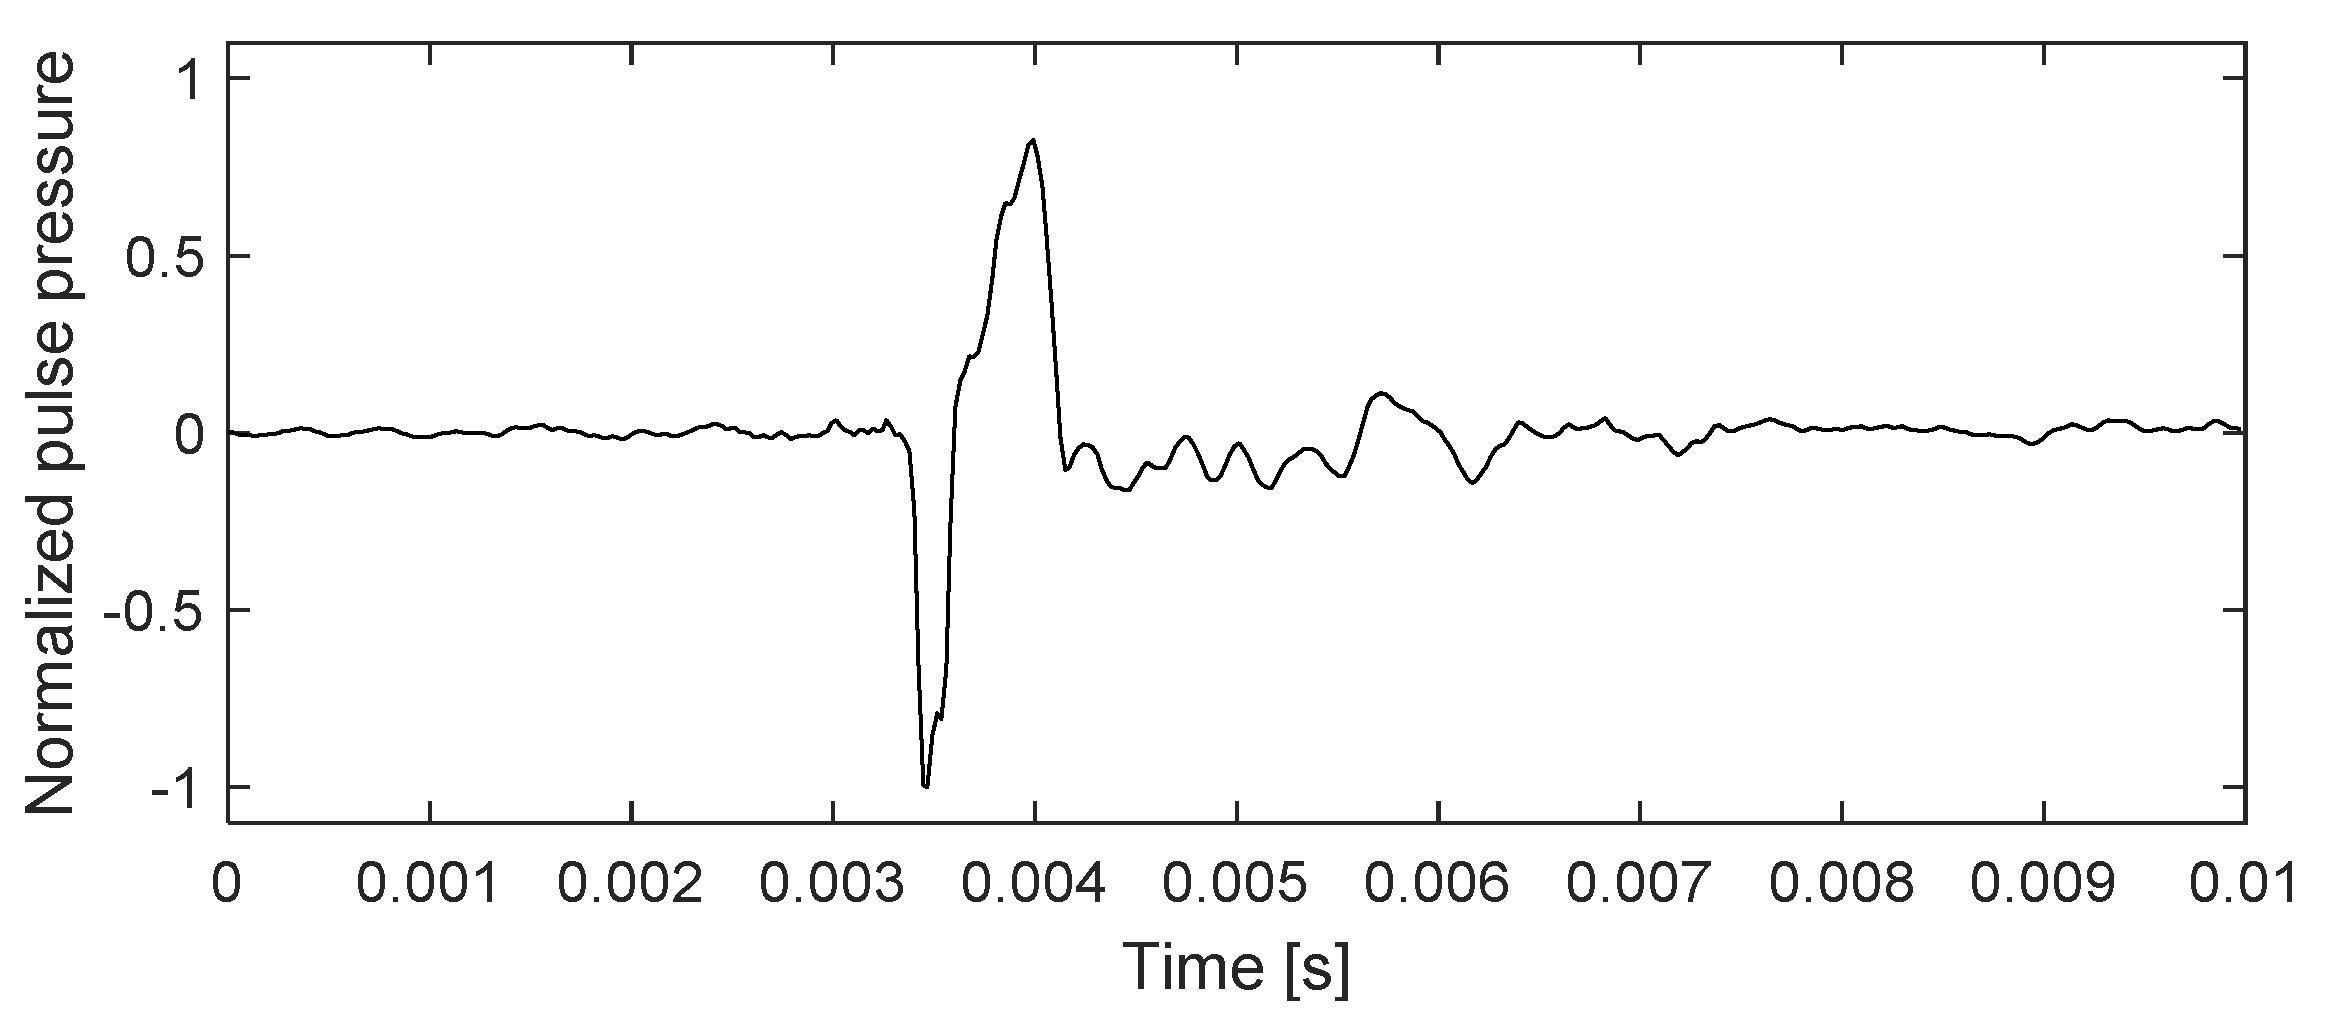
The acoustic sources used for the experiment were commercial firecrackers, which use gunpowder to generate short impulse signals after a certain period of time when ignited. The acoustic pressure signal from the explosion of the firecracker used in the experiment is shown in
Figure 8. This signal was collected separately without a drone and measured at a distance of about 20 m away from the location of the firecracker near the center of
Figure 6. That is, the signal was completely unrelated to the operation of the drone and was intended to observe pure acoustic signal features. Strong impulse signals, such as explosions, are easy to distinguish in domains because of their strong amplitude and clear features. In the practical problem of finding acoustic sources, impulses are only one example of the detection targets, but they are important underlying experiments in the goal of assessing the detection performance that this study wants to identify. Additionally, it is possible to identify whether spectral subtraction methods work well for a specific frequency or frequency band that wants to denoise. The impulse signal has the constant response characteristic across all frequencies. In order to restore the energy of pure impulse signals as much as possible in a state of noise mixing, it is important to subtract only a specific frequency for the noise to be removed. The impulse is one of the useful targets for providing basic clues to determine the acoustic frequency of the drone to be removed. It was confirmed that the explosion signal was characterized by a short and strong shock sound in an instant. The firecrackers were fixed just above the ground. The location estimation results analyzed in the Results section were performed for approximately 20 min during 1 sortie flight. The firecrackers were detonated three times at each point in the order of location numbers from L1 to L6. The interval between each three repeated explosions was about 10 s. A straight line from the hovering position to the detonating location is described in
Table 1, up to 151.5 m. During this flight, the drone maintained a hovering position at an altitude of about 150 m. The drone’s position was near the right-hand corner north of the soccer stadium, heading southwards, and it maintained a stable hovering position due to the stabilizer mode.
4. Results and Discussion
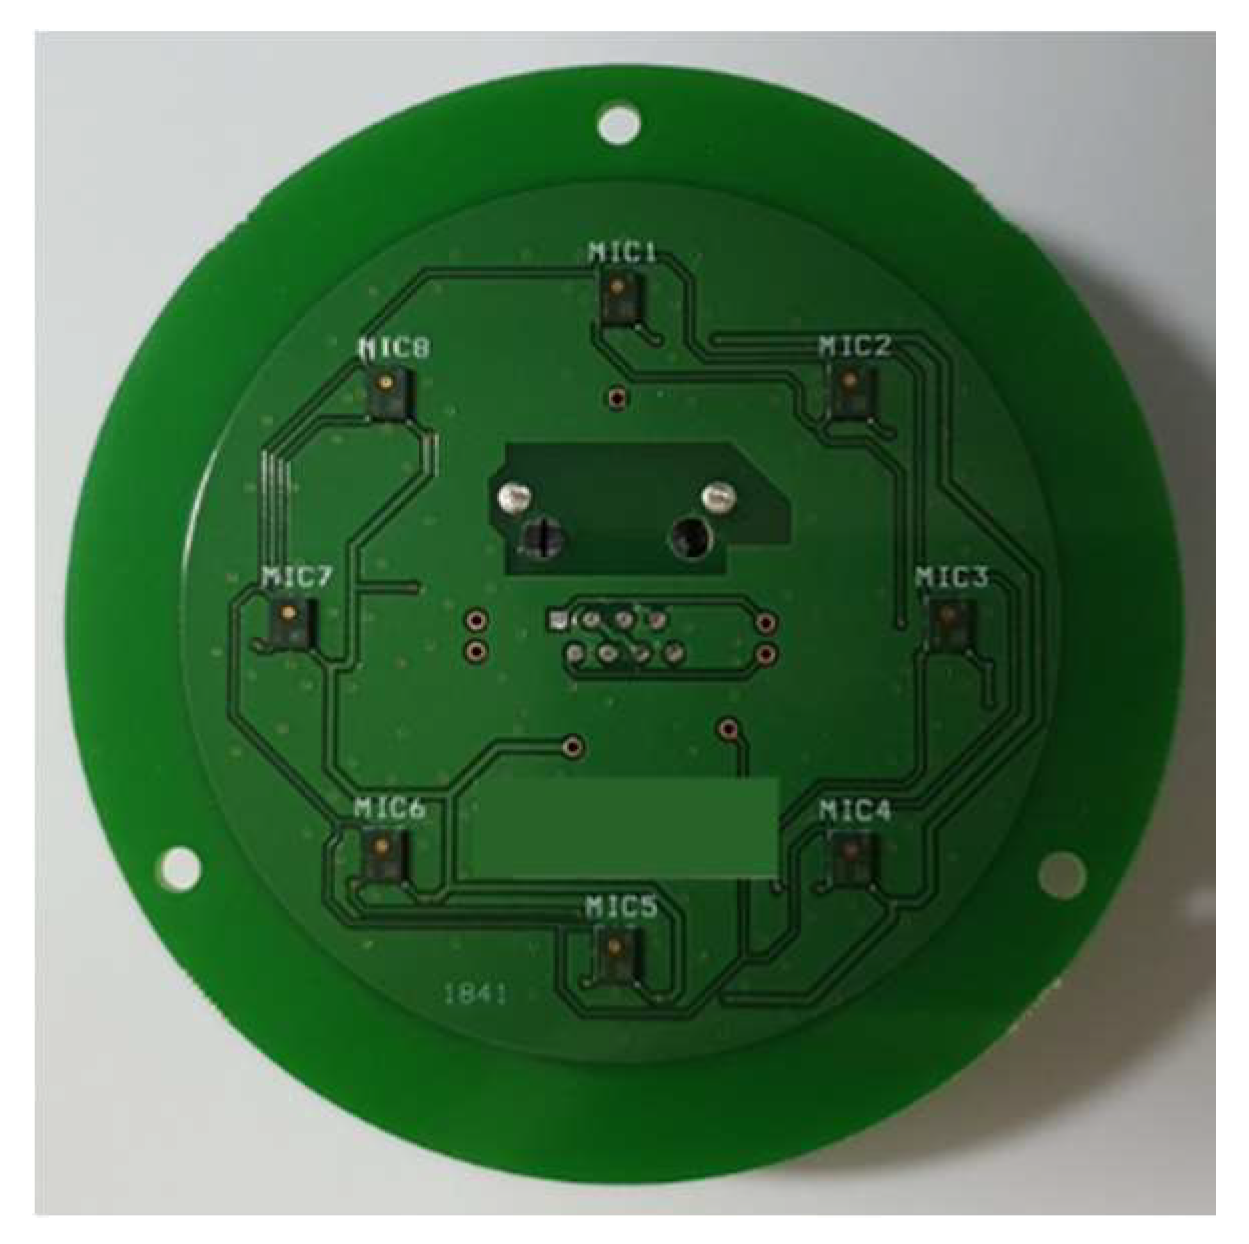
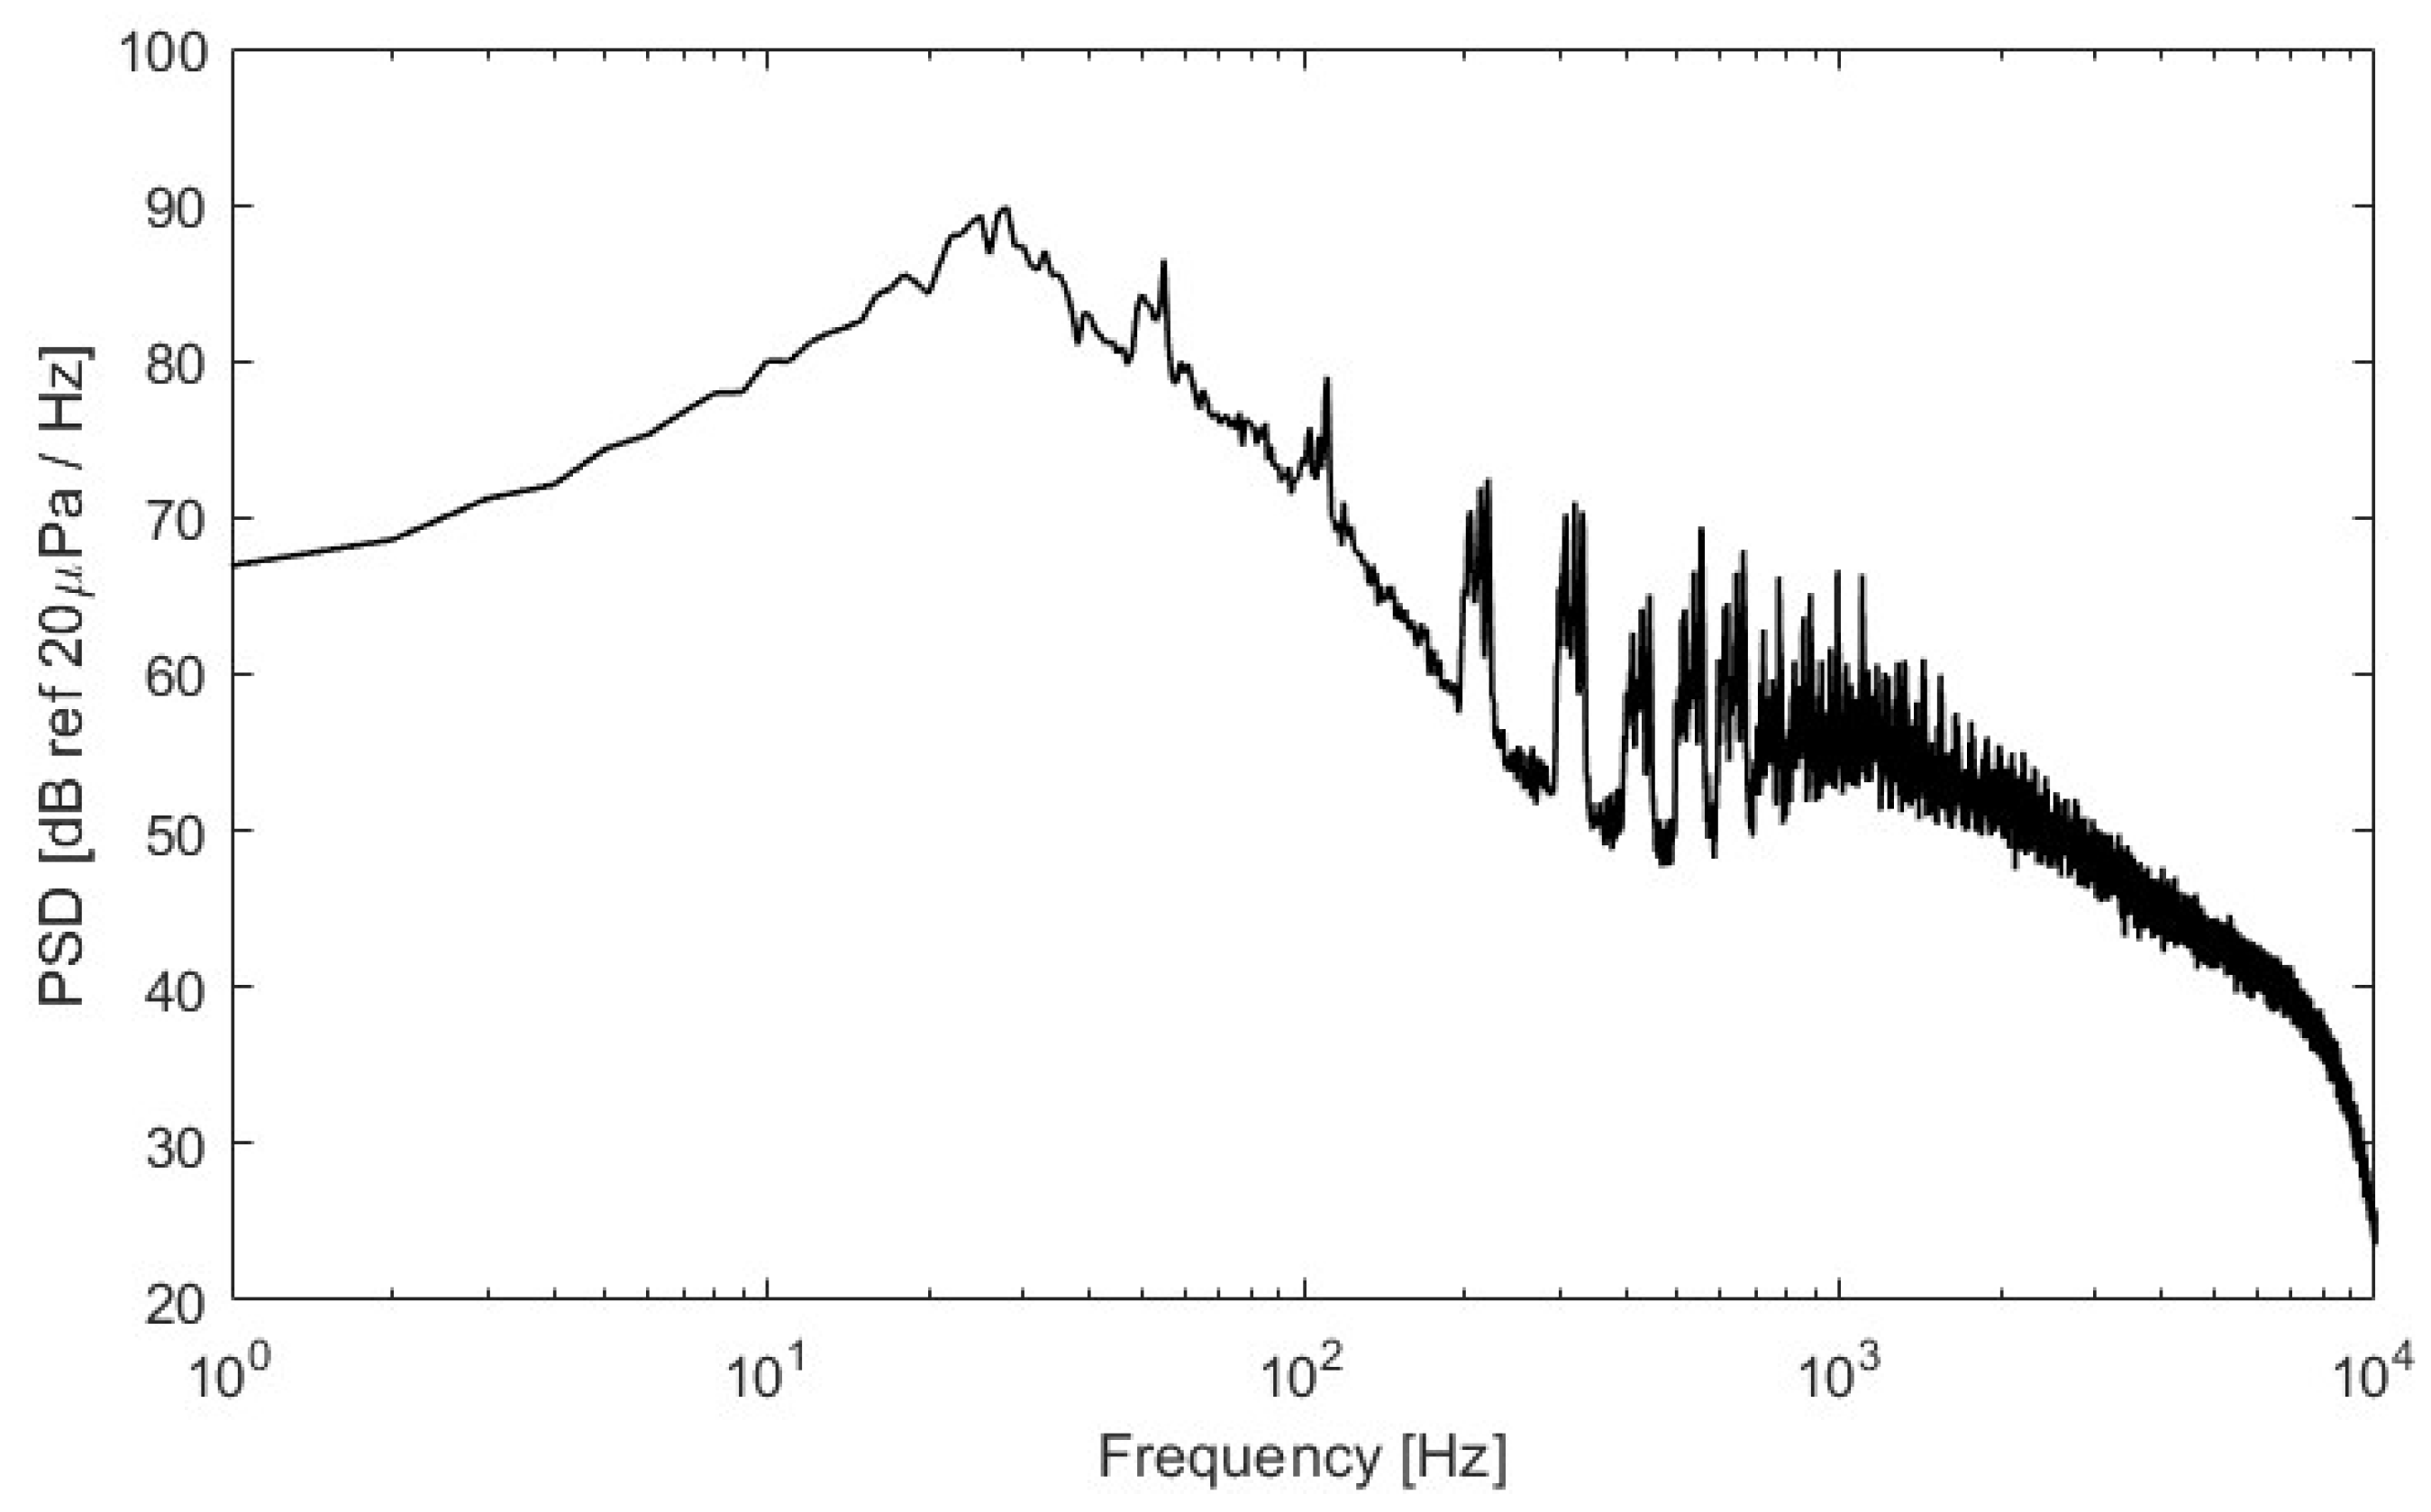
Figure 9 shows the acoustic pressure signals measured by the drone-mounted microphone system, in a hovering position. It is a spectrum that averages acoustic pressure signals measured over 3 s using a total of 32 microphones. The frequency decomposition was 1 Hz, and a 5 Hz high pass filter was applied. This spectrum is meaningful for identifying noise characteristics that actually operate underneath the drone. Noise can be observed together with atmospheric flow and background noise present in the atmosphere when the actual drone is maneuvering. In particular, it is a very poor measurement environment in which fluctuating pressure caused by the propellers’ wakes at the bottom of the drone directly affects the microphones. Analysis of the mean spectrum is the basis for determining the frequency bands and amplitude that are necessary to determine the noise generated by drones when flying, and that should be deducted when applying spectral subtraction.
The drone operates with six rotors, each with two blades. The average motor rotation at hovering was about 3000 rpm. In order to maintain the drone’s position during hovering, the number of motor rotations changed by about 200 rpm. Changes in motor rotation are directly related to the blade passing frequency and affect the harmonic components that appear as tonal component features. In the average spectrum, six motors remained hovering for three seconds, outputting slightly different rotations, resulting in peak frequencies scattered for each harmonic. Accurately predicting the blade passing frequency and its amplitude should be able to measure each motor’s rotation speed and rotation phase, as it is efficient to match the same number of rotations in each motor from the point of view of drone control.
With respect to the average motor rotation speed, the shaft rate frequency characteristic was shown at about 50 Hz, the first harmonic of blade passing frequency at 100 Hz, and harmonic frequencies for its multiples were observed. Harmonics are observed for rotational frequencies up to 2 kHz, and the tonal frequencies shown here were caused by propellers and motors. Broadband noise above 800 Hz is characterized by turbulence around the propellers. Strong broadband components were observed in bands below 200 Hz. It was observed that this frequency band was mainly caused by atmospheric flow and propeller wake at fluctuating pressures that directly affected the microphones, resulting in high amplitude.
Spectral reduction methods were treated differently for each of the three frequency band intervals in the frequency domain. The first band is the low frequency band below 200 Hz, mainly affected by atmospheric flow and rotor wake. Here, the fluctuating pressure components caused by the flow around the microphones have the greatest effect on the acoustic pressure of the entire frequency characteristics. In the signal we were trying to detect, this band was completely eliminated because it contributed less and was generally associated with high noise amplitude. The second band is from 200 to 1000 Hz, which features the blade passing frequency of the rotor. Blade passing frequency is directly affected by rotor rotation speed, as shown in
Figure 9. Since six rotors were operating at different rotations for maneuvering during flight, peak frequencies continued to change over time even in hover flight. Since this peak frequency is difficult to detect accurately in real time, the excess of amplitude as compared with the spectral reduction model was deducted in the same amount as the model. The third band is over 1000 Hz, containing motor noise, which makes it difficult to specify the frequency characteristics of this section. As the processing method is not clear, we simply subtracted the amount of amplitude the subtraction model had from the measured amplitude. The subtraction of amplitude is calculated for each frequency in the spectrum and is in Pascal units, not dB scales. The analysis of impulse sources requires short-time spectral analysis to process signals in real time. Short-time spectral analysis does not show a clear spectrum curve as compared with the averaged spectrum. Small peak amplitudes were removed through the spectrum smoothing filter to derive amplitude envelope similar to the mean properties and applied as a subtraction model. For the subtraction model, the negative pressure data used signals from the negative pressure signal window of interest, which took into account real-time processing. The signals for the subtraction model were used one second before the window frame of the acoustic pressure signal of interest, considering real-time processing. The frequency and acoustic pressure level models to be subtracted calculate the spectrum of acoustic pressure data measured one second in advance from real-time measured pressure signals and derive the mean characteristics through a smoothing filter. It was not appropriate to use a model to deduct long-time averaged signals because the impact of the number of propeller rotations and wake changed rapidly as the drone was maneuvered.
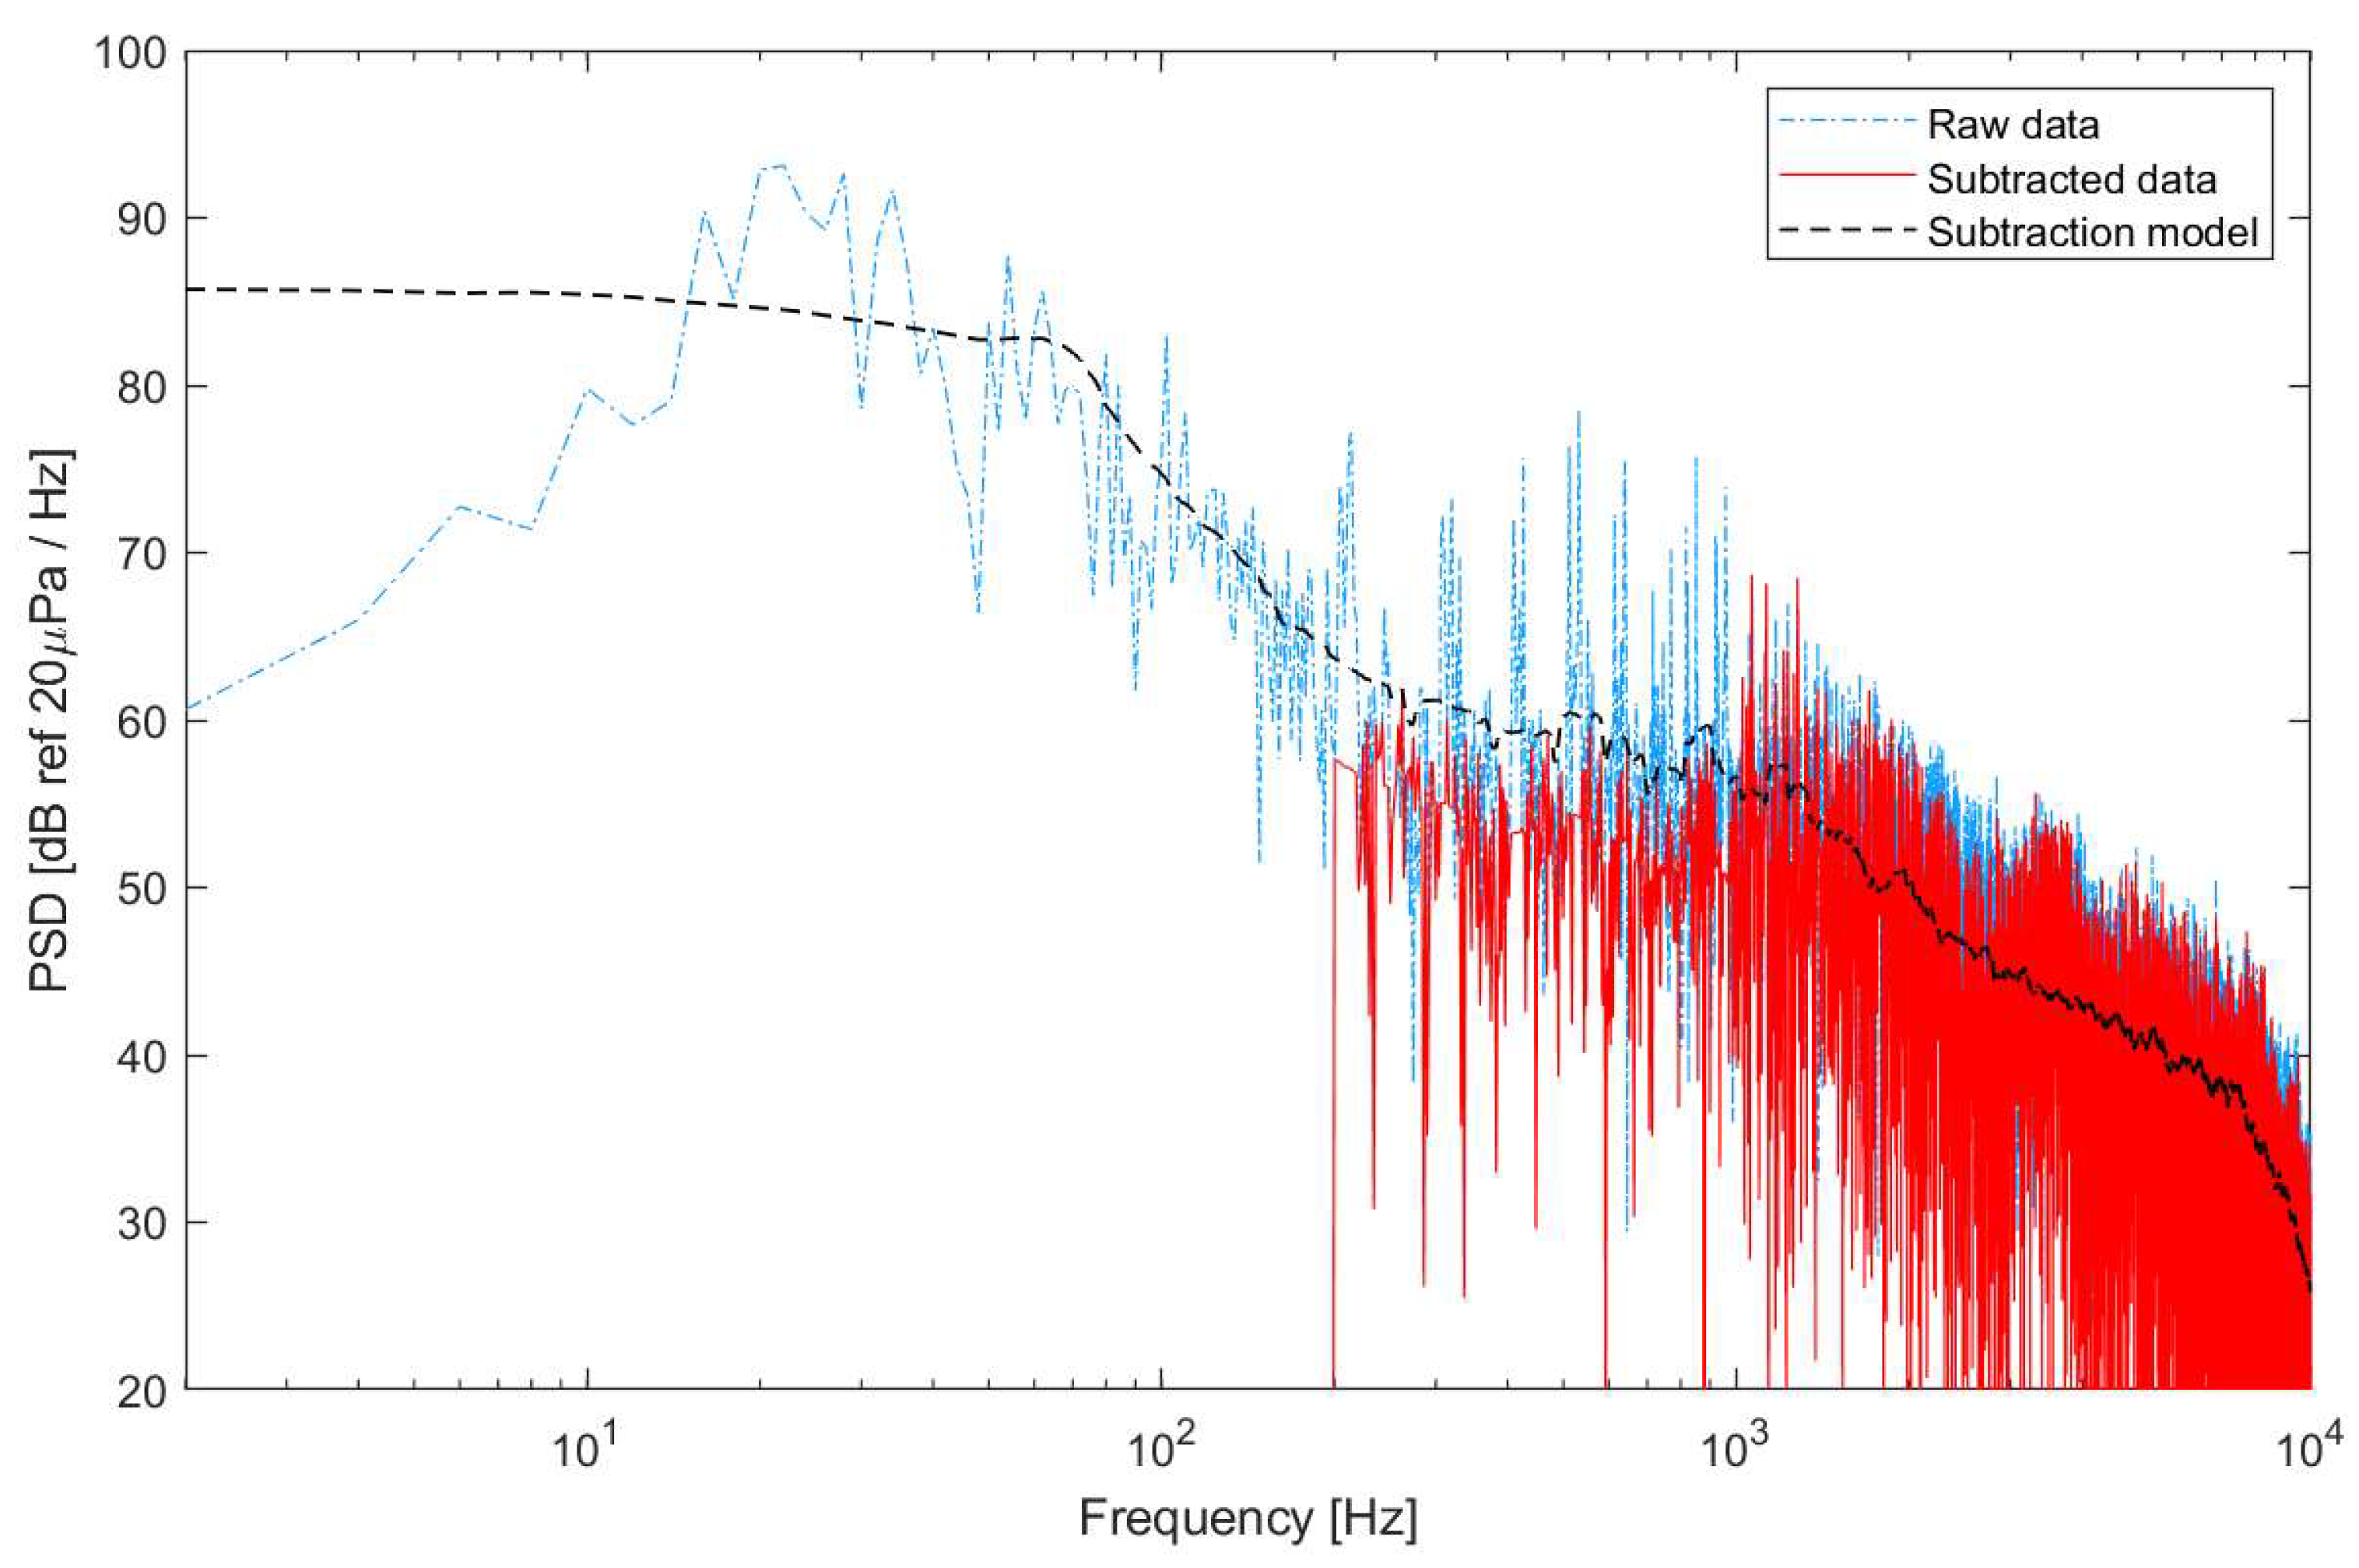
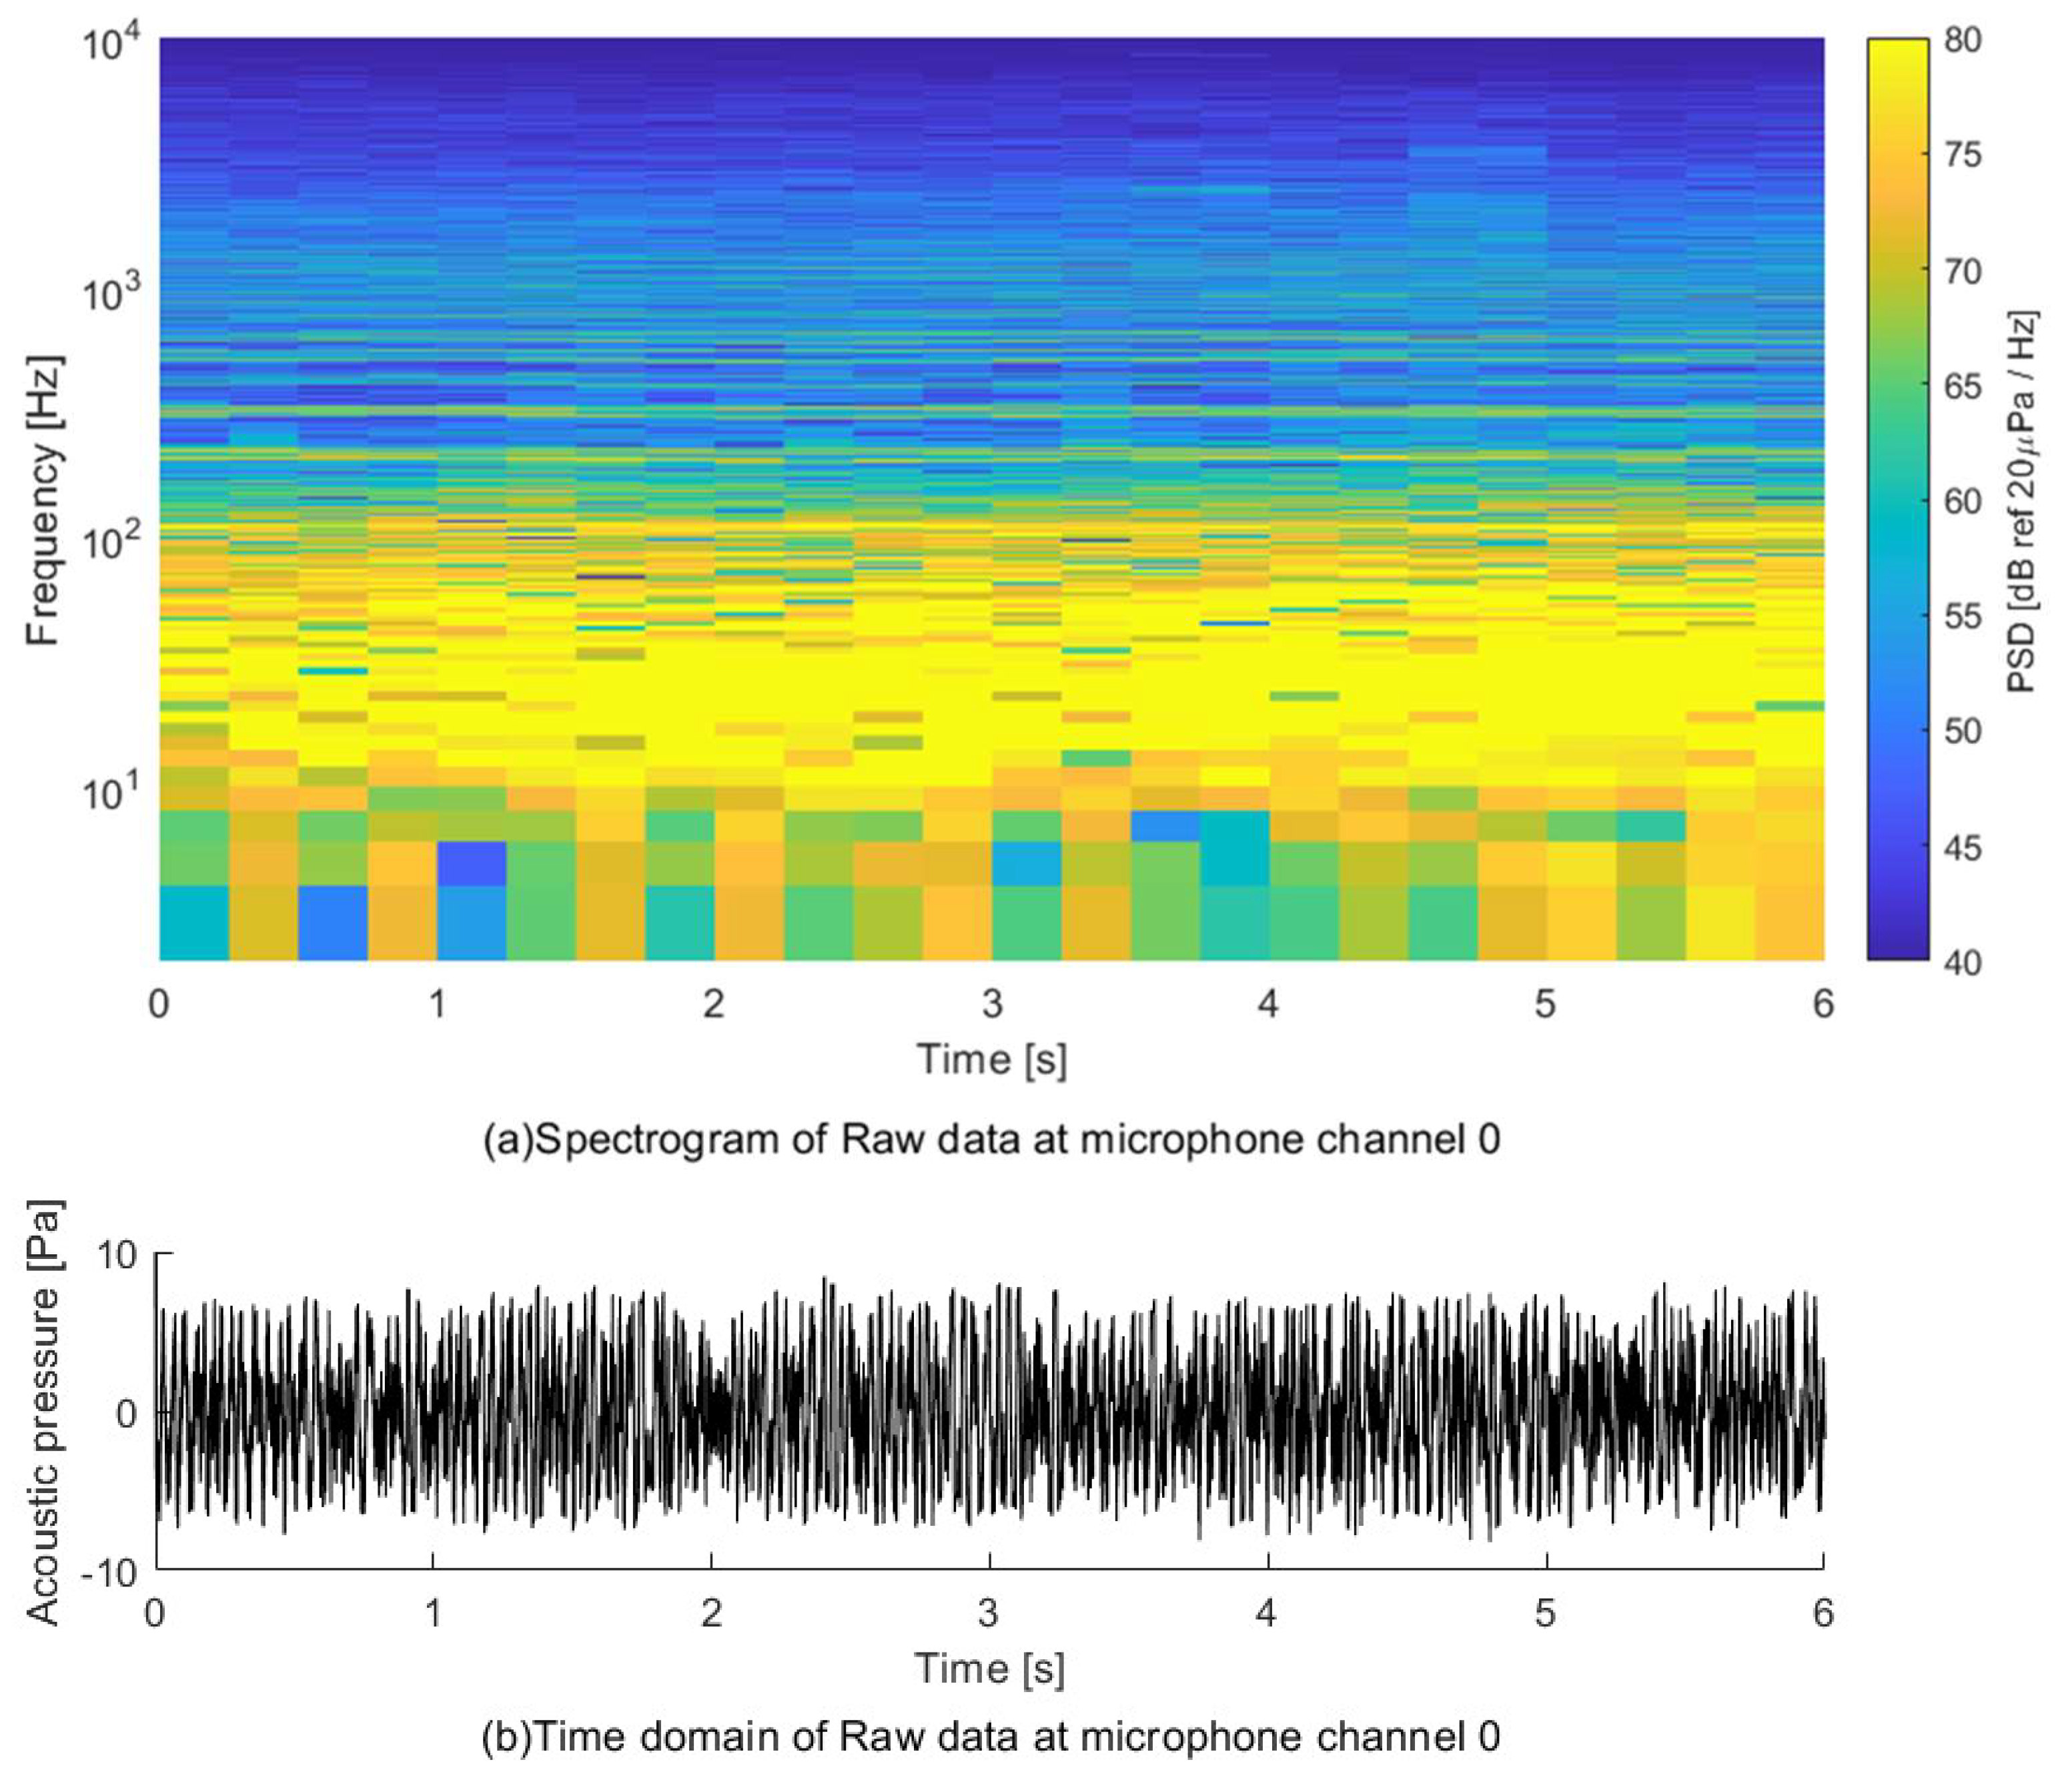
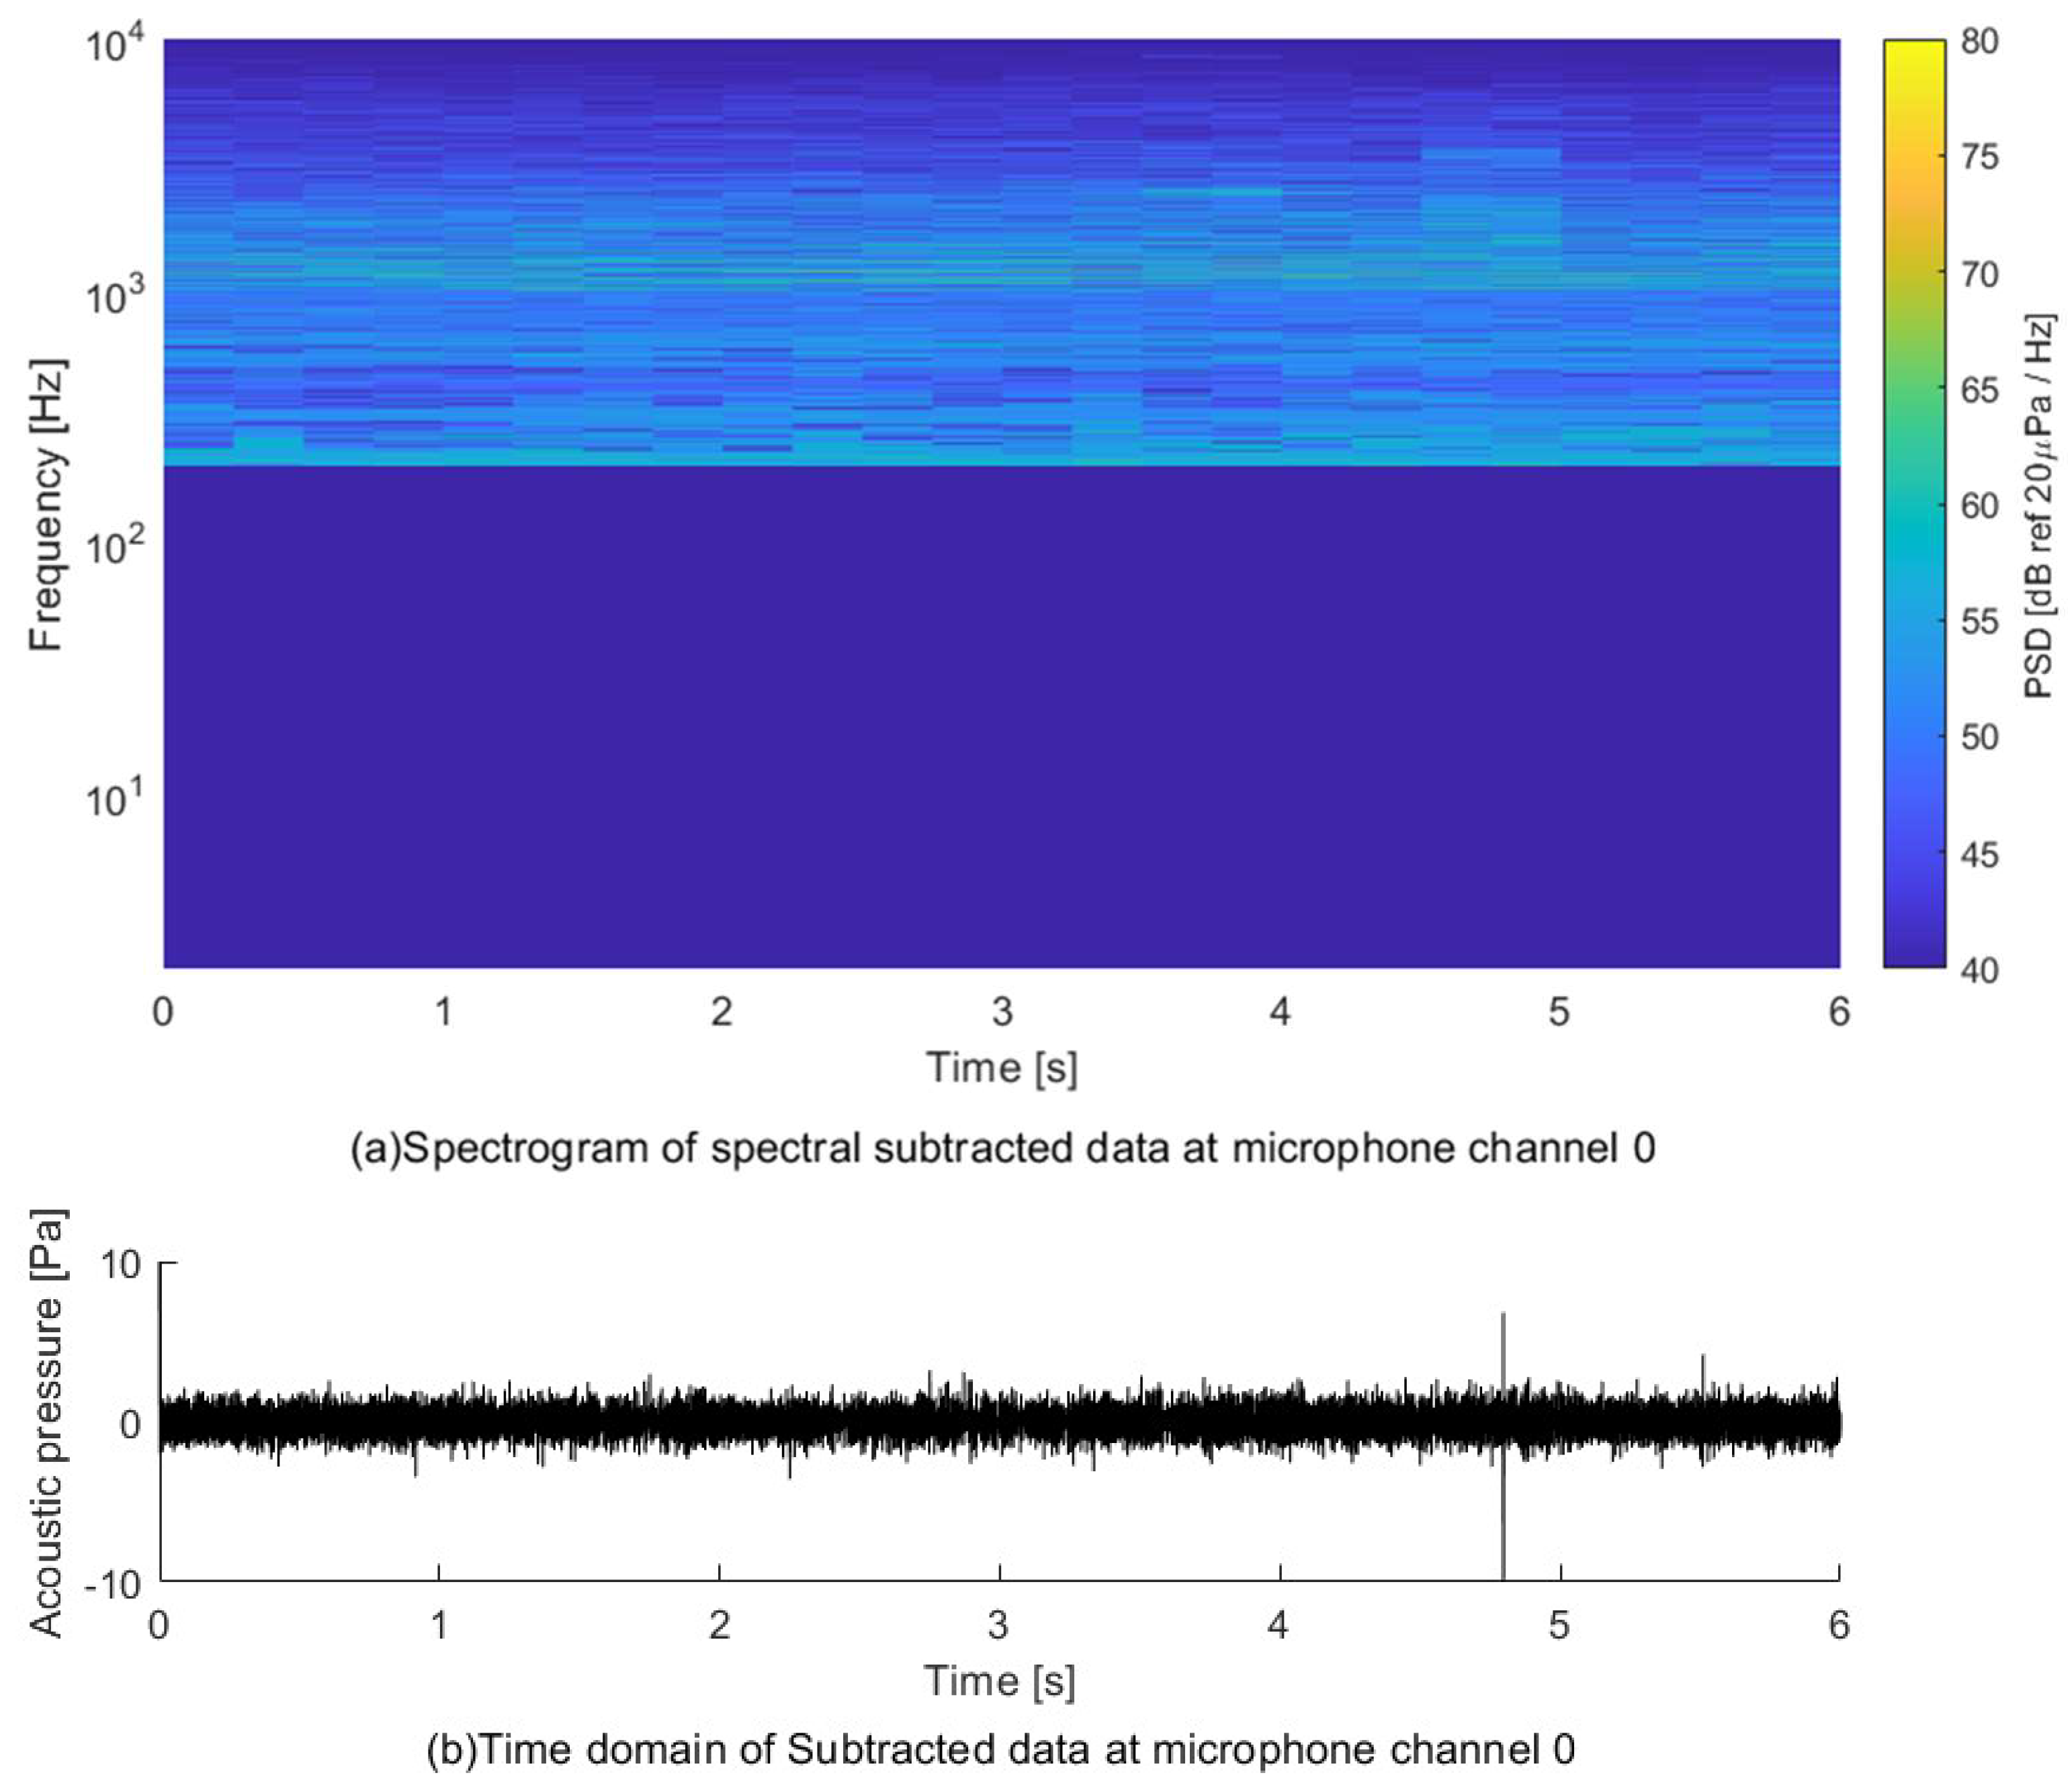
Figure 10 and
Figure 11 show the data that indicate before and after the application of the spectral subtraction method and are measured on microphone Channel 0 for the first of three explosions at Location 1. Explosive sounds represent strong impulse signal characteristics, and the ideal impulse signal has a flat amplitude in the whole band in the frequency domain. The explosive sound of a firecracker affects amplitude over the entire band of frequencies because it produces impulse waves due to rapid pressure changes. Therefore, in order to effectively preserve the amplitude of the impulse signal, spectral subtraction must be performed with the correct focus on the noise frequency.
Figure 11 shows the result of applying spectral subtraction to extract frequencies for explosives. By comparing the spectra, it can be observed that the low frequency band below 200 Hz has been eliminated and that the strong tonal component between 100 and 1000 Hz has been reduced. The 32-channel signal, which passed the spectral reduction method for each channel, was restored back to the time domain signal by a 0.5 s, 50% overlap window function. This process made it possible to specify the time the impulse signal and the time the signal occurred in the time domain data.
The results of spectral subtraction on the impulse signals of firecrackers can be observed more clearly in
Figure 12. We compared the subtraction model obtained through the smoothing filter, the measured signal, and the spectrum after applying the subtraction method. Different subtractions can be distinguished in bands below 200 Hz, between 200 Hz and 1000 Hz, and above 1000 Hz. From this setting, we were able to effectively extract the acoustic pressure of the impulse signal of the firecracker. Defining frequency band discrimination was empirically distinguished here by already measured drone acoustic data, but in the future, it is considered that automatic detection will be possible if the blade passing frequency is detected through the peak finder of the spectrum or if a learned real-time adaptive discrimination filter is used. In addition, the process of spectral subtraction applied in this study can be applied to clarify other acoustic sound sources such as voices. However, this study only confirmed the analysis of the impulse signal and it is necessary to verify the performance of other sounds separately. The spectral subtraction method, implemented separately for each frequency band, was used to eliminate frequencies affected by the drone’s own noise and found to be effective in enhancing the signal-to-noise ratio of acoustic pressure. Especially, it is effective in situations where it is difficult to accurately estimate the harmonic components of blade passing frequency that constantly change during flight. However, if a tonal sound source such as a whistle is detected in a band with a smoothing filter to remove the harmonics of blade passing frequency, it may be considered as blade passing frequency, which may cause a decrease in the signal-to-noise ratio. If this situation is to be detected, it is necessary to consider other ways to only subtract blade passing frequencies.
Time-domain signals with improved signal-to-noise ratio by spectral subtraction methods become input signals that calculate beam power for detecting arrival angles.
Although the beamforming method has the effect of improving the signal-to-noise ratio according to the correlation by phase difference calibration, it is difficult to detect target acoustic sources due to reduced beamforming performance if there is a strong correlation in the proximity field, such as propeller noise.
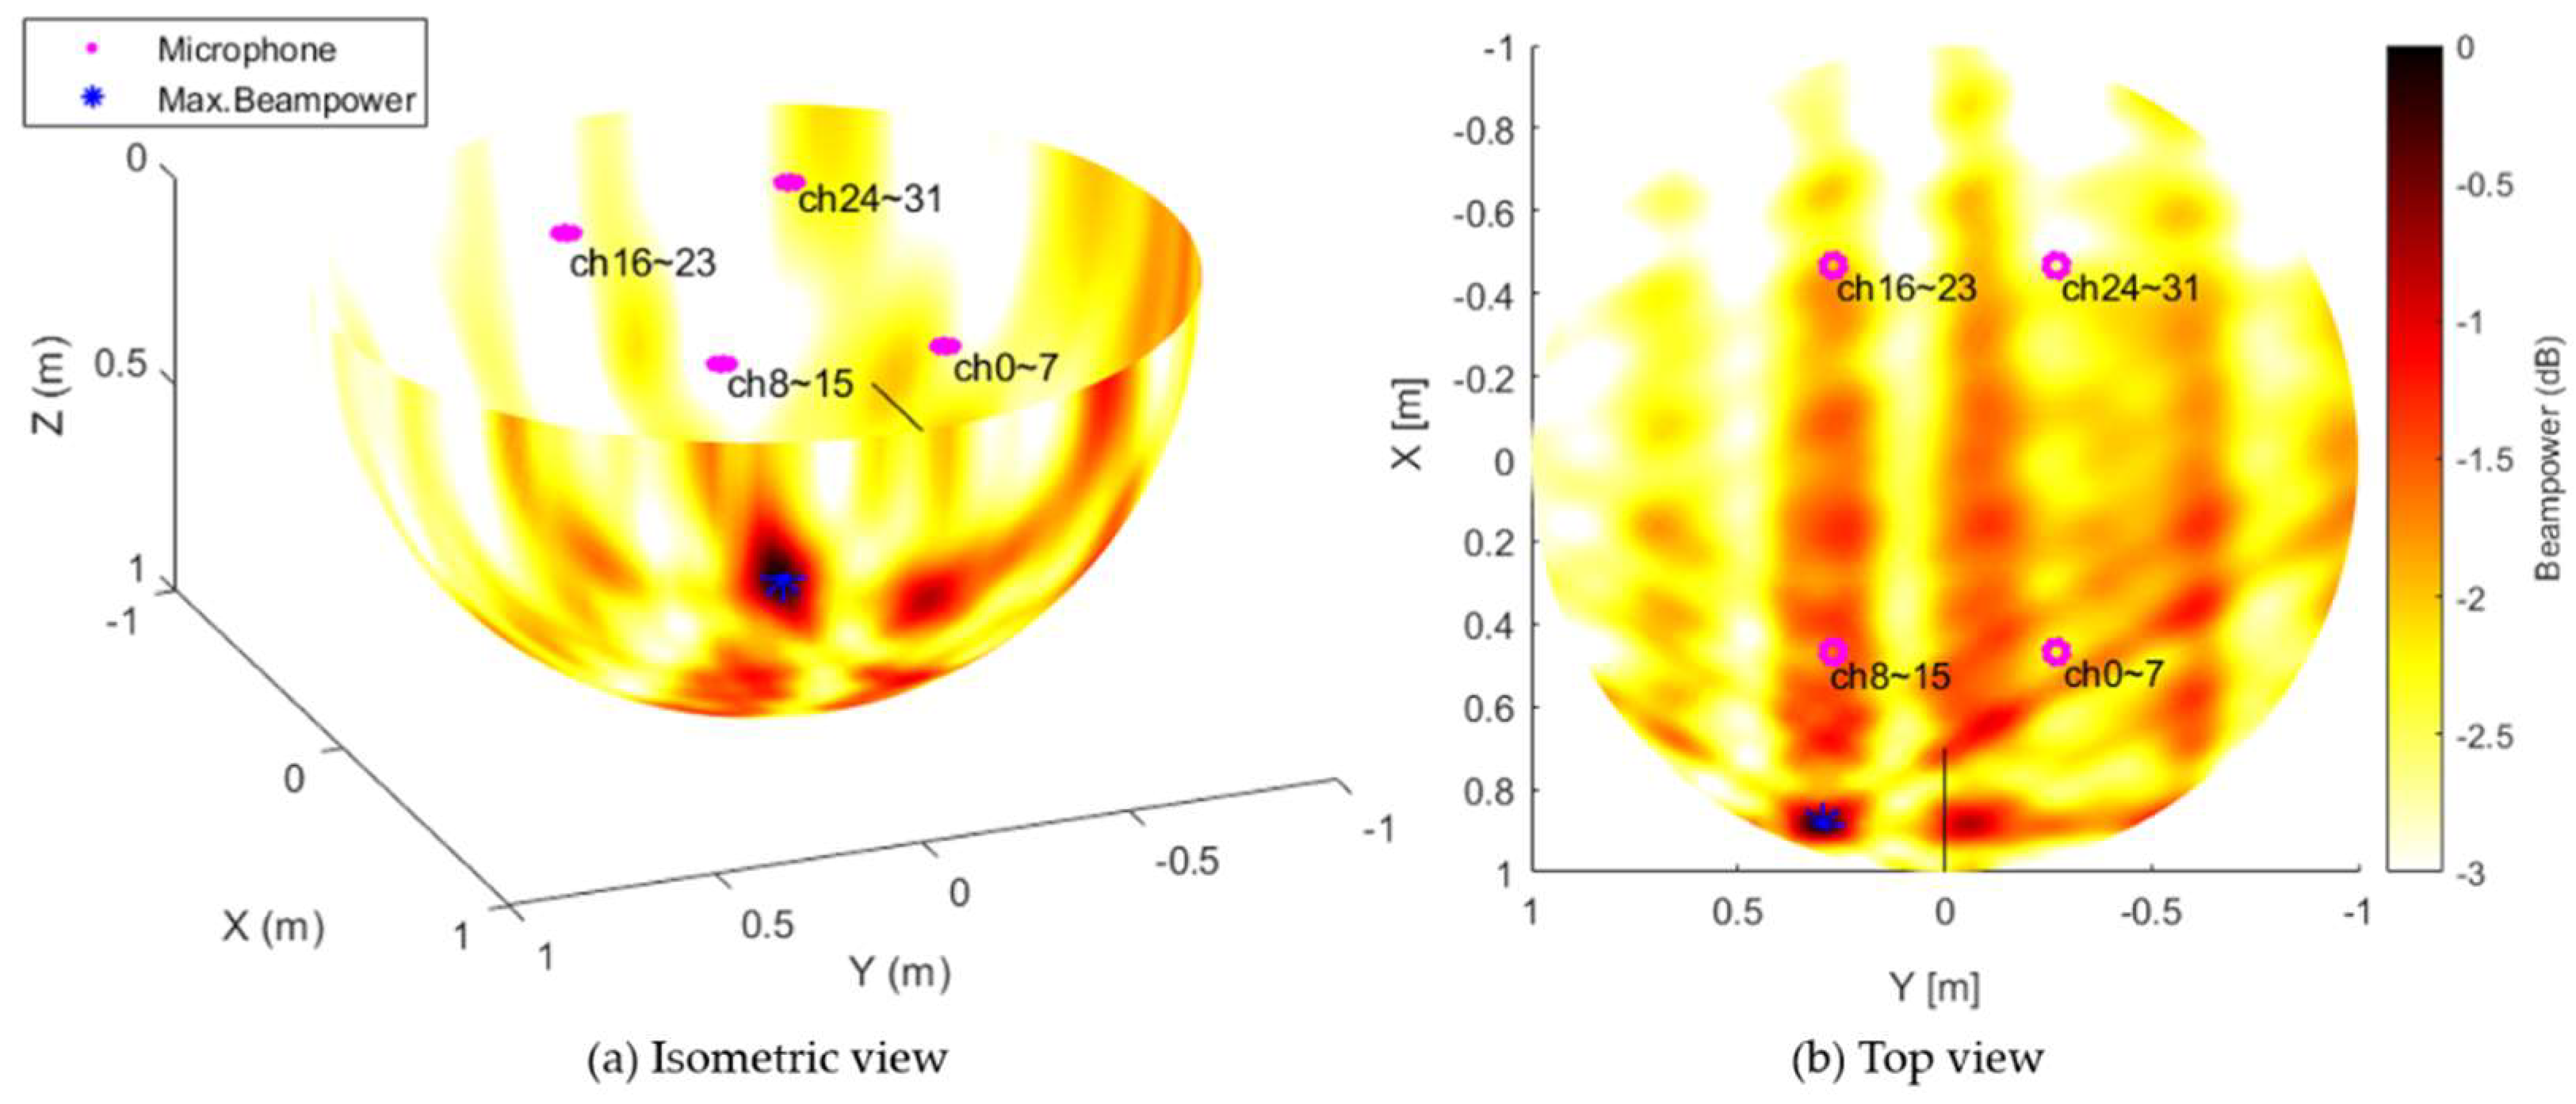
Figure 13 shows the beam power calculated using signals measured from 32 microphones mounted on the drone. The beam power represents the magnitude relative to the lower directions of the drone based on the center point of the drone.
In general, −3 dB is judged as the effective range as compared with the calculated maximum beam power. Since the 32-channel microphone array used in this study was not considered to be optimized for beamforming methods, sidelobes were also prominent, but we found that the direction of arrival calculated with maximum beam power was the direction of arrival for the actual acoustic source. Beamforming methods are also computable in frequency domains, where signals that are characterized across broadband, such as impulse signals, are useful for finding features that are calculated in the time domain. Improving beam power performance requires the optimization of the number of available microphones, the maximum implementable aperture size, and the microphone spacing that matches the frequency characteristics of the target acoustic source. Generally, the greater the number of microphones and the larger the aperture size, the better the performance tends to be, but additional consideration is needed to minimize the operation and acoustic measurement interference of drones to be mounted on drones.
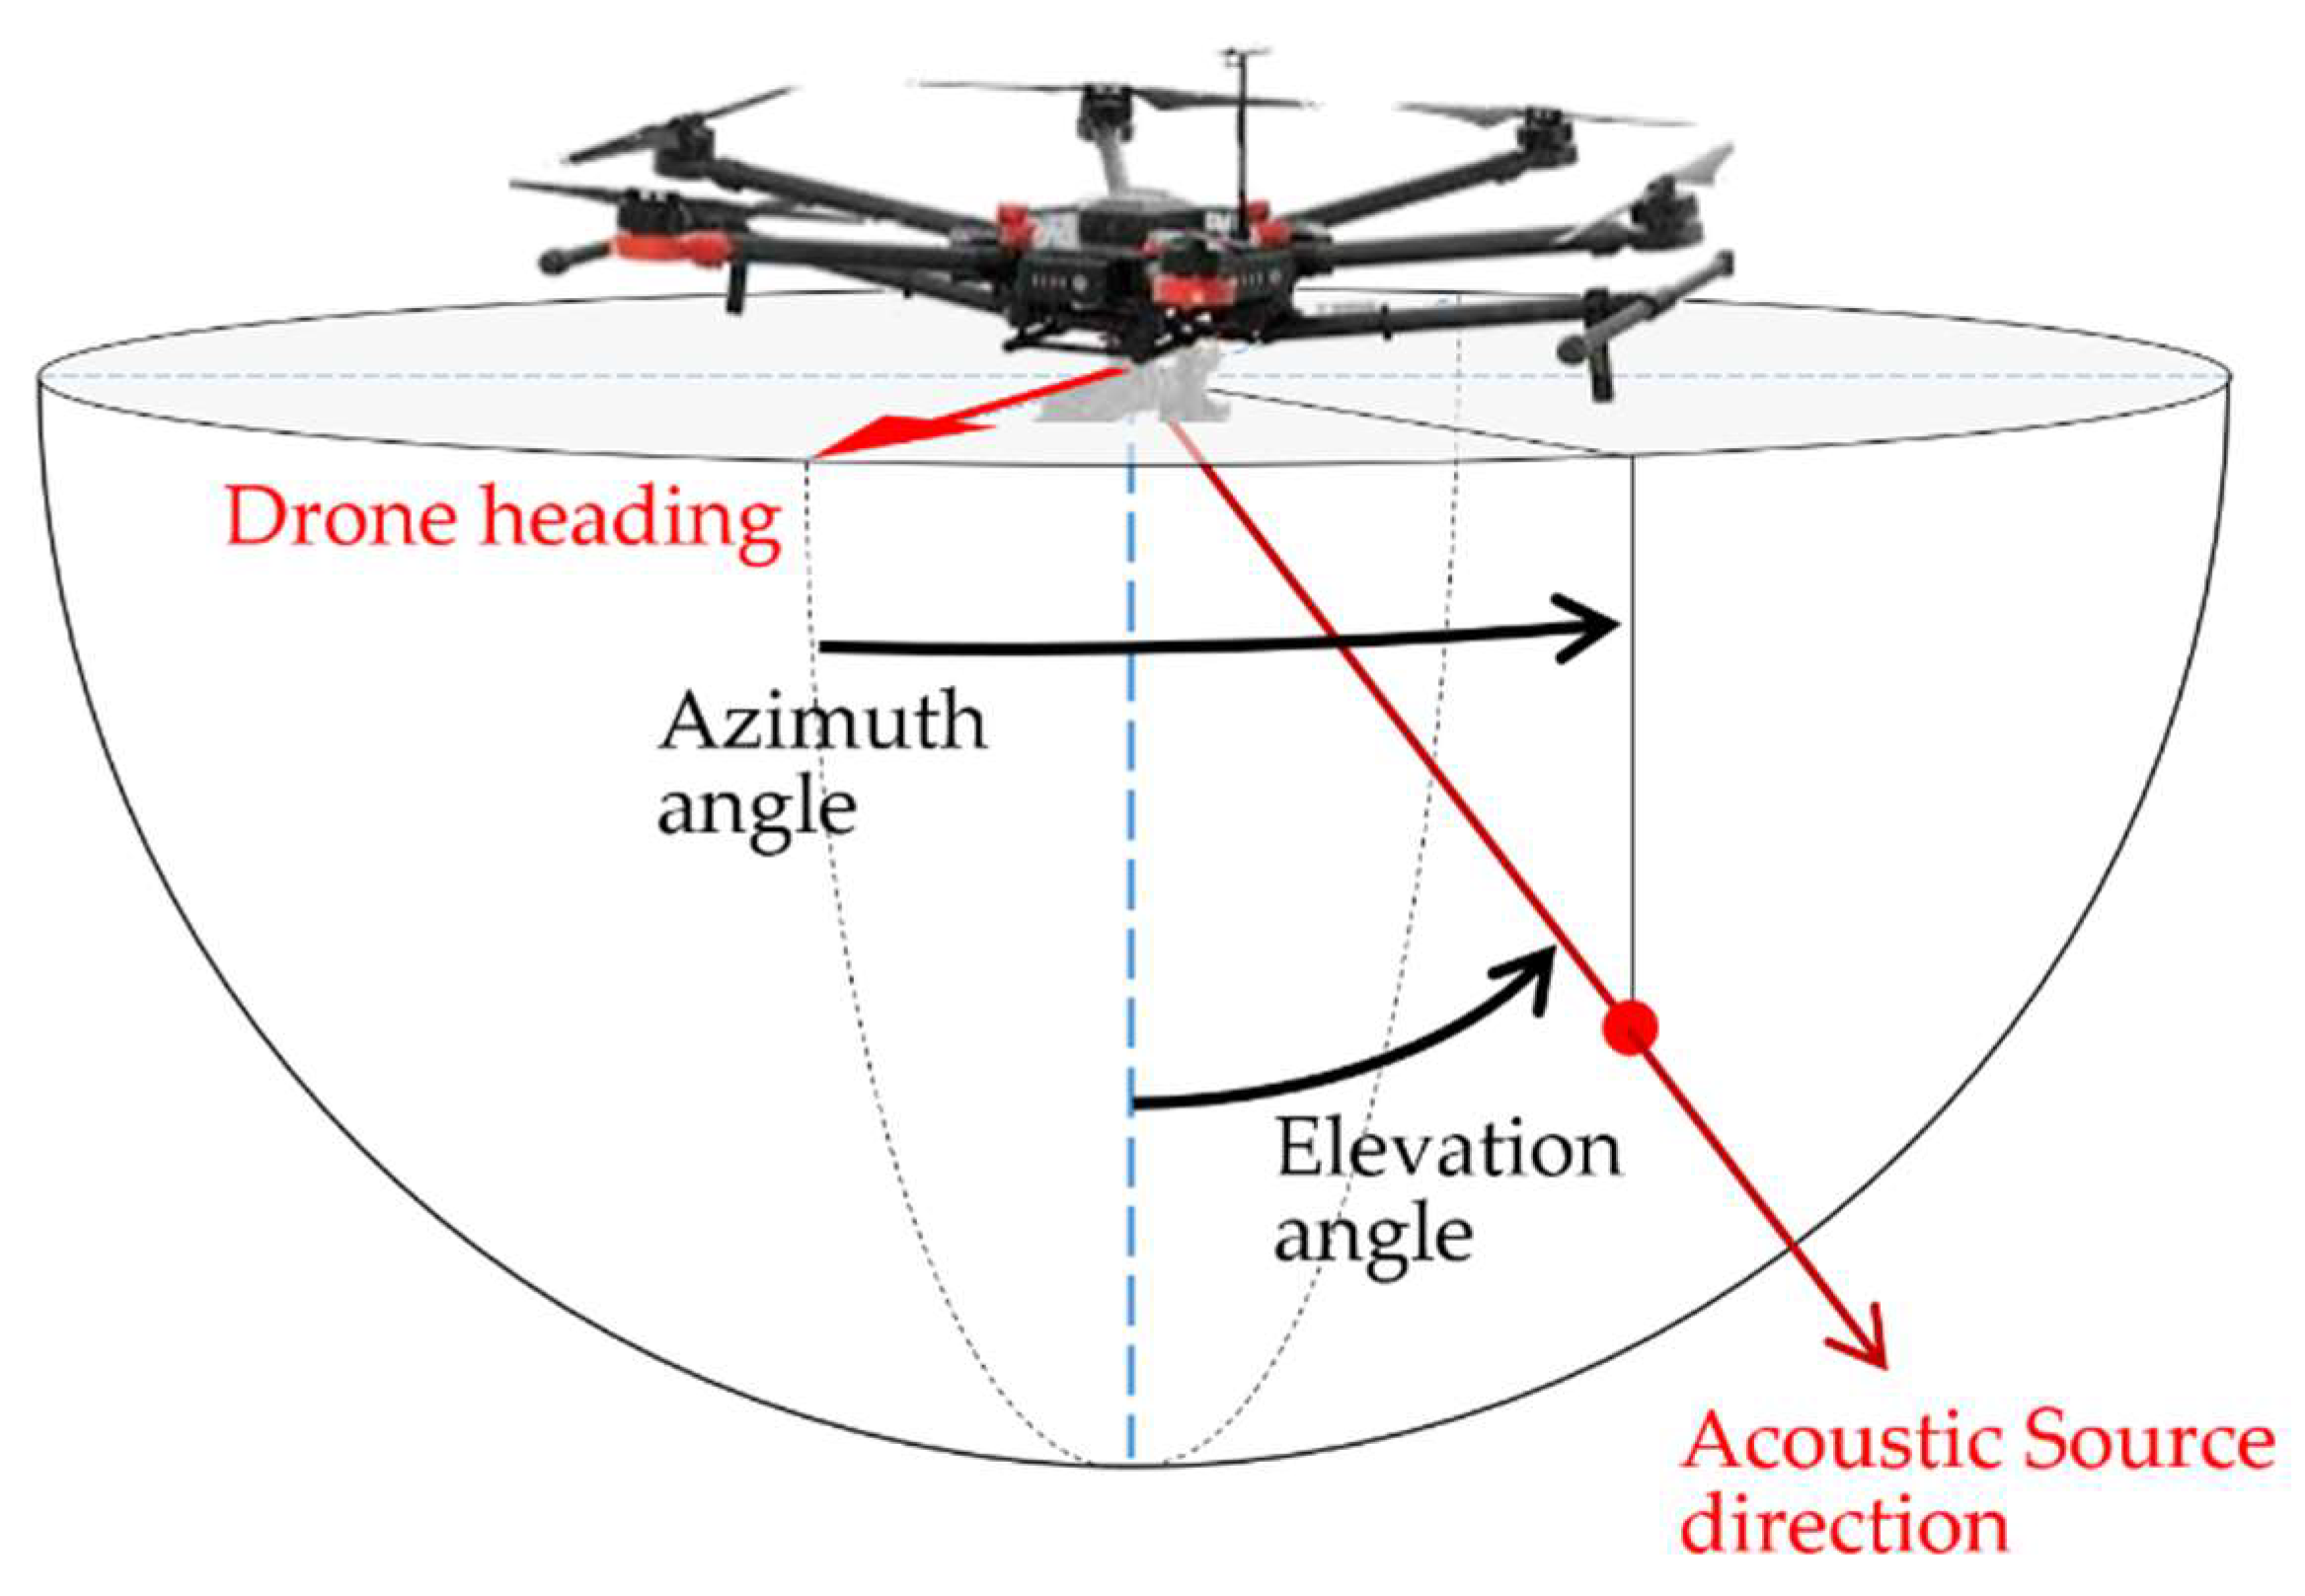
The direction of arrival of acoustic waves was estimated by dividing the maximum beam power into the azimuth and elevation angles based on the heading of the flying drone. The drone’s headings are related to the body coordinate system, and the roll, pitch, and yaw angle are output from the drone’s flight control system in the reference direction. The pose angle of the drone and the estimated arrival angle of the acoustic wave were corrected relative to the ground.
Figure 14 shows the record of flight posture and positional data collected from the time of takeoff until the drone lands after the completion of the measurement and maintains hovering during experiments measuring the sound of the explosion. The flight data showed the amount of change based on the average value of the hovering time interval. The time data also showed when the first explosion was detected at each explosion location from Locations 1 to 6. The remaining firecrackers exploded sequentially, seconds apart after the first explosion.
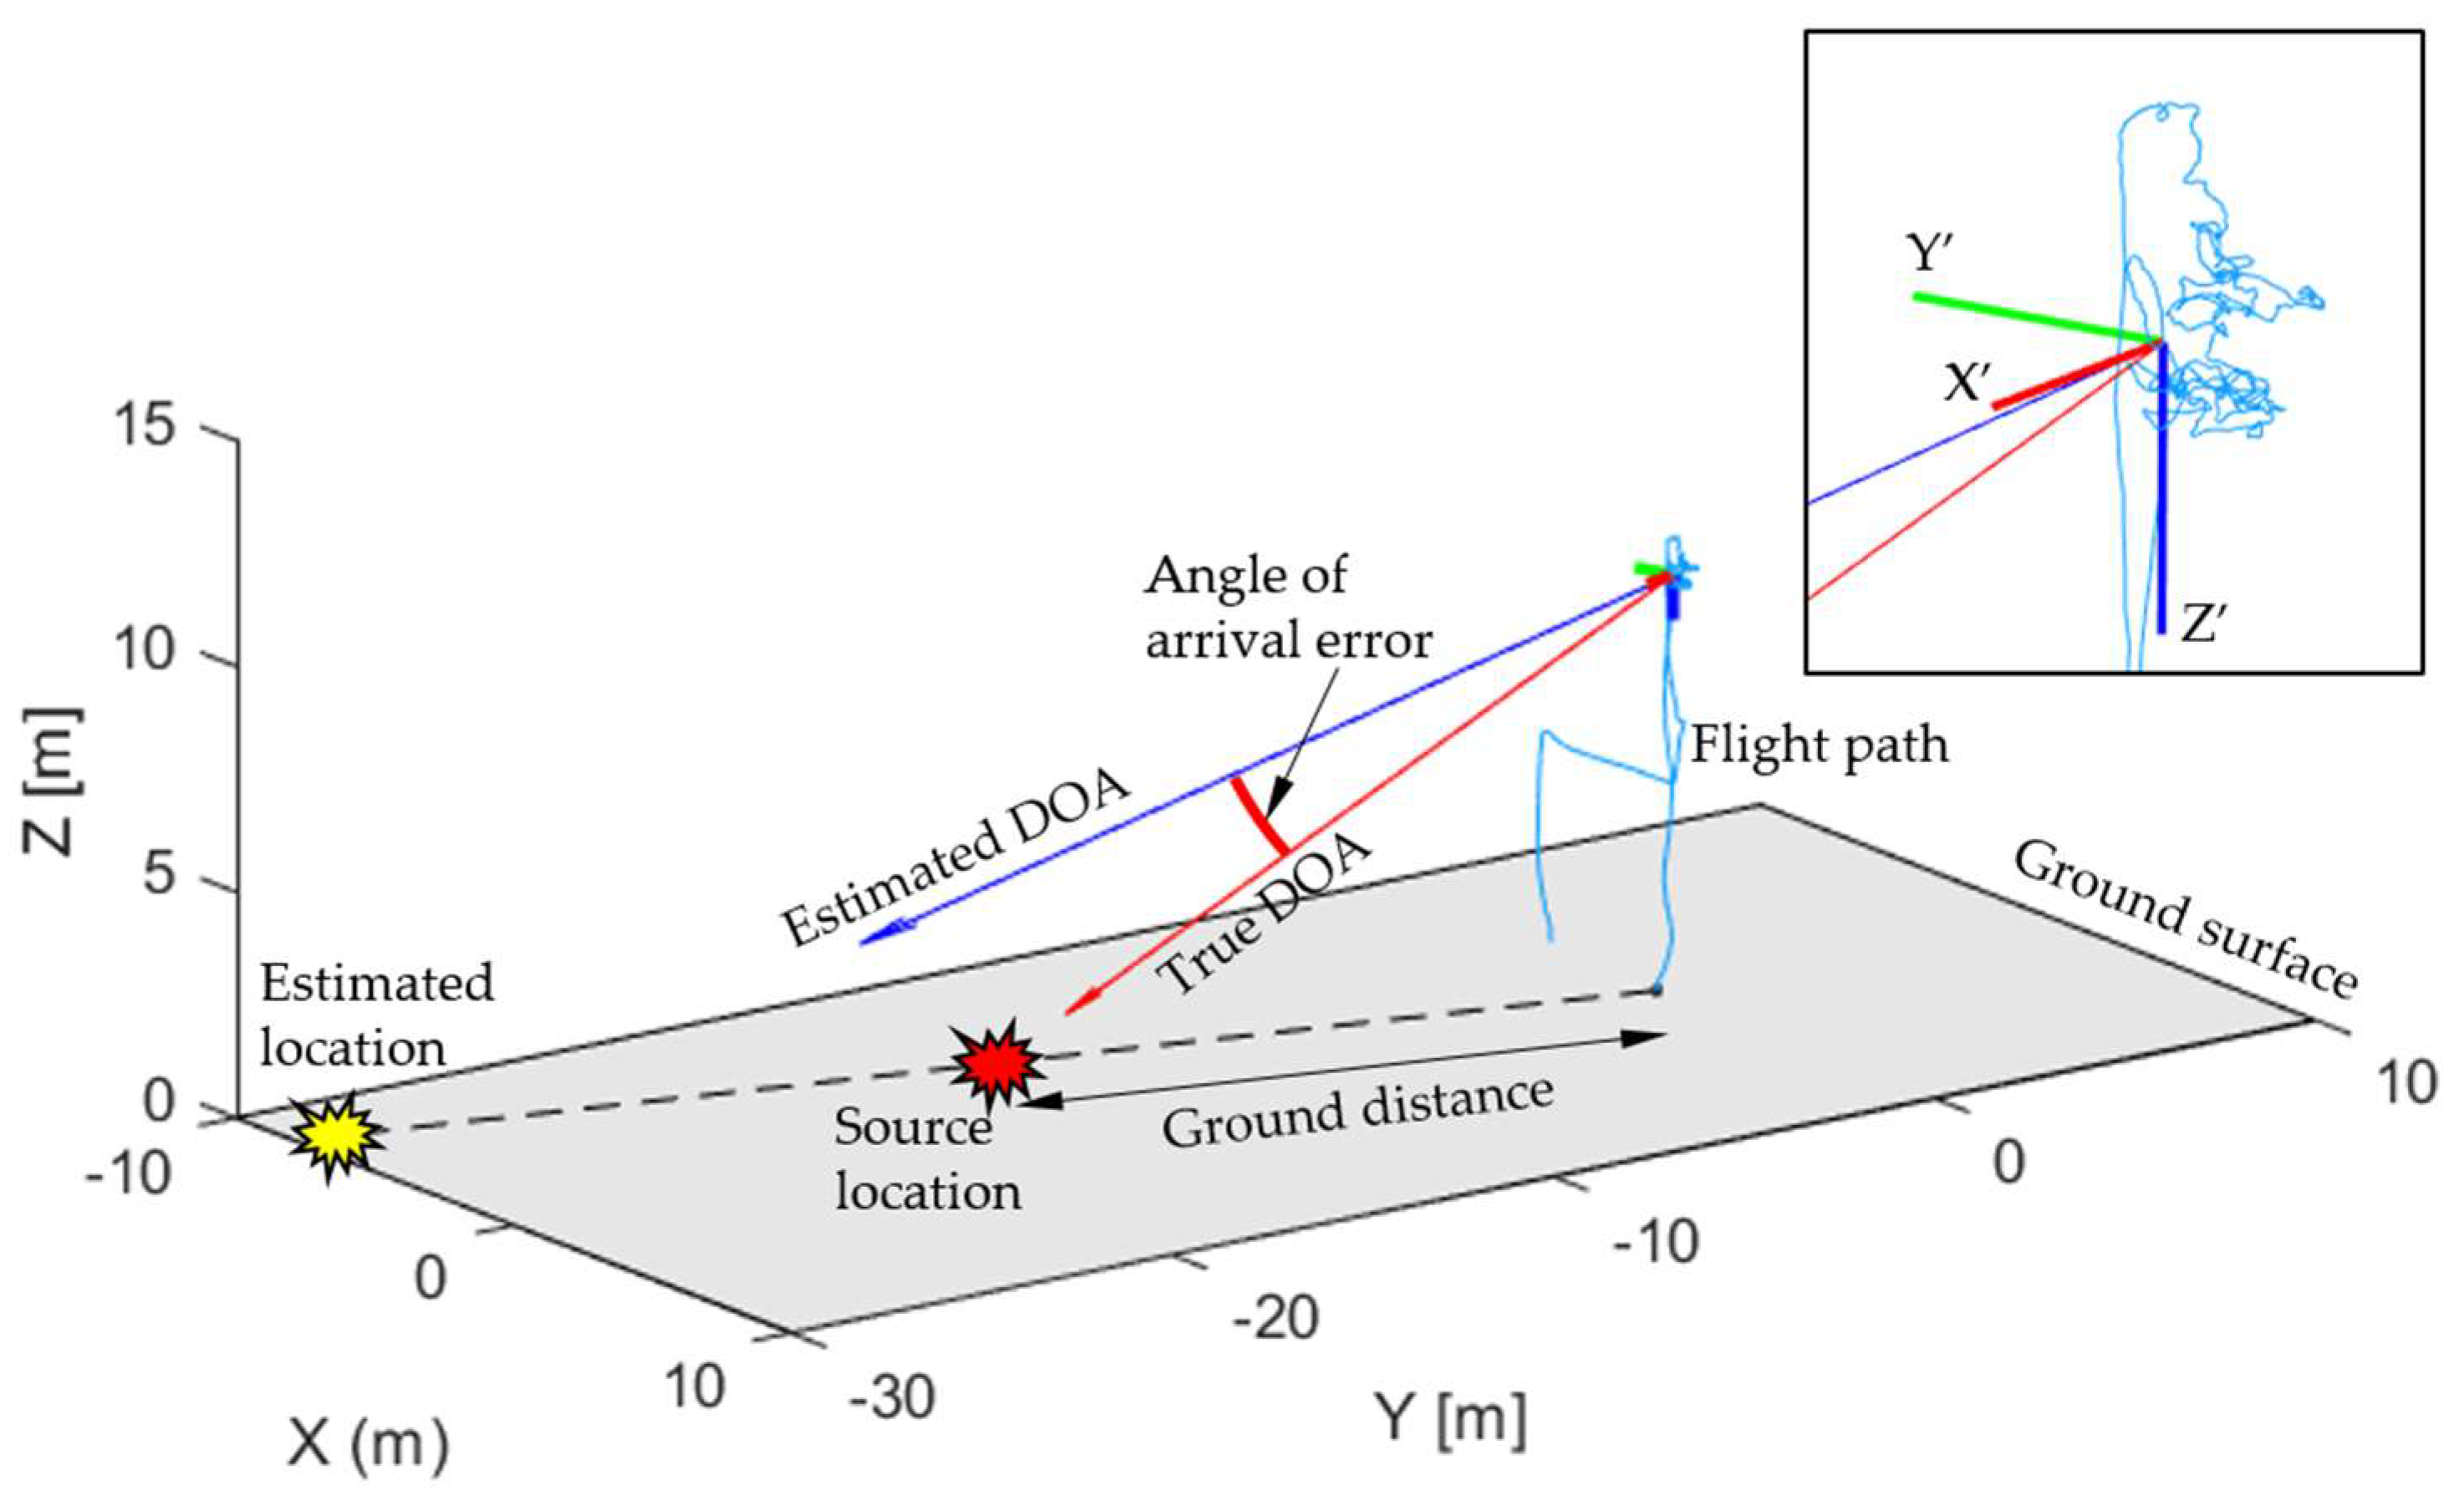
The estimated angle of arrival at the time an acoustic source was detected and the position and posture data of the drone could be corrected to specify the source location on the ground.
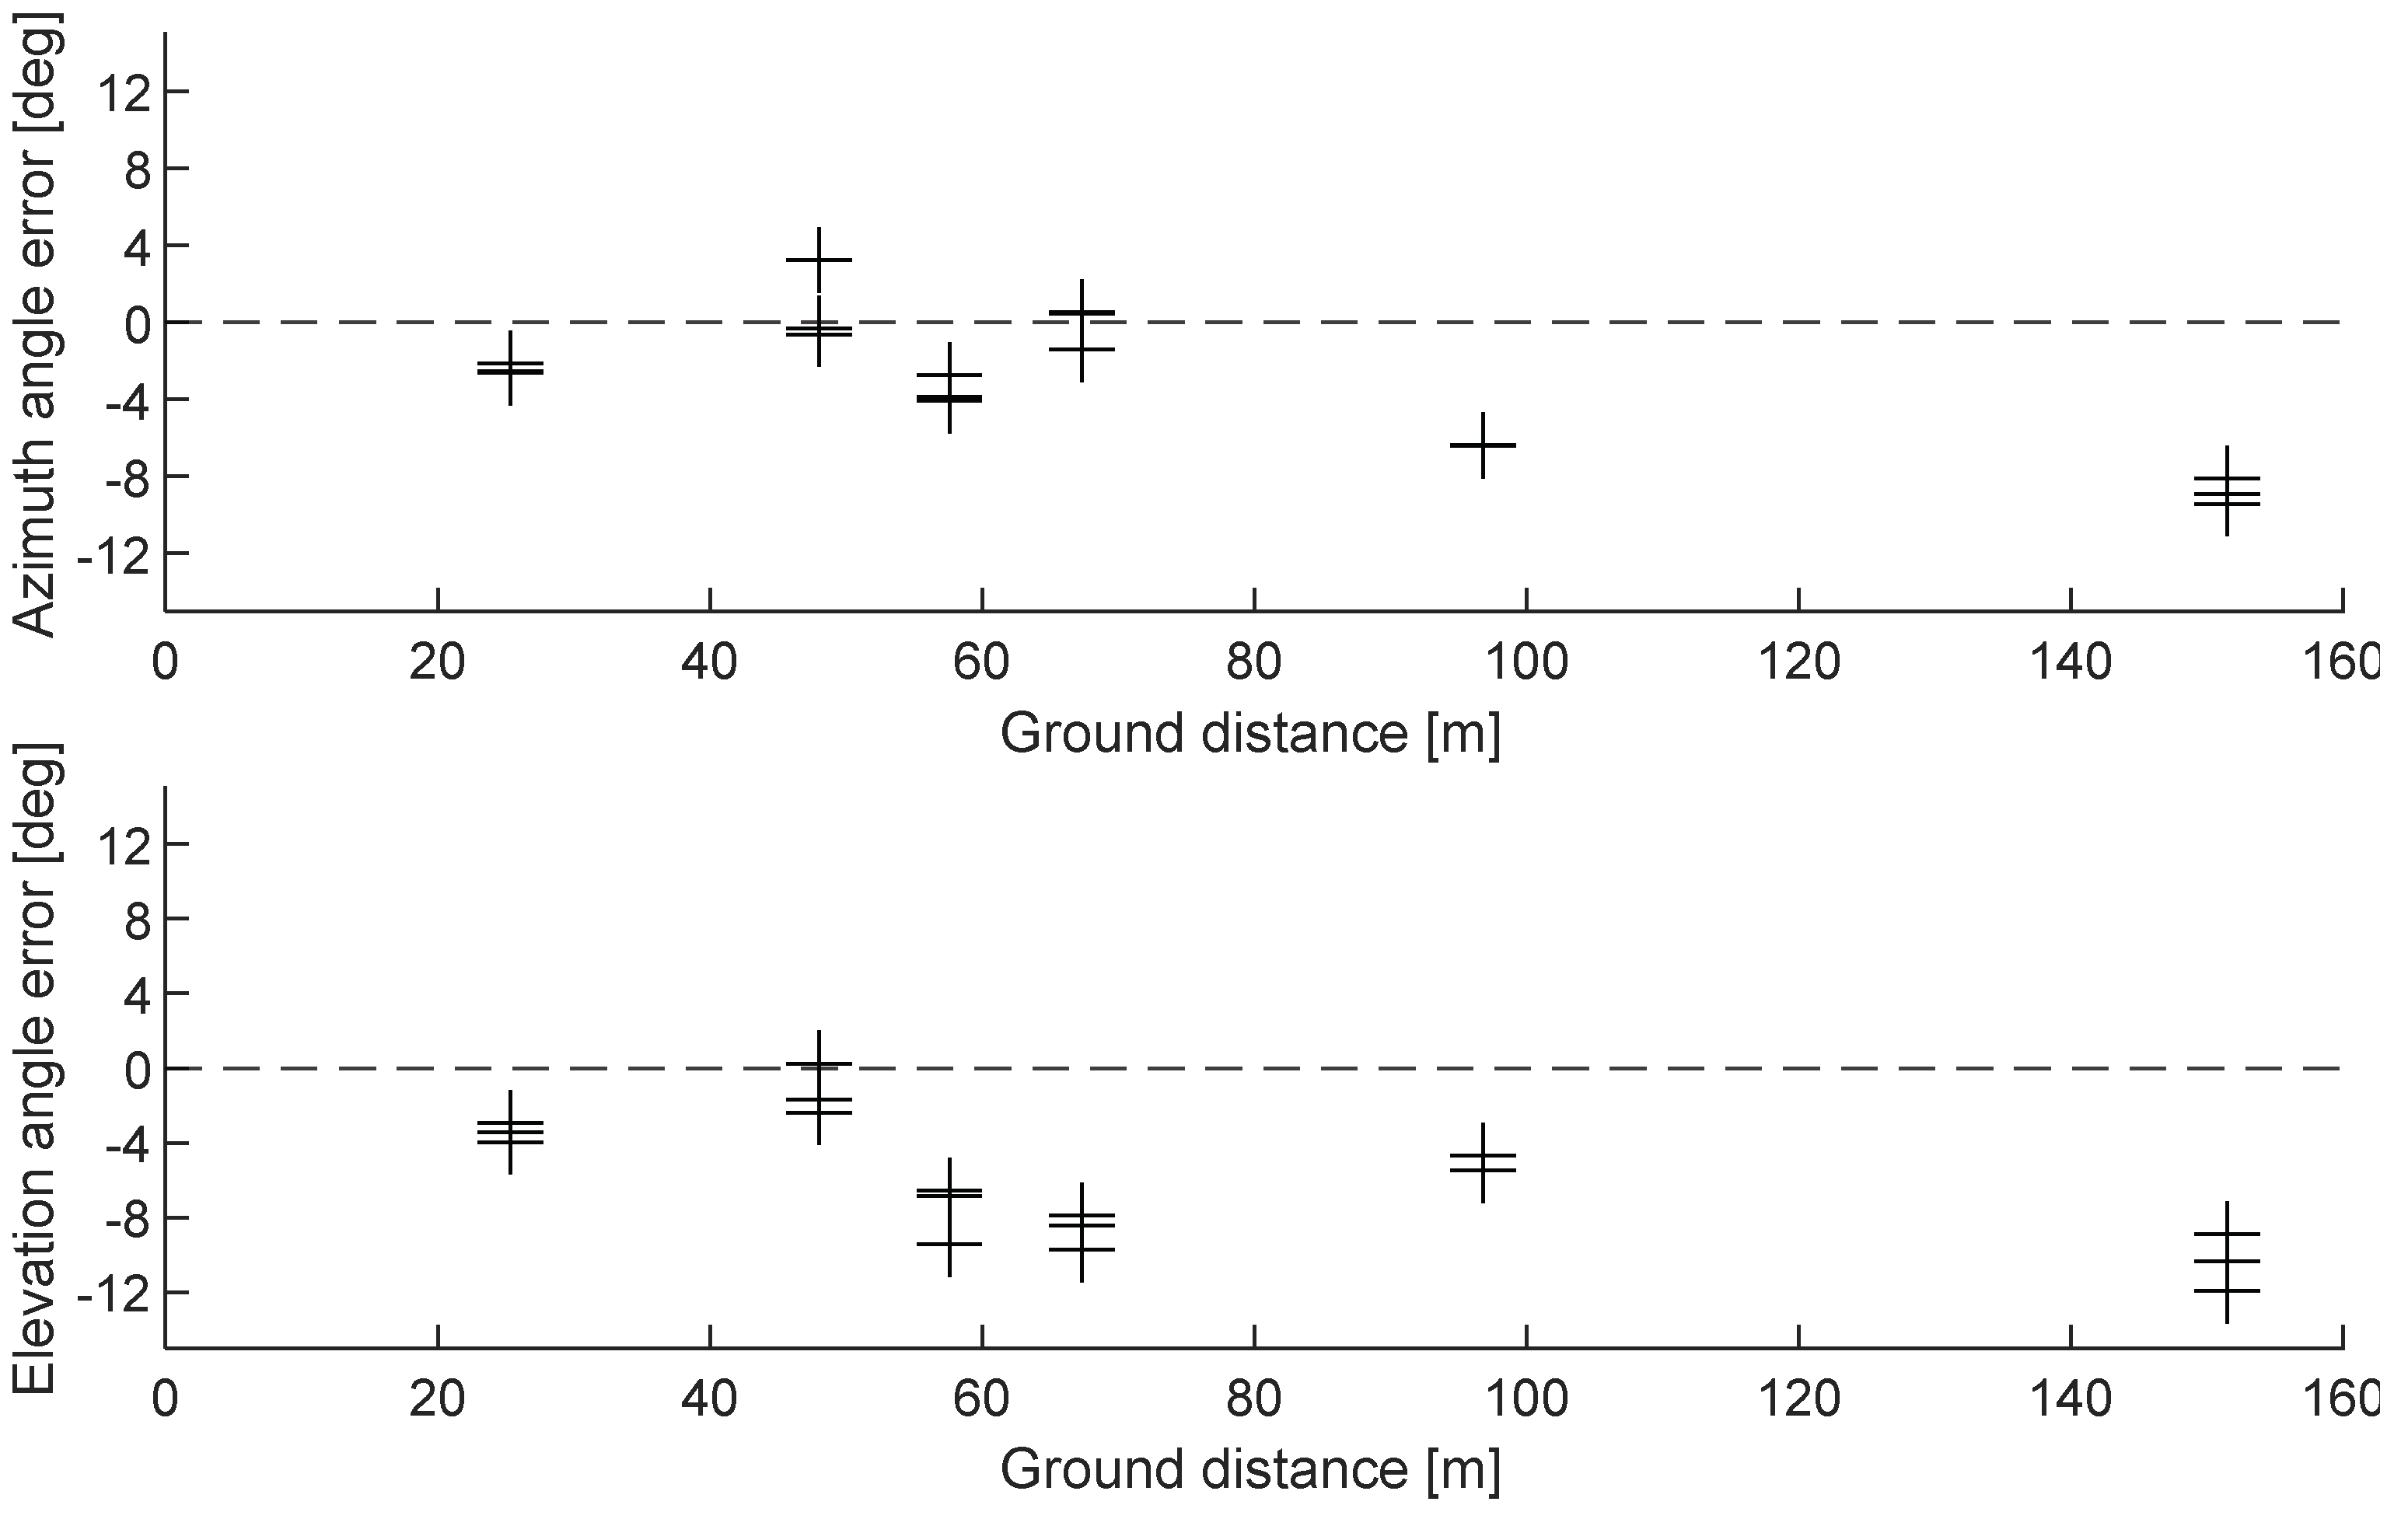
Figure 15 shows the results of determining the estimated accuracy of the acoustic sources above the ground by the error of the horizontal and vertical angles. In this graph, the angle error of 0 degrees implies the true direction for the actual position based on GPS localization, and the measurement error represents the directional error angle that occurred from the true direction. In this experiment, acoustic source detection was performed up to a maximum ground distance of 151.5 m. The mean estimation error for three repeated impact sounds confirmed the detection performance of 8.8 degrees for the horizontal angle error and 10.3 degrees for the vertical angle error (
Table 2). The estimated direction error for the entire location tended to increase both horizontally and vertically as the ground distance increased; the vertical angle error tended to be slightly higher than the horizontal angle error. The estimation error was the most sensitive during the drone’s positional information correction process. In other words, we experimentally confirm that the location and posture of the drone at the time of detecting an acoustic source of interest must be applied to enable accurate localization.
5. Conclusions
Using an array of microphones mounted on a drone, we described how to detect the location of acoustic sources generated on the ground and confirmed the performance of the system through experiments. The spectral subtraction method was applied to enhance the signal-to-noise ratio of the acoustic source of interest and was effective in eliminating noise generated by the drone. It was able to remove the fluctuating pressure and turbulence noise affected by the blade passing frequency of drone propellers and the wake, and to preserve the impact sound that was intended to be detected. Furthermore, we confirmed that the direction of arrival could be estimated when applied to beamforming methods that detected the direction of arrival of acoustic sources using phase difference relationships, and that the phase difference relationship could be effectively restored even with spectral subtraction methods. It is important to highlight that the spectral subtraction method implemented in this study was able to improve the signal-to-noise ratio, and also to effectively preserve the phase for each microphone. A drone mounted with a 32-channel microphone array was used to detect acoustic sources, and flight data could be used to detect the locations on the ground. We implemented a valid acoustic source detection method by fusing flight data at the same time as when the acoustic source was detected. The detection performance of acoustic sources with a ground distance of 151.5 m was confirmed with a horizontal angle error of 8.8 degrees and a vertical angle error of 10.3 degrees.
In this study, we proposed and implemented the necessary elements to implement a method for exploring external sound sources of interest detected by drones. Although each element of the technique is not entirely state-of-the-art, it is meaningful to specify and implement what must be performed when detecting acoustic sources using a drone, and to describe the process of connecting them. Language recognition is a detection target that should immediately become of interest. It can be used to detect people or to strengthen the voice of a person targeted from the air. Drones, especially for lifesaving activities, can be a very useful technology. There have already been several studies on language recognition technology using deep learning, and in the near future, applications of this technology are expected. Deep learning can also be applied to noise cancellation technology for the drone’s self-noise. From a hardware perspective, there should also be additional studies on optimal arrays that can effectively fit drones with fewer microphones to improve location detection performance.


