2.1. Experimental Studies of Propellers
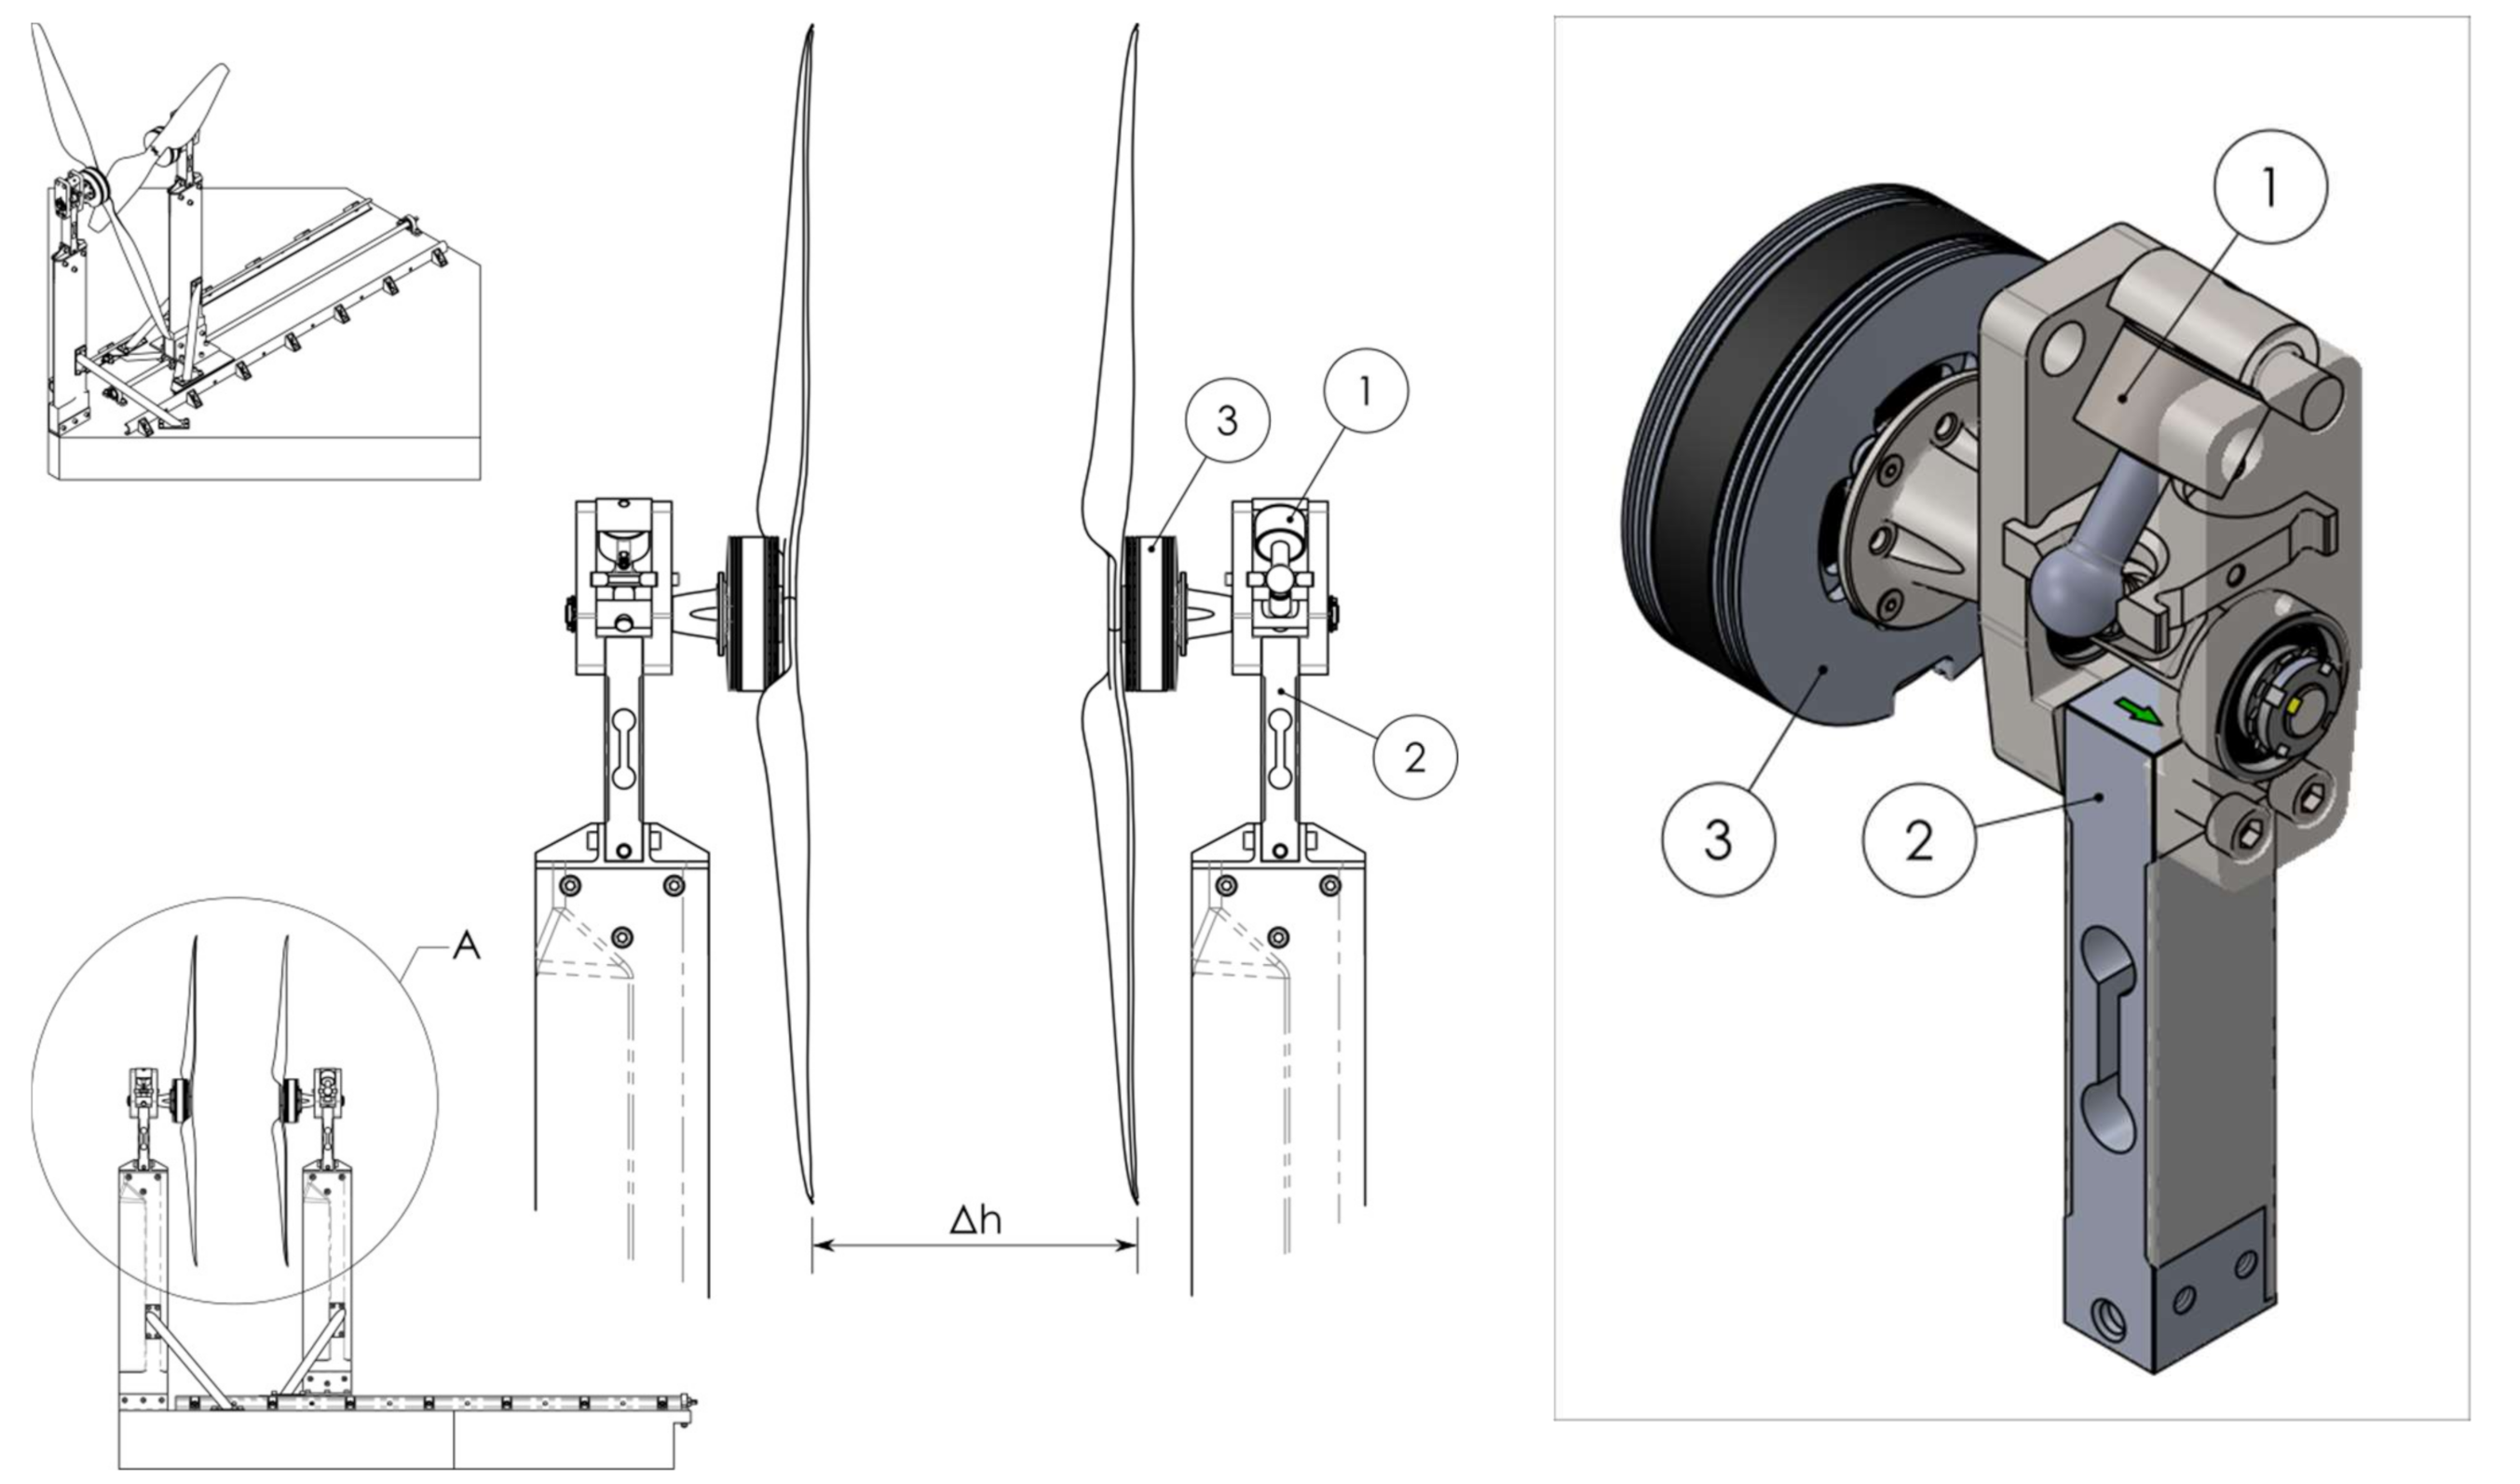
The test setup consists of a platform with two towers, one fixed and one movable allowing for adjusting the distance between propellers, see
Figure 1. On top of the towers are placed measuring nacelles with integrated on them the thrust force (2) and torque (1) load cells. The test rig is meant for testing static (hover), as well as dynamic response of various propellers, motors, and speed controllers (ESCs). The rig consists of a heavy base and two aerodynamically shaped columns that can hold each of the two motors/propellers in a coaxial setup, or only a single motor/propeller in a single setup.
One of the columns is movable in the direction of the propeller rotation axis to enable adjustment of the distance between the two propellers in a coaxial configuration. Thrust force (2) and torque (1) are measured by respective load cells in the nacelles positioned at the top of each column. Nacelles were designed the way to allow the sensors for optimal measurement condition without off-axis forces or moments of force that could falsify the results. By measuring propeller torque, the rig is also able to measure the efficiency of the propeller(s) and the motor/ESC combo(s) separately. All sensors and actuators are interfaced with a custom data acquisition system (DAQ). In the setup control signal was fraction of throttle, 0.0–1.0 = 0%–100%. The data collection frequency in the current setup is 200 Hz. In the current setup following parameters can be measured individually for each propeller (1) thrust (axial load), (2) torque, (3) RPM (it is motor electrical RPM (ERPM) measured at the motor phase wire), (4) motor temperature, (5) current to ESC, (6) bus voltage (the bus voltage is the same for each ESC since they are on the same bus), (6) Power consumed [W], and (7) Power conversion (g/W). The whole system was calibrated with the following parameters:
Thrust measurements are calibrated for offset, gain, and linearity in one direction with a 3rd-order polynomial using test weights; and
Torque measurements are calibrated in both directions for offset, gain, and linearity using a torque arm and test weights.
The step static testing was conducted by a sequential increase of throttle from zero in a pre-defined number of steps to provide consistent data for each step. For temperature measurements to be valid, the duration of the static hover thrust test had been conducted from cold and limited to a few minutes to overcome the motor’s thermal time constant. The duration of each step was set to be 10 s with an increment of 10% of the throttle resulting in 11 steps in total. Data were considered stable when the noise level became stable and was determined by filtration of the signal. A 0% throttle was recorded in order to have noise level measurement for future reference. The propeller did not rotate at the first increment of the throttle, resulting in false readings from RPM and current (which gave unrealistic values of power consumption at close to zero RPM).
To remove the high noise/unreal/unstable section of the signal/singularities at low RPM, following filtration procedure steps:
All RPM values bellow 100 RPM were dropped (no movement and noise level RPM signal) Result: only steps with following throttle levels were not dropped [0.2, 0.3, 0.4, 0.5, 0.6, 0.7, 0.8, 0.9, 1]
The time to stable noise level differs between the steps. To standardize the number of readings, a single value, true for each step was selected. The last 1000 measurements of each step (last 5 s) of each step were used as stable.
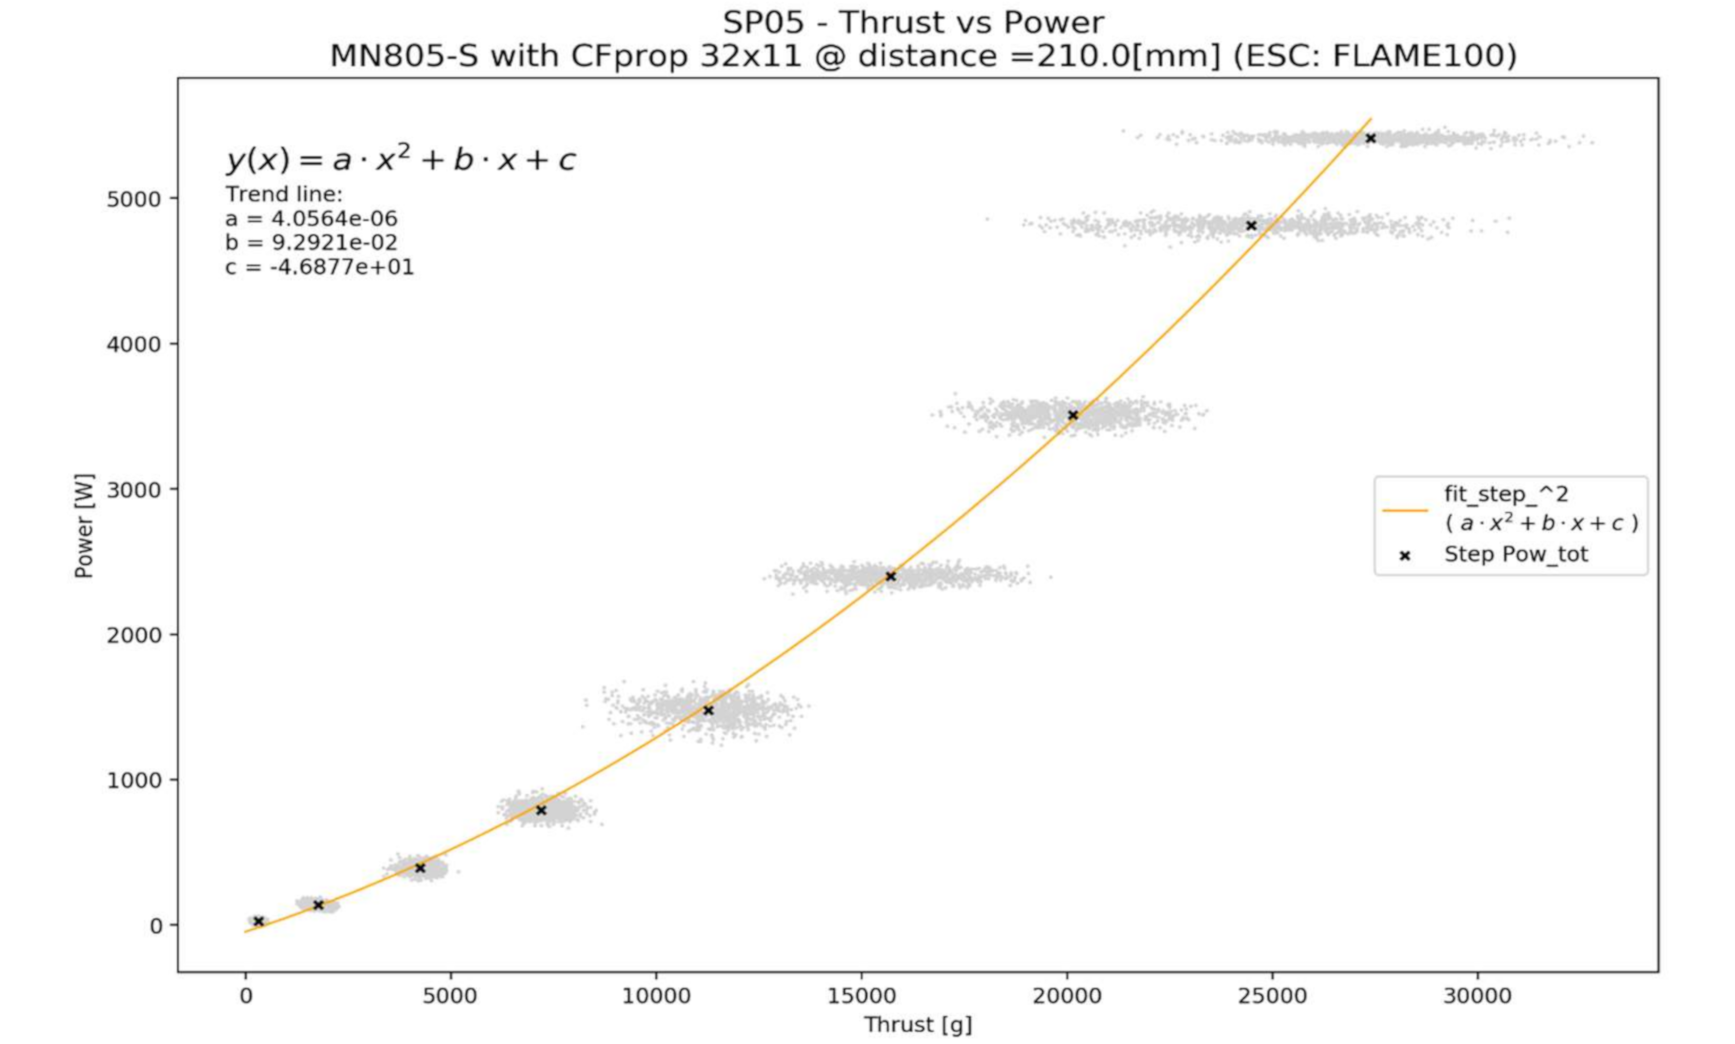
The remaining signal was used to calculate the average values of parameters for each step (
Figure 2).
2.2. CFD-BEMT: A Numerical Approach for Modelling the Propeller
Qblade is open-source software that computes lift and drag coefficients of a given airfoil. Qblade is based on XFOIL (
https://web.mit.edu/drela/Public/web/xfoil/). XFOIL is an interactive program for the design and analysis of subsonic isolated airfoils. It can be used in the viscous (or inviscid) analysis of an existing airfoil, airfoil design and redesign by interactive modification of surface speed distributions, and airfoil redesign by interactive modification of geometric parameters [
17].
OpenFoam is an open-source computational fluid dynamic (CFD) (
https://openfoam.org/) software used in solving flow related problems and in the present studies OpenFOAM has been applied for a flow analysis of the propellers. In CFD, the propeller can be modelled in two ways (1) direct method and (2) indirect method. In the direct method, the propeller geometry is resolved on the CFD grid allowing for the correct representation of the propeller surfaces. In the direct method, a 3D model of the propeller is imported in the CFD pre-processor and a mesh around the propeller is created. In this approach, more detailed features of the flow field around the propeller can be obtained. However, the direct method (resolving propeller on the grid scales) is computationally demanding and almost impossible to apply in the design and optimization of the propeller. The direct modelling approach requires many manual hours in establishing a propeller model needed for performing the simulations. To overcome this challenge and to speed up the simulation, another approach has been developed in which a mathematical model for representing the feature of the propeller has been developed and in this approach, the 3D model of the propeller is not required and therefore it does not require meshing of the propeller. This simplification leads to a computationally efficient solution [
18]. This approach takes less time in establishing a simulation case enabling many simulations needed for finding the optimum size.
In the present approach, Navier–Stokes (NS) equation is solved on the grid to resolve the flow dynamics and the effect of propellers dynamics is introduced as a sink term in the momentum equation. Two fundamental conservation equations; conservation of mass and conservation of momentum have been solved.
The continuity equation or conservation of mass is:
The momentum equation is:
where
is density of the medium,
is the velocity vector,
is the gravitational force,
is the averaged stress tensor, and R the Reynolds stress tensor. The effect of the propeller on the flow is introduced via source terms
to the governing equations for the cells in the mesh that are located inside a pre-defined propeller zone. These zones are predefined using OpenFOAM meshing option. As mentioned earlier, this approach is computationally cheaper than simulating an entire rotor blade geometry, but the resulting wake behind the propeller will only capture the time-averaged effects of the entire propeller on the flow field. Additionally, this approach cannot account for flow separation in the blades or other 3D effects such as shocks (for compressible cases), tip vortices, or hub horseshoe vortices. The source term in the momentum equation can be modelled either using the actuator disk (AD) or actuator line (AL) approach. The AD approach assumes a propeller rotor as a porous medium, and the AL approach resolves each blade of the propeller as a line or surface. In AL the propeller blades are represented by lines upon which distribution of forces acts as a function of local incoming flow and blade geometry. The main advantage of the actuator line model is the representing of the blades by its airfoil data that makes the approach well suited for wake studies. The rotational effect of blades, finite blade number effect, and the effect of non-uniform force distribution in the azimuthal direction are well incorporated in ALM.
In ALM, the propeller is modelled using Blade Element Momentum Theory (BEMT), this theory states that a propeller 3D geometry can be subdivided into multiple 2D sections along the length of the propeller. Then on each section, blade sectional forces thrust (
and torque (
are calculated using the local flow velocity, flow angle (
, and blade section properties such as blade pitch angle
, chord (c), and tables of lift (
and drag (
coefficients around each section of the blade [
19]. The following approach is used for estimating the source term that represents the propeller dynamics [
18,
20].
Step 1: Estimate the induction of the propeller using local flow velocity from CFD and use this induction factor to estimate the relative inflow angle. This is an iterative step.
Step 2: Estimate local angle of attack at airfoil section from relative inflow angle, pitch, and blade twist angle:
Step 3: Estimate the lift and drag coefficient at various local angles of attack. The blade lift and drag coefficients for each section aerofoil are functions of the angle-of-attack and are interpolated from lookup tables:
Step 4: Estimate the blade sectional forces:
These forces
are estimated for the mesh points residing in the pre-defined propeller zone. The forces
are estimated in the rotor cylindrical coordinate system. For all the mesh points
residing in the pre-defined propeller zone, the forces
will be transferred from the rotor cylindrical coordinate system to the Cartesian coordinate system
using OpenFOAM inbuilt coordinate transform function:
Step 5: The forces
are point forces and these forces will be converted into a volume forces using the following formulation [
18].
Step 6: Finally, the source terms needed in the momentum equation is implemented in the following manner:
with:
- ⚬
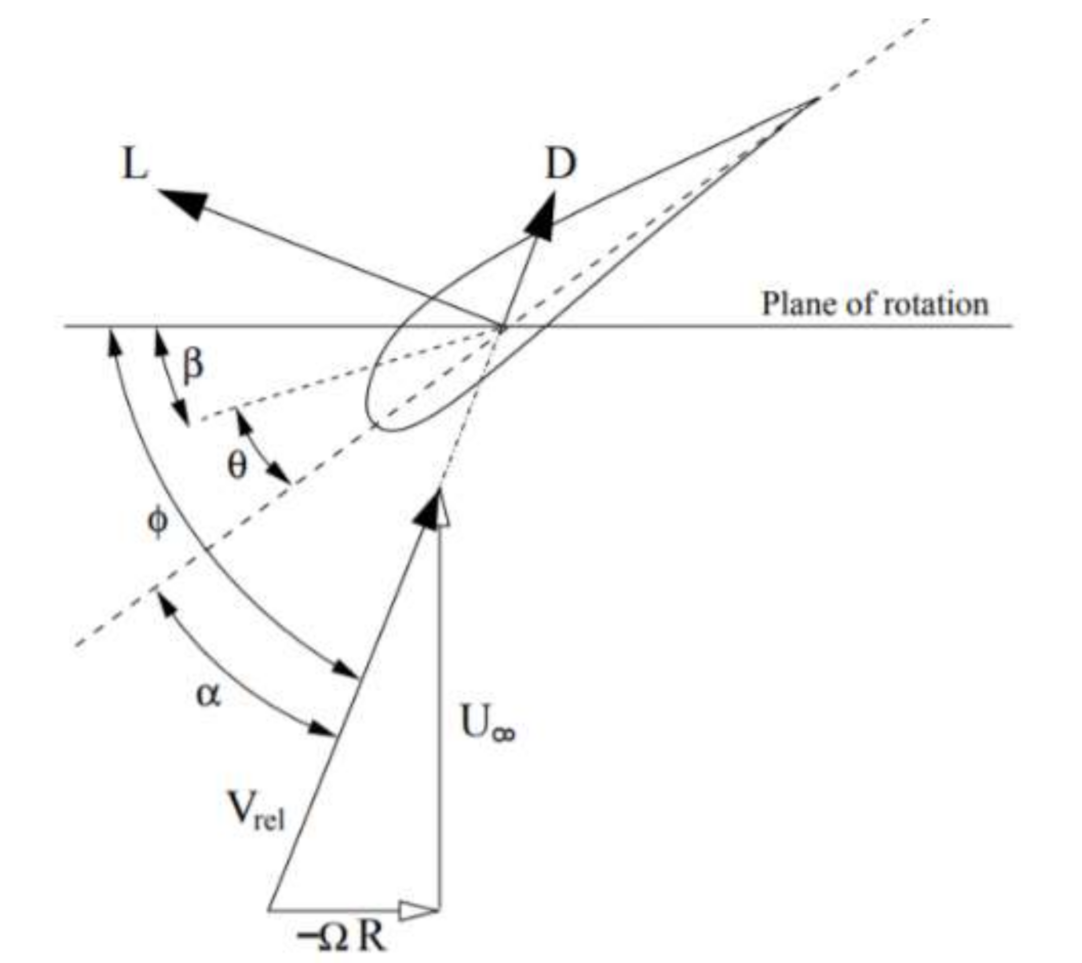
Φ (degree) the relative inflow angle (all the angles are defined in
Figure 3)
- ⚬
λ (-) the speed ratio
- ⚬
α (degree) the angle of incidence
- ⚬
β (degree) the pitch angle
- ⚬
θ (degree) the twist angle
- ⚬
a (-) is the axial induction factor
- ⚬
a’ (-) the rotational induction factor
- ⚬
B (-)the number of blades
- ⚬
c (m) the chord
- ⚬
r (m) the radial position along the blade.
- ⚬
(m) is the radial position of the mesh points residing in the pre-defined propeller zone
- ⚬
(m2) is the area of the cells residing in the pre-defined propeller zone
The tip factor F accounts for the decreased lift in sections close to the blade tip due to the presence of a tip vortex which decreases the lift near the blade tip but does not significantly affect drag. In the present OpenFOAM model, the tip correction model suggested by Prandtl and improved upon by Drela [
17] have been employed:
This model by solving Equation (3) to Equation (16) has been implemented by Patrao [
18] in OpenFOAM. In the present study, this model has been used for studying the propeller behavior.
Modelling of turbulence is very important and there are mainly three approaches for modelling the turbulence (1) Reynolds Averaged Navier–Stokes (RANS), (2) Large Eddy Simulation (LES), and (3) Direct Numerical Simulation (DNS). Both LES and DNS are computationally demanding and therefore these two approaches are not widely used in solving industrial flow related problems. RANS is a widely used approach for modelling the turbulent flow and in the current approach, the RANS approach has been used. However, a challenge with the RANS model is the selection of an appropriate turbulence model that is suitable for accurate estimation of the turbulent flow during the propeller motion. In the current study, the shear stress transport (SST) k-omega turbulence model is used. The SST model combines the k-omega and k-epsilon models. The k-omega model is more accurate near the wall and it is able to capture wall shear stress more accurately near to the walls, but these models are not well suited for free stream flows. On the other hand, the k-epsilon model gives better prediction in the freestream outside the boundary layer but the k-epsilon model fails to capture flow near to the wall. Hence a zone formulation was developed with a blending function to benefit from the best potential of both models [
21]. In addition to continuity and momentum equations, a transport equation of turbulence kinetic energy and turbulence energy dissipation have been solved.
The governing equations of the model are the turbulence specific dissipation given by [
22]:
and the turbulent kinetic energy is given by:
OpenFOAM solves Equations (1), (2), (17), and (18) simultaneously. The source term in Equation (1) is estimated by solving Steps 1–5.
2.3. Model Validation
The CFD-BEMT approach developed in the previous section has been validated with two APC propeller [
23]. To test the validity of the CFD-BEMT approach, the experimental data of a real propeller: APC 10 × 7 and APC 11 × 7 Slow Flyer available in the UIUC propeller database site have been selected. The propeller information including geometry details of the APC can be found online on the website of APC [
23]. The APC Slow Flyer is a two-bladed propeller, with a fixed pitch and a diameter. The propeller might be consisting of thin airfoil profiles with a specific combination of a low Reynolds number Eppler E63 and a Clark-Y airfoil near the tip, inserted to form a sharp leading edge blade design [
23]. One of the challenges in the CFD-BEMT method is the accurate representation of the airfoil section of the blade. From the manufacture homepage, it is rather easy to find the propeller geometry in terms of chord and blade angle distribution but the airfoil shape of the propeller is proprietary of the manufacture and it is difficult to obtain the airfoil section details. However, It has been shown that using 3D scanning to capture the exact airfoil sections can lead to good agreement with experimental data [
24,
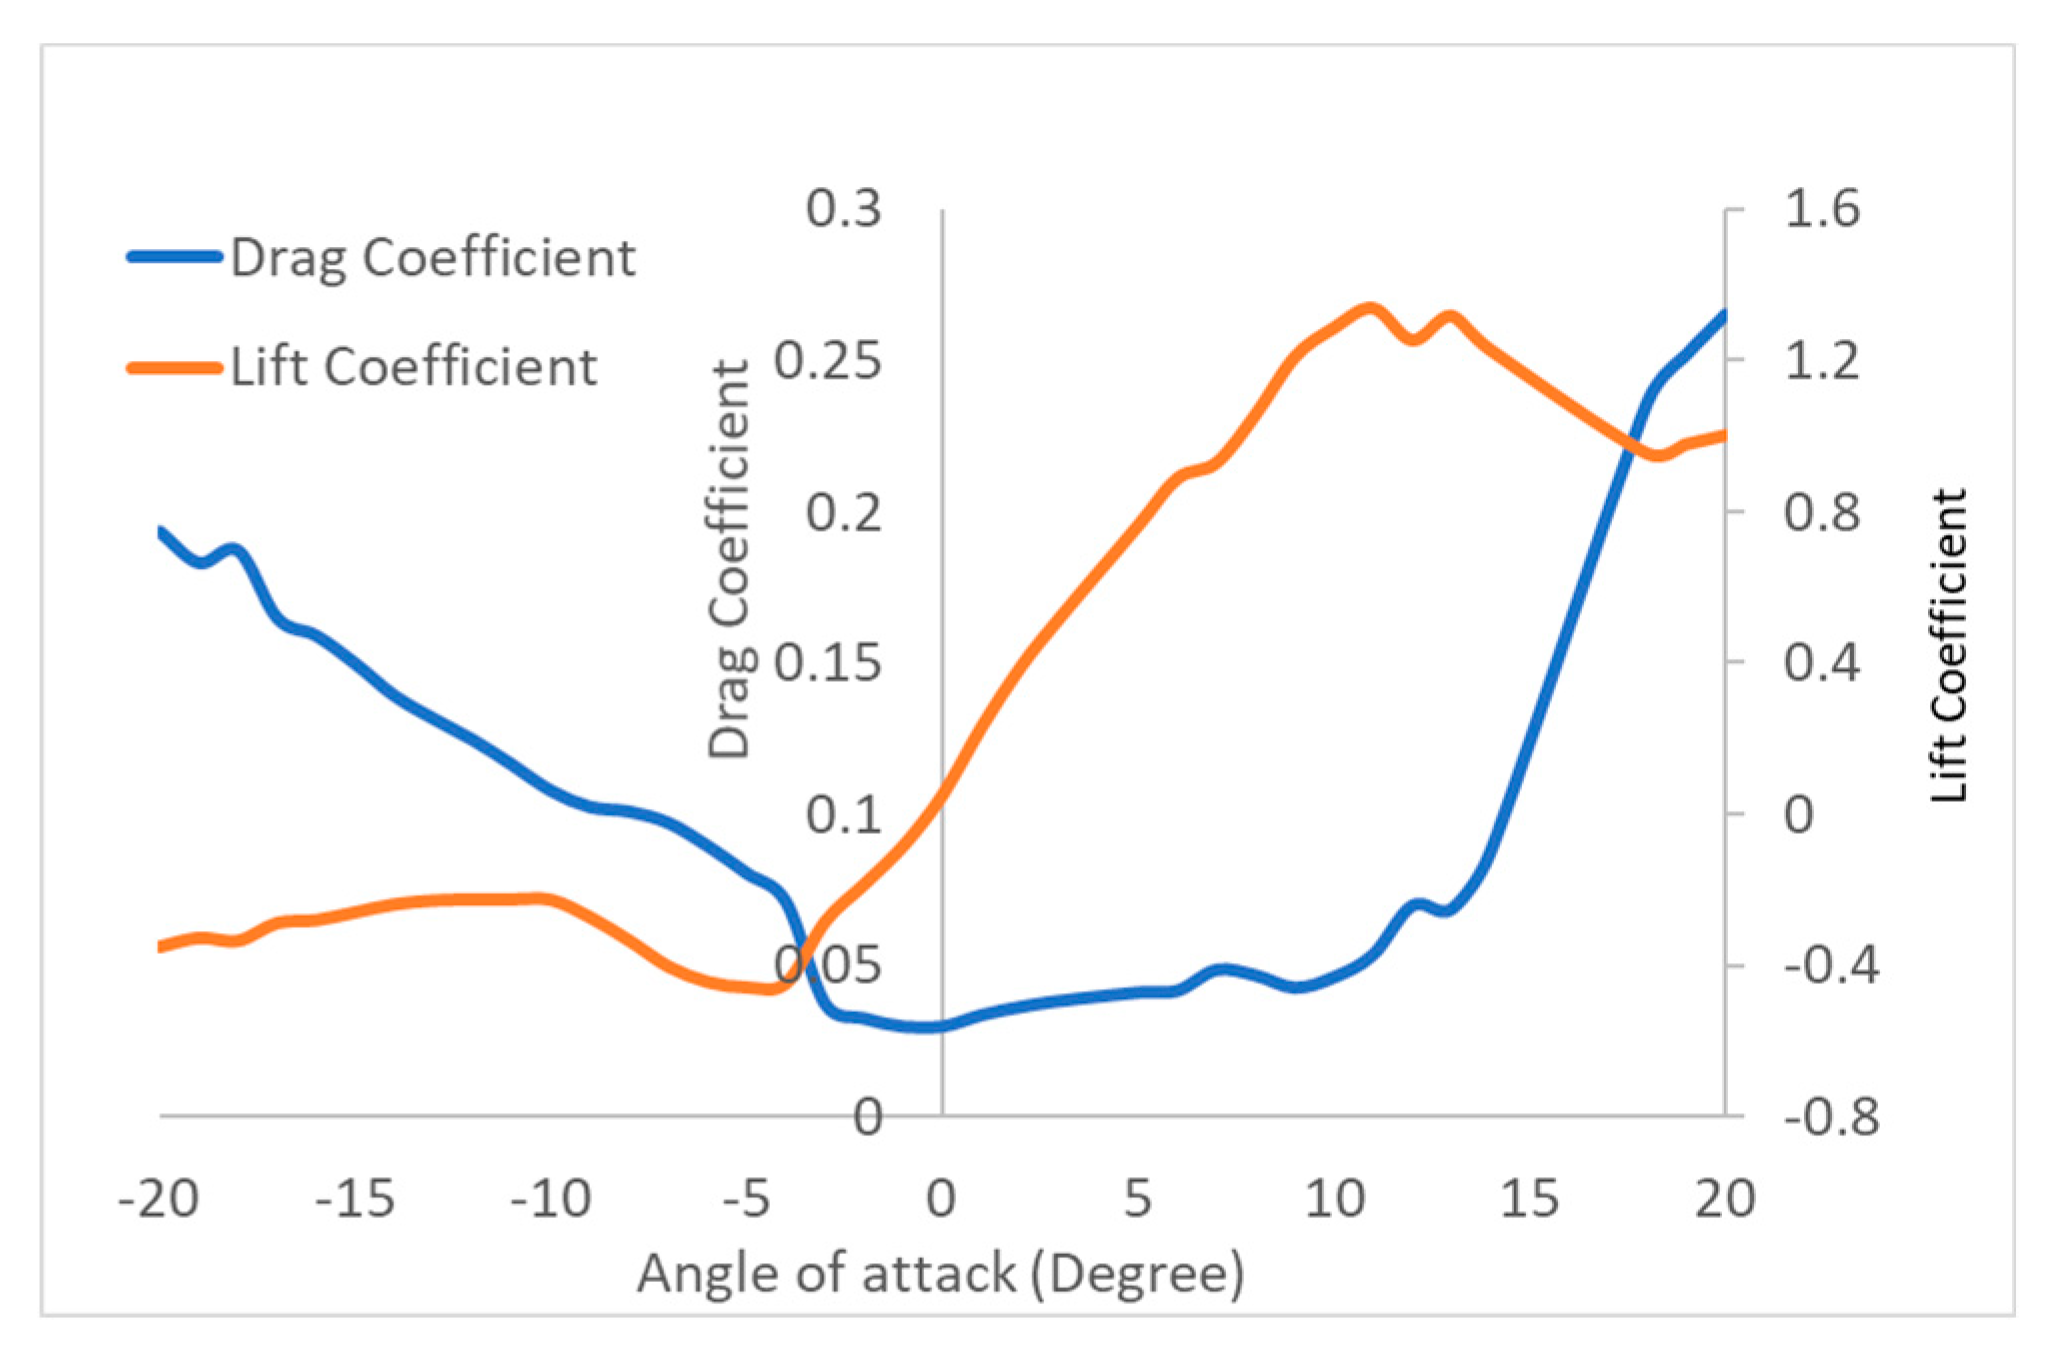
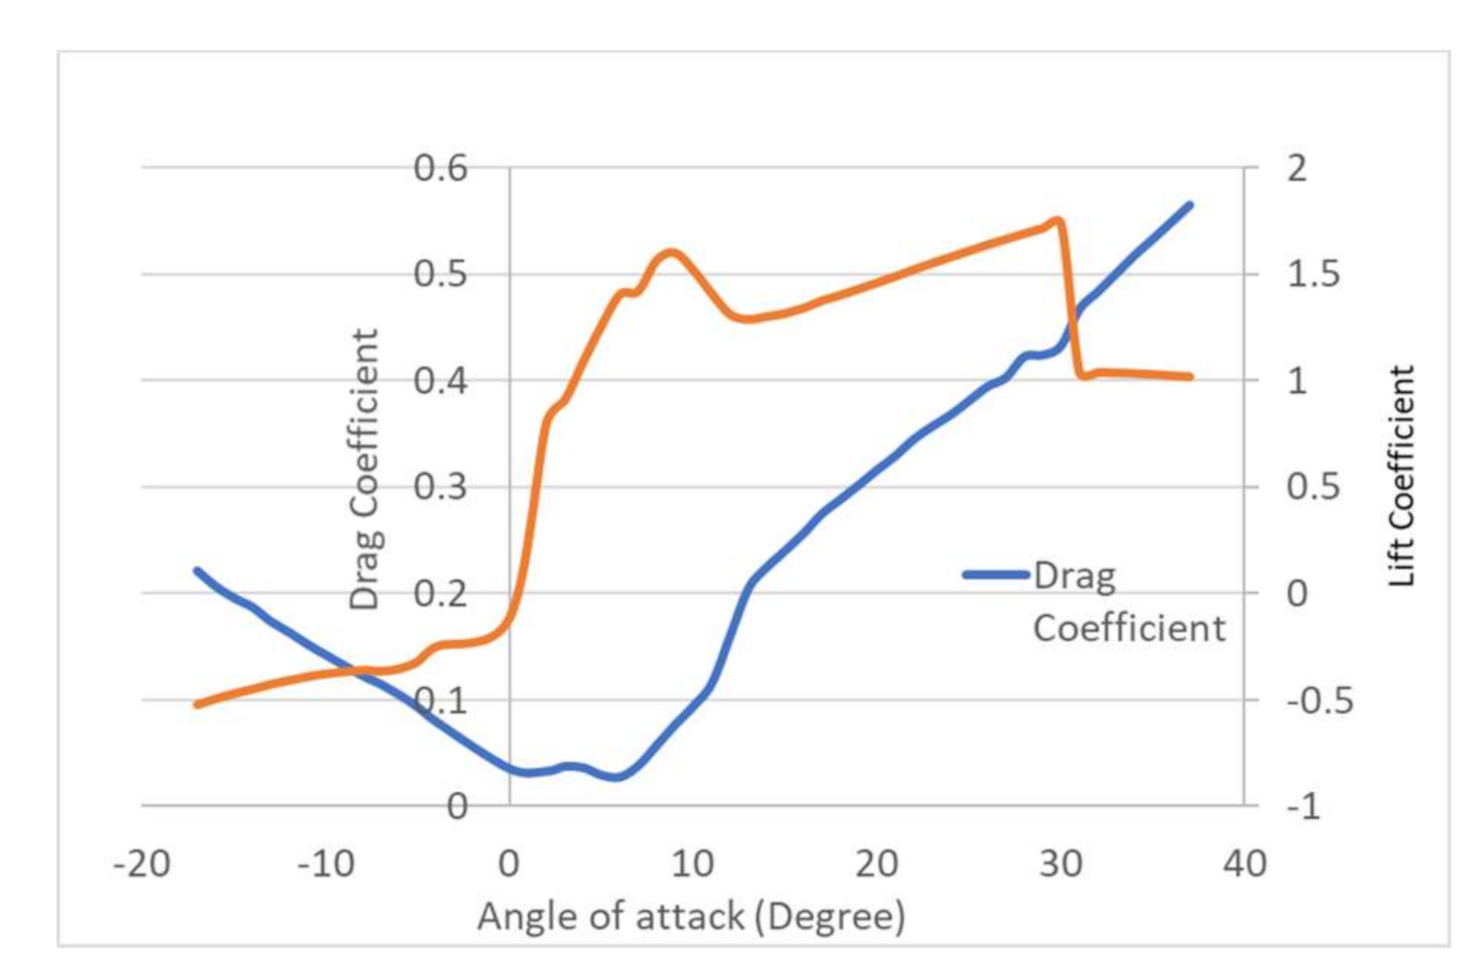
25]. However, in the absence of actual airfoil data, in the first attempt, it was assumed that APC SF propeller consists of Clark-Y airfoil. The lift and drag coefficients of the Clark-Y airfoil were estimated using Qblade. The parameters used in estimating the lift and drag coefficients are Reynolds number (Re) = 5 × 10
4, and angle of attack range = [−20:20]. The lift and drag coefficients found with Qblade for the Clark Y airfoil are shown in
Figure 4.
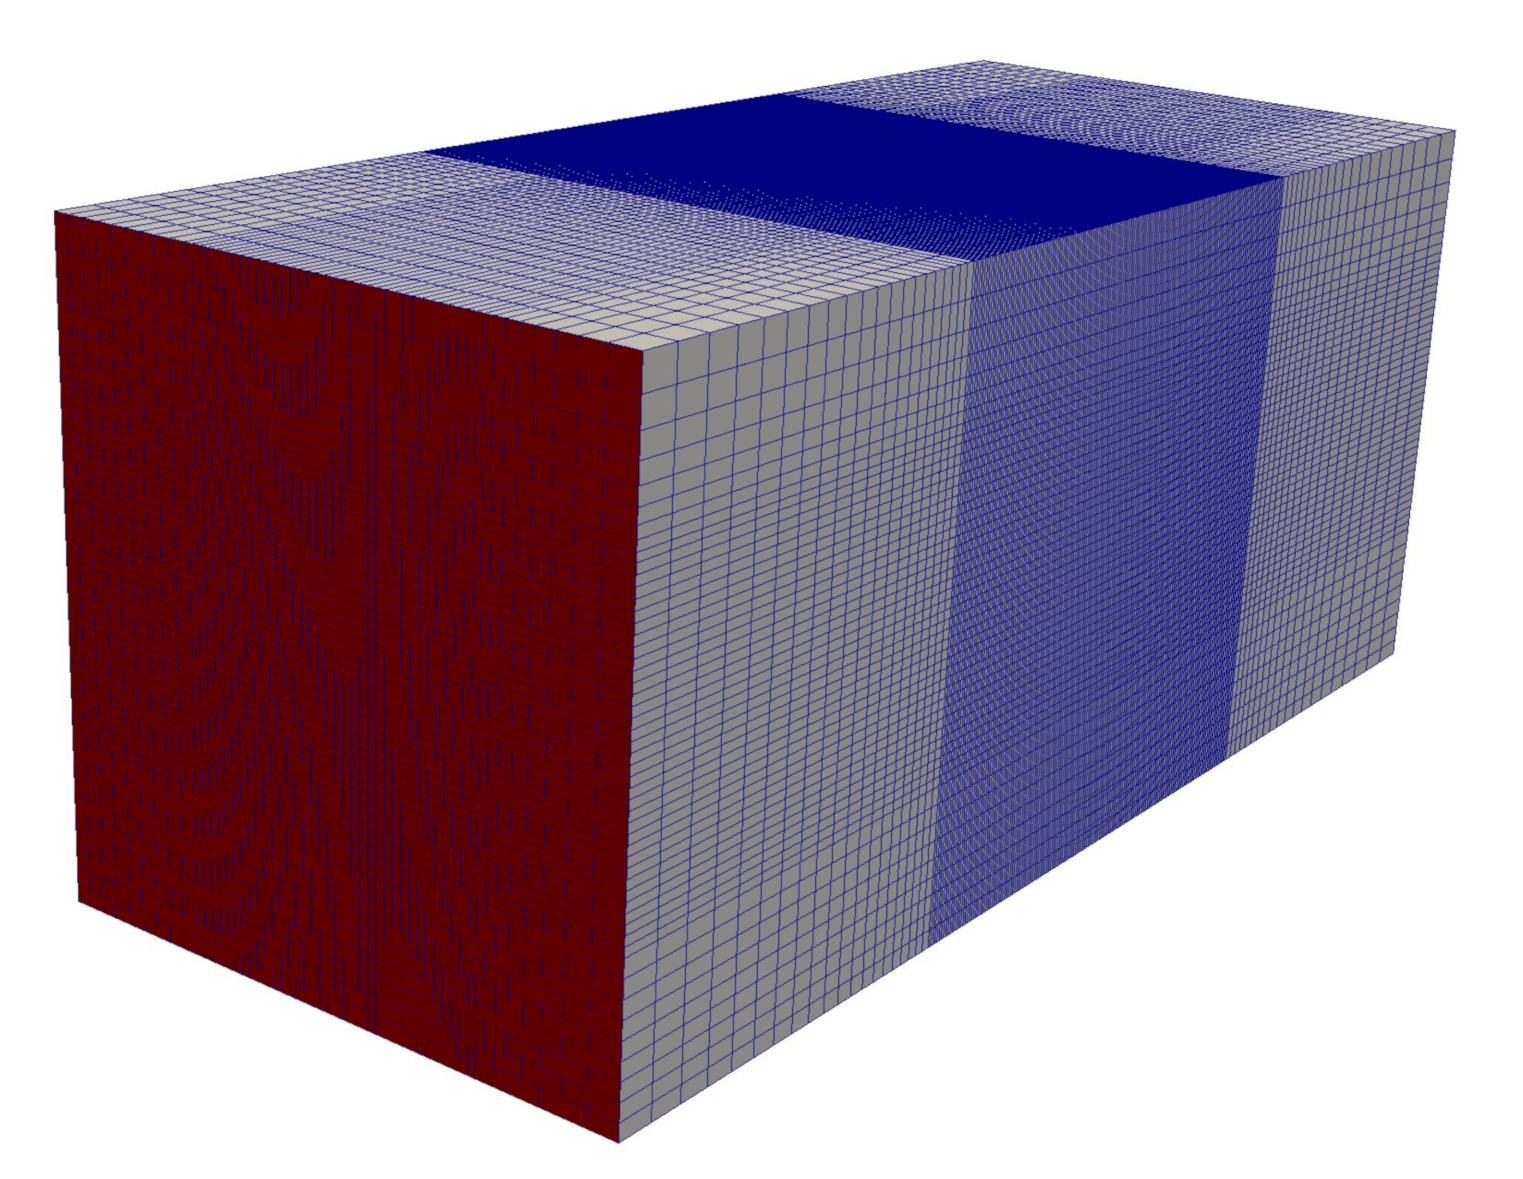
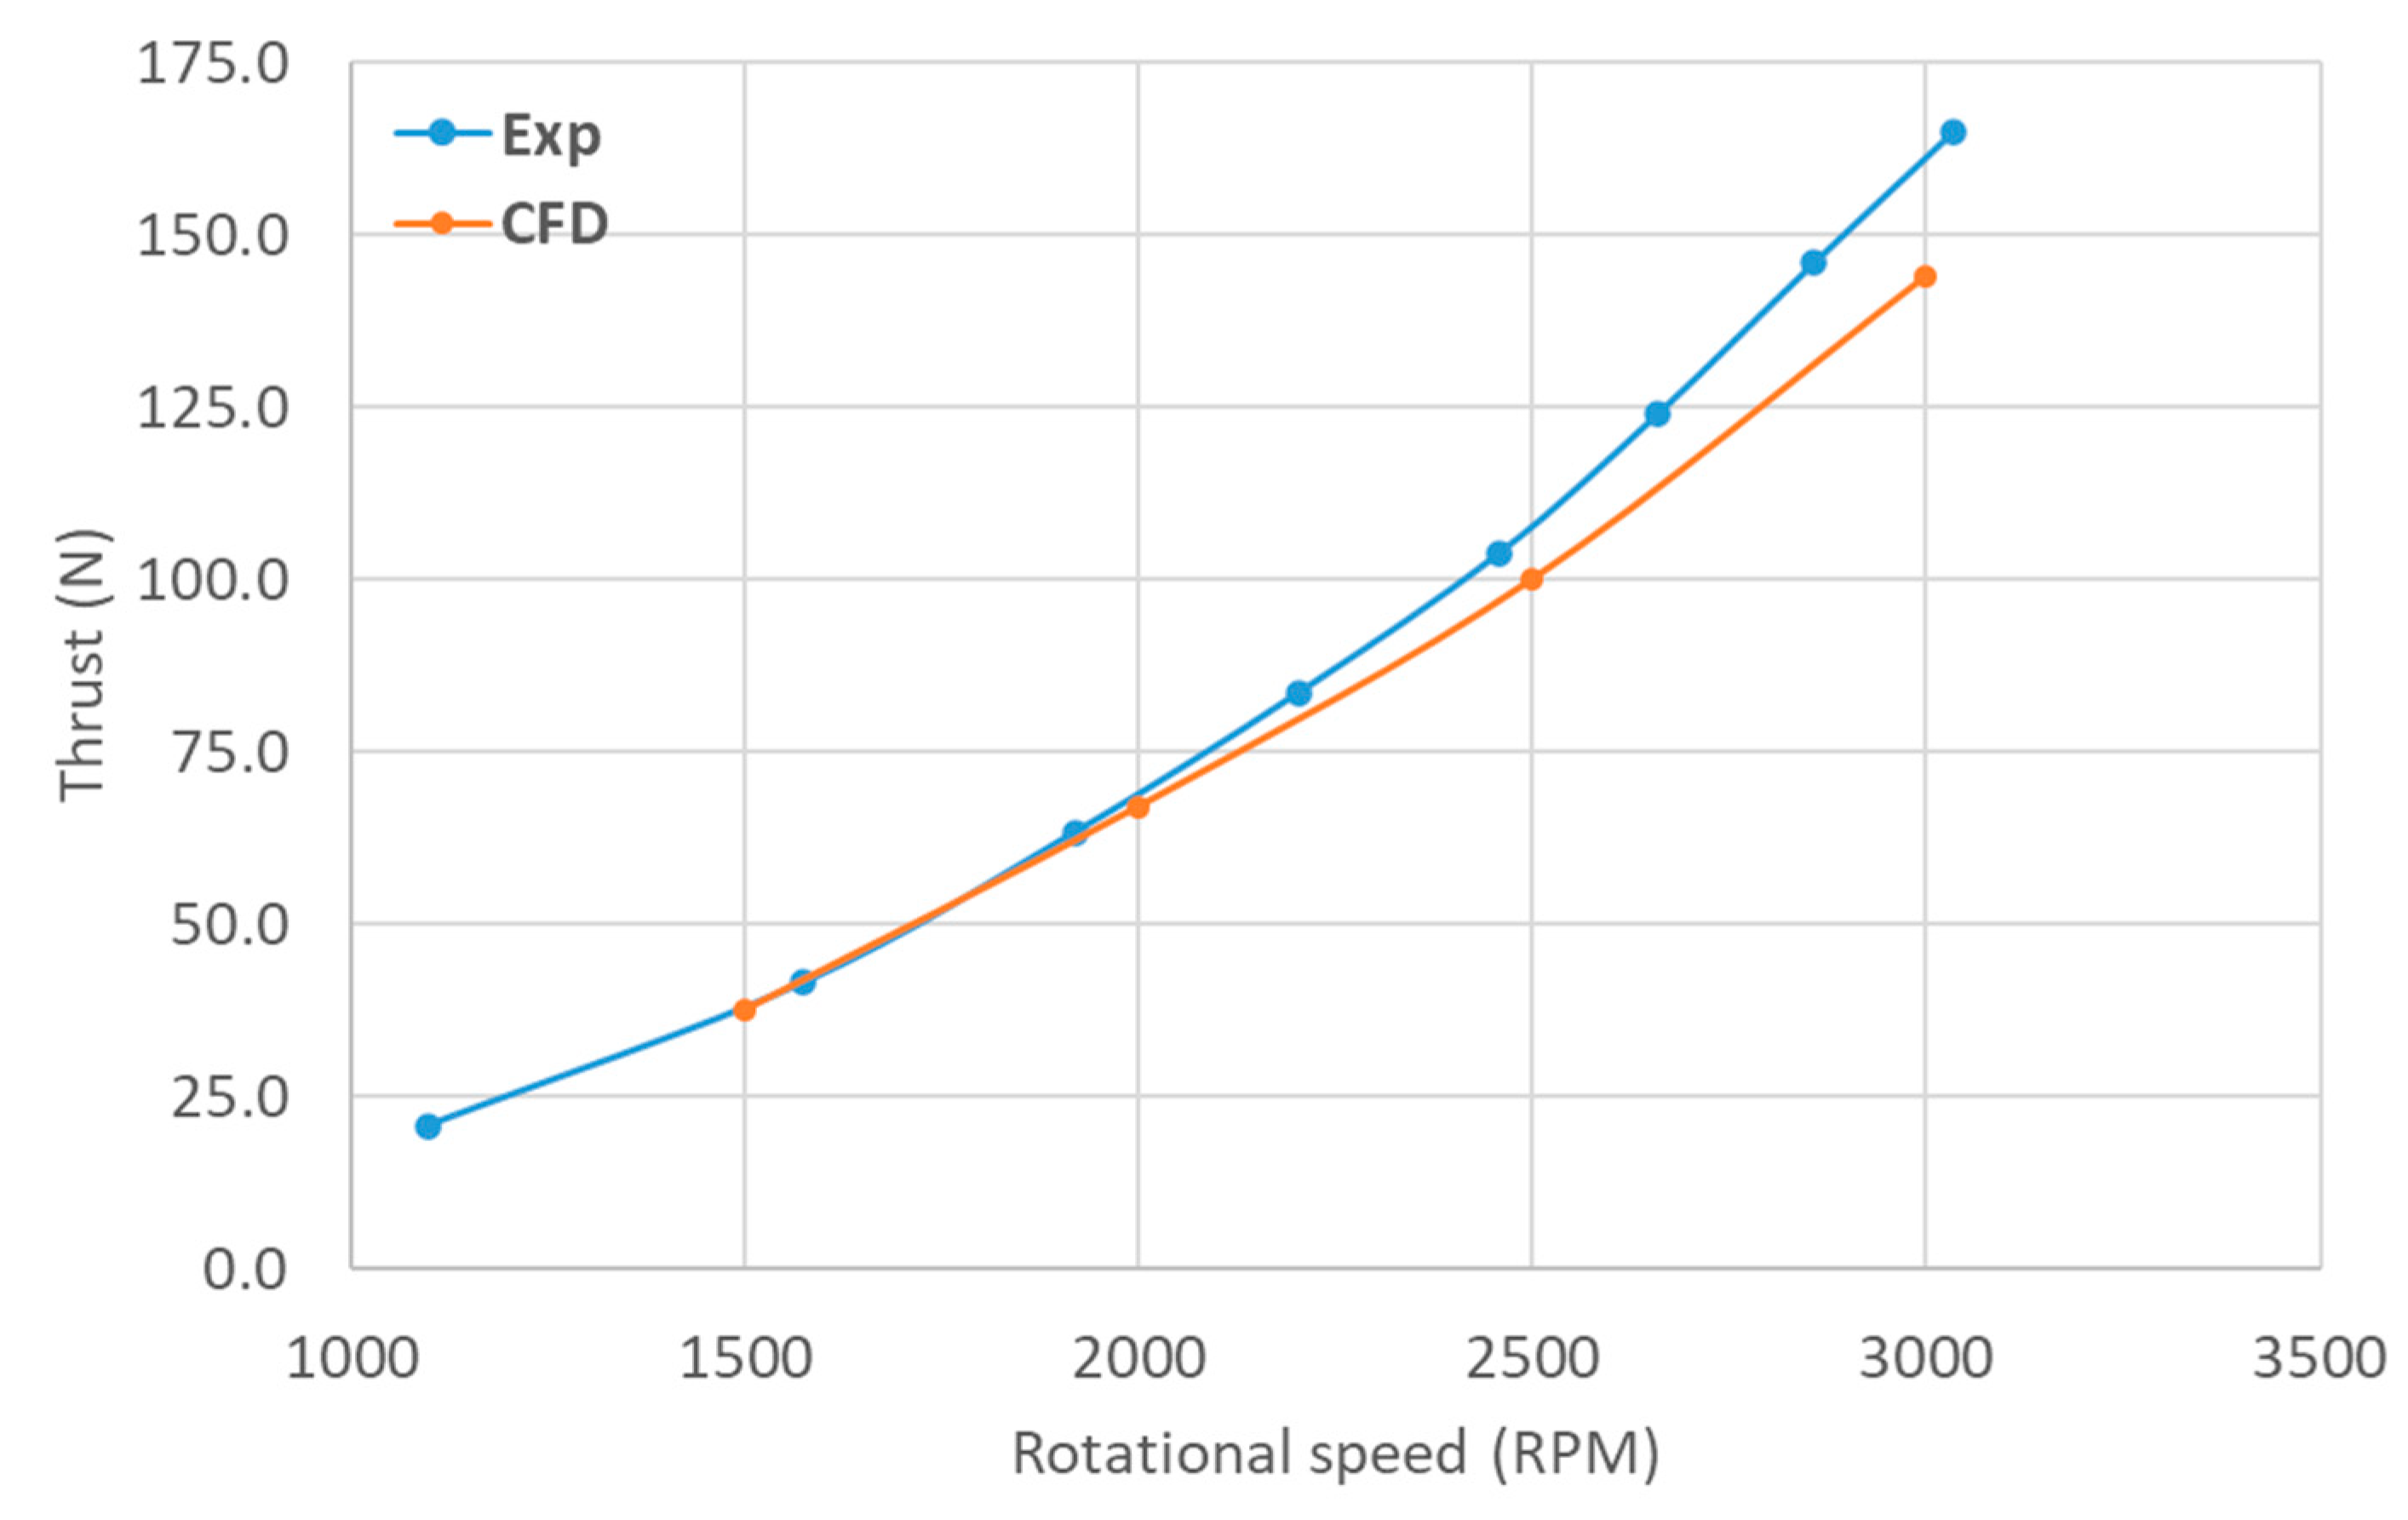
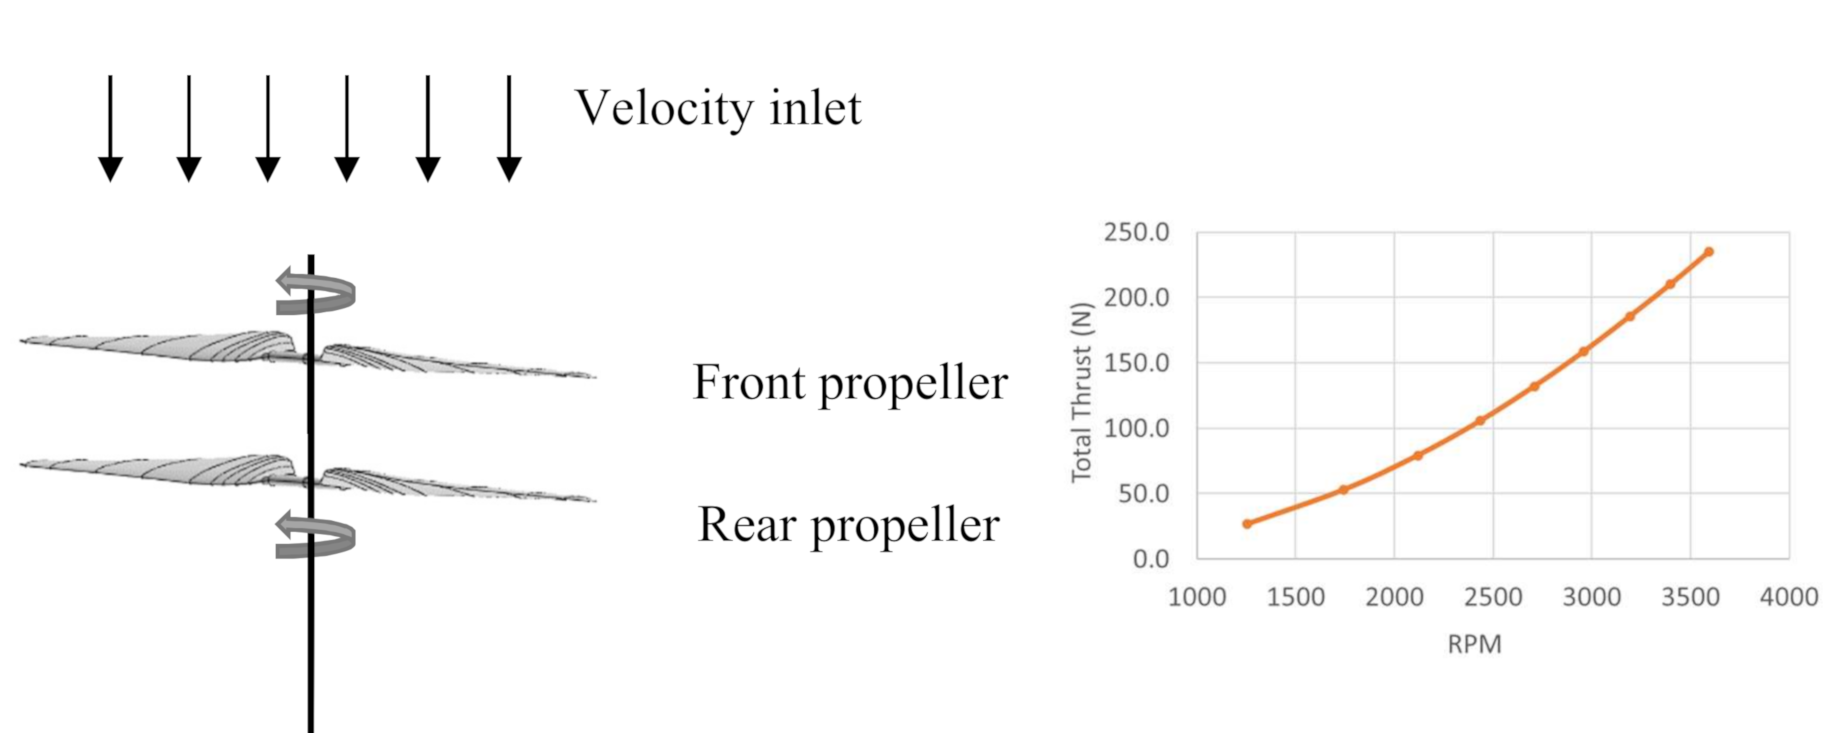
In OpenFOAM, the CFD-BEMT approach is implemented via fvOption and this can be used either using steady solvers such as simpleFoam or unsteady OpenFOAM solver such as pisoFoam. In the present study, only steady-state solver simpleFoam has been used. In CFD, the computational domain consisting of a mesh, boundary conditions, initial condition, etc., is an important step towards full simulations. A 3D computational domain used in the study of single and coaxial propeller is shown in
Figure 5.
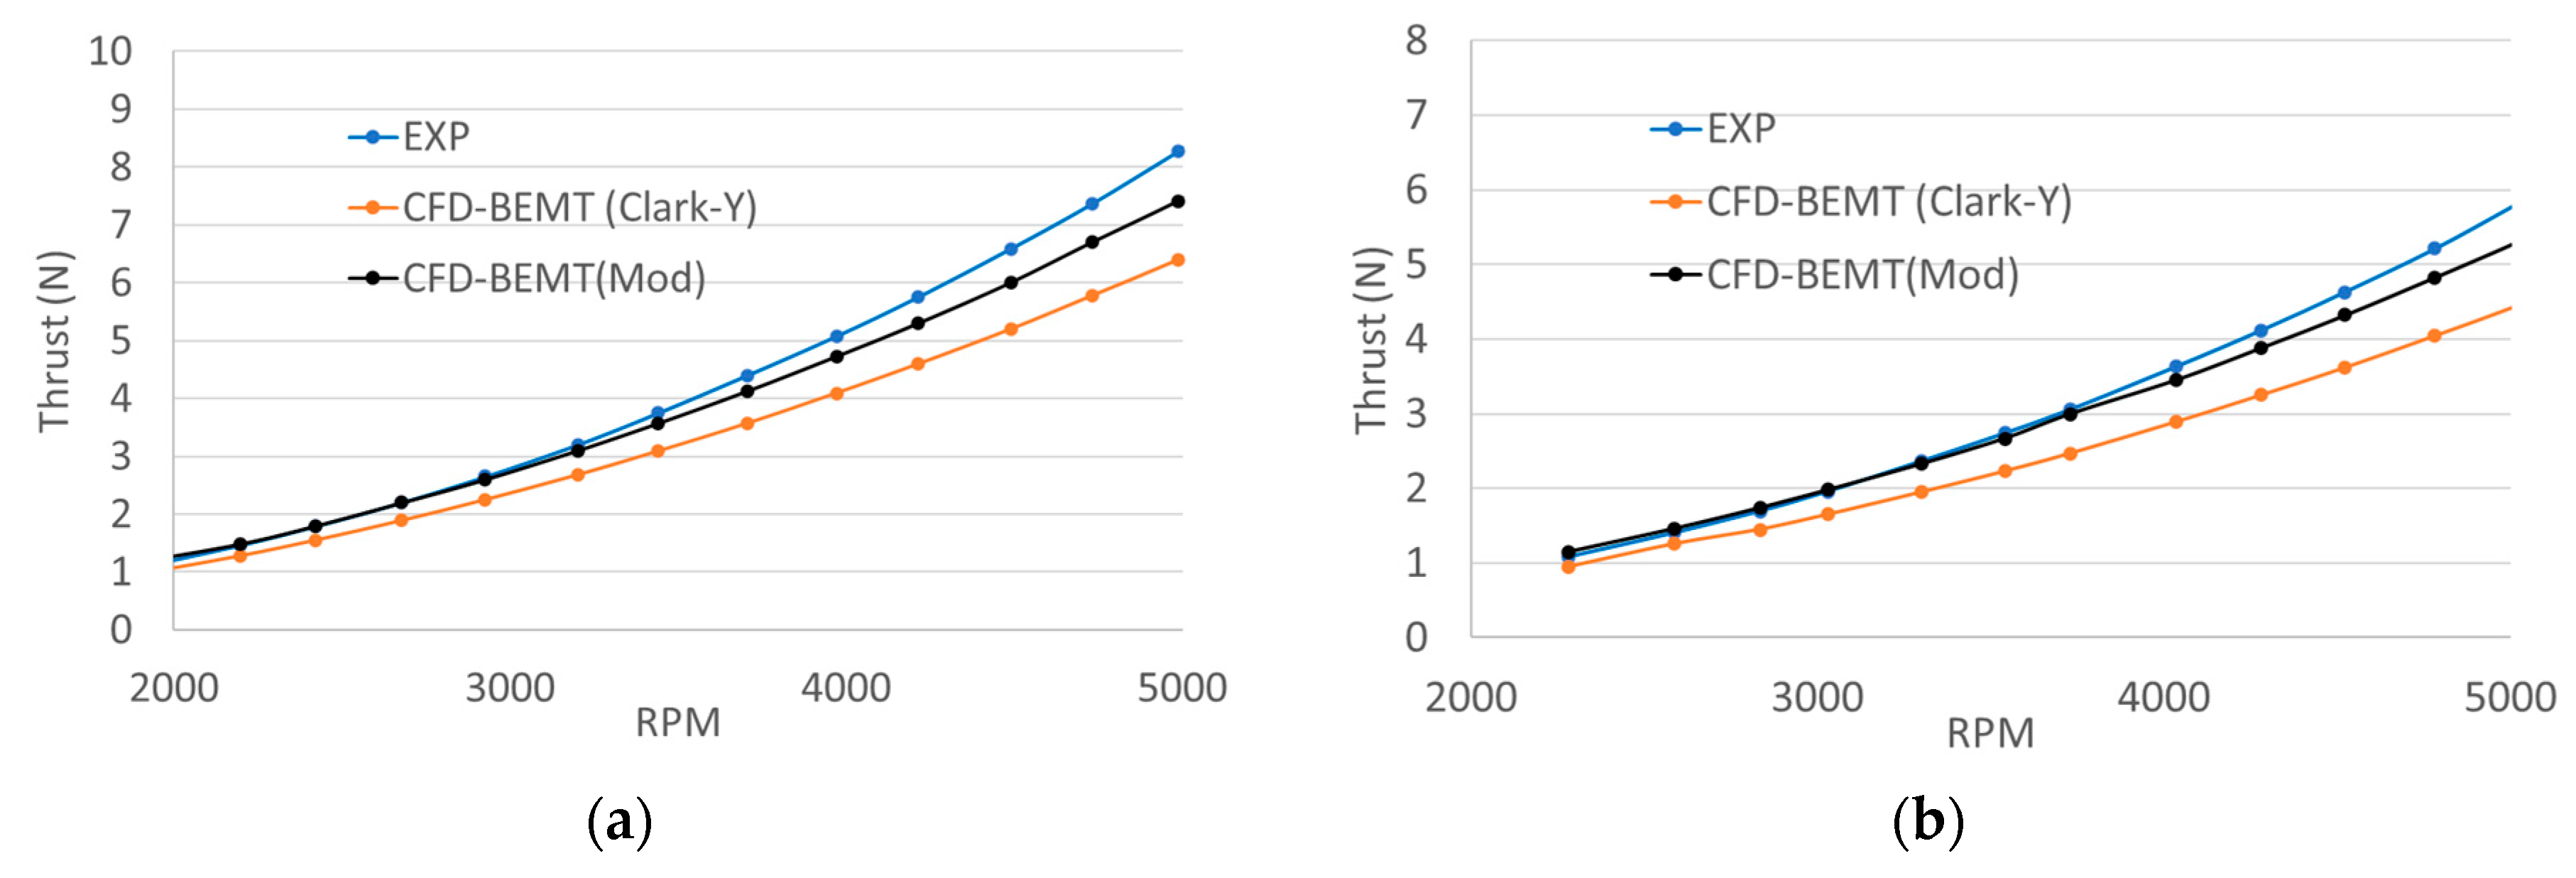
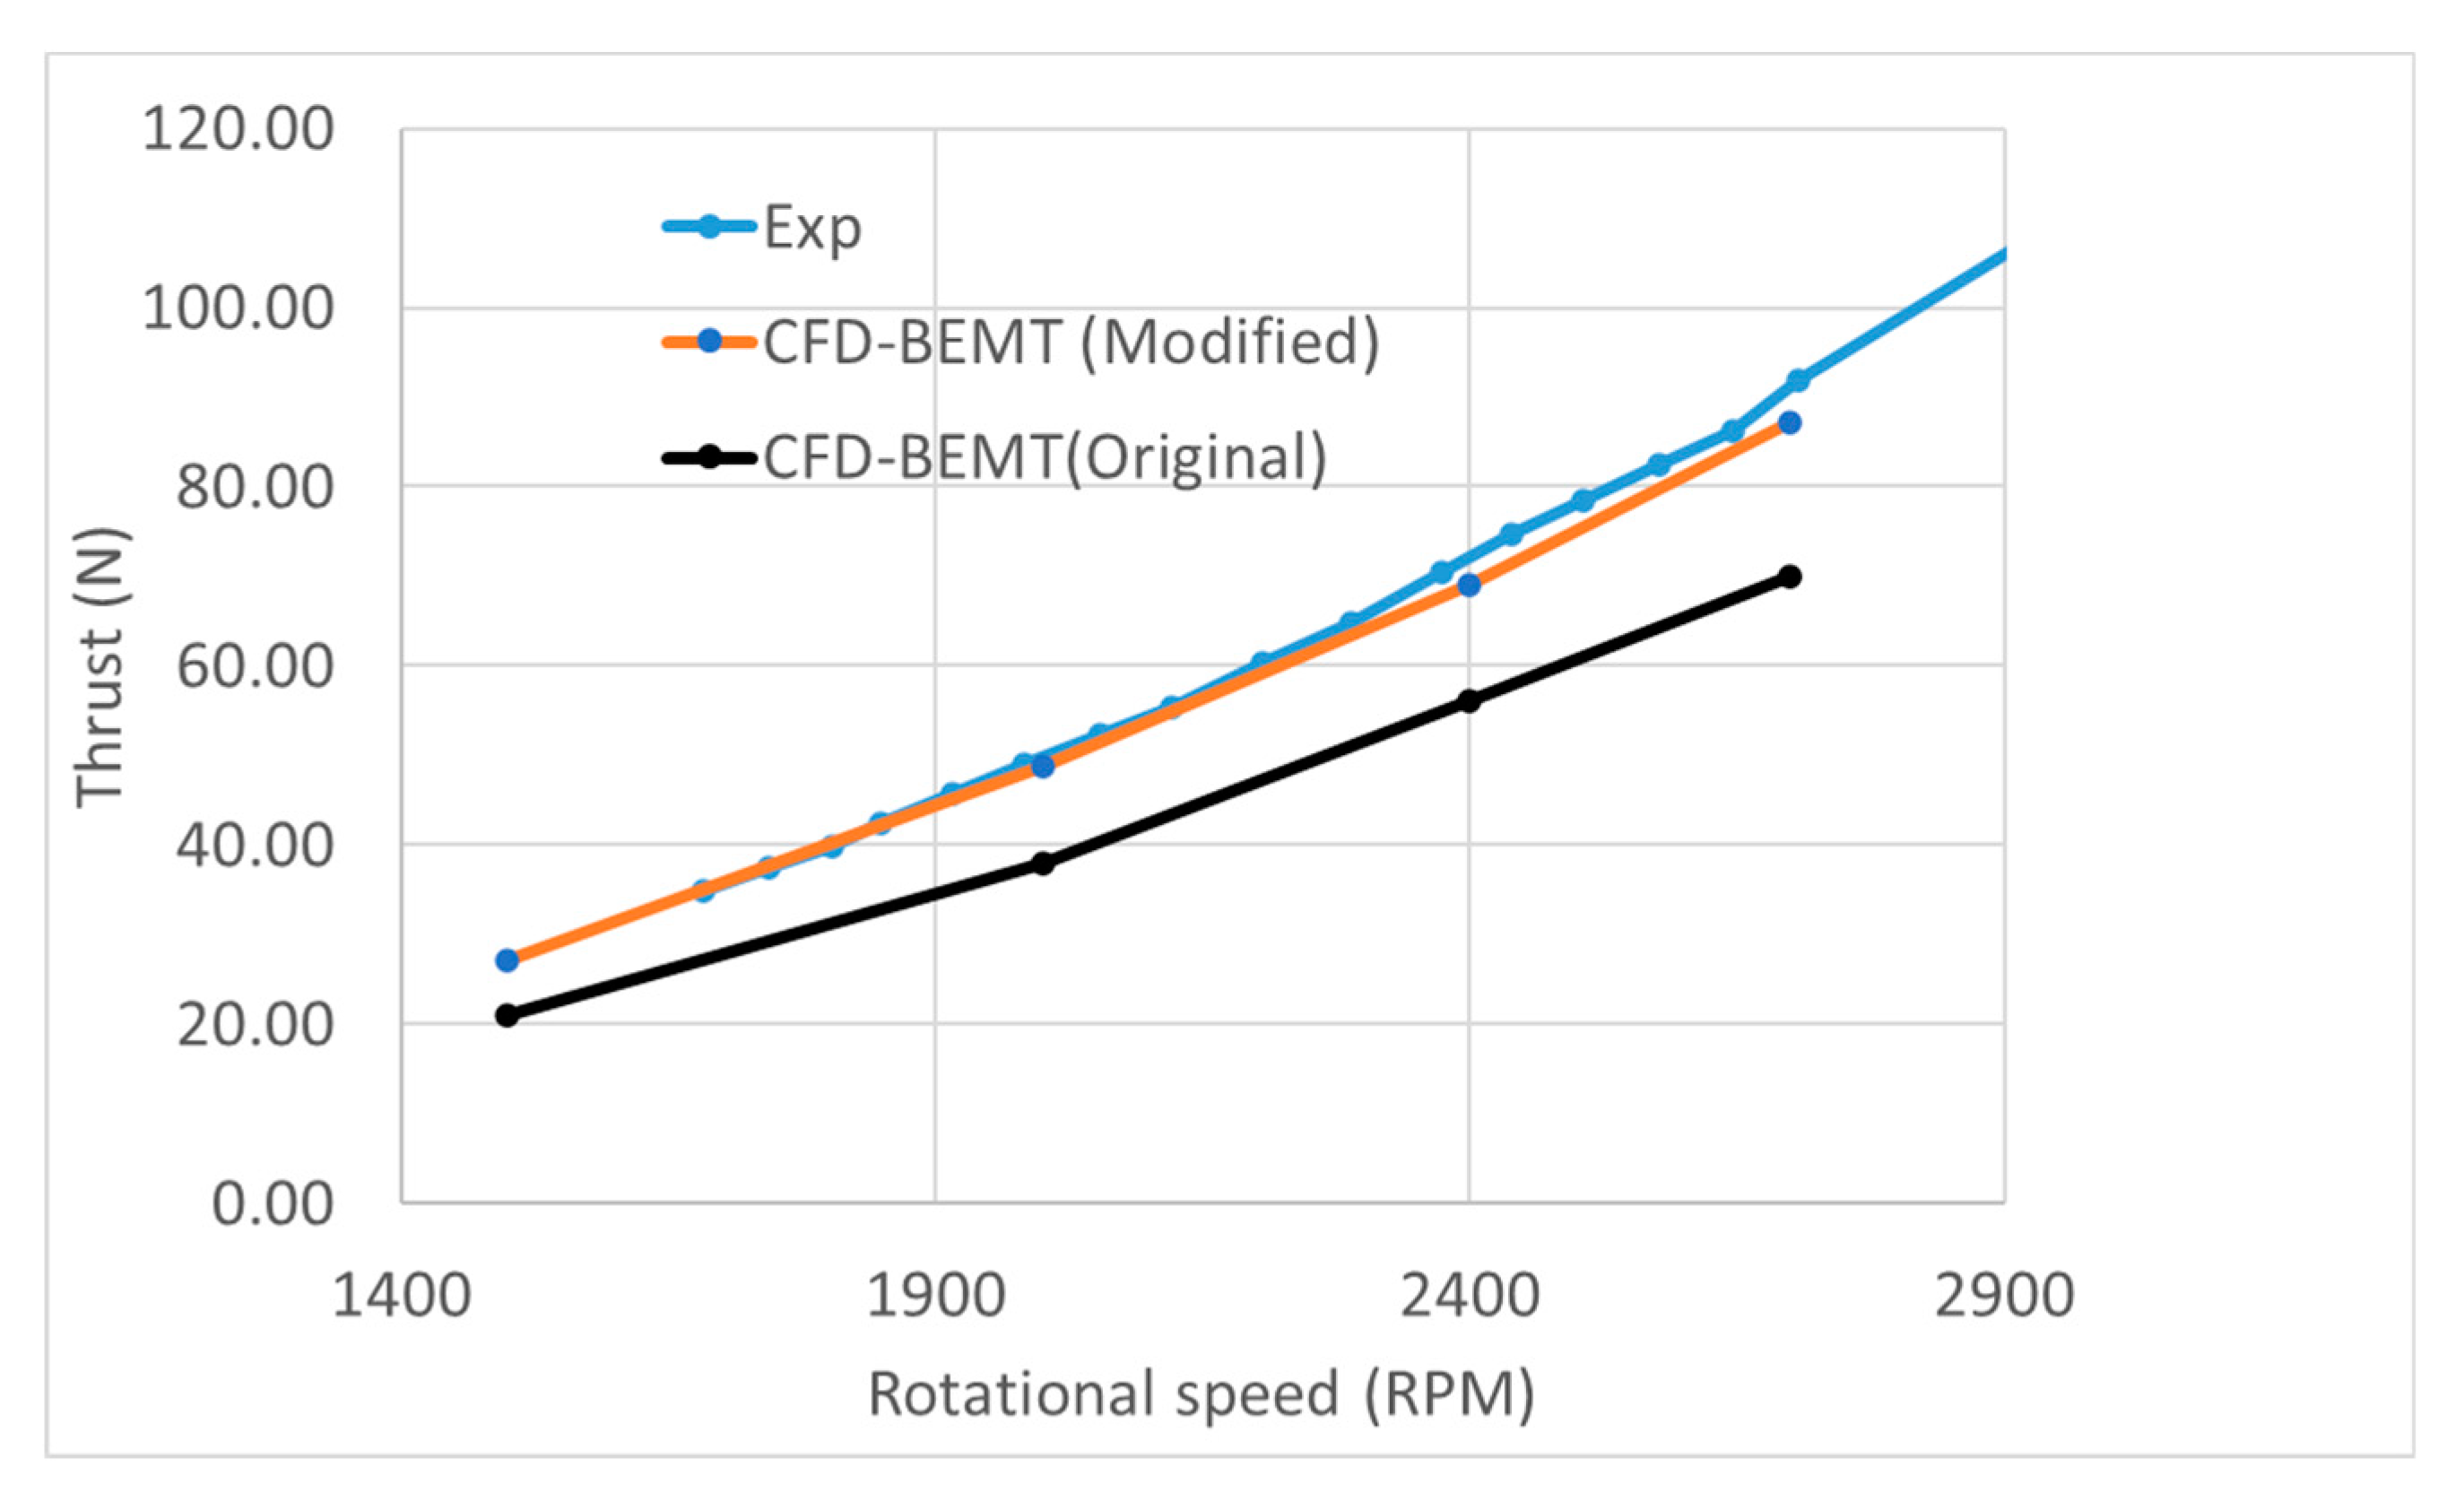
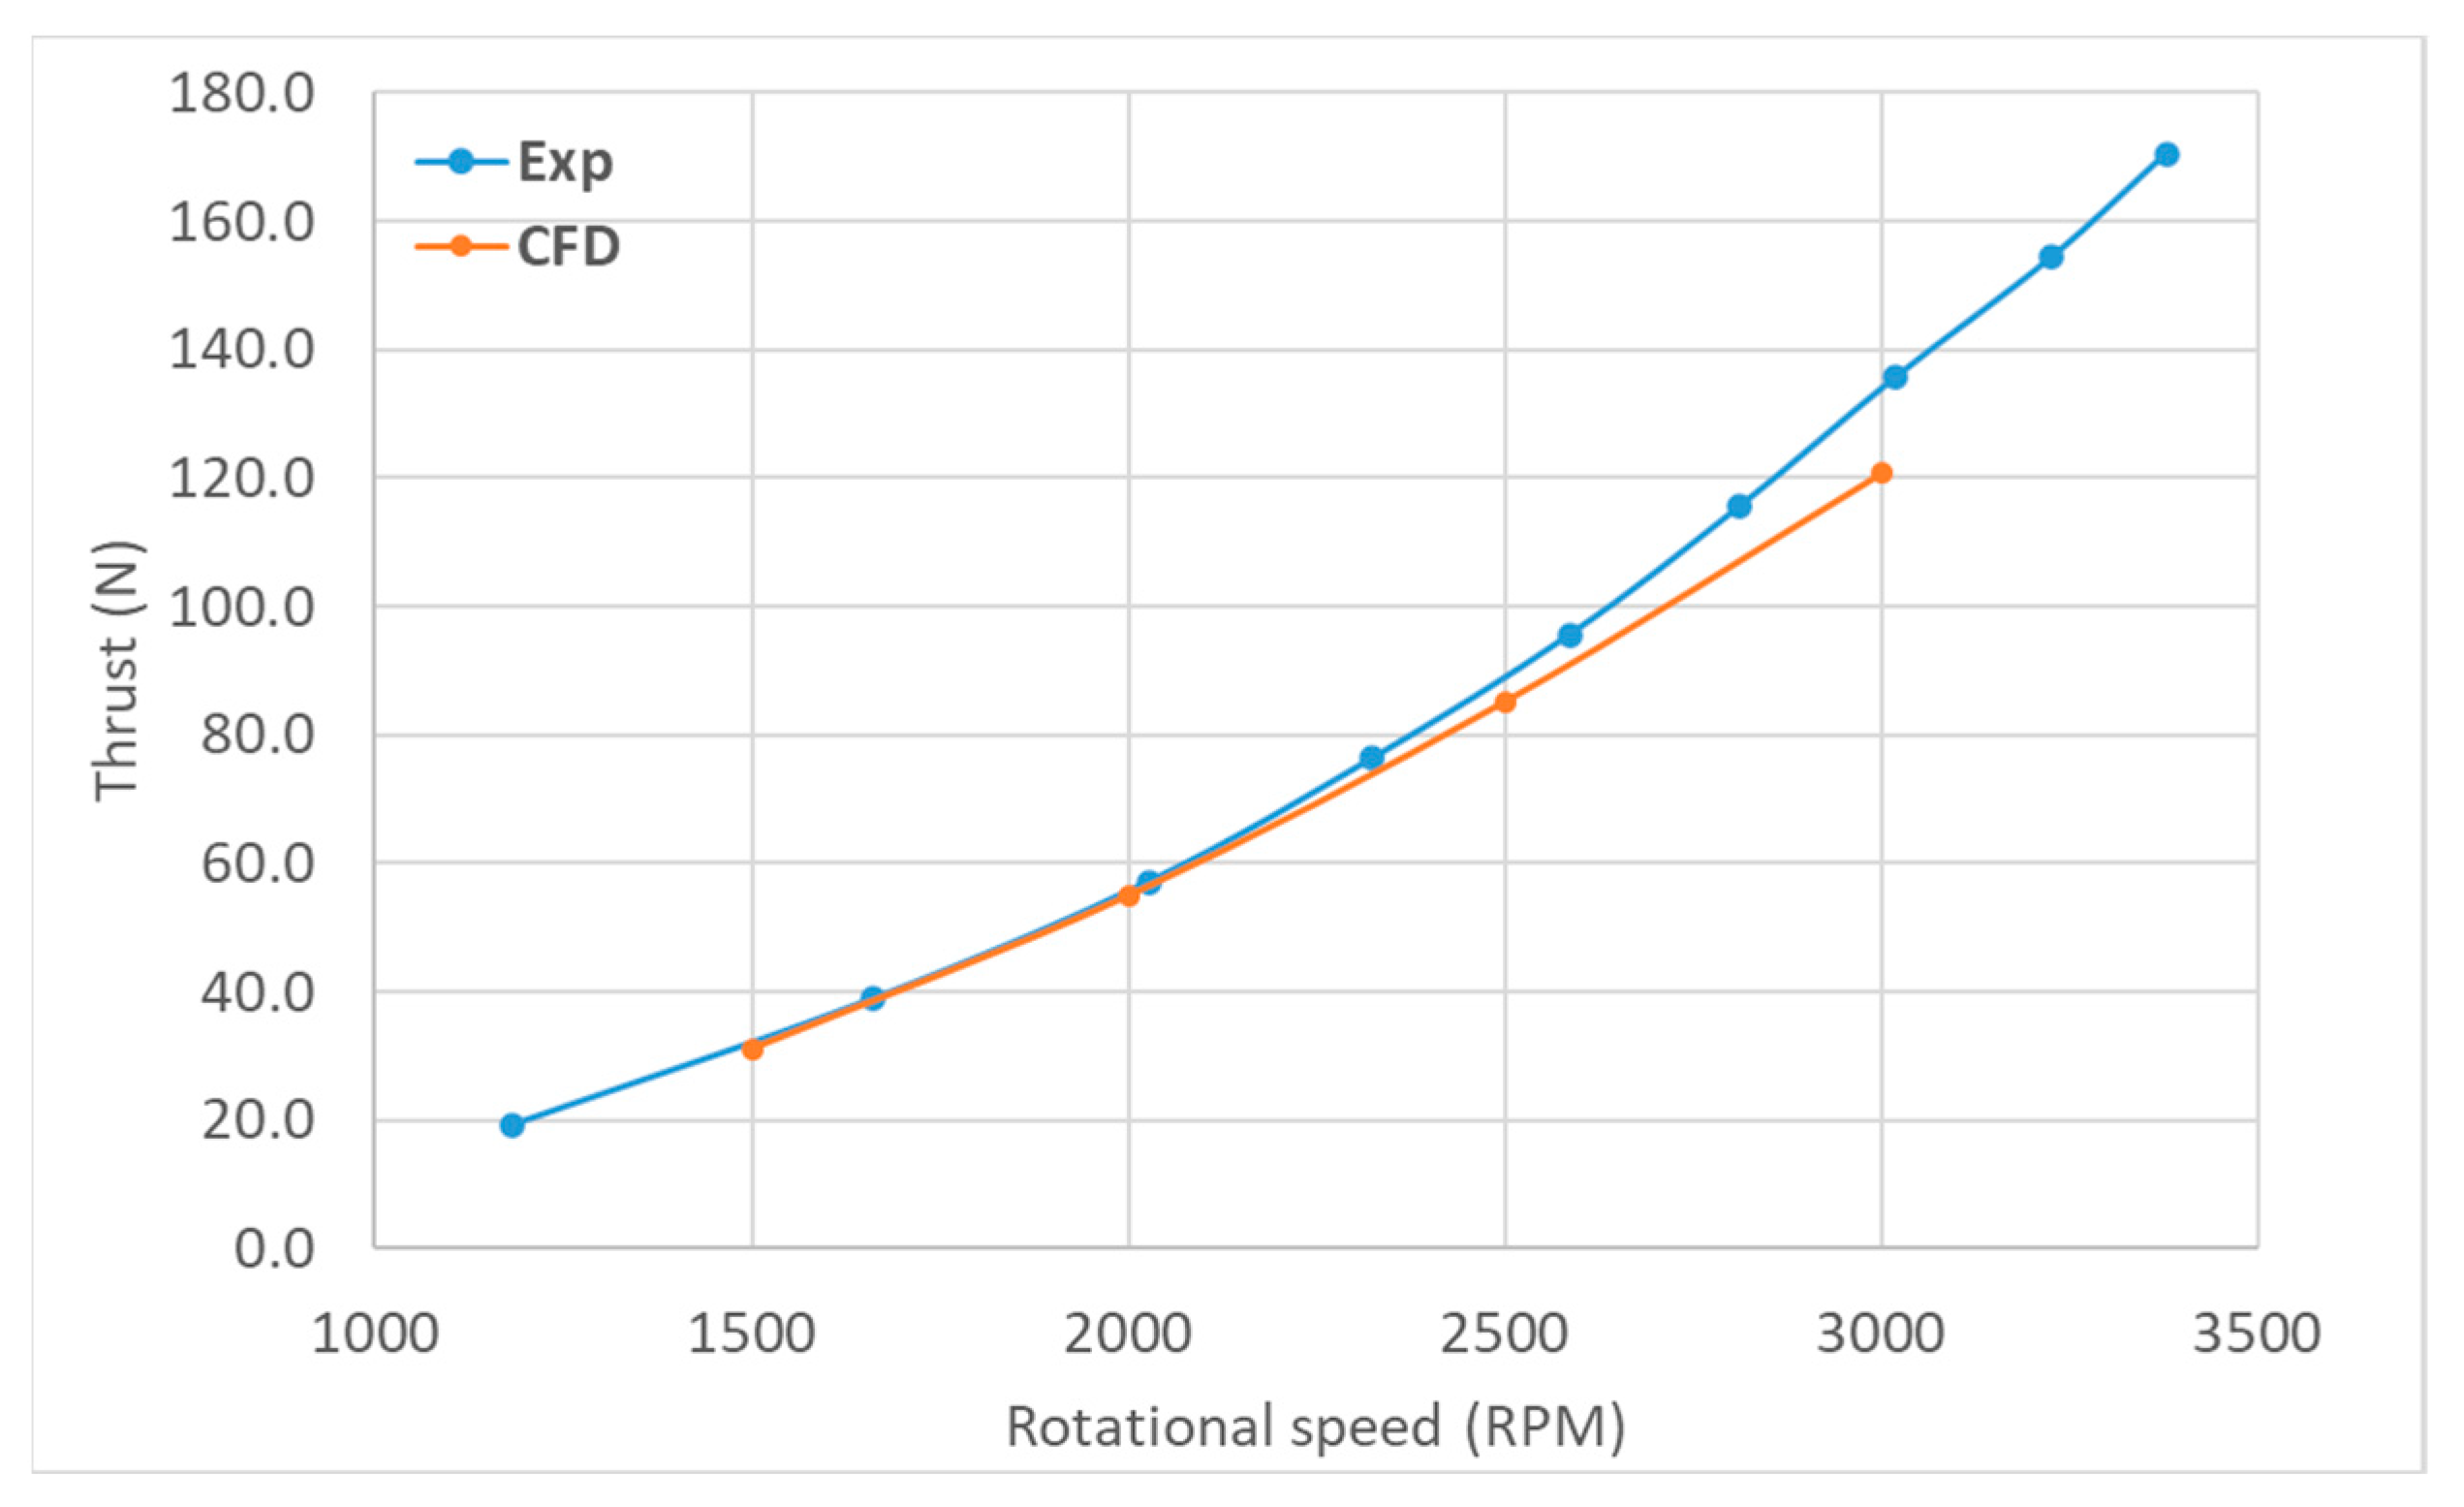
Mesh is generated by blockMesh in OpenFOAM. The mesh around the propeller was refined using appropriate stretching functions. On the left and right sides of the boundary pressure inlet-outlet boundary condition has been used to ensure that the flow can come either left side or right side depending on the propeller rotation direction (clockwise/counter-clockwise). This boundary condition ensures that the flow direction follows the propeller rotation. The other surfaces bottom, top, front and back surfaces are defined as free slip boundary conditions to avoid any disturbances. The Reynolds-averaged Navier–Stokes (RANS) equations in which the SST k-omega turbulence model was used to handle turbulence transport. OpenFOAM simpleFoam solver was used and the simulations were run until flow equations (mass, momentum, and turbulence) residuals were much lower than the prescribed values. The major input parameters needed to run the CFD-BEM approach are lift and drag coefficient of different sections of airfoils, a radius of the propeller, twist, and chord distribution of the blade along the length of the blade, and rotational speed of the propeller. The static thrust of APC 10 × 7 and APC 11 × 7 propellers for a Clark-Y airfoil at various rotational speed is shown in
Figure 6a,b, respectively.
It can be seen from
Figure 6a,b that the predicted static thrust of both the propeller with Clark-Y airfoil is underpredicted compared to the measured data. One of the reasons for this could be the lift and drag coefficients of the airfoil section used in CFD-BEMT simulation are not exactly similar to the one used in APC propeller. APC profiles are based on the modified Clark Y airfoil but in the CFD-BEMT simulations lift and drag coefficients of original Clark Y airfoils have been used. However, there is a significant effect of the lift and drag coefficient on the static and dynamic thrust of the propeller. The CFD-BEMT simulations of both the propeller (APC10x7 and APC11x7) at various rotational speeds were repeated with the airfoil shape nearly similar to the actual geometry. The airfoil section of the APC-SF propeller was scanned by Morgado [
26] at a 75% radius of the propeller and the airfoil section is shown in
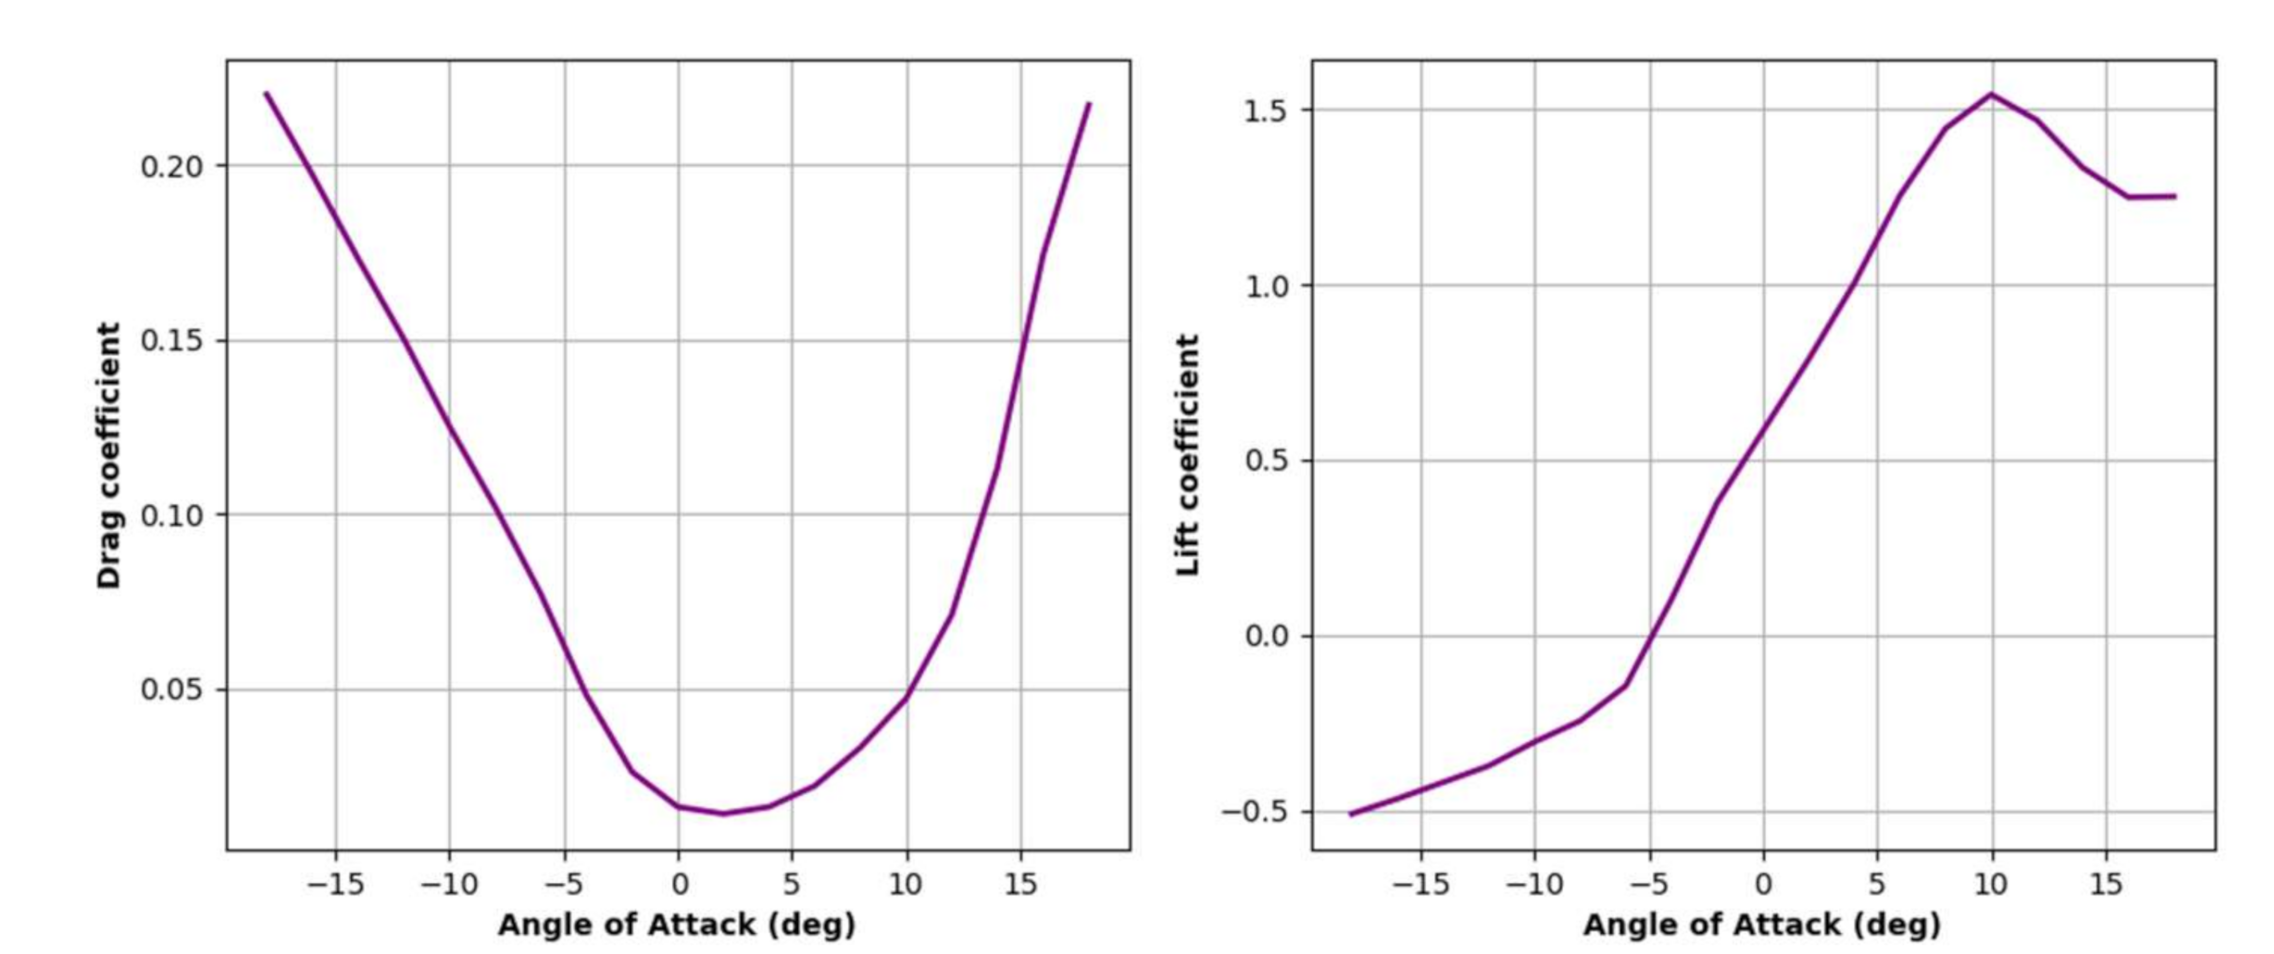
Figure 7. He cut the blade with a vertical band saw machine in the 0.75R position along the blade’s chord. The lift and drag coefficient of the scanned airfoil geometry was used for estimating the lift and drag coefficients. The Reynolds number of the propeller is 50,000, which is defined by the rotational speed of 3000 RPM and a chord at a 75% blade station. Both lift and drag coefficients of the modified airfoil as shown in
Figure 8 were estimated using QBlade at a Reynolds number of 50,000. In the present study effect of rotational speed on the Reynolds number was neglected. The lift and drag coefficient of the modified scanned airfoil is shown in
Figure 8. The modified lift and drag coefficients were used for estimating the static thrust of both APC 10 × 7 and APC 11 × 7 propellers using the CFD-BEMT approach. The predicted static thrust with modified lift and drag coefficient for APC 10 × 7 and APC 11 × 7 airfoil is shown in
Figure 6a,b respectively. The predicated thrust compares well with the measurement data at low rotational speed but at higher rotational speed the CFD-BEMT approach slightly underpredicts the thrust.
The reason for the underprediction could be, the current BEM does not include the effects of ‘3D correction’ due to the rotation of the wind turbine blade and effect of rotational speed on the Reynold number. The ‘3D correction’ accounts for the lift augmentation caused by rotation and these effects dominates at higher rotational speeds. Many studies have shown that the rotation of the blade significantly affects the aerodynamic coefficients of airfoil sections, in particular around stall [
27,
28,
29]. Besides, the lack of aerodynamic data for both high angles of attack and varying Reynolds number leads to difficulty in accurately modelling the propeller performance at higher rotational speeds. In the present study, these corrections have not been included and will be studied in future work [
29].
2.4. The Static Thrust of Reference Propeller
Propellers have constantly faced design challenges to improve efficiencies and operational usages. If quadcopters are to be used, then maximizing their operational efficiency is critical and aerodynamic behavior is very crucial and these propellers have to be designed to meet the specific requirements. Drone propellers need to be designed to generate enough thrust to carry the take-off weight and maintain a good lift to drag ratio. The propeller design parameters include blade number, diameter, section geometry, pitch angle, and twist angle. Studies of a single propeller and coaxial propeller have been performed to estimate the static thrust of the propeller. However, it will be a challenge for many drone developers to design and develop a new propeller to suits their requirements and a common practice is to purchase available propeller with a known diameter and pitch angle. However, these propellers do not include any information regarding the airfoil profile of the propeller blades. A common practice adopted by a drone developer is to purchase a propeller and perform some experimental studies to meet the specified requirements. The drone developer performs static thrust experiments on the propellers to identify the optimum propeller. These tests are time-consuming delaying the overall product development time. To enable faster evaluation of different drone propeller a modeling approach described in the previous section has been applied to the three propellers which have been identified by Sevendof AS for their drone.
Three propellers have been studied: SevenDOF3232 (32 × 11), SevenDOF3234 (34 × 11.5), and SevenDOF3236 (36 × 11.5). The actual names of the SevenDOF32 propellers are not disclosed due to a confidential issue.
The coordinate of various sections of the SevenDOF3232 propeller have been extracted using scanning techniques and these sections are plotted in
Figure 9. The geometry of propeller was retraced by using an Occipital Structure Sensor (Mark I) 3D scanner with ±0.1 mm accuracy. The point cloud was used to recreate the airfoil profile in CAD software with the use of direct measurements with an accuracy of ±0.01 mm. However, the scanning technique is time-consuming and cannot be applied for scanning all the SevenDOF32 propeller. Therefore, the airfoils sections of SevenDOF3232 will also be used for the SevenDOF3234 and SevenDOF3236 as an approximation to the real geometry. The modelling of the propeller requires aerodynamic data of the different sections. A description of the aerodynamic data has been provided in the result and discussion section.
