Abstract
Food security is a longstanding global issue over the last few centuries. Eradicating hunger and all forms of malnutrition by 2030 is still a key challenge. The COVID-19 pandemic has placed additional stress on food production, demand, and supply chain systems; majorly impacting cereal crop producer and importer countries. Short food supply chain based on the production from local farms is less susceptible to travel and export bans and works as a smooth system in the face of these stresses. Local drone-based data solutions can provide an opportunity to address these challenges. This review aims to present a deeper understanding of how the drone-based data solutions can help to combat food insecurity caused due to the pandemic, zoonotic diseases, and other food shocks by enhancing cereal crop productivity of small-scale farming systems in low-income countries. More specifically, the review covers sensing capabilities, promising algorithms, and methods, and added-value of novel machine learning algorithms for local-scale monitoring, biomass and yield estimation, and mapping of them. Finally, we present the opportunities for linking information from citizen science, internet of things (IoT) based on low-cost sensors and drone-based information to satellite data for upscaling crop yield estimation to a larger geographical extent within the Earth Observation umbrella.
1. Introduction
Food security has been a global challenge over the last few centuries. The competence of agriculture food production to support the increasing population has been a global concern for generations. The rapidly growing population has elevated demand for food production systems [1]. Eradicating hunger and all forms of malnutrition by 2030 is still a prime challenge (Sustainable Development Goal (SDG) 2: Zero Hunger) [2]. Still, over 2 billion people do not have regular access to safe, nutritious, and sufficient food [3]. The Food and Agriculture Organization of the United Nations (FAO) estimated that 821.6 million people globally are undernourished of which 278.5 million people are from South Asia [3]. Projections indicate agricultural productions would have to increase by at least 50% by 2050 to fulfill the increased food demand [4,5], most of which is expected to come from improved yields [6].
Cereal crops are the key components of the human diet and livestock feed. The term “cereals” refers to members of the Gramineae family and denotes nine species: wheat (Triticum), rye (Secale), barley (Hordeum), oat (Avena), rice (Oryza), millet (Pennisetum), corn (Zea), sorghum (Sorghum), and triticale (a hybrid of wheat and rye). Cereal crops; specifically rice and wheat are the prime staple food consumed in most parts of the world, especially in Asia and Africa. Therefore, food security is fundamentally a reflection of cereal crop security in these countries [7]. Hence, achieving self-reliance in cereal crop production is an effective way to promote nation-wide food security and achieve the SDG Zero Hunger target.
Traditionally, different direct and indirect measurements of plant characteristics, soil parameters, environmental conditions are being applied to monitor the crop [8]. Ground-based measurements are the utmost accurate monitoring approach. Nevertheless, the approach requires enormous human resources and is time-consuming which makes it costly. More prominently, it’s use is restricted to a smaller area. For agriculture crop monitoring over a larger geographical extent, earth observation (EO) satellite technologies and resulting datasets have been extensively used for decades as alternative methods (e.g., MODIS, Landsat, Sentinel, etc. [9,10,11]). While these datasets are suitable for regional studies, it requires corresponding ground truth data in building a synergy between satellite data and in-situ measurements [12]. Usually, agriculture production from small-holder farmers is dominant in low-income countries [13]. Further, individual farm size is also small in these countries [13]. Hence, coarser spatial and temporal resolution data offered by satellite-based EO systems appear to deliver generic monitoring advice and erroneous yield estimation [9,10,11,14].
Drones [15,16] are becoming new promising platforms for cost-effective spatial data collection as compared to satellite images [17,18]. The ongoing development and improvement of navigation and flight control system, ease of flight at low-altitudes, and ultra-high spatial resolution images (i.e., centimeter-level) offer great data solutions possibilities to monitor the crop development process at the local level. Despite these potentials, drone-based data solutions still face some challenges. Administrative hurdles for securing drone flight permissions [19] in many parts of the world is time consuming and involves a lot of bureaucratic process. Moreover, its application is restricted due to the limited availability of data processing hardware and software facilities. Most of the drone workflows are still limited to research laboratories. Transferability of the acquired knowledge to the farmers’ level in making informed decisions needs further scaffolding and a long way to go.
The rest of the paper is organized as follows: Section 2 defines and describes the terminologies, and highlights the importance of a review focusing on cereal crops. Section 3 presents the importance of cereal crops for ensuring food security, Section 4 highlights impact of the COVID-19 pandemic on food security situations and importance of resilience of small scale local farmers, Section 5 elaborates state-of-the-art of drone and sensor technologies, and Section 6 deals with drone-based data solutions for cereal crops. Finally, the conclusion of this review and recommendations for future research are presented in Section 7.
2. Research Need
Precision agriculture (PA) [20,21] is a data-intensive farm management approach that uses modern information and communication technologies (ICT) to ensure that the crops receive the right amount of nutrients and water for optimum health and productivity. The ultimate goal of PA is to ensure productivity, profitability, and sustainability. The data, repeatedly collected with EO sensors and IoT-based devices are processed to precisely and accurately determine location-specific interventions. The PA system helps in monitoring crop characteristics and agricultural fields, and detecting problems in the early stages so that the right decisions can be made at the right time and right deployment can be targeted to the right locations. Thus, it supports optimization of the crop yield through reduced use of water, fertilizer, and pesticide by significant amounts. The terms like precision farming [21], smart farming [22], satellite farming [21], site-specific crop management [21], and digital agriculture [23] are also commonly used these days with a similar concept.
To present a deeper understanding of the research domain, we systematically reviewed over 200 recent peer-reviewed papers from electronic databases such as Scopus [24] and Web of Science [25]. Search terms included “UAV”, “Drones”, “Cereal Crops”, combined with “Agriculture”. A selection filter was used to consider the literature from 2010 onwards for this review paper. Numerous papers have examined the drone’s applications and their capabilities for various purposes. Many civilian applications of drones have been reviewed by González-Jorge et al. [16]. Further, applications of drones at and by communities have been examined in [15]. Stöcker et al. has presented regulations for drones around the world [19]. The overall use of drones in the field of photogrammetry and remote sensing is covered in [26]. A number of review articles have also focused on examining the contribution of drones to the agricultural domain [22,27,28,29,30,31,32]. The examination of drones for precision farming, in general, has been presented in many papers [22,29,30,32]. Similarly, a number of review articles on the use of imaging sensors for drone platforms are also available [28,31]. The utilization of thermal imageries using drones is examined and discussed by Messina and Modica [28]. Likewise, the use of drone-based imaging sensors for assessment of crop stress including drought, fertilizer use efficiency, and disease detection has been assessed in [31]. Additionally, a review of methods to enhance nitrogen use efficiency has been discussed by Sharma and Bali [27].
To date, the review articles have covered the use of drones for generic precision agriculture mapping and fertilizer use management. However, none of them incorporates the review tailored at a particular crop type e.g., cereals. Cereal crops have short life-span, require more intense monitoring and quick intervention. Hence, we review the key issues and options available for drone-based data solutions (particularly with a clear focus on cereal crops), from the smallholder farmers’ perspective. More specifically, we review the capabilities of promising sensors, algorithms and methods, and added-value of novel machine learning algorithms for local-scale cereal crops monitoring, biomass, and yield estimation, and mapping. We present the opportunities for linking information from the citizen science, internet of things (IoT) based on low-cost sensors and drone-based information to EO satellite data for upscaling crop yield estimation to a larger geographical area.
The main contributions of this review article are as follows:
- An importance of drone-based data solutions for cereal crops to combat food insecurity,
- A historical overview of drone and sensor technologies,
- An inventory of methods and techniques used in various phases of drone data acquisition and processing for cereal crops monitoring and yield estimation, and
- A series of research issues and recommendations for potential future research directions.
3. Importance of Cereal Crops for Ensuring Food Security
Cereal grains are grown in greater quantities and offer more food energy worldwide than any other type of crop [33]. These grains are rich in carbohydrates, fats, oils, protein, vitamins, minerals, and fiber [34]. Cereal products (such as rice, wheat, maize, barley, and sorghum) have a central role in most countries and are staple foods for most of the world’s population [35]. Wheat together with maize and rice was grown on more than 582 million hectares of land in 2017 [36]. In low-income countries, maize, wheat, and rice together share 48% of the total calories and 42% of the total protein consumption [37]. Cereals provide more protein to the human diet than the contribution from animal-based foods like milk, meat, fish, and eggs. Thus, cereals contribute as an important source of protein for over half of the world’s population. Further, they are a rich source of dietary fiber and nutrients. Hence, achieving self-reliance in cereal crop production can perhaps be an effective way to promote nation-wide food security and achieve the SDG Zero Hunger target. However, the food production of cereals is not uniform across the world (Figure 1) and many countries are dependent on their import to meet the minimum calories.
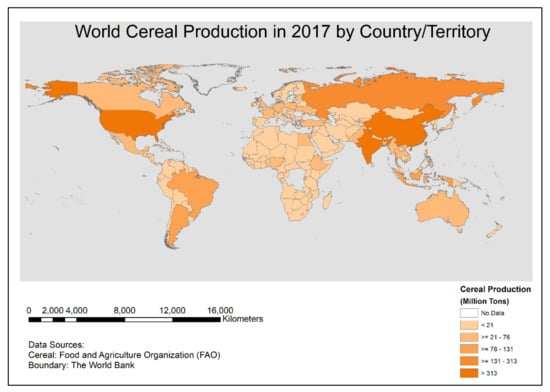
Figure 1.
Global scenario of cereal production (in million tons) in 2017 by country/territory. This map is prepared by authors with the cereal data retrieved from the Food and Agriculture Organization of the United Nations (FAO) and boundary data was obtained from the World Bank.
4. Impact of the COVID-19 Pandemic on Food Security
The COVID-19 pandemic has a severe impact on food production, demand, and supply chain systems [38,39]. Access to key requirements such as seeds, fertilizers, and pesticides might become a limiting factor for food production [39,40]. Disruptions in national food supply chains, financial instability and remittances are further creating severe food insecurity in many countries [41]. Additionally, national food security risks will be compromised by trade and export restrictions, which could be destructive, particularly for cereal food-import-dependent countries [39,40,42]. The problem is worsened by labor (both agricultural and non-agricultural) shortages and disruptions to transportation networks [43]. About 135 million people across 55 countries and territories around the world were experiencing hunger (integrated food security and humanitarian phase classification-IPC/CH Phase 3 or above) before the COVID-19 pandemic [44]. Millions of people are likely to join the list as a result of the COVID-19-triggered recession. The lives and livelihoods of 265 million people (130 million new people due to the pandemic) in low and middle-income countries would be under severe threat due to acute hunger by the end of 2020 [42].
The resilience of small-scale farmers is key to feeding both rural and urban populations in many parts of the world. The food production system is dominated by smallholder farmers who produce more than 70% of the food calories in 83 countries across Latin America, sub-Saharan Africa, and South and East Asia [45]. The production from small-scale farms is extremely important as they belong to rural areas of developing countries where the necessity is the highest. Moreover, the produce from the smallholder farms is generally sold in local marketplaces enabling a smooth supply of food where the COVID-19 pandemic has created complex logistical and transport problems. Moreover, the food supply chain sourcing from the local farms is less vulnerable to travel and export bans and works as a smooth food supply system [43]. Additionally, it offers economic, social, environmental as well as health benefits [46]. Migration of unskilled workforce towards rural areas due to the COVID-19 pandemic [39] and utilization of family labor may empower them to overcome the need of seasonal labor deficiencies (at least in the developing countries where the family size is usually larger and family members have returned to their rural homes due to shutdowns and job cuts in the urban areas) around plantation, harvesting, and sending the product to the market. This might help in reducing the cost of local food production so that local food supply chains may compete with the mainstream supply chain systems as well as empower the local communities with limited income due to the loss of jobs to buy staple foods.
Thus, this review paper aims to explore how the local drone-based data solution can help to combat food insecurity caused due to the COVID-19 pandemic and shocks beyond the COVID-19 like drought, flood, natural disaster as well as man-made extreme events such as social and political disturbances [47] by improving cereal crop productivity of small-scale farming systems in low-income countries.
5. State-of-the-Art of Drone and Sensor Technologies
Drone [15,16] is an aircraft without a human pilot onboard which is controlled either autonomously by onboard computers or through the remote control by a pilot on the ground. Other names like unmanned aerial system (UAS), unmanned aerial vehicle (UAV), low altitude remote sensing, and remotely controlled planes are also commonly used.
5.1. Drone Types and Categories
A wide range of criteria can be used to categorize drones in use for civilian purposes. Common parameters include aerodynamic flight principle, size, payload, flight range, and endurance. These parameters are interwoven. For example, a larger drone has greater payload capacity, higher endurance, range, and vice-versa.
Based on the aerodynamic flight principles, drones are classified into two major types: fixed-wing and multi-rotor [16]. Each of them flies based on different principles and has pros and cons. A multi-rotor drone is propelled by rotors. The propellers are positioned in the same plane, parallel to the ground. It has a mechanism that applies the opposite force to balance the wind; resulting in more stable flight performance. Further, the ability to vertical take-off and landing (VTOL) makes a multi-rotor drone more popular because of its ability to operate in space-constrained situations. Nevertheless, a multi-rotor has low efficiency. On the contrary, a fixed-wing drone requires more space to take-off-and-land and drifts more in windy conditions. However, it generally has higher endurance; meaning one can cover larger acreage with a single battery from the same flying altitude and the sensor (if it is installable). A summary of features of fixed-wing and multi-rotor drones (Table 1) and an illustration of typical drones of the two types (Figure 2) are presented.

Table 1.
Comparative analysis of drone types. There is a wide price range for drones. Low: Starting from 1,500 to 2500 USD, Medium: above 2,500 up to 7,000 USD, High: above 7,000 USD.
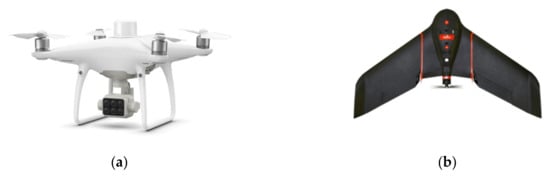
Figure 2.
Types of drones based on aerodynamic flight principles. DJI P4 Multispectral (https://www.dji.com/p4-multispectral/specs), a multi-rotor drone (a); senseFly eBee SQ (https://www.sensefly.com/drone/ebee-sq-agriculture-drone/), a fixed-wing drone (b).
A helicopter can be categorized as a special case of a multi-rotor drone, having only one rotor. Moreover, hybrid drones are being developed nowadays. These drones have a VTOL feature like a multi-rotor but fly like a fixed-wing drone. Thus, they have advantages of the two types. Cost is a major driving factor in the choice of drones where a multi-rotor is comparatively economical. However, the choice depends upon a project’s requirements.
5.2. Applications of Drone Technologies in Geospatial Engineering.
Innovations in drones date back to the early 20th century with their military use. Gradually, focus on drone research for civilian purposes started to develop from the 1990s, beginning with the Environmental Research Aircraft and Sensor Technology (ERAST) project by NASA [48]. The high cost of equipment, limited payload capacity, and unavailability of quality sensors were some of the notable challenges in the early days for their scientific applications. With the development of a wide range of sensors, reduced cost of ownership, and increased reliability and robustness, the drone technology is becoming popular and is being widely used in scientific as well as engineering applications. Applications of drone technologies in geospatial science and engineering are discussed.
Applications of drone for aerial survey and mapping [49,50,51,52,53,54], forest [55,56,57,58], wildlife conservation [59,60,61], agriculture [22,27,28,29,30,31,62,63,64,65,66,67,68,69,70,71,72,73,74,75,76,77,78,79,80,81,82,83,84,85,86,87,88,89], disaster management [90,91,92,93,94], documentation of cultural heritage [95,96,97,98,99,100,101,102], among many others, have been observed over the years. Examples of research cases in each of these domains are summarized in Table 2.
Table 2.
Example of the applications of drone technologies in the geospatial domain.
5.3. Suitable Sensors for Vegetation Scouting
A widespread range of sensors has been reported for vegetation monitoring. The list of such sensors includes inexpensive consumer-grade red-green-blue (RGB) cameras to the most expensive but accurate LiDAR sensors. The use of lightweight multispectral sensors with near-infrared (NIR) and/or Red-Edge bands as well as hyperspectral sensors have also become common because of the spectral separability they offer. Thermal sensors are also becoming common in agriculture monitoring [28,67,71,89,103]. Simultaneous utilization of multispectral, thermal, and RGB sensors for precision viticulture has also been reported [67]. Similarly, the use of thermal sensors for assessing water stress in the agricultural field has been described in the literature [89].
The use of LiDAR equipped drones has also been reported in the literature for a wide range of vegetation monitoring applications; ranging from forestry [55,104,105] to agricultural [80,88,106] applications. They come with a higher precision global positioning system (GPS) and inertial measurement unit (IMU) and offer promising results. However, these systems are very expensive because of the higher payload requirement for the carrier drones and the high cost of LiDAR sensors as well as other necessary high precision sensors like IMU. Hence, the associated high cost is a prime concern for farmers in low-income countries. While consumer RGB sensors are in-expensive, are lightweight, and find a broad range of applications, multispectral and hyperspectral sensors are mostly designed for specific applications (e.g., vegetation monitoring, soil characteristics, rock analysis, etc.). It has to be noted that sensor technology is a fast-growing industry where new and promising sensors are being rapidly developed. Sensors that were available on remote sensing satellite platforms are now becoming available for integration with drones [107], however, they are still unaffordable to many users. Only typical sensors available for integration with small drones for vegetation monitoring are presented in Table 3.
Table 3.
Typical sensors available for small drones. Wide varieties of sensors ranging from consumer RGB digital camera to multispectral, hyperspectral, thermal, and LiDAR sensors fitted on drones are in use in vegetation/agriculture applications.
Generally, a smaller multi-rotor drone comes equipped with a company-fitted digital camera with an RGB sensor. However, consumer RGB sensors have limited application in vegetation monitoring given overlapping of spectral bands in these sensors [108]. Moreover, the interpolation algorithm applied in such cameras for simulating a realistic appearance to the human eye [109] brings in interpolated pixel values, thereby lowering the radiometric quality of the images. This is an undesirable process for qualitative remote sensing. Researchers have experimented with modifying the RGB camera by removing NIR blocking filter and replacing it with a visible (generally blue or green) band blocking filter [109] so that vegetation analysis can be performed effectively. However, poor performance has been reported because of the high vignetting effect on the vegetation indices calculated with visible and infrared bands like the normalized difference vegetation index (NDVI) [109]. Yet, comparable results with those from professional-grade sensors can be obtained after reducing the vignetting effect from the modified camera [65]. Nonetheless, the correction/reduction methods are camera dependent or require a large set of images with different acquisition and illumination scene conditions [109].
To overcome the limitation of RGB sensors, a professional but lightweight multispectral sensor with a NIR/Red-Edge band or a hyperspectral sensor can be employed. Larger drones are equipped with sensor swapping facilities so that multispectral and hyperspectral cameras and other sensors can be installed (Figure 3b). On smaller consumer drones, however, customization facilities are provided, where an additional sensor (generally, a multispectral sensor) is attached along with the existing company fitted RGB sensor Figure 3a.
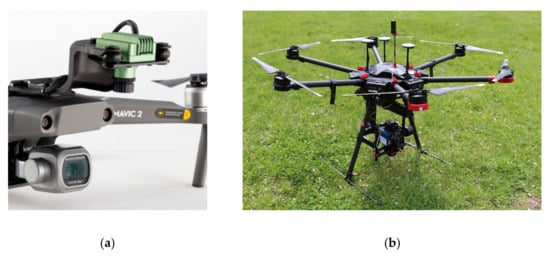
Figure 3.
Options for multi-spectral sensor installations on small drones. Installation of Sentera NDVI camera (https://sentera.com/dji-ndvi-upgrade/) on Mavic 2 (https://www.dji.com/mavic-2) in addition to the company fitted RGB camera (a); a gimbal suitable for installing a select/swappable sensor (a GPS/IMU, a thermal and a hyperspectral) on DJI M600 Pro (https://www.headwallphotonics.com/blog/airborne-integration-considerations) (b).
6. Drone-Based Data Solutions for Cereal Crops
6.1. Use of Drones for Cereal Crop Scouting
Drones have found to achieve a multitude of aims in agriculture applications. Their application ranges from growth monitoring, biomass, and yield estimation to fertilizer, weeds and pest management, water stress assessment, among others. The major application areas of drone-based data in precision agriculture are presented in Table 4.
Table 4.
Application of drones in agriculture. ER: exponential regression, Log: logarithmic regression, LR: linear regression, MLR: multiple linear regression, RF: random forest.
6.1.1. Crop Monitoring
Researchers have explored the use of drones for growth and health monitoring of cereal crops. They have experimented with a wide range of criteria, ranging from plant height to various vegetation indices, and sensors from RGB consumer cameras to LiDAR sensors. Canopy height extracted from drone-based point cloud data derived from photogrammetry with a moving cuboid filter has been used to monitor winter wheat [135]. Likewise, NDVI and Red-Edge NDVI (RENDVI) indices have been used to study maize crops [73]. The use of color indices (CIs)/vegetation indices (VIs) to monitor different cereal crops has been reported in the literature [77,131,136]. Few researchers have replaced the red band with NIR by using a red band blocking filter and records data in Green-Blue-NIR bands [136]. Christiansen et al. [88] have used a LiDAR sensor mounted on a drone to monitor winter wheat. Likewise, the relationship between plant height obtained from drone-based LiDAR and the lodging degree of maize has been studied [106].
6.1.2. Biomass Estimation
Biomass estimation of cereal crops has been reported in various studies. Like crop monitoring, plant height, RGB-based color indices as well as NIR/Red-Edge-based vegetation indices have been used to estimate crop biomass. Canopy height obtained from RGB images is used in many studies [17,133,137]. The combination of vegetation indices and plant height derived from drone RGB imagery has shown a high potential for maize biomass estimation [66]. Table 4 presents examples of combining VIs for estimating biomass. Furthermore, the use of NIR/Red-Edge-based VIs has been reported to estimate cereal crops biomass [18,65,83]. The use of multi-sensor data (multispectral, hyperspectral, and RGB cameras) for biomass estimation of barley has been reported in [74].
6.1.3. Yield Estimation
Yield estimation of cereals using plant height [137,138], CIs/VIs [18,65,75,81,82,132,138] derived from RGB, multispectral and/or hyperspectral sensors are available in the literature. An image processing method combined with the K-means clustering algorithm with a graph-cut (KCG) algorithm on RGB images collected using a multi-rotor drone is utilized to estimate rice yield [139]. Similarly, NDVI alone is used to estimate rice yield [18]. The rice yield is predicted with single-stage and multi-temporal VIs derived from multispectral and digital (RGB) images [132]. Spectral indices, ground-measured plant height, and height derived from drone hyperspectral images were used to predict the winter wheat yield [138].
6.1.4. Fertilizer, Weeds, Pest, and Water-Stress Assessment
The impact of applied fertilizer on yield and/or biomass estimate has been investigated in many studies [27,65,69,79,82,88]. A consumer-grade camera was used to assess wheat N status and grain yield [65]. The study used developed vegetation indices using blue (B), green (G), red (R), and near-infrared (NIR) bands. Further, the study finds that indices developed using R-G bands could differentiate unfertilized and fertilized plots. In a different research, correlation of high-resolution NDVI with fertilizer application level, and yield of rice and wheat crops were assessed [82]. Crop height derived from LiDAR point clouds was correlated to the applied nitrogen treatments [88].
Additionally, weeds [62,86,140] and disease detection [63,64,72] studies with the help of drone-based data have also been carried out. A semi-automatic object-based image analysis (OBIA) procedure was developed with random forest (RF) combined with feature selection techniques, was used to classify soil, weeds, and maize [86]. Multispectral [63] and hyperspectral [64] drone images were used to map crop diseases in wheat. The studies used deep learning methods for disease detection and mapping [63,64]. While Su et al. [63] explore spectral vegetation indices (SVIs) with RF classification method to accurately map healthy and yellow rust infected areas, a deep convolutional neural network (DCNN) based approach was utilized by Zhang et al. [64].
About 70% of freshwater is utilized in the agriculture sector [141]. Therefore, proper management of water in this area is of paramount importance. Drones can better be utilized to assess water stress levels in agricultural fields [89,134,142]. Zhang et al. [134] has demonstrated the use of multispectral drone images as promising data for water-stress assessment in the maize field. They found strong relationships between crop water stress index (CWSI), calculated by on-site measurements and transformed chlorophyll absorption in reflectance index (TCARI)/soil-adjusted vegetation index (SAVI) ratio, derived from drone images as well as CSWI and TCARI/renormalized difference vegetation index (RDVI) ratio.
6.2. Crop Characteristics and Modeling Methods
6.2.1. Correlating Crop Characteristics with Remote Sensing Data
Remote sensing of crop yield depends on crop properties that vary according to the growth stage, type, varieties, and health. These properties can be related to plant height and several indices derived from RGB, multispectral, and hyperspectral images. Efforts have been made to developing and/or improving vegetation indices to better understand the characteristics of the crops. These indices use spectral reflectance from specific wavelengths recorded by the remote sensor. The foliage is found to be very reflective and absorptive respectively in the NIR and red bands. Therefore, NDVI, which is derived using information recorded in these two bands, is perhaps the most widely used index to monitor vegetation health and dynamics. In addition to NDVI, other VIs/CIs are also used in the literature to address the issues like atmospheric effects, canopy background, among others. Some of the indices are visual atmospheric resistance index (VARI), normalized green-red difference index (NGRDI), excess green (ExG), excess red (ExR), excess green minus red (ExGR), color index of vegetation (CIVE), and vegetation index (VEG). Major indices (either generic for vegetation analysis or more relevant to crop assessment), their formula, and the literature are provided in Table 5.
Table 5.
Vegetation indices for crop analysis reported in the literature adopted from [132], [66], and [79]. R, G, B, RE, and NIR signify digital numbers (DNs) in Red, Green, Blue, Red-Edge, and Near-Infrared spectral bands, respectively whereas r, g, and b represent normalized DNs values of R, G, and B bands, respectively. is radiance with spectral band wavelength λ.
While some studies have used plant height alone [17,133,143,144], others have used vegetation indices and plant height [66,81,145]. In addition, use of single index [18,82] and multiple indices were also reported in studies [66,69,73,77,79,83,132,145]. Usually, VIs derived using multispectral images provide a better relationship with yield data than those obtained from the color image [132]. However, Zhou et al. [132] have reported a higher correlation with color indices in the early growth stage of rice, which behaved poorly after the heading stage. Hence, no consensus is available on which of the two sensor types is the best. Nonetheless, the fusion of multi-sensor data and/or indices monitored over time has shown stronger relationships [74,132].
6.2.2. Comparative Analysis of Cereal Crop Modeling with Machine Learning Methods
The methods to predict crop biomass and yield using remote sensing data can be grouped into three broad categories: (1) physics-based methods, (2) crop simulation methods, and (3) regression-based methods. The physics-based methods only consider individual crops and require soil-related parameters. The simulation methods offer many benefits (e.g., are dynamic, parameters can be tuned as per growth stage and consider growth development), however, they also require the inclusion of changing meteorological situations, agricultural practices together with crop and soil parameters, among others to predict crop yield [165]. Applying simulation methods to a larger extent can be challenging because of the enormous need for diverse data mentioned above [165]. Furthermore, the unavailability of large-scale data may result in inaccurate yield estimates. On the contrary, regression-based methods are site-dependent, are less data-hungry, and are well suited for local scales. Here, we deal with regression-based methods in this review.
While numerous studies have used traditional machine learning (ML) methods like linear, exponential, and multiple/multi-temporal regressions, modern ML methods like artificial neural network (ANN), random forest (RF), support vector machine (SVM), convolution neural network (CNN), etc. have developed over the years, and are relatively new for agricultural applications. Several studies have used a linear regression model to correlate biomass and/or crop yield with crop parameters measured using remote sensing techniques [18,66,74,81,137,143,144,145]. The use of multiple variables (multiple linear regression) and multitemporal data are also reported in the literature [66,79,83,132]. Non-linear (exponential and logarithmic) regression models have also been used in many cereal crop research [17,66,133,144,145]. The use of multiple models has also become common in recent times [66,74,132,133]. As compared to linear regression, non-linear models produce higher accuracy biomass and yield estimates [66]. Likewise, regression with multi-temporal data generally provides a higher correlation score [132]. However, these models also require more in-situ samples.
With the huge amount of remote sensing data being collected from agricultural fields using drones as well as IoT sensors, modern ML methods are now finding applications in PA. ML methods can enhance the performance of drone-based systems by extracting soil and crop information from images and sensors. Together with big data technologies and the availability of high-performance computing facilities, these modern ML methods have evolved to offer new opportunities to understand data-enabled analyses in PA. Application of these ML methods in PA ranges from species classification to weeds and disease identification, fertilizer efficiency, and biomass and yield estimation. In the upcoming paragraphs, we deal with the use of modern ML methods for cereal crops using drone-based data only. A detail review of machine learning applications in agricultural production systems can be found in the literature [23].
Deep neural network (DNN), a type of ANN with multiple hidden layers, was utilized for crop classification [166]. The method was successful in identifying staple food crops like maize and banana while it failed to classify intercropping crops like legume. In a separate study, a semi-automatic object-based image analysis (OBIA) technique was used to extract spectral, textural, and geometric features from drone RGB images, which was provided to RF classifier to classify soil, weeds, and maize. To detect yellow rust in winter wheat, Zhang et al. [64] provided spatial and spectral information from high-resolution hyperspectral drone images to a deep convolutional neural network (DCNN) while that of spectral information only was used in the RF. Combining both spectral and spatial information in DCNN yielded higher accuracy in detecting the disease [64].
For water stress assessment in winter wheat, Ge et al. explored extreme learning machine (ELM) and RF methods [121] and used 4 spectral indices derived from hyperspectral drone images. The RF algorithm was found to be the best method with a perpendicular index (PI). In another research, the RF algorithm was used to estimate barley biomass and nitrogen content [74]. The authors utilized combinations of 55 hyperspectral features and 13 RGB features. The utilization of spectral features was the most significant while that of the 3D features was found to be the least significant [74]. Various methods for wheat yield estimation were used by Fu et al. [167]. With a combination of four VIs from multispectral drone images as input in the study, the RF algorithm provided the best estimation accuracy, followed by ANN and partial least square regression (PLSR) methods. Applications of only modern ML methods for cereal crops with the use of drone-based data are summarized in Table 6.
Table 6.
Summary of modern Machine Learning methods in cereal crop applications. ANN—artificial neural network, CCCI—canopy chlorophyll content index, CIs—color indices, DCNN—deep convolution neural network, DNN—deep neural networks, NDRE—normalized difference red edge index, NDVI—normalized difference vegetation index, RF—random forest, OSAVI—optimized soil adjusted vegetation index, PLSR—partial least square regression, VIs—vegetation indices, DI—difference index, RI—ratio index, NDI—normalized difference index, PI—perpendicular index.
SVM/support vector regression (SVR), CNN, and RF are popular modern ML methods/algorithms. SVR is appreciated because of its ability to tackle with high dimensionality data and do well with limited training sets [168]. RF is popular for being relatively insensitive to classification parameters and usually offers high accuracy [169]. However, there is no consensus on which of these methods yields the best results [64,167,170,171]. Moreover, the application of ML methods with a tremendous volume of drone-based agriculture data is relatively unmatured. Hence, additional research is necessary to explore and utilize the efficiency and efficacy of such methods in this arena.
6.3. Opportunities and Challenges
A drone-based platform coupled with digital, multispectral, and/or hyperspectral sensors presents a multitude of opportunities and challenges for monitoring, investigating, and mapping cereal crops at the farm level. Some issues like complex drone regulations and unavailability of insurance policy for drones, however, are debatable and actual conditions may differ country by country [19,172]. Similarly, privacy concerns may be relaxed as the agriculture area generally lies in remote places with no nearby settlements. Additionally, an endurance of around 2 h with a fixed-wing drone will be fine for agriculture scouting at the farm level. A list of opportunities and challenges for cereal crop investigation and modeling are summarized in Table 7 and each of them is reviewed and discussed.
Table 7.
Opportunities and challenges of drone-based crop monitoring and yield estimation.
6.3.1. Opportunities
- Ultra-high spatial resolution
The flying height of small drones is usually in the range of tens of meters to a few hundred meters. This allows the platform to provide ultra-high-resolution images [49,86,131]. Spatial resolution smaller than 10 cm is generally obtained, though 1 cm spatial resolution [131] has become quite common in recent times. The available resolution is very much suitable for monitoring and mapping of smaller farms in low-income countries [13]. Further, the ultra-high spatial resolution images not only allow to get individual crop level information but also can permit the information on soil characteristics, e.g., soil moisture [89,121].
- Extremely high temporal resolution
Due to the short lifespan of cereal crops, monitoring, and intervention of the farms with the extremely high temporal resolution is of paramount importance. Monitoring cereal crop characteristics at each/particular phenological stage is crucial. Moreover, the revisit time of very high resolution (VHR) satellite images may not align with the strict crop monitoring schedule. However, a drone can be flown at the strict monitoring schedule. Furthermore, this platform also permits to fly at a chosen time of the day which will enable to reduce the shadowing effect. Additionally, the lower operational cost of drones also supports capturing data with high temporal resolution.
- Cloud-free data/images
Though optical satellite images were common in the past, cloud cover [14,110] is a major hindrance to their applications for cereal crop investigation, especially during the monsoon and the winter. Cloud cover is prevalent in the monsoon when paddy rice is grown in the larger area of Asia. Similarly, fog and haze are quite common during the winter wheat growing season. Hence, these images limit the investigation of cereal crops. Satellite-based active sensors (e.g., SAR) can be an alternative data source, however, the spatial resolution of such images currently available is unsuitable for the smallholders’ plot-level farm investigation. Hence, drone images prove to be the most promising platform considering the operational flying height of small drones that permits the acquisition of cloud-free ultra-high spatial resolution images.
- Potential for high-density 3D point cloud
Three-dimensional point could is crucial for estimating plant height, crop phenology, and biomass [135,144,173]. A better estimation of these parameters can be achieved with a high-density point cloud obtainable from drone images and LiDAR than aerial imageries and stereo satellite images. Though the accuracy of the point cloud from LiDAR is tremendous, its cost is far greater than that from the drone images [174]. Moreover, monitoring smaller farms with manned aircraft and satellite images is not practical due to associated cost and necessity for high temporal resolution.
- High potential for citizens participation
Planning and operating a consumer drone have become straight forward because of the high level of automation in planning, takeoff, and landing. With high penetration of mobile networks [175], smartphones-based freely available flight planning software have made planning a drone flight reachable to almost all, and are tremendously easy as they now offer intuitive graphical user interface (GUI). With some kind of training provided to the farmers, they could download and process images with freely available GUI based software, e.g., PrecisionMapper (https://www.precisionhawk.com/precisionanalytics) and WebODM (https://www.opendronemap.org/webodm/).
- Scalability with relatively low costs operation
Cereal crop monitoring, investigation, and yield estimation using satellite-based EO images are challenging due to smaller farm sizes in low-income countries [13] and a short cereal crop lifespan. Whilst the spatial and temporal resolutions of freely available satellite images prohibit their applicability at the farm level, the cost of very high-resolution (VHR) satellite images bars temporal monitoring of such crops [176]. Moreover, the farmers lack the resources to use VHR remote sensing images, images from piloted aircraft, or any sophisticated and expensive systems like LiDAR. Further, the cost of operation for consumer drones are low, are easy to operate, and provide ultra-high spatial and temporal resolution images.
Cooperative farming is becoming popular [177]. This practice not only helps to cut the cost of inputs and gets government subsidies but also support sharing resources, knowledge, and find marketing their product much appropriate. As a result of the low operational cost and easy to operate the system for monitoring, mapping, and yield estimation with consumer drones, the cooperatives can manage to pay for and employ the technology to scout their cereal farms, make informed decisions, and get enhanced productivity. Henceforth, the drone-based system is scalable with a cooperative farming system. In one of our research, plant height measurements were performed by farmers’ cooperative members [137]. Thus, the farmers’ cooperatives can appropriately employ the drones and operate it themselves as well, if proper training is prearranged.
- The emergence of cloud-based data processing platforms
The drone data solution represents the five stages of the data lifecycle i.e., acquisition, analysis, storage, sharing, and visualization. The advancements of sensor technologies (e.g., Table 3) have enabled drones to acquire a large amount of data (e.g., image, video, radio signals, emission gases, etc.) with very high spatial and temporal resolution. At the same time, IoT-based low-cost sensors continuously present agronomic and environmental parameters, which can be assimilated with the drone-platforms. The advancement of big data processing environments (e.g., Microsoft Azure, Google Earth Engine (GEE) and machine learning methods (e.g., Table 6) offer a unique opportunity to process these datasets in real-time for better decision making [178,179].
- The fair and accurate payout for crop insurance
Natural disasters (such as floods, drought, cyclone, etc.), pandemic and zoonotic diseases (such as COVID-19, bacteria, parasites, and fungi) and occasional but disruptive insects like Desert Locust (which appears at the beginning of 2020 in Africa and entered Nepal in July 2020) can damage the crop and reduce the yield. Precise and accurate information is mandatory for both the farmers and the insurance companies for a fair and accurate payout. Traditional surveying methods like images from an expensive aircraft or an inaccurate measurement produced by “eyeballing”, are no longer practical in these conditions. On the contrary, a single drone flight can provide a rapid, easy, and accurate assessment for crop insurance adjustment procedures and payout.
Further, crop simulation models require very comprehensive information on crop fields to accurately predict the produce. With drone’s technology, the crop insurance companies can get supplementary information like tentative sowing date, planting density, row spacing, management regimes, precise growth, and health among other information at the plot-level. Farmers plant/sow different crops than what had been committed to crop insurance companies at the time of issuance of the insurance policy. With the application of drone’s technology, geographic information system (GIS), and digital cadastral data, it is now possible to detect fraudulent claims by the farmers, measure discrepancies and validate the compliance level stated/agreed in the policy [180]. Hence, a drone-based crop scouting system can be a great solution for fair and accurate payout to the insured farmers, by the crop insurance companies and this would help the companies to stay competitive and increase operational efficiency.
6.3.2. Challenges
- Limited payload
Consumer drones have limited payload capacity. Thus, they cannot afford to accommodate heavy professional quality sensors. Innovations in sensor technology have led to the development of lightweight sensors that can fit on consumer drones (Table 3). However, the cost of such sensors is still out of reach for many users, especially in low-income countries. Nonetheless, the cost of light-weight sensors can be anticipated to drop in the coming years as did the price of the consumer drones.
- Low spectral resolution for low-cost sensors and high cost of hyperspectral sensors
The high cost of high spectral resolution (hyperspectral) sensors is a major limiting factor to the widespread use of drones in the agriculture sector. Thus, many users were limited to use a consumer-grade digital camera for many applications [66,108,109,137]. Consumer digital cameras suffer from overlapping spectral bands [108], pixel interpolation, and high vignetting effect [109]. Thus, these sensors may find limited applications, for example, in disease detection, crop health monitoring, and weeds identification. The use of multispectral sensors could bridge the gap for many, as a cost point of view.
- Sensitivity to atmospheric conditions
Drone images are free from the cloud cover issues. However, other atmospheric phenomena like haze, fog, precipitation, and strong winds may negatively impact its usage [181]. These issues can, however, be tackled with proper flight planning and management, and to some extent with the help of image pre-processing techniques.
- Limited flight endurance
Flight endurance of multi-rotor drones which present flexibility in sensor installation, is still a major challenge for monitoring larger acreage. However, the lager acreage can be inspected and mapped with the help of fixed-wing drones. Nonetheless, only light-weight sensors can be installed on them.
- The high initial cost of ownership
Though consumer drones are cheaper, they come with consumer-grade optical sensors, which are unsuitable for many agricultural applications. A hyperspectral sensor offers tremendous opportunities for cereal crop analysis. However, they are unaffordable to many. Additionally, the weight of such sensors is still on the heavier side which requires larger carrier drones, increasing the ownership cost. Thus, the initial cost of ownership is still a major hurdle in the wider application of drones. We can expect to drop the cost as well as the size and the weight of the sensors in the future.
- Requirement of customized training to the farmers
For proper utilization of the technologies, confidence and knowledge of the farmers need to be boosted. Motivating and capacity building of wide diversity of farmers may be the main challenge towards real applications of drones in agriculture. While younger generations are selecting farming as an occupation, the job can be completed comparatively with ease. Nonetheless, training for implementing the entire workflow is of paramount importance.
- Lack of technical knowledge for repair and maintenance, and unavailability of parts
Though consumer drones are easy to operate, their repair and maintenance require technical knowledge and experience. Further, the unavailability of parts (for replacement in case of damage) may be another issue at many places in the world.
7. Conclusions and Outlook
The outbreak of the COVID-19 pandemic is having an unparalleled effect on our food systems and beyond. To this end, we provide a synthesis of the use of drone-based data solutions and highlight the need to capitalize on this development towards improving cereal crop productivity of small-scale farming systems in low-income countries. We also discussed the availability of suitable sensors, platform choices, and the benefits of utilizing novel machine learning methods for crop yield estimation by employing associated variables. Furthermore, possible opportunities and challenges of drone-based technologies for cereal crop monitoring and mapping are presented in this review article. We conclude that the productivity of smallholder farmers may be enhanced with the use of technologies like drones to combat the disruption caused in food supply systems because of the COVID-19 pandemic.
The drone navigation system, sensor technologies, regulations, and platforms together with internet services are constantly improving. These improvements will provide new opportunities for drone-based data solutions. A number of future outlooks have been identified with regards to cereal crops:
- Drone-based data solutions have produced promising results in crop biomass and yield estimation. However, they are applicable to farm scales only due to logistics, cost, and big amount of data acquisition. Furthermore, drone technologies are still considered high-tech in farmers’ communities, especially in low-income countries. Satellite remote sensing images are better suited for homogeneous agriculture practice where larger farm sizes exist. While satellite remote sensing data are not capable to produce high accuracy yield prediction in heterogeneous agriculture practice, the drone-based solutions apply to local scales only. Hence, there is a requirement for a robust system and method for estimating crop yield in heterogenous agriculture practices with smaller farm sizes, and yet they should be scalable to larger areas. A framework is required for integrating the information from drones at local scales to satellite-based data which will make yield prediction at larger scales possible [182]. This framework could reduce the requirement for in-situ data. For biomass estimation of mangrove forest, up to 37% reduction in in-situ data was observed than what is normally required for direct calibration-validation using satellite data [55]). Sentinel-1 SAR (https://sentinel.esa.int/web/sentinel/user-guides/sentinel-1-sar/overview) and upcoming NASA-ISRO SAR mission (NISAR) (https://nisar.jpl.nasa.gov/) can provide a backscatter of up to 10 m spatial resolution. This will also help to get weather independent data (cloud during the monsoon crops like rice and maize; and fog and haze during the winter crops) to upscale the results.
- Citizen science has been considered as an alternative and cost-effective way to acquire in-situ data [183]. Citizen science-based data can be utilized to calibrate and validate the models. The usability of smartphones and low-cost sensors can be explored to increase the wider acceptance of the system in low-income countries [184,185]. Furthermore, the utilization of drones by local farmers themselves will allow cost reduction, enhance technical know-how, increase acceptance by the farmers’ communities, and make the system sustainable. Nevertheless, data privacy, data governance, and the degree to which communities would require external support, training, and funding for drone operation also need to be considered carefully.
- It is usually not possible to regulate multiple variables through linear regression models. Multiple variables can be ingested to machine learning techniques; however, most studies have been using developed vegetation indices only. Additional research can ingest multiple variables (e.g., agro-environmental conditions) in the model. Internet of things (IoT) based low-cost sensors can be employed to automate the system and to reduce the cost of data acquisition.
Author Contributions
Data collection and analysis: U.S.P.; interpretation: U.S.P. and A.K.P.; structure and relevant content: U.S.P., A.K.P., J.A., and R.B.K.; writing draft manuscript: U.S.P.; editing manuscript: U.S.P., A.K.P., J.A., and R.B.K.; supervision: J.A. and R.B.K. All authors have read and agreed to the published version of the manuscript.
Funding
This research received no external funding.
Acknowledgments
The authors would like to thank Reshma Shrestha, Shashank Karki, Abidemi Elesho and three anonymous reviewers for their comments and suggestions to enhance the manuscript.
Conflicts of Interest
The authors declare no conflict of interest.
References
- Ehrlich, P.R.; Harte, J. To feed the world in 2050 will require a global revolution. Proc. Natl. Acad. Sci. USA 2015, 112, 14743–14744. [Google Scholar] [CrossRef] [PubMed]
- UN. Sustainable Development Goals. Available online: https://www.un.org/sustainabledevelopment/sustainable-development-goals/ (accessed on 1 October 2019).
- FAO; IFAD; UNICEF; WFP; WHO. The State of Food Security and Nutrition in the World. Safeguarding against Economic Slowdowns and Downturns; FAO: Rome, Italy, 2019. [Google Scholar]
- Chakraborty, S.; Newton, A.C. Climate change, plant diseases and food security: An overview. Plant Pathol. 2011, 60, 2–14. [Google Scholar] [CrossRef]
- Godfray, H.C.J.; Beddington, J.R.; Crute, I.R.; Haddad, L.; Lawrence, D.; Muir, J.F.; Pretty, J.; Robinson, S.; Thomas, S.M.; Toulmin, C. Food security: The challenge of feeding 9 billion people. Science (80) 2010, 327, 812–818. [Google Scholar] [CrossRef] [PubMed]
- Alexandratos, N.; Bruinsma, J. World Agriculture towards 2030/2050: The 2012 Revision ESA Working Paper No. 12-03; FAO: Rome, Italy, 2012. [Google Scholar]
- Goff, S.A.; Salmeron, J.M. Back to the future of cereals. Sci. Am. 2004, 291, 42–49. [Google Scholar] [CrossRef]
- Gower, S.T.; Kucharik, C.J.; Norman, J.M. Direct and indirect estimation of leaf area index, f(APAR), and net primary production of terrestrial ecosystems. Remote Sens. Environ. 1999, 70, 29–51. [Google Scholar] [CrossRef]
- Son, N.T.; Chen, C.F.; Chen, C.R.; Duc, H.N.; Chang, L.Y. A phenology-based classification of time-series MODIS data for rice crop monitoring in Mekong Delta, Vietnam. Remote Sens. 2013, 6, 135–156. [Google Scholar] [CrossRef]
- Wijesingha, J.S.J.; Deshapriya, N.L.; Samarakoon, L. Rice crop monitoring and yield assessment with MODIS 250m gridded vegetation product: A case study in Sa Kaeo Province, Thailand. Int. Arch. Photogramm. Remote Sens. Spat. Inf. Sci. 2015, XL-7/W3. [Google Scholar] [CrossRef]
- Torbick, N.; Chowdhury, D.; Salas, W.; Qi, J. Monitoring rice agriculture across myanmar using time series Sentinel-1 assisted by Landsat-8 and PALSAR-2. Remote Sens. 2017, 9, 119. [Google Scholar] [CrossRef]
- Pratihast, A.K.; DeVries, B.; Avitabile, V.; de Bruin, S.; Kooistra, L.; Tekle, M.; Herold, M. Combining satellite data and community-based observations for forest monitoring. Forests 2014, 5, 2464–2489. [Google Scholar] [CrossRef]
- Family Farming Knowledge Platform—Smallholders Dataportrait. Available online: http://www.fao.org/family-farming/data-sources/dataportrait/farm-size/en/ (accessed on 3 April 2020).
- Park, S.; Im, J.; Park, S.; Yoo, C.; Han, H.; Rhee, J. Classification and mapping of paddy rice by combining Landsat and SAR time series data. Remote Sens. 2018, 10, 447. [Google Scholar] [CrossRef]
- Vargas-Ramírez, N.; Paneque-Gálvez, J. The Global Emergence of Community Drones (2012–2017). Drones 2019, 3, 76. [Google Scholar] [CrossRef]
- González-Jorge, H.; Martínez-Sánchez, J.; Bueno, M.; Arias, P. Unmanned Aerial Systems for Civil Applications: A Review. Drones 2017, 1, 2. [Google Scholar] [CrossRef]
- Bendig, J.; Bolten, A.; Bennertz, S.; Broscheit, J.; Eichfuss, S.; Bareth, G. Estimating biomass of barley using crop surface models (CSMs) derived from UAV-based RGB imaging. Remote Sens. 2014, 6, 10395–10412. [Google Scholar] [CrossRef]
- Swain, K.C.; Thomson, S.J.; Jayasuriya, H.P.W. Adoption of an unmanned helicopter for low-altitude remote sensing to estimate yield and total biomass of a rice crop. Trans. ASABE 2010, 53, 21–27. [Google Scholar] [CrossRef]
- Stöcker, C.; Bennett, R.; Nex, F.; Gerke, M.; Zevenbergen, J. Review of the current state of UAV regulations. Remote Sens. 2017, 9, 459. [Google Scholar] [CrossRef]
- Mulla, D.J. Twenty five years of remote sensing in precision agriculture: Key advances and remaining knowledge gaps. Biosyst. Eng. 2013, 114, 358–371. [Google Scholar] [CrossRef]
- Ahmad, L.; Mahdi, S.S. Satellite Farming: An Information and Technology Based Agriculture; Springer International Publishing: Cham, Switzerland, 2018. [Google Scholar]
- Tsouros, D.C.; Bibi, S.; Sarigiannidis, P.G. A review on UAV-based applications for precision agriculture. Information 2019, 10, 349. [Google Scholar] [CrossRef]
- Liakos, K.G.; Busato, P.; Moshou, D.; Pearson, S.; Bochtis, D. Machine learning in agriculture: A review. Sensors 2018, 18, 1–29. [Google Scholar] [CrossRef]
- Elsevier Scopus Search. Available online: https://www.scopus.com/sources (accessed on 1 July 2020).
- Web of Science Group Master Journal List. Available online: https://mjl.clarivate.com/search-results (accessed on 1 July 2020).
- Colomina, I.; Molina, P. Unmanned aerial systems for photogrammetry and remote sensing: A review. ISPRS J. Photogramm. Remote Sens. 2014, 92, 79–97. [Google Scholar] [CrossRef]
- Sharma, L.K.; Bali, S.K. A review of methods to improve nitrogen use efficiency in agriculture. Sustainability 2018, 10, 51. [Google Scholar] [CrossRef]
- Messina, G.; Modica, G. Applications of UAV thermal imagery in precision agriculture: State of the art and future research outlook. Remote Sens. 2020, 12, 1491. [Google Scholar] [CrossRef]
- Boursianis, A.D.; Papadopoulou, M.S.; Diamantoulakis, P.; Liopa-Tsakalidi, A.; Barouchas, P.; Salahas, G.; Karagiannidis, G.; Wan, S.; Goudos, S.K. Internet of Things (IoT) and Agricultural Unmanned Aerial Vehicles (UAVs) in smart farming: A comprehensive review. Internet Things 2020, 100187. [Google Scholar] [CrossRef]
- Hassler, S.C.; Baysal-Gurel, F. Unmanned aircraft system (UAS) technology and applications in agriculture. Agronomy 2019, 9, 618. [Google Scholar] [CrossRef]
- Barbedo, J.G.A. A Review on the Use of Unmanned Aerial Vehicles and Imaging Sensors for Monitoring and Assessing Plant Stresses. Drones 2019, 3, 1–27. [Google Scholar] [CrossRef]
- Radoglou-Grammatikis, P.; Sarigiannidis, P.; Lagkas, T.; Moscholios, I. A compilation of UAV applications for precision agriculture. Comput. Netw. 2020, 172, 107148. [Google Scholar] [CrossRef]
- Awika, J.M. Major cereal grains production and use around the world. Am. Chem. Soc. 2011, 1089, 1–13. [Google Scholar]
- McKevith, B. Nutritional aspects of cereals. Nutr. Bull. 2004, 29, 111–142. [Google Scholar] [CrossRef]
- FAO. World Agriculture: Towards 2015/2030; FAO: Rome, Italy, 2002. [Google Scholar]
- FAO. FAOSTAT. Available online: http://www.fao.org/faostat/en/#data/QC (accessed on 7 August 2020).
- CIMMYT. The Cereals Imperative of Future Food Systems. Available online: https://www.cimmyt.org/news/the-cereals-imperative-of-future-food-systems/ (accessed on 7 August 2020).
- FAO. Novel Coronavirus (COVID-19). Available online: http://www.fao.org/2019-ncov/q-and-a/impact-on-food-and-agriculture/en/ (accessed on 17 June 2020).
- Jámbor, A.; Czine, P.; Balogh, P. The impact of the coronavirus on agriculture: First evidence based on global newspapers. Sustainability 2020, 12, 4535. [Google Scholar] [CrossRef]
- Poudel, P.B.; Poudel, M.R.; Gautam, A.; Phuyal, S.; Tiwari, C.K. COVID-19 and its Global Impact on Food and Agriculture. J. Biol. Today’s World 2020, 9, 7–10. [Google Scholar]
- World Bank. Food Security and COVID-19. Available online: https://www.worldbank.org/en/topic/agriculture/brief/food-security-and-covid-19 (accessed on 17 June 2020).
- WFP. Risk of Hunger Pandemic as Coronavirus Set to Almost Double Acute Hunger by End of 2020. Available online: https://insight.wfp.org/covid-19-will-almost-double-people-in-acute-hunger-by-end-of-2020-59df0c4a8072 (accessed on 17 June 2020).
- Hobbs, J.E. Food supply chains during the COVID-19 pandemic. Can. J. Agric. Econ. 2020, 1–6. [Google Scholar] [CrossRef]
- FSIN. 2020 Global Report on Food Crises: Joint Analysis for Better Decisions; FSIN: Saskatoon, SK, Canada, 2020. [Google Scholar]
- Samberg, L.H.; Gerber, J.S.; Ramankutty, N.; Herrero, M.; West, P.C. Subnational distribution of average farm size and smallholder contributions to global food production. Environ. Res. Lett. 2016, 11, 1–12. [Google Scholar] [CrossRef]
- Cranfield, J.; Spencer, H.; Blandon, J. The Effect of Attitudinal and Sociodemographic Factors on the Likelihood of Buying Locally Produced Food. Agribusiness 2012, 28, 205–221. [Google Scholar] [CrossRef]
- Béné, C. Resilience of local food systems and links to food security—A review of some important concepts in the context of COVID-19 and other shocks. Food Secur. 2020. [Google Scholar] [CrossRef]
- Nonami, K. Prospect and Recent Research & Development for Civil Use Autonomous Unmanned Aircraft as UAV and MAV. J. Syst. Des. Dyn. 2007, 1, 120–128. [Google Scholar]
- Turner, D.; Lucieer, A.; Watson, C. An automated technique for generating georectified mosaics from ultra-high resolution Unmanned Aerial Vehicle (UAV) imagery, based on Structure from Motion (SFM) point clouds. Remote Sens. 2012, 4, 1392–1410. [Google Scholar] [CrossRef]
- Koeva, M.; Bennett, R.; Gerke, M.; Crommelinck, S.; Stöcker, C.; Crompvoets, J.; Ho, S.; Schwering, A.; Chipofya, M.; Schultz, C.; et al. Towards innovative geospatial tools for fit-for-purpose land rights mapping. Int. Arch. Photogramm. Remote Sens. Spat. Inf. Sci. 2017, 42, 37–43. [Google Scholar] [CrossRef]
- Kamarudin, S.S.; Tahar, K.N. Assessment on UAV onboard positioning in ground control point establishment. In Proceedings of the 2016 IEEE 12th International Colloquium on Signal Processing and its Applications, CSPA 2016, Melaka, Malaysia, 4–6 March 2016; pp. 210–215. [Google Scholar]
- Jhan, J.P.; Rau, J.Y.; Haala, N. Robust and adaptive band-to-band image transform of UAS miniature multi-lens multispectral camera. ISPRS J. Photogramm. Remote Sens. 2018, 137, 47–60. [Google Scholar] [CrossRef]
- Nahon, A.; Molina, P.; Blázquez, M.; Simeon, J.; Capo, S.; Ferrero, C. Corridor mapping of sandy coastal foredunes with UAS photogrammetry and mobile laser scanning. Remote Sens. 2019, 11, 1352. [Google Scholar] [CrossRef]
- Nex, F.; Duarte, D.; Steenbeek, A.; Kerle, N. Towards real-time building damage mapping with low-cost UAV solutions. Remote Sens. 2019, 11, 287. [Google Scholar] [CrossRef]
- Wang, D.; Wan, B.; Liu, J.; Su, Y.; Guo, Q.; Qiu, P.; Wu, X. Estimating aboveground biomass of the mangrove forests on northeast Hainan Island in China using an upscaling method from field plots, UAV-LiDAR data and Sentinel-2 imagery. Int. J. Appl. Earth Obs. Geoinf. 2020, 85, 101986. [Google Scholar] [CrossRef]
- Fujimoto, A.; Haga, C.; Matsui, T.; Machimura, T.; Hayashi, K.; Sugita, S.; Takagi, H. An end to end process development for UAV-SfM based forest monitoring: Individual tree detection, species classification and carbon dynamics simulation. Forests 2019, 10, 680. [Google Scholar] [CrossRef]
- Sandino, J.; Pegg, G.; Gonzalez, F.; Smith, G. Aerial mapping of forests affected by pathogens using UAVs, hyperspectral sensors, and artificial intelligence. Sensors 2018, 18, 944. [Google Scholar] [CrossRef] [PubMed]
- Shin, J.I.; Seo, W.W.; Kim, T.; Park, J.; Woo, C.S. Using UAV multispectral images for classification of forest burn severity-A case study of the 2019 Gangneung forest fire. Forests 2019, 10, 1025. [Google Scholar] [CrossRef]
- Gonzalez, L.F.; Montes, G.A.; Puig, E.; Johnson, S.; Mengersen, K.; Gaston, K.J. Unmanned aerial vehicles (UAVs) and artificial intelligence revolutionizing wildlife monitoring and conservation. Sensors 2016, 16, 97. [Google Scholar] [CrossRef] [PubMed]
- Muller, C.G.; Chilvers, B.L.; Barker, Z.; Barnsdale, K.P.; Battley, P.F.; French, R.K.; McCullough, J.; Samandari, F. Aerial VHF tracking of wildlife using an unmanned aerial vehicle (UAV): Comparing efficiency of yellow-eyed penguin (Megadyptes antipodes) nest location methods. Wildl. Res. 2019, 46, 145–153. [Google Scholar] [CrossRef]
- Jiménez López, J.; Mulero-Pázmány, M. Drones for Conservation in Protected Areas: Present and Future. Drones 2019, 3, 10. [Google Scholar] [CrossRef]
- Gašparović, M.; Zrinjski, M.; Barković, Đ.; Radočaj, D. An automatic method for weed mapping in oat fields based on UAV imagery. Comput. Electron. Agric. 2020, 173, 105385. [Google Scholar] [CrossRef]
- Su, J.; Liu, C.; Coombes, M.; Hu, X.; Wang, C.; Xu, X.; Li, Q.; Guo, L.; Chen, W.H. Wheat yellow rust monitoring by learning from multispectral UAV aerial imagery. Comput. Electron. Agric. 2018, 155, 157–166. [Google Scholar] [CrossRef]
- Zhang, X.; Han, L.; Dong, Y.; Shi, Y.; Huang, W.; Han, L.; González-Moreno, P.; Ma, H.; Ye, H.; Sobeih, T. A deep learning-based approach for automated yellow rust disease detection from high-resolution hyperspectral UAV images. Remote Sens. 2019, 11, 1554. [Google Scholar] [CrossRef]
- Fernández, E.; Gorchs, G.; Serrano, L. Use of consumer-grade cameras to assess wheat N status and grain yield. PLoS ONE 2019, 14, 18. [Google Scholar] [CrossRef]
- Niu, Y.; Zhang, L.; Zhang, H.; Han, W.; Peng, X. Estimating above-ground biomass of maize using features derived from UAV-based RGB imagery. Remote Sens. 2019, 11, 21. [Google Scholar] [CrossRef]
- Matese, A.; Di Gennaro, S.F. Practical applications of a multisensor UAV platform based on multispectral, thermal and RGB high resolution images in precision viticulture. Agriculture 2018, 8, 116. [Google Scholar] [CrossRef]
- Melville, B.; Lucieer, A.; Aryal, J. Classification of Lowland Native Grassland Communities Using Hyperspectral Unmanned Aircraft System (UAS) Imagery in the Tasmanian Midlands. Drones 2019, 3, 12. [Google Scholar] [CrossRef]
- Moharana, S.; Dutta, S. Spatial variability of chlorophyll and nitrogen content of rice from hyperspectral imagery. ISPRS J. Photogramm. Remote Sens. 2016, 122, 17–29. [Google Scholar] [CrossRef]
- López-Granados, F.; Torres-Sánchez, J.; De Castro, A.I.; Serrano-Pérez, A.; Mesas-Carrascosa, F.J.; Peña, J.M. Object-based early monitoring of a grass weed in a grass crop using high resolution UAV imagery. Agron. Sustain. Dev. 2016, 36. [Google Scholar] [CrossRef]
- Maimaitijiang, M.; Ghulam, A.; Sidike, P.; Hartling, S.; Maimaitiyiming, M.; Peterson, K.; Shavers, E.; Fishman, J.; Peterson, J.; Kadam, S.; et al. Unmanned Aerial System (UAS)-based phenotyping of soybean using multi-sensor data fusion and extreme learning machine. ISPRS J. Photogramm. Remote Sens. 2017, 134, 43–58. [Google Scholar] [CrossRef]
- Kalischuk, M.; Paret, M.L.; Freeman, J.H.; Raj, D.; Silva, S.D.; Eubanks, S.; Wiggins, D.J.; Lollar, M.; Marois, J.J.; Charles Mellinger, H.; et al. An improved crop scouting technique incorporating unmanned aerial vehicle-assisted multispectral crop imaging into conventional scouting practice for gummy stem blight in Watermelon. Plant Dis. 2019, 103, 1642–1650. [Google Scholar] [CrossRef]
- Deng, L.; Mao, Z.; Li, X.; Hu, Z.; Duan, F.; Yan, Y. UAV-based multispectral remote sensing for precision agriculture: A comparison between different cameras. ISPRS J. Photogramm. Remote Sens. 2018, 146, 124–136. [Google Scholar] [CrossRef]
- Näsi, R.; Viljanen, N.; Kaivosoja, J.; Alhonoja, K.; Hakala, T.; Markelin, L.; Honkavaara, E. Estimating biomass and nitrogen amount of barley and grass using UAV and aircraft based spectral and photogrammetric 3D features. Remote Sens. 2018, 10, 1082. [Google Scholar] [CrossRef]
- Herrmann, I.; Bdolach, E.; Montekyo, Y.; Rachmilevitch, S.; Townsend, P.A.; Karnieli, A. Assessment of maize yield and phenology by drone-mounted superspectral camera. Precis. Agric. 2020, 21, 51–76. [Google Scholar] [CrossRef]
- Gil-Docampo, M.L.; Arza-García, M.; Ortiz-Sanz, J.; Martínez-Rodríguez, S.; Marcos-Robles, J.L.; Sánchez-Sastre, L.F. Above-ground biomass estimation of arable crops using UAV-based SfM photogrammetry. Geocarto Int. 2020, 35, 687–699. [Google Scholar] [CrossRef]
- Fawcett, D.; Panigada, C.; Tagliabue, G.; Boschetti, M.; Celesti, M.; Evdokimov, A.; Biriukova, K.; Colombo, R.; Miglietta, F.; Rascher, U.; et al. Multi-scale evaluation of drone-based multispectral surface reflectance and vegetation indices in operational conditions. Remote Sens. 2020, 12, 514. [Google Scholar] [CrossRef]
- Wang, H.; Mortensen, A.K.; Mao, P.; Boelt, B.; Gislum, R. Estimating the nitrogen nutrition index in grass seed crops using a UAV-mounted multispectral camera. Int. J. Remote Sens. 2019, 40, 2467–2482. [Google Scholar] [CrossRef]
- Stavrakoudis, D.; Katsantonis, D.; Kadoglidou, K.; Kalaitzidis, A.; Gitas, I.Z. Estimating rice agronomic traits using drone-collected multispectral imagery. Remote Sens. 2019, 11, 545. [Google Scholar] [CrossRef]
- Sofonia, J.; Shendryk, Y.; Phinn, S.; Roelfsema, C.; Kendoul, F.; Skocaj, D. Monitoring sugarcane growth response to varying nitrogen application rates: A comparison of UAV SLAM LiDAR and photogrammetry. Int. J. Appl. Earth Obs. Geoinf. 2019, 82, 101878. [Google Scholar] [CrossRef]
- Olson, D.; Chatterjee, A.; Franzen, D.W.; Day, S.S. Relationship of drone-based vegetation indices with corn and sugarbeet yields. Agron. J. 2019, 111, 2545–2557. [Google Scholar] [CrossRef]
- Guan, S.; Fukami, K.; Matsunaka, H.; Okami, M.; Tanaka, R.; Nakano, H.; Sakai, T.; Nakano, K.; Ohdan, H.; Takahashi, K. Assessing correlation of high-resolution NDVI with fertilizer application level and yield of rice and wheat crops using small UAVs. Remote Sens. 2019, 11, 112. [Google Scholar] [CrossRef]
- Devia, C.A.; Rojas, J.P.; Petro, E.; Martinez, C.; Mondragon, I.F.; Patino, D.; Rebolledo, M.C.; Colorado, J. High-Throughput Biomass Estimation in Rice Crops Using UAV Multispectral Imagery. J. Intell. Robot. Syst. Theory Appl. 2019, 96, 573–589. [Google Scholar] [CrossRef]
- Borra-Serrano, I.; De Swaef, T.; Muylle, H.; Nuyttens, D.; Vangeyte, J.; Mertens, K.; Saeys, W.; Somers, B.; Roldán-Ruiz, I.; Lootens, P. Canopy height measurements and non-destructive biomass estimation of Lolium perenne swards using UAV imagery. Grass Forage Sci. 2019, 74, 356–369. [Google Scholar] [CrossRef]
- Viljanen, N.; Honkavaara, E.; Näsi, R.; Hakala, T.; Niemeläinen, O.; Kaivosoja, J. A novel machine learning method for estimating biomass of grass swards using a photogrammetric canopy height model, images and vegetation indices captured by a drone. Agriculture 2018, 8, 70. [Google Scholar] [CrossRef]
- Gao, J.; Liao, W.; Nuyttens, D.; Lootens, P.; Vangeyte, J.; Pižurica, A.; He, Y.; Pieters, J.G. Fusion of pixel and object-based features for weed mapping using unmanned aerial vehicle imagery. Int. J. Appl. Earth Obs. Geoinf. 2018, 67, 43–53. [Google Scholar] [CrossRef]
- Sanches, G.M.; Duft, D.G.; Kölln, O.T.; Luciano, A.C.D.S.; De Castro, S.G.Q.; Okuno, F.M.; Franco, H.C.J. The potential for RGB images obtained using unmanned aerial vehicle to assess and predict yield in sugarcane fields. Int. J. Remote Sens. 2018, 39, 5402–5414. [Google Scholar] [CrossRef]
- Christiansen, M.P.; Laursen, M.S.; Jørgensen, R.N.; Skovsen, S.; Gislum, R. Designing and testing a UAV mapping system for agricultural field surveying. Sensors 2017, 17, 19. [Google Scholar] [CrossRef] [PubMed]
- Gago, J.; Douthe, C.; Coopman, R.E.; Gallego, P.P.; Ribas-Carbo, M.; Flexas, J.; Escalona, J.; Medrano, H. UAVs challenge to assess water stress for sustainable agriculture. Agric. Water Manag. 2015, 153, 9–19. [Google Scholar] [CrossRef]
- Ghorbanzadeh, O.; Meena, S.R.; Blaschke, T.; Aryal, J. UAV-based slope failure detection using deep-learning convolutional neural networks. Remote Sens. 2019, 11, 2046. [Google Scholar] [CrossRef]
- Chaudhary, S.; Wang, Y.; Dixit, A.M.; Khanal, N.R.; Xu, P.; Fu, B.; Yan, K.; Liu, Q.; Lu, Y.; Li, M. Spatiotemporal degradation of abandoned farmland and associated eco-environmental risks in the high mountains of the Nepalese Himalayas. Land 2020, 9, 1. [Google Scholar] [CrossRef]
- Piralilou, S.T.; Shahabi, H.; Jarihani, B.; Ghorbanzadeh, O.; Blaschke, T.; Gholamnia, K.; Meena, S.R.; Aryal, J. Landslide detection using multi-scale image segmentation and different machine learning models in the higher himalayas. Remote Sens. 2019, 11, 2575. [Google Scholar] [CrossRef]
- Kakooei, M.; Baleghi, Y. Fusion of satellite, aircraft, and UAV data for automatic disaster damage assessment. Int. J. Remote Sens. 2017, 38, 2511–2534. [Google Scholar] [CrossRef]
- Erdelj, M.; Natalizio, E.; Chowdhury, K.R.; Akyildiz, I.F. Help from the Sky: Leveraging UAVs for Disaster Management. IEEE Pervasive Comput. 2017, 16, 24–32. [Google Scholar] [CrossRef]
- Jones, C.A.; Church, E. Photogrammetry is for everyone: Structure-from-motion software user experiences in archaeology. J. Archaeol. Sci. Rep. 2020, 30, 102261. [Google Scholar] [CrossRef]
- Parisi, E.I.; Suma, M.; Güleç Korumaz, A.; Rosina, E.; Tucci, G. Aerial platforms (uav) surveys in the vis and tir range. Applications on archaeology and agriculture. Int. Arch. Photogramm. Remote Sens. Spat. Inf. Sci. 2019, 945–952. [Google Scholar] [CrossRef]
- Agudo, P.; Pajas, J.; Pérez-Cabello, F.; Redón, J.; Lebrón, B. The Potential of Drones and Sensors to Enhance Detection of Archaeological Cropmarks: A Comparative Study Between Multi-Spectral and Thermal Imagery. Drones 2018, 2, 29. [Google Scholar] [CrossRef]
- Hess, M.; Petrovic, V.; Meyer, D.; Rissolo, D.; Kuester, F. Fusion of multimodal three-dimensional data for comprehensive digital documentation of cultural heritage sites. In Proceedings of the 2015 Digital Heritage International Congress, Granada, Spain, 28 September–2 October 2015. [Google Scholar]
- Oreni, D.; Brumana, R.; Della Torre, S.; Banfi, F.; Barazzetti, L.; Previtali, M. Survey turned into HBIM: The restoration and the work involved concerning the Basilica di Collemaggio after the earthquake (L’Aquila). ISPRS Ann. Photogramm. Remote Sens. Spat. Inf. Sci. 2014, 2, 267–273. [Google Scholar] [CrossRef]
- Raeva, P.; Pavelka, K.; Hanuš, J.; Gojda, M. Using of both hyperspectral aerial sensing and RPAS multispectral sensing for potential archaeological sites detection. In Multispectral, Hyperspectral, and Ultraspectral Remote Sensing Technology, Techniques and Applications VII; SPIE: Honolulu, HI, USA, 2018; 15p. [Google Scholar]
- Gonzalez-Aguilera, D.; Bitelli, G.; Rinaudo, F.; Grussenmeyer, P. (Eds.) Data Acquisition and Processing in Cultural Heritage; MDPI: Basel, Switzerland, 2020. [Google Scholar]
- Luo, L.; Wang, X.; Guo, H.; Lasaponara, R.; Zong, X.; Masini, N.; Wang, G.; Shi, P.; Khatteli, H.; Chen, F.; et al. Airborne and spaceborne remote sensing for archaeological and cultural heritage applications: A review of the century (1907–2017). Remote Sens. Environ. 2019, 232, 111280. [Google Scholar] [CrossRef]
- Tucci, G.; Parisi, E.I.; Castelli, G.; Errico, A.; Corongiu, M.; Sona, G.; Viviani, E.; Bresci, E.; Preti, F. Multi-sensor UAV application for thermal analysis on a dry-stone terraced vineyard in rural Tuscany landscape. ISPRS Int. J. Geo-Inf. 2019, 8, 87. [Google Scholar] [CrossRef]
- Wallace, L.; Lucieer, A.; Watson, C.; Turner, D. Development of a UAV-LiDAR system with application to forest inventory. Remote Sens. 2012, 4, 1519–1543. [Google Scholar] [CrossRef]
- Lin, Q.; Huang, H.; Wang, J.; Huang, K.; Liu, Y. Detection of pine shoot beetle (PSB) Stress on pine forests at individual tree level using UAV-based hyperspectral imagery and lidar. Remote Sens. 2019, 11, 2540. [Google Scholar] [CrossRef]
- Zhou, L.; Gu, X.; Cheng, S.; Yang, G.; Shu, M.; Sun, Q. Analysis of plant height changes of lodged maize using UAV-LiDAR data. Agriculture 2020, 10, 146. [Google Scholar] [CrossRef]
- SAL Engineering, E.; Fondazione, B.K. MAIA S2—the Multispectral Camera. Available online: https://www.spectralcam.com/maia-tech-2/ (accessed on 22 July 2020).
- Logie, G.S.J.; Coburn, C.A. An investigation of the spectral and radiometric characteristics of low-cost digital cameras for use in UAV remote sensing. Int. J. Remote Sens. 2018, 39, 4891–4909. [Google Scholar] [CrossRef]
- Lebourgeois, V.; Bégué, A.; Labbé, S.; Mallavan, B.; Prévot, L.; Roux, B. Can commercial digital cameras be used as multispectral sensors? A crop monitoring test. Sensors 2008, 8, 7300–7322. [Google Scholar] [CrossRef]
- Ghebregziabher, Y.T. Monitoring Growth Development and Yield Estimation of Maize Using Very High-Resolution Uav-Images in Gronau, Germany. Enschede Univ. Twente Fac. Geo-Inf. Earth Obs. (ITC) 2017, unpublished. [Google Scholar]
- Ashapure, A.; Jung, J.; Chang, A.; Oh, S.; Maeda, M.; Landivar, J. A comparative study of RGB and multispectral sensor-based cotton canopy cover modelling using multi-temporal UAS data. Remote Sens. 2019, 11, 2757. [Google Scholar] [CrossRef]
- Cholula, U.; Da Silva, J.A.; Marconi, T.; Thomasson, J.A.; Solorzano, J.; Enciso, J. Forecasting yield and lignocellulosic composition of energy cane using unmanned aerial systems. Agronomy 2020, 10, 718. [Google Scholar] [CrossRef]
- SlantRange Inc. Multispectral Drone Sensor Systems for Agriculture. Available online: https://slantrange.com/product-sensor/ (accessed on 24 July 2020).
- Doughty, C.L.; Cavanaugh, K.C. Mapping coastal wetland biomass from high resolution unmanned aerial vehicle (UAV) imagery. Remote Sens. 2019, 11, 540. [Google Scholar] [CrossRef]
- MicaSense Inc. RedEdge.MX. Available online: https://micasense.com/rededge-mx/ (accessed on 25 July 2020).
- Vanegas, F.; Bratanov, D.; Powell, K.; Weiss, J.; Gonzalez, F. A novel methodology for improving plant pest surveillance in vineyards and crops using UAV-based hyperspectral and spatial data. Sensors (Switzerland) 2018, 18, 260. [Google Scholar] [CrossRef]
- Nocerino, E.; Dubbini, M.; Menna, F.; Remondino, F.; Gattelli, M.; Covi, D. Geometric calibration and radiometric correction of the maia multispectral camera. Int. Arch. Photogramm. Remote Sens. Spat. Inf. Sci. 2017, 42, 149–156. [Google Scholar] [CrossRef]
- Horstrand, P.; Guerra, R.; Rodriguez, A.; Diaz, M.; Lopez, S.; Lopez, J.F. A UAV Platform Based on a Hyperspectral Sensor for Image Capturing and On-Board Processing. IEEE Access 2019, 7, 66919–66938. [Google Scholar] [CrossRef]
- SpectraPartners BV SPECIM AFX10. Available online: https://www.hyperspectralimaging.nl/products/afx10/ (accessed on 25 July 2020).
- Headwall Photonics Inc. Hyperspectral Sensors. Available online: https://www.headwallphotonics.com/hyperspectral-sensors (accessed on 25 July 2020).
- Ge, X.; Wang, J.; Ding, J.; Cao, X.; Zhang, Z.; Liu, J.; Li, X. Combining UAV-based hyperspectral imagery and machine learning algorithms for soil moisture content monitoring. PeerJ 2019, 7, e6926. [Google Scholar] [CrossRef]
- Zhang, H.; Zhang, B.; Wei, Z.; Wang, C.; Huang, Q. Lightweight integrated solution for a UAV-borne hyperspectral imaging system. Remote Sens. 2020, 12, 657. [Google Scholar] [CrossRef]
- FLIR Systems Inc. HD Dual-Sensor Thermal Camera for Drones Flir Duo® Pro R. Available online: https://www.flir.com/products/duo-pro-r/ (accessed on 6 August 2020).
- Yang, Y.; Lee, X. Four-band thermal mosaicking: A new method to process infrared thermal imagery of urban landscapes from UAV flights. Remote Sens. 2019, 11, 1365. [Google Scholar] [CrossRef]
- FLIR Systems Inc. Radiometric Drone Thermal Camera Flir Vue Pro R. Available online: https://www.flir.asia/products/vue-pro-r/?model=436-0019-00S (accessed on 6 August 2020).
- Sagan, V.; Maimaitijiang, M.; Sidike, P.; Eblimit, K.; Peterson, K.T.; Hartling, S.; Esposito, F.; Khanal, K.; Newcomb, M.; Pauli, D.; et al. UAV-based high resolution thermal imaging for vegetation monitoring, and plant phenotyping using ICI 8640 P, FLIR Vue Pro R 640, and thermomap cameras. Remote Sens. 2019, 11, 330. [Google Scholar] [CrossRef]
- Workswell Thermal Imaging System WIRIS Agro R. Available online: https://www.drone-thermal-camera.com/products/workswell-cwsi-crop-water-stress-index-camera/ (accessed on 29 July 2020).
- Lin, Y.C.; Cheng, Y.T.; Zhou, T.; Ravi, R.; Hasheminasab, S.M.; Flatt, J.E.; Troy, C.; Habib, A. Evaluation of UAV LiDAR for mapping coastal environments. Remote Sens. 2019, 11, 2893. [Google Scholar] [CrossRef]
- Velodyne Lidar Drone/UAV: Leading Lidar Technology in the Air. Available online: https://velodynelidar.com/industries/drone-uav/ (accessed on 26 July 2020).
- RIEGL Laser Measurement Systems GmbH Unmanned Laser Scanning. Available online: http://www.riegl.com/products/unmanned-scanning/ (accessed on 26 July 2020).
- Schirrmann, M.; Giebel, A.; Gleiniger, F.; Pflanz, M.; Lentschke, J.; Dammer, K.H. Monitoring agronomic parameters of winter wheat crops with low-cost UAV imagery. Remote Sens. 2016, 8, 706. [Google Scholar] [CrossRef]
- Zhou, X.; Zheng, H.B.; Xu, X.Q.; He, J.Y.; Ge, X.K.; Yao, X.; Cheng, T.; Zhu, Y.; Cao, W.X.; Tian, Y.C. Predicting grain yield in rice using multi-temporal vegetation indices from UAV-based multispectral and digital imagery. ISPRS J. Photogramm. Remote Sens. 2017, 130, 246–255. [Google Scholar] [CrossRef]
- Acorsi, M.G.; Abati Miranda, F.D.D.; Martello, M.; Smaniotto, D.A.; Sartor, L.R. Estimating biomass of black oat using UAV-based RGB imaging. Agronomy 2019, 9, 14. [Google Scholar] [CrossRef]
- Zhang, L.; Zhang, H.; Niu, Y.; Han, W. Mapping maize water stress based on UAV multispectral remote sensing. Remote Sens. 2019, 11, 605. [Google Scholar] [CrossRef]
- Song, Y.; Wang, J. Winter wheat canopy height extraction from UAV-based point cloud data with a moving cuboid filter. Remote Sens. 2019, 11, 22. [Google Scholar] [CrossRef]
- Hunt, E.R.; Dean Hively, W.; Fujikawa, S.J.; Linden, D.S.; Daughtry, C.S.T.; McCarty, G.W. Acquisition of NIR-green-blue digital photographs from unmanned aircraft for crop monitoring. Remote Sens. 2010, 2, 290–305. [Google Scholar] [CrossRef]
- Panday, U.S.; Shrestha, N.; Maharjan, S.; Pratihast, A.K.; Shahnawaz; Shrestha, K.L.; Aryal, J. Correlating the Plant Height of Wheat with Above-Ground Biomass and Crop Yield Using Drone Imagery and Crop Surface Model, A Case Study from Nepal. Drones 2020, 4, 28. [Google Scholar] [CrossRef]
- Tao, H.; Feng, H.; Xu, L.; Miao, M.; Yang, G.; Yang, X.; Fan, L. Estimation of the yield and plant height of winter wheat using UAV-based hyperspectral images. Sensors 2020, 20, 1231. [Google Scholar] [CrossRef]
- Reza, M.N.; Na, I.S.; Baek, S.W.; Lee, K.H. Rice yield estimation based on K-means clustering with graph-cut segmentation using low-altitude UAV images. Biosyst. Eng. 2019, 177, 109–121. [Google Scholar] [CrossRef]
- Nakshmi, J.V.N.; Hemanth, K.S.; Bharath, J. Optimizing Quality and Outputs by Improving Variable Rate Prescriptions in Agriculture using UAVs. Procedia Comput. Sci. 2020, 167, 1981–1990. [Google Scholar] [CrossRef]
- FAO. Water for Sustainable Food and Agriculture; FAO: Rome, Italy, 2017. [Google Scholar]
- Su, J.; Coombes, M.; Liu, C.; Guo, L.; Chen, W.H. Wheat Drought Assessment by Remote Sensing Imagery Using Unmanned Aerial Vehicle. In Proceedings of the Chinese Control Conference, Wuhan, China, 25–27 July 2018. 5p. [Google Scholar]
- Tilly, N.; Hoffmeister, D.; Cao, Q.; Huang, S.; Lenz-Wiedemann, V.; Miao, Y.; Bareth, G. Multitemporal crop surface models: Accurate plant height measurement and biomass estimation with terrestrial laser scanning in paddy rice. J. Appl. Remote Sens. 2014, 8, 083671. [Google Scholar] [CrossRef]
- Tilly, N.; Hoffmeister, D.; Cao, Q.; Lenz-Wiedemann, V.; Miao, Y.; Bareth, G. Transferability of Models for Estimating Paddy Rice Biomass from Spatial Plant Height Data. Agriculture 2015, 5, 538–560. [Google Scholar] [CrossRef]
- Tilly, N.; Aasen, H.; Bareth, G. Fusion of plant height and vegetation indices for the estimation of barley biomass. Remote Sens. 2015, 7, 11449–11480. [Google Scholar] [CrossRef]
- Rouse, J.W. Monitoring the Vernal Advancement and Retrogradation (Greenwave Effect) of Natural Vegetation; NASA: Washington, DC, USA, 1974. [Google Scholar]
- Fitzgerald, G.J.; Rodriguez, D.; Christensen, L.K.; Belford, R.; Sadras, V.O.; Clarke, T.R. Spectral and thermal sensing for nitrogen and water status in rainfed and irrigated wheat environments. Precis. Agric. 2006, 7, 223–248. [Google Scholar] [CrossRef]
- Tucker, C.J. Red and photographic infrared linear combinations for monitoring vegetation. Remote Sens. Environ. 1979, 8, 127–150. [Google Scholar] [CrossRef]
- Gitelson, A.A.; Kaufman, Y.J.; Merzlyak, M.N. Use of a green channel in remote sensing of global vegetation from EOS- MODIS. Remote Sens. Environ. 1996, 58, 289–298. [Google Scholar] [CrossRef]
- Jordan, C.F. Derivation of Leaf-Area Index from Quality of Light on the Forest Floor. Ecology 1969, 50, 663–666. [Google Scholar] [CrossRef]
- Huete, A.R. A soil-adjusted vegetation index (SAVI). Remote Sens. Environ. 1988, 25, 295–309. [Google Scholar] [CrossRef]
- Rondeaux, G.; Steven, M.; Baret, F. Optimization of soil-adjusted vegetation indices. Remote Sens. Environ. 1996, 55, 95–107. [Google Scholar] [CrossRef]
- Sripada, R.P.; Heiniger, R.W.; White, J.G.; Meijer, A.D. Aerial color infrared photography for determining early in-season nitrogen requirements in corn. Agron. J. 2006, 98, 968. [Google Scholar] [CrossRef]
- Cao, Q.; Miao, Y.; Wang, H.; Huang, S.; Cheng, S.; Khosla, R.; Jiang, R. Non-destructive estimation of rice plant nitrogen status with Crop Circle multispectral active canopy sensor. Field Crop. Res. 2013, 154, 133–144. [Google Scholar] [CrossRef]
- Huete, A.R.; Liu, H.Q.; Batchily, K.; Van Leeuwen, W. A comparison of vegetation indices over a global set of TM images for EOS-MODIS. Remote Sens. Environ. 1997, 59, 440–451. [Google Scholar] [CrossRef]
- Li, F.; Mistele, B.; Hu, Y.; Yue, X.; Yue, S.; Miao, Y.; Chen, X.; Cui, Z.; Meng, Q.; Schmidhalter, U. Remotely estimating aerial N status of phenologically differing winter wheat cultivars grown in contrasting climatic and geographic zones in China and Germany. Field Crop. Res. 2012, 138, 21–32. [Google Scholar] [CrossRef]
- Gitelson, A.A.; Gritz, Y.; Merzlyak, M.N. Relationships between leaf chlorophyll content and spectral reflectance and algorithms for non-destructive chlorophyll assessment in higher plant leaves. J. Plant Physiol. 2003, 160, 271–282. [Google Scholar] [CrossRef]
- Roujean, J.L.; Breon, F.M. Estimating PAR absorbed by vegetation from bidirectional reflectance measurements. Remote Sens. Environ. 1995, 51, 375–384. [Google Scholar] [CrossRef]
- Hunt, E.R.; Cavigelli, M.; Daughtry, C.S.T.; McMurtrey, J.E.; Walthall, C.L. Evaluation of digital photography from model aircraft for remote sensing of crop biomass and nitrogen status. Precis. Agric. 2005, 6, 359–378. [Google Scholar] [CrossRef]
- Meyer, G.E.; Neto, J.C. Verification of color vegetation indices for automated crop imaging applications. Comput. Electron. Agric. 2008, 63, 282–293. [Google Scholar] [CrossRef]
- Gitelson, A.A.; Kaufman, Y.J.; Stark, R.; Rundquist, D. Novel algorithms for remote estimation of vegetation fraction. Remote Sens. Environ. 2002, 80, 76–87. [Google Scholar] [CrossRef]
- Louhaichi, M.; Borman, M.M.; Johnson, D.E. Spatially located platform and aerial photography for documentation of grazing impacts on wheat. Geocarto Int. 2001, 16, 65–70. [Google Scholar] [CrossRef]
- Kataoka, T.; Kaneko, T.; Okamoto, H.; Hata, S. Crop growth estimation system using machine vision. In Proceedings of the IEEE/ASME International Conference on Advanced Intelligent Mechatronics, Kobe, Japan, 20–24 July 2003. [Google Scholar]
- Hague, T.; Tillett, N.D.; Wheeler, H. Automated crop and weed monitoring in widely spaced cereals. Precis. Agric. 2006, 7, 21–32. [Google Scholar] [CrossRef]
- Karthikeyan, L.; Chawla, I.; Mishra, A.K. A review of remote sensing applications in agriculture for food security: Crop growth and yield, irrigation, and crop losses. J. Hydrol. 2020, 586, 124905. [Google Scholar] [CrossRef]
- Chew, R.; Rineer, J.; Beach, R.; Neil, M.O.; Ujeneza, N.; Lapidus, D.; Miano, T.; Hegarty-craver, M.; Polly, J.; Temple, D.S. Deep Neural Networks and Transfer Learning for Food Crop Identification in UAV Images. Drones 2020, 4, 7. [Google Scholar] [CrossRef]
- Fu, Z.; Jiang, J.; Gao, Y.; Krienke, B.; Wang, M.; Zhong, K.; Cao, Q.; Tian, Y.; Zhu, Y.; Cao, W.; et al. Wheat growth monitoring and yield estimation based on multi-rotor unmanned aerial vehicle. Remote Sens. 2020, 12, 508. [Google Scholar] [CrossRef]
- Mountrakis, G.; Im, J.; Ogole, C. Support vector machines in remote sensing: A review. ISPRS J. Photogramm. Remote Sens. 2011, 66, 247–259. [Google Scholar] [CrossRef]
- Belgiu, M.; Drăgu, L. Random forest in remote sensing: A review of applications and future directions. ISPRS J. Photogramm. Remote Sens. 2016, 114, 24–31. [Google Scholar] [CrossRef]
- Shi, L.; Duan, Q.; Ma, X.; Weng, M. The research of support vector machine in agricultural data classification. In Proceedings of the International Conference on Computer and Computing Technologies in Agriculture, Beijing, China, 29–31 October 2011; Daoliang, L., Chen, Y., Eds.; Springer: Beijing, China, 2012. 5p. [Google Scholar]
- Maimaitijiang, M.; Sagan, V.; Sidike, P.; Daloye, A.M. Crop Monitoring Using Satellite / UAV Data Fusion and Machine Learning. Remote Sens. 2020, 12, 1357. [Google Scholar] [CrossRef]
- Shrestha, R.; Zevenbergen, J.; Panday, U.S.; Awasthi, B.; Karki, S. Revisiting the current uav regulations in Nepal: A step towards legal dimension for uavs efficient application. Int. Arch. Photogramm. Remote Sens. Spat. Inf. Sci. 2019, 42, 107–114. [Google Scholar] [CrossRef]
- Hämmerle, M.; Höfle, B.; Höfle, B. Effects of reduced terrestrial LiDAR point density on high-resolution grain crop surface models in precision agriculture. Sensors 2014, 14, 24212–24230. [Google Scholar] [CrossRef]
- Mlambo, R.; Woodhouse, I.H.; Gerard, F.; Anderson, K. Structure from Motion (SfM) Photogrammetry with Drone Data: A Low Cost Method for Monitoring Greenhouse Gas Emissions from Forests in Developing Countries. Forests 2017, 8, 68. [Google Scholar] [CrossRef]
- ITU. Indicator 9.C.1: Proportion of Population Covered by a Mobile Network, by Technology. Available online: https://www.itu.int/en/ITU-D/Statistics/Pages/SDGs-ITU-ICT-indicators.aspx (accessed on 1 July 2020).
- Jin, X.; Kumar, L.; Li, Z.; Feng, H.; Xu, X.; Yang, G.; Wang, J. A review of data assimilation of remote sensing and crop models. Eur. J. Agron. 2018, 92, 141–152. [Google Scholar] [CrossRef]
- Neupane, H.; Adhikari, M.; Rauniyar, P.B. Farmers’ perception on role of cooperatives in agriculture practices of major cereal crops in Western Terai of Nepal. J. Inst. Agric. Anim. Sci. 2015, 33–34, 177–186. [Google Scholar] [CrossRef]
- Tamiminia, H.; Salehi, B.; Mahdianpari, M.; Quackenbush, L.; Adeli, S.; Brisco, B. Google Earth Engine for geo-big data applications: A meta-analysis and systematic review. ISPRS J. Photogramm. Remote Sens. 2020, 164, 152–170. [Google Scholar] [CrossRef]
- Kotas, C.; Naughton, T.; Imam, N. A comparison of Amazon Web Services and Microsoft Azure cloud platforms for high performance computing. In Proceedings of the 2018 IEEE International Conference on Consumer Electronics, Las Vegas, NV, USA, 12–14 January 2018. [Google Scholar]
- Joshi, E.; Sasode, D.S.; Chouhan, N. Revolution of Indian Agriculture Through Drone Technology. Biot. Res. Today 2020, 2, 174–176. [Google Scholar]
- Honkavaara, E.; Saari, H.; Kaivosoja, J.; Polonen, I.; Hakala, T.; Litkey, P.; Makynen, J.; Pesonen, L. Processing and Assessment of Spectrometric, Stereoscopic Imagery Collected Using a Lightweight UAV Spectral Camera for Precision Agriculture. Remote Sens. 2013, 5, 5006–5039. [Google Scholar] [CrossRef]
- Tang, Z.; Wang, H.; Li, X.; Li, X.; Cai, W.; Han, C. An object-based approach for mapping crop coverage using multiscale weighted and machine learning methods. IEEE J. Sel. Top. Appl. Earth Obs. Remote Sens. 2020, 13, 1700–1713. [Google Scholar] [CrossRef]
- Brammer, J.R.; Brunet, N.D.; Burton, A.C.; Cuerrier, A.; Danielsen, F.; Dewan, K.; Herrmann, T.M.; Jackson, M.V.; Kennett, R.; Larocque, G.; et al. The role of digital data entry in participatory environmental monitoring. Conserv. Biol. 2016, 30, 1277–1287. [Google Scholar] [CrossRef]
- Pratihast, A.K.; Herold, M.; Avitabile, V.; De Bruin, S.; Bartholomeus, H.; Souza, C.M.; Ribbe, L. Mobile devices for community-based REDD+ monitoring: A case study for central Vietnam. Sensors (Switzerland) 2013, 13, 21–38. [Google Scholar] [CrossRef]
- Pratihast, A.K.; Herold, M.; De Sy, V.; Murdiyarso, D.; Skutsch, M. Linking community-based and national REDD+ monitoring: A review of the potential. Carbon Manag. 2013, 4, 91–104. [Google Scholar] [CrossRef]


© 2020 by the authors. Licensee MDPI, Basel, Switzerland. This article is an open access article distributed under the terms and conditions of the Creative Commons Attribution (CC BY) license (http://creativecommons.org/licenses/by/4.0/).