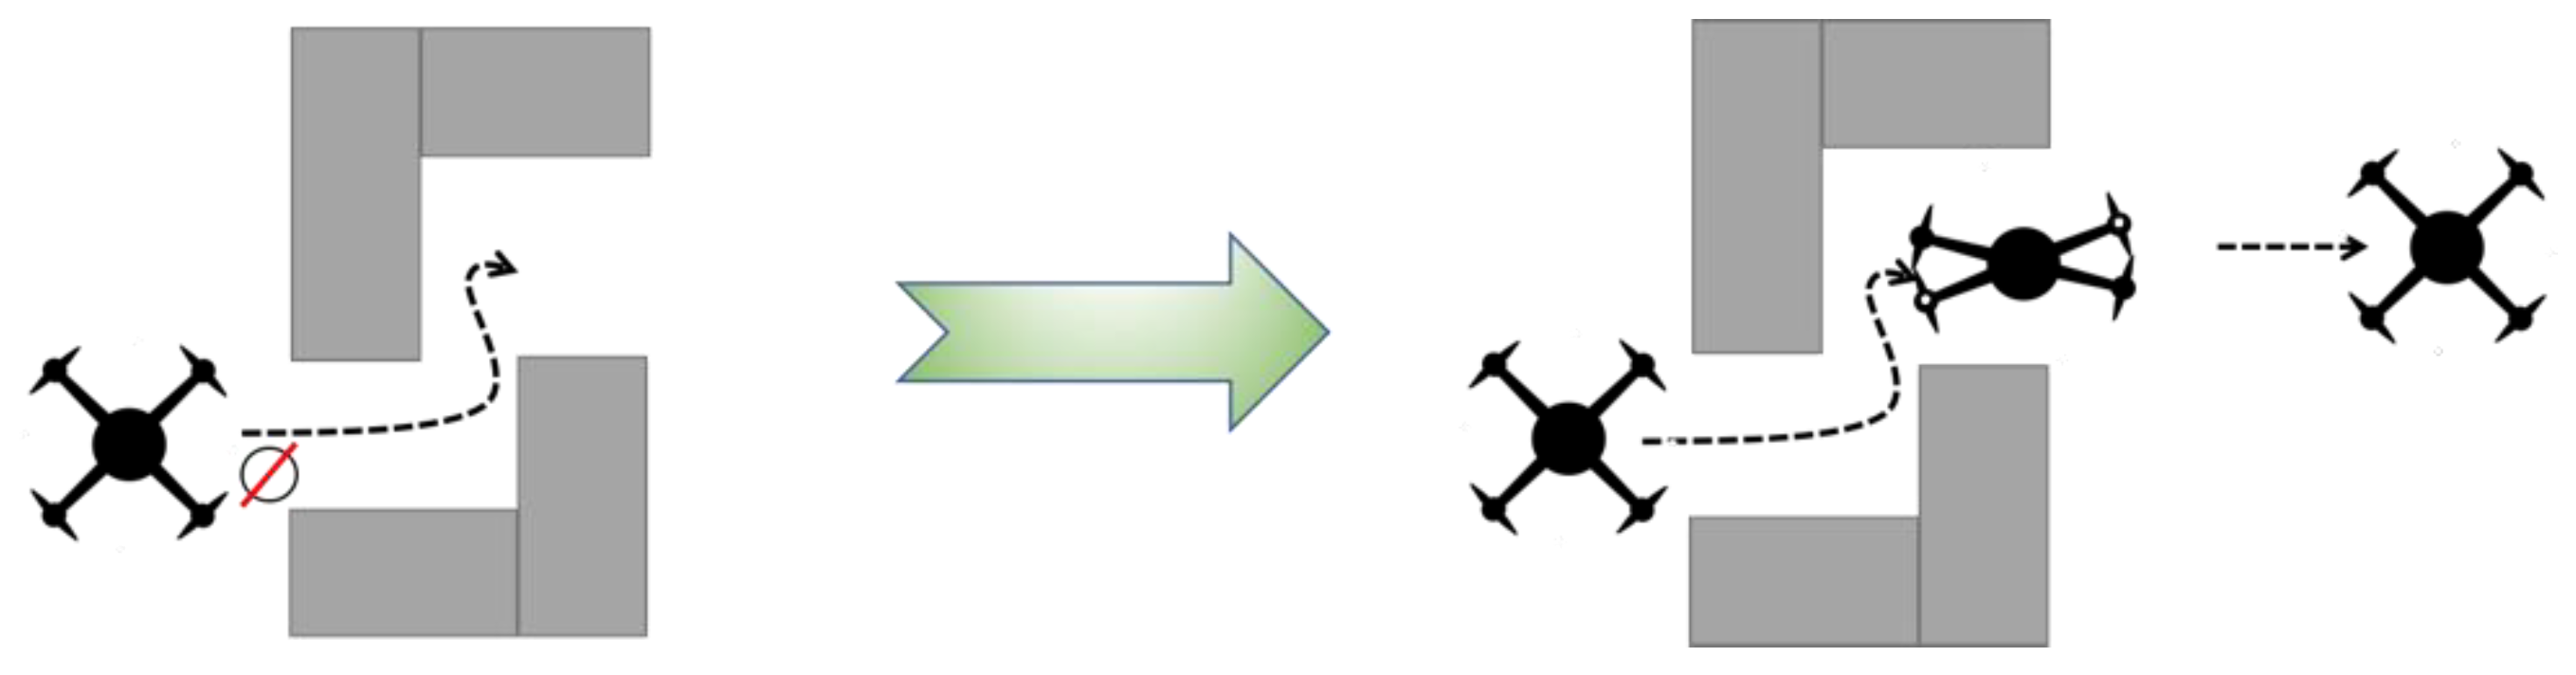
Figure 1.
Illustration of the rationale for morphing geometry capability on a quadcopter.
Figure 1.
Illustration of the rationale for morphing geometry capability on a quadcopter.
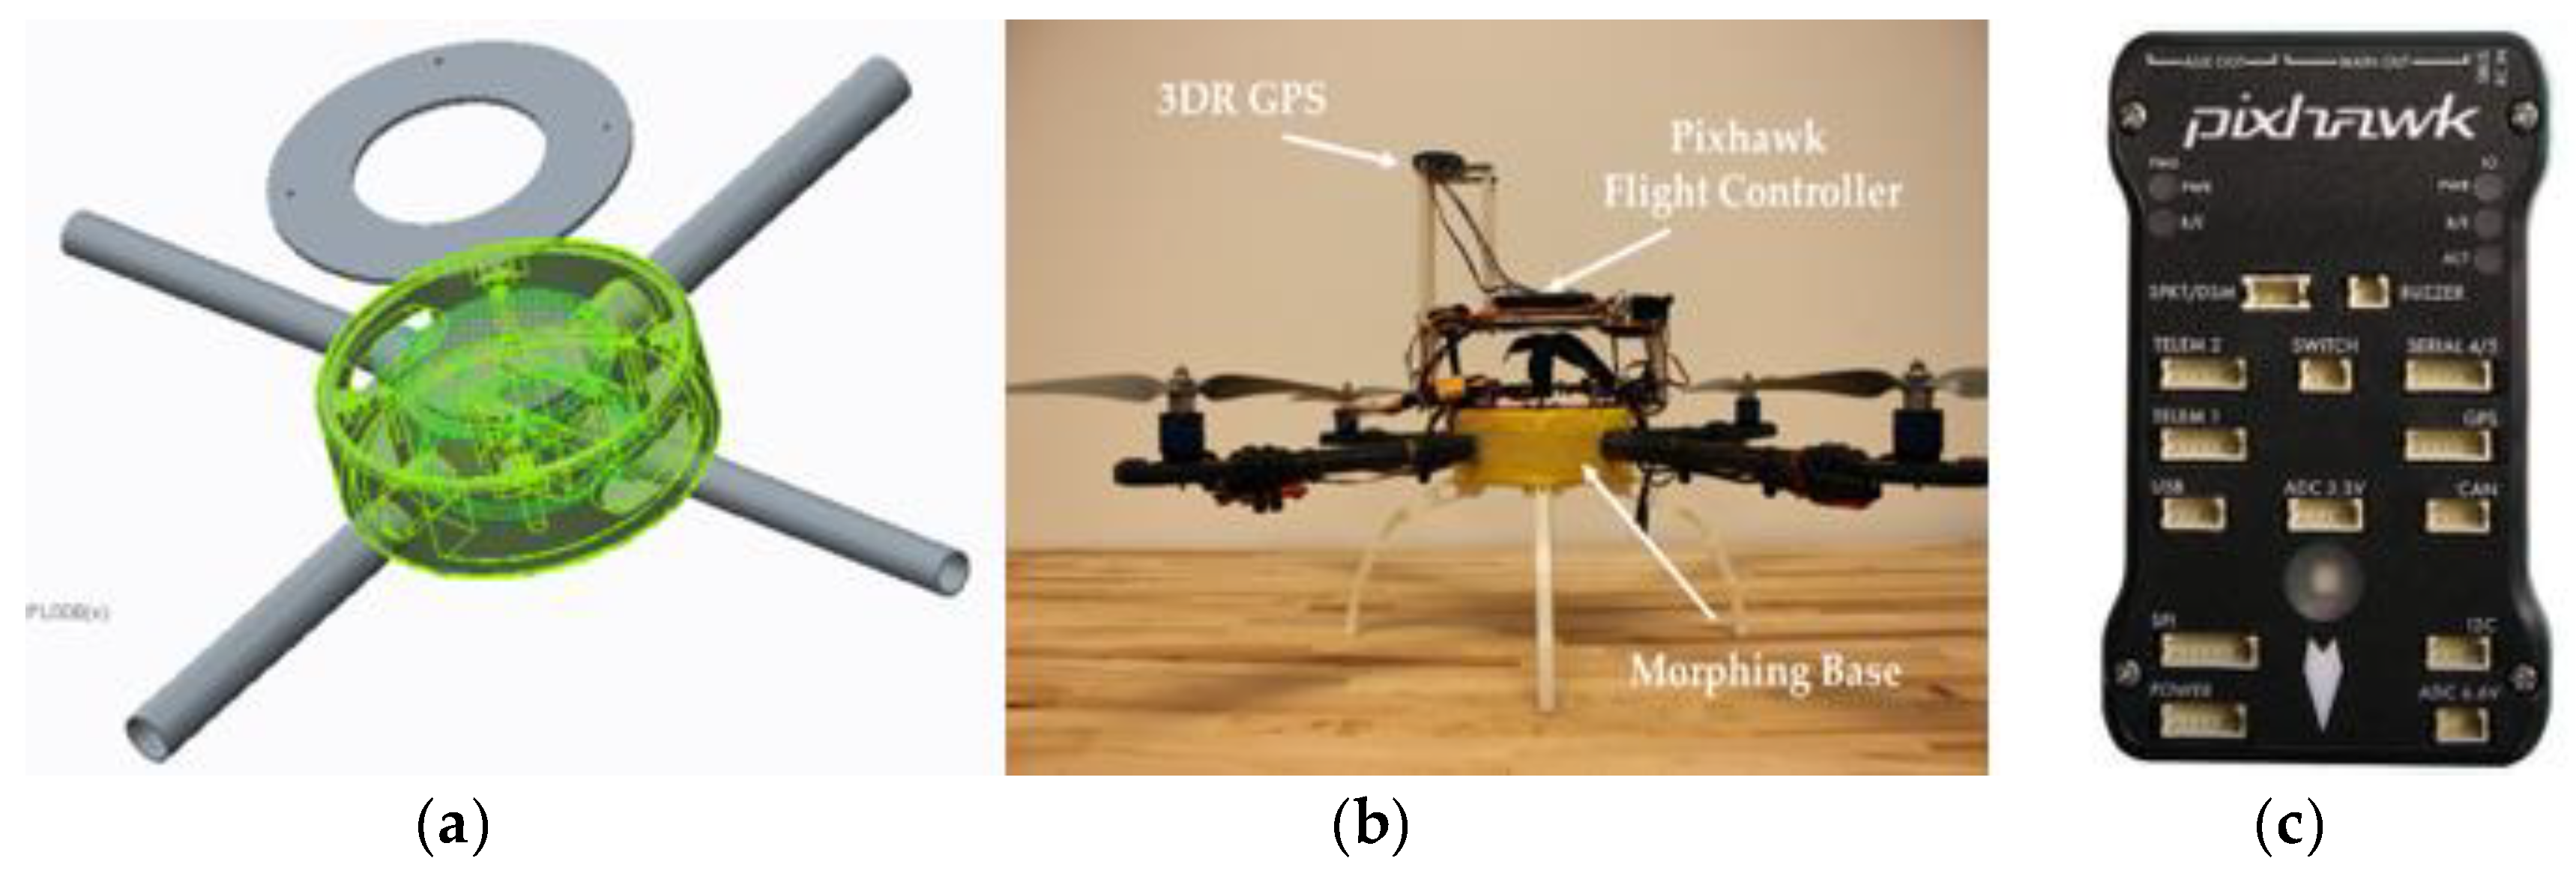
Figure 2.
(a) Wireframe of the Morphing Mechanism; (b) Flight Ready, Morphing Geometry quadcopter UAS; (c) Pixhawk flight controller.
Figure 2.
(a) Wireframe of the Morphing Mechanism; (b) Flight Ready, Morphing Geometry quadcopter UAS; (c) Pixhawk flight controller.
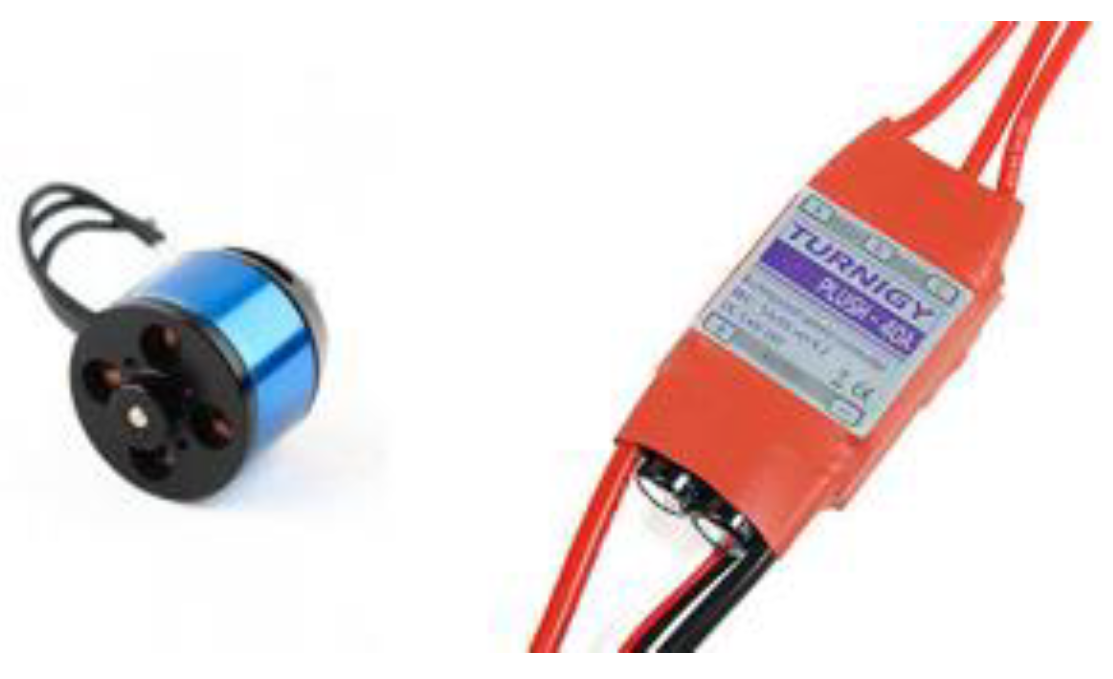
Figure 3.
Motor (left) and speed controller (right).
Figure 3.
Motor (left) and speed controller (right).
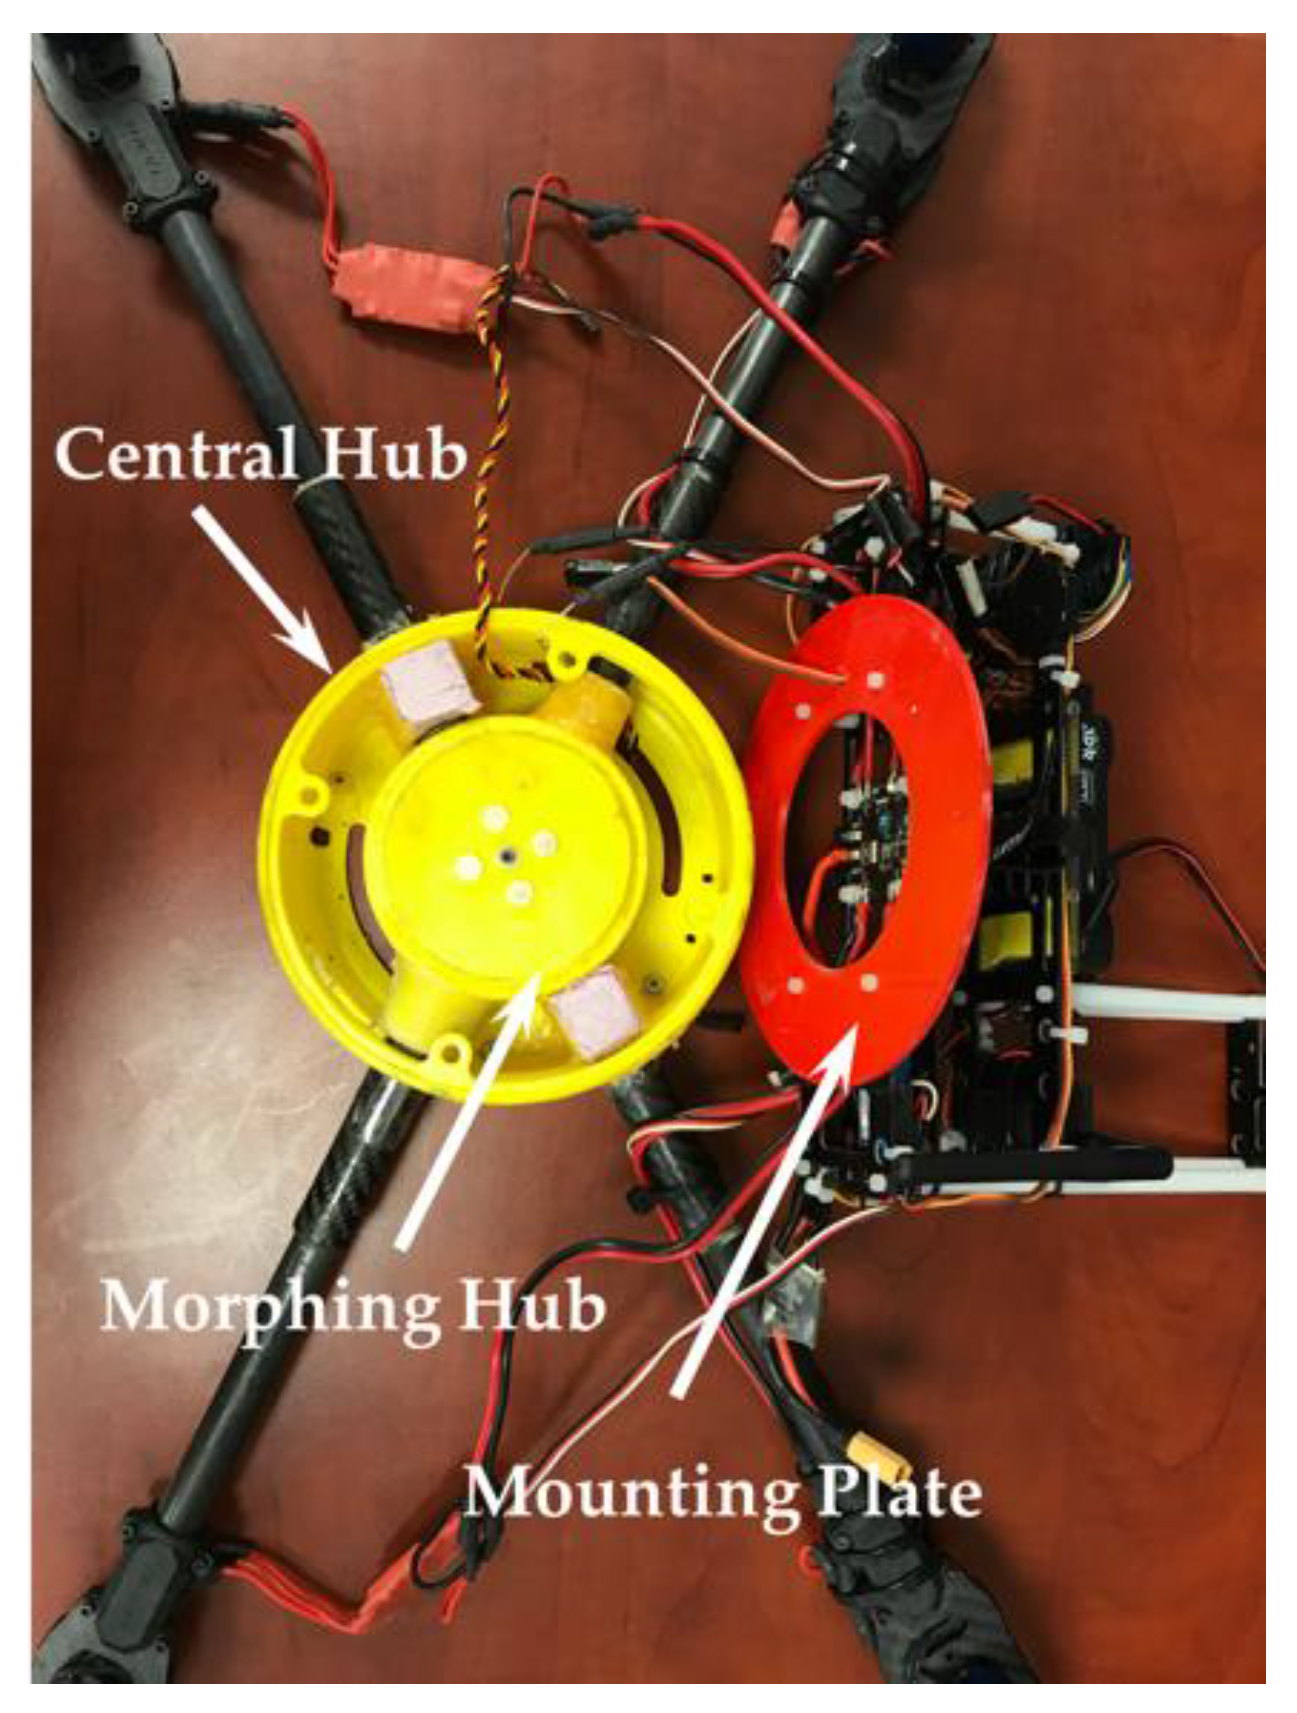
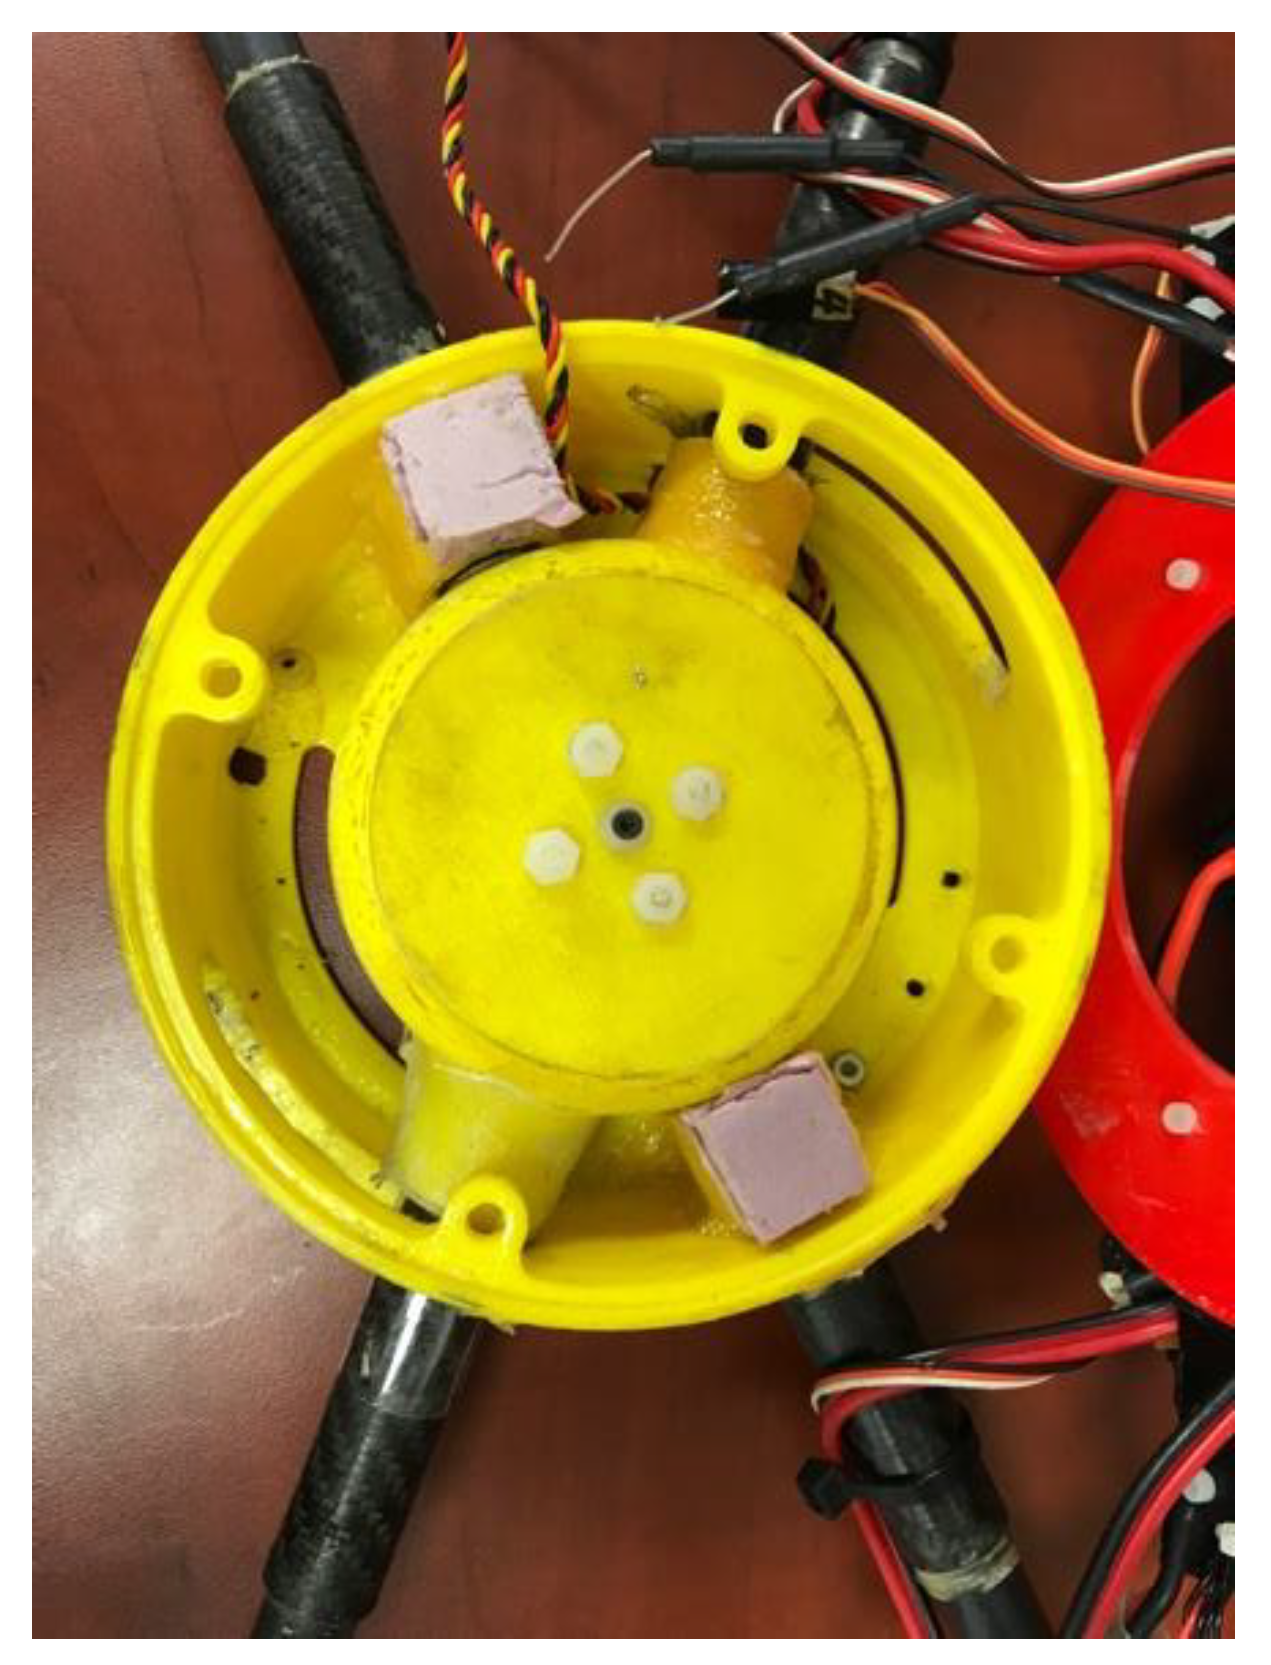
Figure 5.
Close-up of the Morphing Hub.
Figure 5.
Close-up of the Morphing Hub.
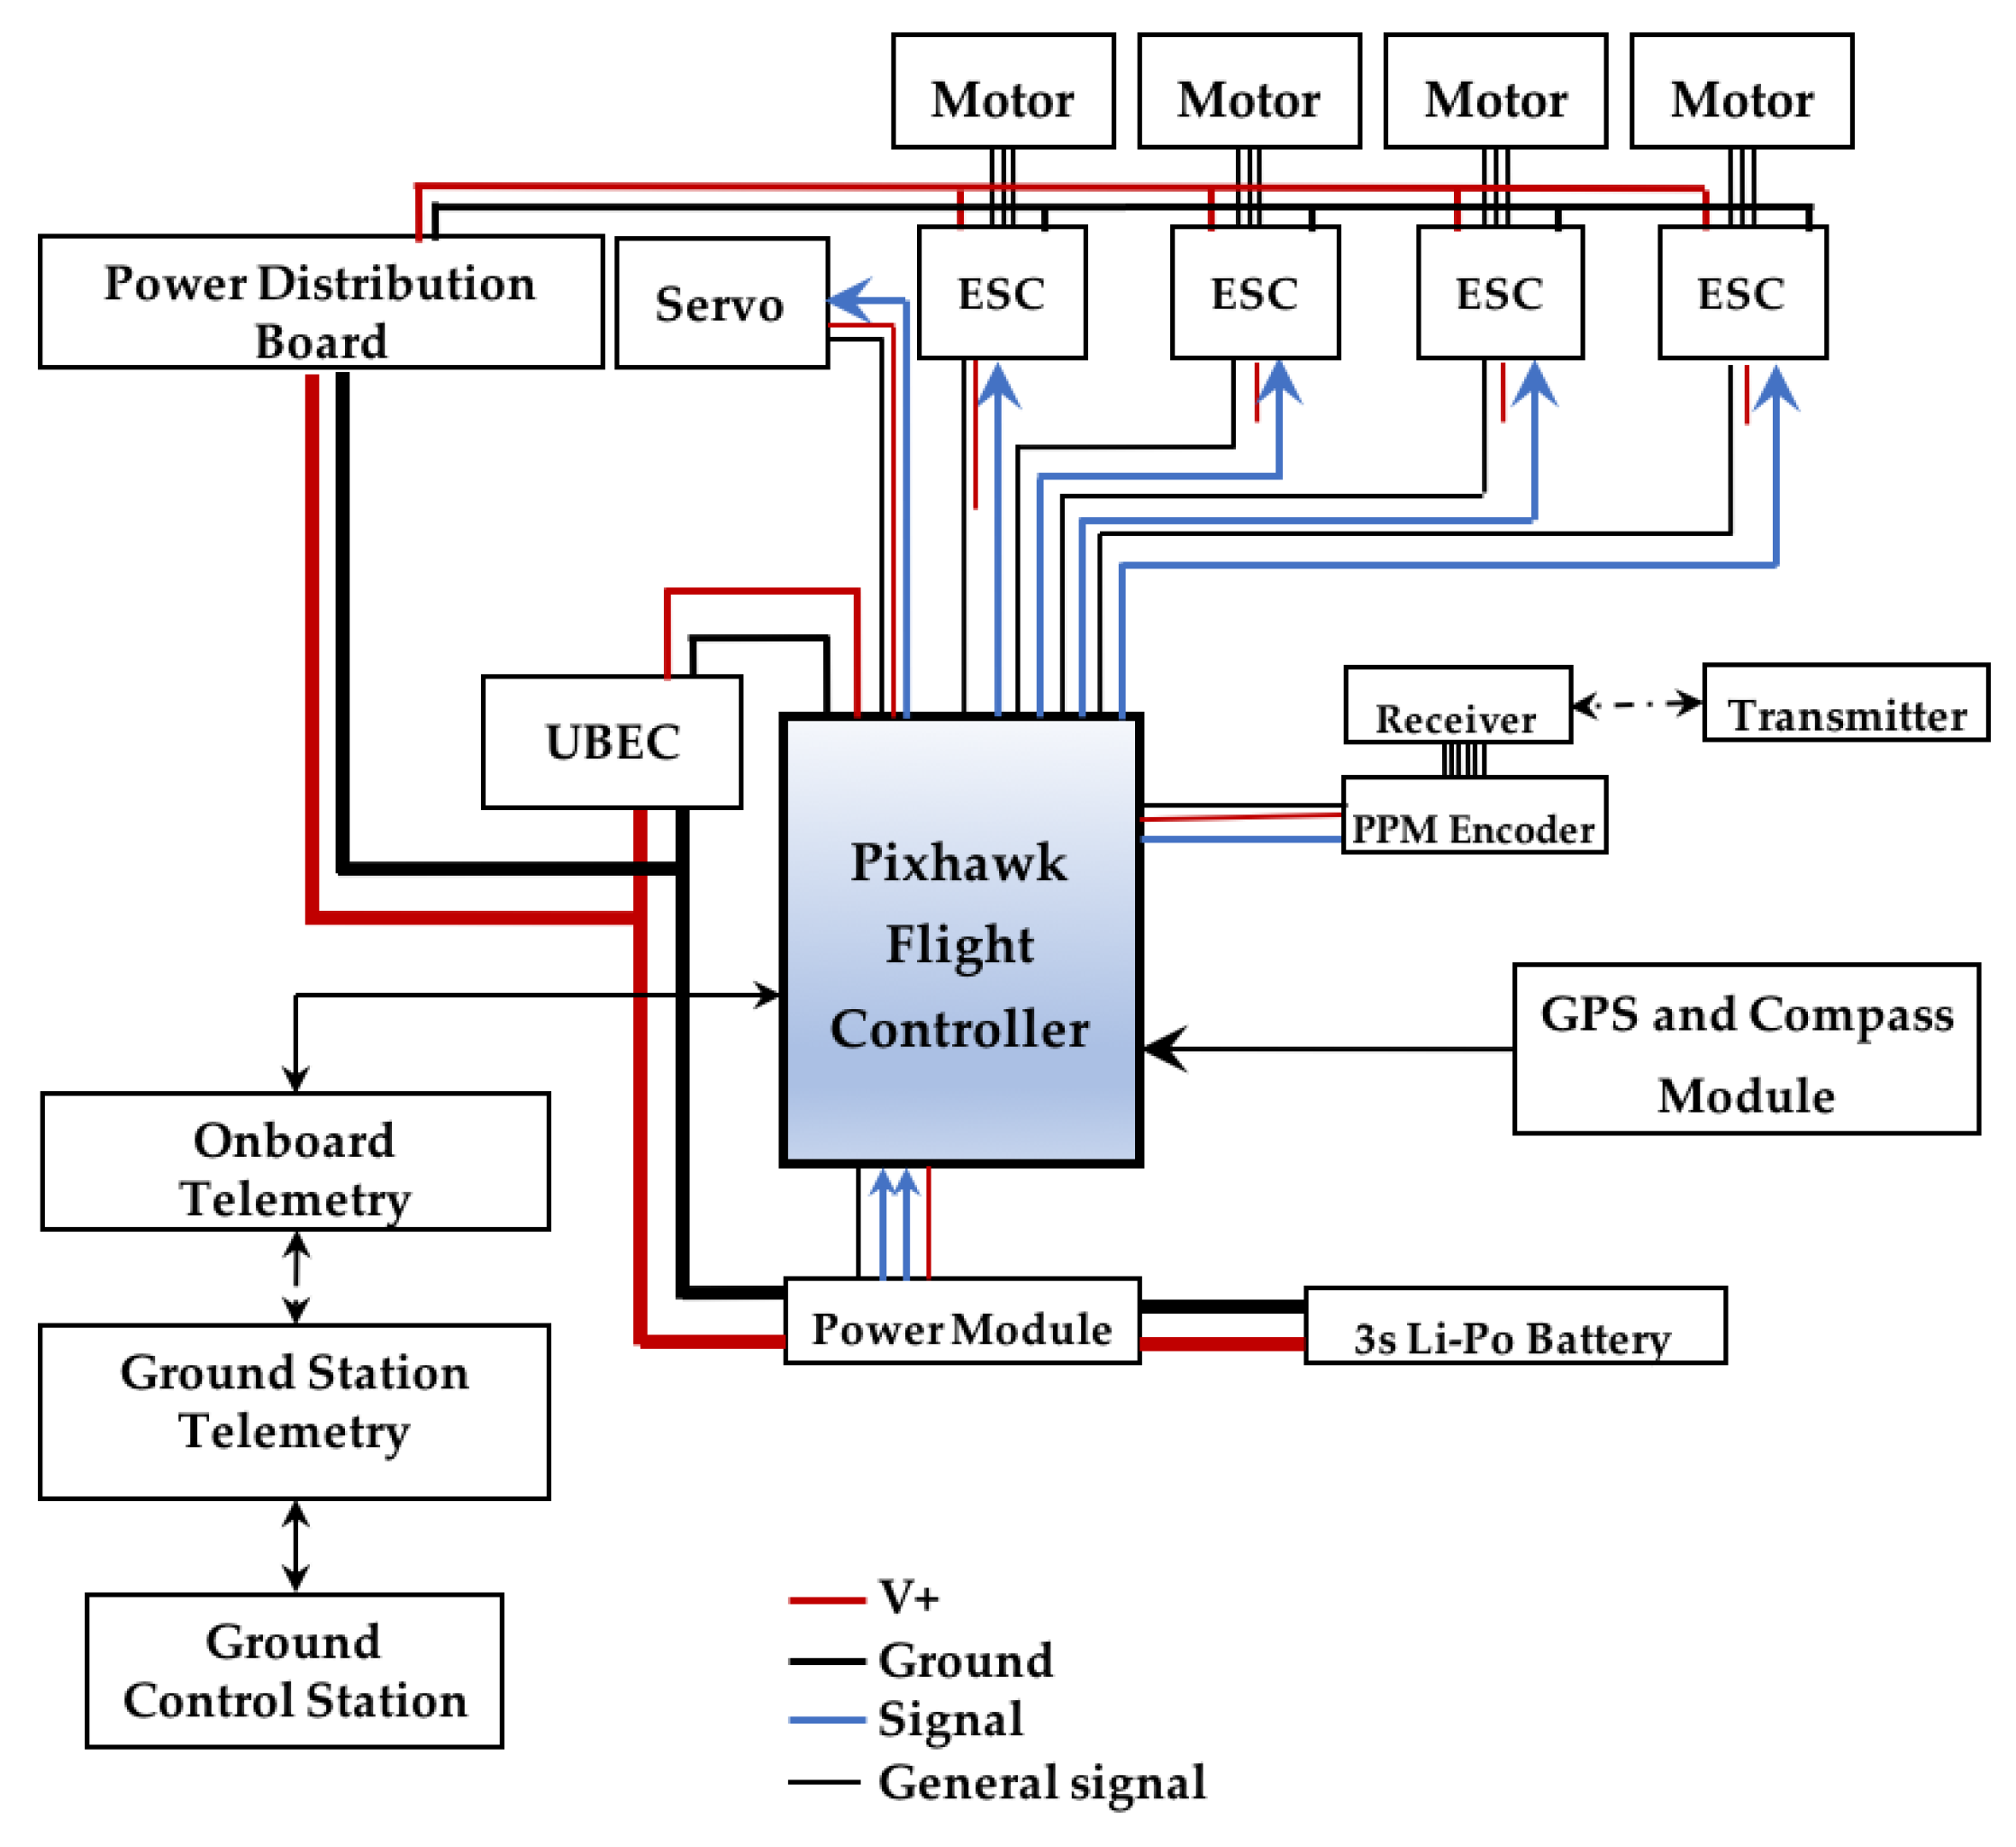
Figure 6.
General power distribution of the quadcopter.
Figure 6.
General power distribution of the quadcopter.
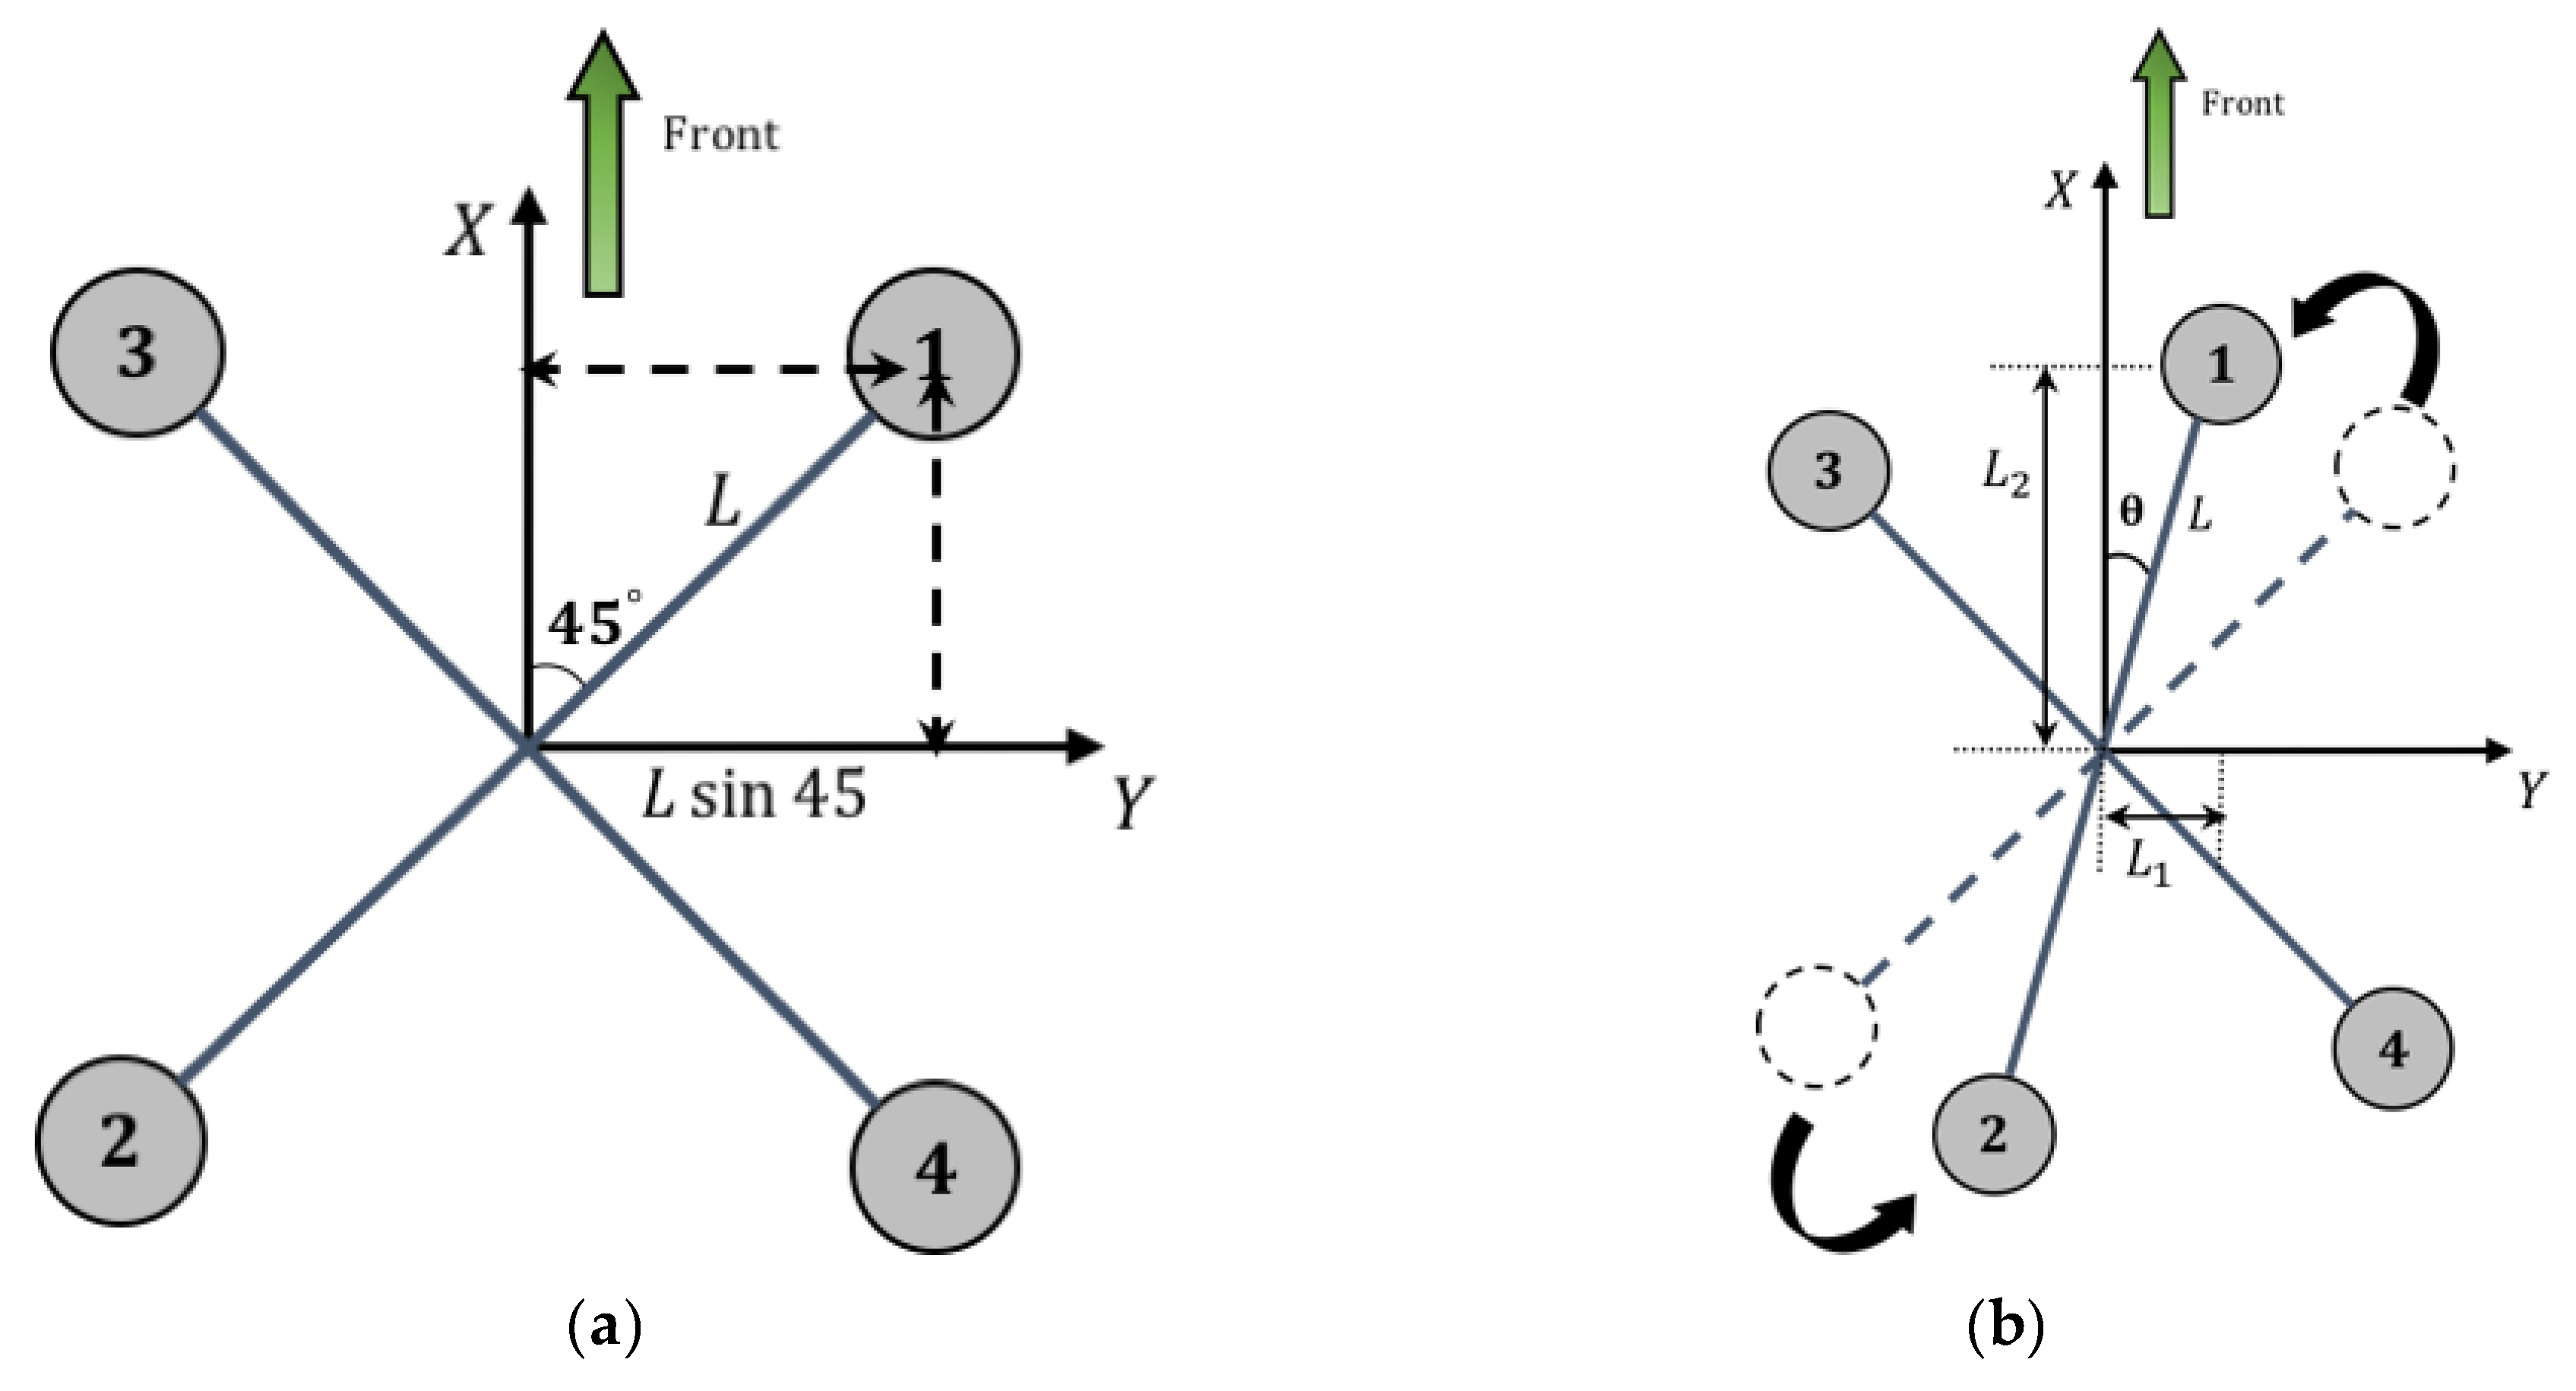
Figure 7.
Quadcopter in (a) normal configuration and (b) quadcopter transitioning from normal to morphed configuration.
Figure 7.
Quadcopter in (a) normal configuration and (b) quadcopter transitioning from normal to morphed configuration.
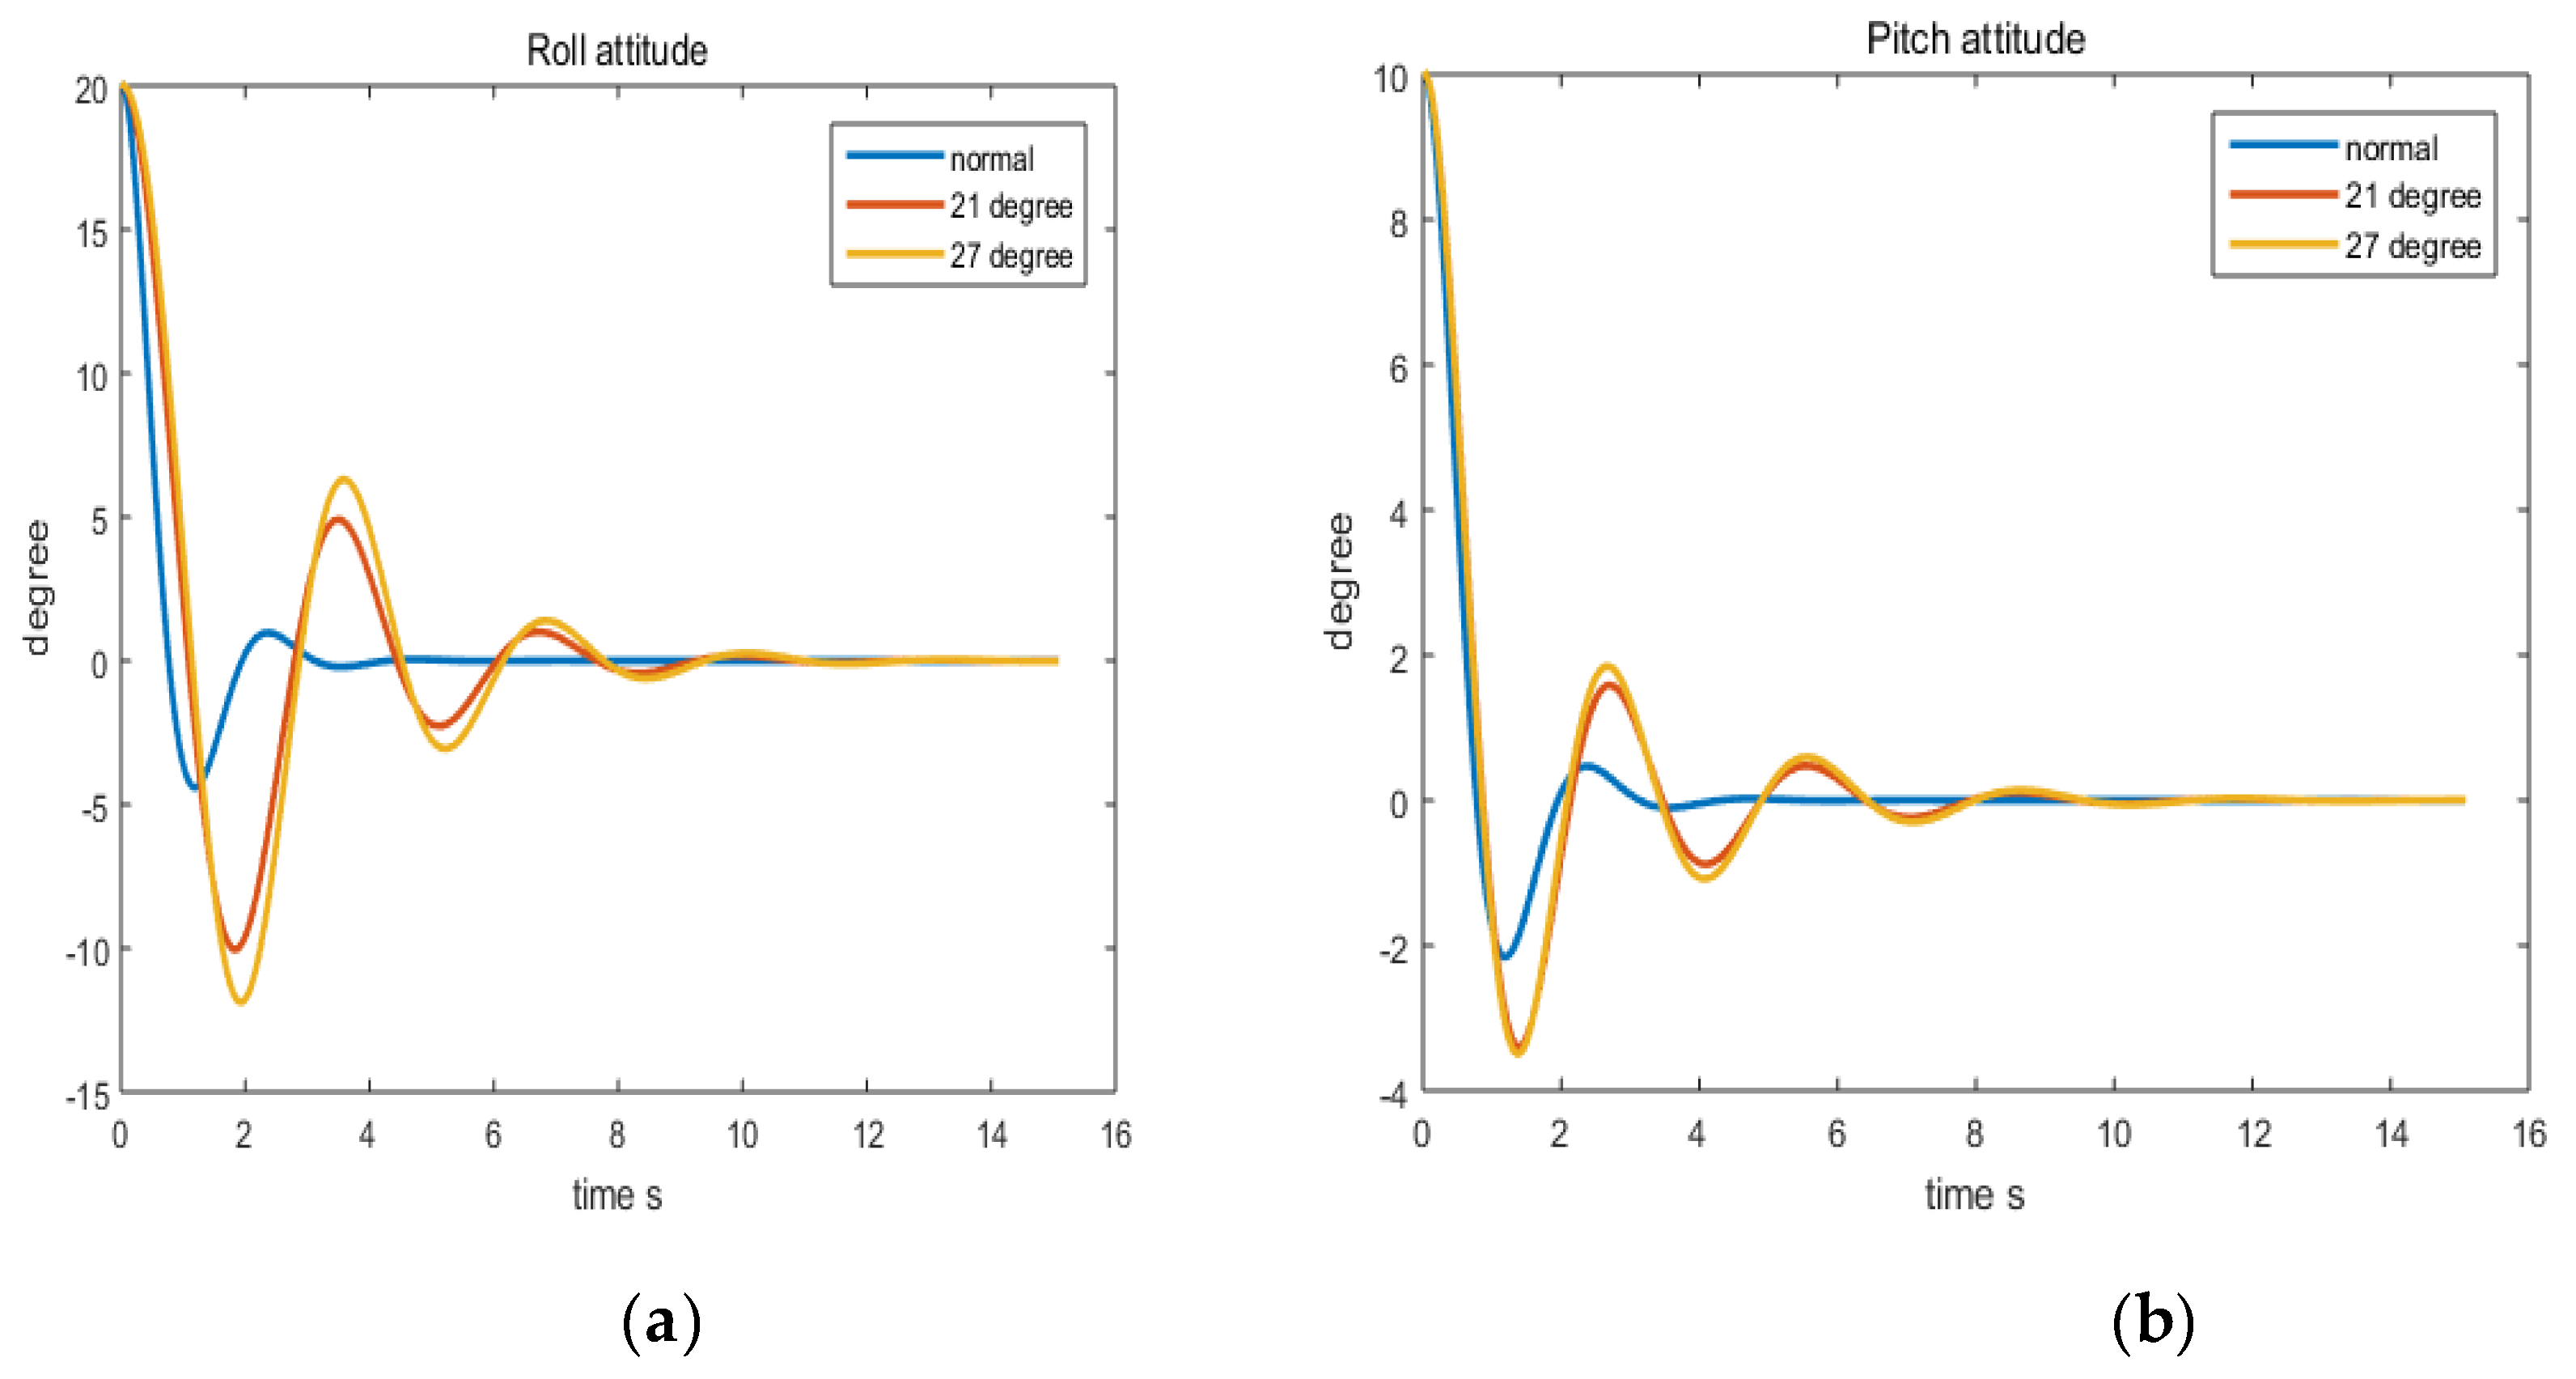
Figure 8.
Simulation response of (a) roll (l) and (b) pitch (r) attitude between normal and morphed geometries.
Figure 8.
Simulation response of (a) roll (l) and (b) pitch (r) attitude between normal and morphed geometries.
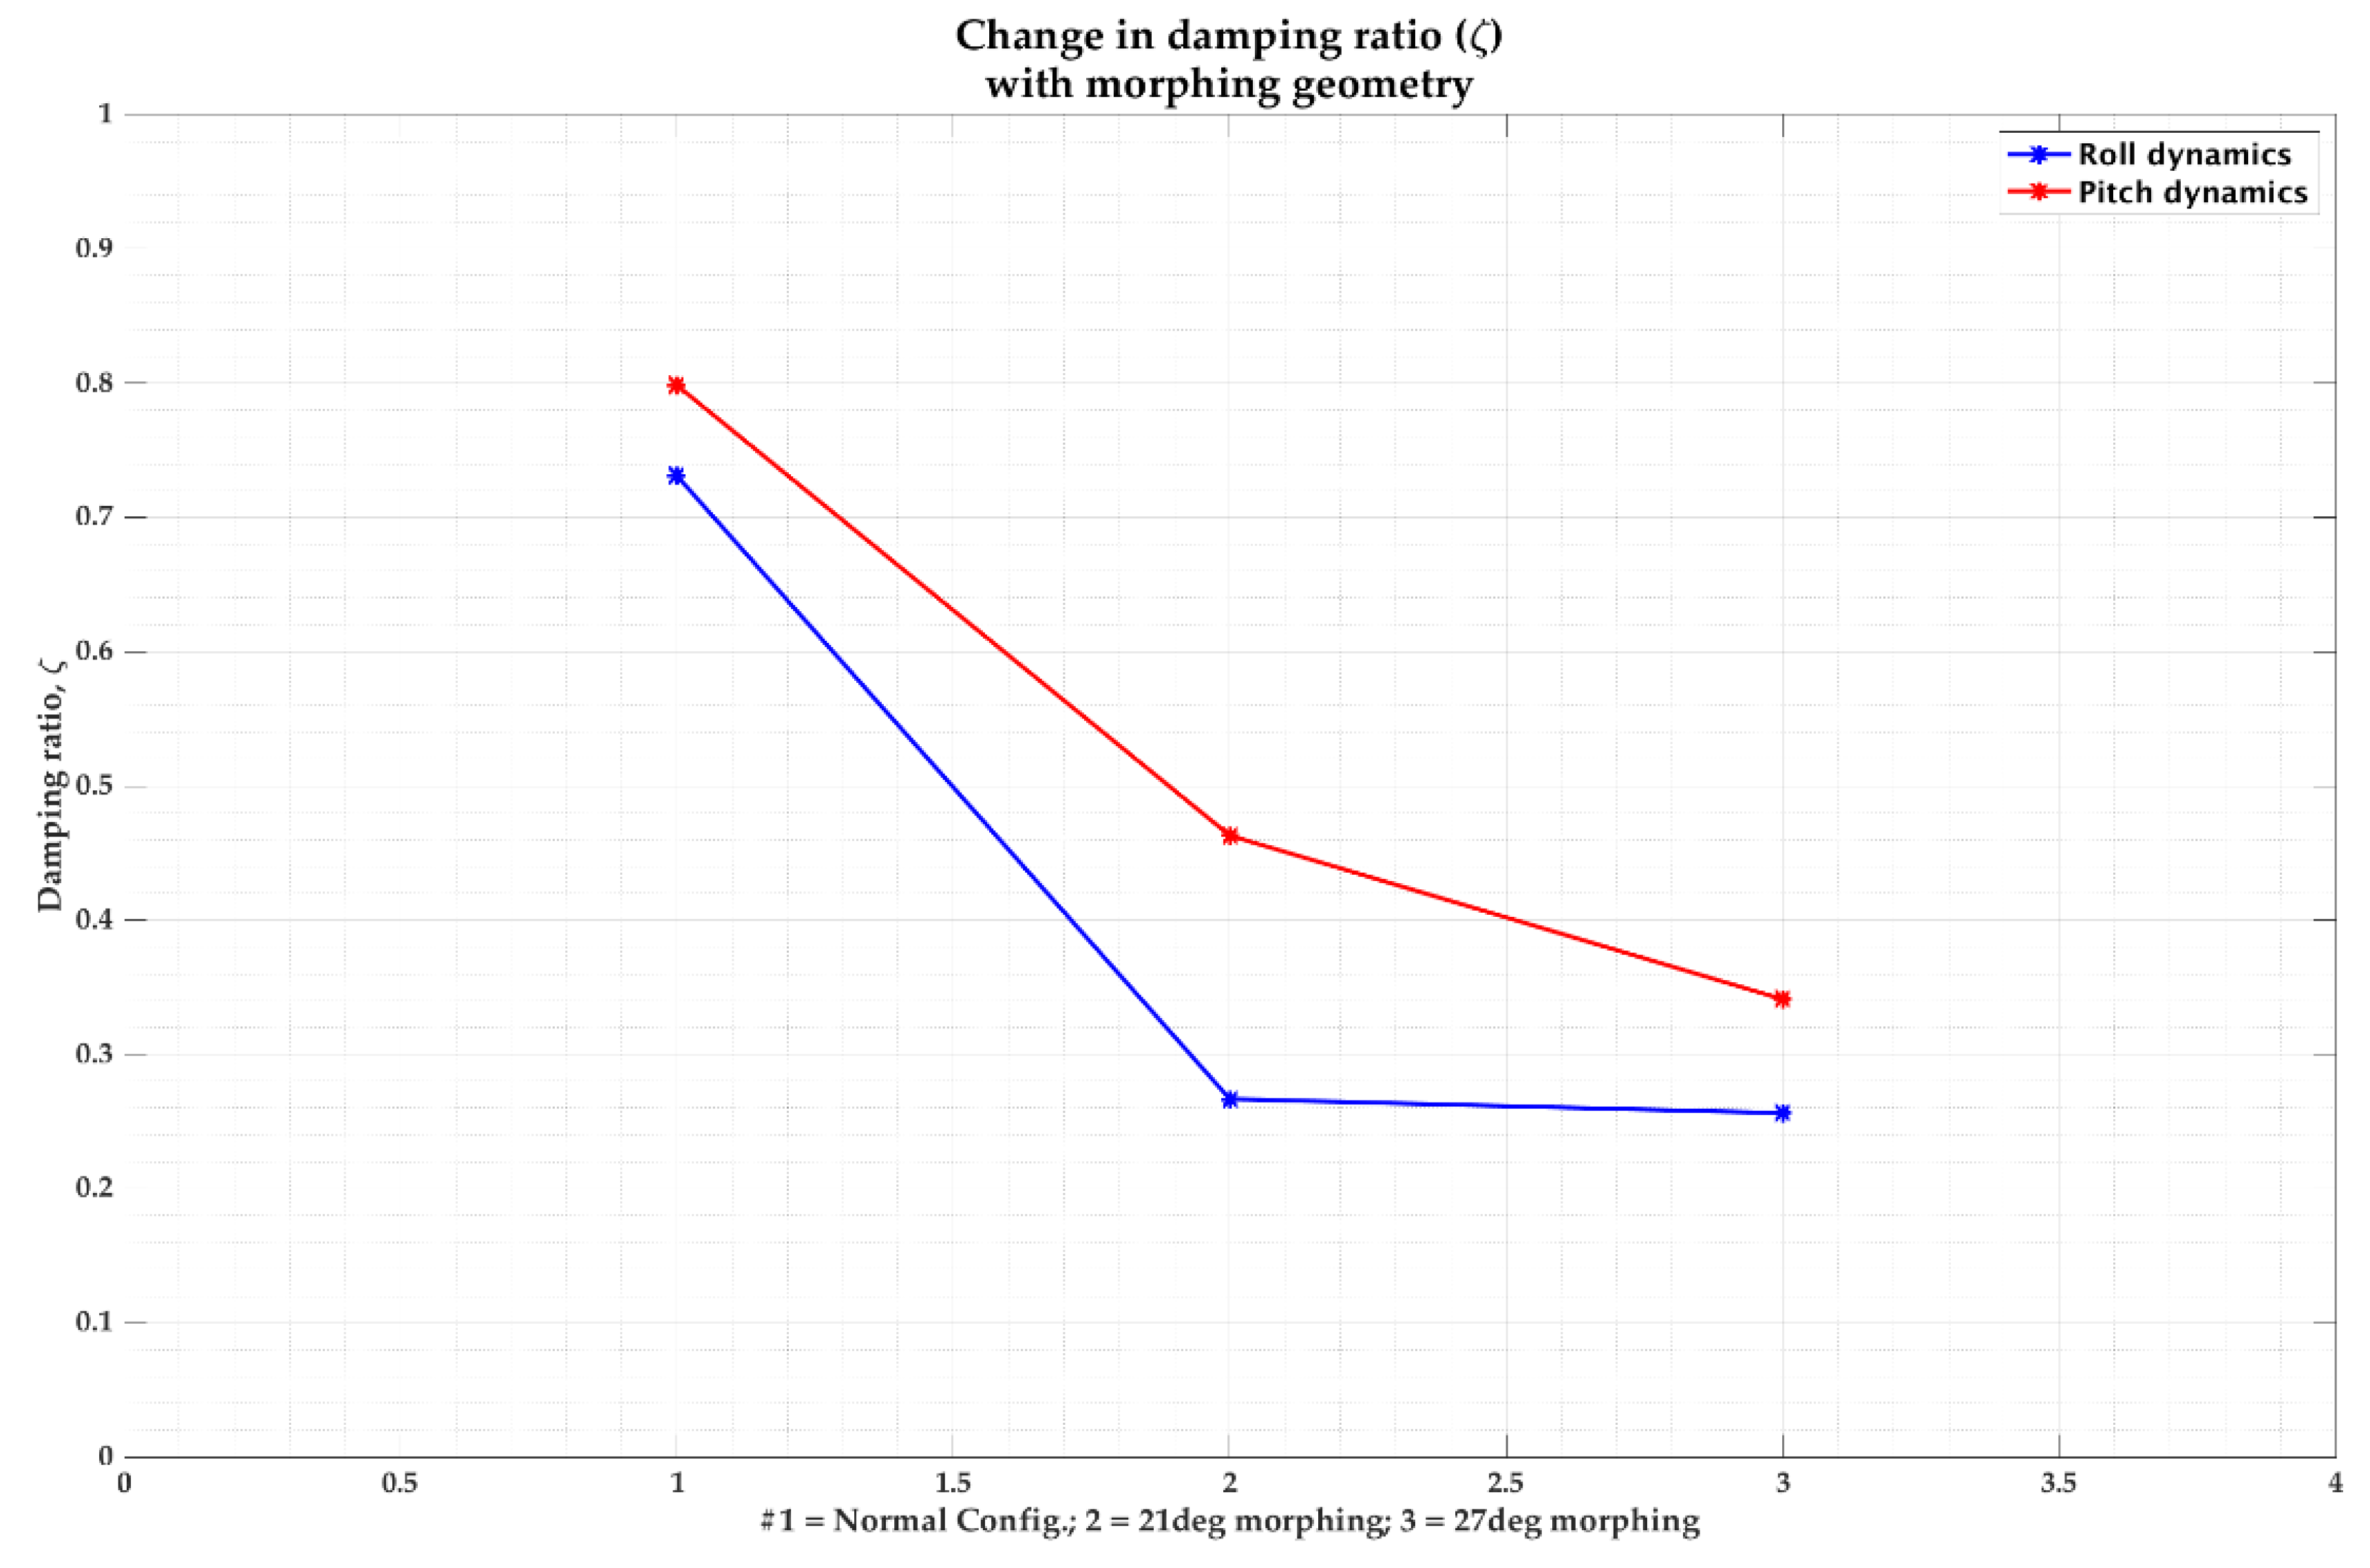
Figure 9.
Trend of changing damping ratio, with changes in the morphing angle.
Figure 9.
Trend of changing damping ratio, with changes in the morphing angle.
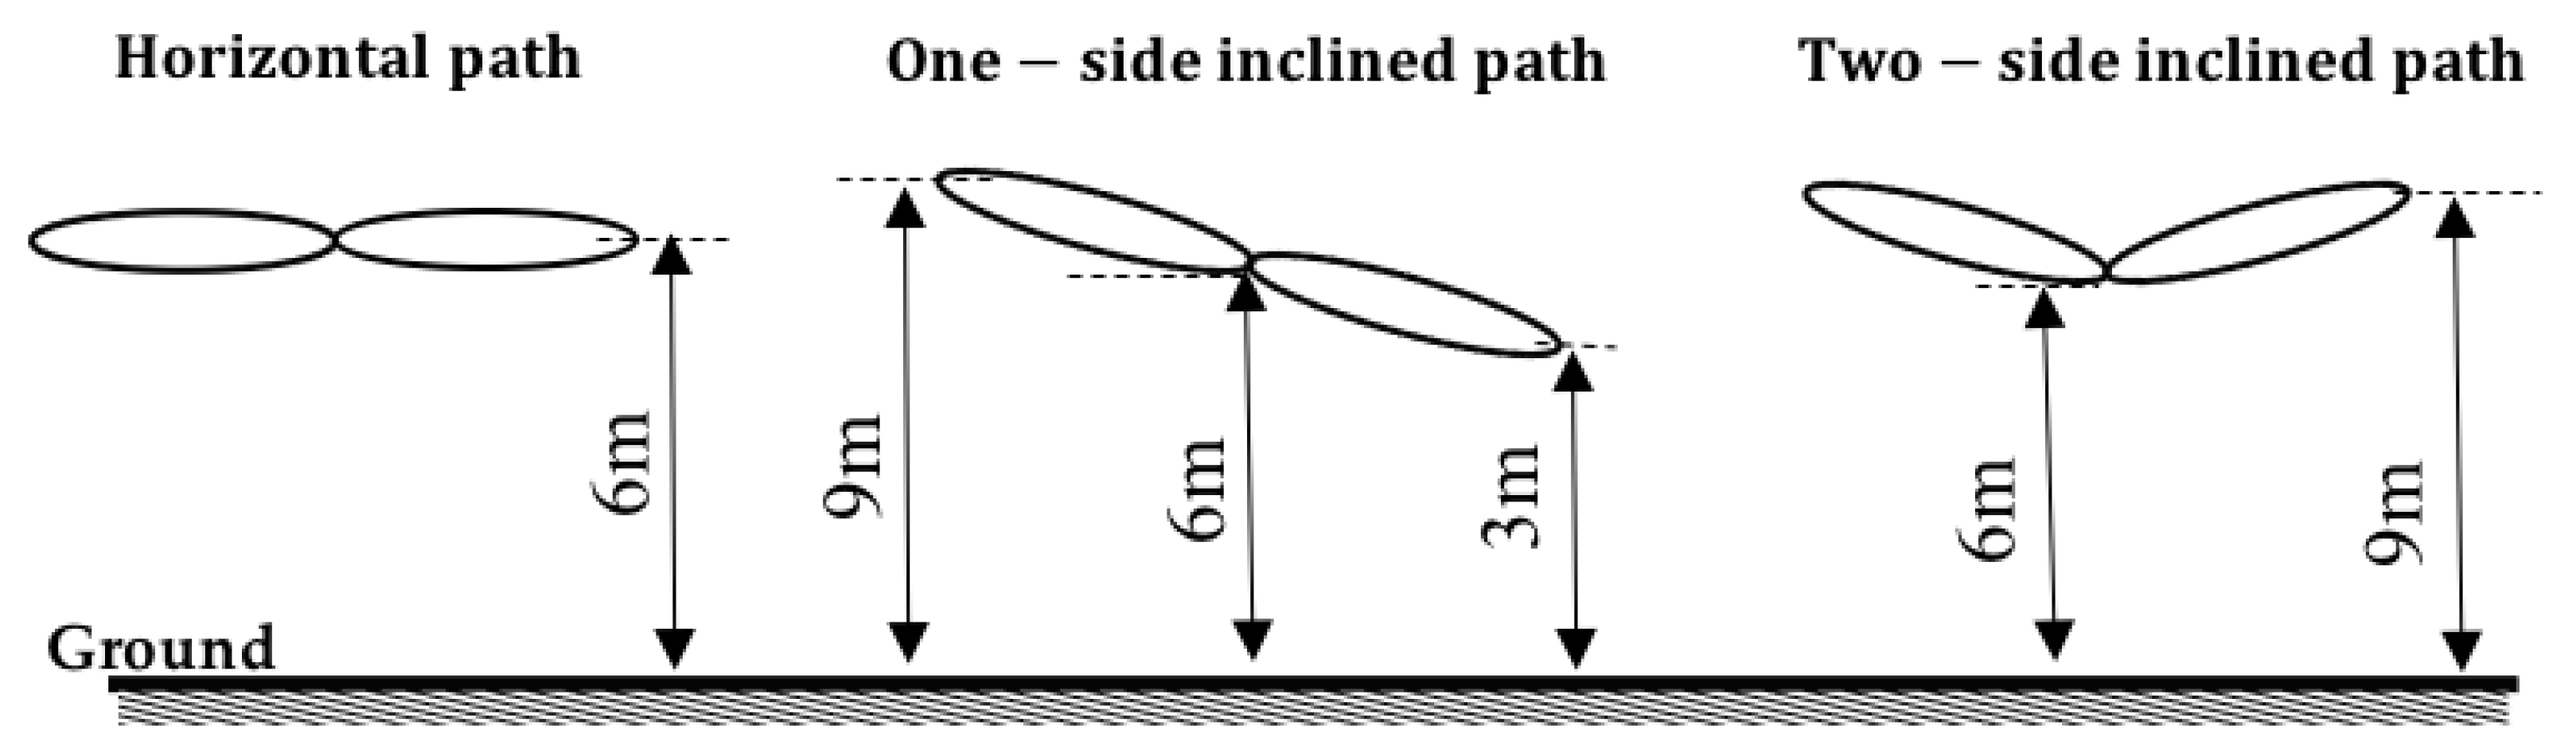
Figure 10.
Illustrations of the flight paths as described in
Table 6.
Figure 10.
Illustrations of the flight paths as described in
Table 6.
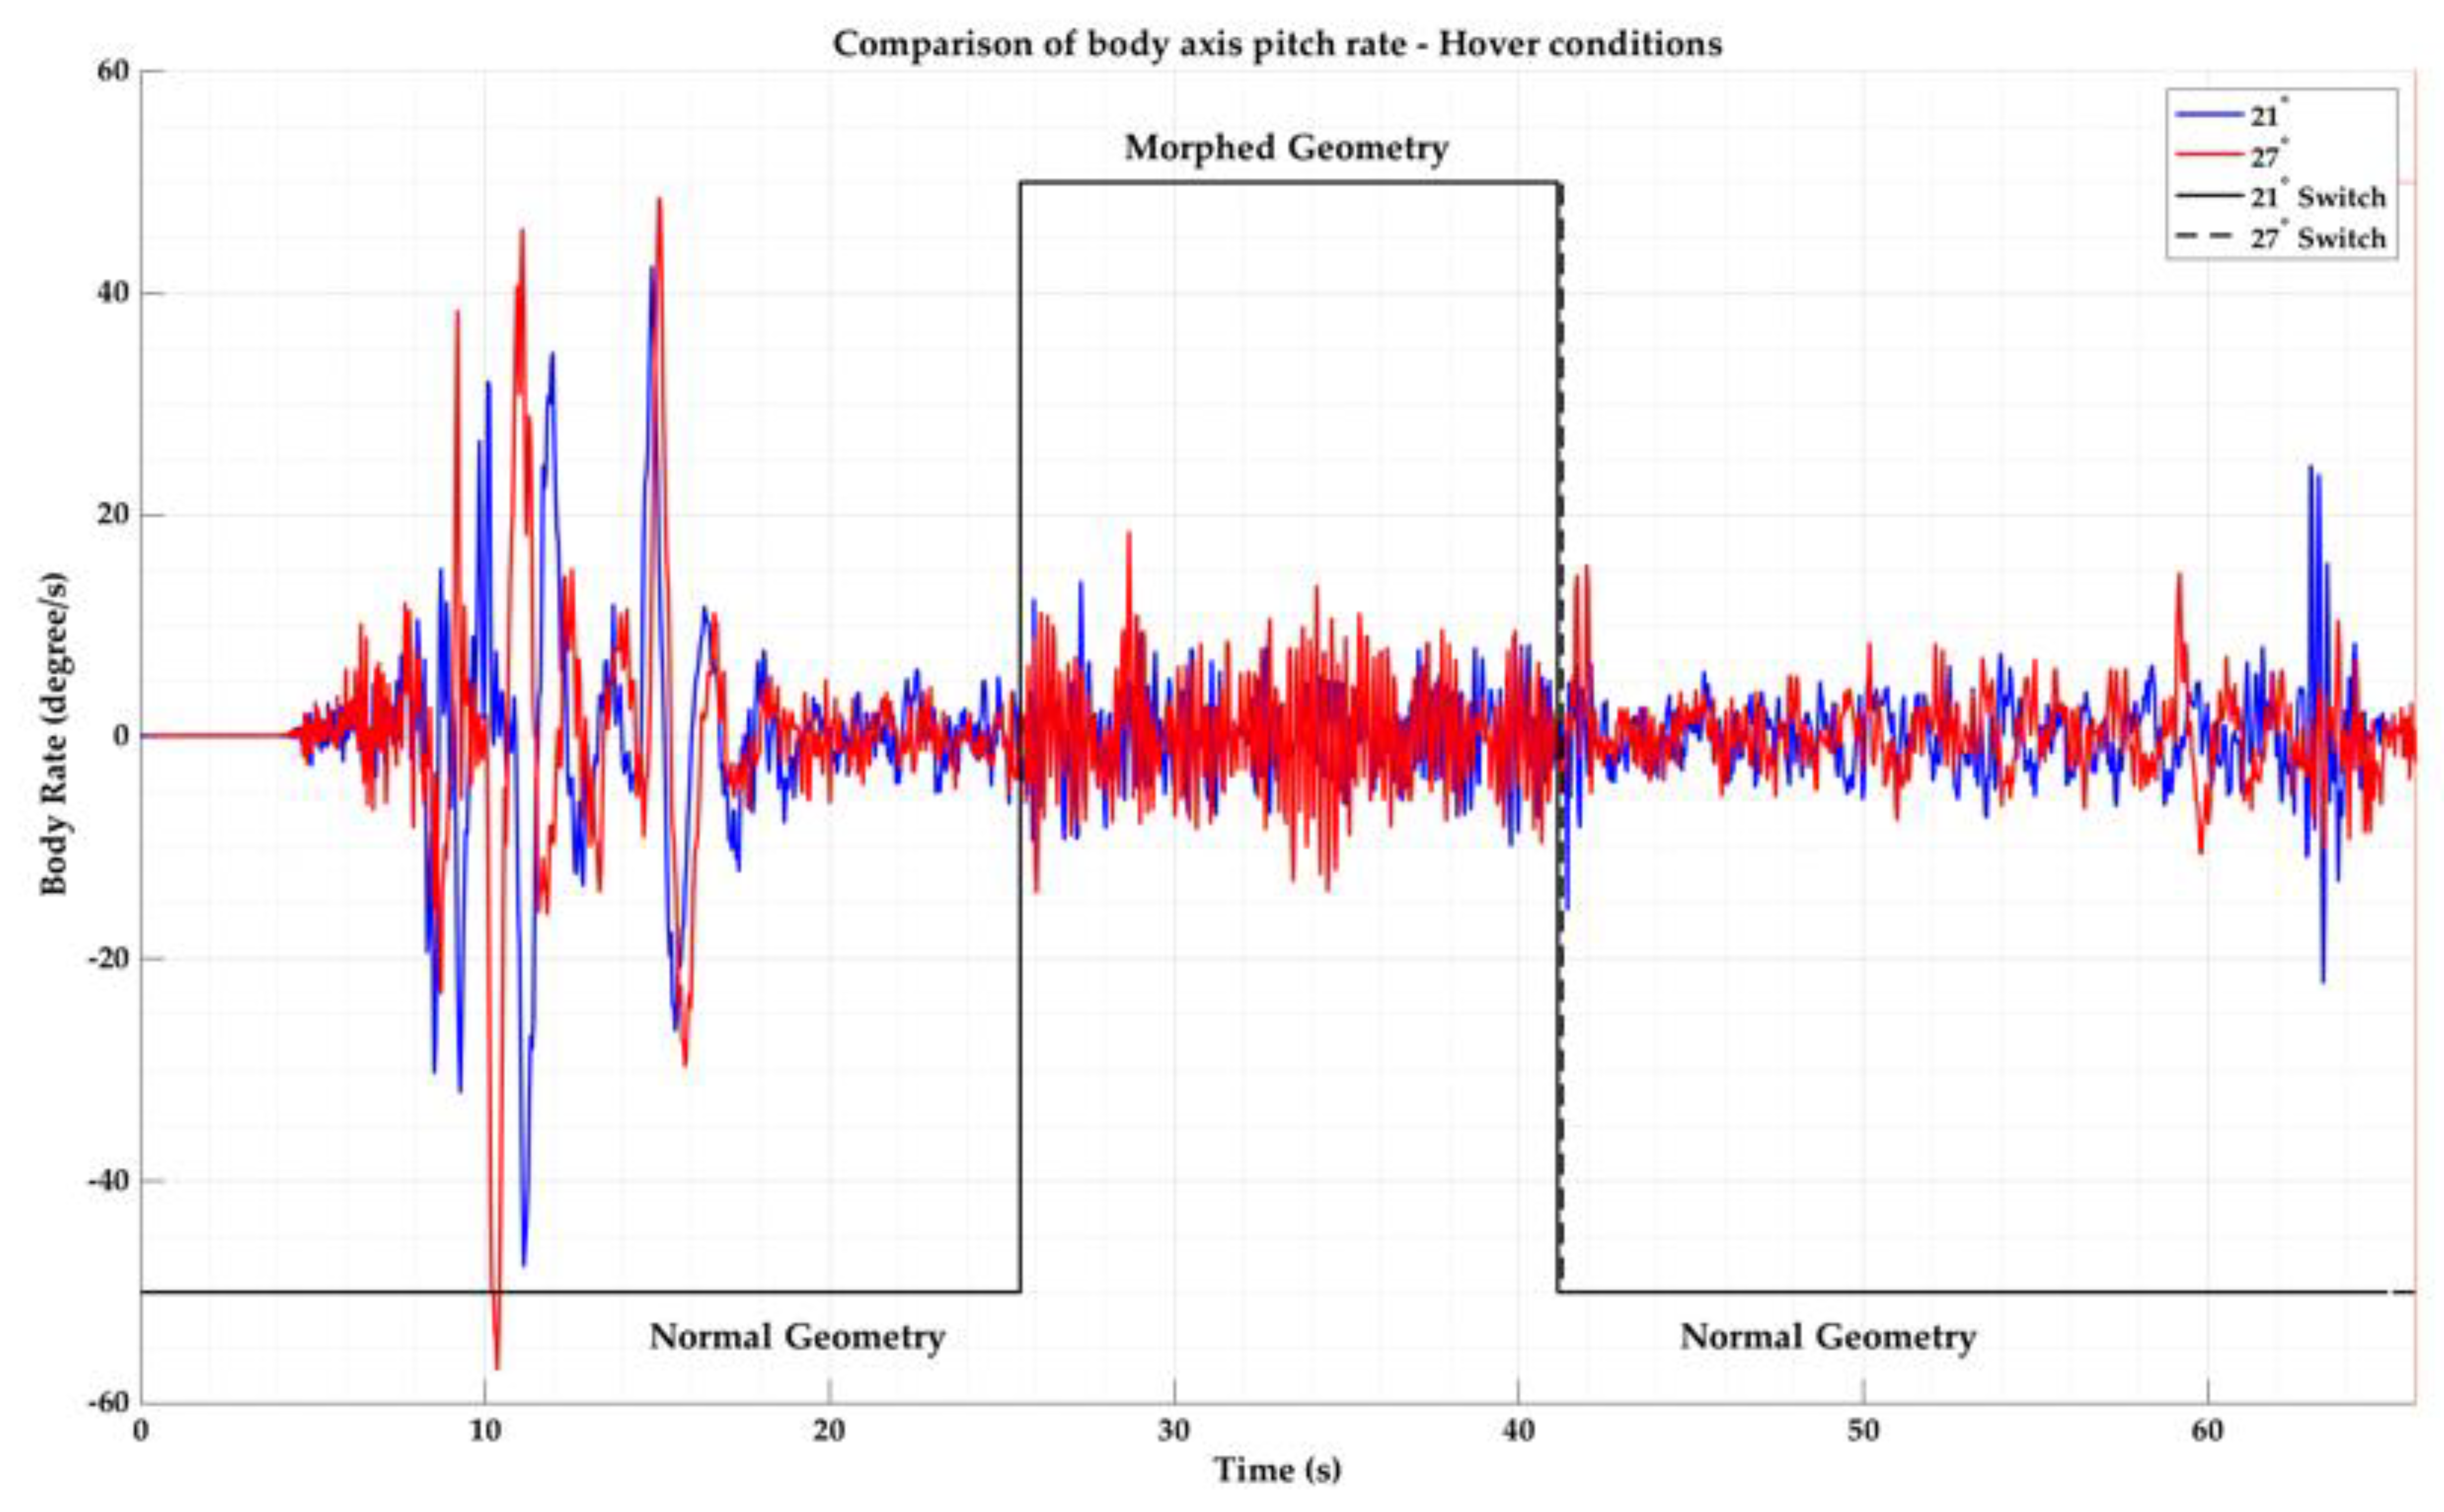
Figure 11.
Body axis pitch rate, during morphing at Hover conditions.
Figure 11.
Body axis pitch rate, during morphing at Hover conditions.
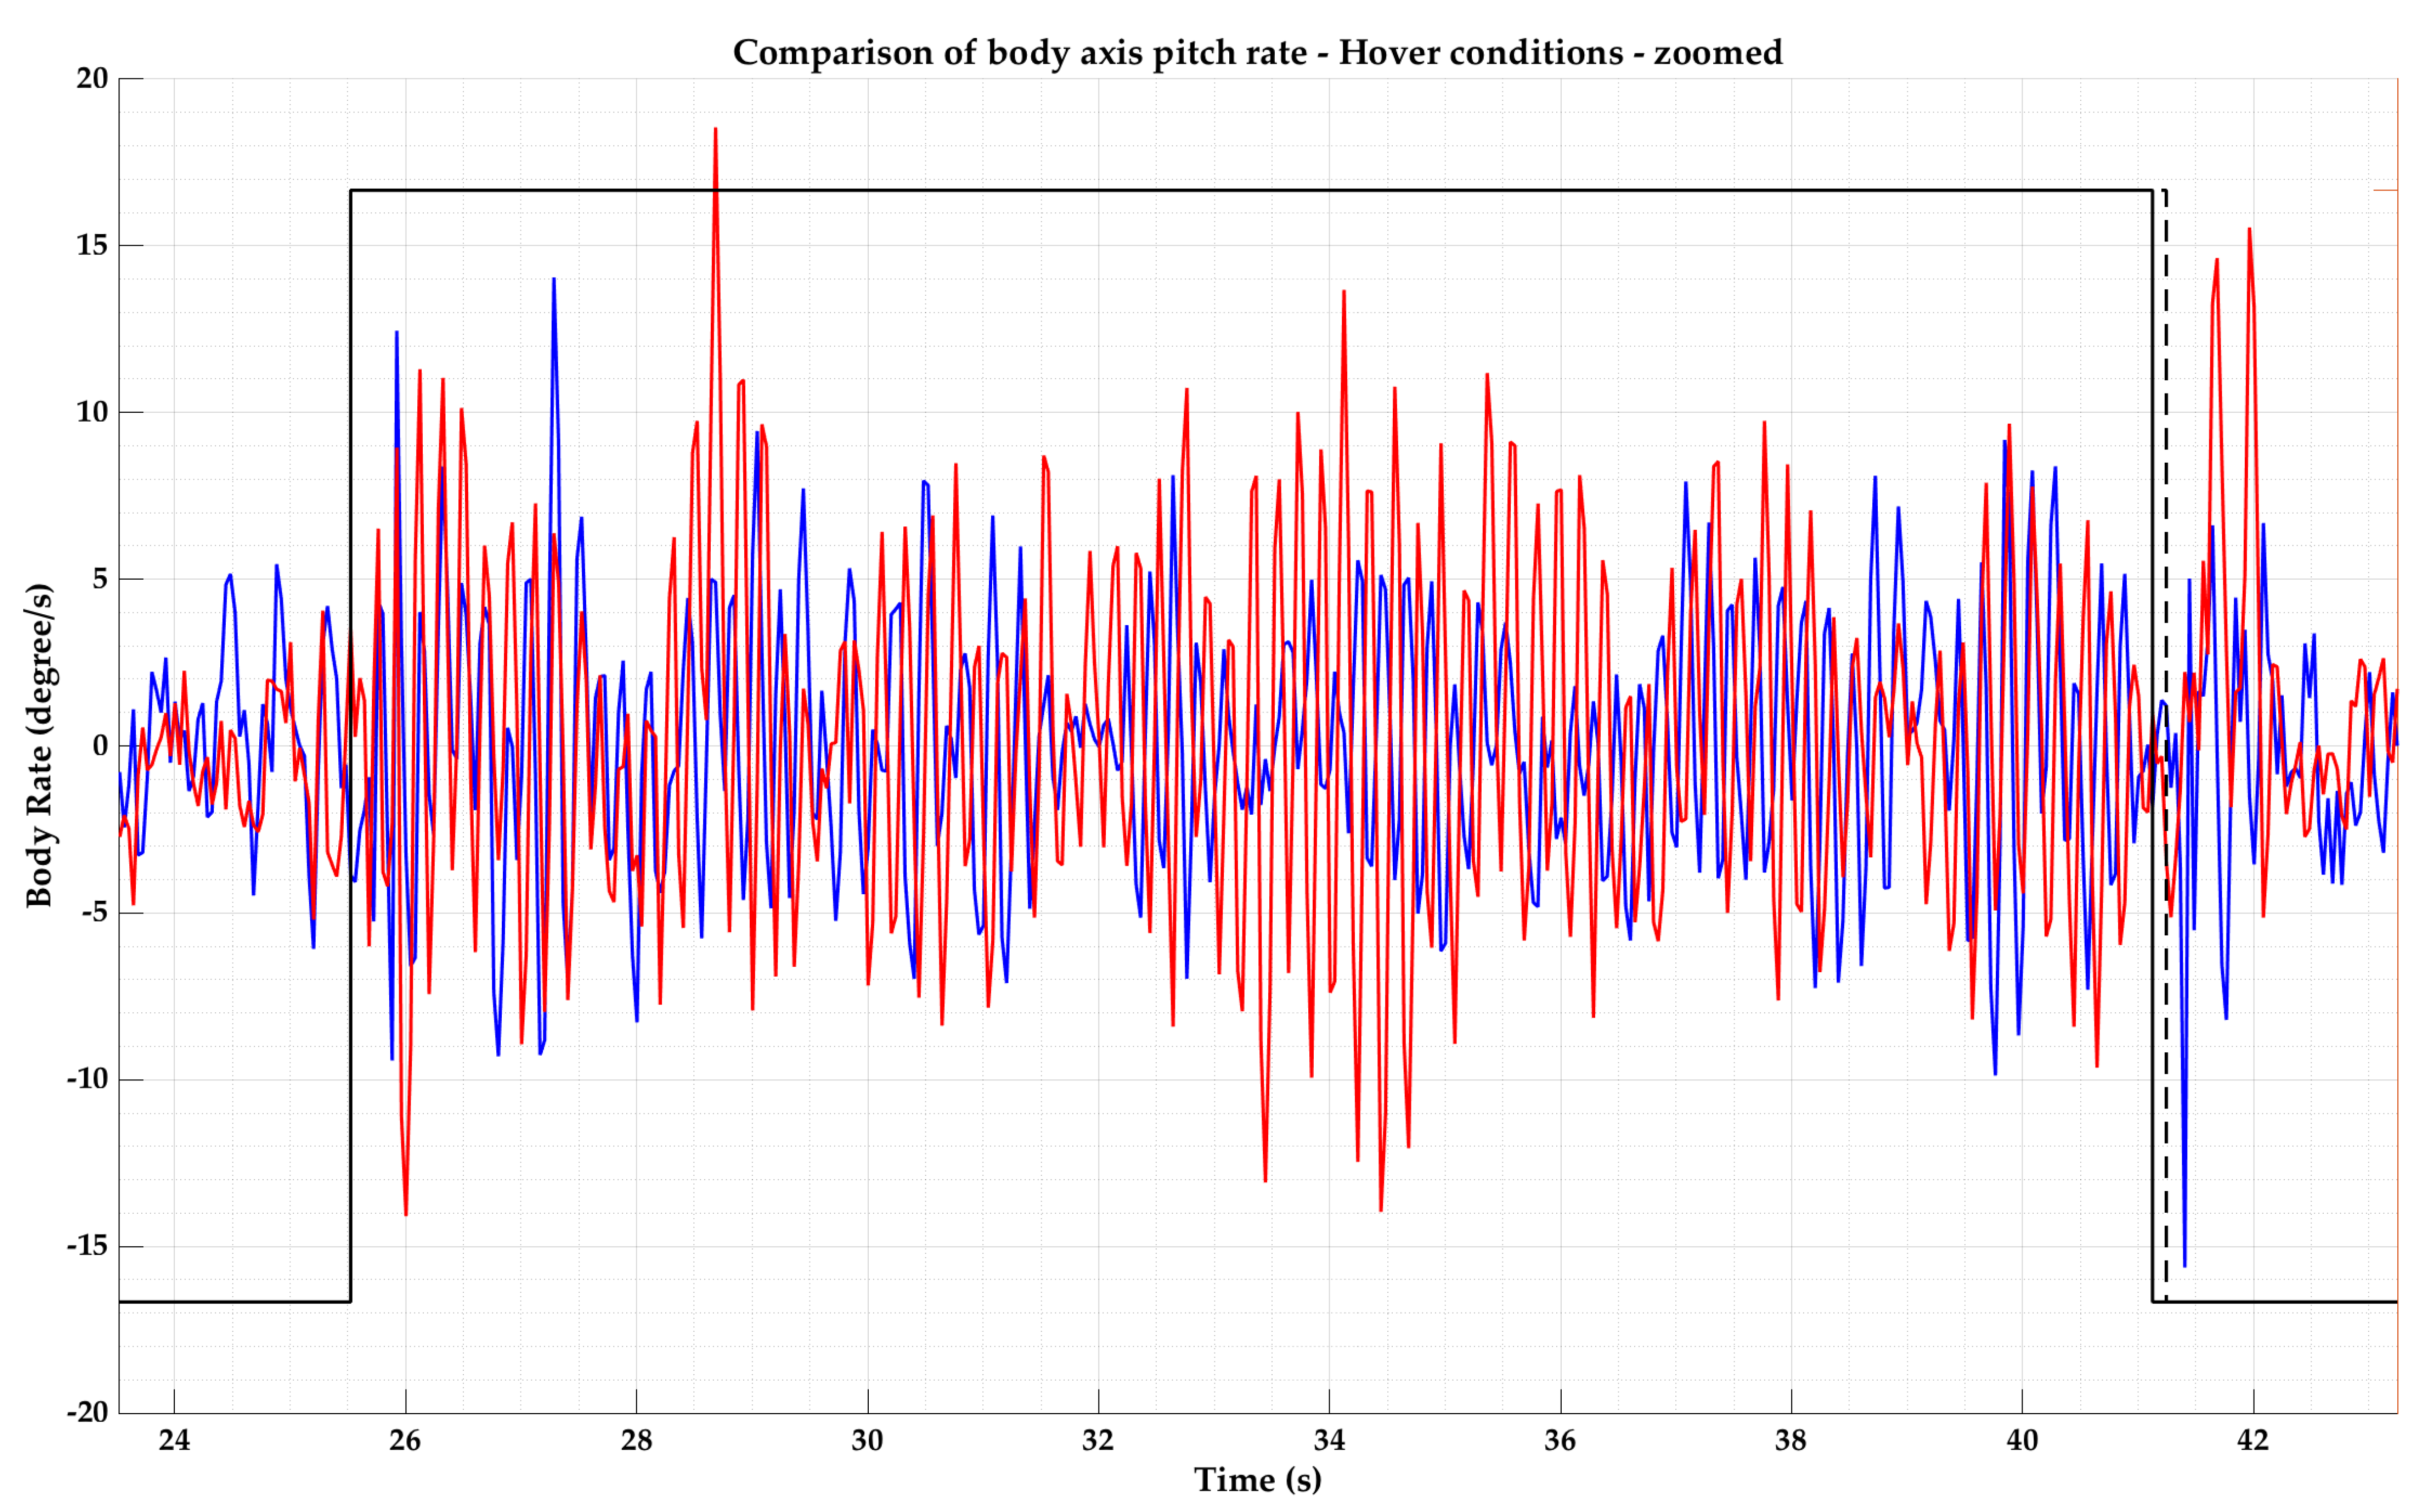
Figure 12.
Body axis pitch rate, during morphing at Hover conditions—zoomed in.
Figure 12.
Body axis pitch rate, during morphing at Hover conditions—zoomed in.
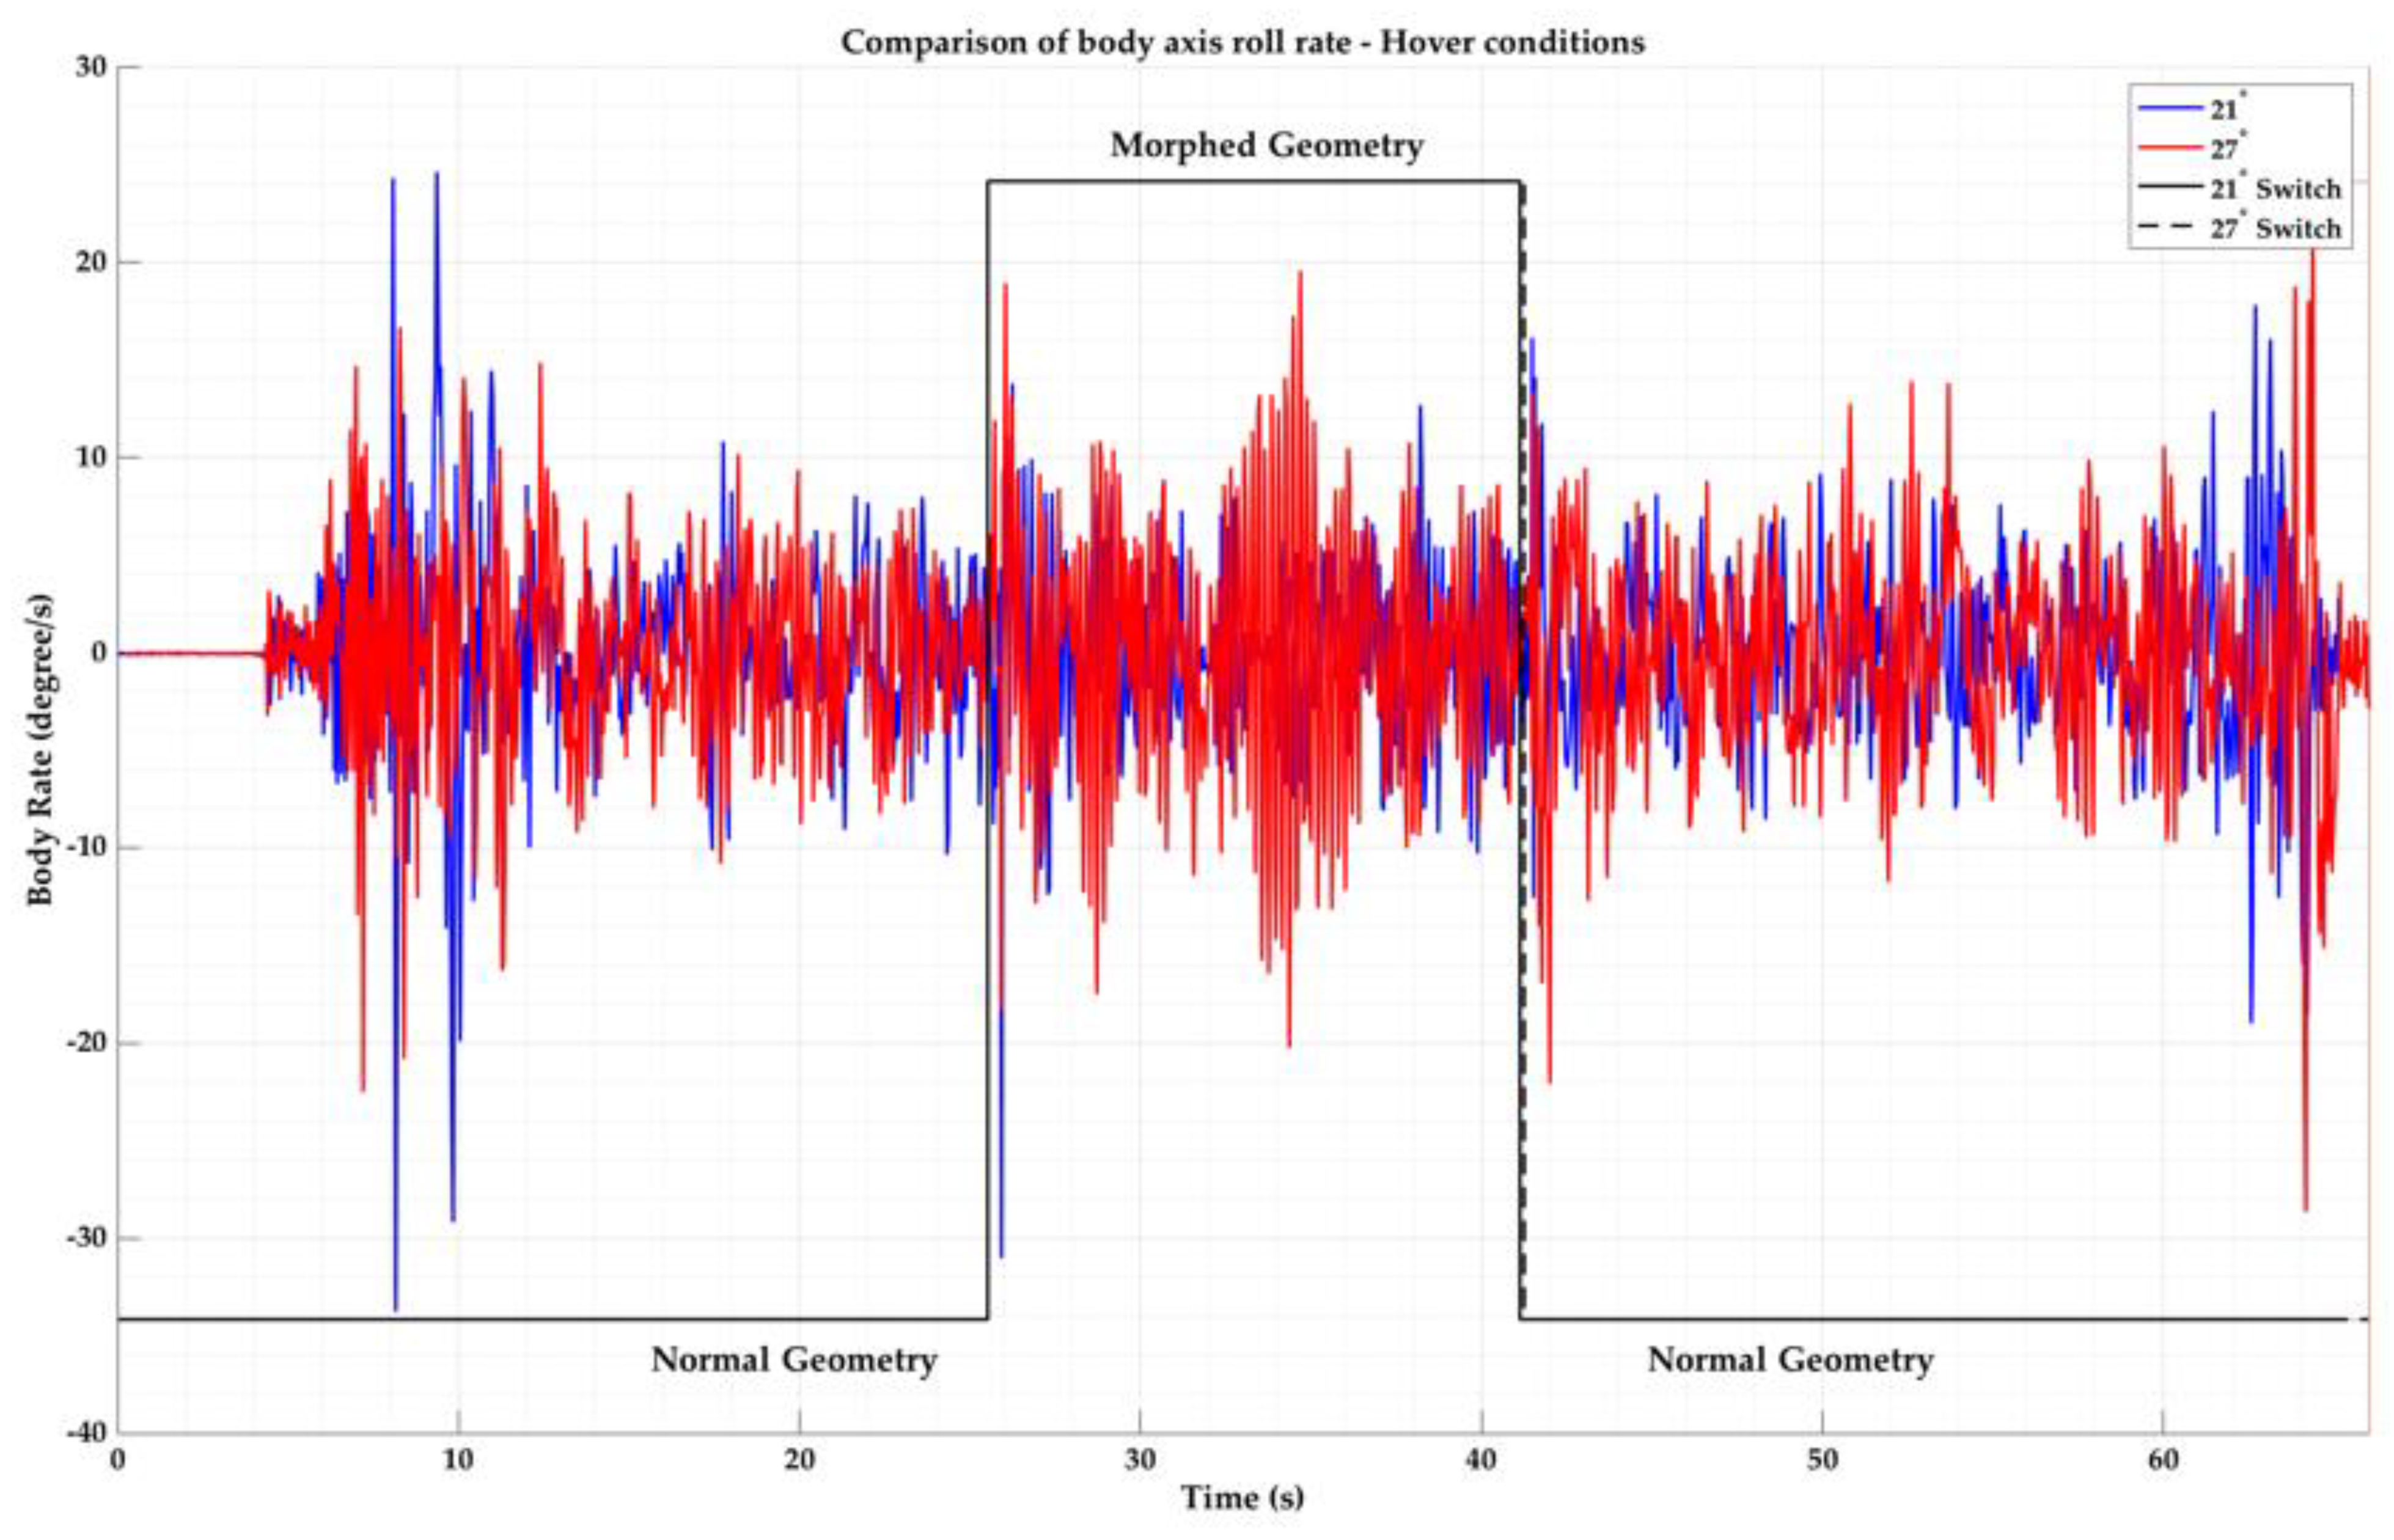
Figure 13.
Body axis roll rate, during morphing in hover conditions.
Figure 13.
Body axis roll rate, during morphing in hover conditions.
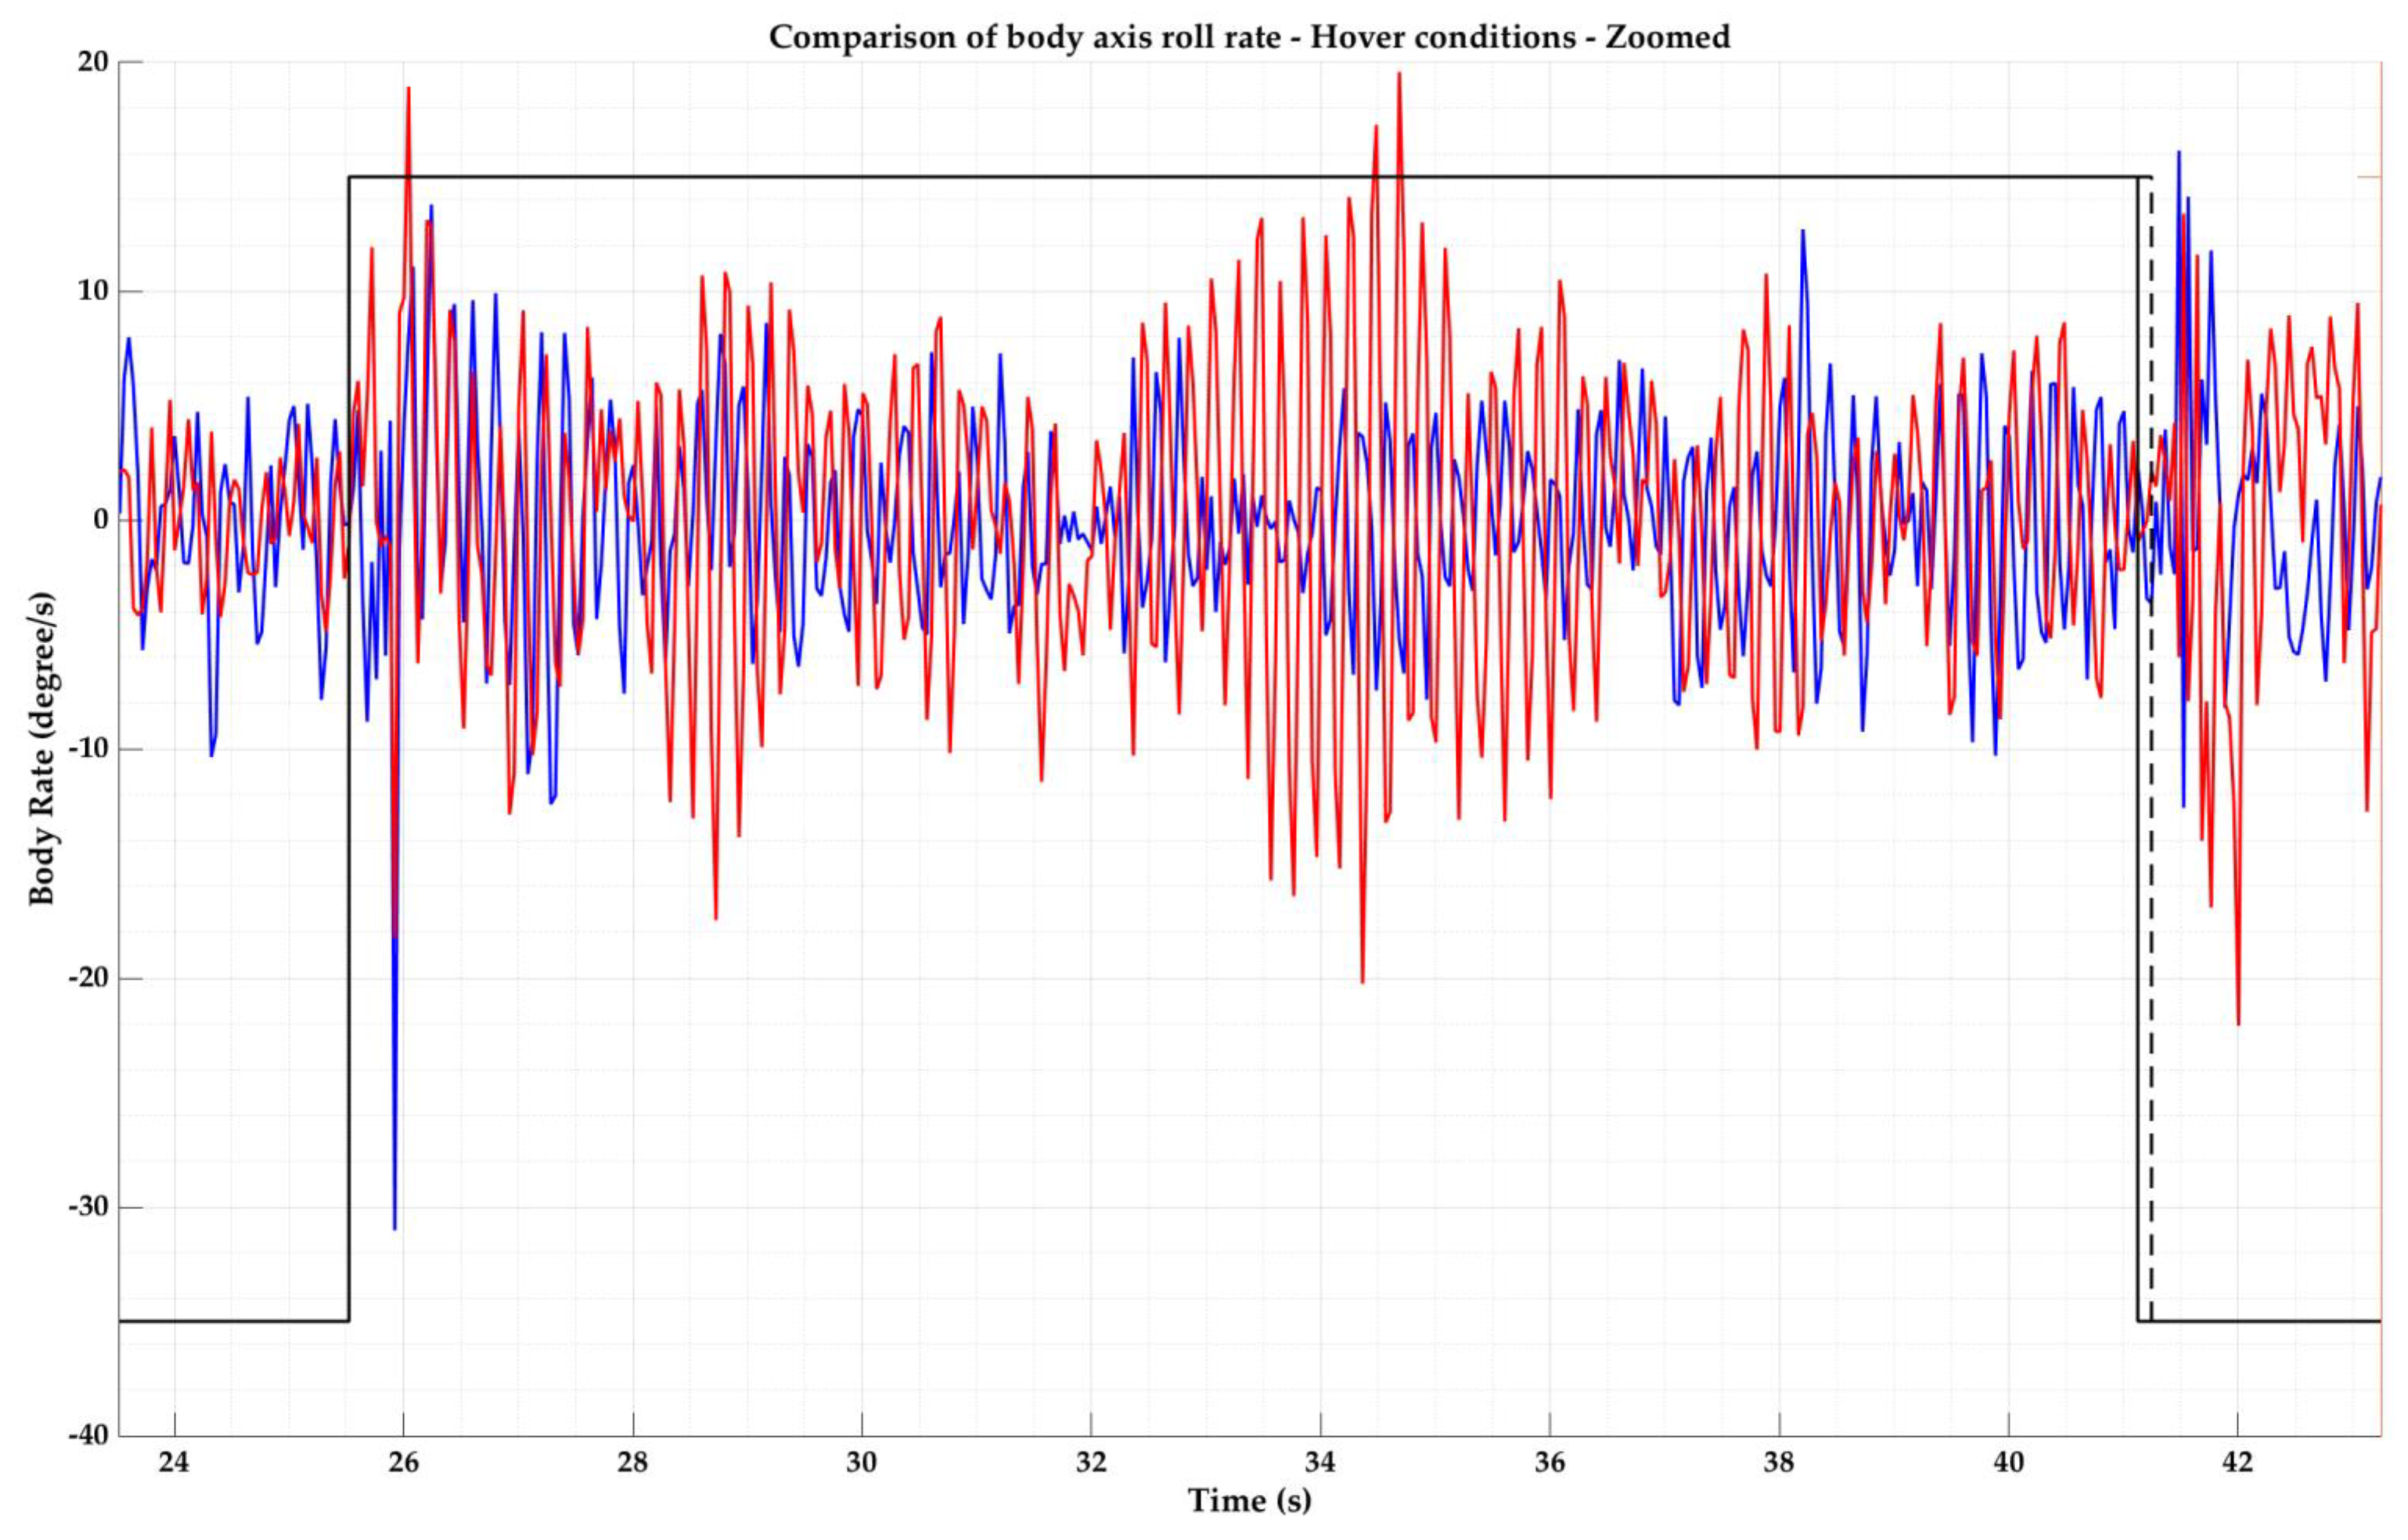
Figure 14.
Body axis roll rate during morphing in Hover conditions—zoomed in.
Figure 14.
Body axis roll rate during morphing in Hover conditions—zoomed in.
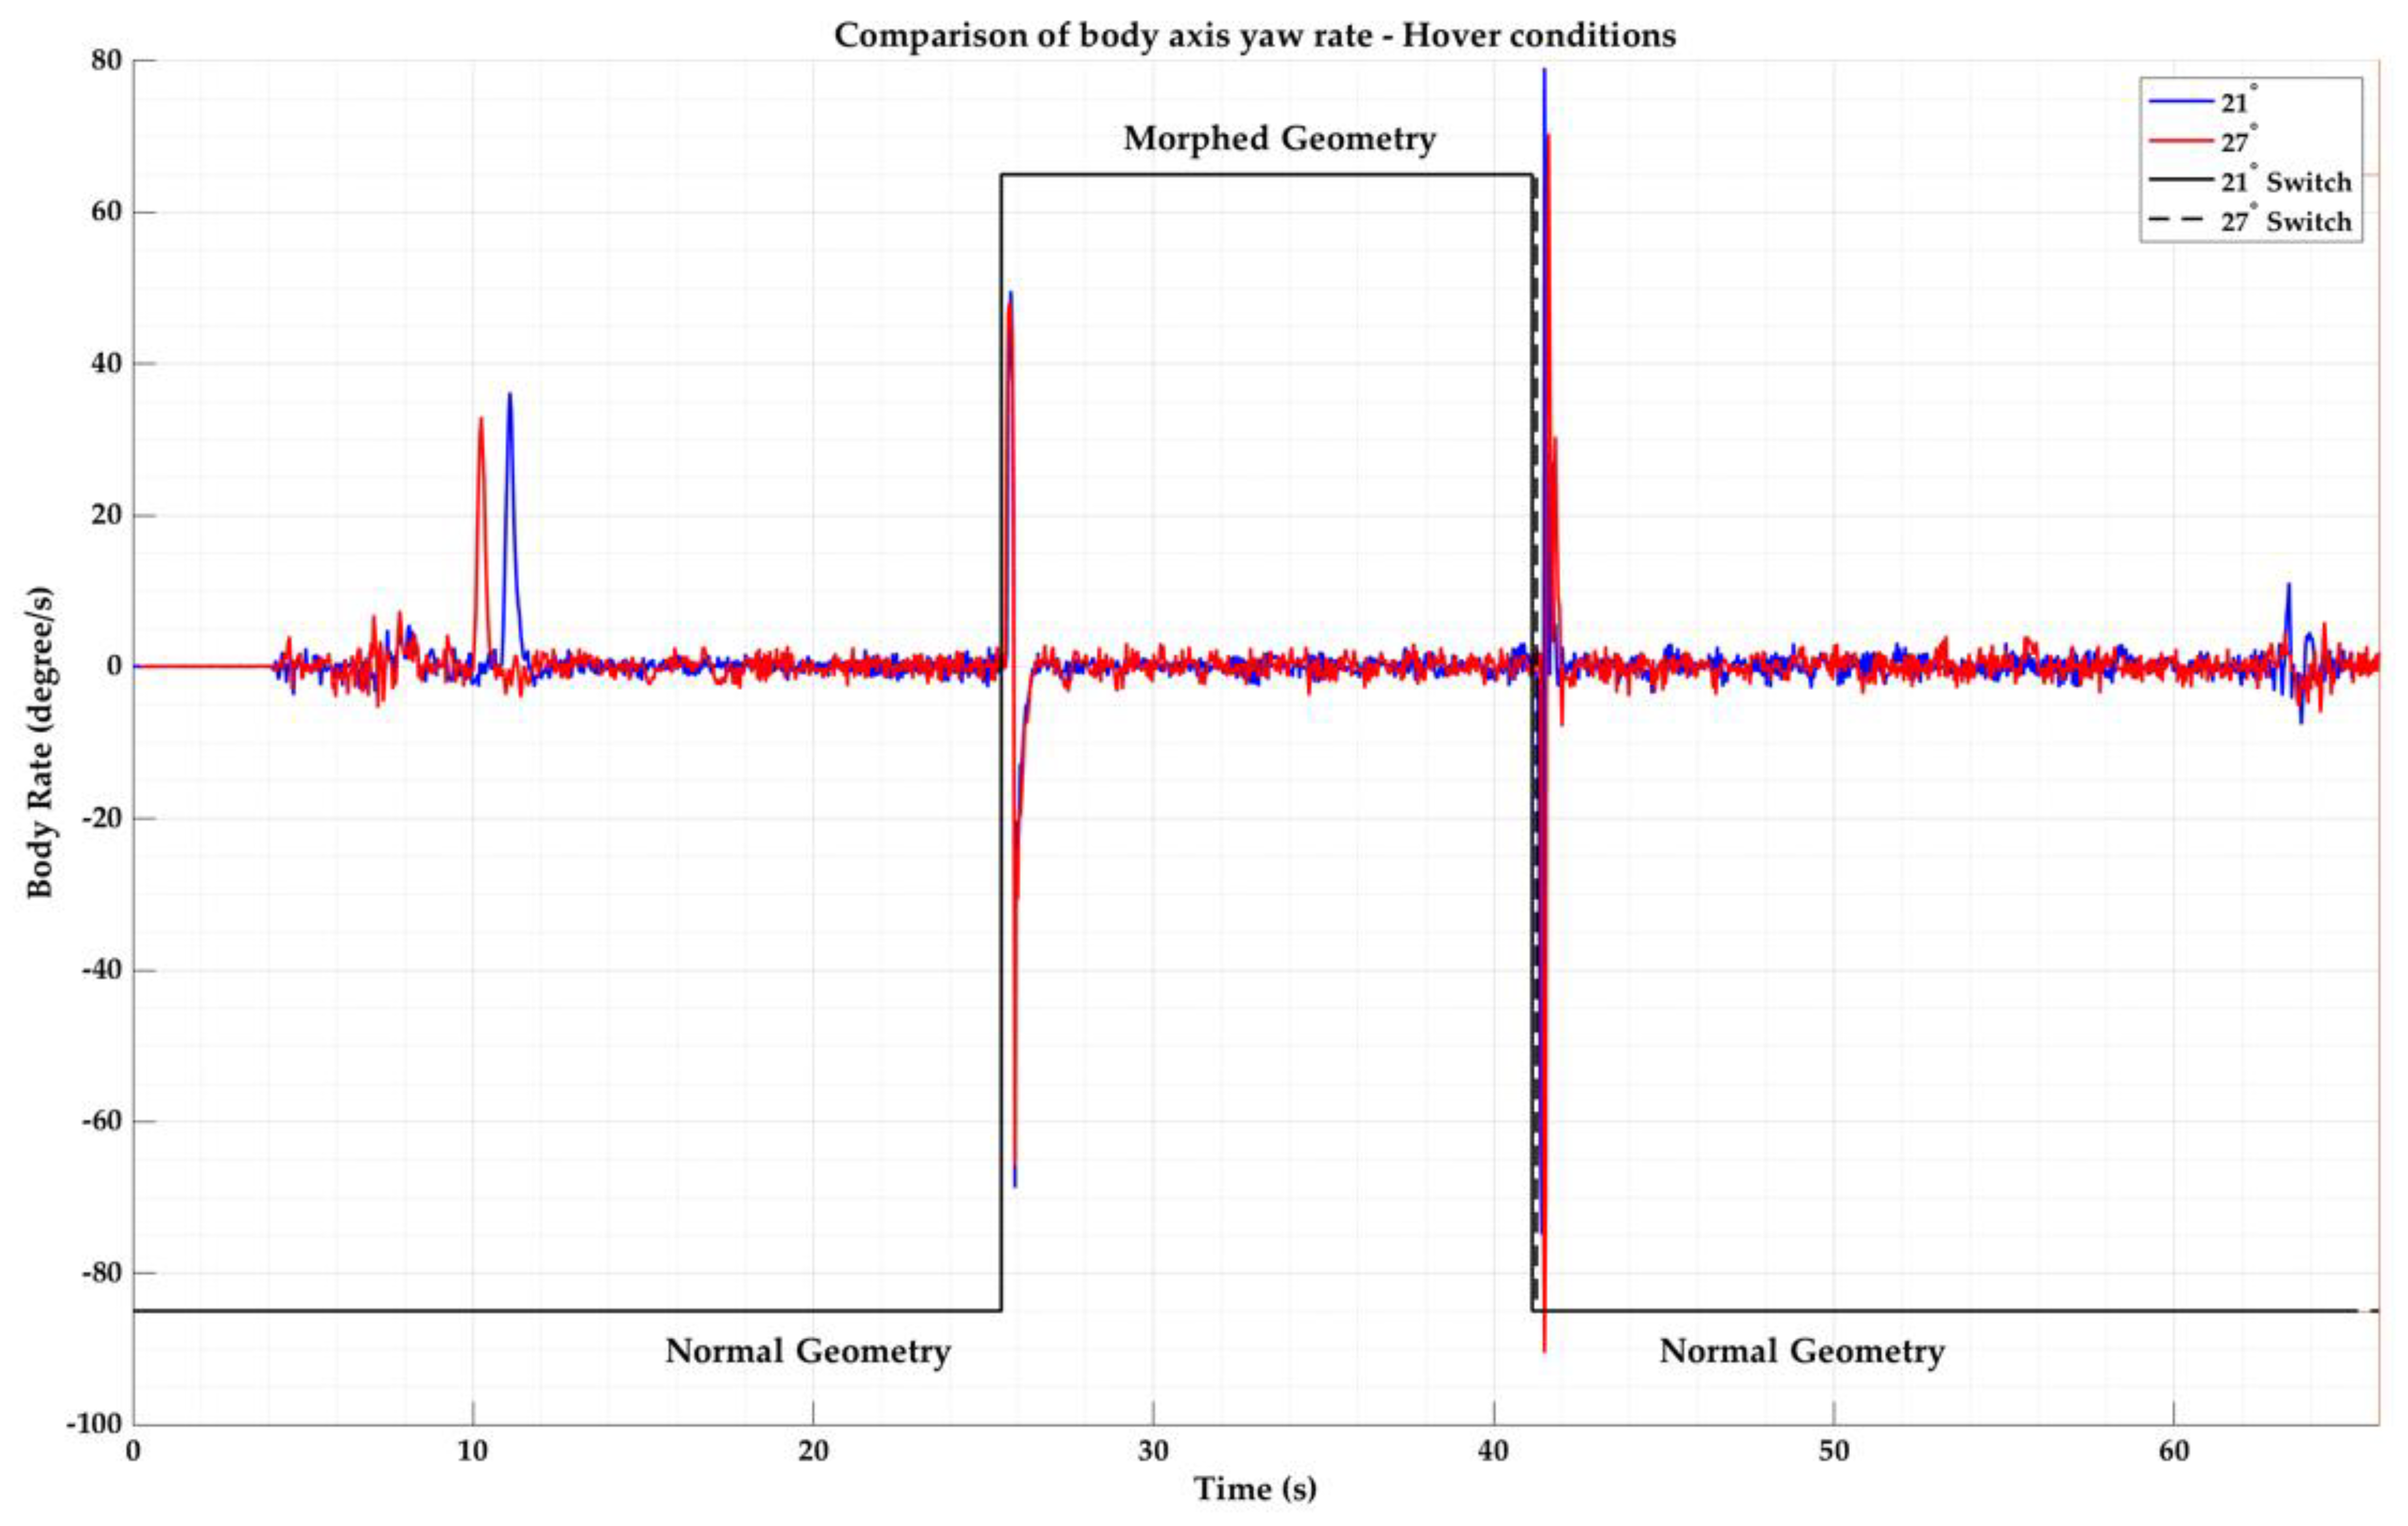
Figure 15.
Body axis yaw rate during morphing in hover conditions.
Figure 15.
Body axis yaw rate during morphing in hover conditions.
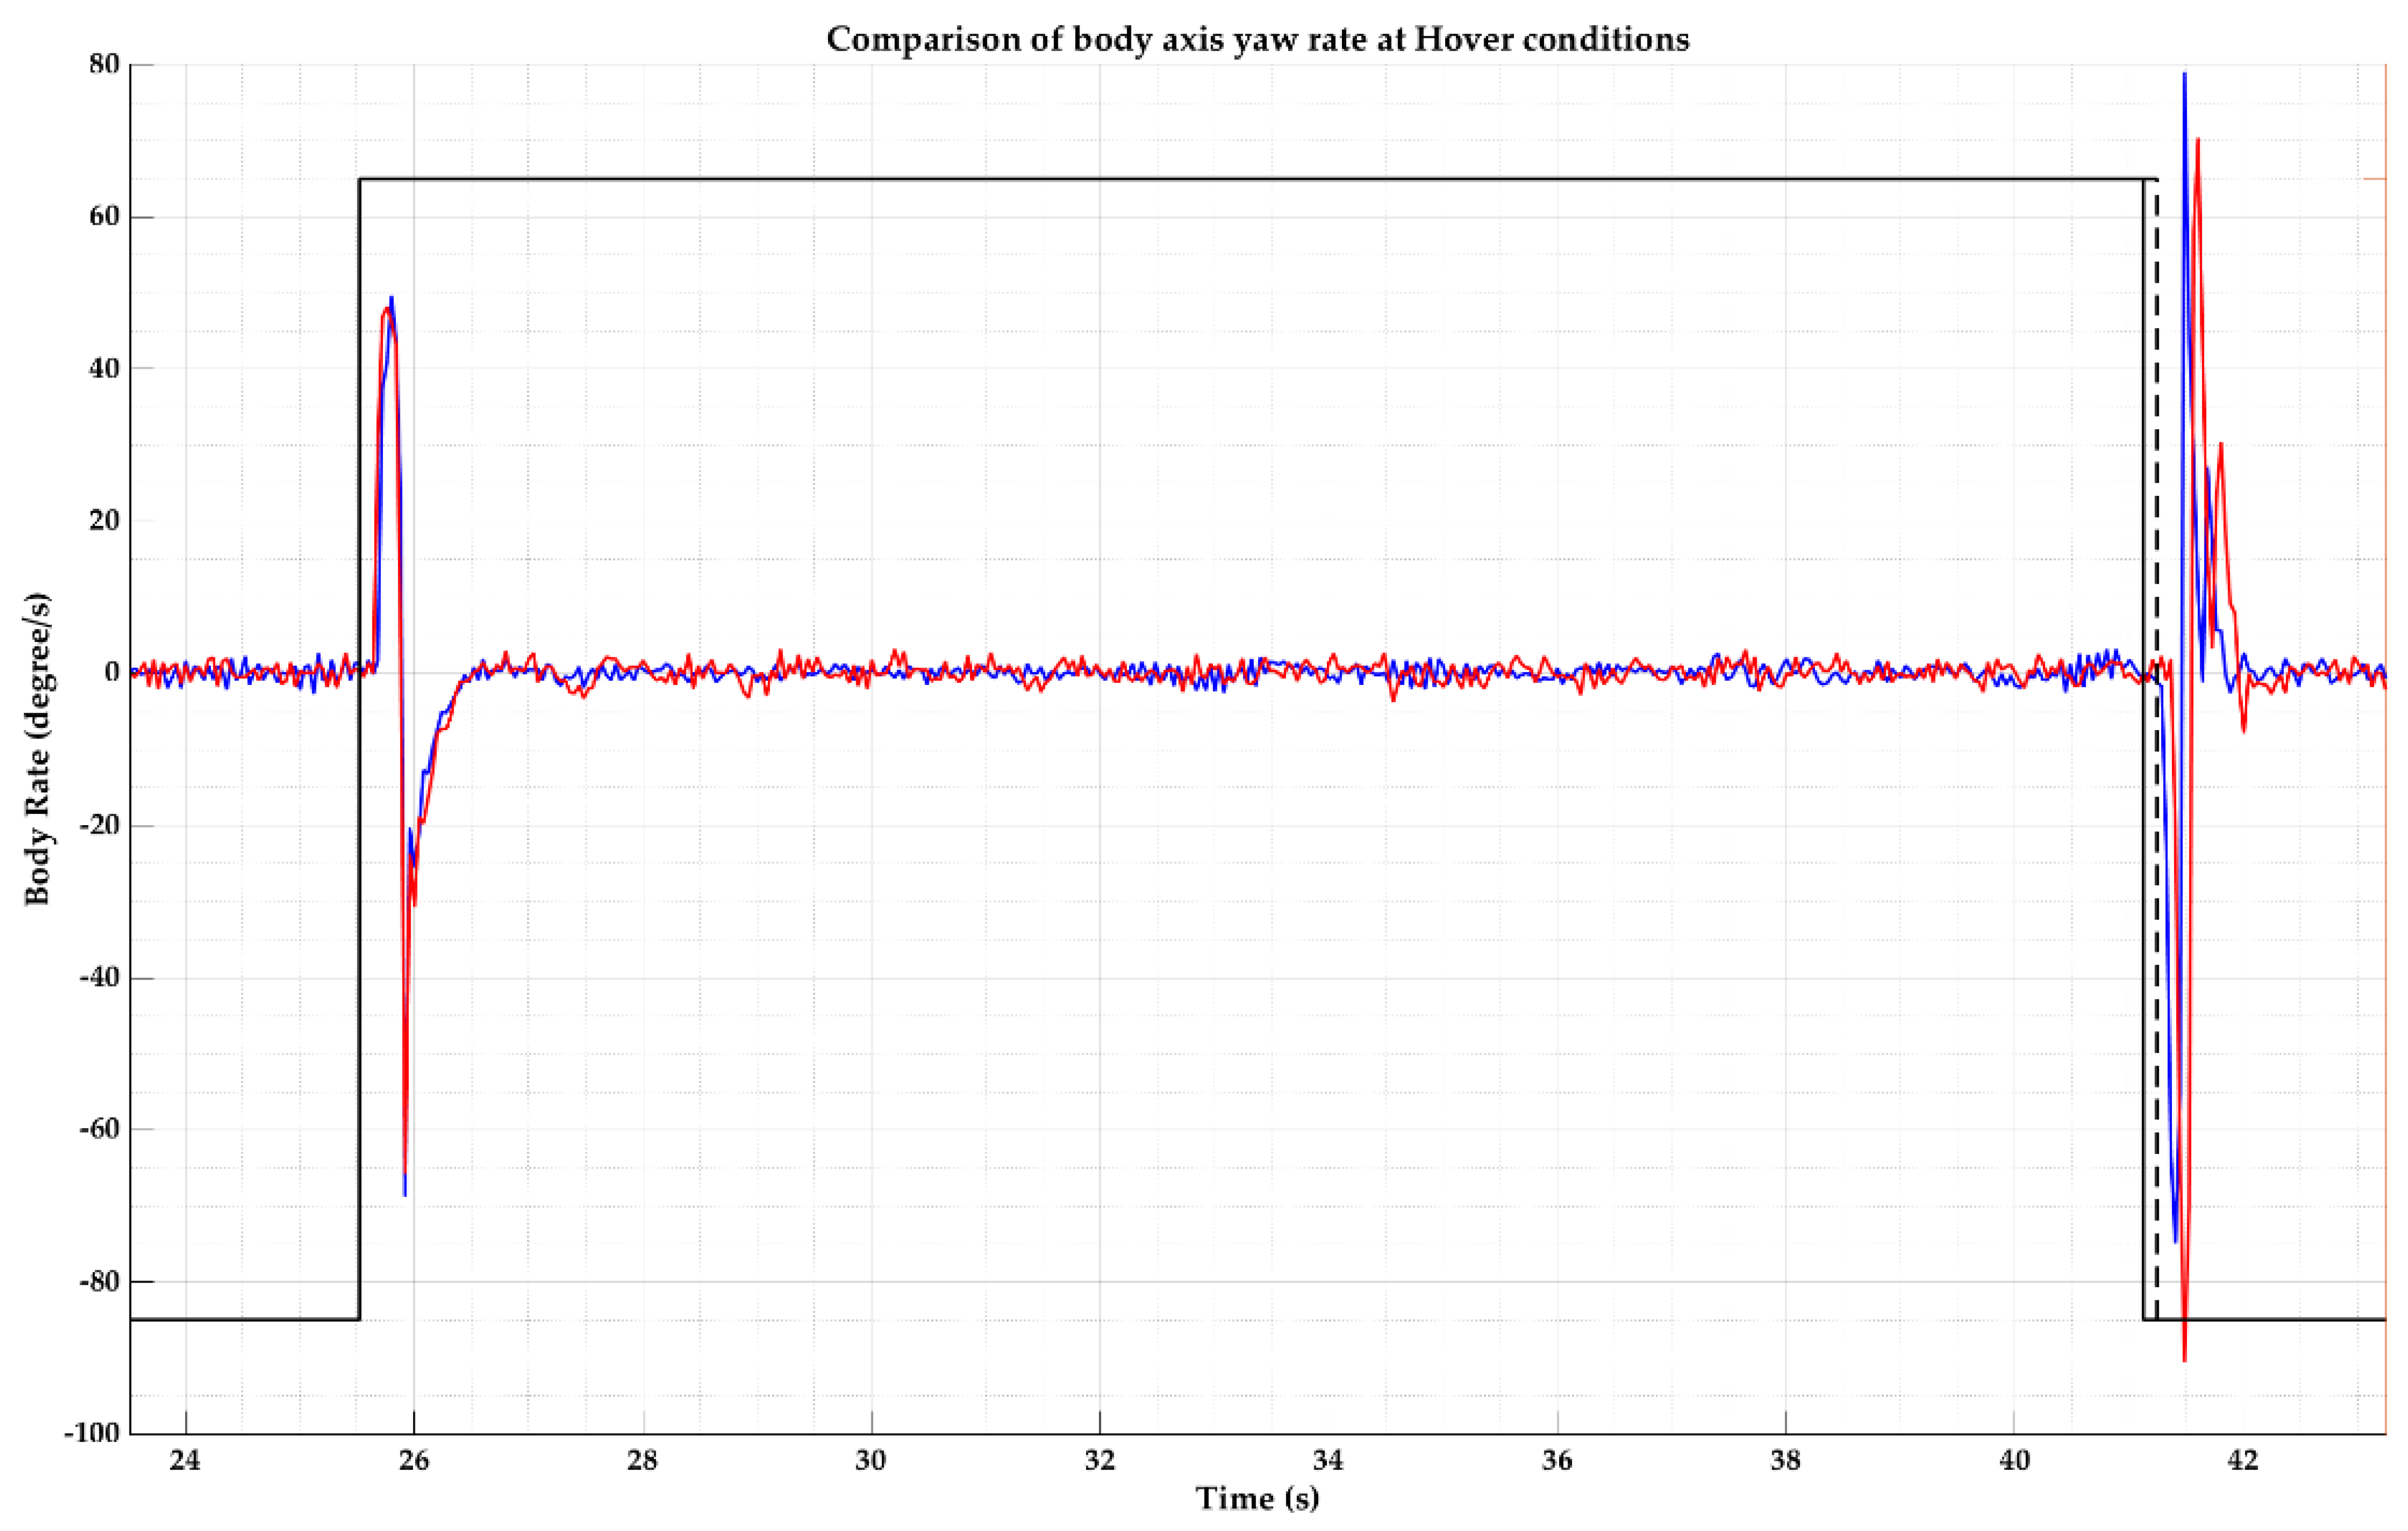
Figure 16.
Body axis roll rate during morphing at Hover conditions—zoomed in.
Figure 16.
Body axis roll rate during morphing at Hover conditions—zoomed in.
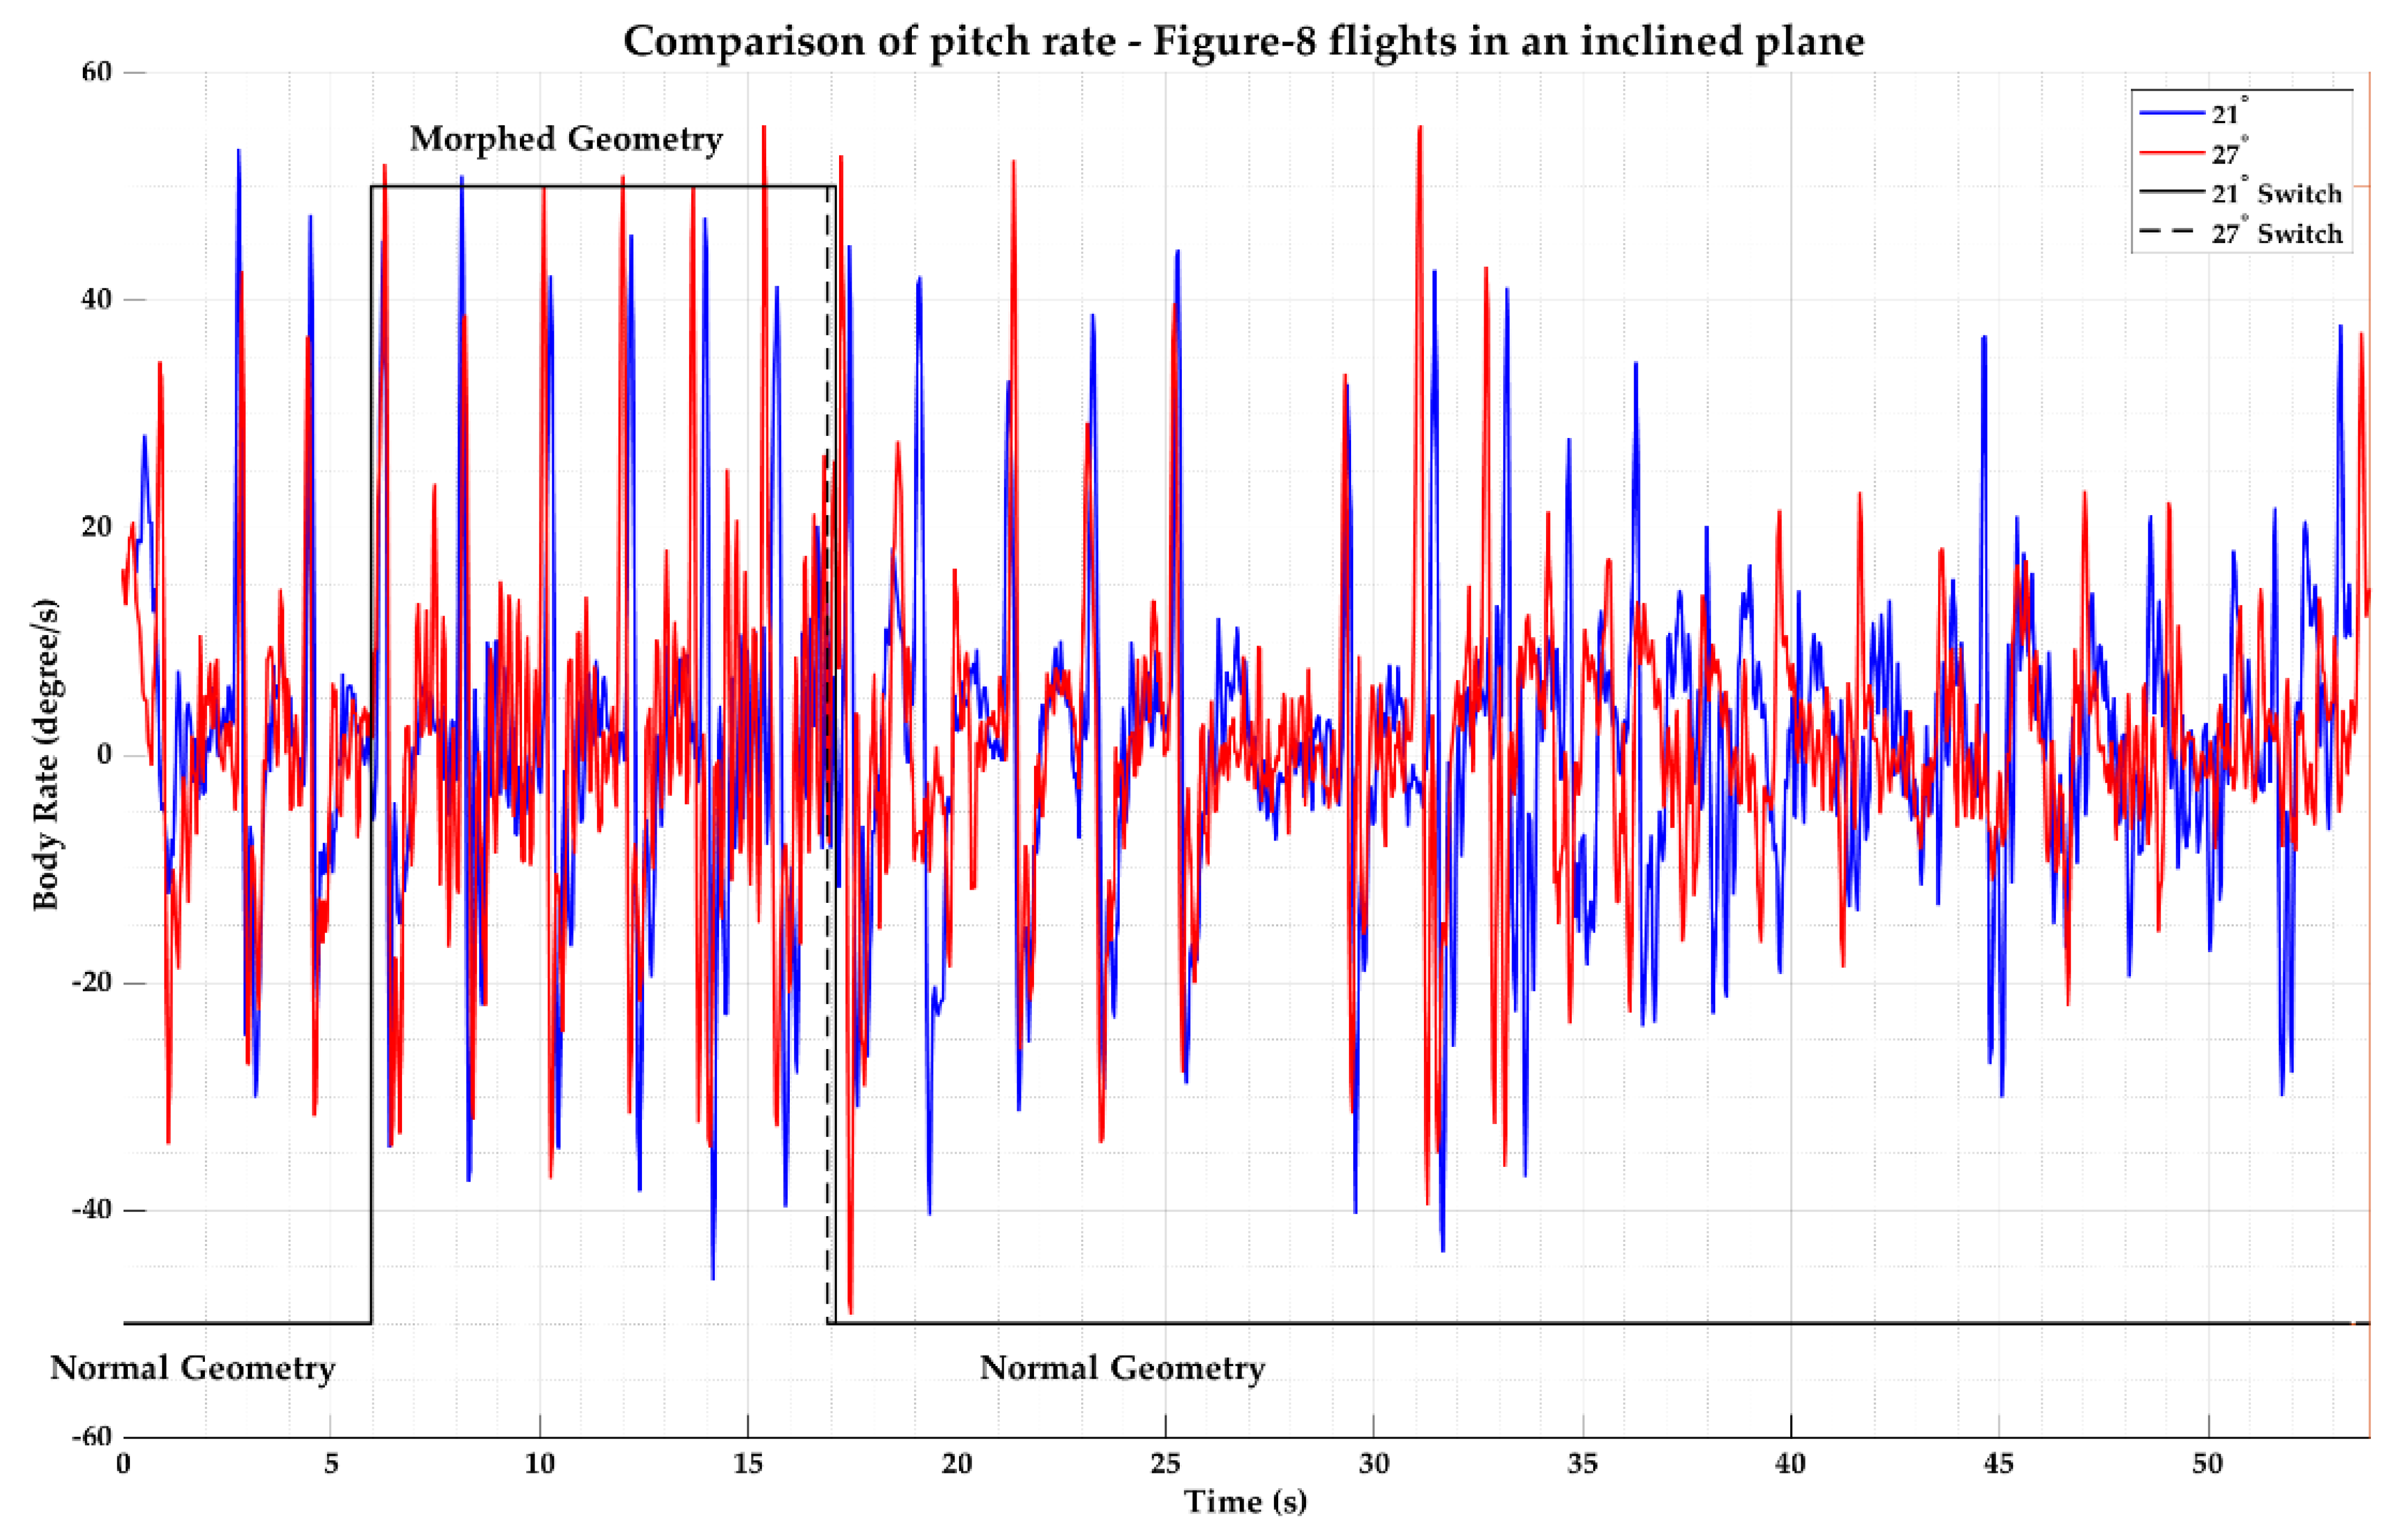
Figure 17.
Comparison of pitch rate of Figure-8 flights of the quadcopter in an inclined plane.
Figure 17.
Comparison of pitch rate of Figure-8 flights of the quadcopter in an inclined plane.
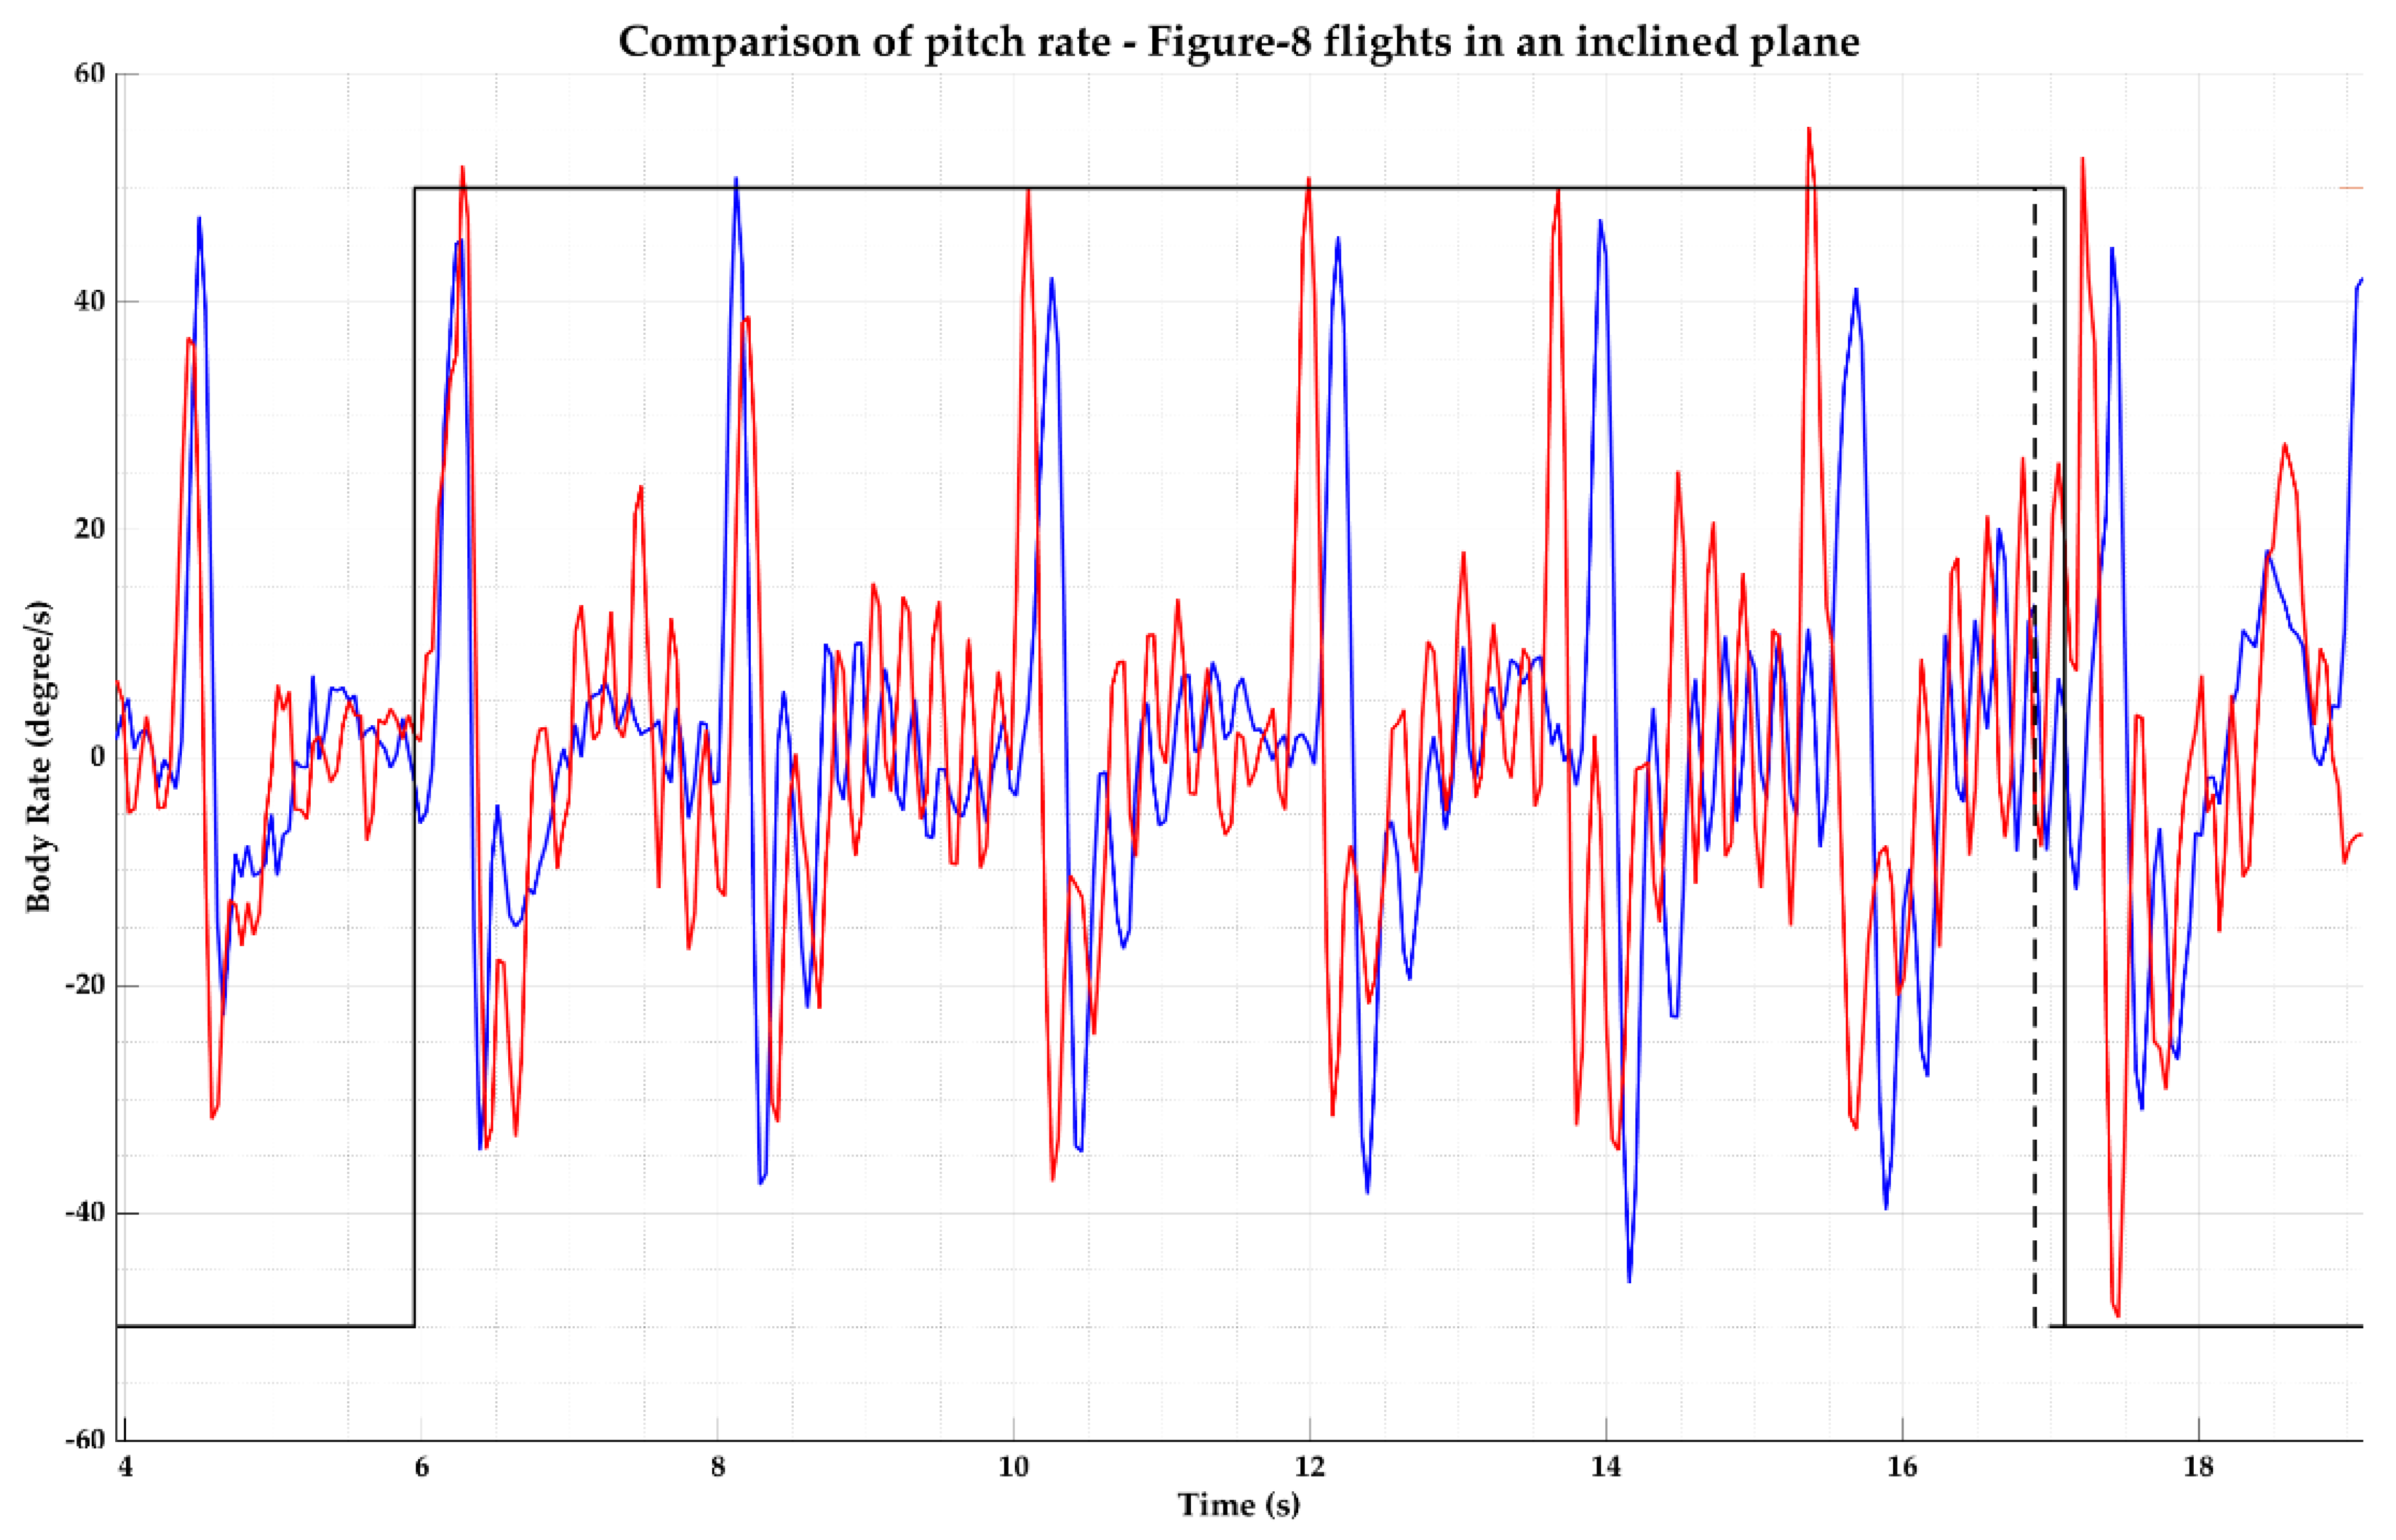
Figure 18.
Comparison of pitch rate of Figure-8 flights of the quadcopter in an inclined plane—zoomed in.
Figure 18.
Comparison of pitch rate of Figure-8 flights of the quadcopter in an inclined plane—zoomed in.
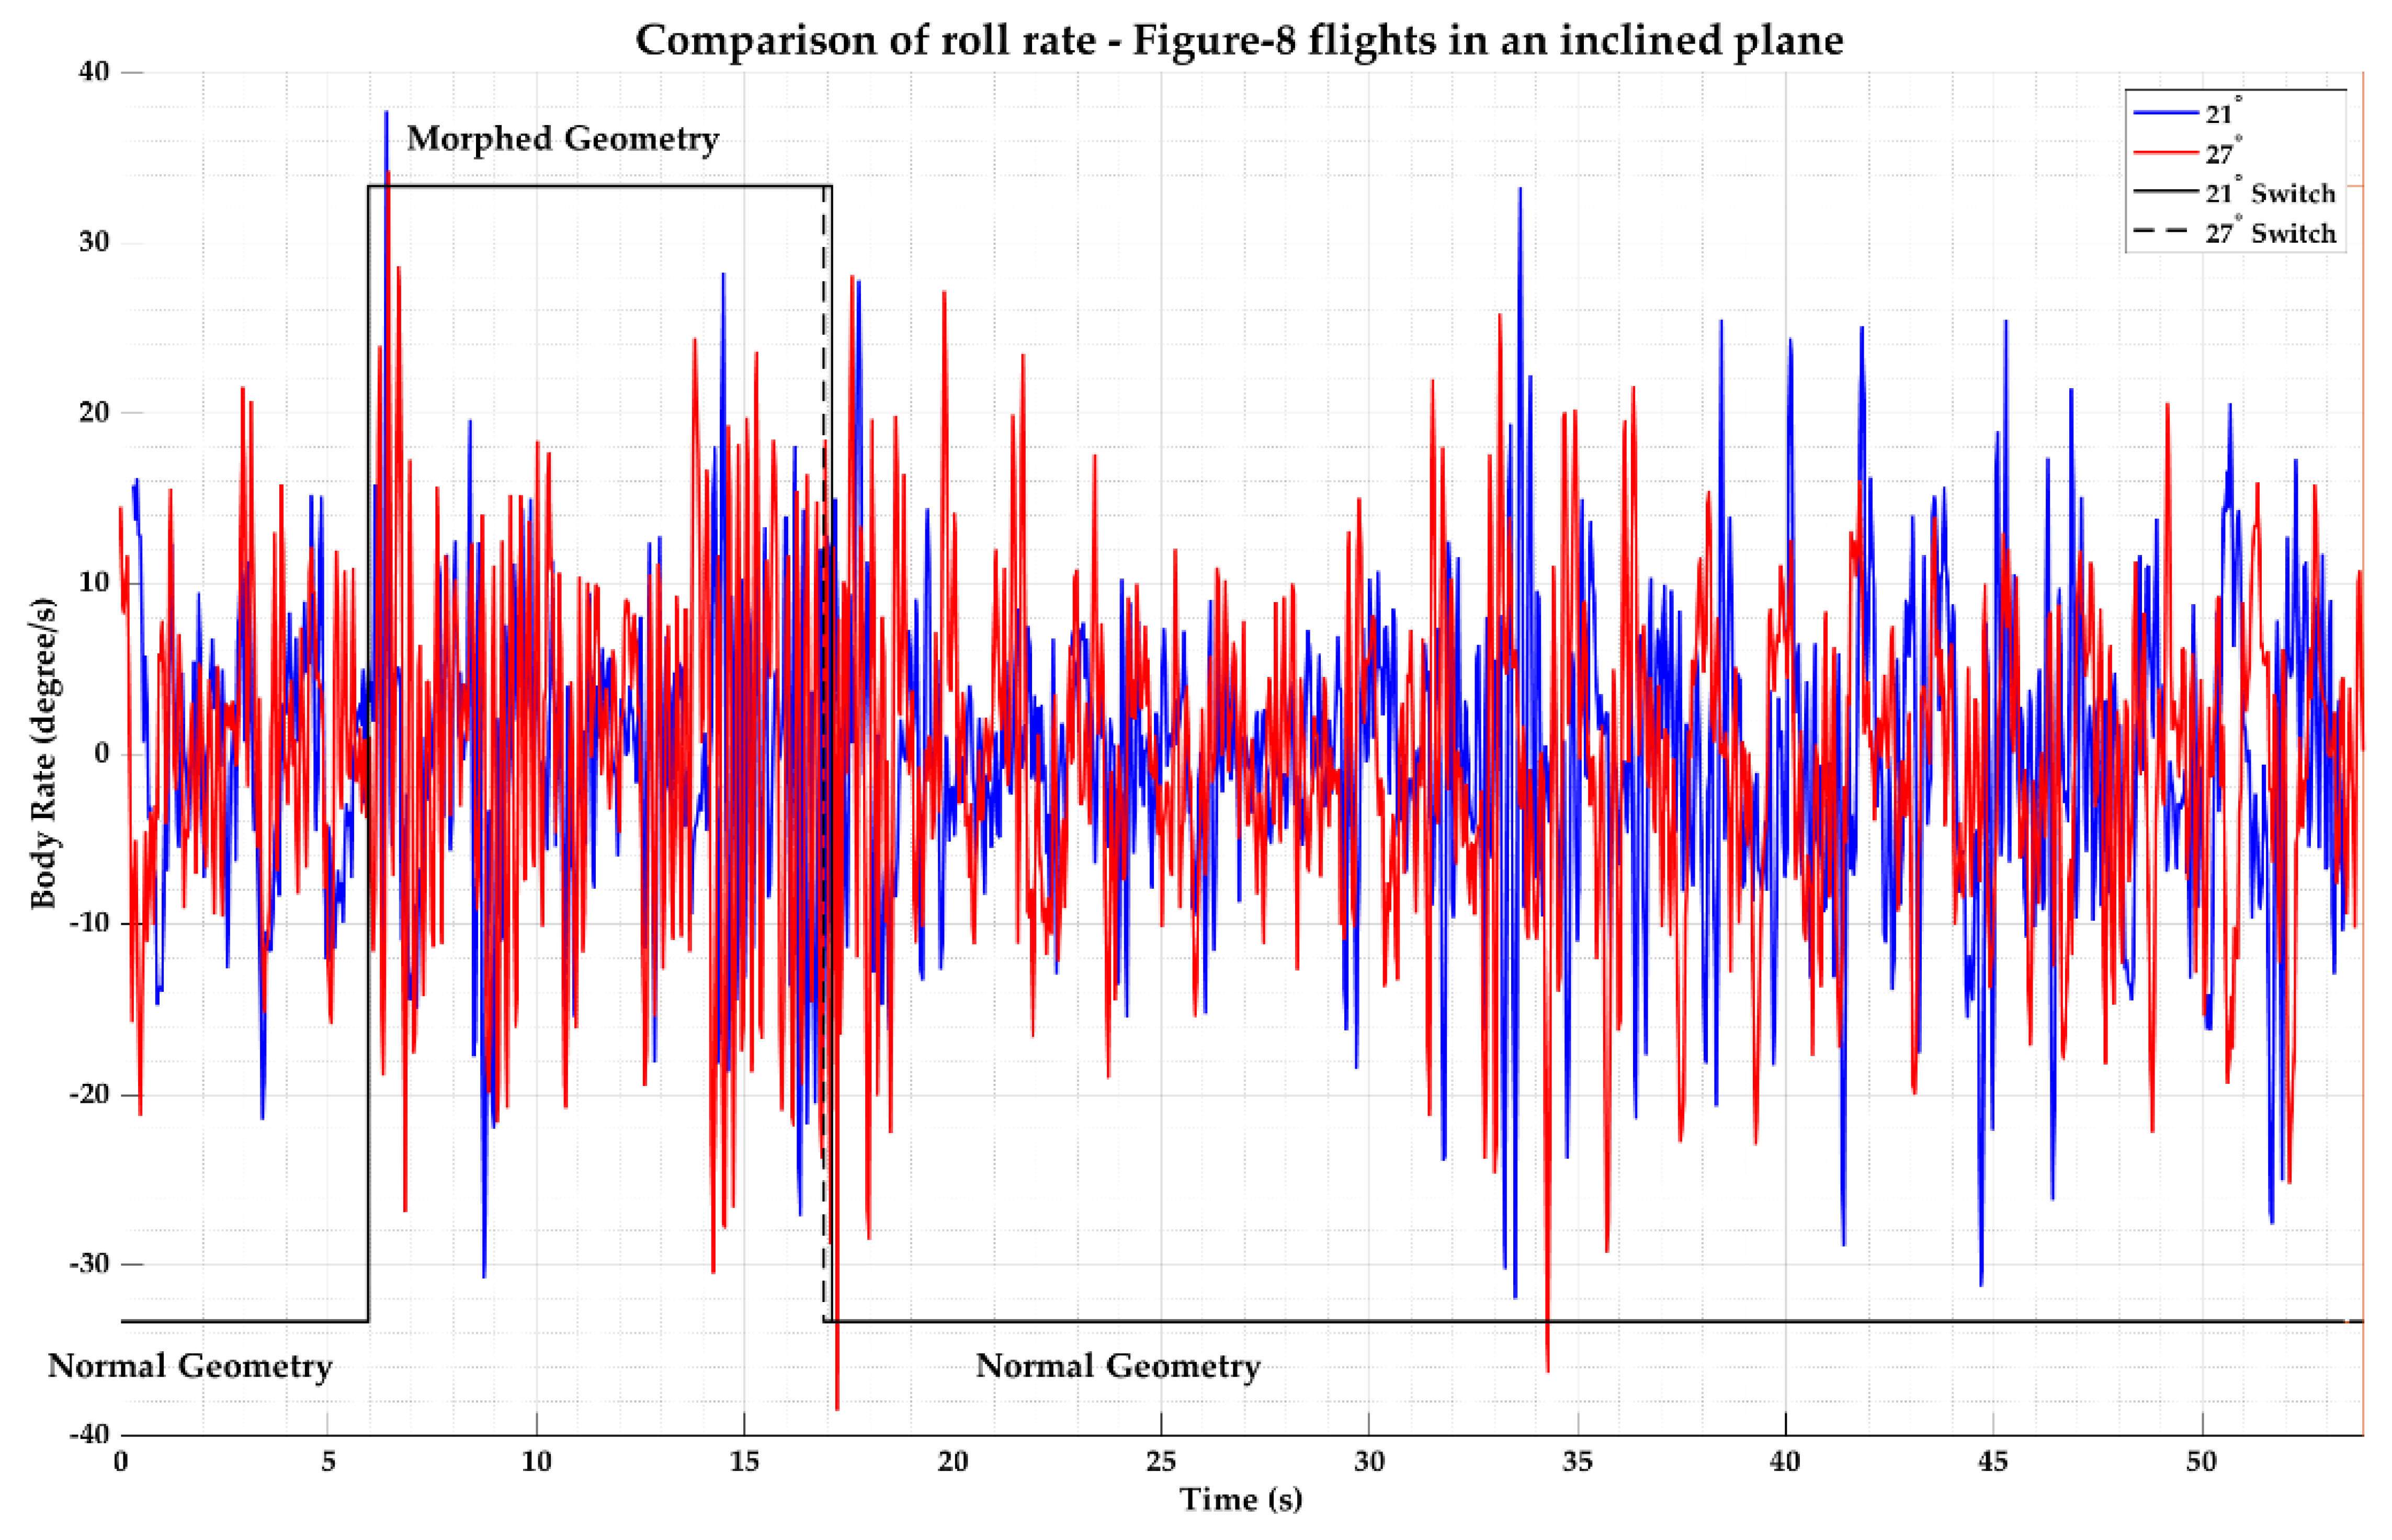
Figure 19.
Comparison of roll rate of Figure-8 flights of the quadcopter in an inclined plane.
Figure 19.
Comparison of roll rate of Figure-8 flights of the quadcopter in an inclined plane.
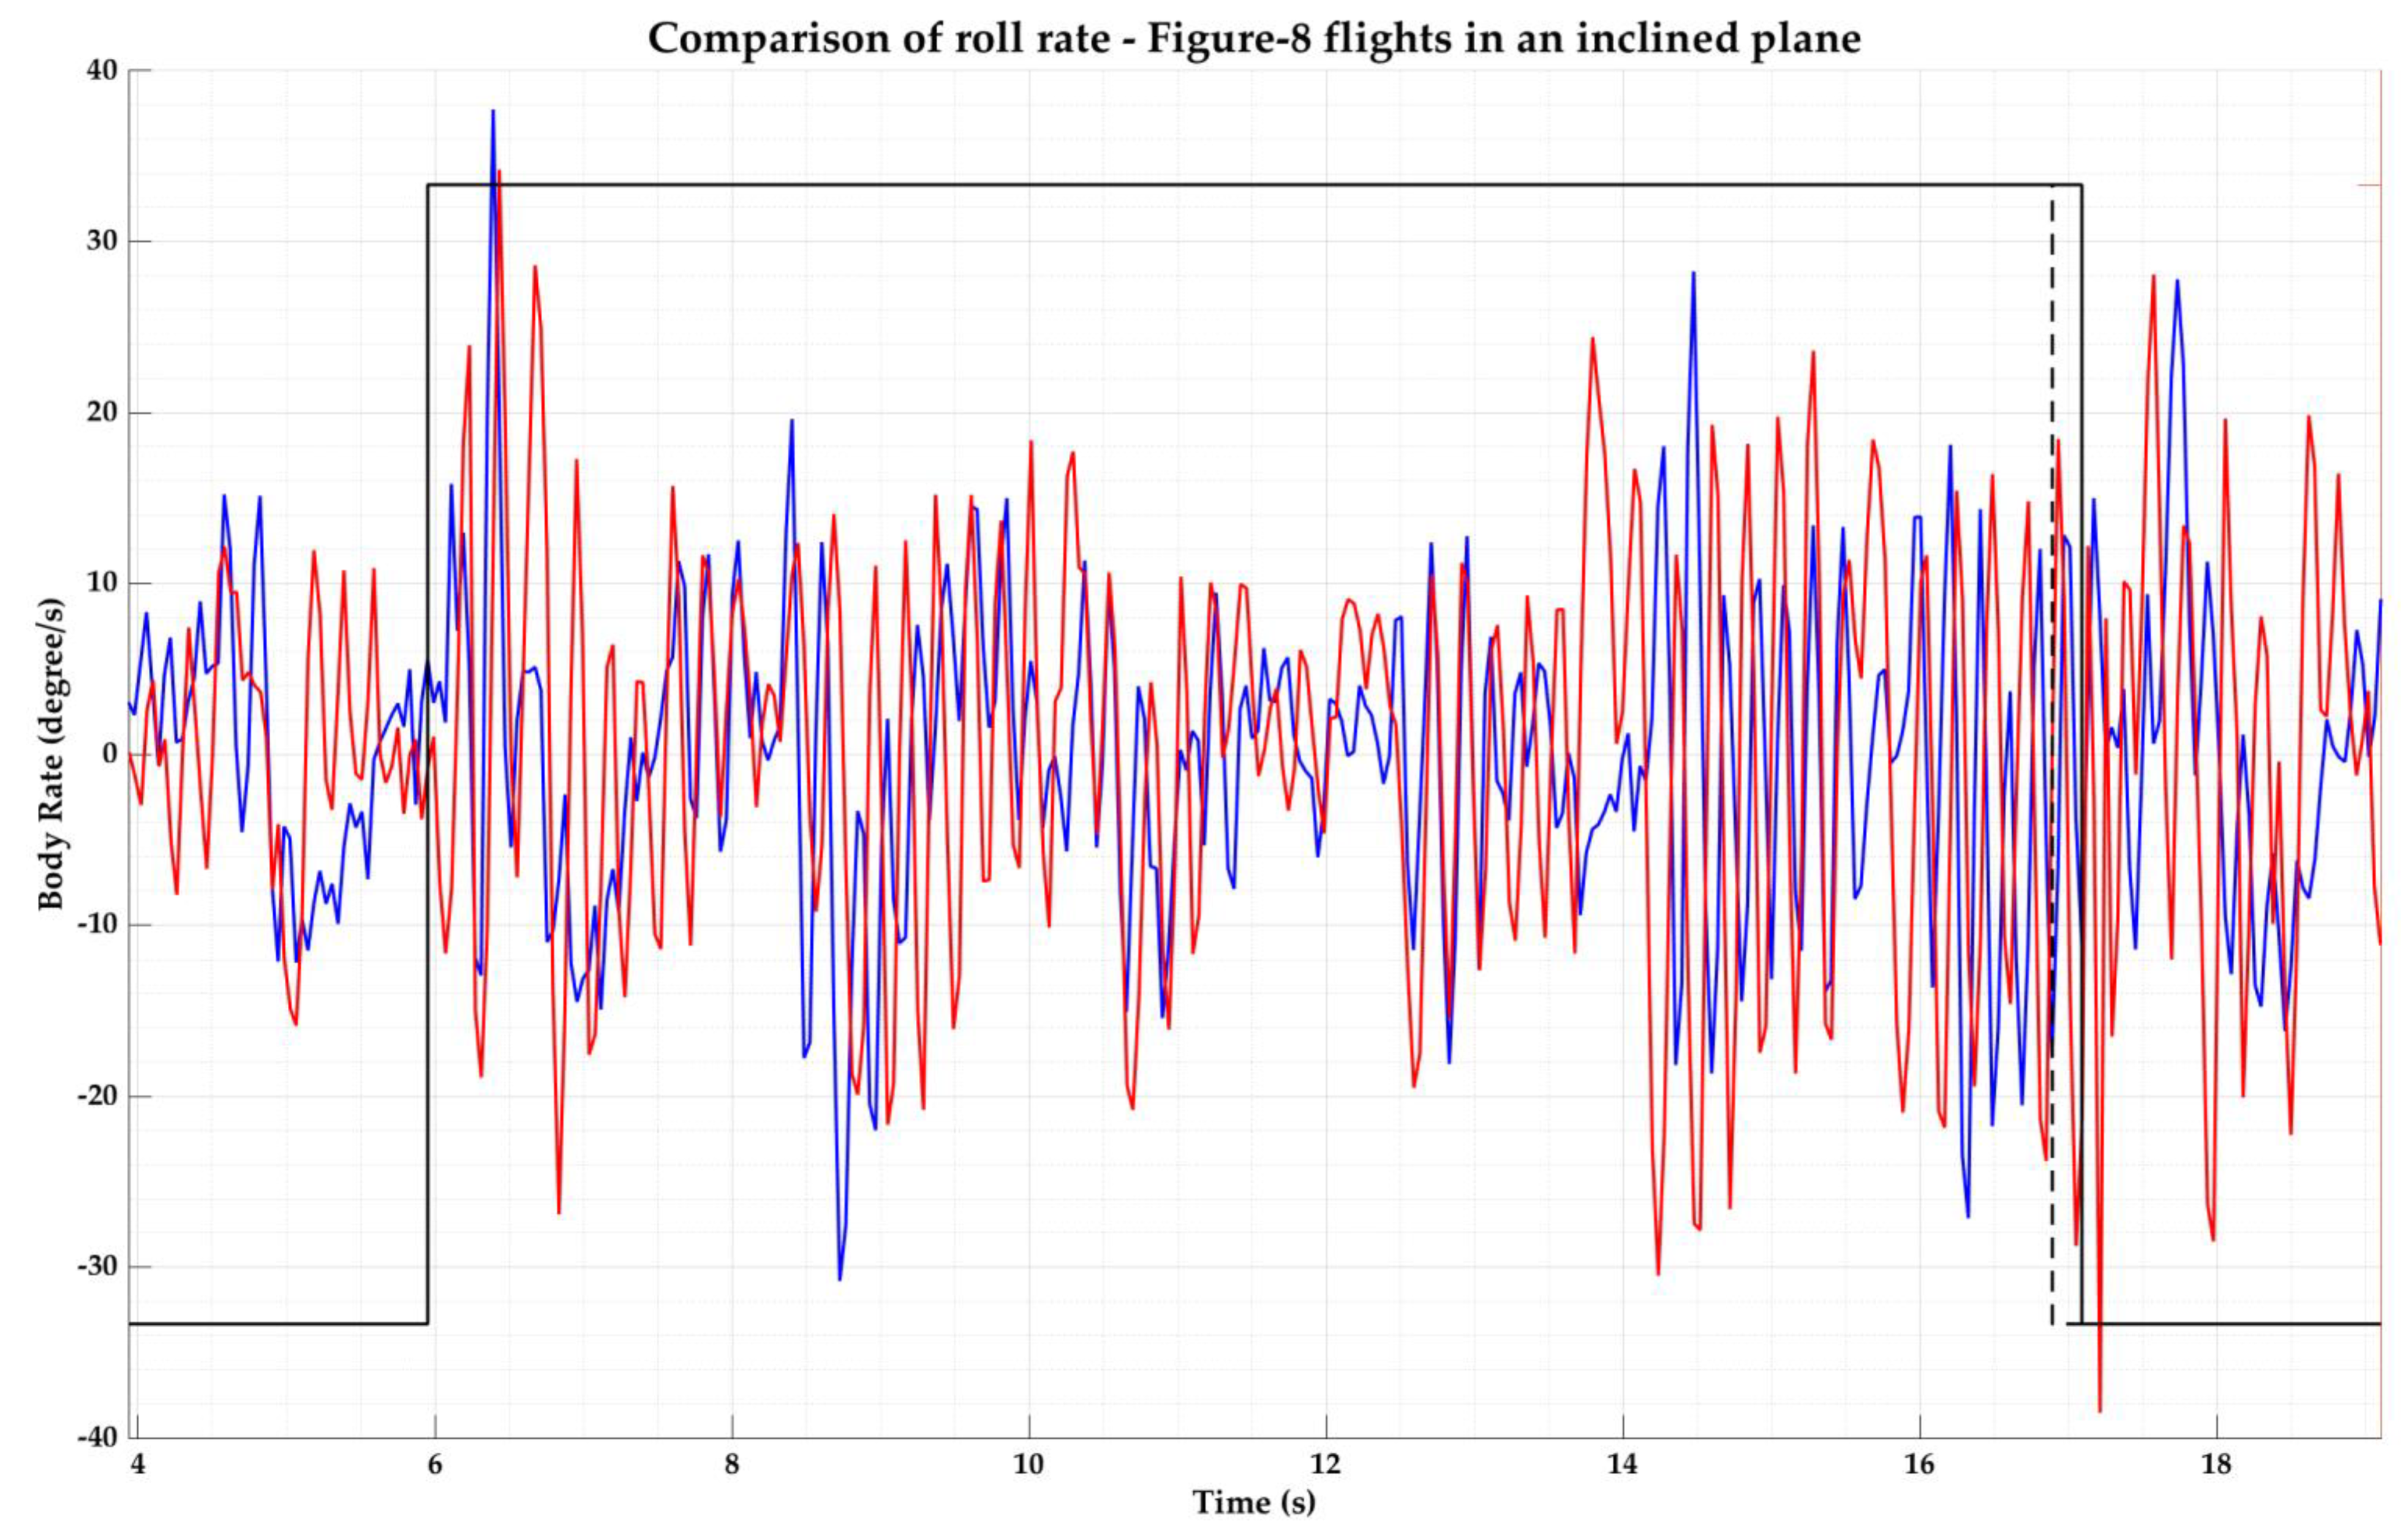
Figure 20.
Comparison of roll rate of Figure-8 flights of the quadcopter in an inclined plane—zoomed in.
Figure 20.
Comparison of roll rate of Figure-8 flights of the quadcopter in an inclined plane—zoomed in.
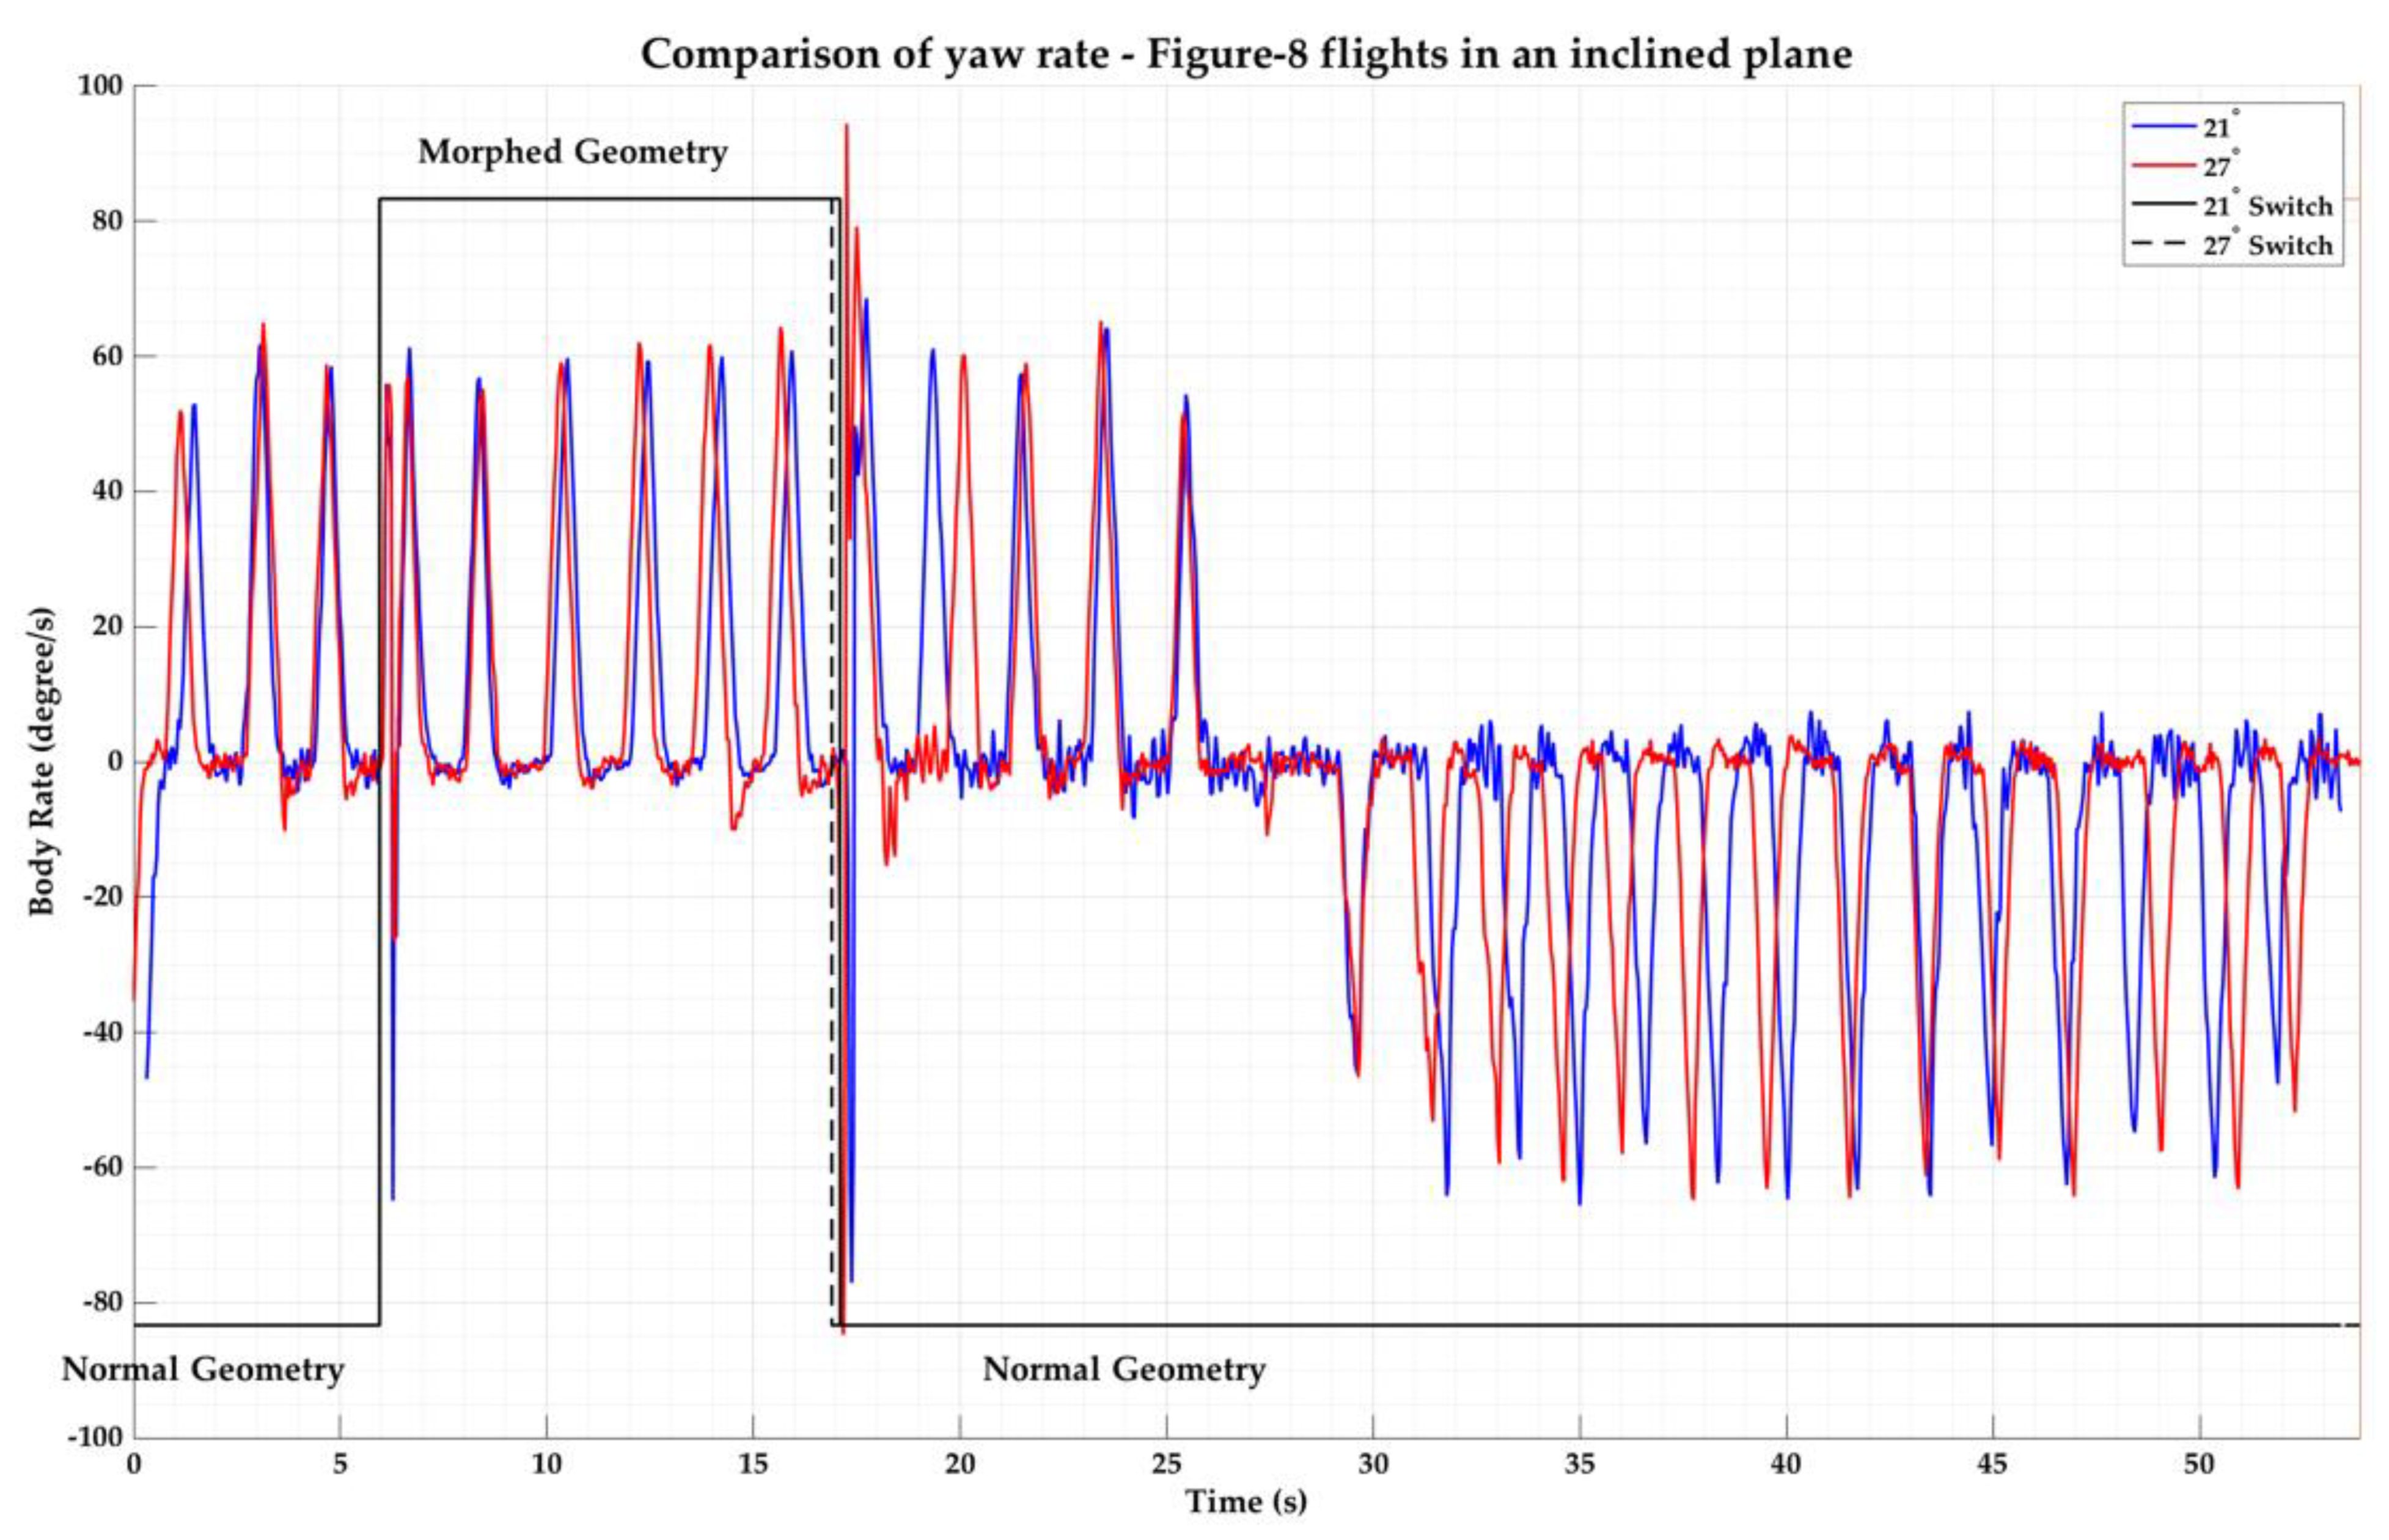
Figure 21.
Comparison of yaw rate of Figure-8 flights of the quadcopter in an inclined plane.
Figure 21.
Comparison of yaw rate of Figure-8 flights of the quadcopter in an inclined plane.
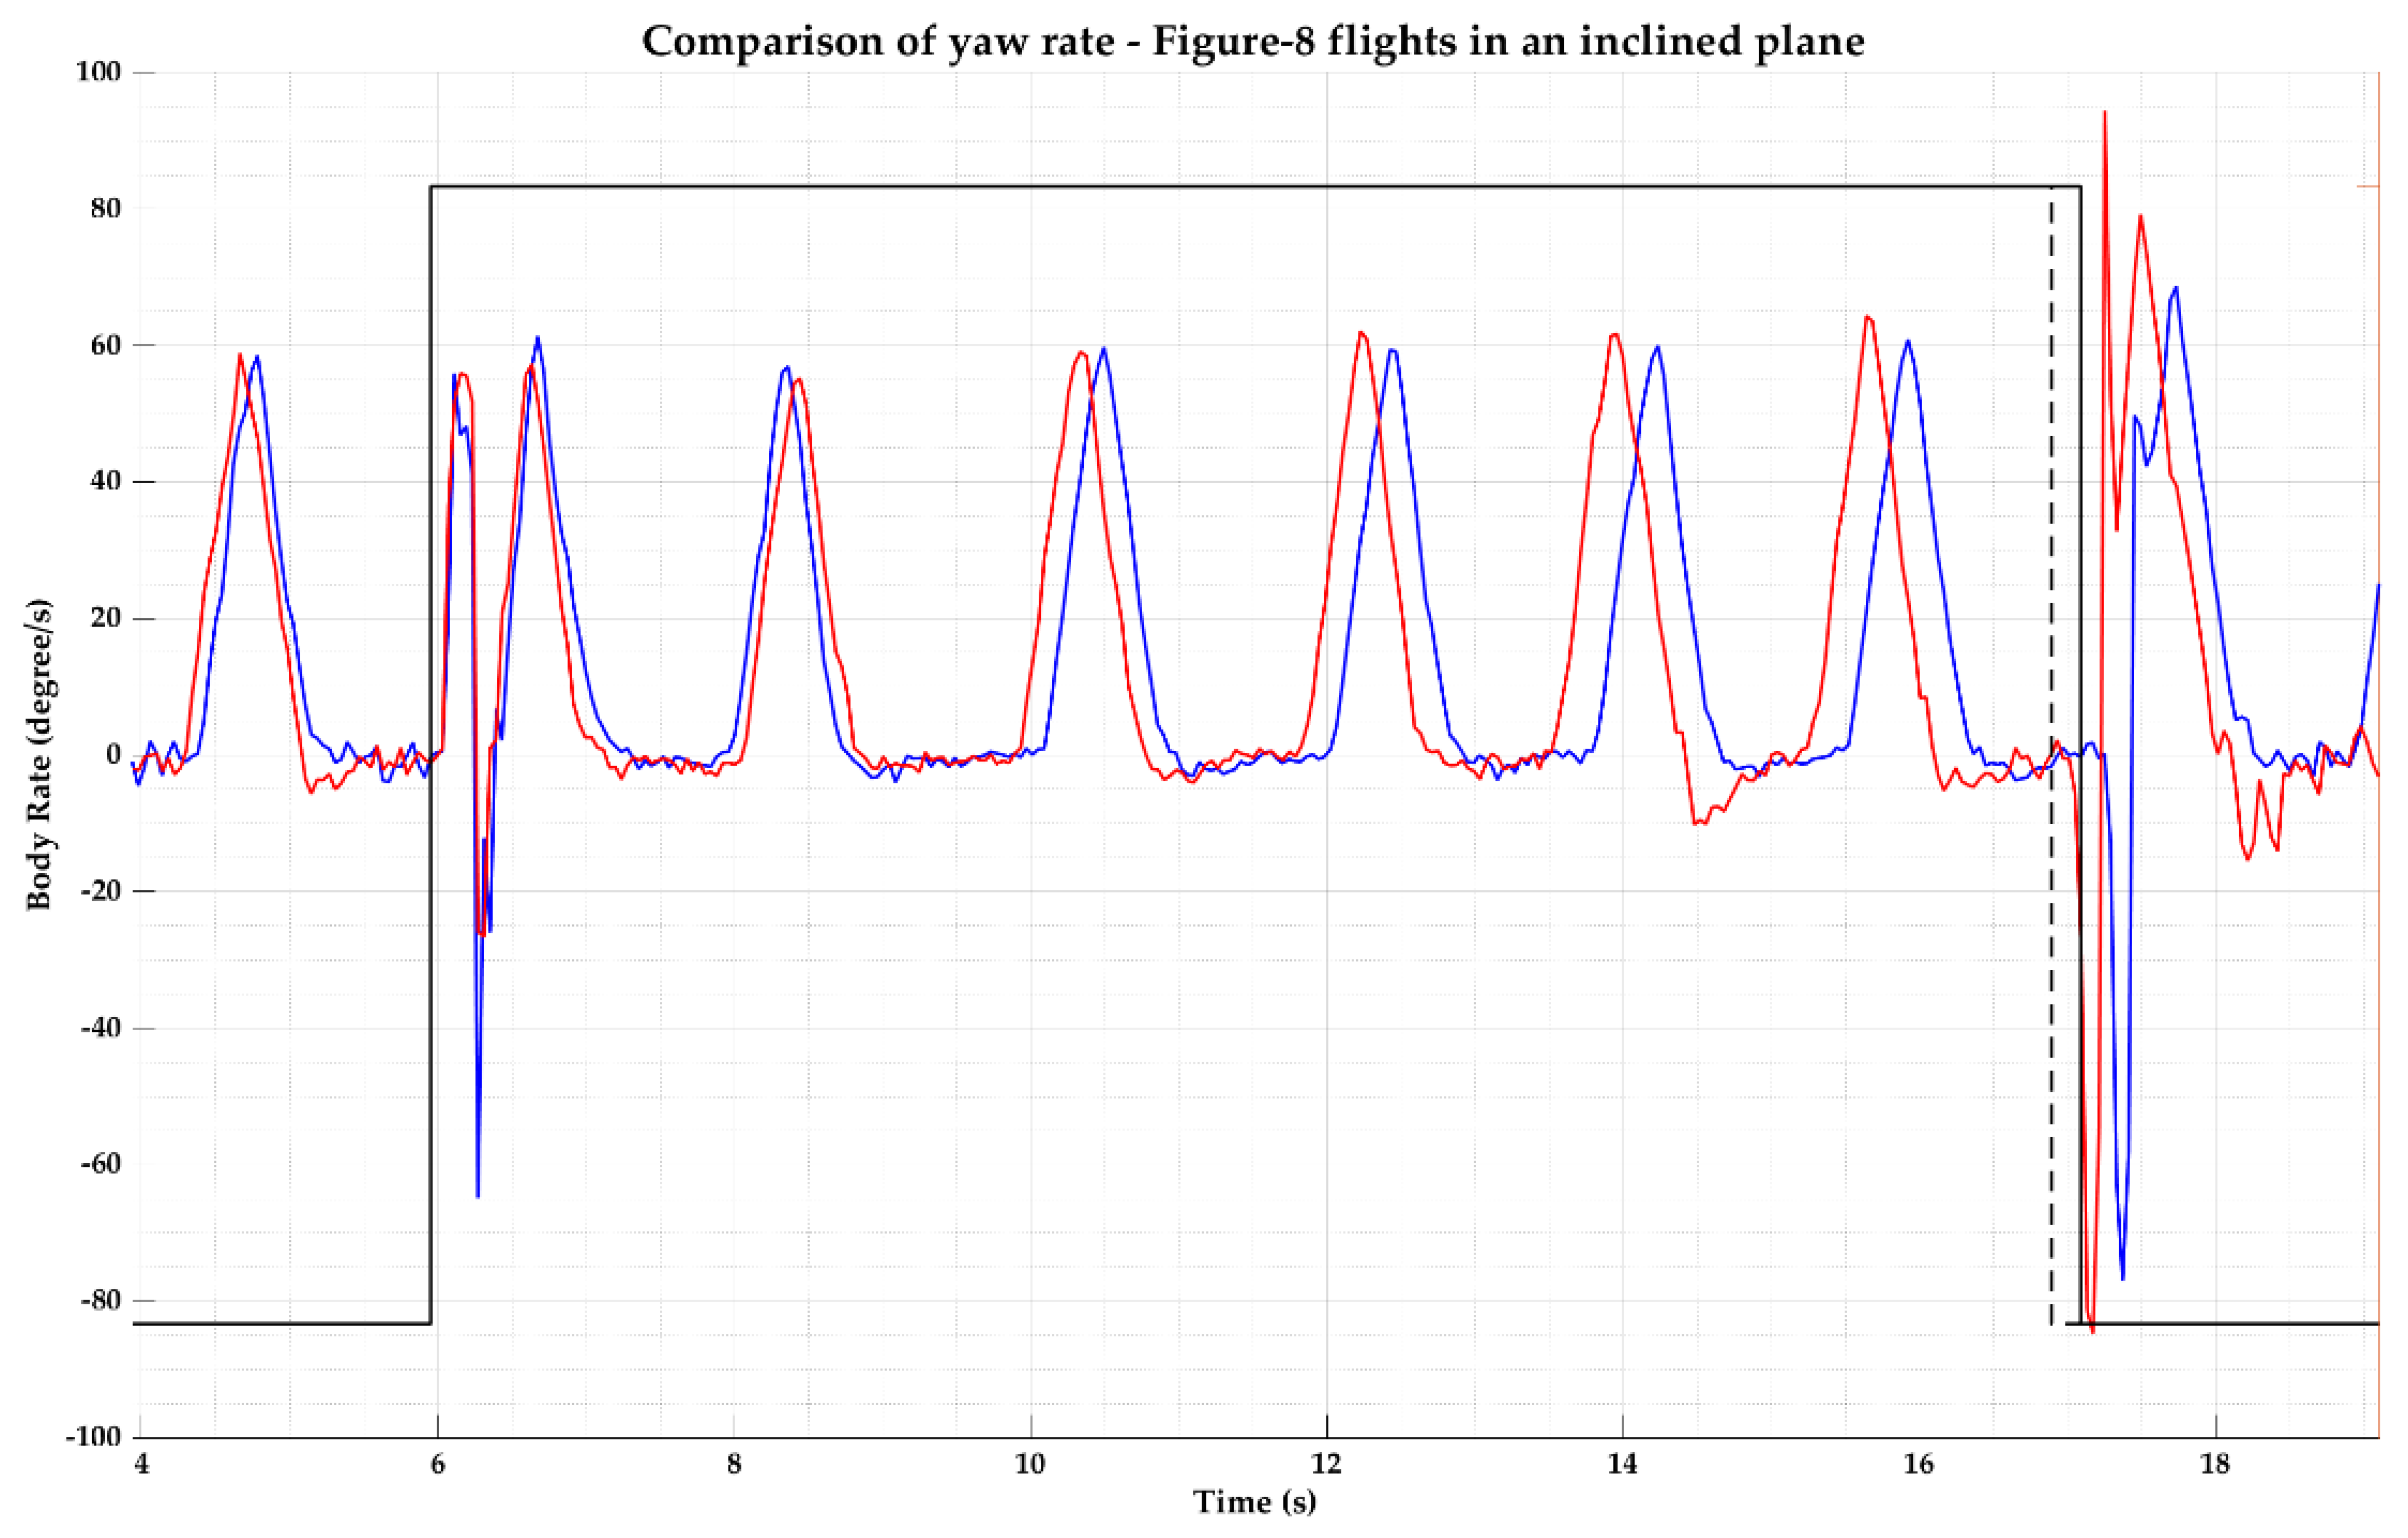
Figure 22.
Comparison of yaw rate of Figure-8 flights of the quadcopter in an inclined plane—zoomed in.
Figure 22.
Comparison of yaw rate of Figure-8 flights of the quadcopter in an inclined plane—zoomed in.
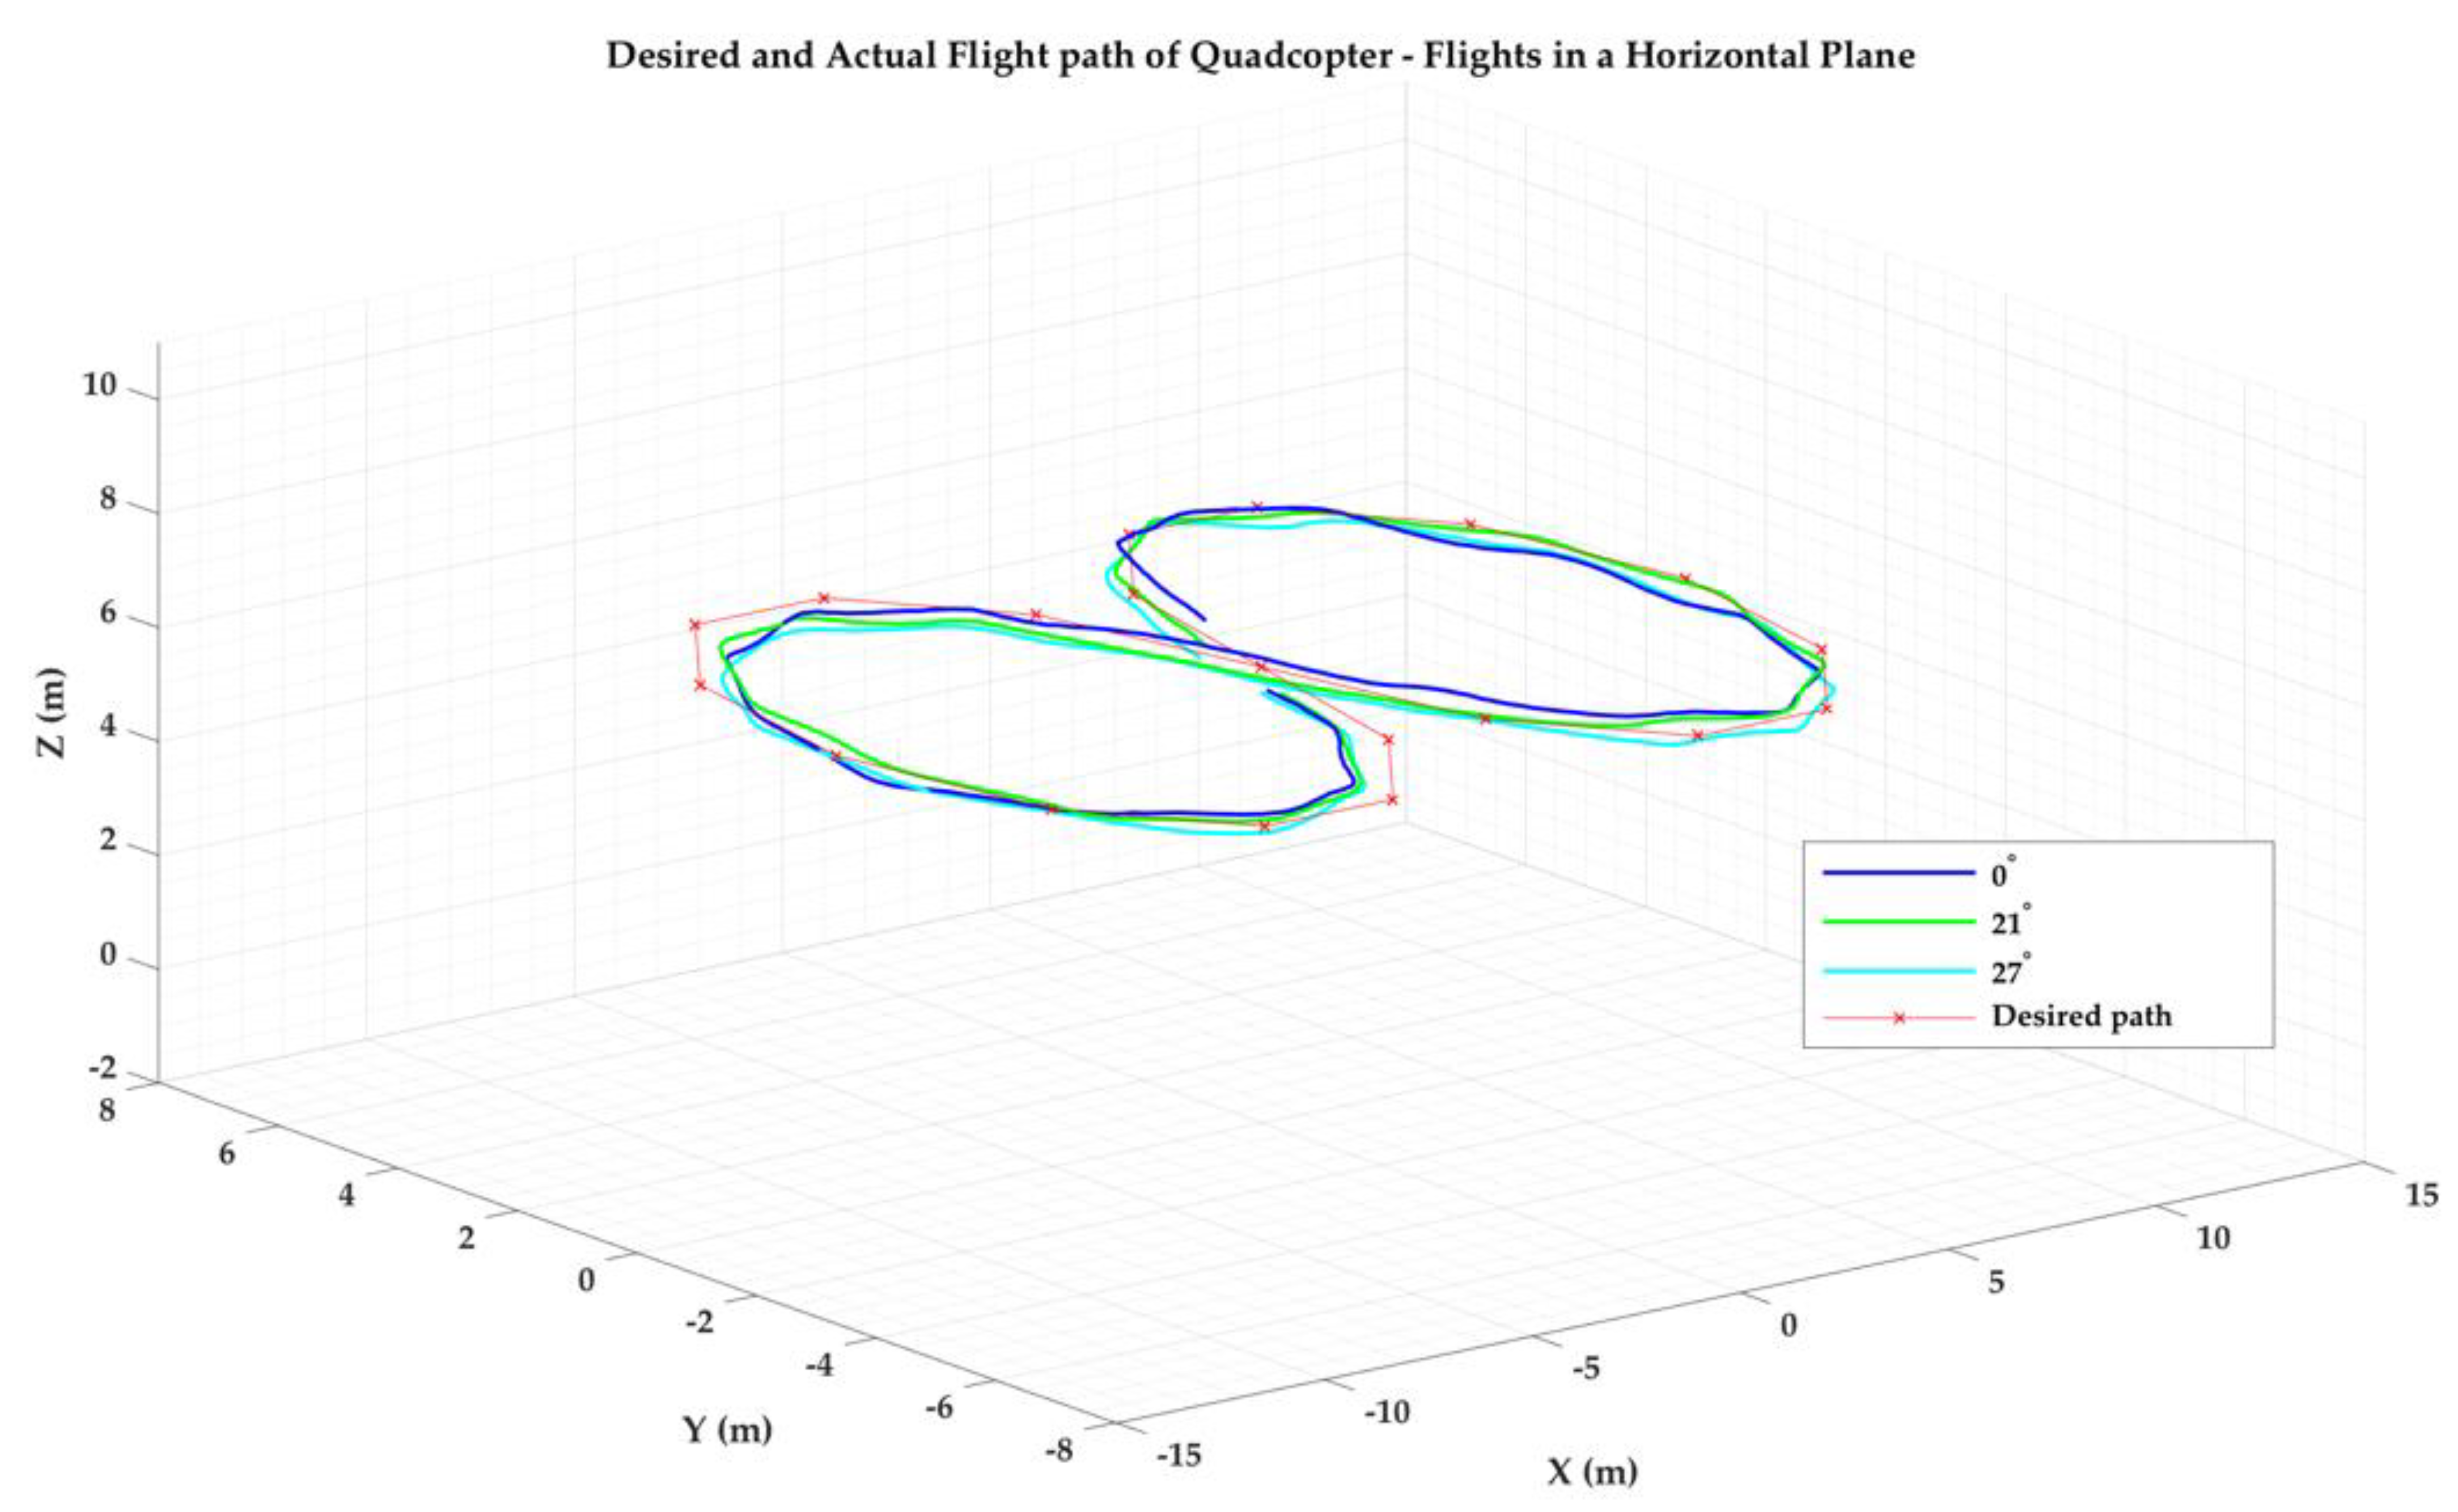
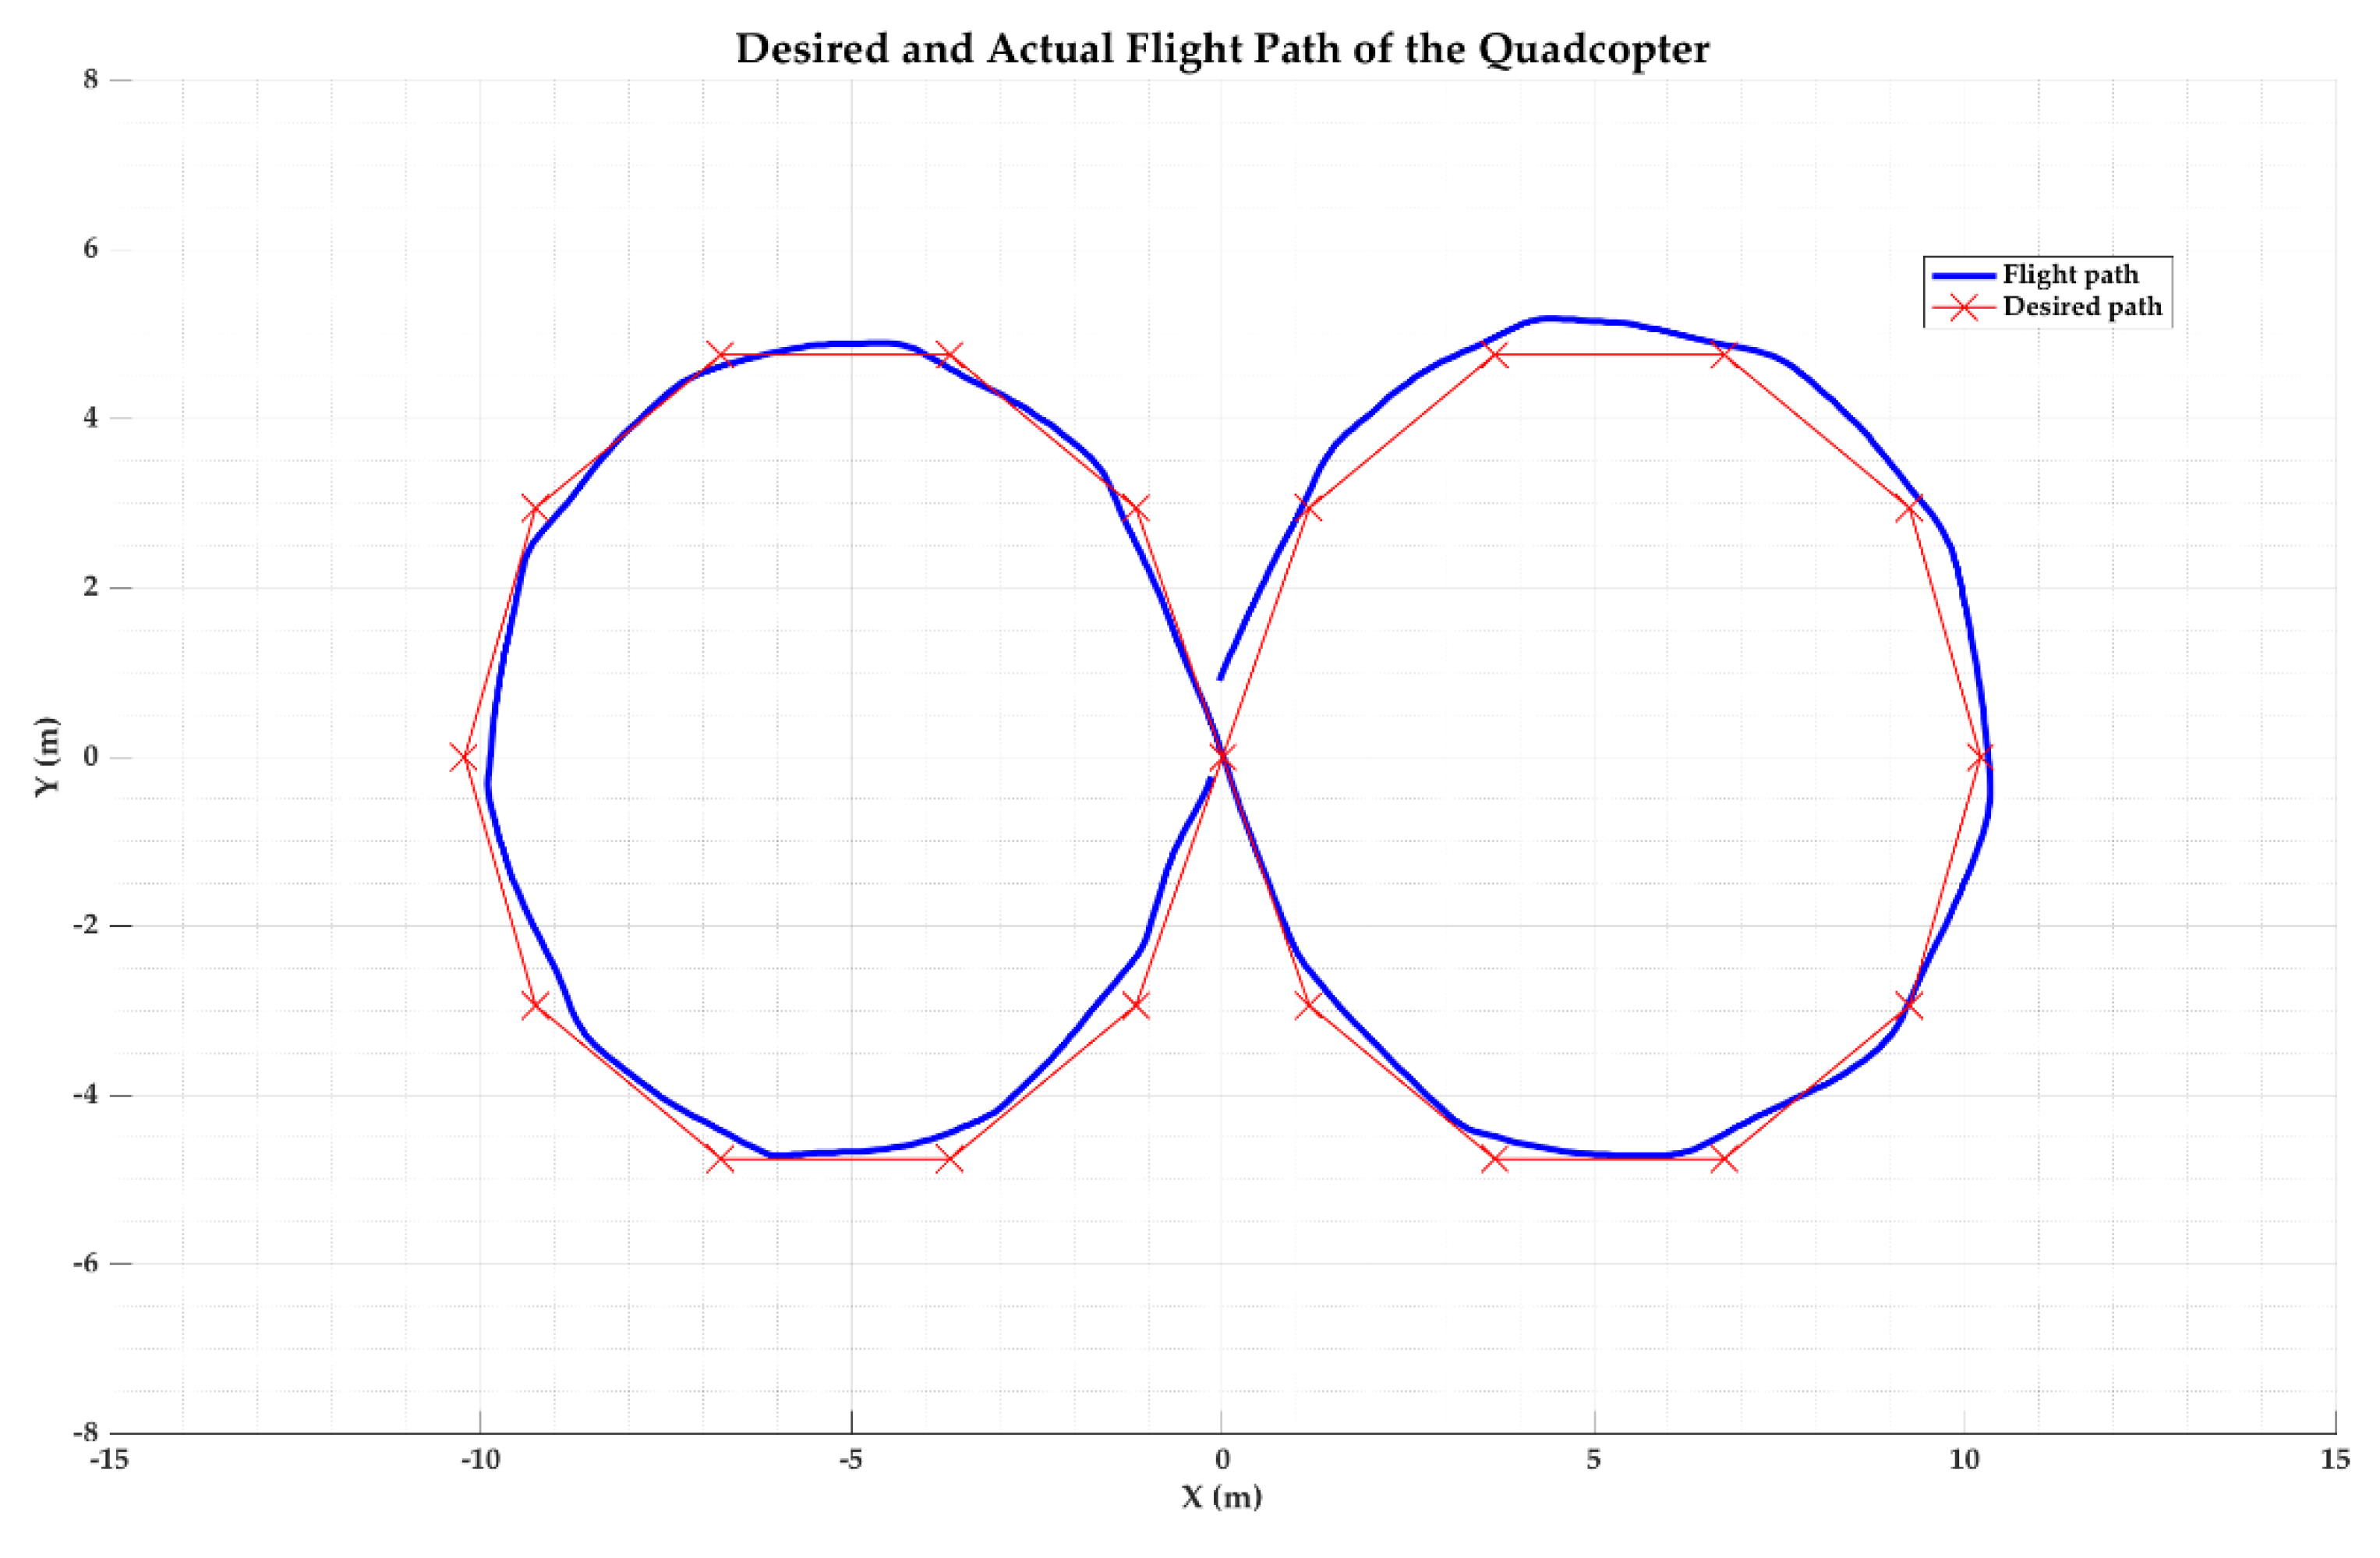
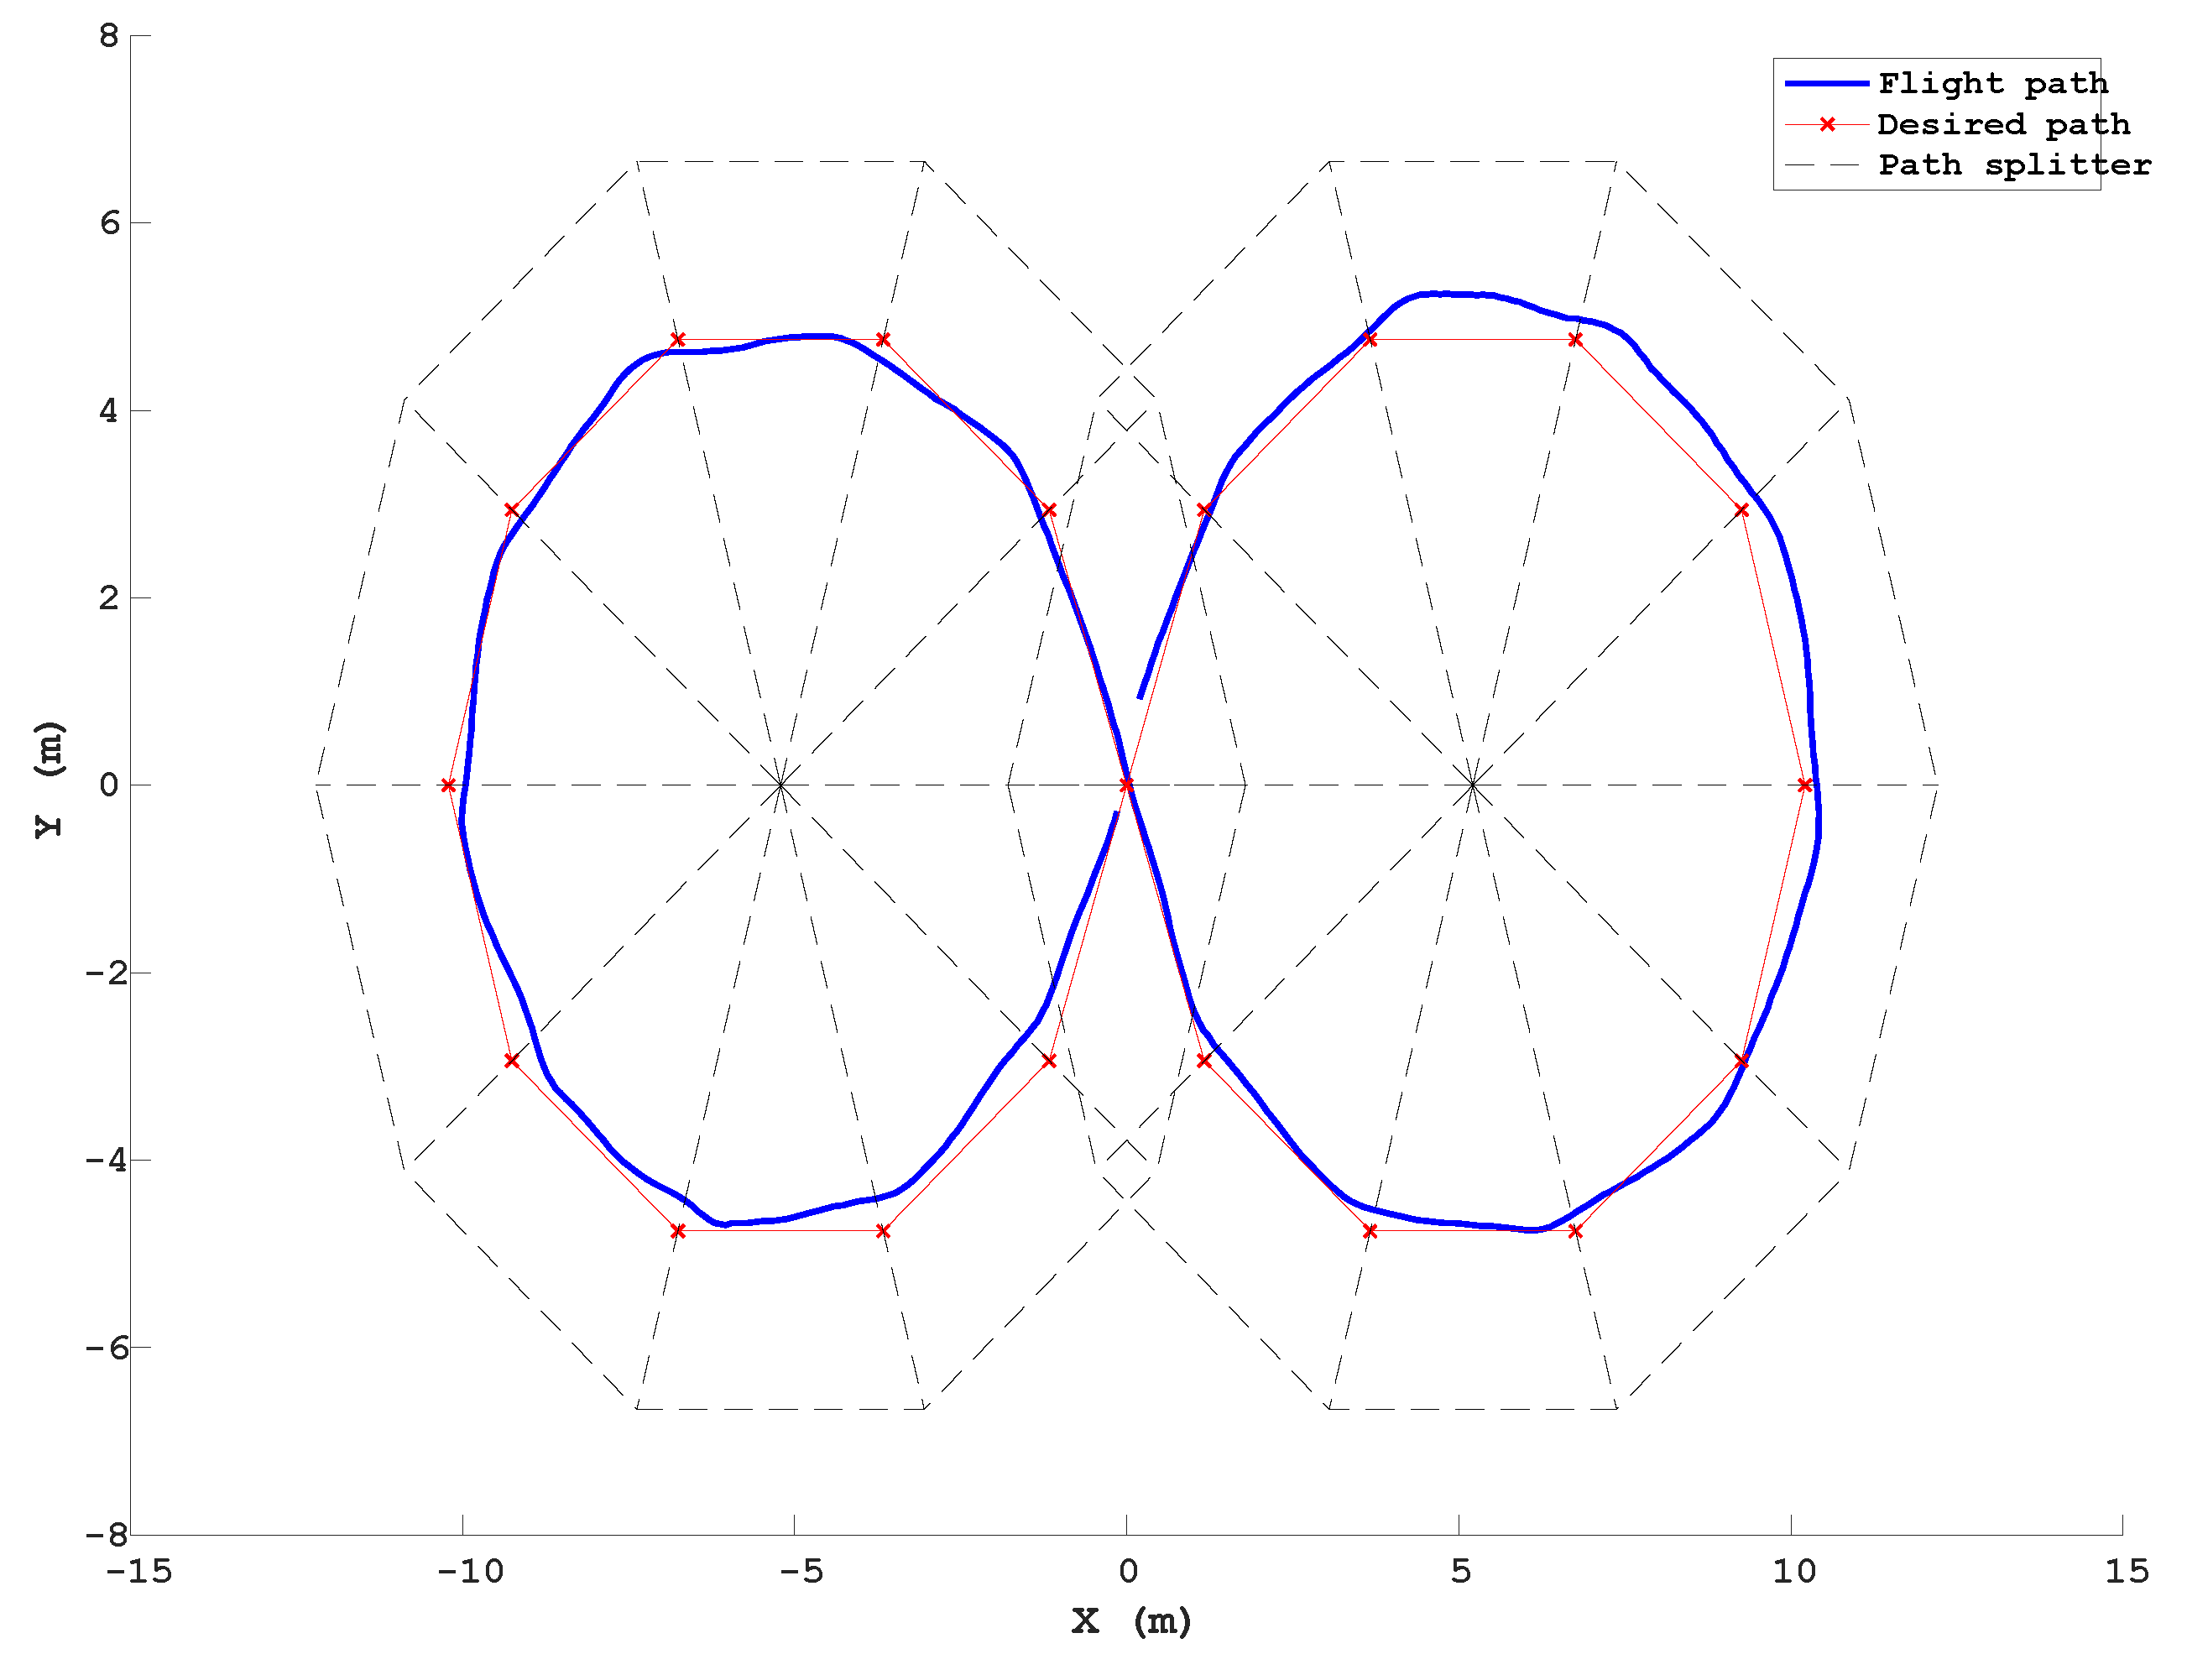
Figure 23.
Desired and actual flight path of quadcopter—morphing flights in a horizontal plane.
Figure 23.
Desired and actual flight path of quadcopter—morphing flights in a horizontal plane.
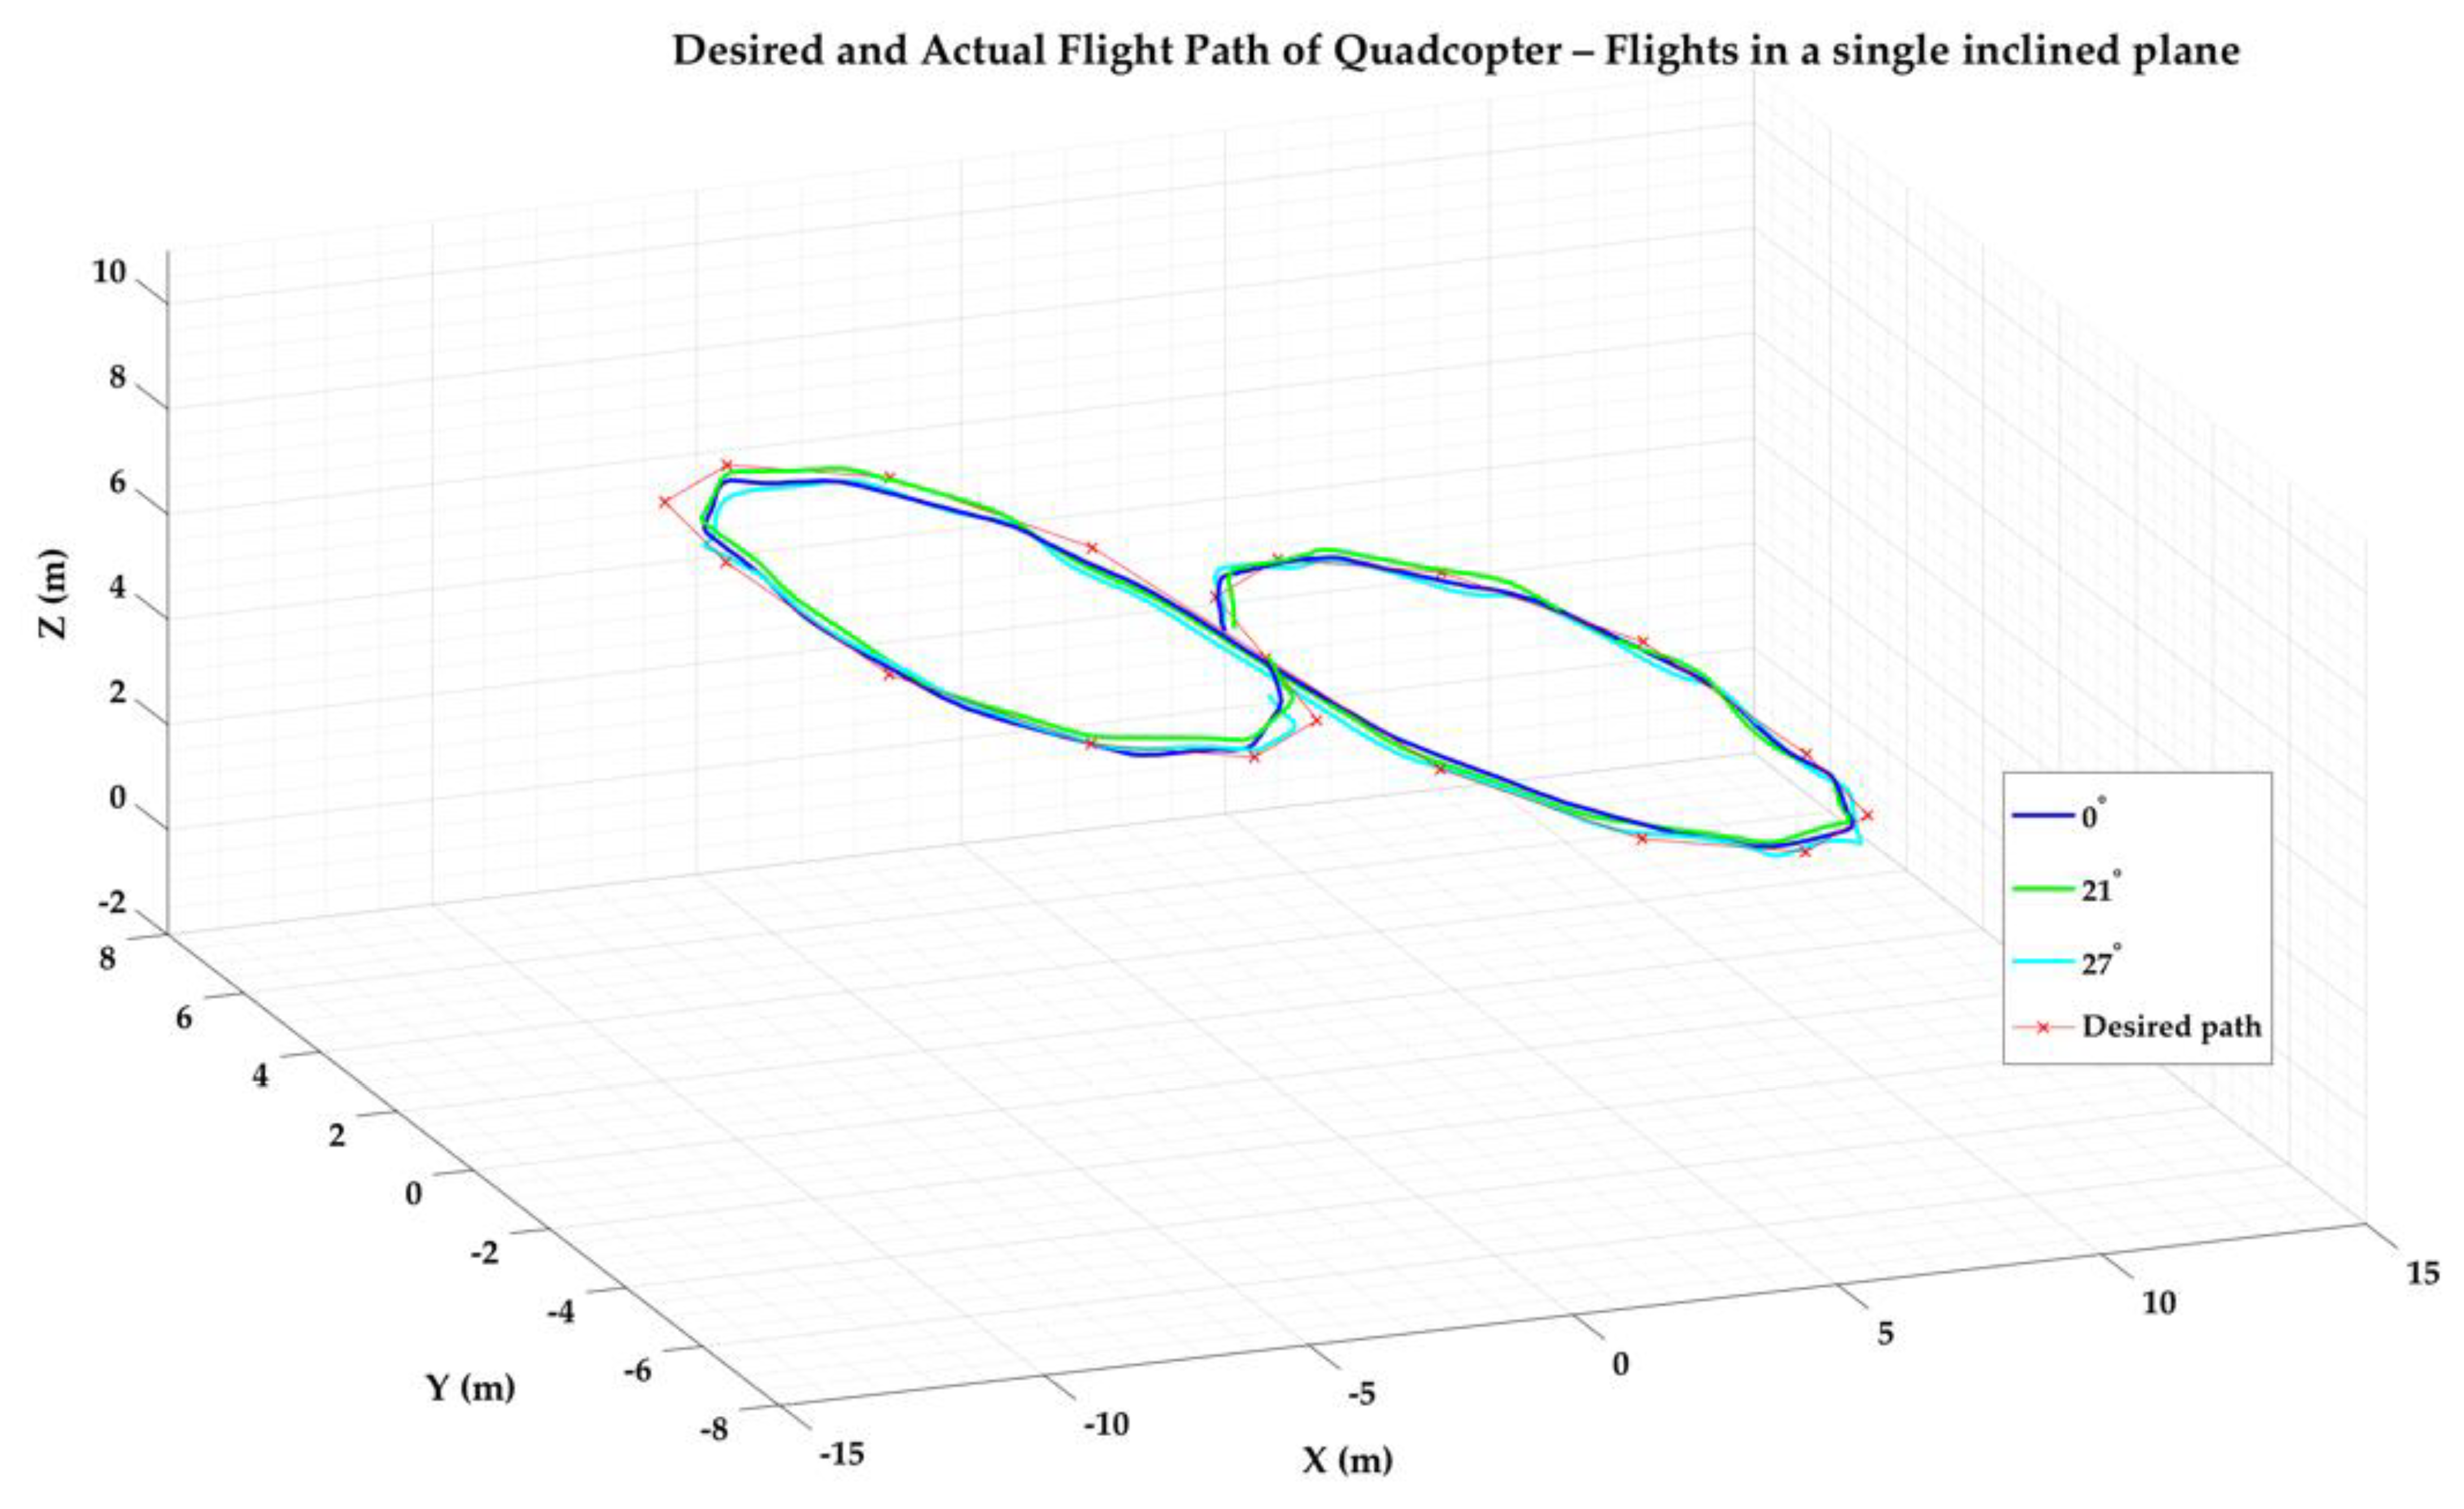
Figure 24.
Desired and actual flight path of quadcopter—morphing flights in a single inclined plane.
Figure 24.
Desired and actual flight path of quadcopter—morphing flights in a single inclined plane.
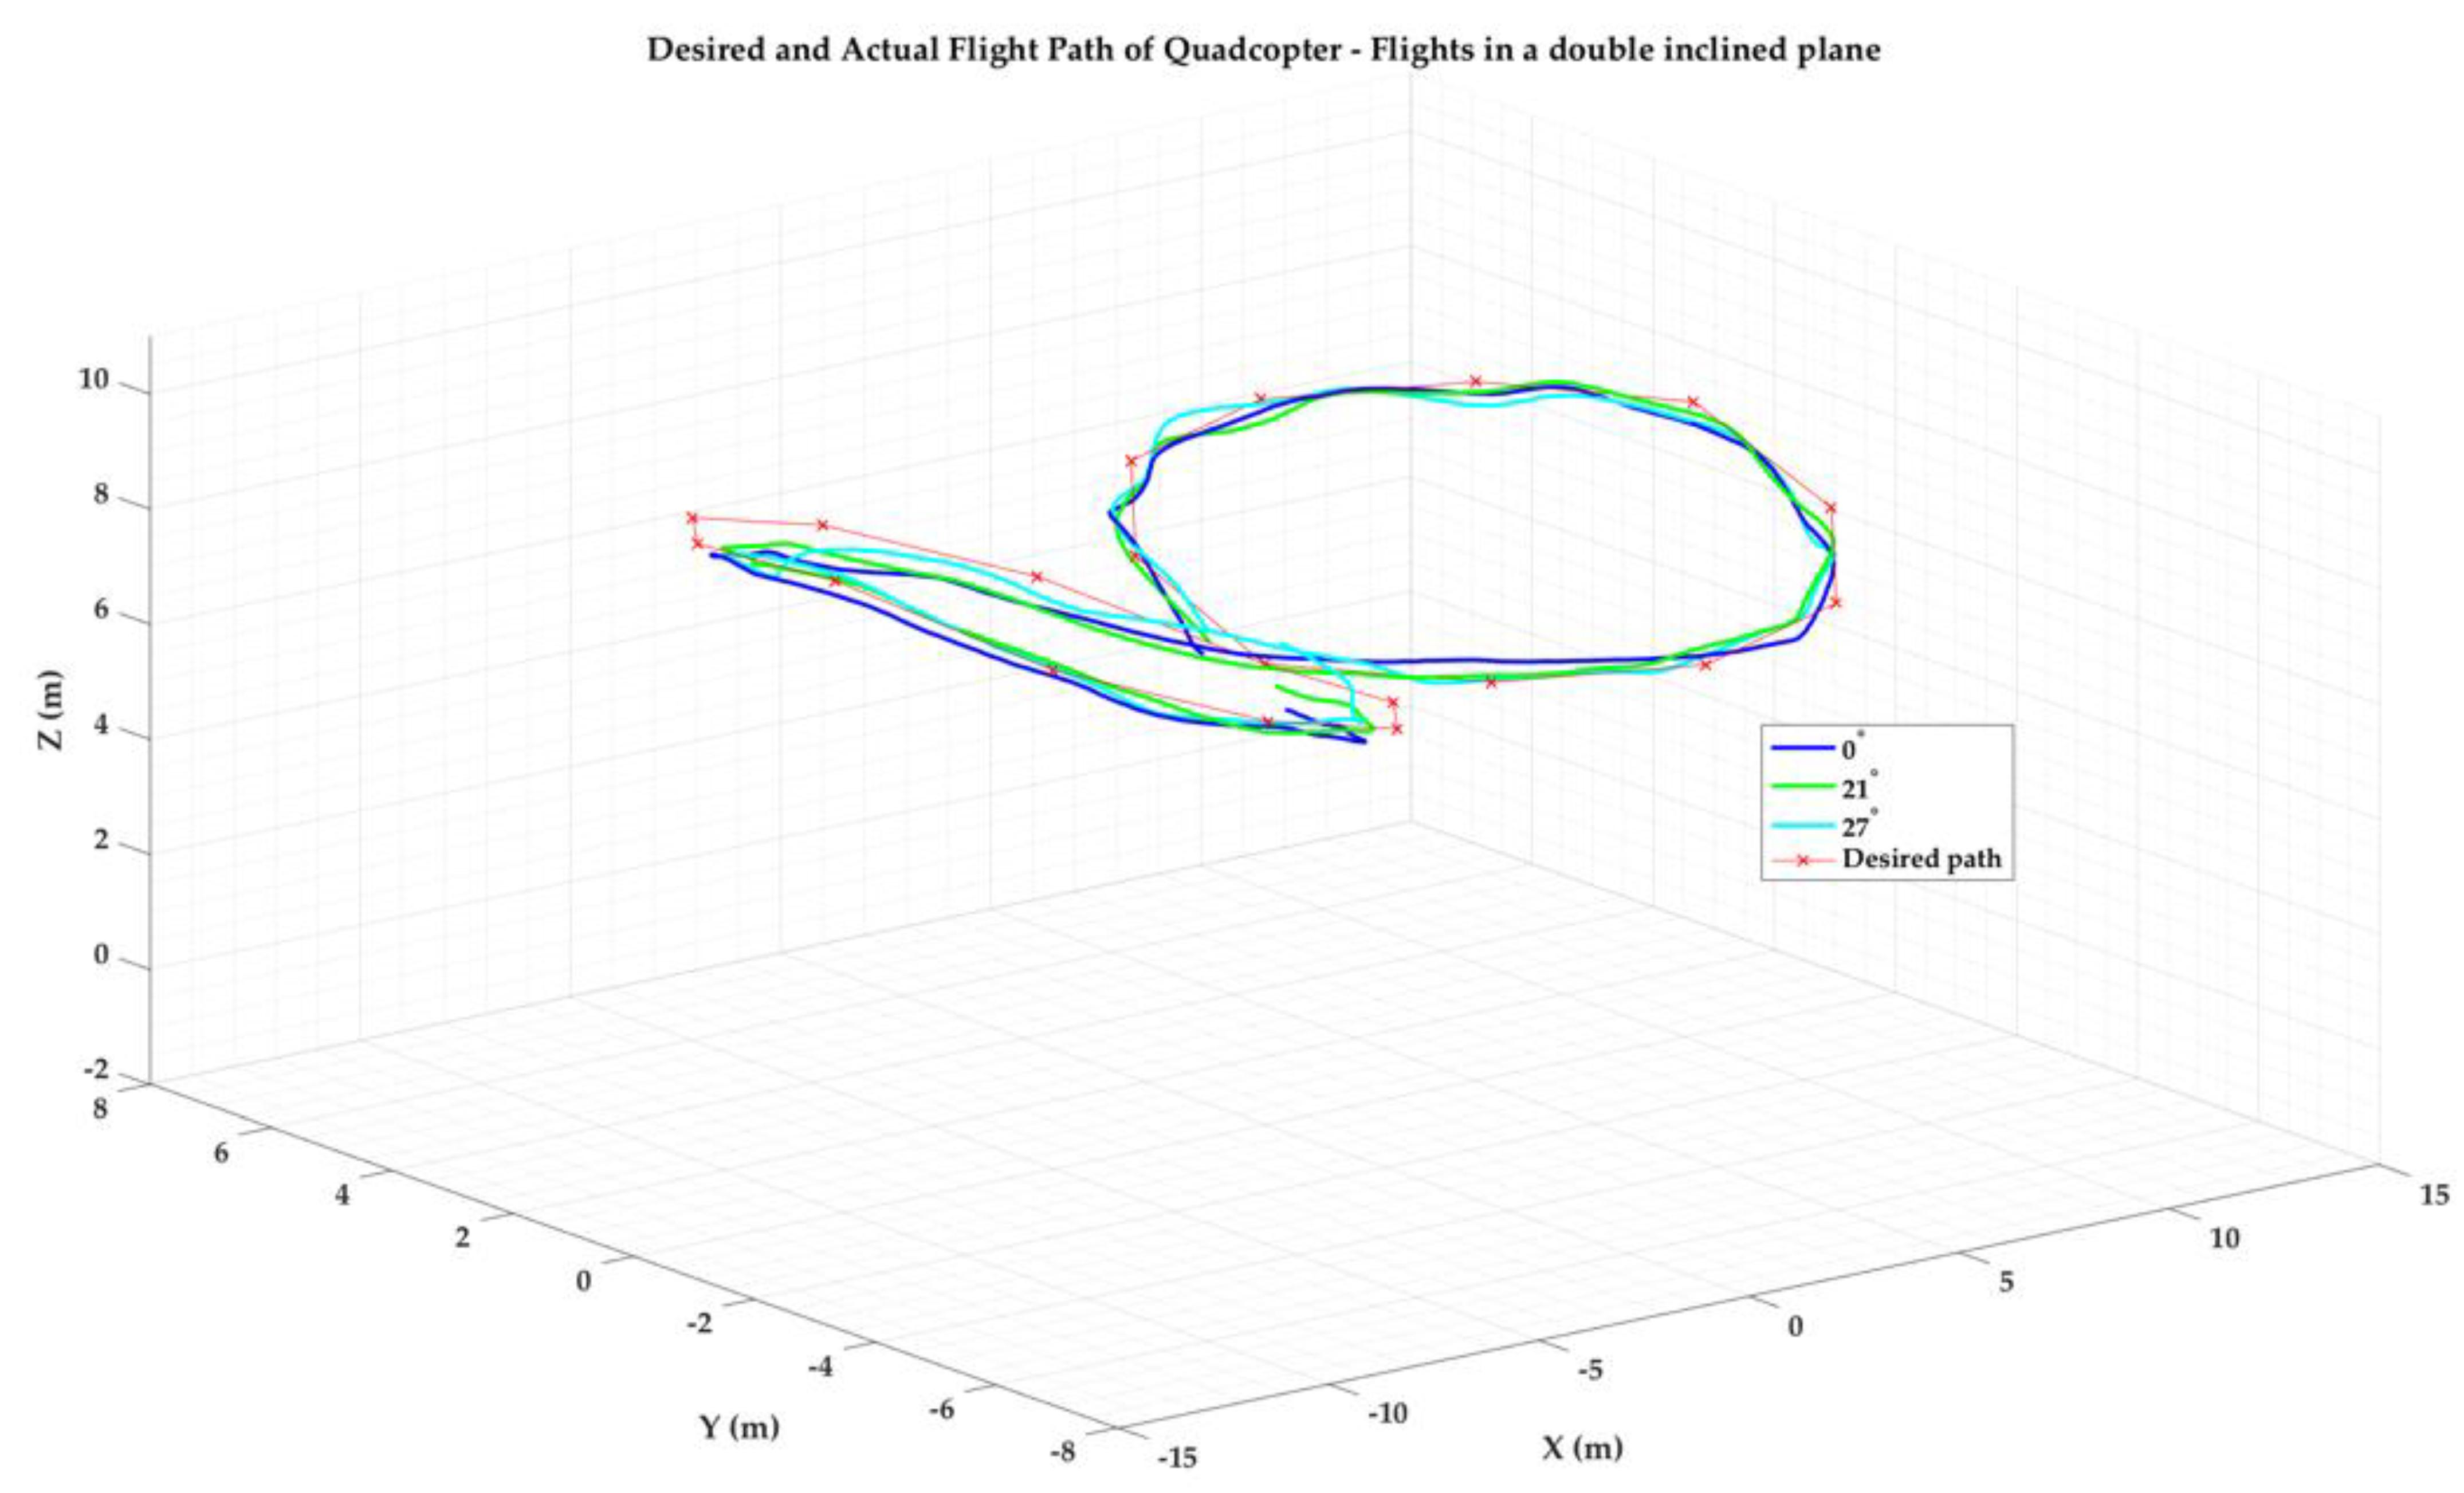
Figure 25.
Desired and actual flight path of—morphing flights in a Double Inclined plane.
Figure 25.
Desired and actual flight path of—morphing flights in a Double Inclined plane.
Figure 26.
Step 1: “sliced pie” trajectory based on 20 waypoints.
Figure 26.
Step 1: “sliced pie” trajectory based on 20 waypoints.
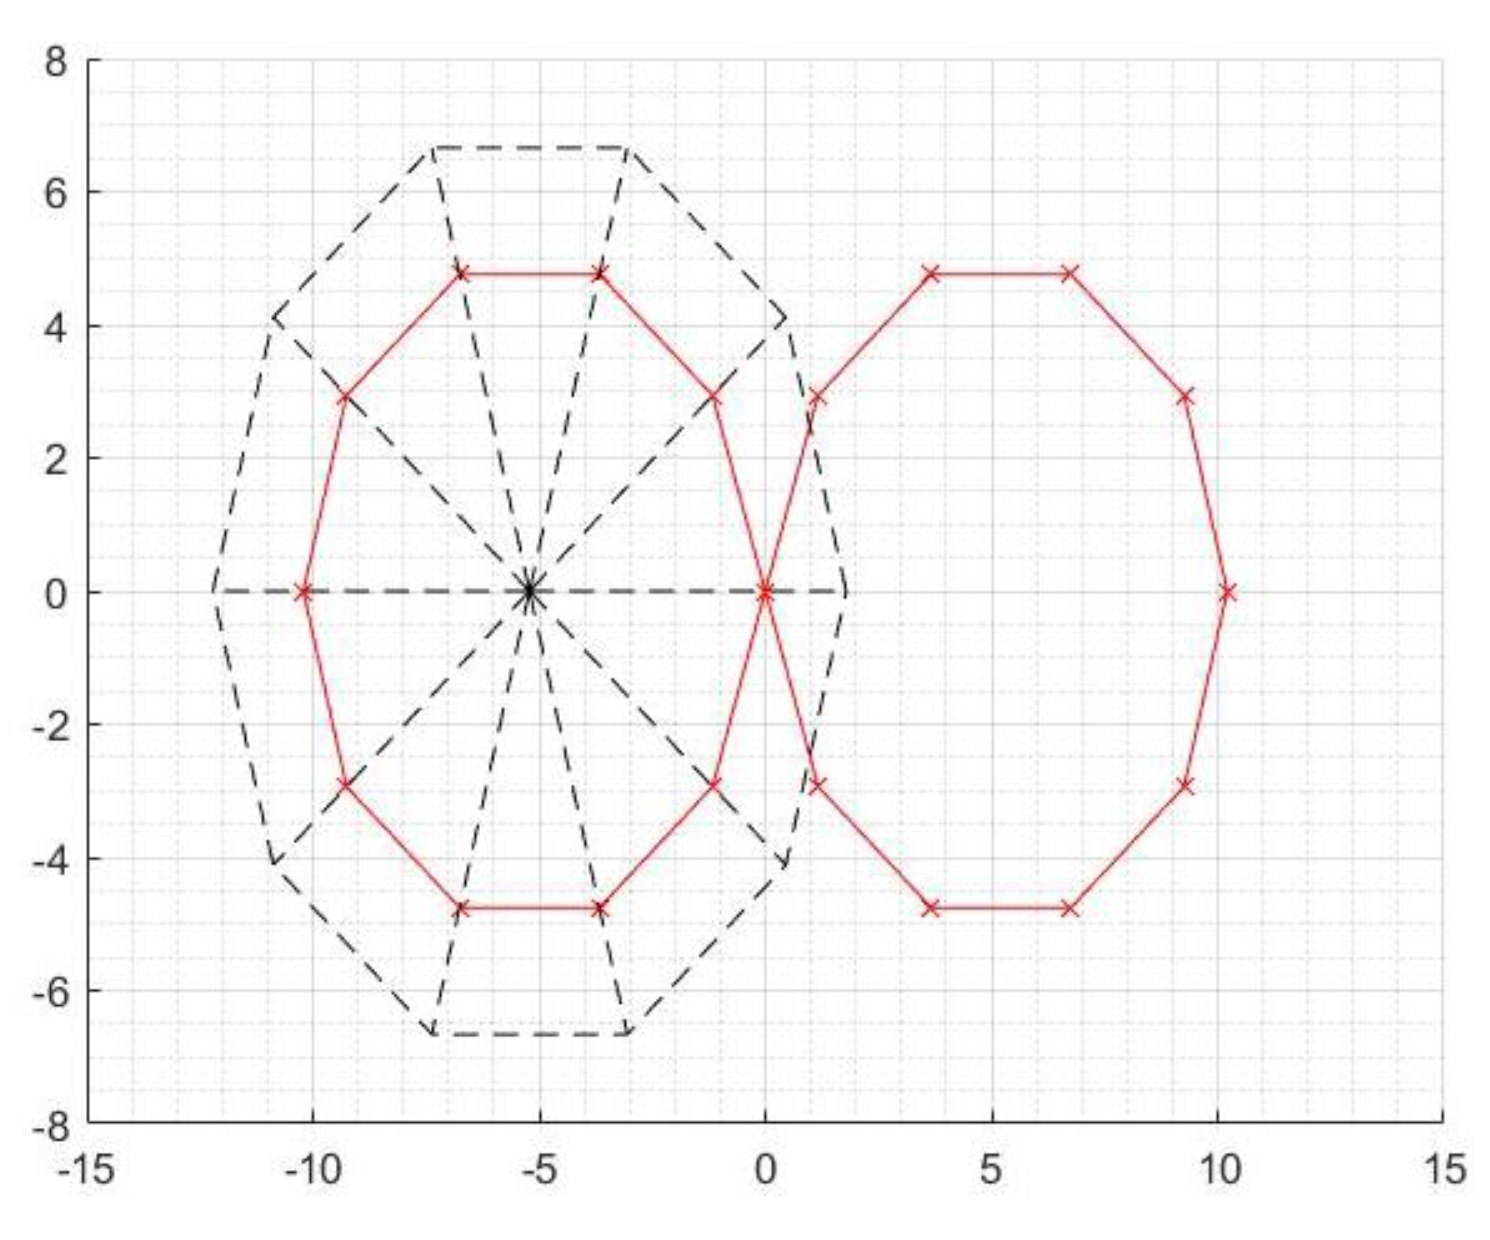
Figure 27.
Step 2: “left lobe” trajectory split.
Figure 27.
Step 2: “left lobe” trajectory split.
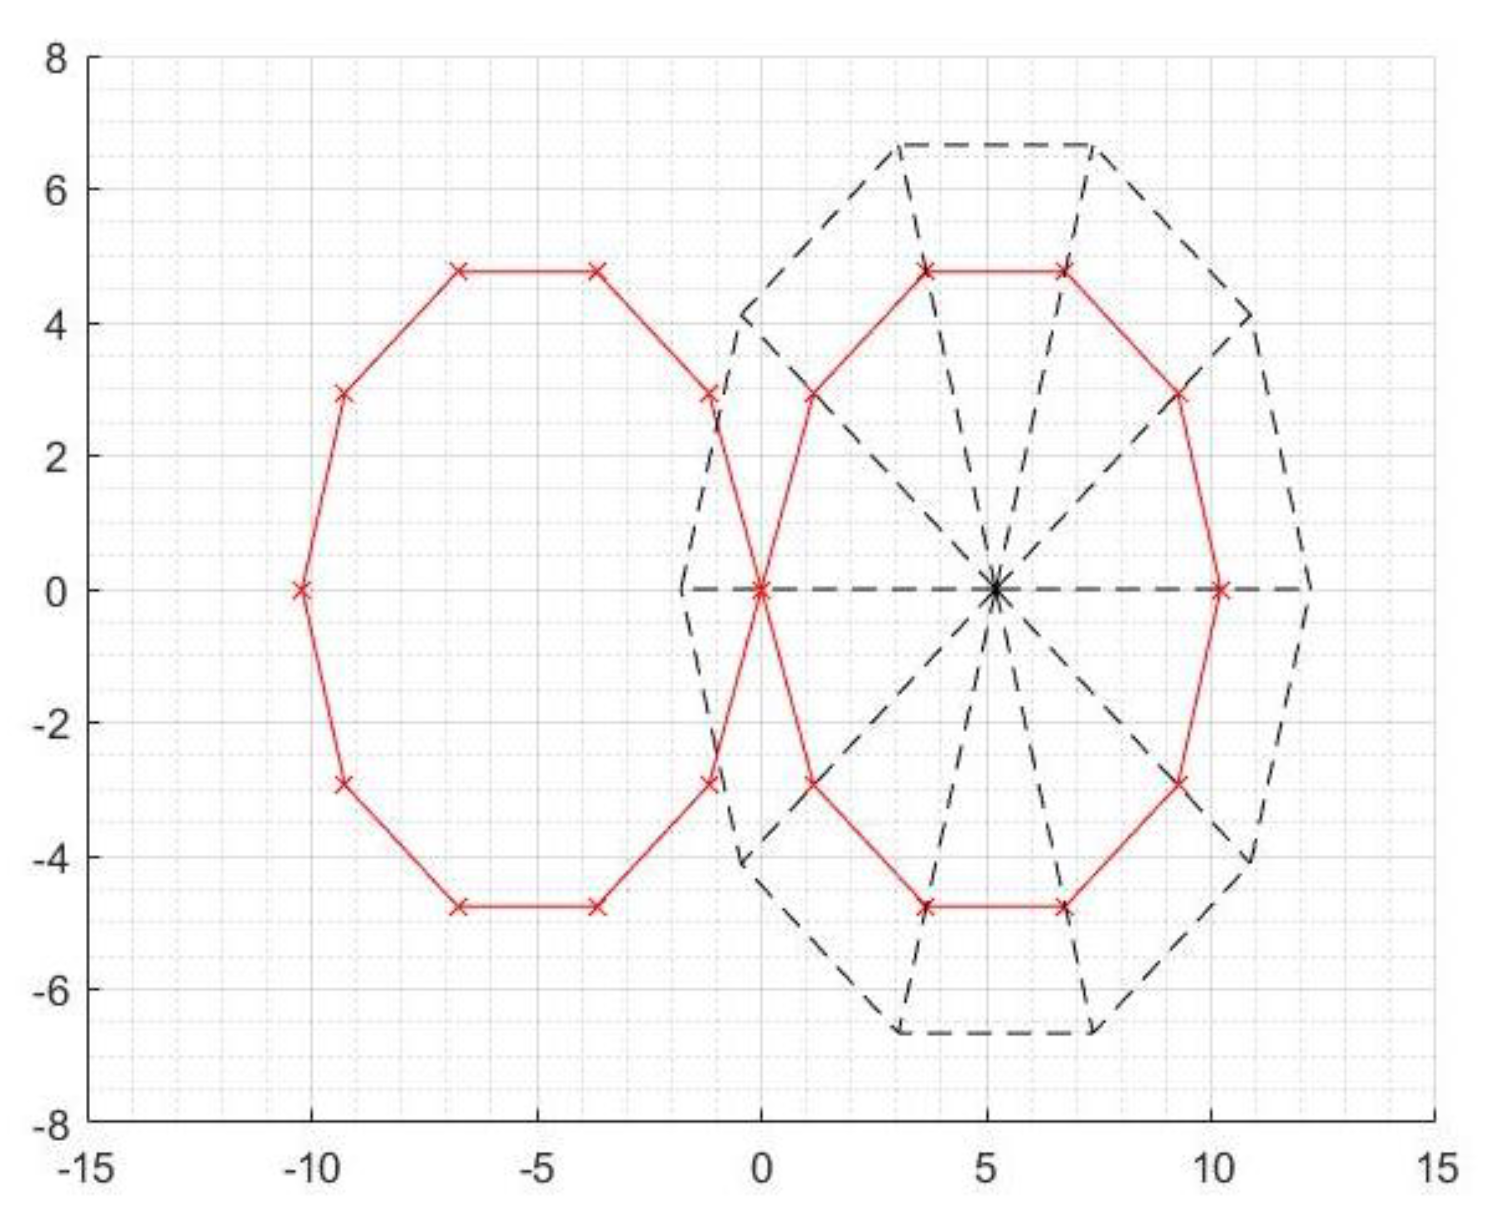
Figure 28.
Step 2: “right lobe” trajectory split.
Figure 28.
Step 2: “right lobe” trajectory split.
Figure 29.
A complete “sliced pie” split of the flight path of the UAS, into segments between waypoints.
Figure 29.
A complete “sliced pie” split of the flight path of the UAS, into segments between waypoints.
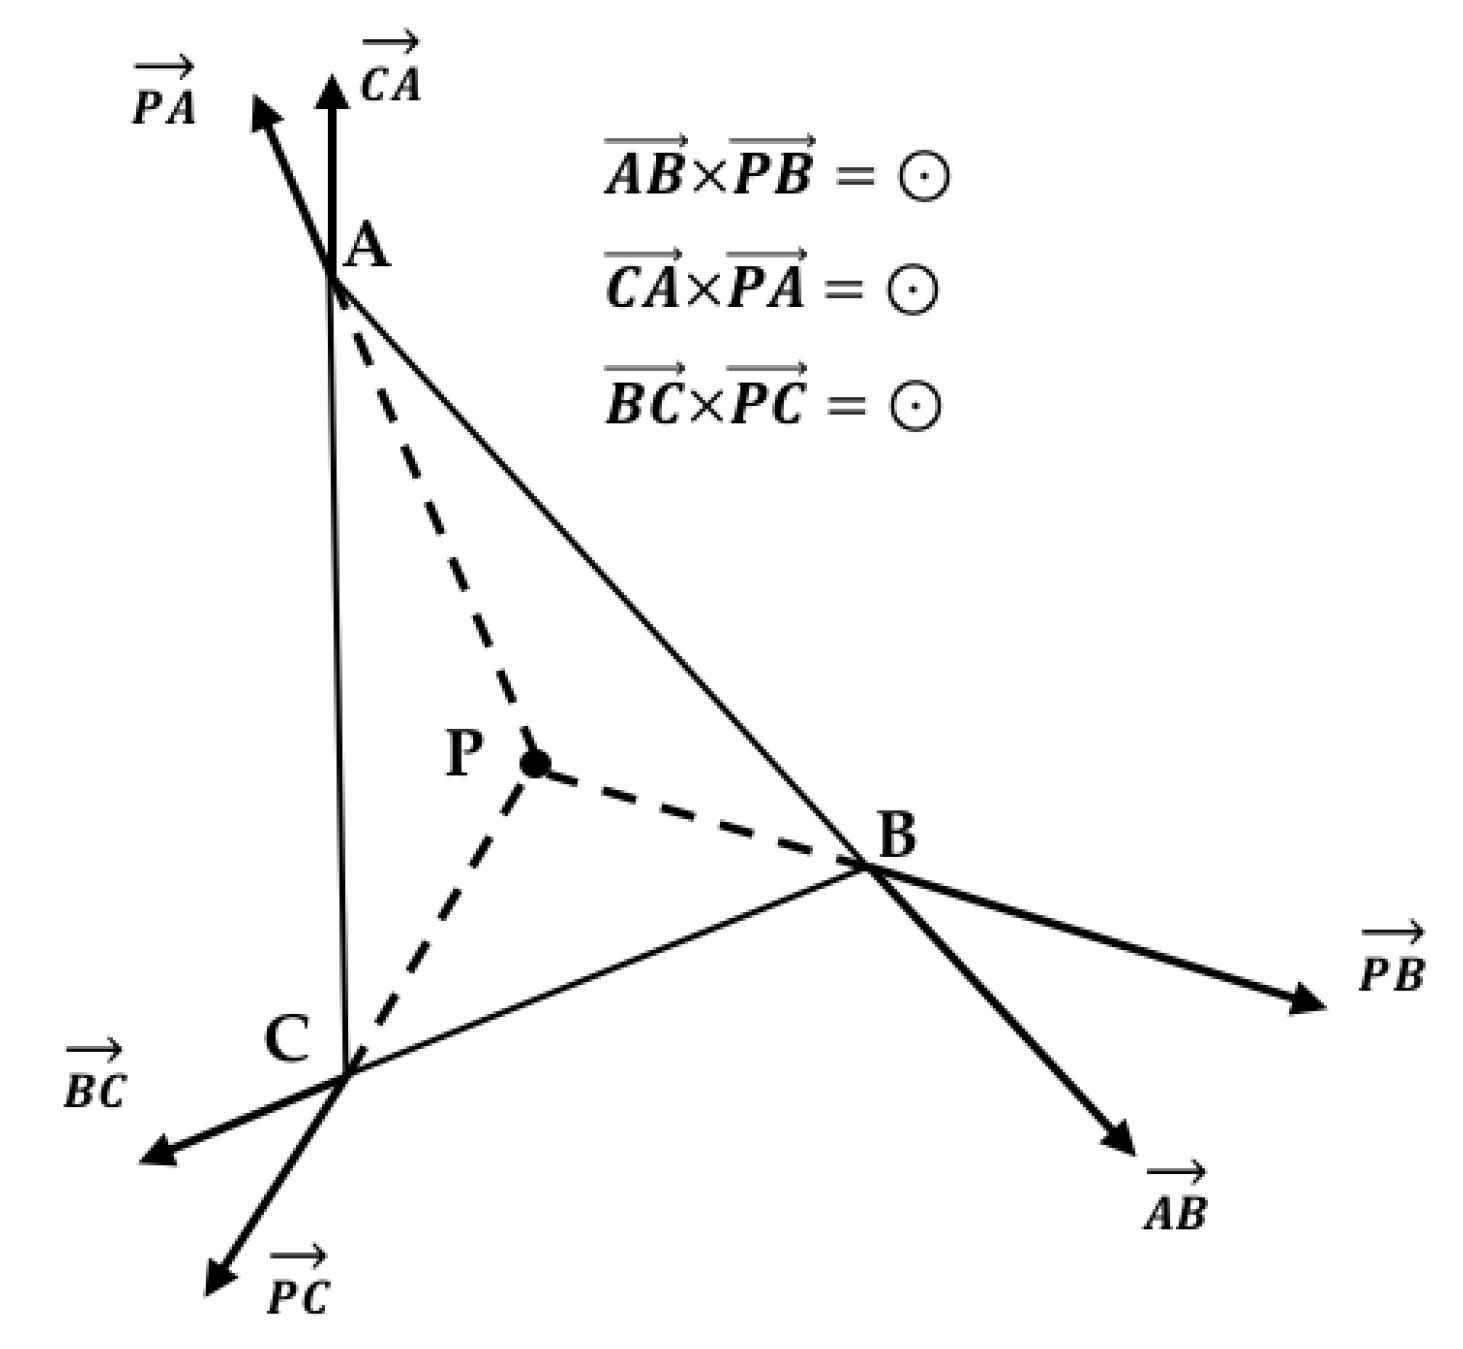
Figure 30.
Triangle ABC with point P within.
Figure 30.
Triangle ABC with point P within.
Figure 31.
Triangle ABC with point P outside.
Figure 31.
Triangle ABC with point P outside.
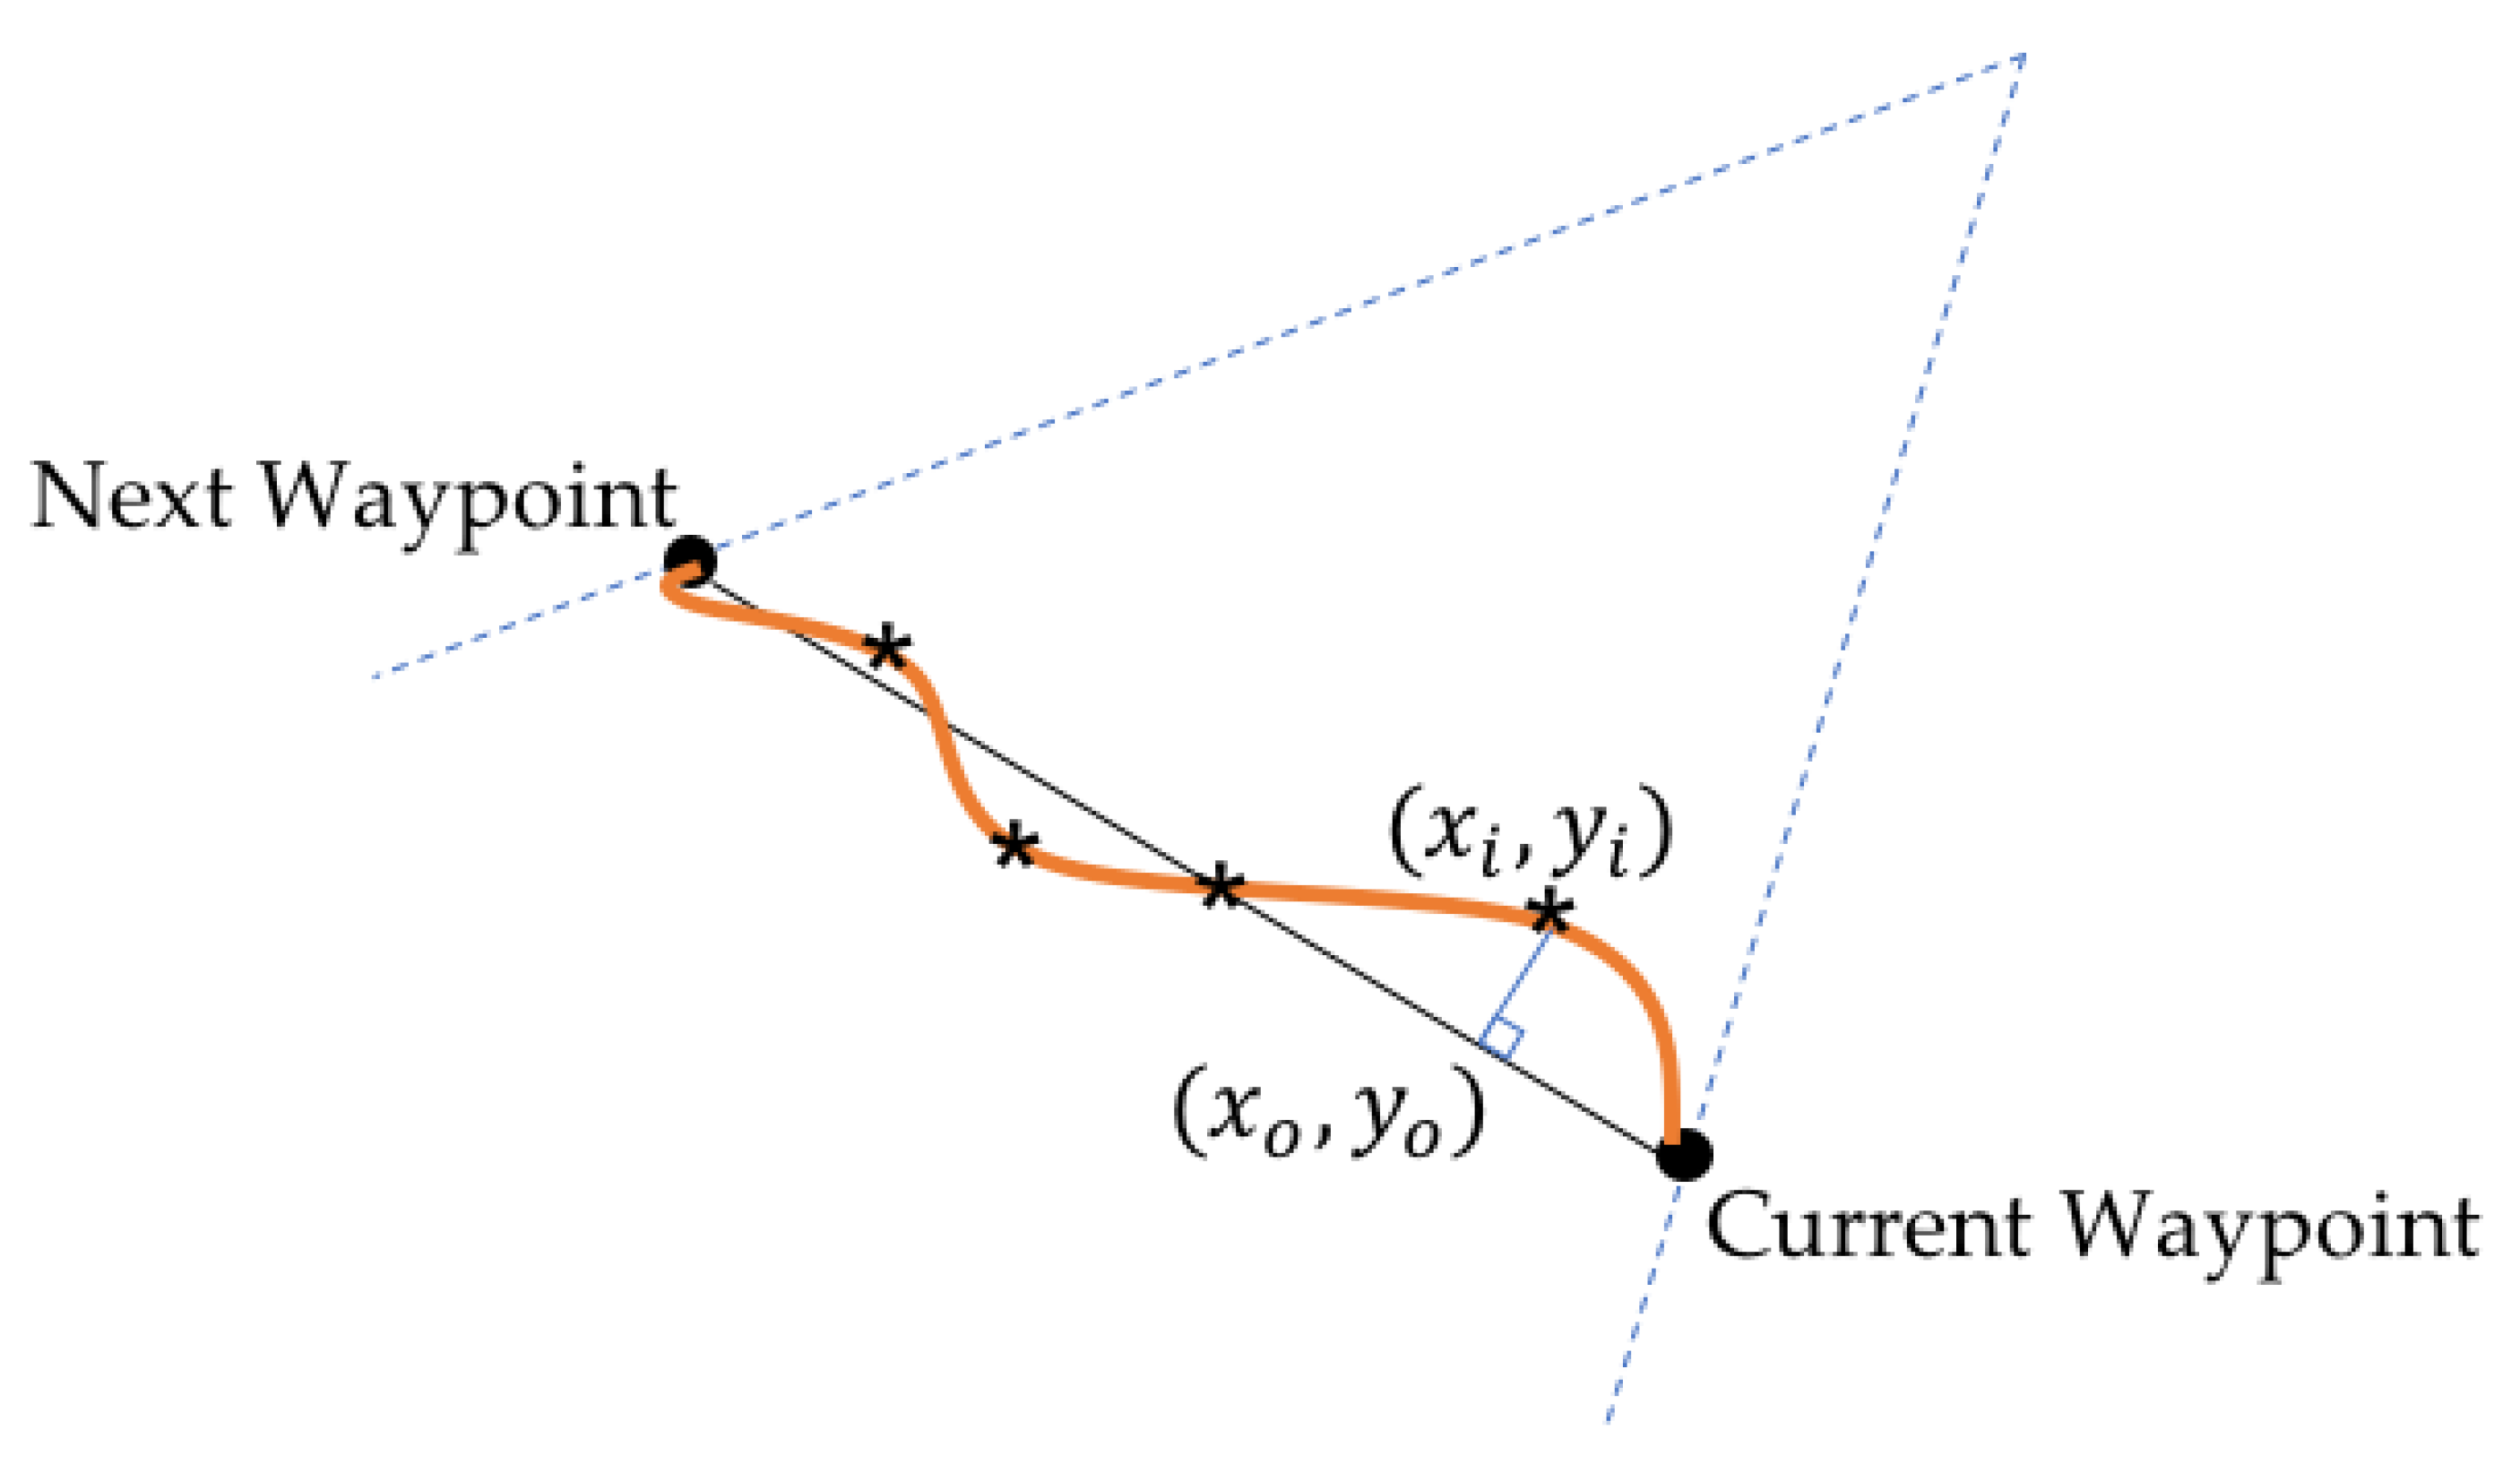
Figure 32.
Calculation of position error between waypoints.
Figure 32.
Calculation of position error between waypoints.
Table 1.
Specifications of the Pixhawk flight controller.
Table 1.
Specifications of the Pixhawk flight controller.
| Component | Description |
|---|
| CPU | 168 MHz Cortex-M4F |
| IMU | Invensense MPU6000; 3-axis gyroscope, 3-axis accelerometer, three 16-bit analog-to-digital converters (ADCs) for gyroscope and accelerometer outputs. User-programmable gyroscope full-scale range of ±250, ±500, ±1000, and ±2000°/s and accelerometer full-scale range of ±2 g, ±4 g, ±8 g, and ±16g. |
| Barometer | MEAS MS5611 |
| I/O | 14 PWM Servo outputs |
| Extra connectivity | UART, I2C, GPS |
| Flight log | Pluggable microSD card |
| Firmware Version | ArduPilot, 3.4.1 |
Table 2.
Specifications of brushless DC motor and ESC.
Table 2.
Specifications of brushless DC motor and ESC.
| Motor | ESC |
|---|
| Model | KDA 20–22 L | Model | Plush 18 A |
| Kv | 924 | Burst Current | 22 A |
| Operating Current | 6–14 A | Constant Current | 18 A |
| Max. Voltage | 11 v | BEC | 5 v/2 A; Linear, 2–4 cells |
| Size/Weight | 28 × 32 mm; 56 g | Size/Weight | 24 × 45 × 11 mm/19 g |
Table 3.
Specifications of the BEC driving the morphing servo.
Table 3.
Specifications of the BEC driving the morphing servo.
![Drones 03 00070 i001]() | i. Input Voltage: 5–25 volts |
| ii. Selectable Output: 4.8–9.0 volts |
| iii. Mode: Switching |
| iv. LiPo Cells: 2–6 |
| v. Size/Weight: 30 × 15 × 10 mm/11 g |
Table 4.
Physical, inertial, and geometric properties of the quadcopter used in simulation.
Table 4.
Physical, inertial, and geometric properties of the quadcopter used in simulation.
| Parameter | Value | Parameter | Value |
|---|
| | | , , |
| | | , , |
| | | , , |
| mass | 2.324 kg | | |
| arm length | 0.305 m | | |
| 0.0207 k | | 0.0137(); 0.0123() k |
| 0.0207 k | | 0.0276(); 0.0029 () k |
| 0.0138 k | | 0.0138(); 0.0138() k |
| | | | −0.0027(); −0.0043() k |
Table 5.
Step response of roll and pitch attitude in simulation.
Table 5.
Step response of roll and pitch attitude in simulation.
| | Roll Dynamics | Pitch Dynamics |
|---|
| | | | | | | | | |
|---|
| 5.8744 | 0.7310 | 0.5105 | 1.7783 | 5.5352 | 0.7984 | 0.5132 | 1.6368 |
| 14.8066 | 0.2667 | 0.7089 | 6.7685 | 8.7098 | 0.4630 | 0.5636 | 3.0997 |
| 15.3960 | 0.2563 | 0.7296 | 7.2485 | 11.6535 | 0.3410 | 0.57 | 4.2566 |
Table 6.
Flight test parameters.
Table 6.
Flight test parameters.
| Flight Conditions | Parameters |
|---|
| “Figure-8” flight path | Horizontal, inclined and double inclined plane |
| Morphing Angle | , , |
| Number of waypoints | 20, 30 (over the entire path) |
| Waypoints with morphed Geometry | No. 4–No. 7 (20), No. 5–No. 11 (30) |
| Velocity | , |
Table 7.
General setup for flight test evaluation of morphed geometry quadcopter configurations.
Table 7.
General setup for flight test evaluation of morphed geometry quadcopter configurations.
- i.
Take off manually - ii.
Fly to the center of “Figure-8” (Initial point) and hover (for 5s) before executing the mission; - iii.
Start to fly the “Figure-8” path with normal geometry; - iv.
Change geometry at the pre-determined waypoint (Morphing); - v.
Fly with morphed geometry (Morphed); - vi.
Recover normal geometry at pre-determined waypoint (Morphing back); - vii.
Fly back to the center of figure-eight, hover (for 5 s) and land.
|
Table 8.
Mean value and standard deviation of body axis angular rates during hover tests.
Table 8.
Mean value and standard deviation of body axis angular rates during hover tests.
| |
|---|
| | Roll | Pitch | Yaw | Roll | Pitch | Yaw |
|---|
| −0.10162 | 0.149712 | 0.082135 | 3.754336 | 2.70556 | 1.154787 |
| 0.052661 | 0.120368 | 0.066851 | 5.426002 (44.52%) | 4.567562 (68.82%) | 6.195452 (436.5%) |
| 0.071171 | 0.20745 | 0.079197 | 6.281651 (67.31%) | 5.24529 (93.87%) | 6.702127 (480.7%) |
Table 9.
Standard deviation of angular rates of different flights (flights in a horizontal plane).
Table 9.
Standard deviation of angular rates of different flights (flights in a horizontal plane).
| | v = 1.5 m/s; Waypoints = 20 | v = 2.5 m/s; Waypoints = 20 |
|---|
| | | | | | | |
|---|
| 5.7103 | 13.2743 | 23.5161 | 16.3689 | 17.0616 | 26.6821 |
| 10.4814(83.6%) | 15.597(17.5%) | 22.7085(−3.43%) | 23.3277(42.51%) | 19.3982(13.7%) | 25.7222(−3.6%) |
| 10.0744(76.4%) | 13.1465(−0.96%) | 24.2962(3.31%) | 17.7324(8.33%) | 18.4482(8.13%) | 27.2056(1.96%) |
Table 10.
Standard deviation of angular rates of different flights (flights in a single inclined plane).
Table 10.
Standard deviation of angular rates of different flights (flights in a single inclined plane).
| | v = 1.5 m/s; Waypoints = 20 | v = 2.5 m/s; Waypoints = 20 |
|---|
| | | | | | | |
|---|
| 6.5744 | 11.4717 | 23.529 | 14.8538 | 15.7843 | 27.2415 |
| 10.6581(62.11%) | 14.6114(27.36%) | 22.7722(−3.21%) | 21.3364(43.64%) | 17.2458(9.25%) | 26.7324(−1.86%) |
| 9.9941(52%) | 11.7458(2.39%) | 24.3338(3.42%) | 17.6113(18.56%) | 16.8861(7%) | 26.9048(−1.23%) |
Table 11.
Standard deviation of axis angular rates of different flights (flights in a double inclined plane).
Table 11.
Standard deviation of axis angular rates of different flights (flights in a double inclined plane).
| | v = 1.5 m/s; Waypoints = 20 | v = 2.5 m/s; Waypoints = 20 |
|---|
| | | | | | | |
|---|
| 6.4357 | 13.2678 | 23.4045 | 16.8838 | 16.9342 | 27.0096 |
| 11.0187(71.21%) | 14.4729(9%) | 21.3538(−8.76%) | 22.7902(35%) | 16.0106(−5.45%) | 28.1622(4.26%) |
| 10.3847(61.36%) | 11.8751(−10.5%) | 24.7663(5.81%) | 19.7108(16.74%) | 17.4828(3.23%) | 28.4287(5.25%) |
Table 12.
Standard deviation of angular rates of different flights (flights in a horizontal plane).
Table 12.
Standard deviation of angular rates of different flights (flights in a horizontal plane).
| | v = 1.5 m/s; Waypoints = 30 | v = 2.5 m/s; Waypoints = 30 |
|---|
| | | | | | | |
|---|
| 7.6676 | 14.2476 | 21.0887 | 14.5061 | 18.2174 | 23.121 |
| 12.3884(61.56%) | 16.255(14%) | 20.2024(−4.2%) | 17.7009(22%) | 20.703(13.64%) | 24.4376(5.69%) |
| 10.1845(32.82%) | 13.6735(−4%) | 20.8213(−1.27%) | 17.7756(22.54%) | 19.7693(8.52%) | 24.1675(4.52%) |
Table 13.
Standard deviation of angular rates of different flights (flights in a single inclined plane).
Table 13.
Standard deviation of angular rates of different flights (flights in a single inclined plane).
| | v = 1.5 m/s; Waypoints = 30 | v = 2.5 m/s; Waypoints = 30 |
|---|
| | | | | | | |
|---|
| 7.6265 | 13.9759 | 20.6477 | 13.7688 | 18.331 | 22.5695 |
| 10.6458(39.6%) | 16.2405(16.2%) | 20.9114(1.28%) | 17.0046(23.5%) | 19.3913(5.8%) | 23.4673(4%) |
| 12.698(66.5%) | 15.9637(14.22%) | 21.7133(5.16%) | 18.1519(31.8%) | 19.7393(7.68%) | 23.782(5.37%) |
Table 14.
Standard deviation of angular rates of different flights (flights in a double inclined plane).
Table 14.
Standard deviation of angular rates of different flights (flights in a double inclined plane).
| | v = 1.5 m/s; Waypoints = 30 | v = 2.5 m/s; Waypoints = 30 |
|---|
| | | | | | | |
|---|
| 7.2602 | 13.5614 | 20.4416 | 14.3061 | 17.6015 | 22.2279 |
| 10.2385(41%) | 15.5668(15.19%) | 21.3065(4.38%) | 16.1706(13%) | 19.8128(12.56%) | 23.3341(5%) |
| 11.5224(58.7%) | 14.8339(9.76%) | 21.3371(4.53%) | 17.1404(19.81%) | 19.3309(9.82%) | 23.4543(5.5%) |
Table 15.
Broad description of the “sliced pie” method to identify flight segments.
Table 15.
Broad description of the “sliced pie” method to identify flight segments.
- i.
Approximate the “Figure-8” flight path using two circles, tangential to each other (or intersecting at one point) at the center of the “Figure-8”; - ii.
Draw two larger circles, each centered at one lobe to encompass the flight path - iii.
Draw radial lines from the center of each lobe through corresponding waypoints in each lobe; this “slices” the flight path (pizza cutting style). Thus, the two circles can be divided into several triangular segments. - iv.
Identify the “slice” that a current GPS location belongs to, using the triangle method (described below). By using this method, the whole flight path can be divided into several segments resembling a “sliced pie”.
|
Table 16.
Performance of the UAS in tracking the desired trajectory—normal and morphed geometries.
Table 16.
Performance of the UAS in tracking the desired trajectory—normal and morphed geometries.
| Position Accuracy (m) |
|---|
| Velocity | # of Waypoints | Figure-8 Path | Angle of Morphing |
|---|
| | |
|---|
| 1.5 m/s | 20 | Horizontal | 0.147747 | 0.164417 (11.28%) | 0.191469 (29.59%) |
| Inclined Plane | 0.158586 | 0.179997 (13.50%) | 0.173187 (9.21%) |
| Double Inclined Plane | 0.174257 | 0.159785 (−8.31%) | 0.181728 (4.29%) |
| 30 | Horizontal | 0.159395 | 0.162365 (1.86%) | 0.196734 (23.43%) |
| Inclined Plane | 0.170629 | 0.165754 (−2.86%) | 0.192818 (13.00%) |
| Double Inclined Plane | 0.156425 | 0.17115 (9.41%) | 0.188438 (20.47%) |
| 2.5 m/s | 20 | Horizontal | 0.326446 | 0.296922 (−9.04%) | 0.320985 (−1.67%) |
| Inclined Plane | 0.285876 | 0.299318 (4.70%) | 0.328326 (14.85%) |
| Double Inclined Plane | 0.299329 | 0.279802 (−6.52%) | 0.313557 (4.75%) |
| 30 | Horizontal | 0.300823 | 0.318122 (5.75%) | 0.279573 (−7.06%) |
| Inclined Plane | 0.301102 | 0.307059 (1.98%) | 0.298945 (−0.72%) |
| Double Inclined Plane | 0.284698 | 0.281298 (−1.19%) | 0.267317 (−6.11%) |


