Technical Note

Giant Big Stik R/C UAV Computer Model Development in JSBSim for Sense and Avoid Applications

1
Faculty of Engineering and Applied Science, Memorial University of Newfoundland, St. John’s, NL A1B 3X7, Canada
2
School of Computing, Engineering and Physical Sciences, University of West Scotland, Paisley PA1 2BE, Scotland, UK
*
Author to whom correspondence should be addressed.
Drones 2019, 3(2), 48; https://doi.org/10.3390/drones3020048
Submission received: 18 April 2019 / Revised: 7 June 2019 / Accepted: 16 June 2019 / Published: 18 June 2019

Abstract

:
Open-source aerospace simulation packages often lack unmanned aerial vehicles (UAVs) models, limiting the study of their interaction with other elements in the airspace. These events, which are a consequence of encounters between manned and unmanned aircraft, have recently attracted interest due to the uncertainties created by UAVs in real environments. In this paper, a fit-for-purpose flight dynamics model specific for sense and avoid (SAA) strategies in near mid-air collision scenarios is developed based on existing model development practices and adjusted from flight data. The Giant Big Stik is recognized as the representative aircraft for testing SAA manoeuvres due to its capabilities. The simulation platform is based on the JSBSim open-source flight dynamics model, and the SAA application is carried out following the current regulations and flight recommendations for UAVs in Canada. Through this methodology, the error between the real and the computer model is reduced in every step that is minimal for the SAA application. The relevance of this paper is also shown in future applications, where this model will be incorporated into more complex simulations with manned aircraft for the study of avoidance manoeuvres that will serve the safe integration of UAVs into the airspace.

1. Introduction

Computational modelling plays an important role in the aerospace industry regarding the development of aircraft and their environment. Modelling and simulation (M&S) methods are used to replicate aircraft performance, which has a wide range of applications. Pilot training simulators are an example of the use of M&S to reduce real flight time and costs. Focusing on aircraft modelling, the flight dynamics model (FDM) is the combination of physical and mathematical equations that expresses the dynamics of flight. Designing an accurate FDM is essential in order to reduce the human interaction with the real system, making the flying hours minimal. Testing aircraft computer models based on their FDM is especially useful prior to the procurement of the aircraft or when the flight tests pose a particular hazard; knowing the mathematical expressions and the coefficients that govern the aircraft, its performance can be estimated from a set of simulations prior to flight tests.
Uncertain scenarios between manned aircraft and unmanned aerial vehicles (UAVs) have become more frequent in the airspace and, as a consequence, international administrations have developed more restrictive regulations/recommendations for the use of UAVs [1]. Sense and avoid (SAA) is currently one of the main challenges that UAVs are facing regarding their integration in the airspace; UAVs have been proven to have the same level of safety as manned aircraft.

1.1. The SAA Issue and Collision Avoidance Basis: Simulation Requirements

SAA is the capability of the aircraft to detect conflicting traffic and take appropriate action. The term sense describes the ability of the system to identify the hazard, whereas the second term, avoid, refers to the manoeuvre required to avoid a collision that has been detected in the first stage. Both elements have equal importance and offer a challenge in order to integrate the UAVs into the shared airspace [2].
The minimum requirement for that detection and the SAA task is that there is enough time for the aircraft to perform a manoeuvre and remain safe. The functional boundaries and thresholds [3] define the risk of an airborne collision. The two major components of the SAA task are (1) self-separation and (2) collision avoidance (CA). According to the current recommendations in Canada [4], the collision volume is defined by a cylindrical volume with a horizontal radius of 500 ft and height of 200 ft. The manoeuvre time (τ) is the time required by the aircraft to complete the task of avoiding the collision volume. For a co-altitude encounter between a manned and an unmanned aircraft, an approach could be a vertical manoeuvre taking the unmanned aircraft 100 ft downward at the minimum time possible.

1.2. Problem Statement and Motivation

The problem is to estimate an avoidance performance envelope in terms of manoeuvre time (τ), prior to conducting actual flight tests. The current regulations limit near mid-air collision (NMAC) flight tests in real environments, especially in non-segregated airspaces where there is manned and unmanned aircraft traffic. A simulation-based estimation is a necessary first step in formulating minimum operational performance standards for SAA.
Empirical models based on system identification of flight test data include additional sensor and actuator dynamics not typically modelled within the FDM. There are also data biases from unforeseen installation choices, such as the location of the pitot tube and the free play and the hysteresis of the mechanical linkages between the servos and the control surfaces. FDM allows the designers to separate and identify the aircraft physics from the artefacts introduced by the flight procedure during real tests.

1.3. Summary and Outline

In this paper, the computational model development of a representative UAV for a particular case of SAA is discussed. Modelling is an active task that uses verification and validation (V&V) methods [5] to fine-tune the FDM in order to represent the real model behaviour, which is especially critical in SAA. The presented piece of work focuses on the modelling and development stage of the computer system fit for the purpose of the SAA task. This paper starts by introducing general model development concepts followed by the simulation context with a brief description of the simulation platform (JSBSim and FlightGear). The core and highlight of the paper is the short procedure for a correct validation that is later presented along with the development of the Giant Big Stik UAV computer model. Finally, the paper ends with the SAA application. The relevance of this work is also addressed in future work, where this model will be part of simulations that evaluate the interaction between manned and unmanned aircraft.

2. Model Development Practices

By definition, a model is a representation of a system for a particular purpose and application, meaning that the model is not required to be an exact representation as long as its limitations are clearly defined.
Computational modelling plays an important role in the aerospace industry regarding the development of the aircraft and its environment. M&S methods are used to replicate aircraft performance with a wide range of applications. The aircraft is considered a system composed of subsystems that need to be modelled such as the aerodynamics, atmosphere and control systems.
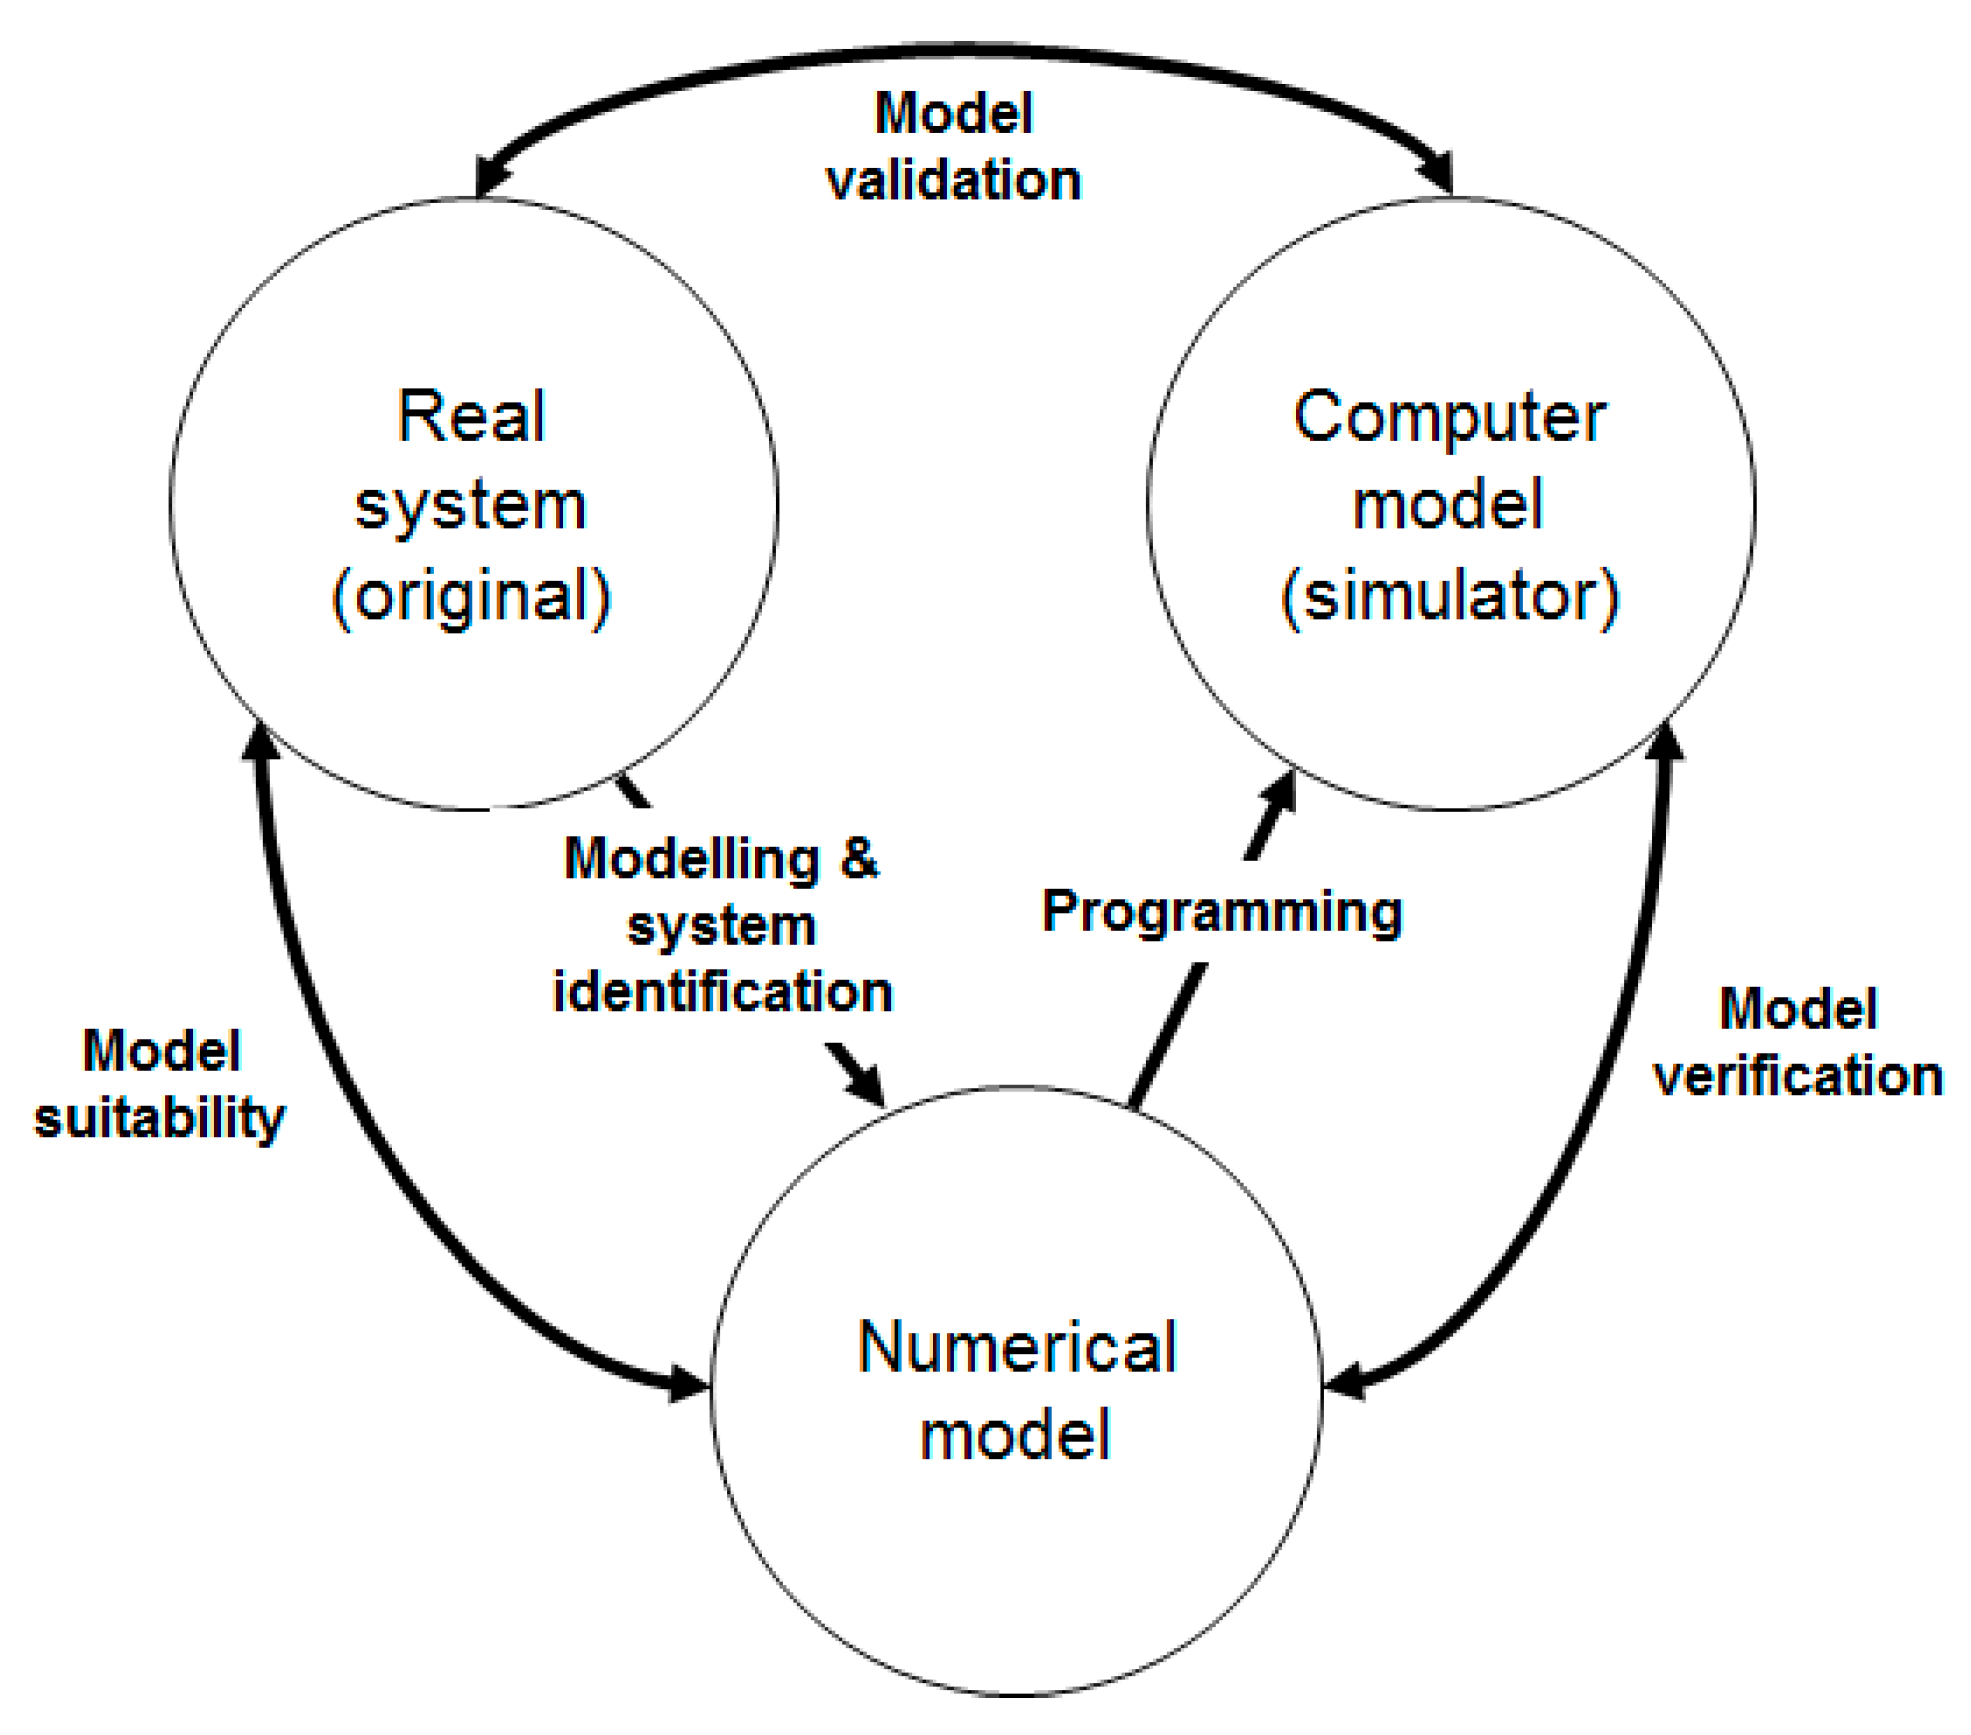
In software development, the system lifecycle is generally expressed by the classic V-diagram [6]. Similarly, V&V procedures are critical aspects of model development. As defined in [7], the verification concept certifies the correctness of the internal structure of the model, while the validation confirms the behaviour of the system according to the requirements. Figure 1 [8] expresses the basic structure of the modelling of a dynamic system. For this paper, the focus is on the programming and model validation tasks, assuming the correctness of the internal verification and the relationship between the real system and the numerical model.
In aerospace, the methods for computer model validation in general aircraft are assorted [9] and usually dependent on the company/country regulations:
  • Military services criteria: most military entities have their own requirements that are either agreed to with other entities or followed according to the regulatory agencies’ standards; the requirements are specific to the final purpose of the project.
  • Regulatory agencies simulation qualification: Agencies such as the Federal Aviation Administration (FAA), Transport Canada, International Civil Aviation Organization (ICAO), and Civil Aviation Authority (CAA) include special standards for the development of aircraft simulators. They mostly cover flight simulators and their requirements are very specific. For example, simulators for aircraft under the jurisdiction of the FAA are validated by the correspondent FAA Advisory Circular under the National Simulator Program (NSP) [10]. In Canada, similar qualifications are included in the Aeroplane and Rotorcraft Simulator Manual (TP9685E) [11] under the National Simulator Evaluator Program [12].
  • Experimental flight testing: this method collects data from experimental flights to analyze the limitations and accuracy of the computer models.
  • Pilot validation: the pilot’s operating handbook (POH) regularly contains general data and recommended practices useful for the validation of the model by a pilot.
  • Operational flight procedures: similar to the Cooper–Harper handling qualities for aircraft flight [13], a computer model can be evaluated by following the same scale for its intended purpose.
  • Observation/inspection of aircraft model performance: This includes traditional software testing: inspection, results verification by exercising the real model, and observation of the model’s behaviour. These techniques are used to observe and determine the viability of a model in a more accessible way when the model design is highly limited.
In a general modelling simulation, traditional methods for validating include [14] the following:
  • Consulting with experts on the real model performance;
  • Conducting sensitivity analysis to determine important factors;
  • Using statistical procedures to evaluate the similarities between the real model and the simulation output.
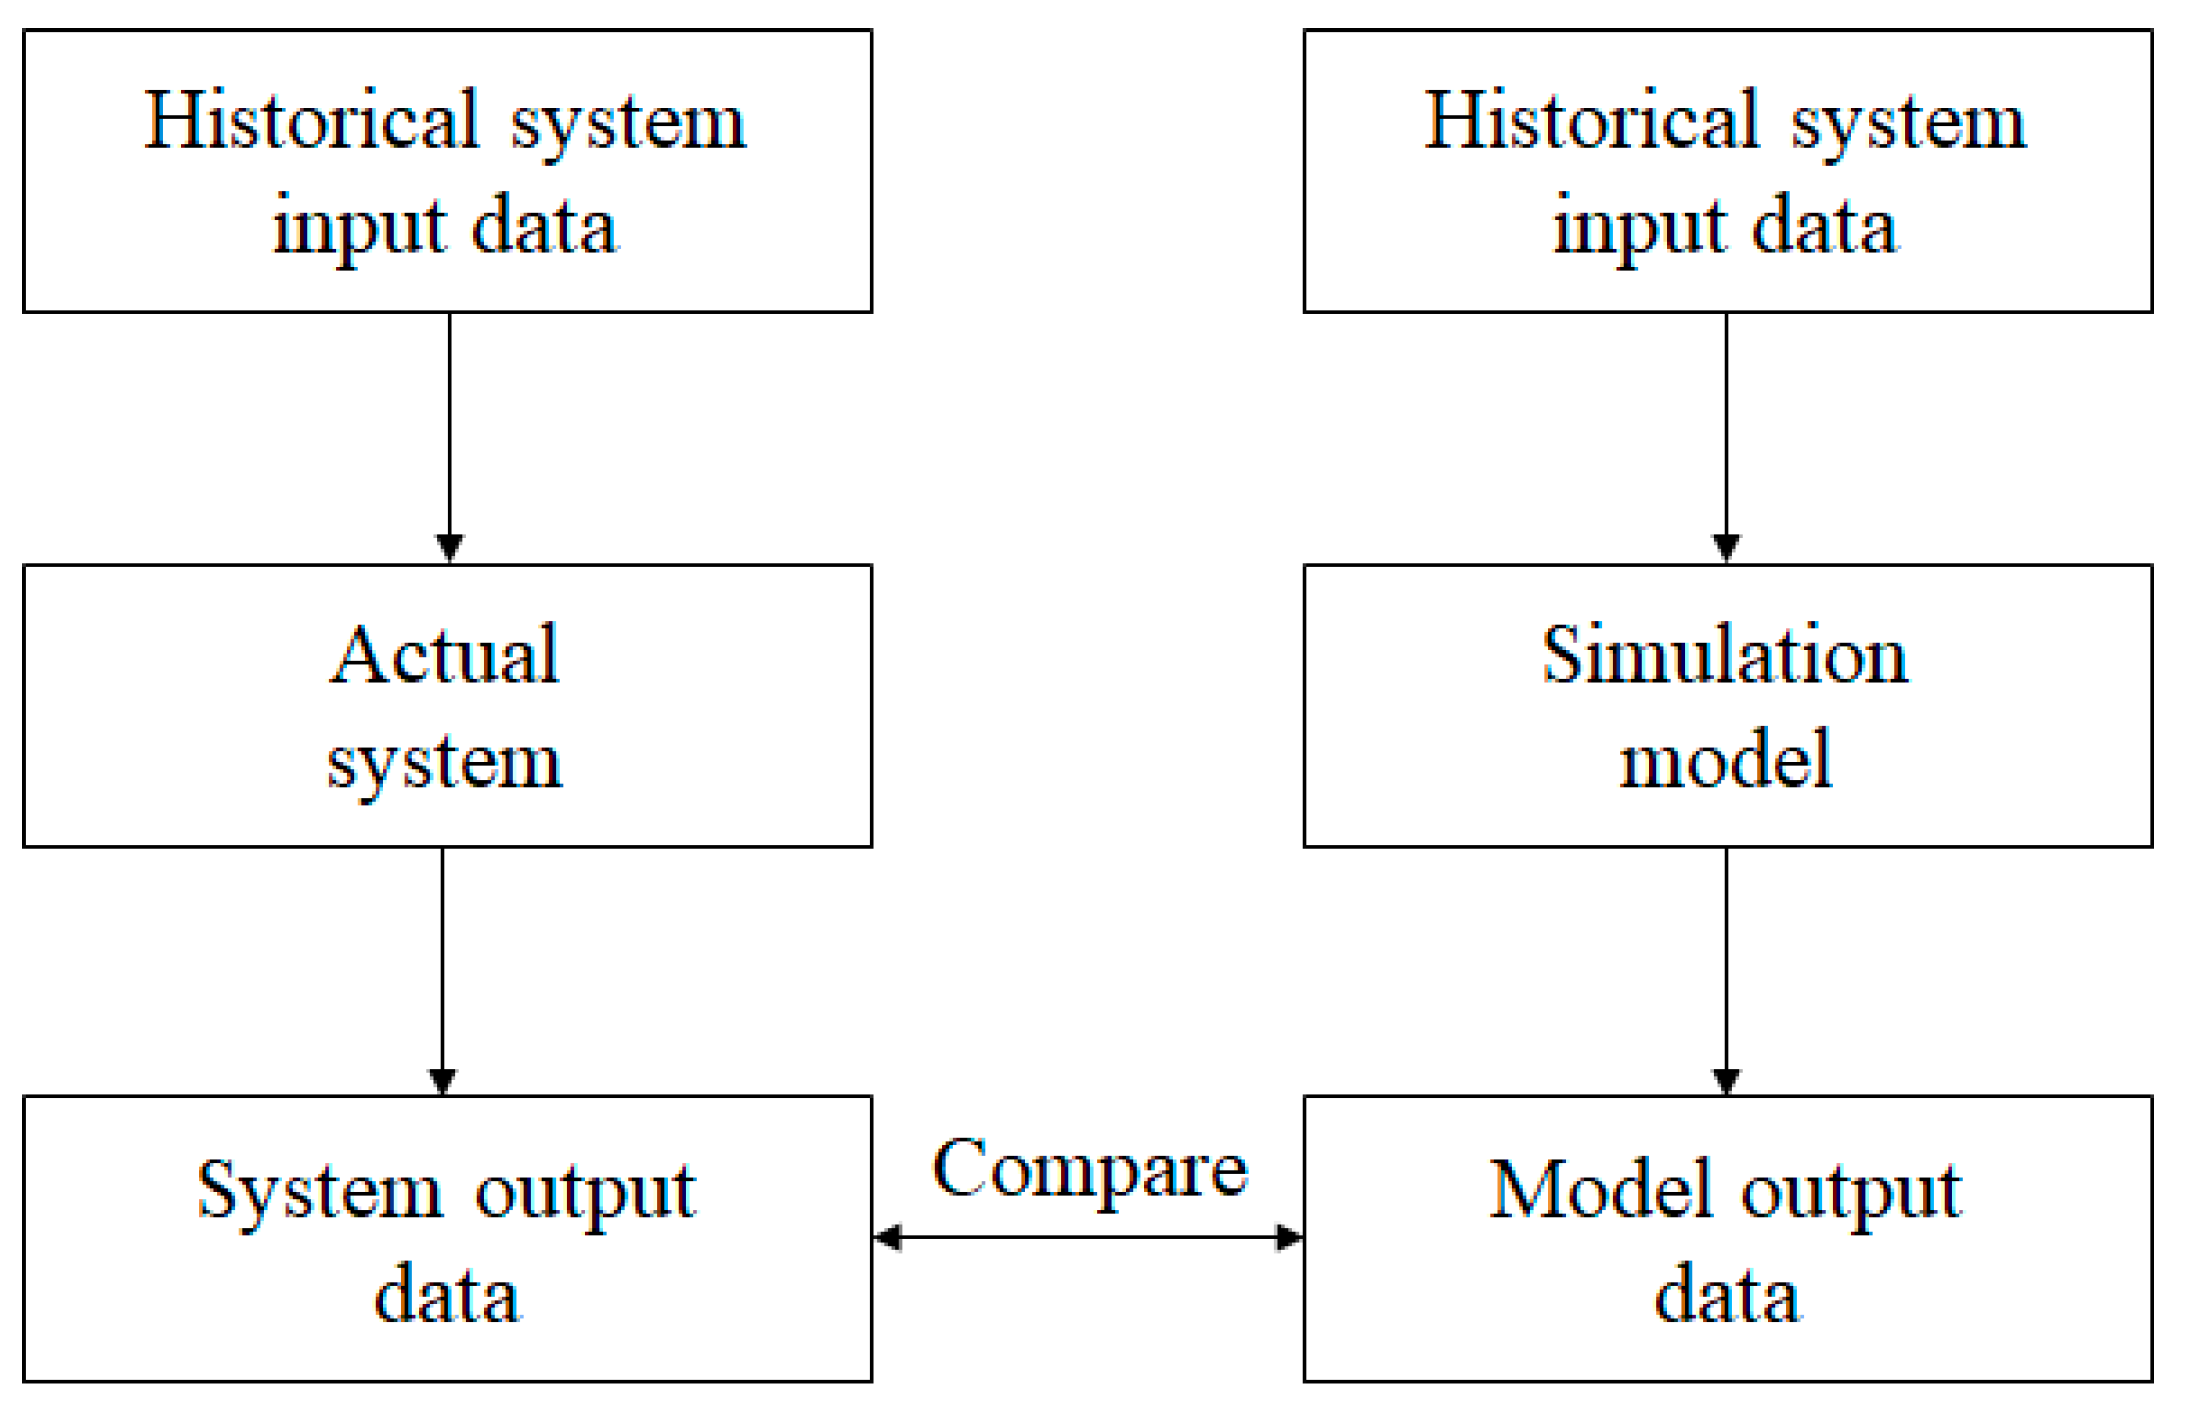
These techniques, the latter in particular, present a resourceful tool, since both models (real and simulated) receive exactly the same observations from input variables. This procedure is called the correlated inspection approach (Figure 2), and it has been frequently used in V&V since it provides comparable output data to evaluate whether the simulation model correlates to the real model and follows the assumptions.
In most simulation model scenarios in this paper, there is not high interest in expressing all the real characteristics of the model. The historical data must represent the simulation context and define the level of model detail in the simulation. A successful model validation must also include detailed documentation, including the model requirements and limitations. Additionally, the problem formulation is essential in the first stage of the validation procedure whereas the model credibility discussion is essential in the closing section.

3. Simulation Context

Although there are several interesting open-source simulation platforms in robotics and aviation such as ROS, V-REP, and MATLAB/Simulink, the JSBSim FDM has been used in this study due to its flexibility regarding the design of new aircraft and the dual mode of running the model.

3.1. JSBSim Open-Source Flight Dynamics Model

JSBSim is a 6-DoF FDM that has been used in aeronautics for over 20 years [15]. It is an open-source platform with versatile aircraft models and a large online library that includes scenery and airports. The highlight of this FDM is that the scripting mode runs under most of the operating systems, making it easily reproducible. JSBSim has been used in projects with UAVs [16,17], but it was initially designed for general aircraft and, as a consequence, its reliability has been questioned. However, the Bernoulli’s equation is universal, and the basic principles are the same for large and small aircraft. Although the turbulent flight is more noticeable in smaller aircraft, the main differences are controllable by the way the aircraft is operated and it is, therefore, independent from the dynamics of the aircraft.
The software can be downloaded from its website [18] and runs with FlightGear [19] to provide a visual performance. The latter is an open-source flight simulator that is in constant development (its last version, FlightGear 2018.3.2, was released on 29 January 2019). It is usually run along with JSBSim, as their roles are complementary; JSBSim provides the dynamics of the system and FlightGear the visual performance.
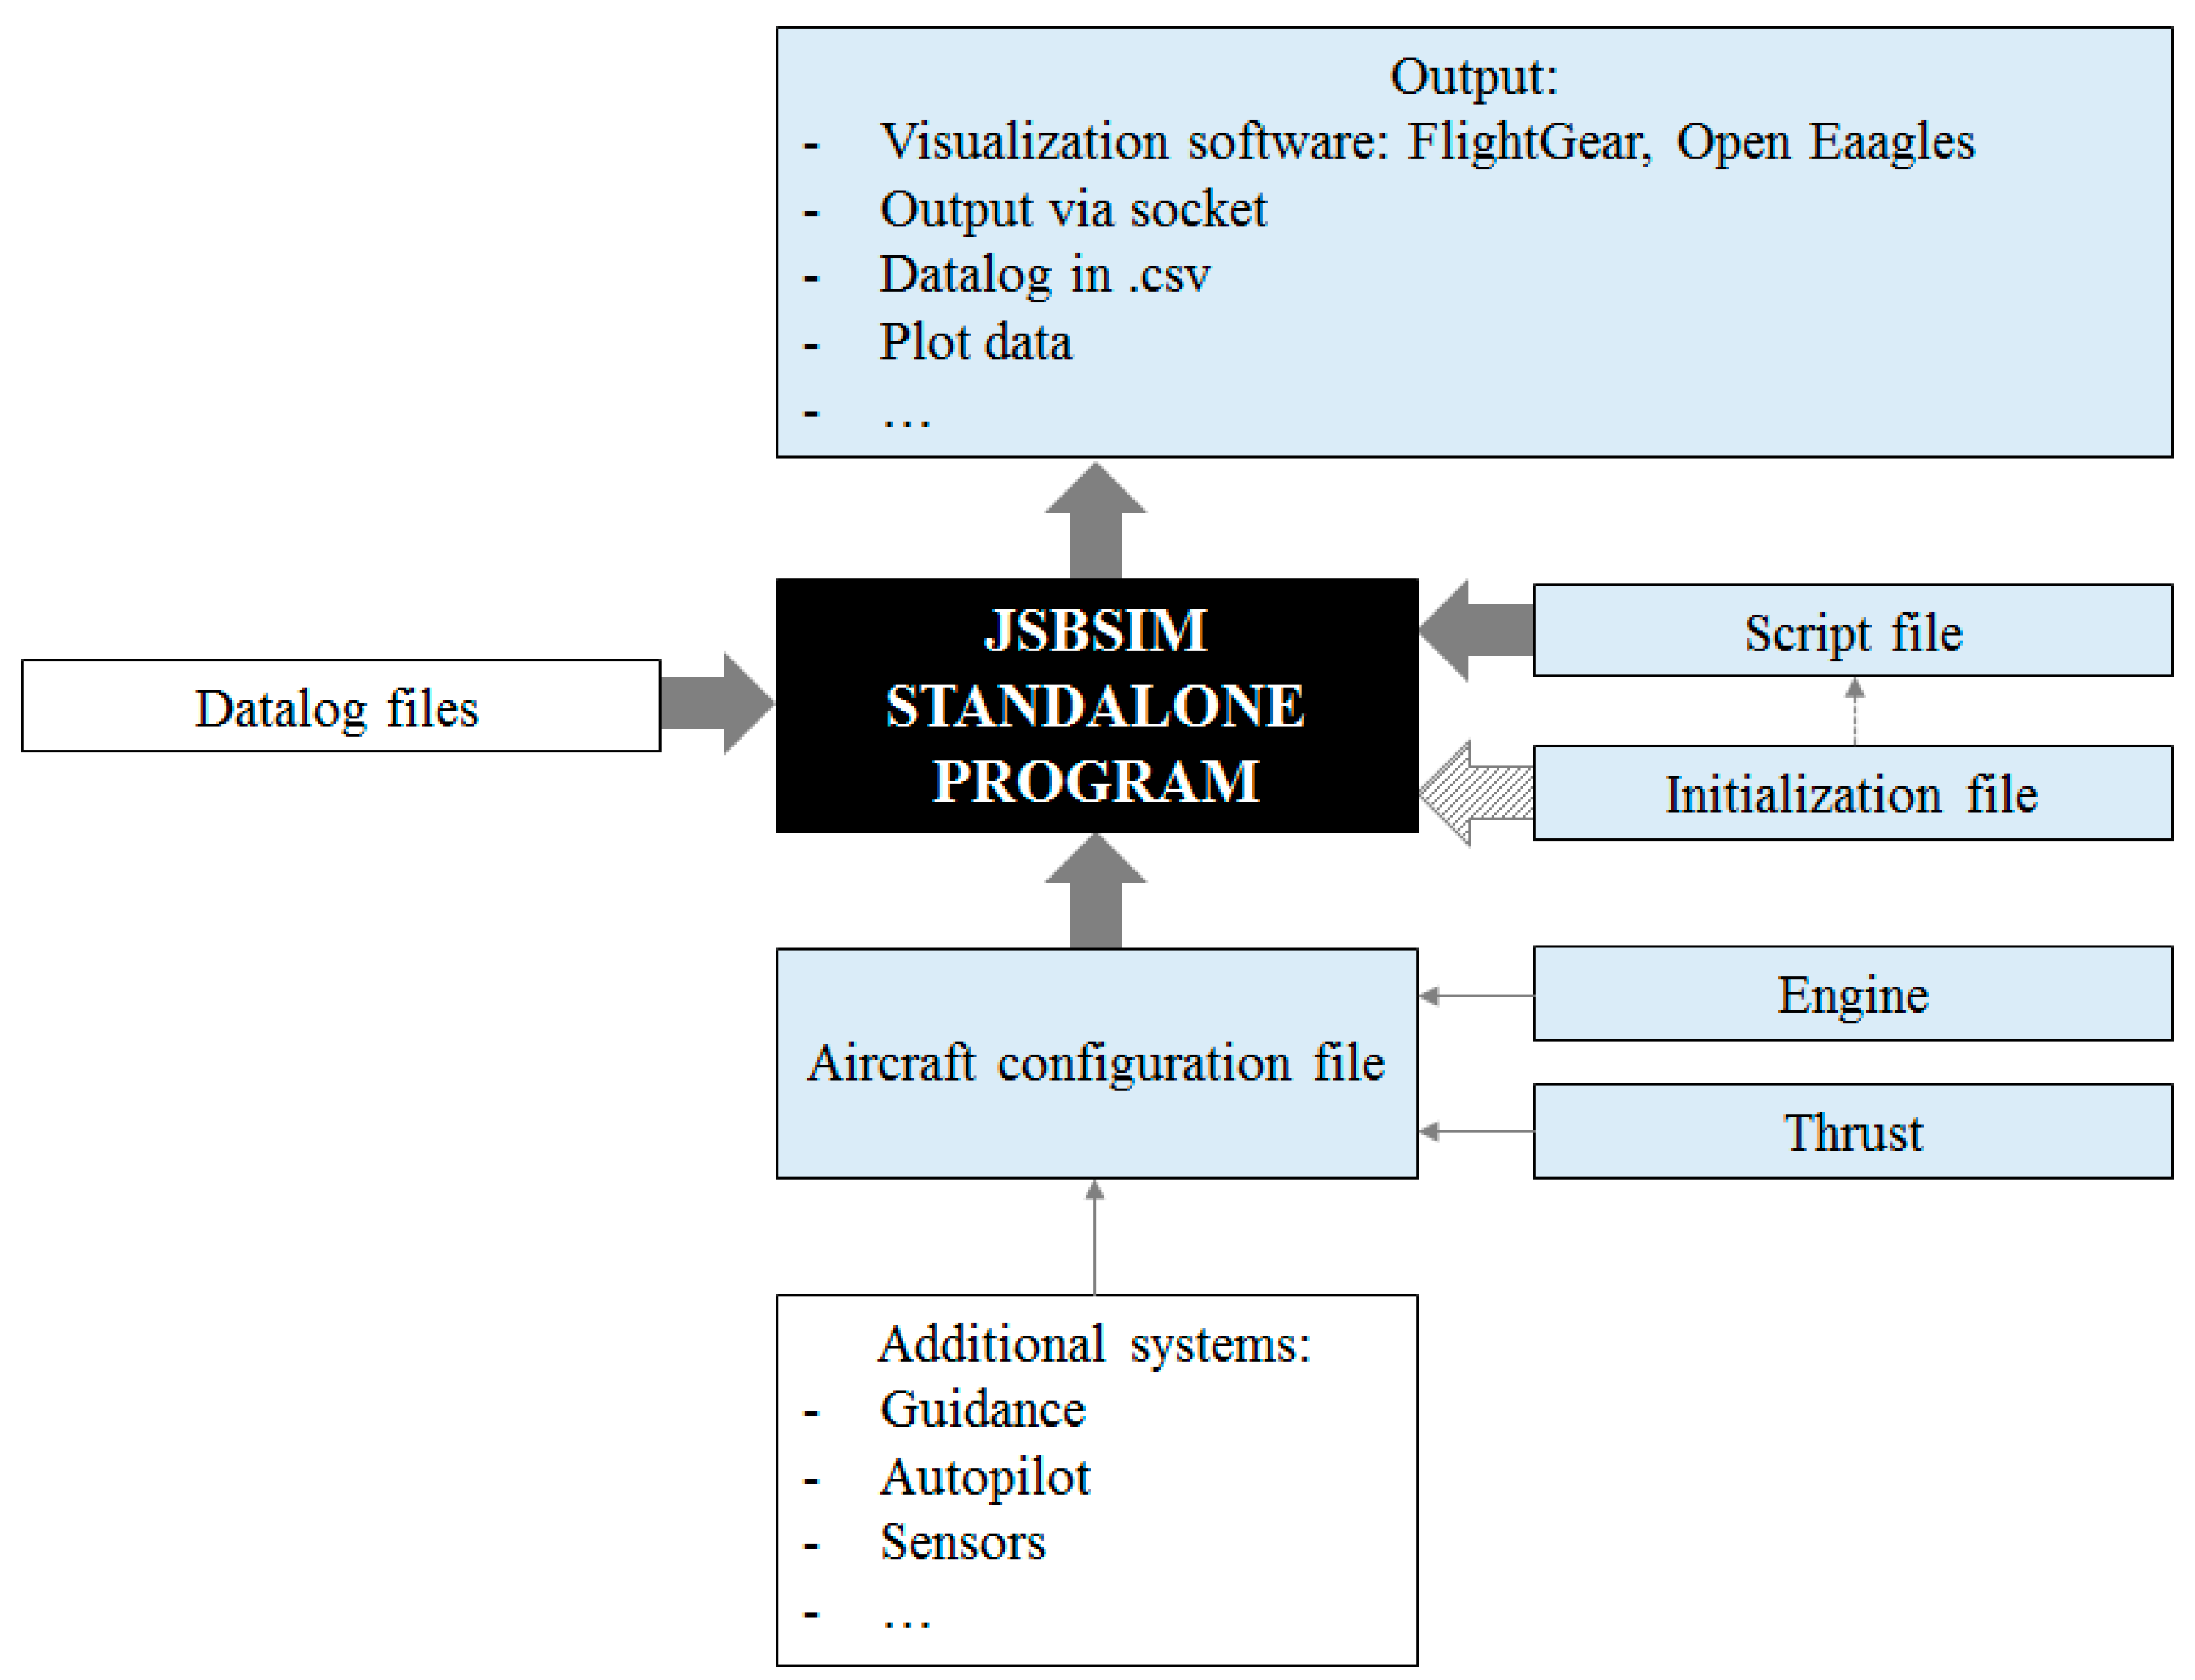
In the simplest scenario, JSBSim can be run through scripts entirely implemented through the code with FlightGear as the visualization software. In the diagram below (Figure 3), a simple simulation with JSBSim is shown formed by four main blocks: (1) JSBSim standalone program; (2) inputs, including script, initialization, and datalog files; (3) output, and (4) system files such as the aircraft configuration and propulsion files.
The versatility of JSBSim is one of its strongest attributes, since it is an open-source project. The MATLAB/Simulink with its AeroSim toolkit has also been commonly used to run simulations with UAVs [20]. Even though this toolkit is no longer supported after MATLAB R2010a, it plays a relevant role in the validation process and design of the optimal FDM in the following sections.

3.2. FDM Mathematical Method

The mathematical model used in JSBSim is derived from the most widely used method, Newton’s second law, where the position, velocities, and accelerations are solved from the total forces and moments, assuming that the aircraft is a 6-DoF rigid body [21]. Assuming the three principal position axes on an aircraft: longitudinal, lateral, and vertical, the orientation is given by the three angles: roll, pitch, and yaw. Thus, the FDM can be expressed by a series of non-differential equations. The aircraft motion is expressed by, first, the linear velocities [ u ,   v ,   w ], calculated from their derivatives { v ˙ } B = [ u ˙ ,   v ˙ ,   w ˙ ], and, second, the angular velocities [ p ,   q ,   r ], calculated from their corresponding angular velocities { w ˙ } B = [ p ˙ ,   q ˙ ,   r ˙ ], as follows:
{ F } B = m { v ˙ } B + m { Ω } B { v } B
{ M } B = I B { w ˙ } B + { Ω } B I B { w } B
[ ϕ ˙ θ ˙ ψ ˙ ] = T H , B { w } B
The state variables { v } B are calculated from the total forces along each axis { F } B with respect to the body frame. The body angular velocities { w } B are also calculated from the moments of inertia { M } B about their center of gravity and the aircraft’s mass. The change of the body angles in roll pitch and yaw [ ϕ ˙ θ ˙ ψ ˙ ] is calculated using the velocities.
JSBSim obtains the aerodynamic forces and moments using the coefficient buildup method, meaning that all the contributions to the generation of a specific force or moment are calculated and summed in order to obtain that total force/moment. The coefficients are taken from flight tests, calculated by hand or using software. JSBSim, through its tool Aeromatic v2.0 found on its website [18], also provides an approximate set of coefficients calculated from the aircraft dimensions.
The dynamic pressure expresses the approximate relationship between pressure and speed for low flow speeds (e.g., UAV case). By definition, the dynamic pressure represents the kinetic energy by a unit of volume of air used to calculate the force (e.g., side force (Y)) by multiplying a surface area and the aerodynamic coefficient.
q = 1 2 ρ V 2
Y = 1 2 ρ V 2 S   C Y = q S C Y
where q is the dynamic pressure, ρ is the air density, V is the airspeed expressed in the wind frame, S is the wing area, and CY is the side force coefficient.
The other two forces (drag (D) and lift (L)) are calculated by following the same concept:
D = q S C D
L = q S C L
CD represents the drag coefficient, and CL is the lift coefficient. Note that all the aerodynamic coefficients are non-dimensional.
The expressions for the moments are similar, as follows:
l = q S b C l
m = q S c C m
n = q S b C n
where l, m, and n are the rolling, pitching, and yawing moments; b is the wingspan; c is the wing chord; and Cl, Cm, and Cn are the coefficients for roll, pitch, and yaw coefficients, respectively.
As mentioned earlier, each coefficient is calculated from all the contributions to the force. As an example, the side force dependencies are the following:
C Y = C Y ( β ,   p ,   r ,   δ )
where β represents the sideslip angle, p the roll rate, r the yaw rate, and δ the flight deflections given by the control surfaces. For the slow airspeed and low altitude of the UAV case, the Mach number and altitude elements are neglected because their dependencies in all the coefficients are not significant.
Therefore, the side force coefficient, including the dependencies and its coefficients, is as follows:
C Y = C Y β β + C Y p p + C Y r r + C Y δ δ
Each of the side force coefficients ( C Y β , C Y p ,   C Y r ,   C Y δ ) is a consequence of the corresponding β ,   p ,   r ,   δ components (superscript).
Following the same approach as expressed for the side force coefficient, the drag coefficient CD, the lift coefficient CL, the roll coefficient Cl, the pitch coefficient Cm, and the yaw coefficient Cn for a UAV case in JSBSim are expressed as follows:
C D = C D 0 + K C L 2 + C D α α + C D δ δ
C L = C L 0 + C L α α + C L α ˙ α ˙ + C L q q + C L δ δ
C l = C l β β + C l p p + C l r r + C l δ δ
C m = C m 0 + C m α α + C m α ˙ α ˙ + C m q q + C m δ δ
C n = C n β β + C n p p + C n r r + C n δ δ
where α is the angle of attack, α ˙ is the rate of the angle of attack, q is the pitch rate, and each of the corresponding coefficient dependencies is indicated by their subscript.
The drag coefficient includes a special term K C L 2 , which indicates the induced drag caused by the lift force. Equations (12)–(17) are general statements, but they must be modified according to the aircraft. JSBSim allows for modifications in the aircraft configuration file in case the design carries other dependencies.
JSBSim includes different types of propulsion systems, depending on the engines used to generate the thrust: a piston engine model, a jet turbine engine model, a turboprop engine model, a rocket engine model, and an electric engine model. In the case of the Giant Big Stik, the piston model will be used. The thrust generation presents the same setting, while among all the options found in JSBSim—direct, nozzle, propeller, and rotor—only the propeller is used in the fixed-wing UAV case.
4. Short Procedure for a Correct Validation

The purpose of this section is to define a validation process composed of direct steps with the intent to guide any developer who does not have a deep understanding of software development and validation methods into the design and improvement of a UAV computer model.
The work presented here is based on previous work [22], and it has been improved to meet the UAV applications. It represents the initial stage for the study of UAVs in simulated frameworks. The different stages expressed in Figure 4 and Table 1 state the different aspects the designer has to consider during the development and validation process. Modelling is present specifically in the first two stages, as it is related to the model setup and programming. The validation tasks are named after the process to be carried out in that particular phase or stage. Once the model is validated and its limitations identified, it is assessed in a simple scenario that reproduces its final implementation. This final stage is important in order to prove the feasibility of the model for the fit-for-purpose task.

5. Giant Big Stik Model Development

The Giant Big Stik is the largest wooden aircraft, belonging to the Stik family developed by Great Planes. It is mainly oriented to sports aerobatics, with a nearly unlimited flight envelope, making it a perfect UAV for the study of extreme avoidance manoeuvres. The thrust is provided by a 16 × 8 in propeller and a 1.55cu-in Zenoah G26 Air Engine.
According to the validation methodology diagram expressed in Figure 4, the validation of the Giant Big Stik according to Table 1 can be broken down into the following items (Table 2):

5.1. Simulation Setup

The modelling in JSBSim starts with the identification of the parameters, aerodynamic coefficients, and the range of control surfaces provided by the manufacturer (Table 3, Table 4 and Table 5). The parameters and other dimensional information were obtained by manually measuring the aircraft and consulting the manufacturer’s information. The aerodynamic parameters were calculated in [23]. The visual model in FlightGear was designed from scratch by using SketchUp and integrated into the simulation.
The simulation environment is defined in stage 2 and developed in the following stages. Stages 3 and 4 in particular only require the model implemented in the selected simulation environment (JSBSim). As it is run in standalone mode, its setup is implemented through a configuration file, as shown in Figure 3, and following the recommendations included in [24]. In stage 5, the same model developed in MATLAB/Simulink graphic environment has been set up for comparison to the model in JSBSim.

5.2. Computational Validation

This section covers the comparison between the Giant Big Stik run under MATLAB/Simulink by using the AeroSim toolkit and the model developed in JSBSim. Both models are subjected to the same conditions and inputs, while their outputs are compared to identify the initial FDM limitations. The simulations are divided into three categories, with analysis on the effects of the control surfaces in the aircraft performance (aileron, elevator, and rudder). The isolation of the inputs one at a time is crucial to determine the stability of the aircraft towards disturbances in their corresponding axis. For each of the inputs, the corresponding surface deflection has been set up to its maximum value for a few seconds, as follows:
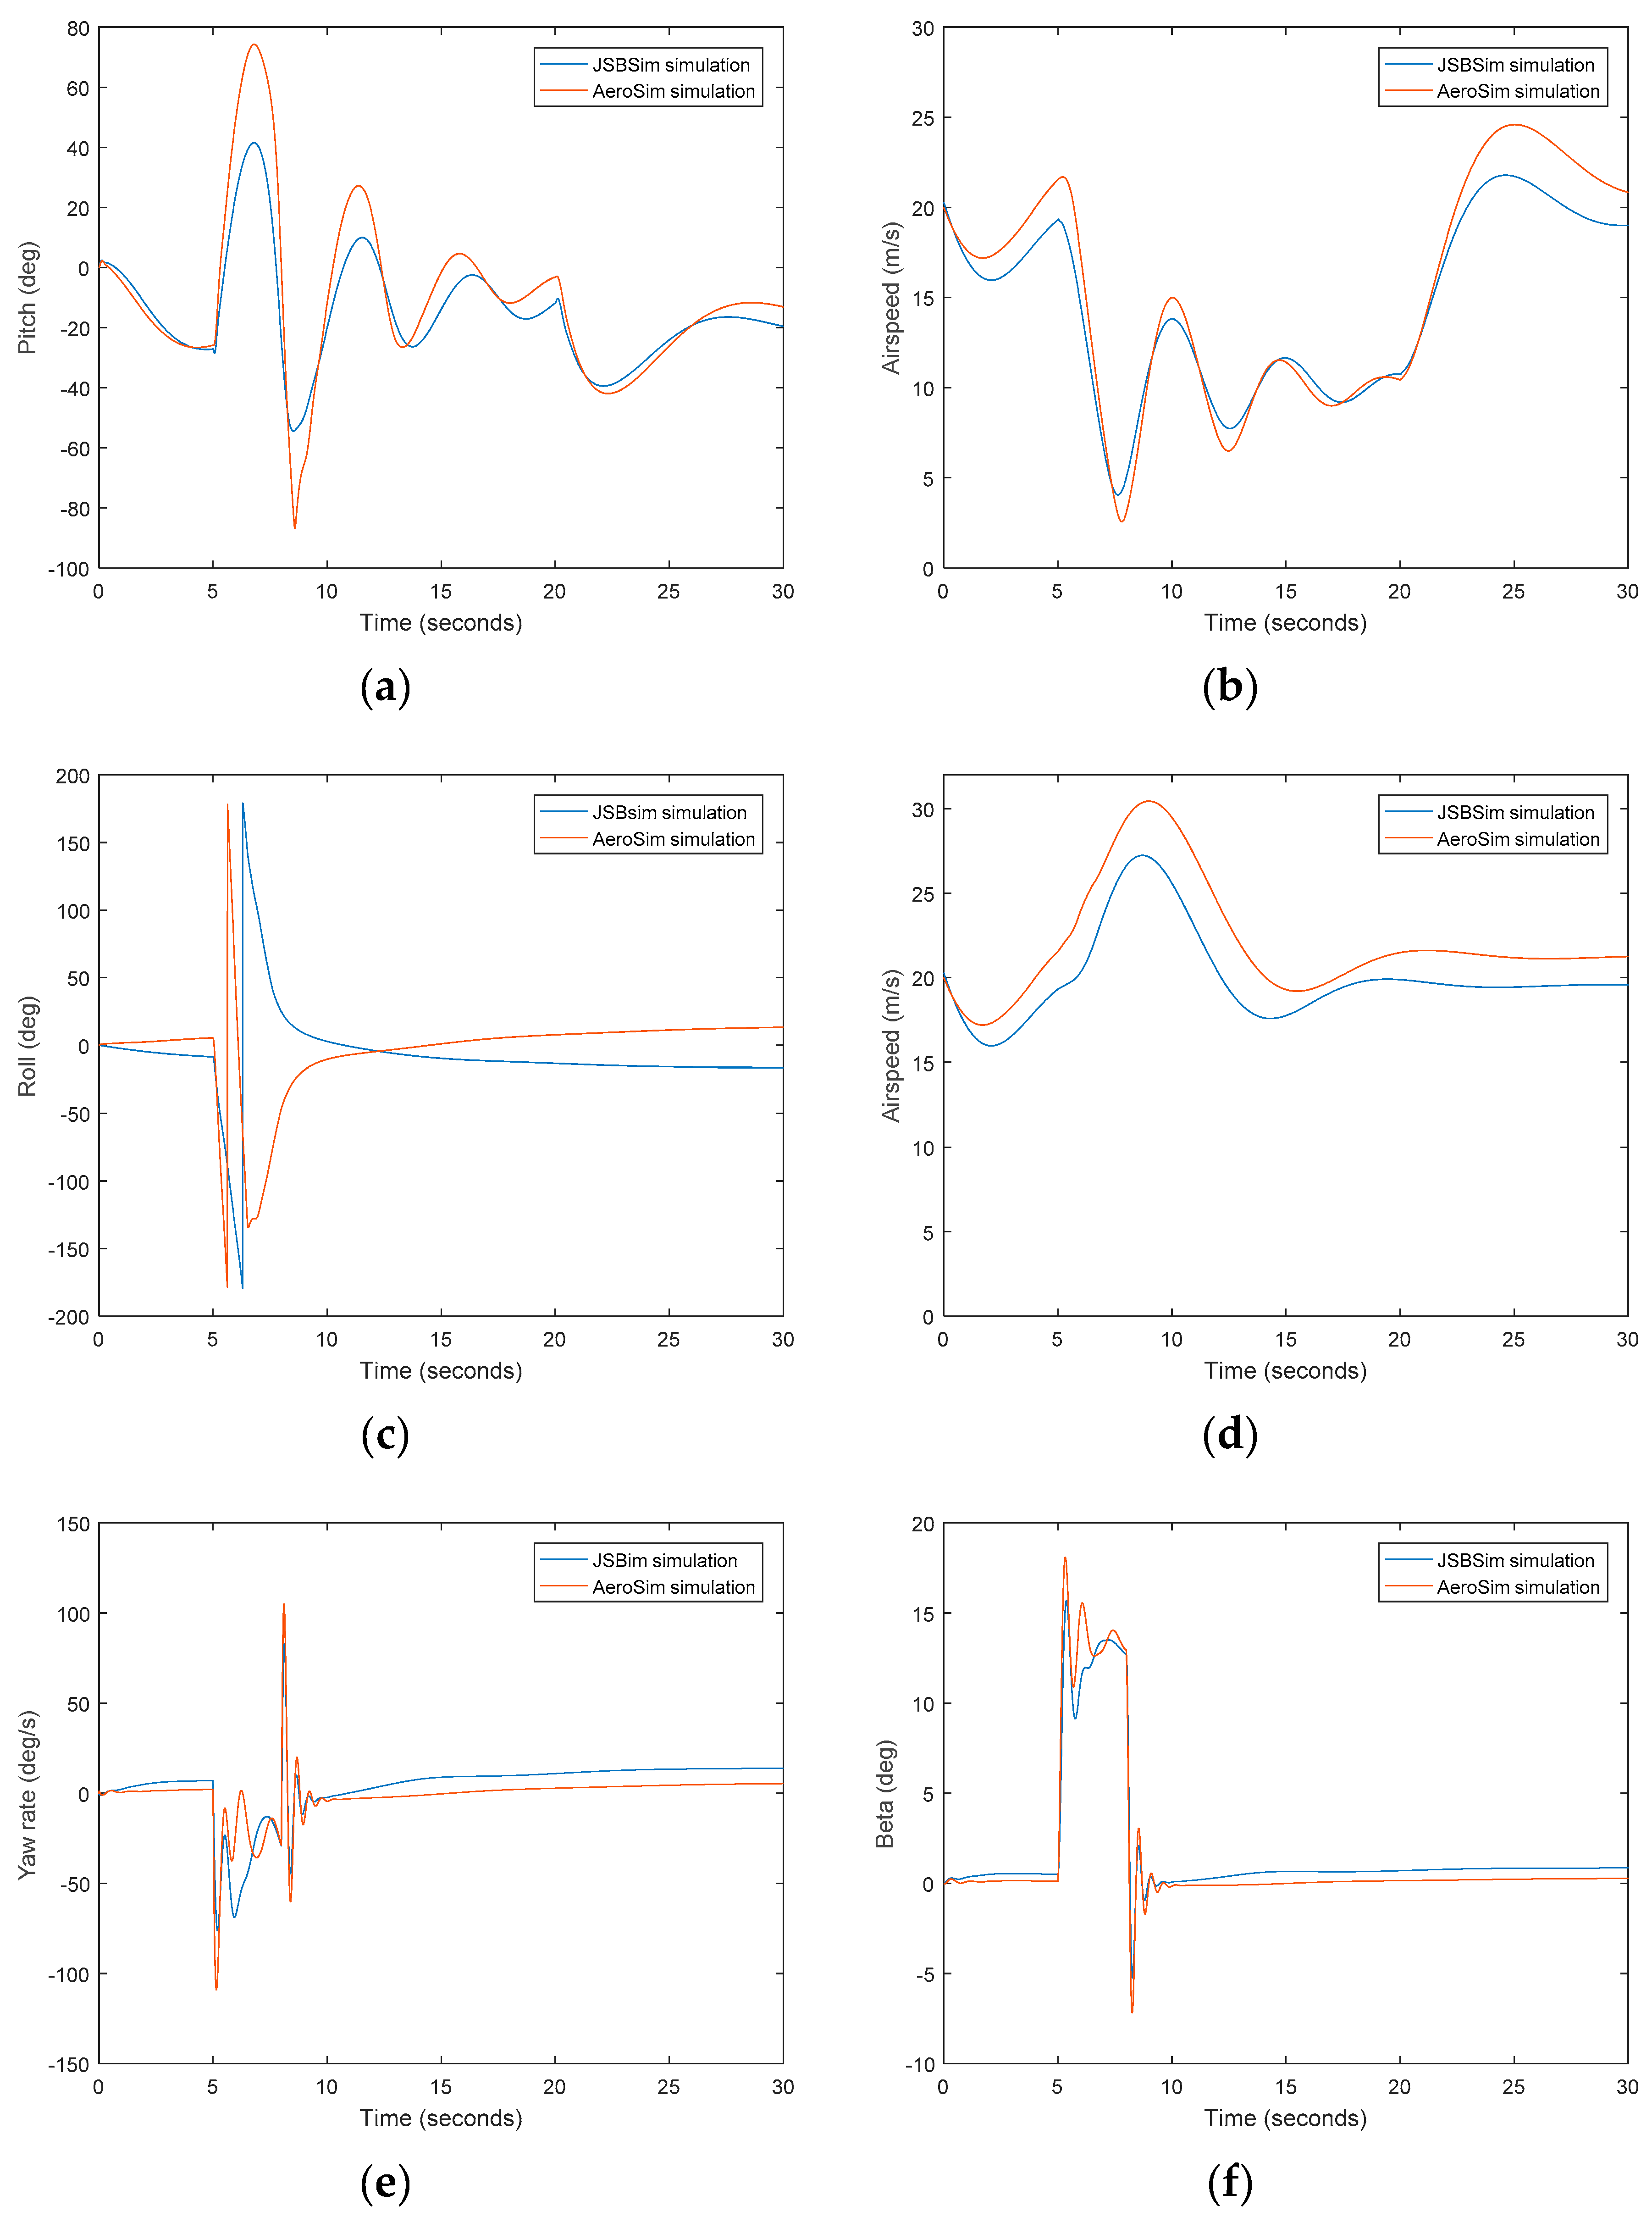
The direct effect in pitch angle due to changes in elevator deflection is noticeable in Figure 5a; with a sudden change in the elevator, both models experience the same reaction, being more responsive in the AeroSim case. The airspeed in Figure 5b is consistent with the changes in the elevator deflection as well: with an increase in the angle of attack, the aircraft slows down.
When the ailerons are set to their maximum value from a stable situation in the aileron test, AeroSim is much more responsive than JSBSim. Whereas the latter turns 180° in 1 s, the former experiences a full turn (Figure 5c). Despite this significant difference, the AeroSim context is unlikely to be realised due to the physical configuration of the aircraft. The airspeed in Figure 5d shows an offset that has been later adjusted by increasing the engine power in the JSBSim model. In the rudder test, both models are very similar and have a surface deflection (Figure 5e,f). In contrast to the elevator and ailerons test, when there is a lateral disturbance both models perform similarly.

5.3. Model Validation

The final stage of the Giant Big Stik computer model development uses test scenarios and empirical validation by comparing model outputs with real measurements from a flight mission. A Giant Big Stik was flown following the current regulations established by Transport Canada [25] in the allowed areas surrounding St. John’s, NL, Canada belonging to Class G airspace. The mission included an R/C controller, a ground control station, a Giant Big Stik vehicle, and an autopilot (Piccolo II) on board for recording the control inputs and the performance parameters over time.
In the analysis, the tasks of taking off and landing were neglected. The rudder control command was also removed from the study since it was not going to be used during flight, and there was also a special interest in the performance of the pitch axis. Likewise, the throttle during the mission was ~0.5% at all times and therefore considered constant in the validation process.
The full flight test was divided into sections where the relevant signals were identified as small, medium, and large signals. Two main sections were selected where the commands were either large or medium. In the first section (Figure 6a), the aileron deflection is kept at medium signals while the elevator deflection is left at small signals. The main interest of starting with this section, even though the focus is on the elevator and pitch performance, is because it is important to ensure that no signals in the ailerons could create instabilities in the pitch axis. However, the selected Section 2 (Figure 6b) focuses on sudden changes in the elevator by approximately 25°, which represent the same deflection that the aircraft might experience during an extreme manoeuvre in a near mid-air collision scenario.
The study in both cases starts at 12.5 s, allowing the computer model to stabilize. The first section lasts 39.5 s with a time range study of 27 s, whereas the second section lasts 26.5 s with a total simulation time of 14 s. The relevant analyzed variables are the roll and pitch angles, which are directly related to their corresponding axis.
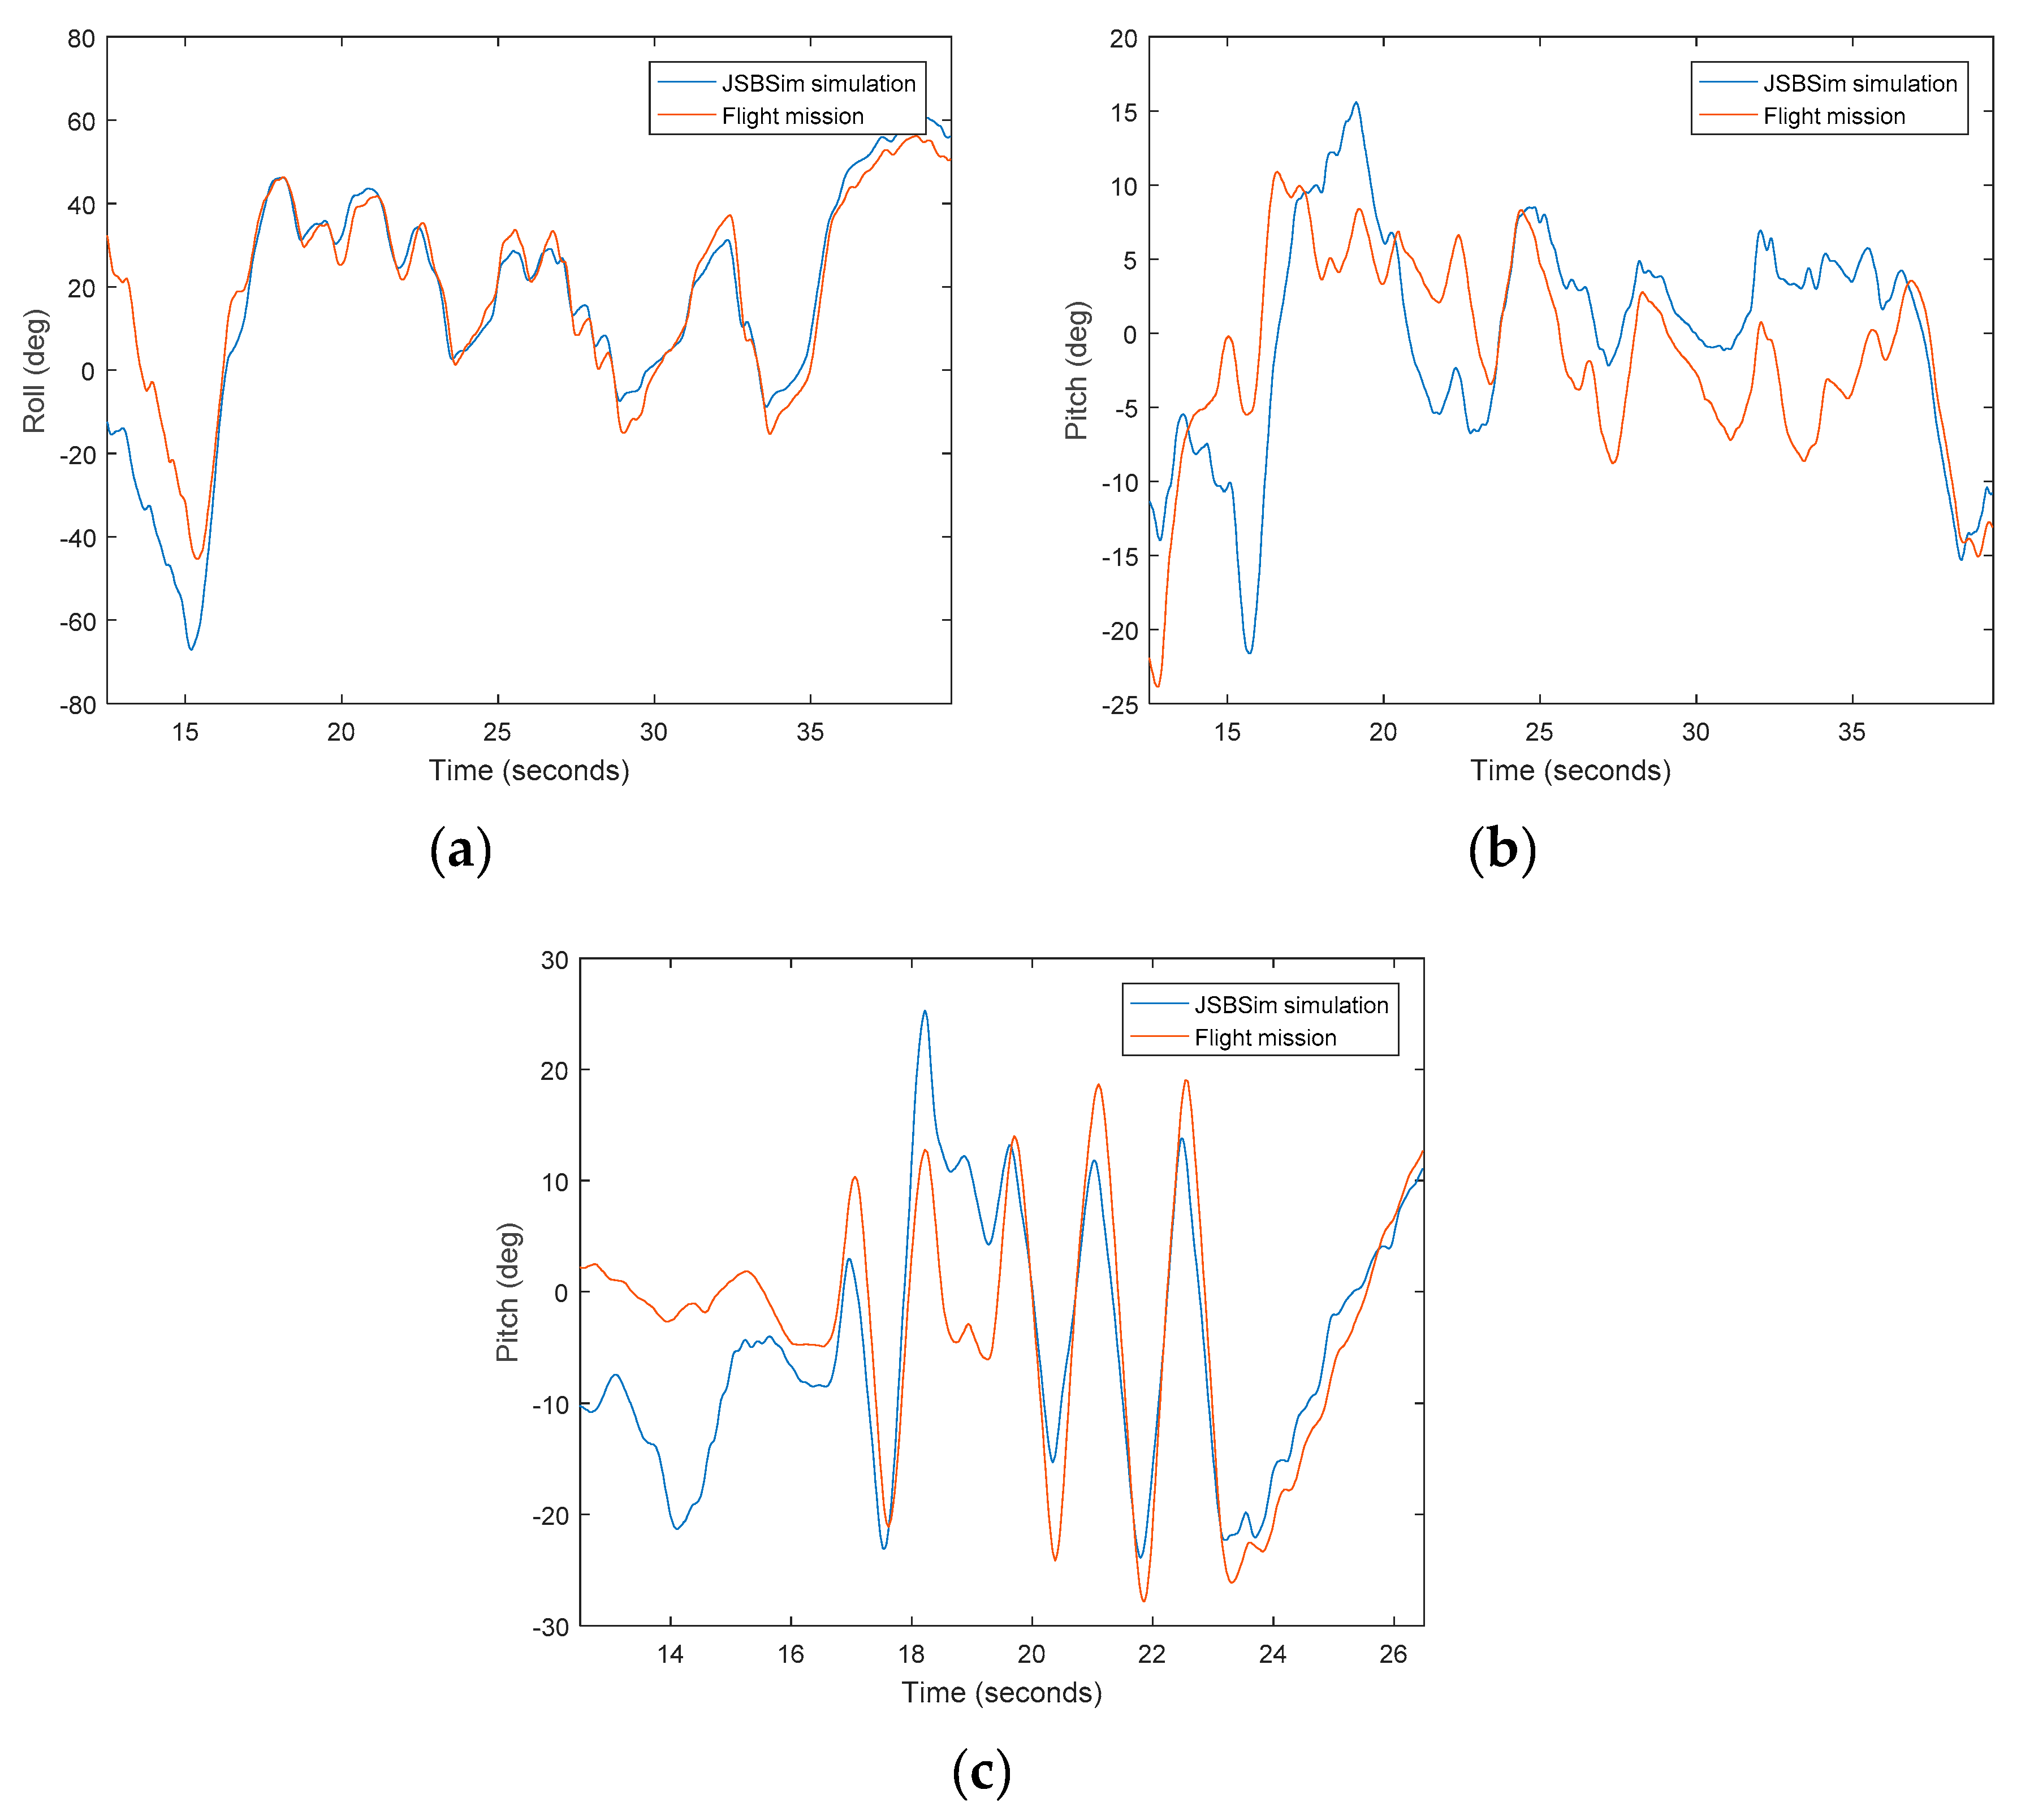
The results shown in Figure 7 are the final outcome of the computer model after the complete validation and development. Although the offsets, delays, and gains have been adjusted to match the real flight data, differences are allowed in the system due to the uncontrollable external forces and the different initial state where both systems (the real and the computer mode) have their starting point.
Although the similarities are observable, the final application of the model is the study of collision avoidance manoeuvres in encounters with manned aircraft. Therefore, it is important that the fit is realistic and quantifiable. The similarity between both models is quantified by the Pearson correlation coefficient, r , which measures how well two vectors are related. It ranges from +1 to −1, where a value close to 0 indicates that there is no connection between the two variables and values around −1 and +1 indicate a negative and positive connection, respectively. The correlation between two vectors X and Y of length n is defined as follows:
r ( X ,   Y ) = 1 n i n X i Y i μ X μ Y σ X σ Y
where μ X and μ Y are the means of the vectors X and Y and σ X and σ Y are the standard deviations of the same vectors X and Y .
The first section in Figure 7a indicates a match between both models in the roll axis with a Pearson correlation coefficient close to +1 (Table 6). When focusing on roll axis in the first section, it is evident that changes in the roll will not create instabilities in the pitch axis and the aircraft performance in a simulated environment will be as close as possible to the real flight. The pitch comparison results in Section 1 (Figure 7b) show that the dynamics of both systems are similar, and the differences have been later adjusted in Section 2 (Figure 7c). The Pearson correlation coefficient in pitch angle has been improved from 0.6 in Section 1 to 0.74 in Section 2 (Table 6). In that context, both performances are clearly alike when sudden changes take place in the elevator.

6. Simulation of a Diving Manoeuvre

In the final stage of the validation, the computer model is implemented in the context in which the model is fit-for-purpose. A general diving manoeuvre is likely to be performed by the elevator and the throttle. However, a high level of throttle will only create an increase of lift by pitching the nose up and delaying the time to dive.
Assuming that the aircraft starts the manoeuvre from a stable steady level flight and considering the SAA basis defined in Section 1.1, the diving manoeuvre is defined by the time that it takes the aircraft to dive 100 ft for a particular elevator deflection. Overall, an avoidance manoeuvre is not considered complete unless the aircraft efficiently recovers from the manoeuvre. The series of events for a diving manoeuvre will consist of an initial state, the avoidance manoeuvre, and the recovery performance (Table 7):
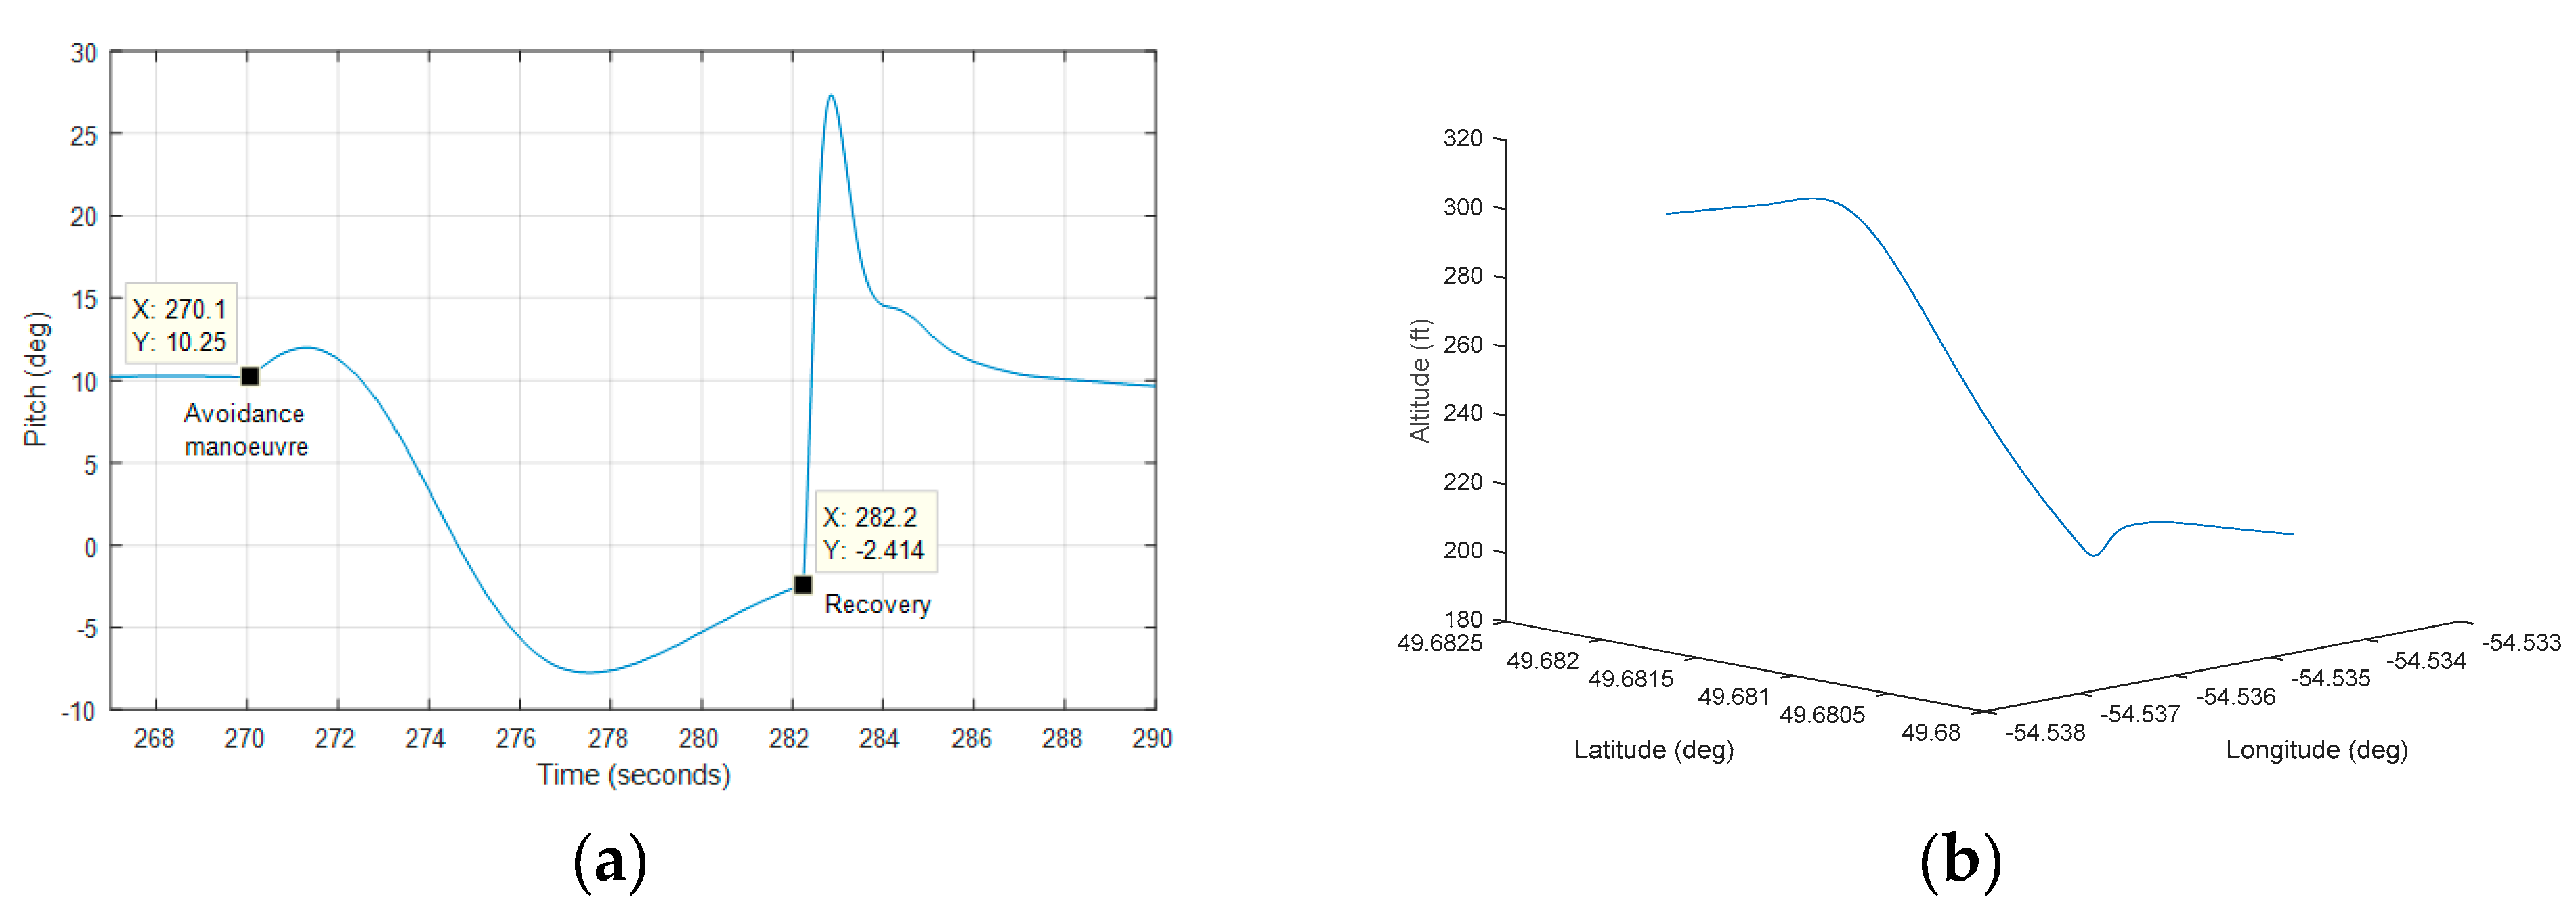
The Giant Big Stik computer model is tested for a 2D diving-only manoeuvre with the elevator deflection and the throttle level as its inputs. The trajectory in Figure 8b shows a minor overshoot in the instant when the avoidance manoeuvre starts, and a more noticeable undershoot in the recovery performance after the UAV has dived 100 ft. In this particular case, the total avoidance manoeuvre lasts around 12 s (Figure 8a) but considering that the Giant Big Stik is an aerobatic aircraft, this value could be improved. However, in this example, the UAV shows a descent rate of 500 fpm, which is the maximum recommended descent rate of an unpressurized cabin like the Cessna 172. This means that, with an improved diving manoeuvre, the Giant Big Stik will show a faster avoidance manoeuvre than a representative general aircraft.

7. Conclusions and Future Work

Overall, there were differences between AeroSim and JSBSim that have been modified through the model development process. The propulsion system and certain aerodynamic coefficients have been adjusted to be closer to the real performance of the aircraft. The dynamics shown for extreme combinations of the commands proved that the JSBSim model will likely be comparable to the actual performance of the real aircraft more than the AeroSim FDM implemented in MATLAB/Simulink. An acceptable simulator should not only perform according to the mathematical model of the aircraft, it should also incorporate the physical limitations of the actual system.
The procedure for a short computer model validation is limited to simple UAV computer models in JSBSim whose commands are defined by the primary control surfaces: aileron, elevator, rudder, and throttle. More sophisticated procedures based on the same concept should be defined and carried out in case the aircraft in question is more complex.
It has been shown that the Giant Big Stik computer model performs in a similar manner to the real system and it can be integrated into simulations with manned aircraft for the study of more complex simulations that include extreme avoidance manoeuvres. The flight mission used for validating the model in Section 5.3 was limited because of the risk associated with extreme manoeuvres. However, an experienced pilot who is familiar with the aerobatic performance of the Giant Big Stik could conduct a flight mission that included changes in the elevator deflection from a steady flight. This dataset would help to fine tune the Giant Big Stik FDM further and increase its correlation coefficient. For an improved fit-for-purpose FDM specific to SAA applications, in-flight system identification methods during extreme manoeuvres would also facilitate the adjustment of the mathematical functions behind the FDM.
In future studies, the high-fidelity fit-for-purpose computer model developed in this paper will also be used to estimate maximum achievable climb and descend rates for SAA manoeuvres.

Author Contributions

Conceptualization, O.C.; methodology, O.C.; software, O.C.; validation, O.C. and L.R.; formal analysis, O.C.; investigation, O.C.; resources, S.O.; data curation, O.C.; writing—original draft preparation, O.C.; writing—review and editing, O.C., L.R., and S.O.; visualization, O.C.; supervision, L.R. and S.O.

Funding

This research was funded by InnovateNL of Tourism, Culture, Industry and Innovation, Newfoundland and Labrador as part of the ArcticTECH research program.

Conflicts of Interest

The authors declare no conflict of interest.

References

  1. SC-228 RTCA. Minimum Operational Performance Standards (MOPS) for Detect and Avoid (DAA) Systems; RTCA: Washington, DC, USA, 2017. [Google Scholar]
  2. Cereceda, O. A Survey of Collision Avoidance Methods for Unmanned Aircraft Systems. In Proceedings of the 27th Annual Newfoundland Electrical and Computer Engineering Conference (NECEC 2018), St. John’s, NL, Canada, 13 November 2018. [Google Scholar]
  3. Federal Aviation Administration. Sense and Avoid (SAA) for Unmanned Aircraft Systems (UAS); Second Caucus Workshop Report; FAA: Washington, DC, USA, 2013.
  4. Unmanned Systems Canada. Small Remotely Piloted Aircraft System (RPAS) Best Practices for BVLOS Operations; Unmanned Systems Canada: Ottawa, ON, Canada, 2017; pp. 1–74. [Google Scholar]
  5. Diston, D.J. Computational Modelling and Simulation of Aircraft and the Environment; Wiley: Hoboken, NJ, USA, 2010; ISBN 0470687118. [Google Scholar]
  6. Forsberg, K.; Mooz, H. The Relationship of System Engineering to the Project Cycle. INCOSE Int. Symp. 1991, 1, 57–65. [Google Scholar] [CrossRef]
  7. Murray-Smith, D.J. Modelling and Simulation of Integrated Systems in Engineering: Issues of Methodology, Quality, Testing and Application; Woodhead Publishing: Sawston, UK, 2012; ISBN 9780857096050. [Google Scholar]
  8. Buchholz, J.J.; Bauschat, J.-M.; Hahn, K.U.; Pausder, H.J. ATTAS & ATTHeS In-Flight Simulators. Recent Application Experiences and Future Programs. In Proceedings of the NATO AGARD Symposium on Flight Simulation—Where Are the Challenges? (AGARD-CP-577), Braunschweig, Germany, 22–25 May 1995. [Google Scholar]
  9. McGovern, S.M. Categories for classification of aircraft flight model validation. In Proceedings of the AIAA/IEEE Digital Avionics Systems Conference, Dallas, TX, USA, 21–25 October 2007. [Google Scholar]
  10. Federal Aviation Administration Flight Simulation Training Device Qualification Guidance—Advisory Circulars (AC). Available online: https://www.faa.gov/about/initiatives/nsp/ac/ (accessed on 28 August 2018).
  11. Transport Canada. Aeroplane and Rotorcraft Simulator Manual; Transport Canada: Ottawa, ON, Canada, 1998. [Google Scholar]
  12. Transport Canada National Simulator Evaluation Program. Available online: https://www.tc.gc.ca/eng/civilaviation/opssvs/nationalops-airline-simulator-menu-850.htm (accessed on 28 August 2018).
  13. Cooper, G.E.; Harper, R.P. The Use of Pilot Training in the Evaluation of Aircraft Handling Qualities; Advisory Group for Aerospace Research and Development: Neuilly sur Seine, France, 1969. [Google Scholar]
  14. Law, A.M. Simulation Modeling and Analysis; McGraw-Hill Education: New York, NY, USA, 2014; ISBN 0073401323. [Google Scholar]
  15. Berndt, J.S.; JSBSim Development Team. JSBSim, An open source, platform-independent, flight dynamics model in C++. In Proceedings of the AIAA Modeling and Simulation Technologies Conference and Exhibit, Providence, Rhode Island, 16–19 August 2004. [Google Scholar]
  16. Wong, D.R.; Ou, Q.; Sinclair, M.; Li, Y.J.; Chen, X.Q.; Marburg, A. Unmanned Aerial Vehicle flight model validation using on-board sensing and instrumentation. In Proceedings of the 15th International Conference on Mechatronics and Machine Vision in Practice, M2VIP’08, Auckland, New Zealand, 2–4 December 2008. [Google Scholar]
  17. Vogeltanz, T.; Jašek, R. JSBSim library for flight dynamics modelling of a mini-UAV. In Proceedings of the International Conference on Numerical Analysis and Applied Mathematics 2014 (ICNAAM-2014), Rhodes, Greece, 22–28 September 2014. [Google Scholar]
  18. JSBSim Development Team. JSBSim Open Source Flight Dynamics Model. Available online: http://jsbsim.sourceforge.net/ (accessed on 9 October 2017).
  19. FlightGear Flight Simulator. Available online: http://www.flightgear.org/ (accessed on 28 April 2017).
  20. Stevenson, J.D.; Cereceda, O. A Simulated Environment for Testing 4D Detect See and Avoid Scenarios for UAVs. In Proceedings of the 23rd Annual Newfoundland Electrical and Computer Engineering Conference (NECEC 2014), St. John’s, NL, Canada, 3 November 2014. [Google Scholar]
  21. Cook, M.V. Flight Dynamics Principle, 2nd ed.; Butterworth-Heinemann: Oxford, UK, 2007; ISBN 978-0-7506-6927-6. [Google Scholar]
  22. Cereceda, O.; Rolland, L.; O’Young, S. Validation discussion of an Unmanned Aerial Vehicle (UAV) using JSBSim Flight Dynamics Model compared to MATLAB/Simulink AeroSim Blockset. In Proceedings of the 2016 IEEE International Conference on Systems, Man, and Cybernetics (SMC), Budapest, Hungary, 9–12 October 2016; pp. 3989–3994. [Google Scholar]
  23. Stevenson, J.D. Assessment of the Equivalent Level of Safety Requirements for Small Unmanned Aerial Vehicles; Memorial University of Newfoundland: St. John’s, NL, Canada, 2015. [Google Scholar]
  24. Cereceda, O.; Rolland, L.; O’Young, S. JSBSim Open-Source Flight Dynamics Model for Fixed-Wing Unmanned Aerial Vehicle Applications. In Proceedings of the 26th Annual Newfoundland Electrical and Computer Engineering Conference (NECEC 2017), St. John’s, NL, Canada, 15 November 2017. [Google Scholar]
  25. Transport Canada Drone Safety. Available online: https://www.tc.gc.ca/eng/civilaviation/drone-safety.html (accessed on 21 April 2018).
Figure 1. Modelling of a dynamic system [5].
Drones 03 00048 g001
Figure 2. The correlated inspection approach [14].
Drones 03 00048 g002
Figure 3. JSBSim standalone mode structure.
Drones 03 00048 g003
Figure 4. Stages for a UAV computer model development and validation.
Drones 03 00048 g004
Figure 5. GBS elevator, aileron, and rudder tests: (a) elevator test, pitch angle; (b) elevator test, airspeed; (c) aileron test, roll angle; (d) aileron test, airspeed; (e) rudder test, yaw rate; and (f) rudder test, sideslip angle.
Drones 03 00048 g005
Figure 6. Aileron and elevator deflections: (a) Section 1 and (b) Section 2.
Drones 03 00048 g006
Figure 7. Computer model vs. real model: (a) Section 1, roll angle; (b) Section 1, pitch angle; and (c) Section 2, pitch angle.
Drones 03 00048 g007
Figure 8. GBS diving manoeuvre: (a) Pitch angle AND (b) Trajectory.
Drones 03 00048 g008
Table 1. Recommended stages for UAV computer model and validation.
StageNameDescription
1Mathematical methodComputer model equation solving method;
2Code evaluationSimulation platform where the model will be integrated;
3Manufacturer recommendationsSuggestions on flying the UAV for the tasks of taking-off, landing, and level flight provided by the manufacturer;
4Model observationGiven a flight controller and a visual simulator linked to the FDM, the system is tested by a pilot, who gives feedback about its performance and possible improvements;
5Computational validationTwo identical computer simulations, one for each FDM, are configured, where both models are exposed to the same conditions/inputs and compared;
6Flight test and model validationIn a real flight, data is collected from a simple mission and compared to the data under the same conditions for the FDM designed. The computer model is adjusted according to the real system.
Table 2. Giant Big Stik computer model development and validation stages.
StageNameGiant Big Stik
1Mathematical methodTraditional 6-DoF with non-linear differential equations;
2Code evaluationJSBSim and FlightGear;
3Manufacturer recommendationsThe recommended flying procedures in the Giant Big Stik manual were not very specific [17] but were tested, and the pilots in our team pointed out that the engine model must be made more powerful;
4Model observation
5Computational validationMATLAB/Simulink with AeroSim vs. JSBSim. Section 5.2;
6Flight test and model validationFlight data vs. JSBSim. Section 5.3.
Table 3. Giant Big Stik parameters.
<metrics><mass_balance>
Wing area (ft2)10.538Ixx (Slug*ft2)0.3046
Wing span (ft)6.709Iyy (Slug*ft2)0.4752
Wing incidence2.00Izz (Slug*ft2)0.7036
Chrod (ft)1.148Ixy (Slug*ft2)0
H tail area (ft2)1.69Ixz (Slug*ft2)0.0951
H tail arm (ft)2.36Iyz (Slug*ft2)0
V tail area (ft2)1.05Empty weight (lbs)13
V tail arm (ft)2.27CG (in)[14.4881, 0, 0]
AERORP (in)[18.4961, 0, 2.5591]
Table 4. Giant Big Stik aerodynamic coefficients.
Lift CoefficientDrag CoefficientSide CoefficientRoll CoefficientPitch CoefficientYaw Coefficient
C D 0 0.1 C m 0 0.15
C L α 5.32k(CL)0.087 C m α −1.9
C L α ˙ 1.7 C m α ˙ −3.5
C Y β −0.83 C l β −0.034 C n β 0.071
C l p −0.41 C n p −0.0575
C L q 3.9 C m q −6.813
C l r 0.107 C n r −0.12032
C L δ Elevator−5.6 C D δ 0.0135 C Y δ 0.0 C l δ 0.0 C m δ −1.458 C n δ 0.0
Aileron0.00.0302−0.075−0.20.00.0108
Rudder0.00.03030.1914−0.1070.0−0.062
Table 5. Control surface deflections range.
Control Surface δ m i n δ m a x
Elevator−26° (−0.4643 rad)26° (0.4643 rad)
Aileron−32.6° (−0.569 rad)32.6° (0.569 rad)
Rudder−31.6° (−0.546 rad)31.6° (0.546 rad)
Table 6. Pearson correlation coefficients on results in Figure 7 1.
SectionAnglePearson Correlation CoefficientSignificance Value
1Roll0.93040
1Pitch0.606641.6996e–136
2Pitch0.740441.4832e–122
1 The significance value indicates the p-value for testing the hypothesis; if it is smaller than the significance level (0.05), then the corresponding correlation coefficient is significant.
Table 7. Collision avoidance events for testing the Giant Big Stik in SAA manoeuvres.
Event/TaskThrottle (%)Elevator (rad)
Initial state (267 s)50.00.0
Avoidance manoeuvre (270 s)0.00.14
Recovery (h < 200 ft in 282 s)30.0−0.01