Article

UAV-Derived Himalayan Topography: Hazard Assessments and Comparison with Global DEM Products

1
Department of Hydrology & Atmospheric Sciences, University of Arizona, Tucson, AZ 85721, USA
2
Planetary Science Institute, Tucson, AZ 85719, USA
3
National Trust for Nature Conservation (NTNC), P.O. Box 3712, Khumaltar, Lalitpur, Nepal
*
Author to whom correspondence should be addressed.
Drones 2019, 3(1), 18; https://doi.org/10.3390/drones3010018
Submission received: 29 December 2018 / Revised: 1 February 2019 / Accepted: 4 February 2019 / Published: 13 February 2019
(This article belongs to the Special Issue Drones for Topographic Mapping)

Abstract

:
Topography derived using human-portable unmanned aerial vehicles (UAVs) and structure from motion photogrammetry offers an order of magnitude improvement in spatial resolution and uncertainty over small survey extents, compared to global digital elevation model (DEM) products, which are often the only available choice of DEMs in the high-mountain Himalaya. Access to fine-resolution topography in the high mountain Himalaya is essential to assess where flood and landslide events present a risk to populations and infrastructure. In this study, we compare the topography of UAV-derived DEMs, three open-access global DEM products, and the 8 m High Mountain Asia (HMA) DEMs (released in December 2017) and assess their suitability for landslide- and flood-related hazard assessments. We observed close similarity between UAV and HMA DEMs when comparing terrain elevation, river channel delineation, landside volume, and landslide-dammed lake area and volume. We demonstrate the use of fine-resolution topography in a flood-modelling scenario relating to landslide-dammed lakes that formed on the Marsyangdi River following the 2015 Gorkha earthquake. We outline a workflow for using UAVs in hazard assessments and disaster situations to generate fine-resolution topography and facilitate real-time decision-making capabilities, such as assessing landslide-dammed lakes, mass movement volumes, and flood risk.

1. Introduction

Elevation models of Himalayan topography are required for investigating a range of earth surface processes, including quantifying landslide and landslide-dammed lake volumes (e.g., [1,2,3,4,5]); glacial lake outburst flood (GLOF) assessments (e.g., [6,7,8]); hydraulic modelling (e.g., [9,10,11,12]); hydrological modelling (e.g., [13]; and calculating glacier mass balance and ablation processes (e.g., [14,15,16,17]). Global digital elevation model (DEM) products, such as the Advanced Land Observing Satellite (ALOS) World 3D DEM (AW3D30), offer near-global land surface coverage at 30 m spatial resolution [18]. Elevation uncertainties can be large in steeply sloping terrain, which can limit their use in the Himalaya. Similarly, products comprising mosaicked stacks of DEMs lack a defined time stamp, which limits multitemporal assessments. Nonetheless, global DEM products are often used in hazard and risk assessments in the absence of finer resolution data [7,12,19]. Increasingly, DEMs with high spatiotemporal resolution are generated using an expanding archive of stereo satellite imagery (e.g., [20]) or using unmanned aerial vehicles (UAVs) following a structure from motion with multiview stereo workflow (SfM-MVS) [21,22,23]. These DEMs and point clouds are becoming increasingly common for assessing earth system processes and hazards in high mountain environments due to the submetre precision that is achievable [17,24,25].
UAV surveys in the Himalaya are generally limited in spatial extent and by the costs and administration associated with permits, licensing, transportation, and field deployment (Table 1). However, flexible flight altitudes and survey times enable tailored data collection to requirements such as achieving a specified spatial resolution or minimising terrain shadows. The widespread low-cost availability of UAVs also means there are emerging opportunities to crowdsource imagery following disasters. For example, UAV-derived products, such as DEMs and orthophotos, can be used to map and monitor landslide evolution [26,27] and quantify socioeconomic disruption [28]. Commercial satellite images were released for crowdsourced landslide mapping following the 2015 Gorkha earthquake in Nepal [5,29]. However, their acquisition was dependent upon cloud-free periods coinciding with orbital revisit times, and coincident DEMs were unavailable for topographic change detection. UAVs provide a rapid means of collecting georeferenced imagery, and although spectral bands are often limited to red-green-blue, UAVs offer a flexible platform that can be fitted with other sensors (e.g., thermal and near-infrared).
In this study, we compare the use of fine-resolution UAV-derived topography to open-access DEM products in a high-mountain environment. Our objectives are to (1) assess the utility of the different DEM products for high-mountain hazard assessment and management, including flooding, landslide volume, and landslide-dammed lake volume; (2) use a fine-resolution DEM to determine whether river-blocking landslides that formed on the Marsyangdi River following the 2015 Gorkha earthquake posed a downstream inundation hazard; and (3) outline a workflow for data acquisition and analysis following a natural disaster.

2. Study Sites and Methods
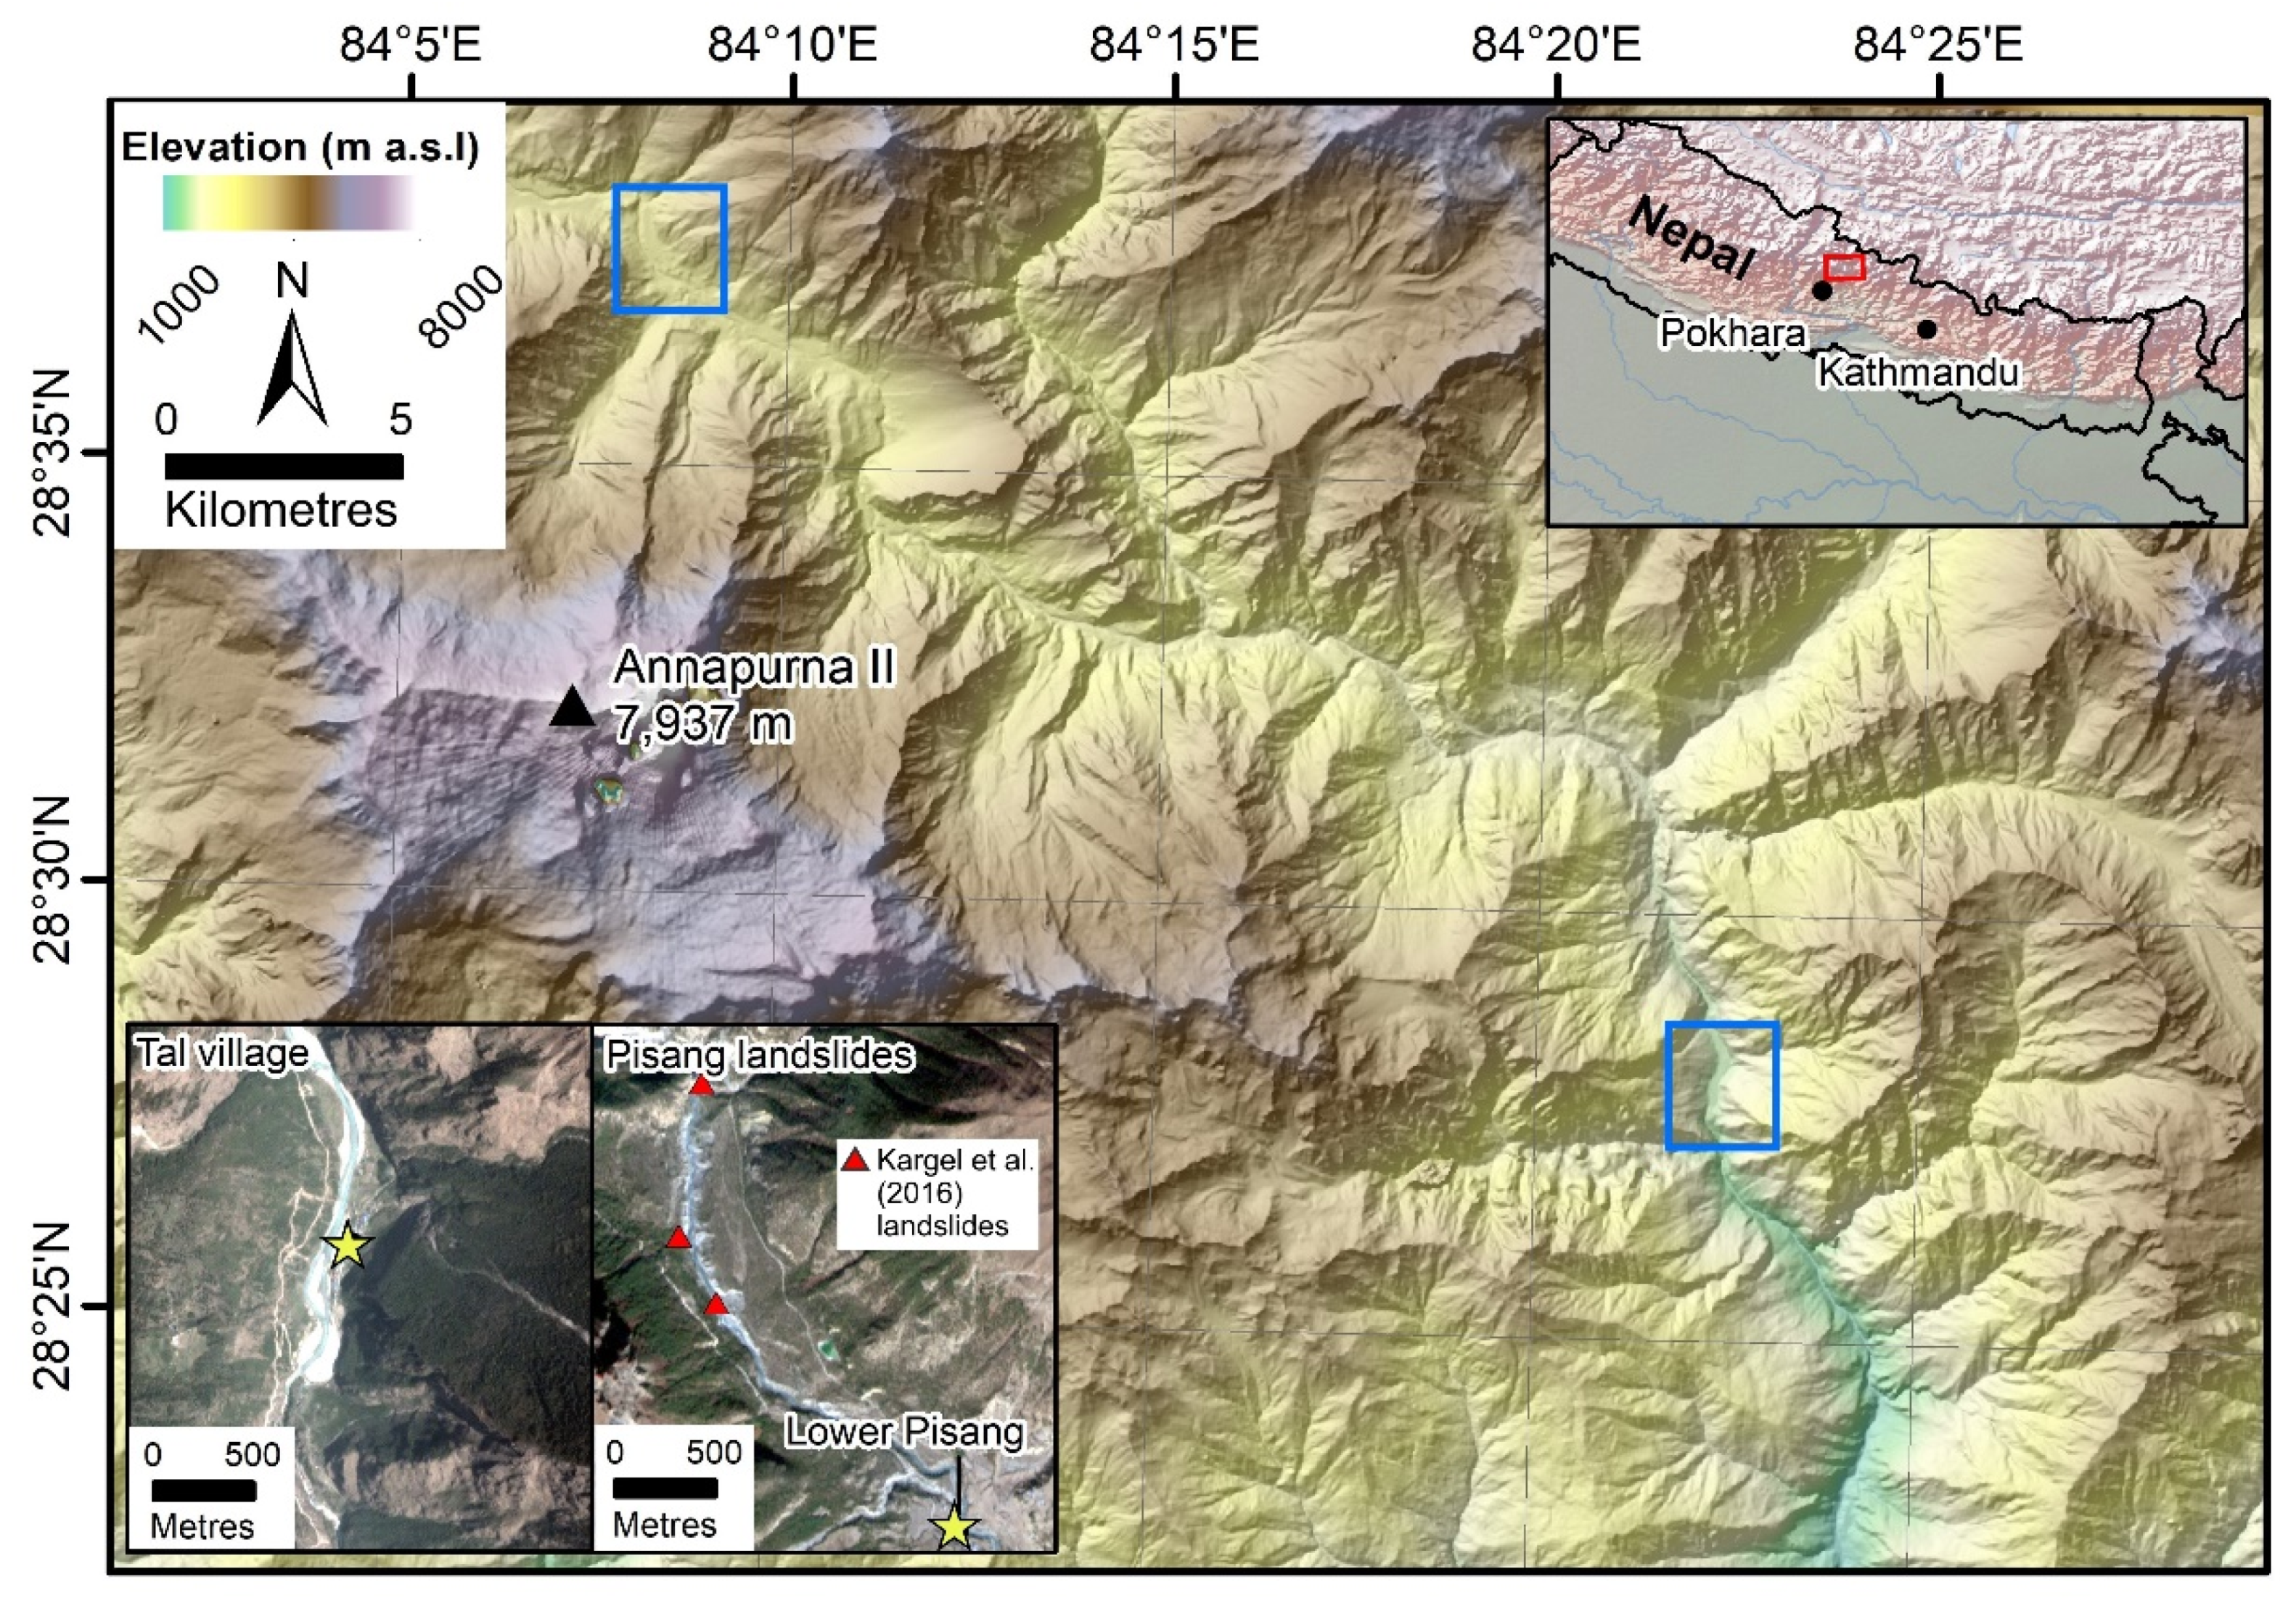
2.1. Study Sites

UAV surveys were conducted in two areas of central Nepal with distinct river channel characteristics (Figure 1). Tal village is located at ~1680 m a.s.l, with a mean area of interest (AOI) slope of 37°. The village is situated on the infill of a former landslide-dammed lake [30] and is located on the Marsyangdi River. The Pisang Landslides occurred following the 2015 Gorkha earthquake upstream of Lower Pisang village (~3200 m a.s.l), which is situated on a terrace above the Marsyangdi River [5]. The village is within the Annapurna Conservation Area (ACA), which is the largest protected area in Nepal (7629 km2). The Pisang Landslides AOI had a mean slope of 26°.

2.2. UAV Surveys

A DJI Phantom 4 Pro+ with a 20 megapixel camera was manually flown at the AOIs during April and May 2018. The DJI Phantom 4 Pro+ does not have automated route-planning capability. The drone automatically captured near-nadir imagery every two seconds. Each image was automatically georeferenced with 3D coordinates from the UAV’s global positioning system (GPS) and global navigation satellite system (GLONASS) receiver. The flight paths generally followed linear out-and-back routes at >100 m altitude. At Tal village, the flight was conducted from a police checkpoint overlooking the village from the southwest, which gave a vantage point ~80 m vertically above the village. For the Lower Pisang AOI, flights were conducted from the road following the western bank of the Marsyangdi River and from an area of landslide runout to the south of the village. Ground control points (GCPs) were collected on prominent natural or human-made features using Emlid Reach RS global navigation satellite system (GNSS) L1 receivers. At Tal village, one receiver was mounted on a tripod to establish a temporary static base station, and one unit was used as a rover to occupy target features for ~5 min. GNSS data were not collected for the Pisang landslides AOI. GNSS data were processed using RTKLIB (RTKPOST v.2.4.3. Emlid b28) using precise GPS and GLONASS ephemeris data. First, the temporary base station data were processed against the closest operating UNAVCO permanent base station (Lamjung). Second, the rover data were processed against the corrected temporary base station location to extract GCPs for use in SfM-MVS software.

2.3. DEM Processing

UAV imagery was processed in Agisoft Photoscan 1.4.0 using high-quality settings to generate point clouds following a SfM-MVS workflow (e.g., [21,22,23]), which were used to generate DEMs and orthophotos. Software filtering of the sparse point cloud is commonly used to remove outliers (e.g., [32,33]). In our study, we removed points with a reprojection error >0.6 pixels and with a reconstruction uncertainty >60. The native UAV georeferencing was not used for Tal village AOI. Here, GCPs were identified in the images, and the GCPs and model uncertainties were used to optimise (parameters: f, cx, cy, k1-k3, p1, and p2) the sparse point clouds to reduce the root mean square error (RMSE) (e.g., [34]). The model RMSEs were 1.12 m for Tal village and 6.54 m for the Pisang landslides model, which was processed using the native UAV image georeferencing and no GCPs (Table 2).
Open-access DEMs were downloaded for the AOIs, including High Mountain Asia (HMA) 8 m, Advanced Spaceborne Thermal Emission and Reflection Radiometer (ASTER) Global Digital Elevation Model (GDEM2) 30 m, AW3D30 (version 2.1) 30 m, and the non-void-filled Shuttle Radar Topography Mission (SRTM) 30 m. The HMA DEMs were derived using stereo imagery from DigitalGlobe’s satellite constellation collected from 28 January 2002 to 24 November 2016 and corresponding to either a single point in time or a mosaic of DEMs (HMA-Mos) with multiple timestamps to reduce data voids. We used a mosaic tile [35] for deriving the river channel at the Pisang Landslides AOI. A single along-track tile (13 September 2013) [36] was used to calculate the volume of the partial river-blocking landslide above Lower Pisang. The GDEM2 was derived using 15 m resolution stereo ASTER imagery collected from 2000 to 2010 [37]. The AW3D30 was derived from 2.5 m ALOS Panchromatic Remote-Sensing Instrument for Stereo Mapping (PRISM) imagery collected from 2006 to 2011, which was used to produce a 5 m commercial DEM that was resampled to 30 m for public distribution [18]. The SRTM was derived from the radar data collected in February 2000 [38]. The HMA and UAV DEMs used WGS84 reference ellipsoid elevations, which were converted to EGM96 geoid elevations before coregistration to match the GDEM2, AW3D30, and SRTM DEMs.
The HMA and SRTM DEMs did not cover Tal village. Additionally, the GDEM2 was excluded from Tal village analysis due to the prevalence of artifacts. The Pisang landslides UAV point cloud was generated without ground control, so we used a HMA DEM (15 March 2014) as the reference DEM for coregistration, which was carried out using iterative closest point (ICP) registration in CloudCompare using an octree subsampled point cloud. For Tal village, we used the UAV DEMs as the reference surface for coregistration. DEMs were coregistered in x, y, and z following the curve-fitting procedure described by Nuth and Kääb [39], which relates elevation differences due to geolocation errors to slope and aspect. Coregistration shifts were greatest for the GDEM2; however, a z shift of −142 m was required to shift the Pisang UAV DEM to the HMA DEM despite both being referenced to the WGS84 reference ellipsoid (Table S1). This offset is a common error for the DJI Phantom 4, potentially due to the drone recording an incorrect altitude position on startup due to differences between the inbuilt GNSS receiver and barometer. Comparisons between DEM products were derived by resampling fine-resolution DEMs to the resolution of the coarser-resolution product.

2.4. Applications

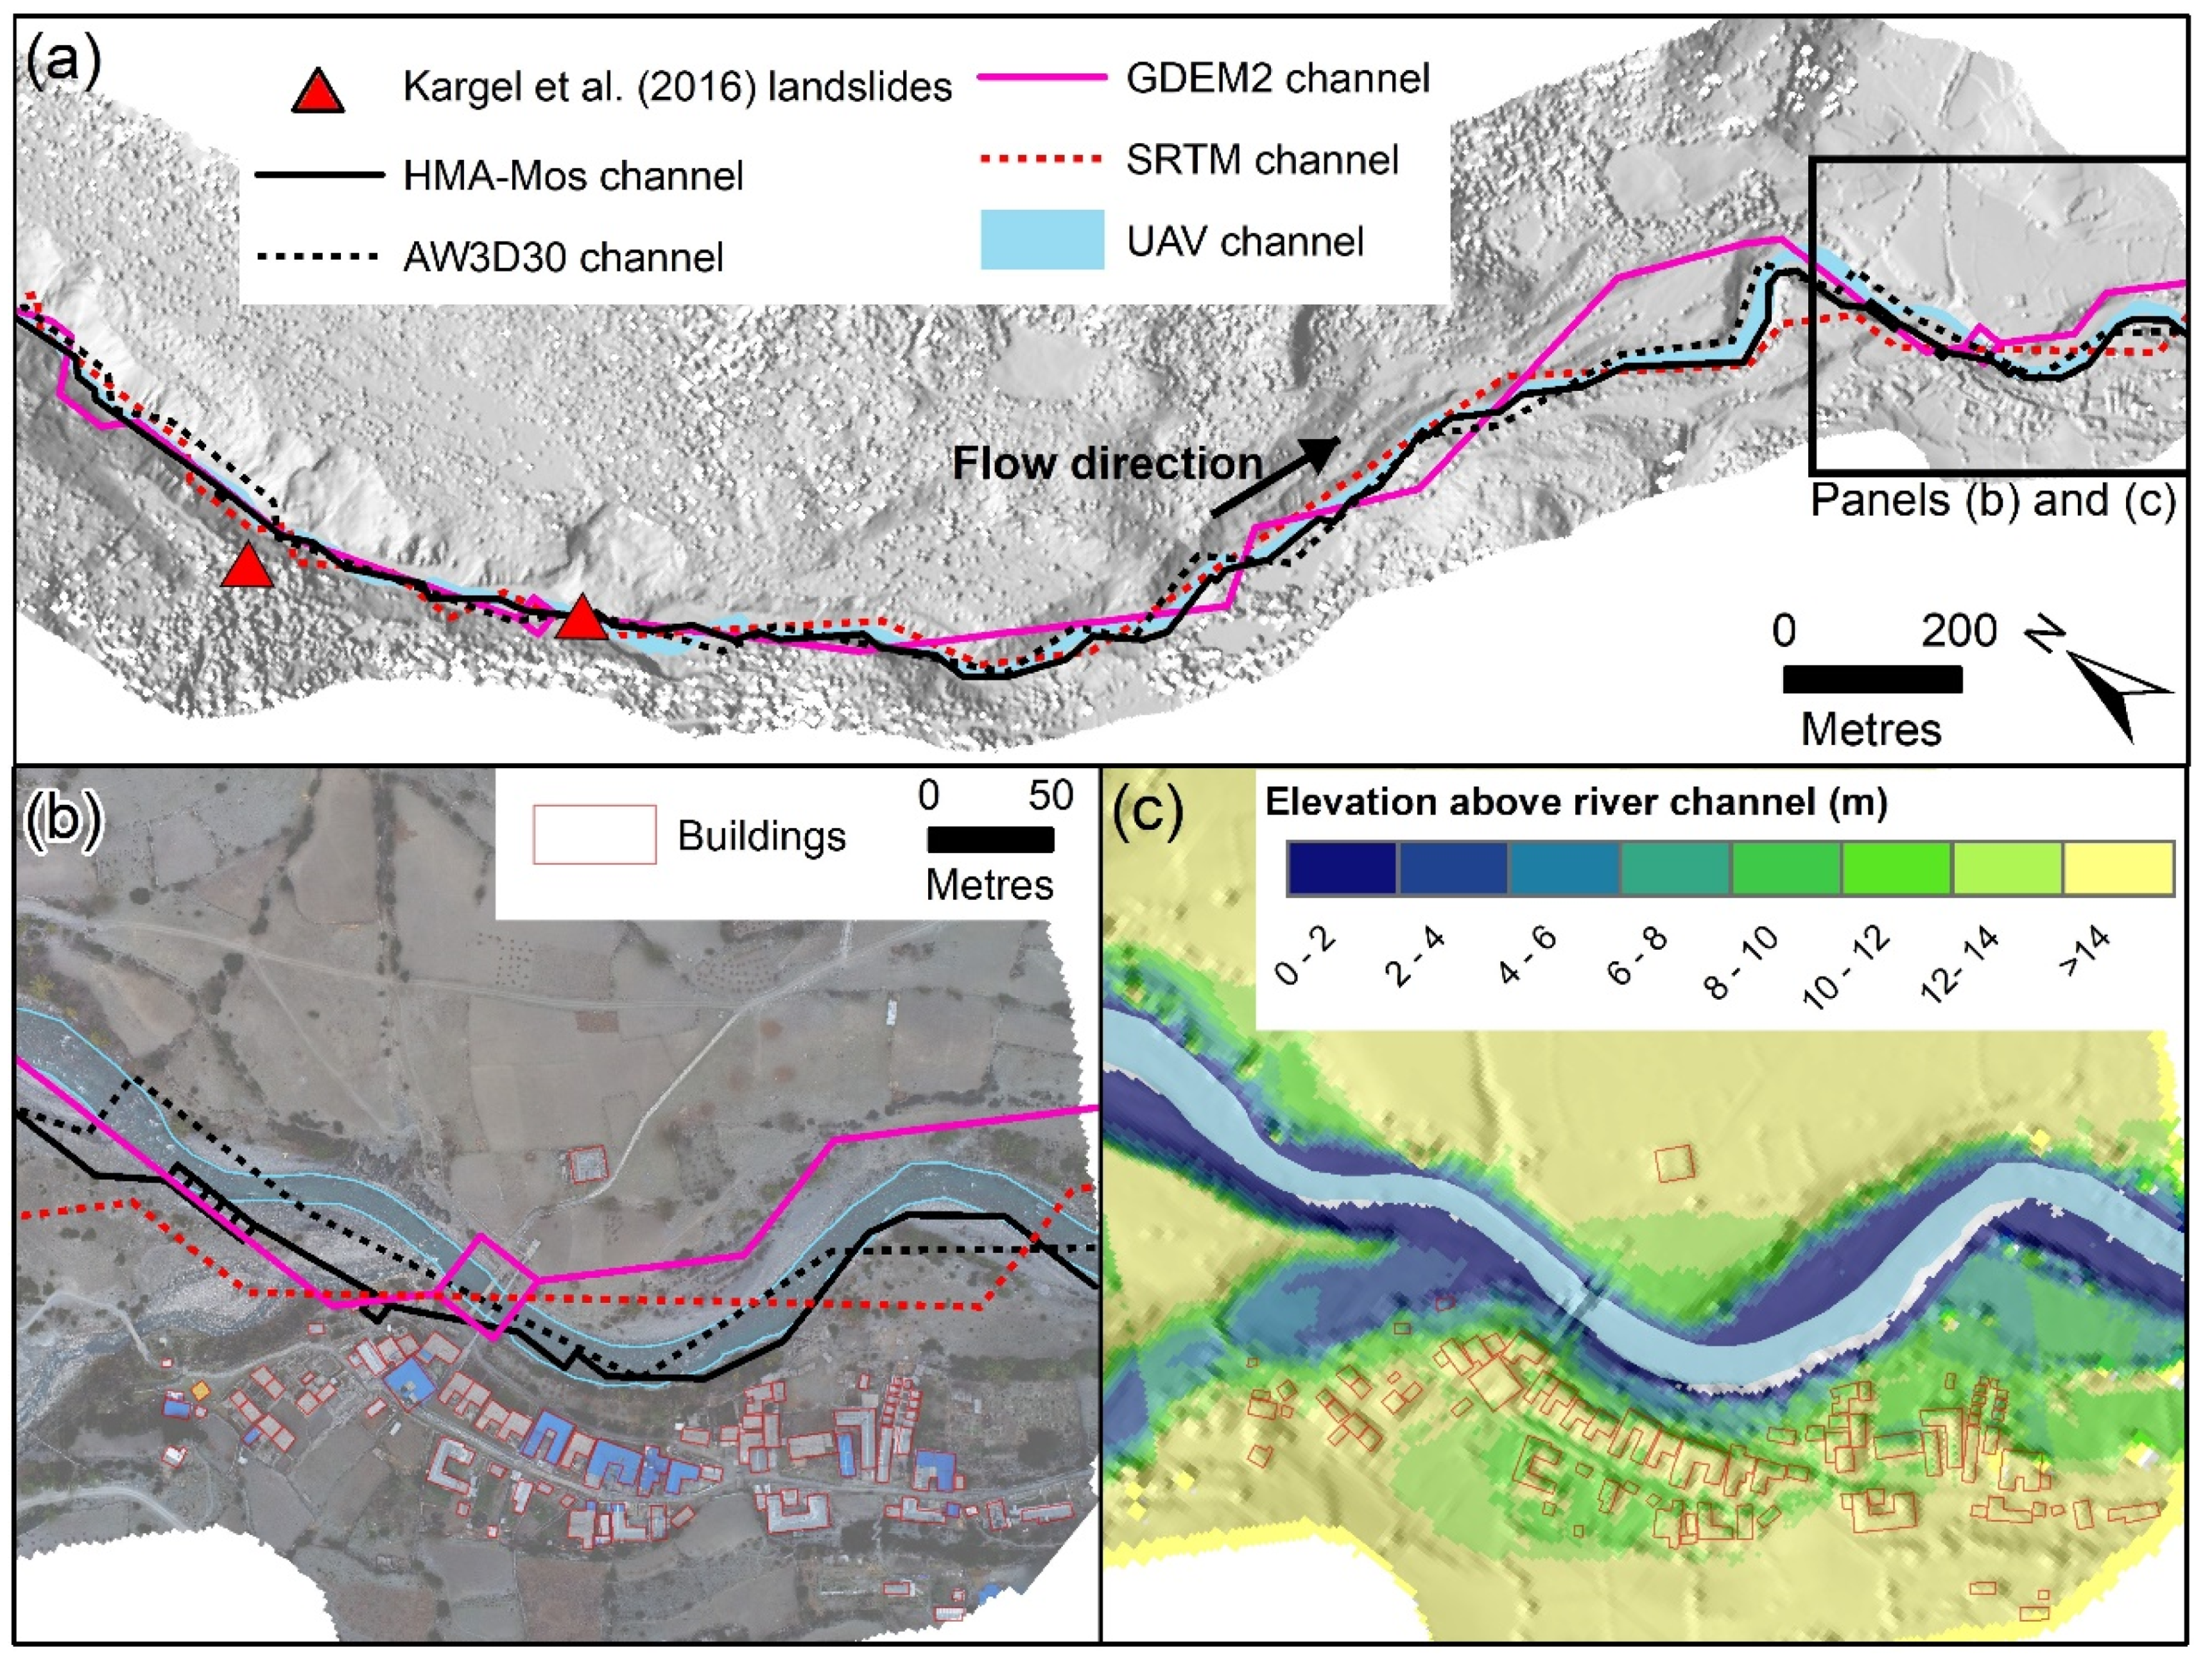
2.4.1. Elevation above the River Channel
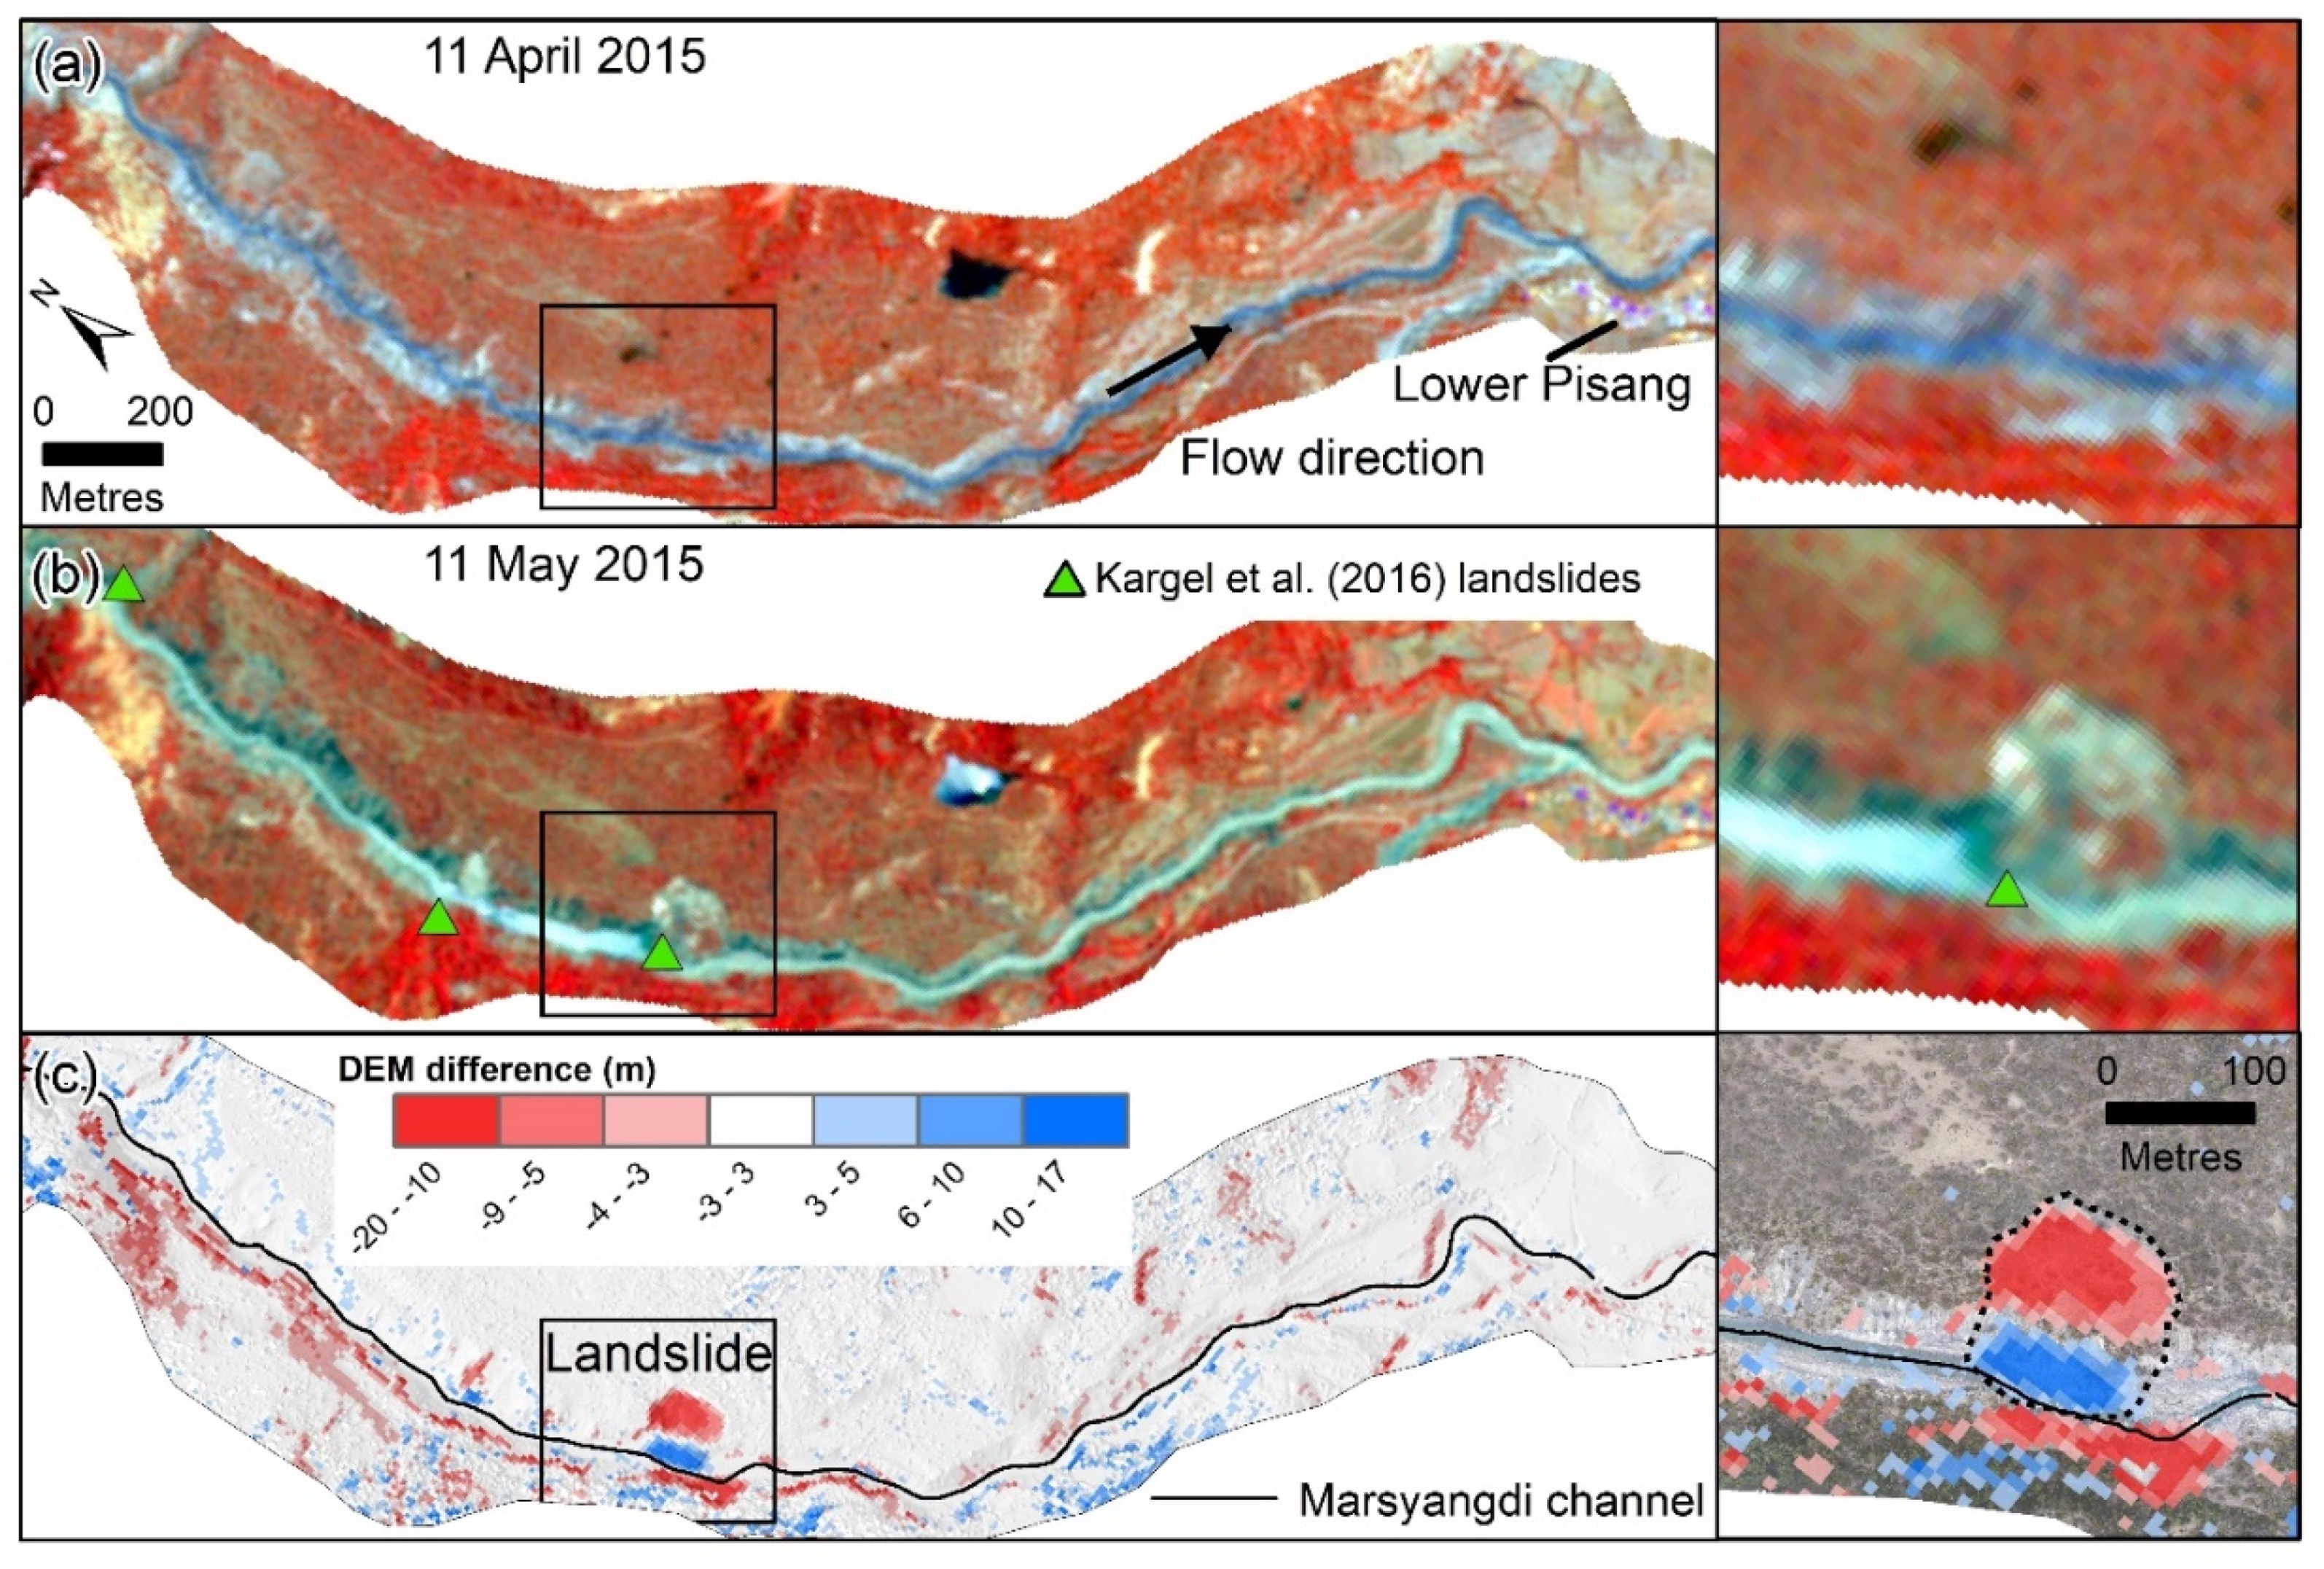
OpenStreetMap buildings data [40] were downloaded for Tal village and Lower Pisang AOIs and were validated and updated using the respective UAV orthophotos (0.2 m resolution). River channels were manually digitised using the UAV orthophotos and automatically delineated for all other DEMs using GIS hydrological tools (DEM fill, flow direction, and thresholded flow accumulation). The elevation of the terrain relative to the adjacent UAV- and DEM-derived river channels were derived for each DEM and used to extract the mean elevation of each building above the channel.

2.4.2. Landslides

A large landslide that partially blocked the Marsyangdi River following the 2015 Gorkha earthquake was manually digitised with reference to the UAV orthophoto and a DEM of difference (UAV April 2018 and HMA March 2014 DEM). The landslide volume was derived from the DEM of difference and was compared to a DEM of difference between two HMA DEMs (May 2015 and March 2014). Additionally, we simulated a complete river blockage by dams with heights of 5, 10, and 15 m close to the village of Lower Pisang. We selected a reach of the Marsyangdi River below the 2015 landslide so that the channel topography was not preconditioned by this river-damming event. For each DEM and dam height, we derived the area and volume of the lake that would form upstream if the dam was not downcut by the river (i.e., the lake was in equilibrium with the dam crest).

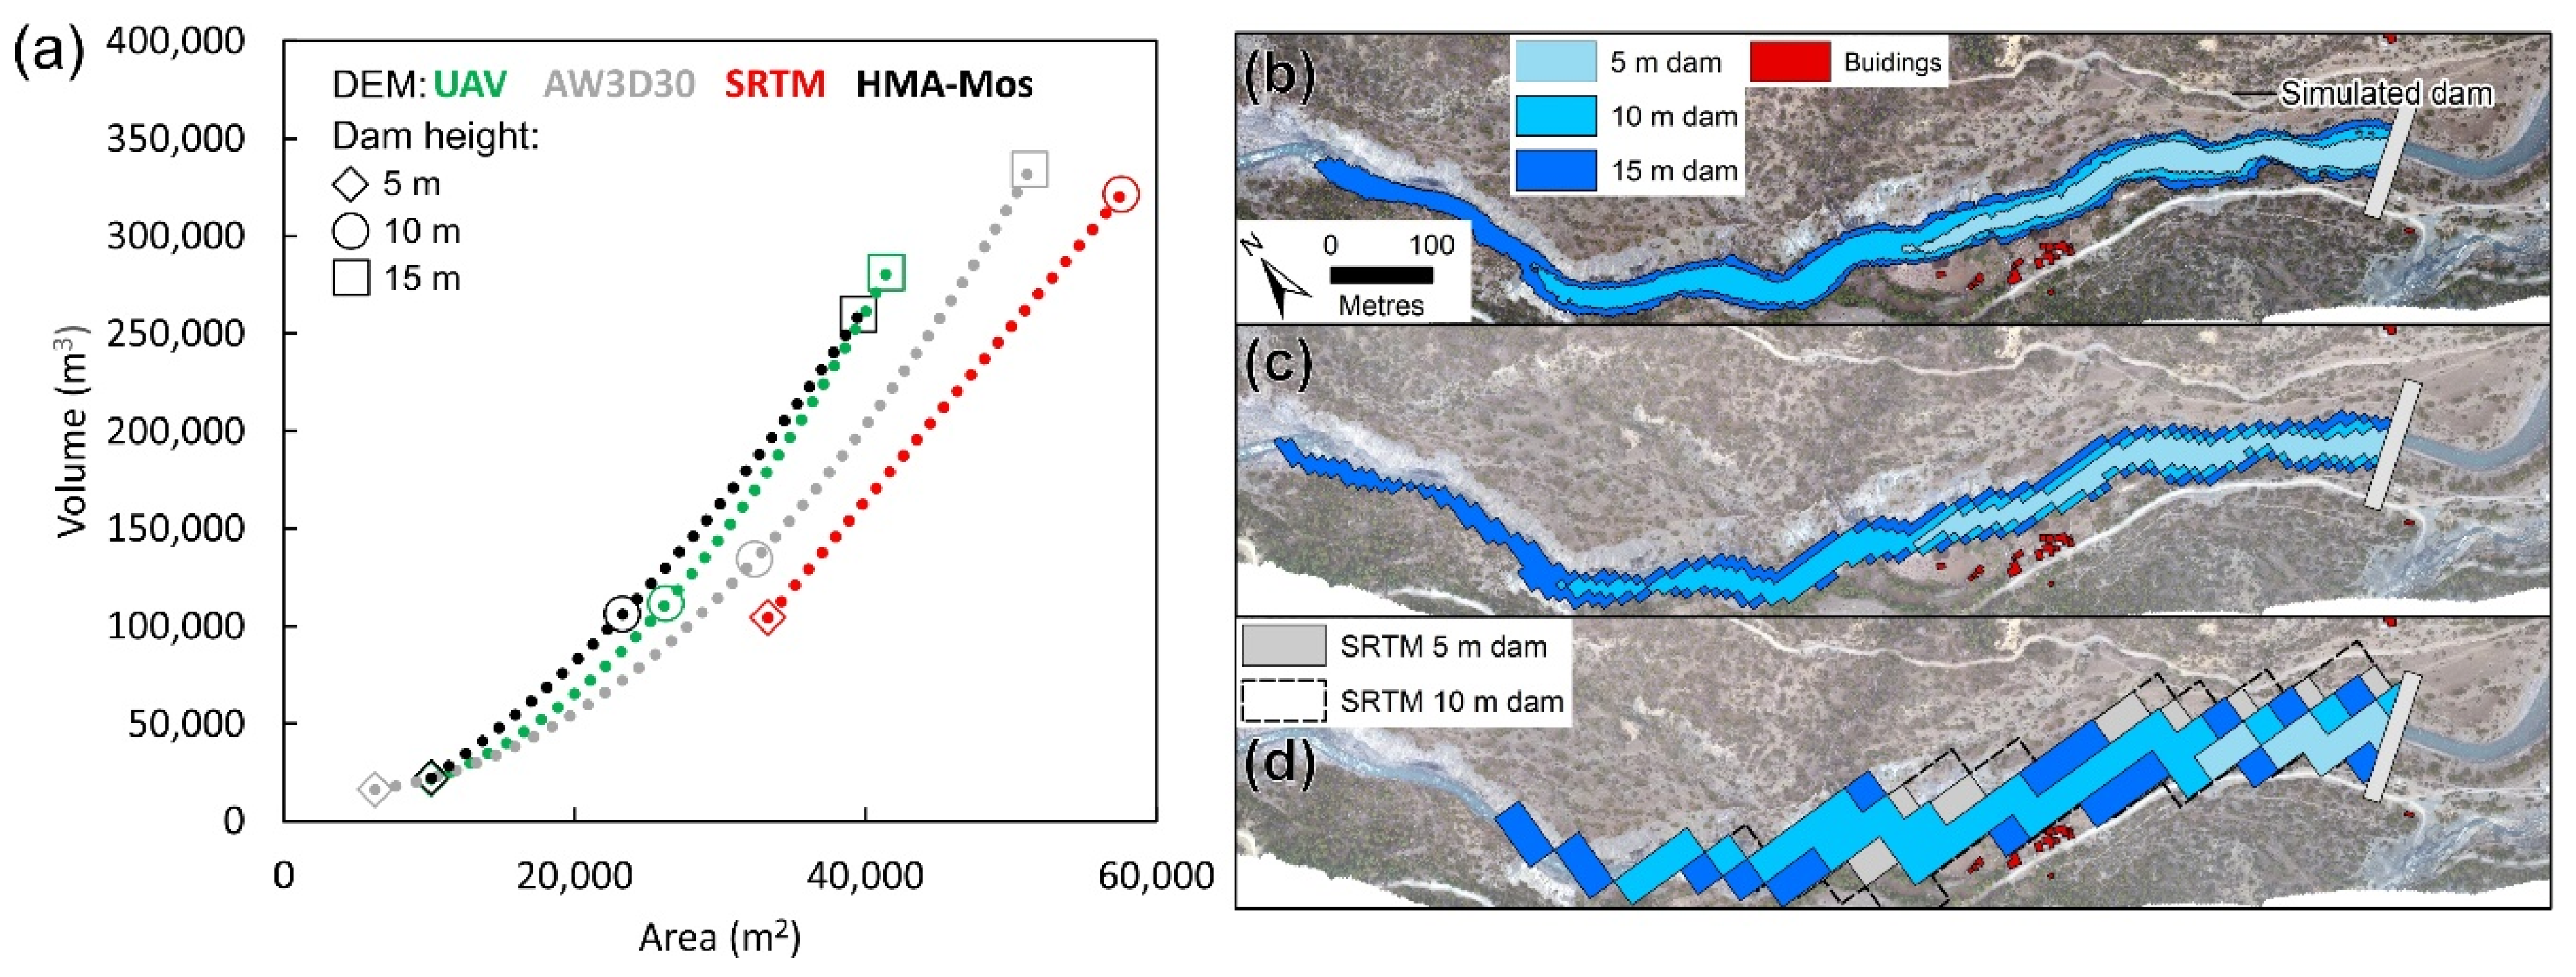
2.4.3. Outburst Flood

Three outburst floods were simulated along the Marsyangdi using a lake volume of 281,051 m3 and drainage following a triangle hydrograph with times to peak discharge (Qp) of 5, 10, and 20 min. The lake volume corresponded to a 15-m-high simulated dam on the Marsyangdi River (Section 2.4.1), which produced a lake of comparable length (1.1 km) to that reported by [5] following the 2015 Gorkha earthquake. Floods had peak discharges of 937, 468, and 234 m3 s−1 for simulations 1–3 respectively. A fourth simulation was carried out with a Qp of 1874 m3 s−1, which represented a doubling of lake volume to 562,102 m2 draining with a time to Qp of 10 min. Upstream landslide-dammed lakes were identified by [5] that could have caused a cascading hazard. Therefore, we took Simulation 4 to be a worst-case scenario. Simulations were carried out in HEC-RAS 5.0.5 (2D) using the UAV-derived 2 m DEM. Manning’s n values were allocated to land cover classes following [41] and inspection of the UAV-derived orthophoto (channel = 0.04, sparse tree coverage = 0.06, woodland = 0.1, urban area = 0.1, bare ground and agricultural land = 0.03). The flood models did not consider sediment entrainment or bank erosion.

2.5. Uncertainties

For each DEM of difference, we calculated the standard error (SE) of the mean difference:
SE = S D n
where SD is the standard deviation of the DEM of difference, and n is the number of included pixels.
n = N t o t × P S 2 d
Ntot is the number of DEM difference points, PS is the pixel size, and d is the distance of spatial autocorrelation, conservatively taken to be 600 m [42]. The SE and mean elevation difference (MED) were used to derive the final uncertainty (e) (e.g., [42,43]).
e = S E 2 + M E D 2
We excluded the area of landslide activity in the Pisang landslides AOI and elevation changes exceeding 50 m, which were assumed to be outliers.

3. Results

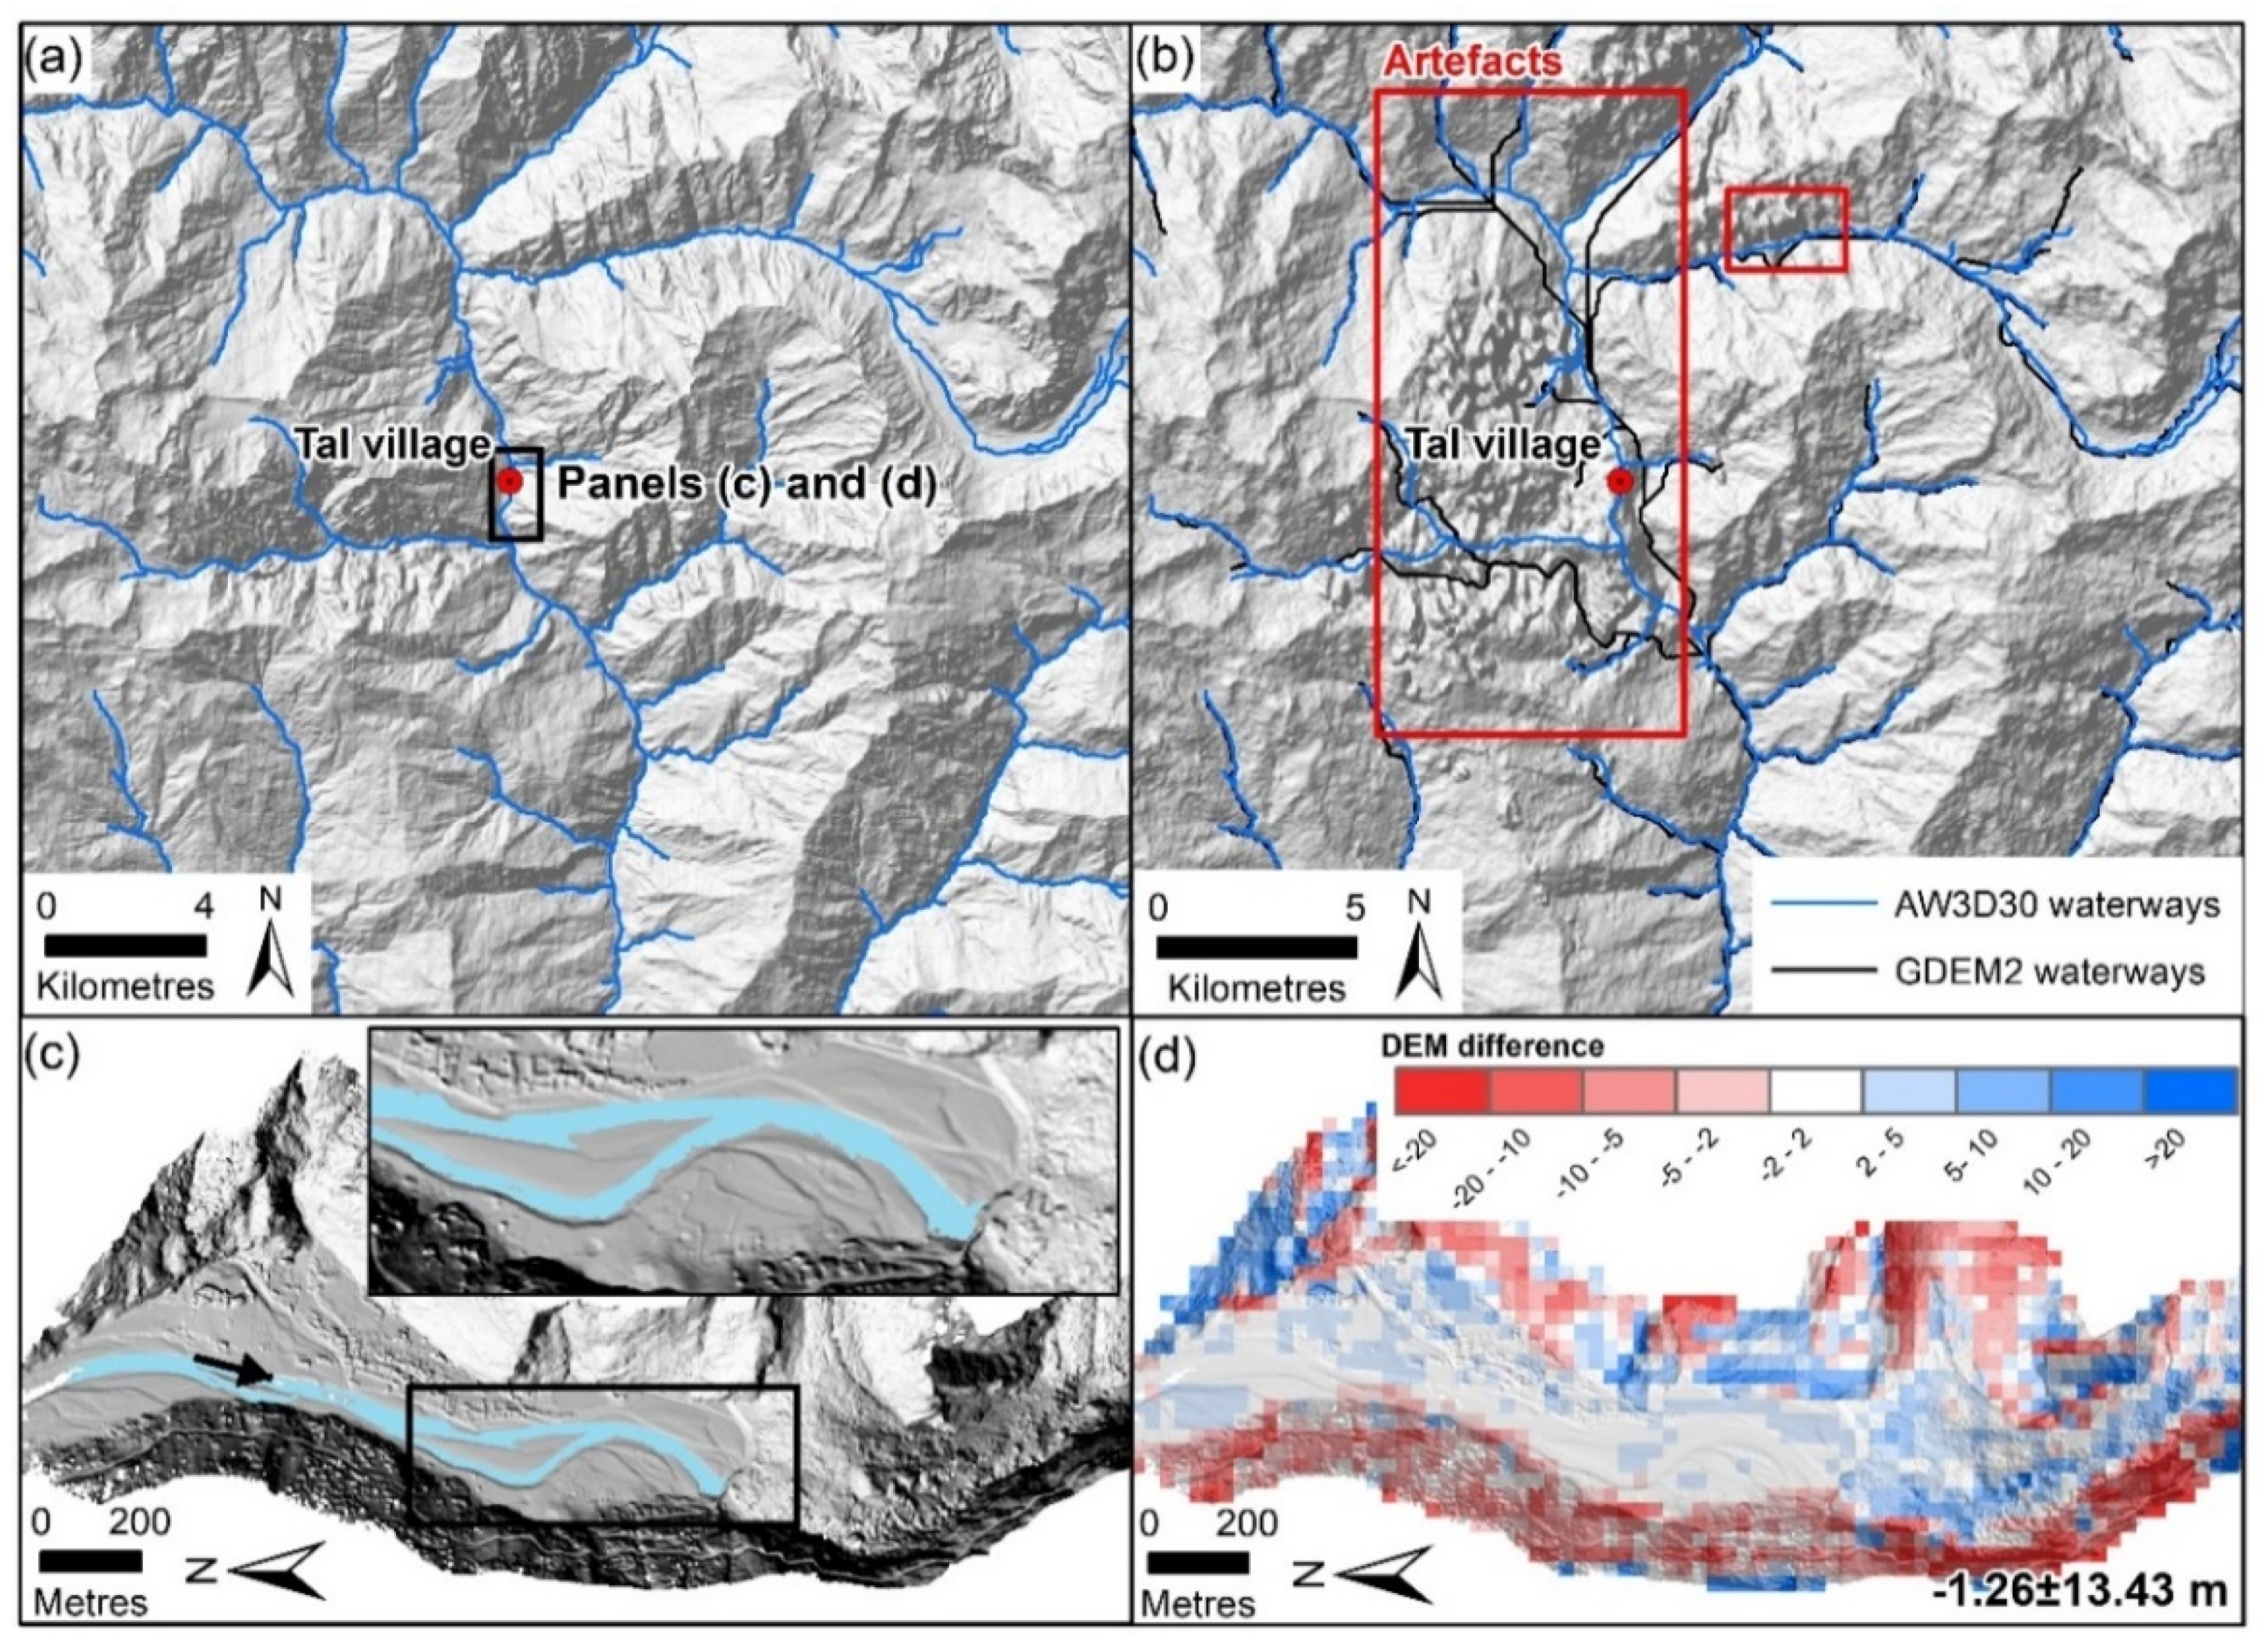
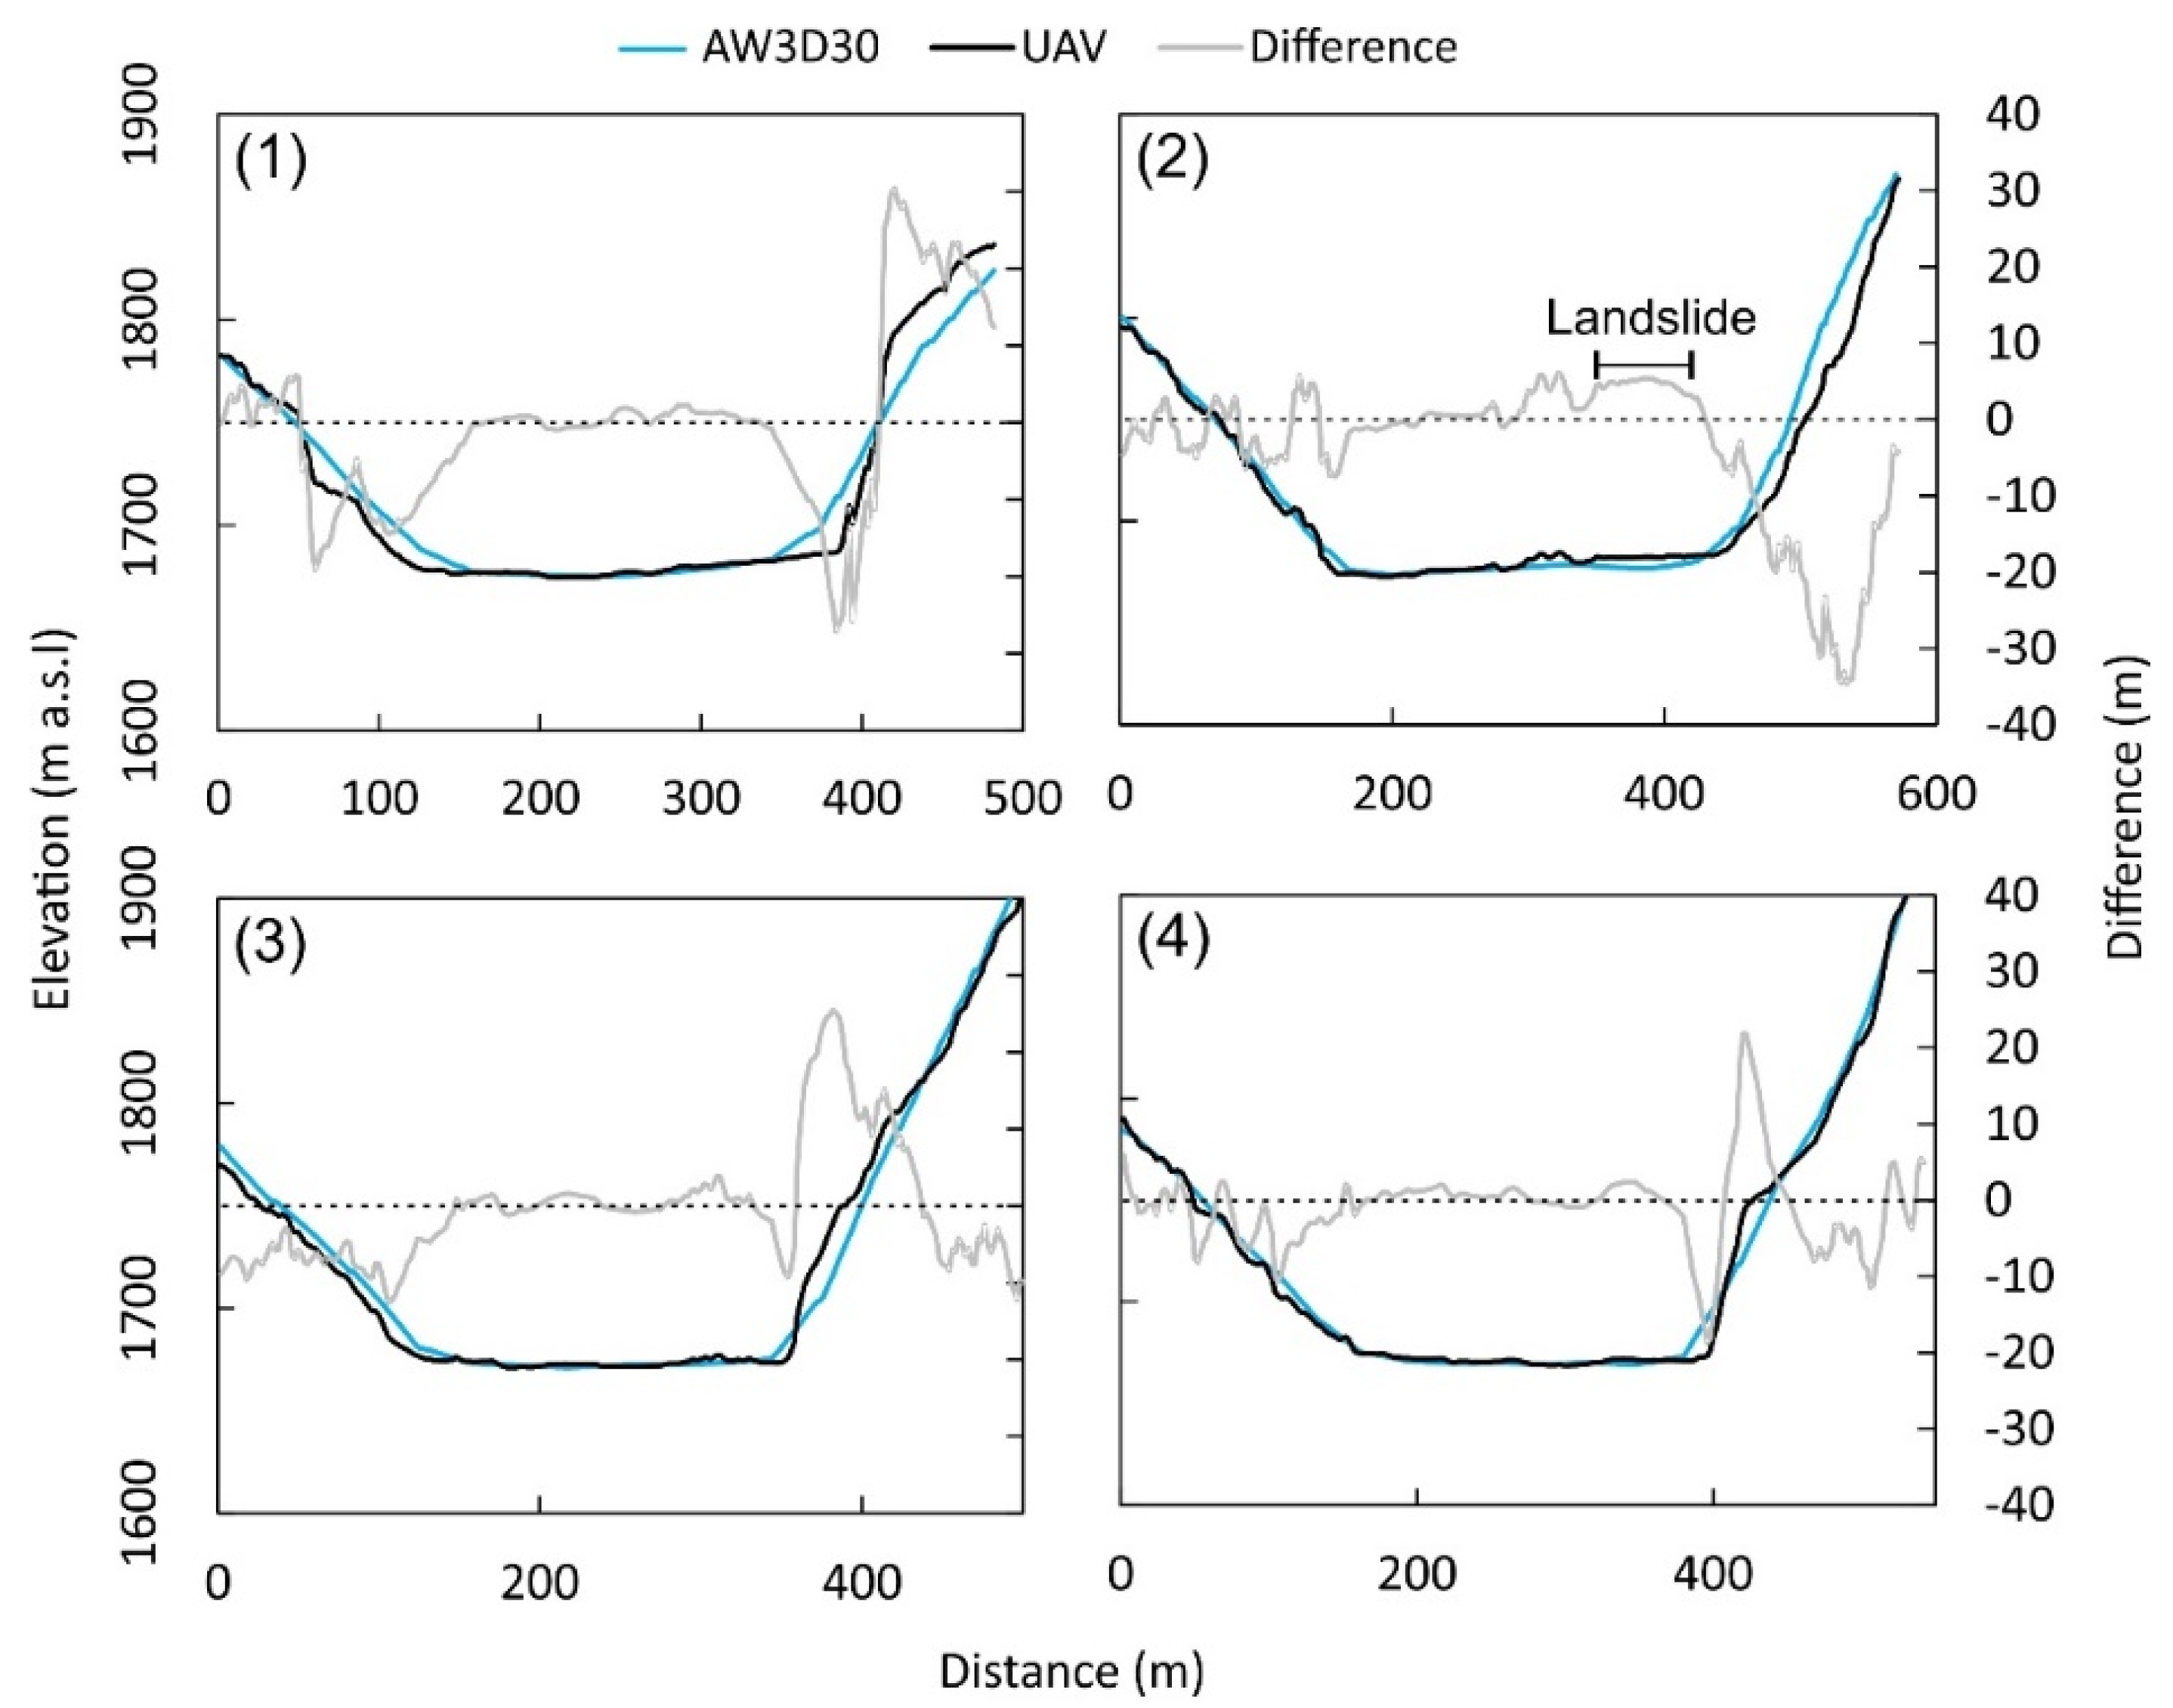
3.1. DEMs of Difference

The GDEM2 had the highest standard deviations and uncertainty in each AOI (Table 3). For the Pisang Landslide DEMs of difference, the GDEM2 had a standard deviation of 12.26 m compared to 7.88 m, 7.74 m, and 2.61 m for the AW3D30, SRTM, and HMA DEMs, respectively.
The GDEM2 was not used in Tal village analysis due to the prevalence of artifacts (Figure 2), which were likely caused by persistent cloud cover. The artifacts caused a deviation of the GDEM2 delineated river channels from the AW3D30 channels by hundreds of metres, in some cases exceeding a kilometre (Figure 2b). By comparison, the AW3D30 was closely geolocated to the UAV DEM, with shifts of −2, −1, and −6 m in x, y, z applied during the coregistration (Table S1). The low gradient floodplain of Tal village was within ±2 m vertically between the UAV and AW3D30 DEMs (Figure 2d).

3.2. Applications

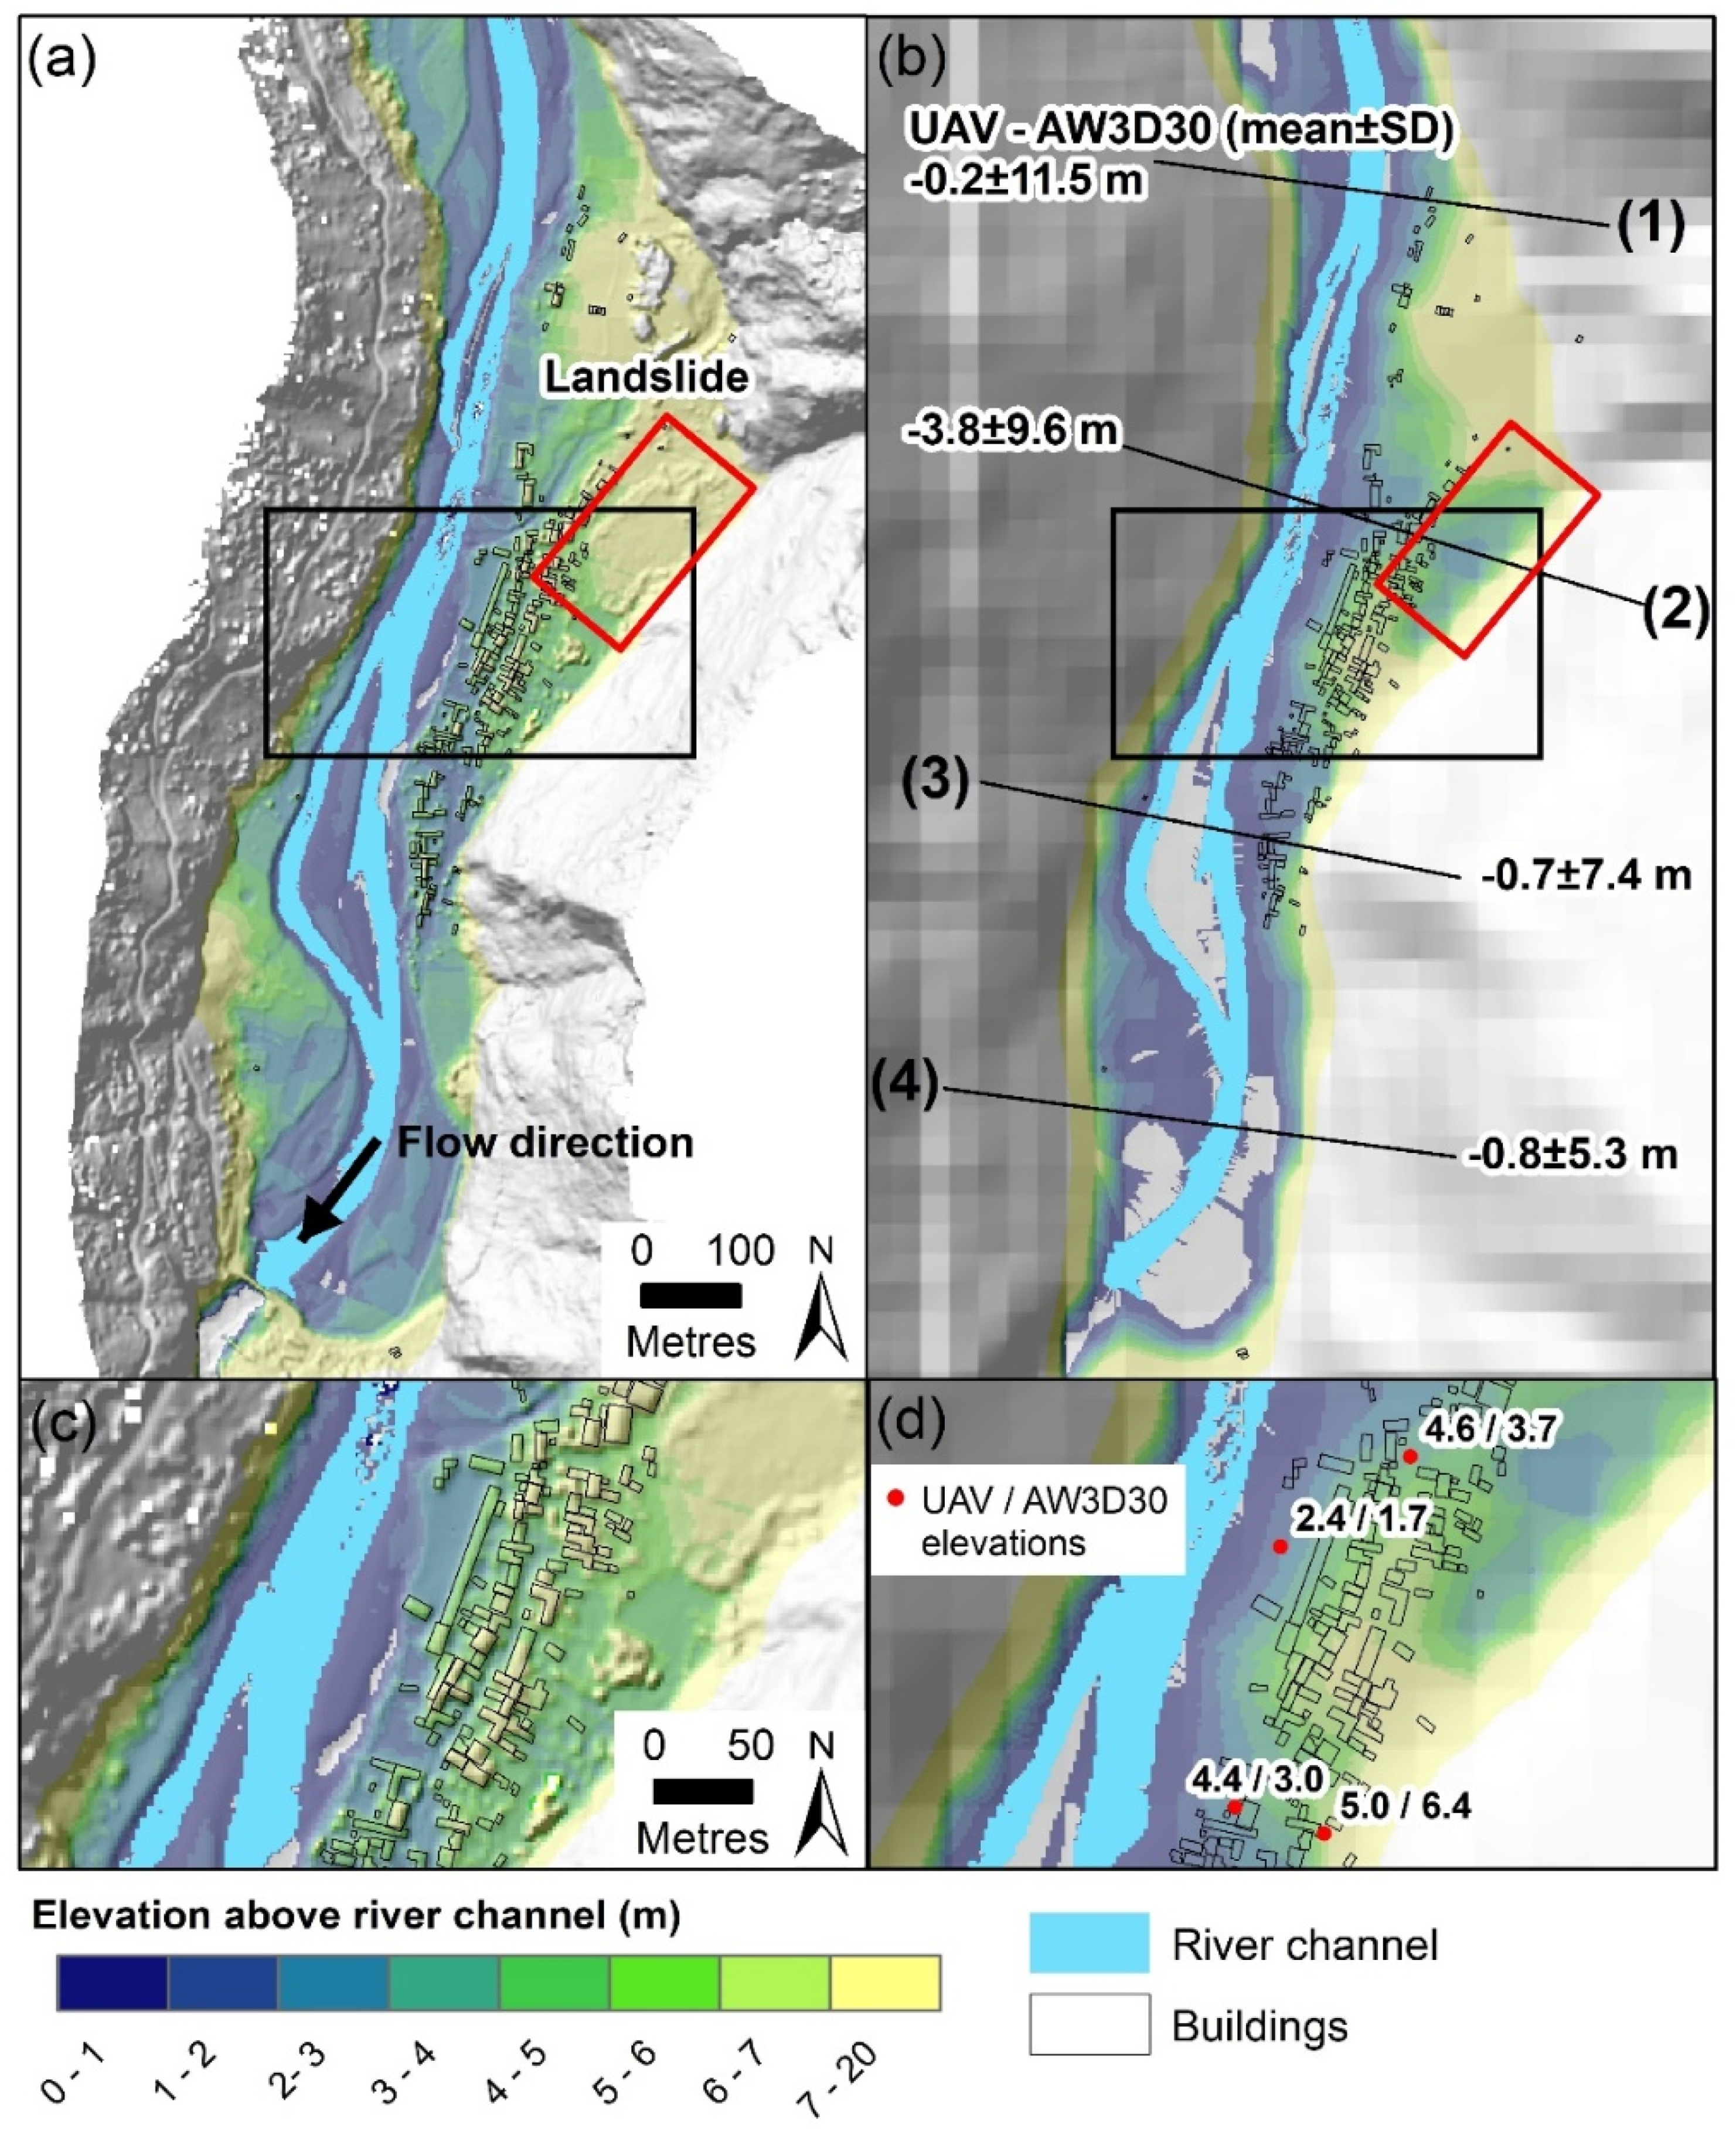
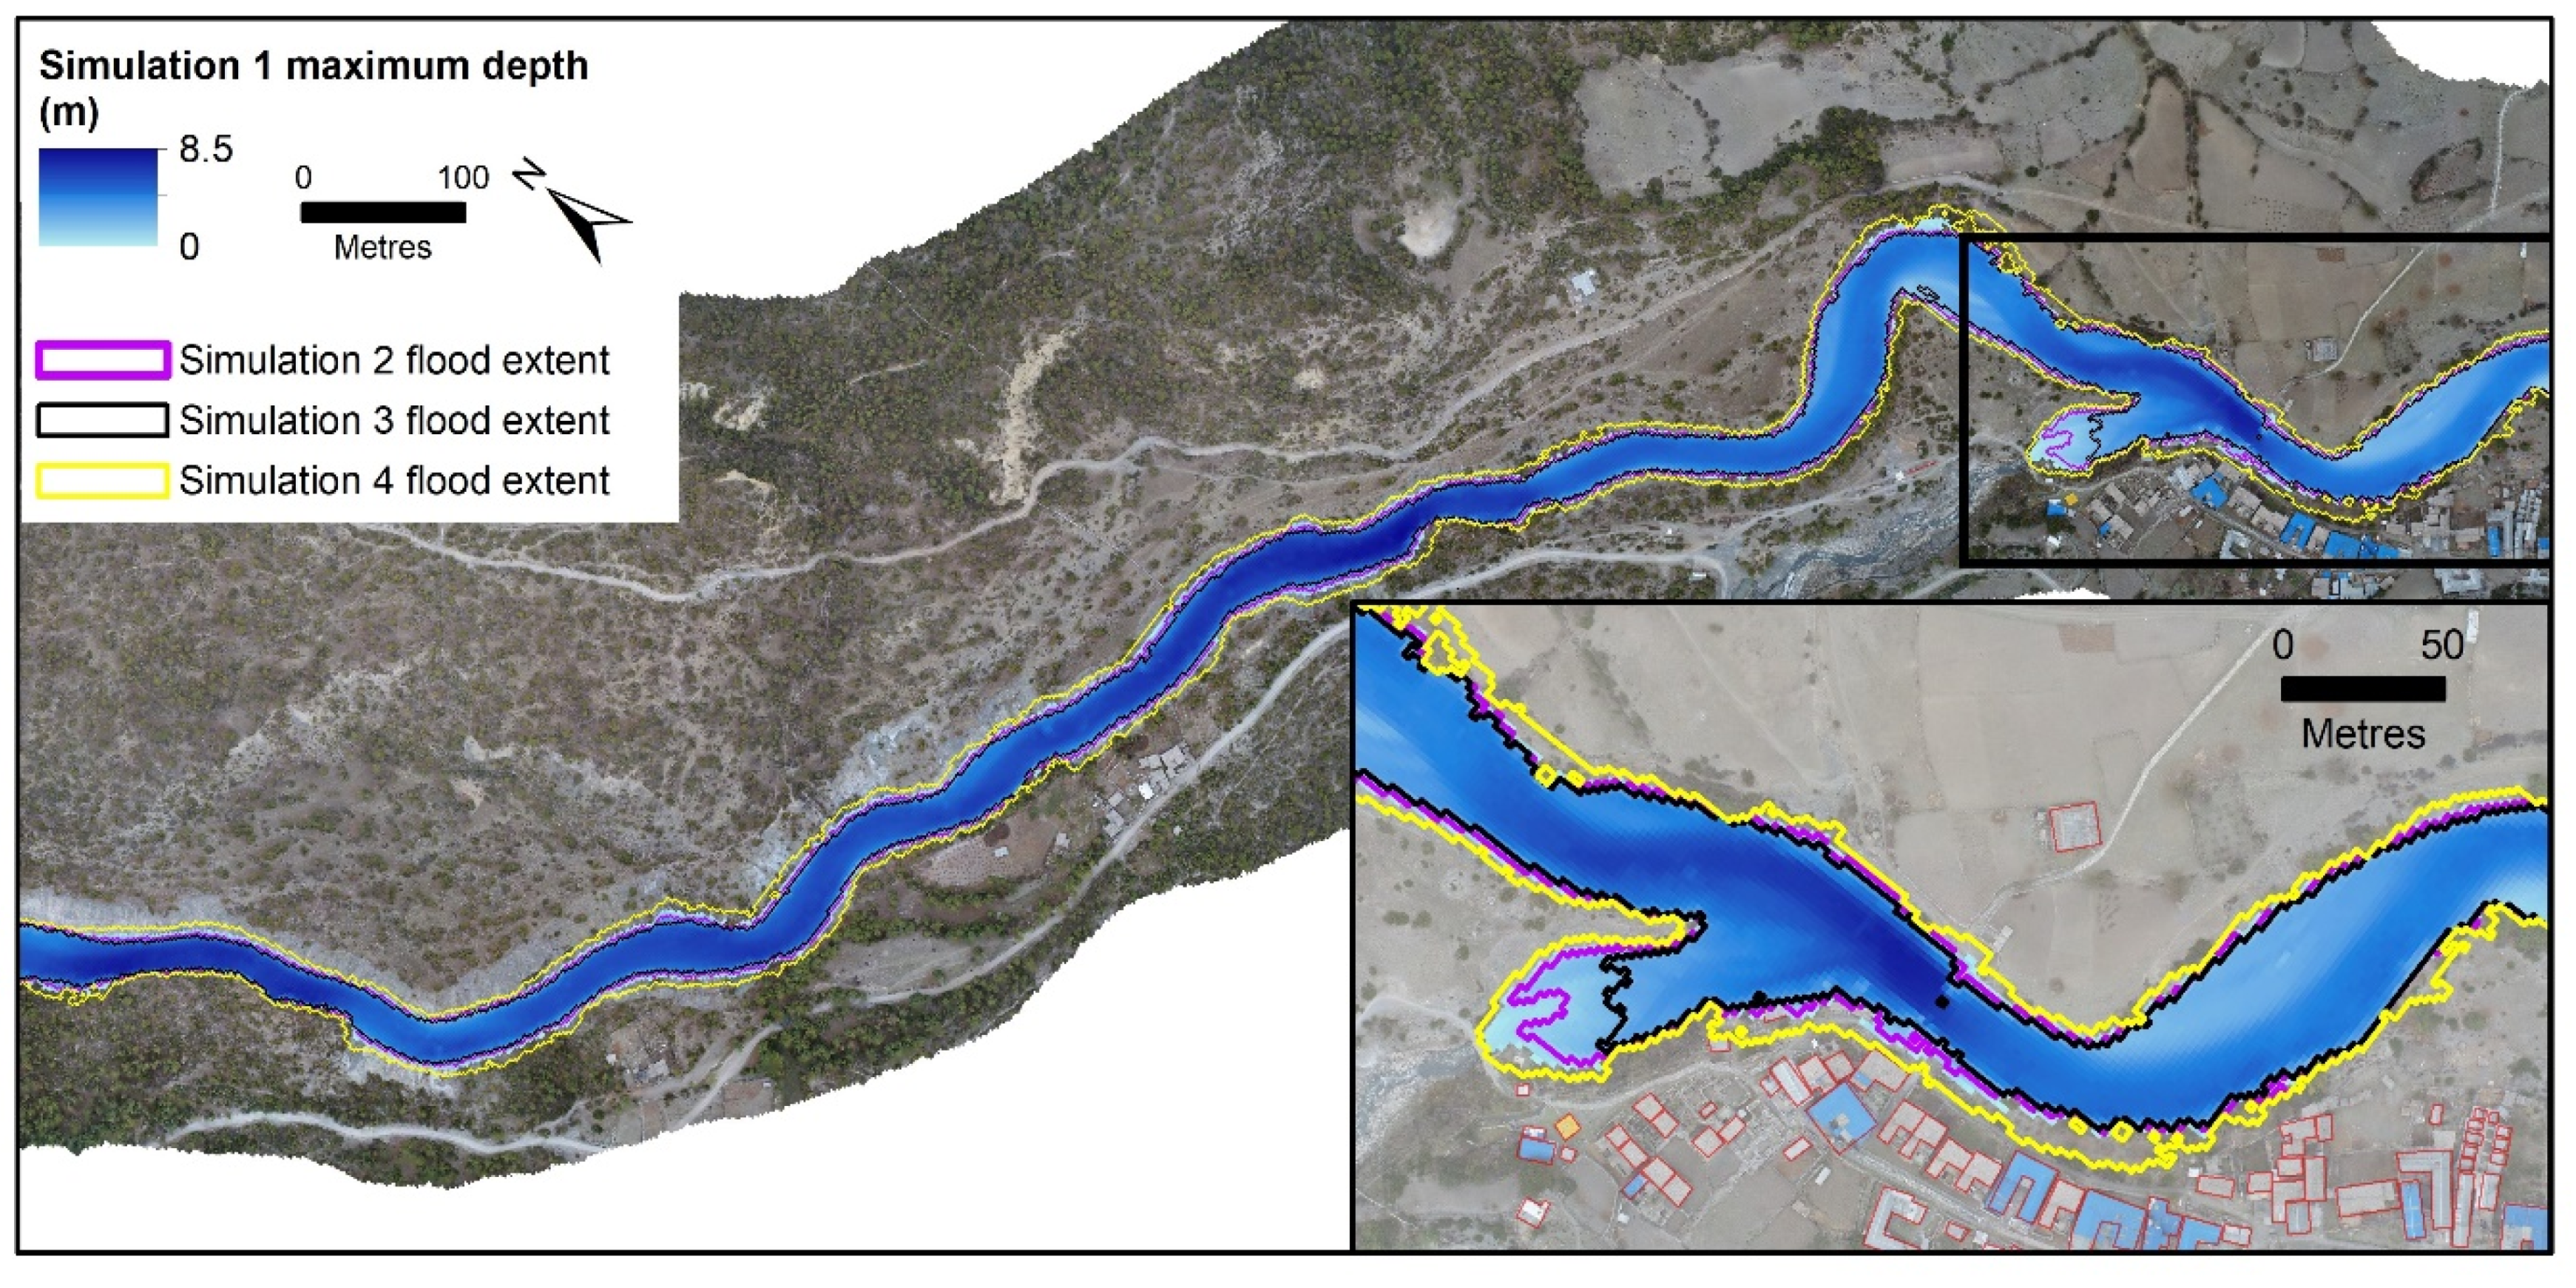
3.2.1. Flood Assessment
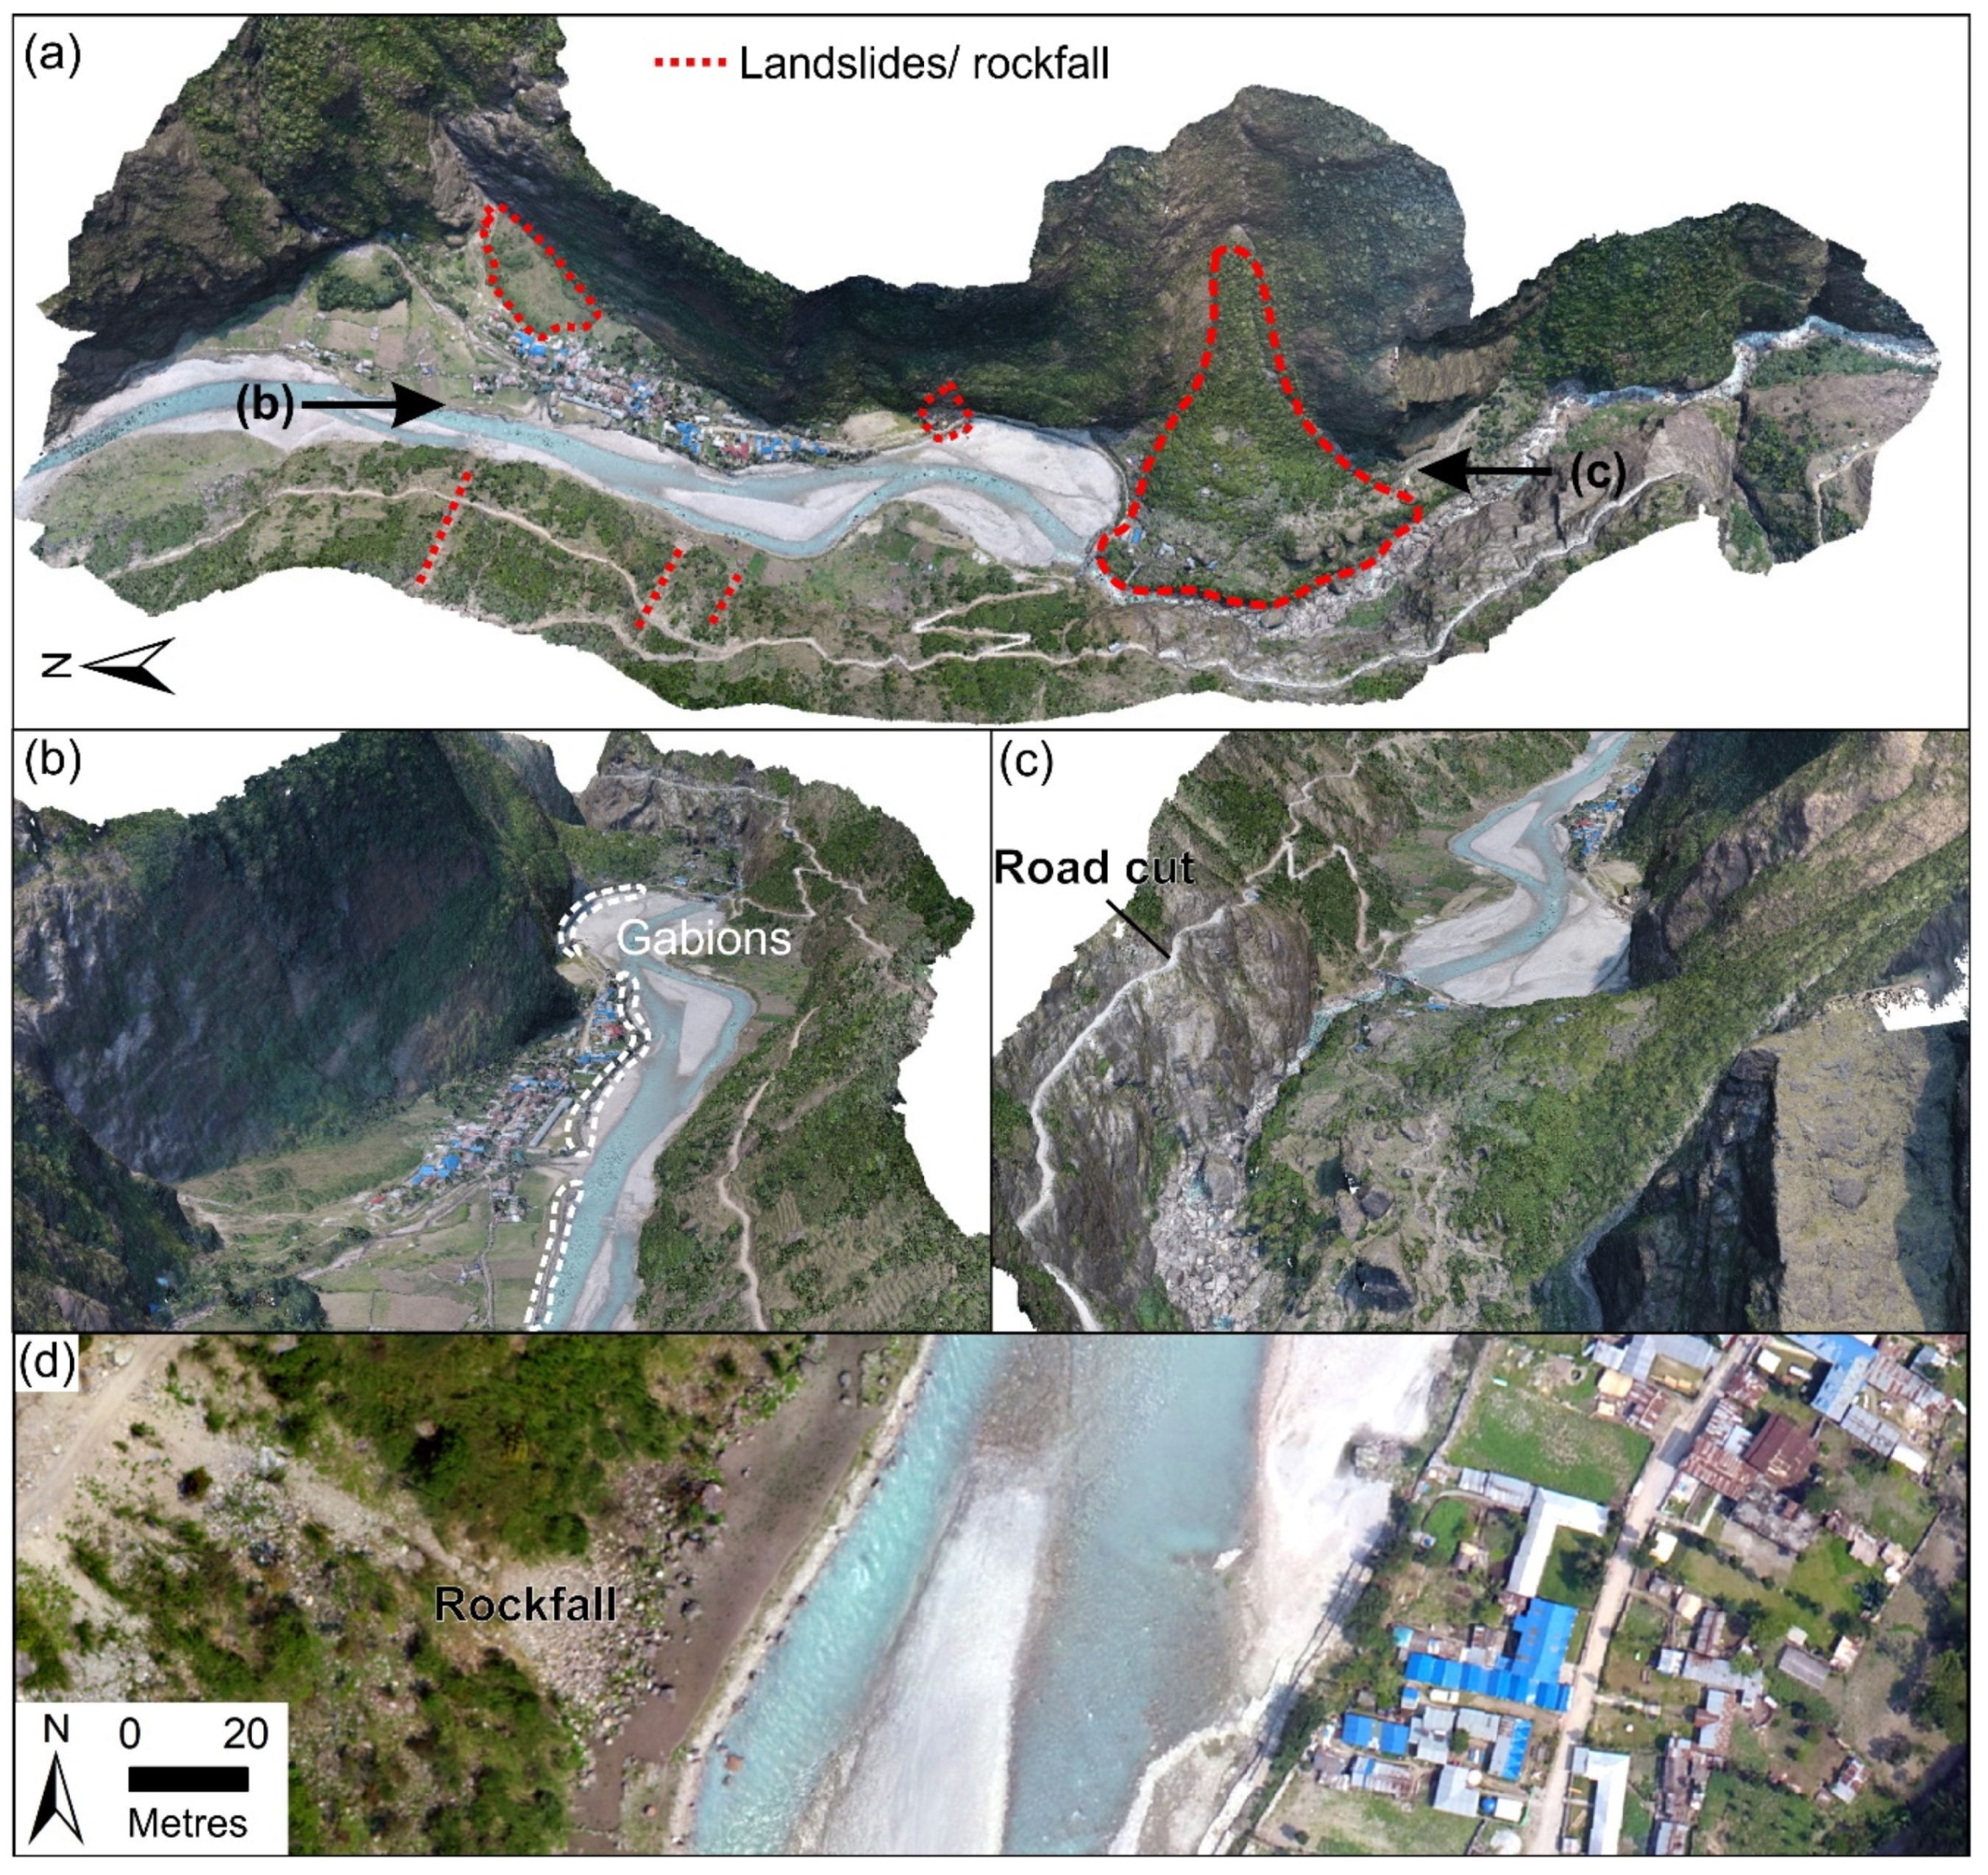
Tal village is confined by the Marsyangdi River to the west, steep cliffs to the east, and numerous landslides have occurred in the AOI (Figure 3). The large landslide viewed in Figure 3c occurred <1000 years ago and blocked the Marsyangdi River, forming a landslide-dammed lake [44]. The village is now situated on the low-gradient valley bottom that represents the lake infill. Gabions are situated along the edge of the agricultural land and the centre of the village to protect against high water levels during the summer monsoon (Figure 3b). There were 68 buildings present in the OpenStreetMap dataset [40], which was updated to 213 buildings using the UAV-derived orthophoto (e.g., Figure 3d). The mean building elevation above the river channel was 6.9 ± 2.0 m for the UAV DEM and 4.4 ± 1.6 m for the AW3D30 DEM (Figure 4). Individual buildings were resolved in the 2 m UAV DEM (Figure 4c,d); therefore, the UAV-derived building elevations above the river channel represent a roof-top height. However, it is clear that the AW3D30 DEM provided a good representation of the low-relief valley bottom and that the greatest deviation from the UAV DEM was on the steep valley slopes (Figure 5).
Similar to Tal village, the mean building elevation above the river channel was highest in the UAV DEM for Lower Pisang village (mean relative elevation of 16.0 ± 5.2 m; Table 4, Figure 6). The SRTM had the lowest mean relative elevation (6.1 ± 4.9 m), and the HMA-Mos (14.2 ± 5.7 m) was closest to the UAV DEM. The minimum building elevation above the river channel was 1.8 m for the UAV DEM, although it was not clear if this was an outbuilding or occupied home.
DEM-derived river channels were compared to those that were digitised manually using the UAV orthophoto. The HMA-Mos channel was closest to the UAV channel (mean distance of 3.1 ± 5.6 m), and the GDEM2 was the furthest (16.7 ± 19.5 m) (Table 4). All DEM-derived river channels had maximum deviations from the UAV channel exceeding 30 m.

3.2.2. Landslides

A landslide occurred on the Marsyangdi River ~1.5 km upstream from the village of Lower Pisang following the 2015 Gorkha earthquake (Figure 7). The landslide constricted the channel and formed a lake. The slump of the channel bank and deposition of the mass in the river was visible in the DEM of difference between the UAV and HMA DEMs (Figure 7c). The volume of mass loss was 83,100 m3. Considering both mass loss and the channel deposition, the volume change was −37,600 m3, suggesting that ~45,500 m3 of material was removed between the date of the landslide and the UAV survey. A DEM of difference between two HMA DEMs (May 2015 and March 2014) suggested a comparable but lower mass loss of 68,000 m3, indicating that additional slumping likely occurred in the years following the initial landslide.

3.2.3. Landslide-Dammed Lake

The area and volume of landside-dammed lakes corresponding to dam heights of 5, 10, and 15 m were simulated using each DEM. The HMA DEM lake was most similar with the UAV DEM lake (Figure 8), followed by the AW3D30. The SRTM DEM produced lakes of much greater area and volume than the UAV DEM, and the 5 m high SRTM dam had a comparable volume to the 10 m dam scenario for the other DEMs. The 15 m dam was not simulated for the SRTM, nor were any dams for the GDEM2, since the simulated dams were circumvented laterally by the lakes.
The simulated floods with peak discharges of 937, 468, and 234 m3 s−1 were contained within the river banks and did not inundate the village of Lower Pisang (Figure 9). Similarly, the worst-case scenario (Simulation 4, Qp = 1874 m3 s−1) did not inundate the main village. Simulation 4’s flood wave reached Lower Pisang in five minutes, and depths peaked within nine minutes. By contrast, for Simulation 3 with the lowest Qp, these times were 12 and 25 min, respectively.

4. Discussion

4.1. DEM Differences

A GDEM validation study found the standard deviation of elevation differences for the GDEM2 in forested mountainous terrain to be 12.7 m [45], which compared to 12.3 m observed in the Pisang landslides AOI in the study (Table 3). Purinton and Bookhagen [46] used >300,000 differential GPS measurements over a 4000 m elevation range to evaluate the performance of the AW3D30, GDEM2, and SRTM and similarly observed the highest uncertainty in the GDEM2. The effective horizontal resolution of the GDEM2 is reported to be 72 m [45], which is ineffective for capturing rapidly varying or steeply sloping topography, similar to the initial release of the SRTM at 90 m resolution [47]. By contrast, the UAV, HMA, and AW3D30 products were derived from finer resolution imagery (all <3 m resolution).
The similarity between the UAV and HMA DEMs for the Pisang landslides AOI (Table 3) shows the benefit of conducting UAV surveys even if ground control is unavailable. In this case, the high initial model RMSE (6.54 m) due to poor native UAV image georeferencing was reduced to 3.54 m (Table 2) through coregistration to the HMA DEM. The increasing availability of real-time kinematic (RTK) positioning-enabled UAV will further reduce the requirements for extensive ground control point surveys (e.g., [48,49]). It is clear that HMA DEMs represent an important new baseline topographic dataset for the Himalaya but still lack the spatial completeness of other open-access global DEMs.

4.2. Landslides

A landslide on the Marsyangdi River that occurred three to six days after the 2015 Gorkha earthquake partially constricted the channel and formed a landslide-dammed lake [5]. We estimated the volume of this landslide to be 83,100 m3 from the UAV (April 2018) and HMA (March 2014) DEM of difference (Figure 7). A DEM of difference between two HMA DEMs (May 2015 and March 2014) suggested a mass loss of 68,000 m3 for the same landslide. The time difference between the DEMs precludes a direct comparison between these volumes; however, it is possible that additional slumping occurred in the additional three years before the UAV survey, which could explain the larger estimated volume loss.

4.3. Flood Assessment and Landslide-Dammed Lakes

Global DEM products are commonly used for flood modelling (e.g., GLOFs) in the absence of finer-resolution data [12,50,51,52]. However, the spatial resolution and vertical uncertainty is often comparable to the flood depth since steep Himalayan river valleys can be poorly resolved in the DEMs. Unresolved valley bottoms lead to an overestimation of river water levels [12,50,53] and would inflate the predicted socioeconomic flood vulnerability since buildings, bridges, and roads, are vertically closer to the channel (e.g., Figure 4d, Table 4). In contrast, the resolution achievable in UAV-derived fine-resolution elevation maps and orthophotos permits easy interpretation and incorporation into local planning policy to determine evacuation routes, areas of refuge, or sites where development should be restricted due to flood hazard.
Landslides formed several lake impoundments along the Marsyangdi River following the 2015 Gorkha Earthquake, leading to concerns that breaches could cause the inundation of Lower Pisang village ~1.5 km downstream [5]. We simulated landslide-dammed lakes on a reach of the Marsyangdi River to quantify the role of DEM product on the resulting lake area and volume. Lakes simulated using the HMA-Mos and AW3D30 DEMs displayed the closest similarity with the UAV DEM (Figure 8), whereas the GDEM2 and SRTM were unsuitable for dam simulation due to poor vertical representation of the river channel. Our UAV DEM suggested a mean building elevation relative to the river channel of 16.0 ± 5.2 m in Lower Pisang (Figure 6c). Flood modelling revealed that the lakes that formed on the Marsyangdi following the 2015 Gorkha earthquake did not pose an inundation hazard to Lower Pisang village in the event of a catastrophic breach. However, bank erosion, which was not considered in the model, could have been a problem due to the close proximity of the village to the banks. Fine-resolution topography was not available at the time of initial hazard assessment following the earthquake. Therefore, acquisition of imagery for processing in a SfM-MVS workflow from UAVs, light aircraft, or helicopters is high priority in countries with high hazard frequency like Nepal, where fine-resolution DEMs are lacking. Flood modelling scenarios along the reach of the Marsyangdi River collectively took less than two hours to run, with an initial setup time of ~1 h. These simulations can be completed in a timely manner with access to an appropriate DEM and information on the hazard characteristics. Therefore, integrating UAV surveys into disaster response frameworks can improve real-time and short-term decision-making, and produce contemporary topographic and socioeconomic data with longer-term benefits (Figure 10).

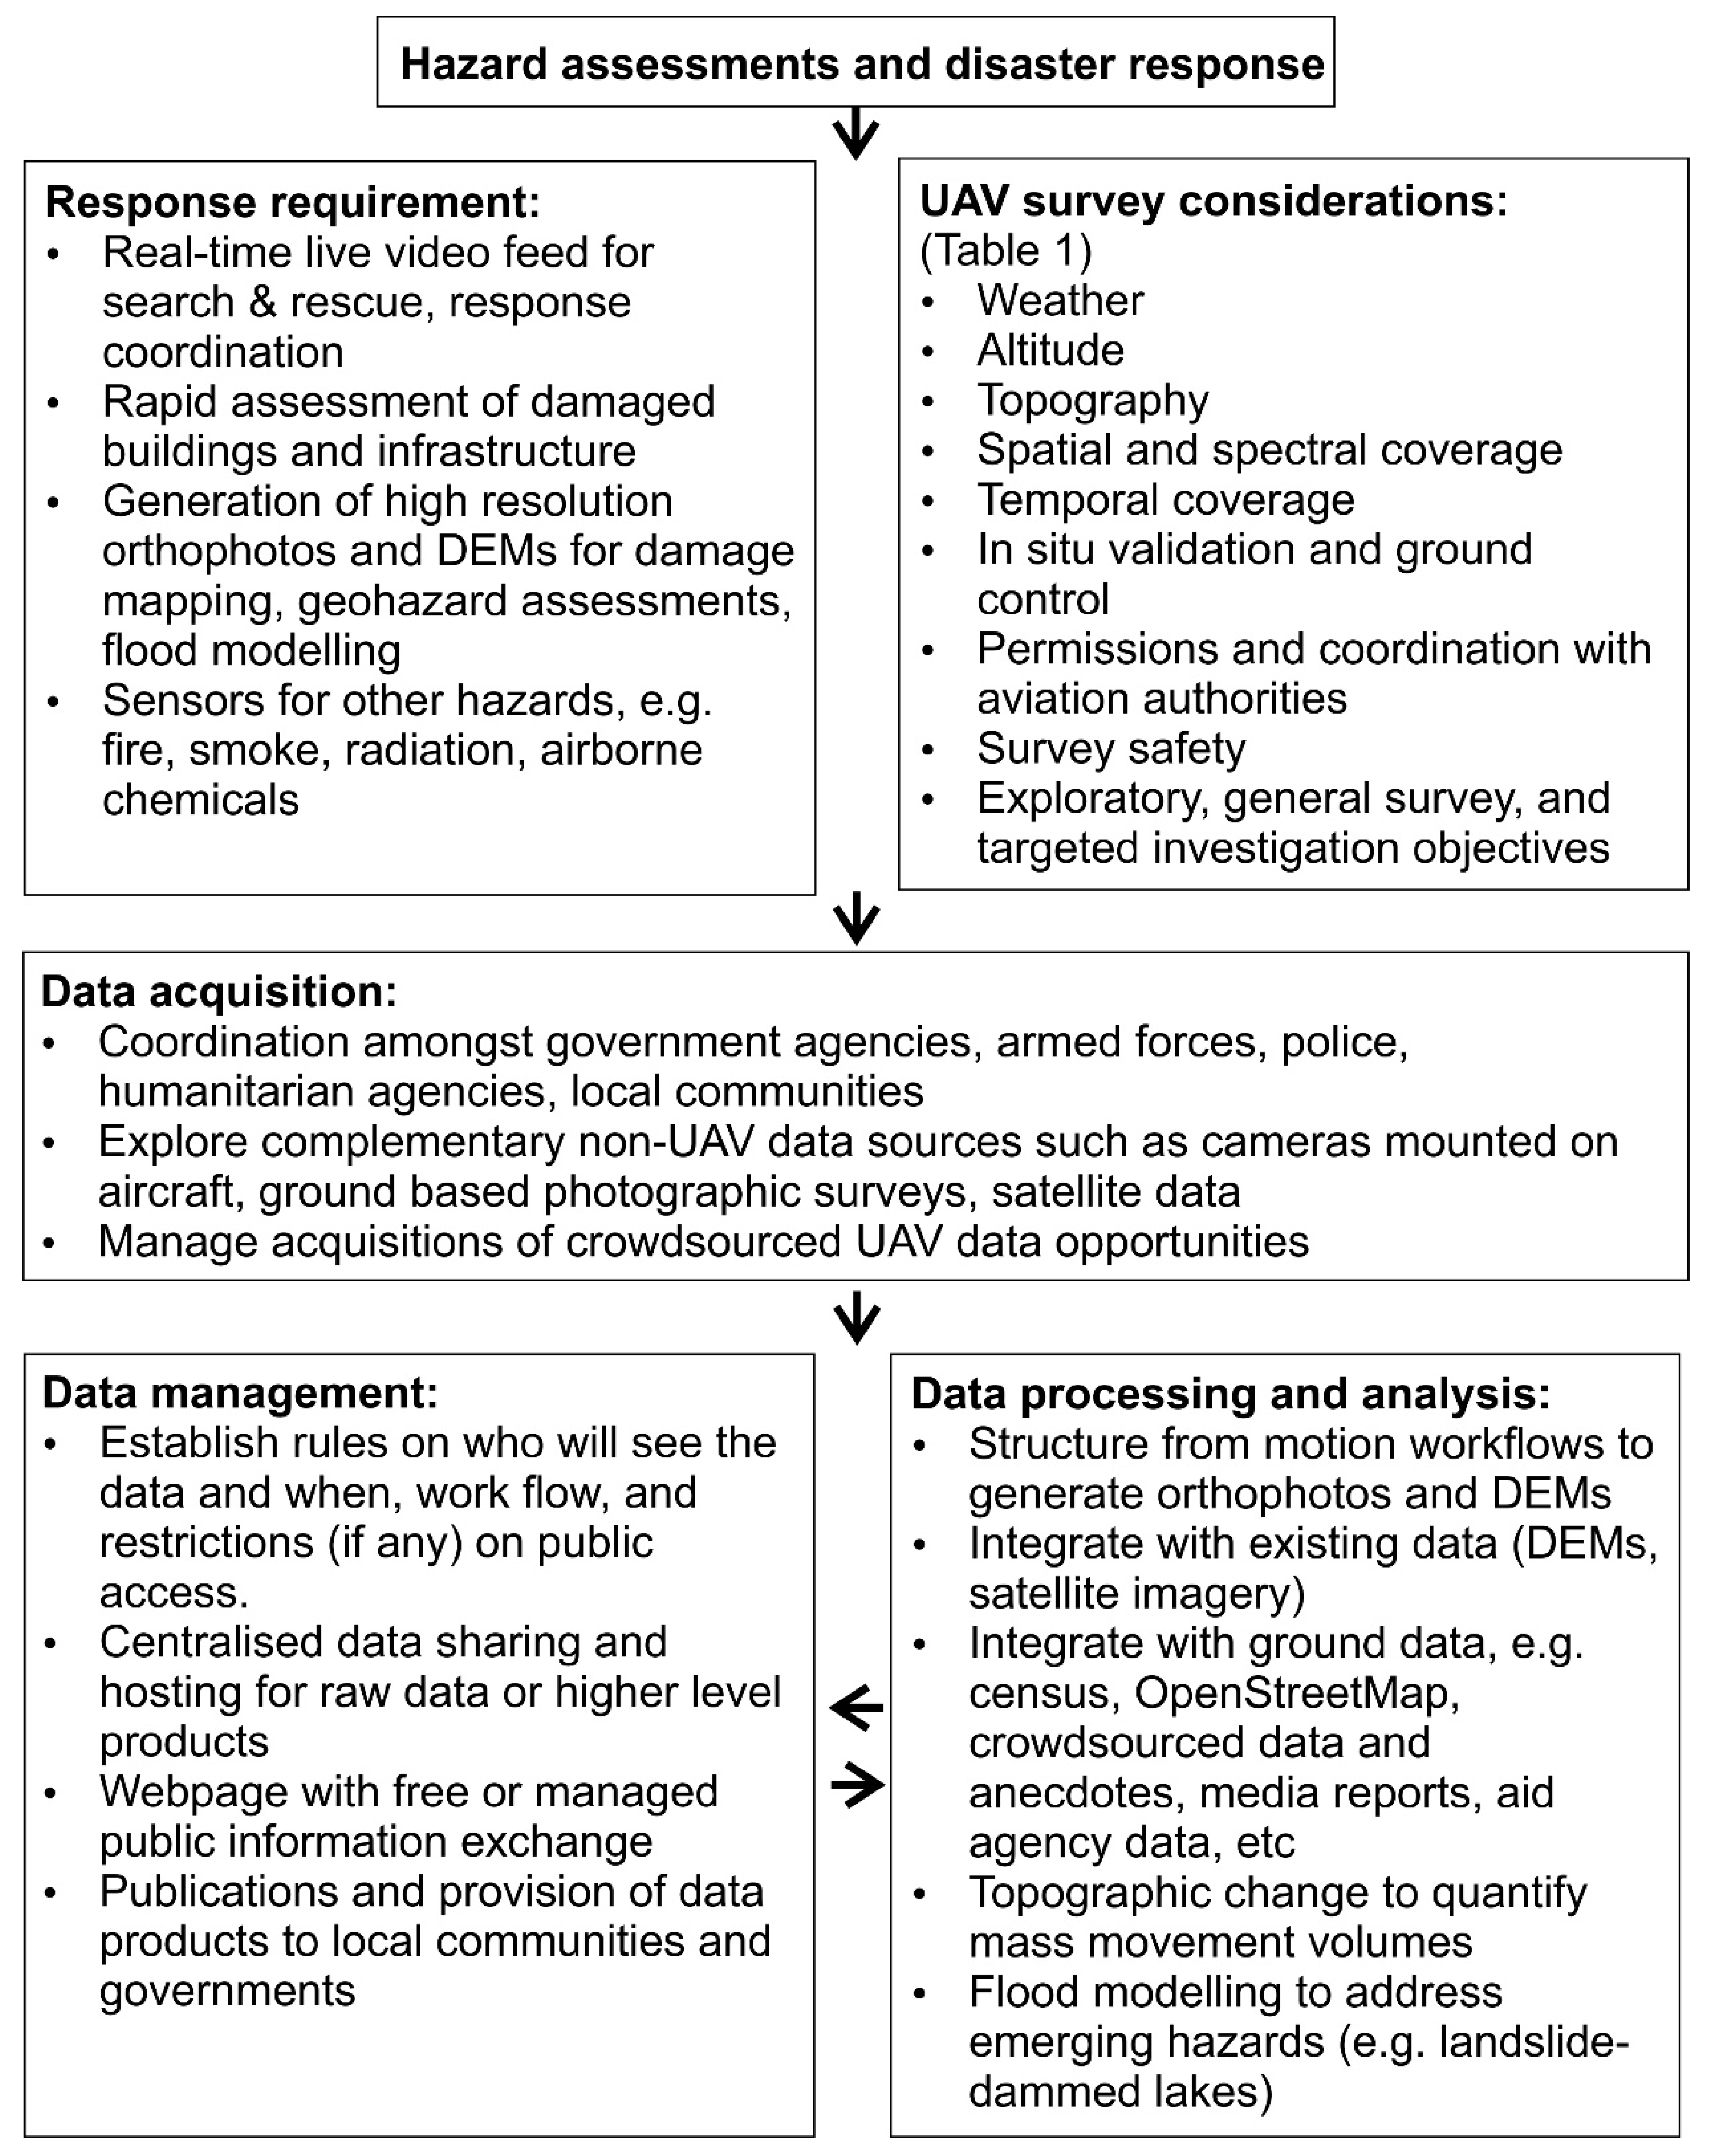
4.4. DEMs for Hazard and Disaster Assessments

Quantifying contemporary topographic change in a high-relief environment at scales relevant to human populations requires up-to-date fine-resolution DEMs, such as those derived using UAV imagery. HMA DEM products (released December 2017) provide an important baseline dataset that is comparable to UAV-derived DEMs; however, gaps still exist, especially along topographically confined river reaches (e.g., along the Marsyangdi River close to Tal village). These gaps are likely to shrink as the archive of stereo imagery grows; however, local-scale UAV surveys still offer the highest elevation precision, tailored surveying, and orthophoto generation capabilities. Additionally, the 3D point cloud generated using UAV imagery can resolve vertical and overhanging topography (e.g., Figure 3), which is not possible using gridded DEM products. Greater emphasis can therefore be placed quantifying topographic change in 3D along the direction of surface normal (e.g., [54,55]), which is more appropriate than vertical DEM differencing on steep slopes.
The main limitation to acquiring UAV data for disaster management or hazard assessment in Nepal is the time required to obtain relevant permissions, which, following tighter regulations after the 2015 Gorkha earthquake, can now take a month or more [56]. Scientists from the Japanese J-RAPID disaster response program reported a wait exceeding six months to survey building damage from the Gorkha earthquake with a UAV and that helicopter flights were a faster alternative with fewer permission requirements [57]. Rapid humanitarian response with UAVs in Nepal would therefore benefit from a streamlined permission procedure. As UAVs become increasingly valuable in disaster response and hazard assessment workflows (Figure 10), improved regulation of their deployment and integration of UAV capabilities into governmental and nongovernmental organisations will enhance short- and long-term analytical capabilities to minimise damages. A streamlined or expedited permitting process for disaster response agencies would therefore be beneficial. Helicopters or (ultra) light aircrafts could collect imagery of comparable quality to generate DEMs and orthophotos for the landslide and flood modelling examples presented in this study. However, their ability or availability for deployment to remote sites may be limited, especially during times of large-scale humanitarian disasters.

5. Conclusions

We have shown the value of fine-resolution UAV-derived DEMs and orthophotos for topographic representation and hazard assessment in the high mountain Himalaya. UAV DEMs acquired for monitoring purposes or in response to a disaster can be compared against the existing topography to quantify surface elevation change or be used for real-time decision making, such as deriving landslide-dammed lake volumes and socioeconomic vulnerabilities. Where available, 8 m High Mountain Asia DEMs offer a clear improvement over existing global DEM products, such as the GDEM2, AW3D30, and SRTM, and will form an important baseline topographic dataset. Of the global DEM products, the GDEM2 consistently had the highest vertical difference compared to fine-resolution UAV-derived DEMs in our areas of interest, whereas the AW3D30 and SRTM DEMs had comparable and improved topographic representation. We showed that landslide-dammed lakes occurring on the Marsyangdi River following the 2015 Gorkha earthquake would not have posed an inundation hazard to Lower Pisang village during a sudden breach scenario. Fine-resolution DEMs were not available at the time of the event, but subsequent availability of HMA DEMs allowed the calculation of landslide volume and produced simulated landslide-dammed lake area and volumes similar to the UAV-derived DEM. Therefore, continued acquisition of fine-resolution topography is high priority in Nepal, where landslide and flood hazards are common. The UAV-derived data (available on request to the corresponding author) should be used to inform assessments of future hazards and socio-economic vulnerabilities along the Marsyangdi River.

Supplementary Materials

The following are available online at https://www.mdpi.com/2504-446X/3/1/18/s1, Table S1: Coregistration of open access and the UAV DEMs. Figure S1. (a,b) Photographs of landslides and rockfall adjacent to Tal village. Photographs taken in October 2013 by Jeffrey Kargel. (c) Photograph of the river-blocking landslide on the Marsyangdi River. Photograph taken in April 2018 by Jeffrey Kargel.

Author Contributions

Conceptualisation, methodology, formal analysis C.S.W.; writing—original draft preparation, C.S.W.; writing—review and editing, C.S.W, J.S.K. and B.T. visualisation, C.S.W.; funding acquisition, J.S.K.

Funding

C.S.W. and J.K. are funded under NASA IDS grant 80NSSC18K0432.

Acknowledgments

The Civil Aviation Authority of Nepal and Home Ministry of Nepal are thanked for providing a UAV permit. We thank the Nepal Department of National Parks and Wildlife Conservation, and the Himalayan Research Centre for facilitating a research permit for this work. We thank Planet Labs for providing access to satellite imagery through the Planet Ambassadors Program. ASTER GDEM is a product of NASA and METI. The AW3D30 DEM is provided by the Japan Aerospace Exploration Agency (JAXA) at http://www.eorc.jaxa.jp/ALOS/en/aw3d30/. High Mountain Asia 8-meter Digital Elevation Models were downloaded from the NASA National Snow and Ice Data Center Distributed Active Archive Center. We thank the two reviewers for their comments, which helped improve this manuscript.

Conflicts of Interest

The authors declare no conflict of interest.

References

  1. Fort, M.; Cossart, E.; Arnaud-Fassetta, G. Hillslope-channel coupling in the Nepal Himalayas and threat to man-made structures: The middle Kali Gandaki valley. Geomorphology 2010, 124, 178–199. [Google Scholar] [CrossRef]
  2. Robinson, T.R.; Rosser, N.J.; Densmore, A.L.; Williams, J.G.; Kincey, M.E.; Benjamin, J.; Bell, H.J.A. Rapid post-earthquake modelling of coseismic landslide intensity and distribution for emergency response decision support. Nat. Hazards Earth Syst. Sci. 2017, 17, 1521–1540. [Google Scholar] [CrossRef] [Green Version]
  3. Ambrosi, C.; Strozzi, T.; Scapozza, C.; Wegmüller, U. Landslide hazard assessment in the Himalayas (Nepal and Bhutan) based on Earth-Observation data. Eng. Geol. 2018, 237, 217–228. [Google Scholar] [CrossRef]
  4. Dunning, S.A.; Rosser, N.J.; Petley, D.N.; Massey, C.R. Formation and failure of the Tsatichhu landslide dam, Bhutan. Landslides 2006, 3, 107–113. [Google Scholar] [CrossRef]
  5. Kargel, J.S.; Leonard, G.J.; Shugar, D.H.; Haritashya, U.K.; Bevington, A.; Fielding, E.J.; Fujita, K.; Geertsema, M.; Miles, E.S.; Steiner, J.; et al. Geomorphic and geologic controls of geohazards induced by Nepal’s 2015 Gorkha earthquake. Science 2016, 351. [Google Scholar] [CrossRef] [PubMed]
  6. Fujita, K.; Suzuki, R.; Nuimura, T.; Sakai, A. Performance of ASTER and SRTM DEMs, and their potential for assessing glacial lakes in the Lunana Region, Bhutan Himalaya. J. Glaciol. 2008, 54, 220–228. [Google Scholar] [CrossRef]
  7. Rounce, D.; Watson, C.; McKinney, D. Identification of hazard and risk for glacial lakes in the Nepal Himalaya using satellite imagery from 2000–2015. Remote Sens. 2017, 9, 654. [Google Scholar] [CrossRef]
  8. Bolch, T.; Buchroithner, M.F.; Peters, J.; Baessler, M.; Bajracharya, S. Identification of glacier motion and potentially dangerous glacial lakes in the Mt. Everest region/Nepal using spaceborne imagery. Nat. Hazards Earth Syst. Sci. 2008, 8, 1329–1340. [Google Scholar] [CrossRef] [Green Version]
  9. Westoby, M.J.; Glasser, N.F.; Brasington, J.; Hambrey, M.J.; Quincey, D.J.; Reynolds, J.M. Modelling outburst floods from moraine-dammed glacial lakes. Earth-Sci. Rev. 2014, 134, 137–159. [Google Scholar] [CrossRef] [Green Version]
  10. Westoby, M.J.; Glasser, N.F.; Hambrey, M.J.; Brasington, J.; Reynolds, J.M.; Hassan, M.A.A.M. Reconstructing historic Glacial Lake Outburst Floods through numerical modelling and geomorphological assessment: Extreme events in the Himalaya. Earth Surf. Process. Landf. 2014, 39, 1675–1692. [Google Scholar] [CrossRef]
  11. Lala, J.M.; Rounce, D.R.; McKinney, D.C. Modeling the glacial lake outburst flood process chain in the Nepal Himalaya: Reassessing Imja Tsho’s hazard. Hydrol. Earth Syst. Sci. 2018, 22, 3721–3737. [Google Scholar] [CrossRef]
  12. Wang, W.; Yang, X.; Yao, T. Evaluation of ASTER GDEM and SRTM and their suitability in hydraulic modelling of a glacial lake outburst flood in southeast Tibet. Hydrol. Processes 2012, 26, 213–225. [Google Scholar] [CrossRef]
  13. Neupane, R.P.; White, J.D.; Alexander, S.E. Projected hydrologic changes in monsoon-dominated Himalaya Mountain basins with changing climate and deforestation. J. Hydrol. 2015, 525, 216–230. [Google Scholar] [CrossRef]
  14. Brun, F.; Berthier, E.; Wagnon, P.; Kaab, A.; Treichler, D. A spatially resolved estimate of High Mountain Asia glacier mass balances from 2000 to 2016. Nat. Geosci. 2017, 10, 668–673. [Google Scholar] [CrossRef] [PubMed] [Green Version]
  15. Watson, C.S.; Quincey, D.J.; Smith, M.W.; Carrivick, J.L.; Rowan, A.V.; James, M. Quantifying ice cliff evolution with multi-temporal point clouds on the debris-covered Khumbu Glacier, Nepal. J. Glaciol. 2017, 63, 823–837. [Google Scholar] [CrossRef] [Green Version]
  16. Thompson, S.; Benn, D.; Mertes, J.; Luckman, A. Stagnation and mass loss on a Himalayan debris-covered glacier: Processes, patterns and rates. J. Glaciol. 2016, 62, 467–485. [Google Scholar] [CrossRef]
  17. Immerzeel, W.W.; Kraaijenbrink, P.D.A.; Shea, J.M.; Shrestha, A.B.; Pellicciotti, F.; Bierkens, M.F.P.; de Jong, S.M. High-resolution monitoring of Himalayan glacier dynamics using unmanned aerial vehicles. Remote Sens. Environ. 2014, 150, 93–103. [Google Scholar] [CrossRef]
  18. Tadono, T.; Ishida, H.; Oda, F.; Naito, S.; Minakawa, K.; Iwamoto, H. Precise global DEM generation by ALOS PRISM. ISPRS Ann. Photogramm. Remote Sens. Spat. Inf. Sci. 2014, 2, 71. [Google Scholar] [CrossRef]
  19. Gruber, F.E.; Mergili, M. Regional-scale analysis of high-mountain multi-hazard and risk indicators in the Pamir (Tajikistan) with GRASS GIS. Nat. Hazards Earth Syst. Sci. 2013, 13, 2779–2796. [Google Scholar] [CrossRef] [Green Version]
  20. Shean, D.E.; Alexandrov, O.; Moratto, Z.M.; Smith, B.E.; Joughin, I.R.; Porter, C.; Morin, P. An automated, open-source pipeline for mass production of digital elevation models (DEMs) from very-high-resolution commercial stereo satellite imagery. ISPRS J. Photogramm. Remote Sens. 2016, 116, 101–117. [Google Scholar] [CrossRef] [Green Version]
  21. Westoby, M.J.; Brasington, J.; Glasser, N.F.; Hambrey, M.J.; Reynolds, J.M. ‘Structure-from-Motion’ photogrammetry: A low-cost, effective tool for geoscience applications. Geomorphology 2012, 179, 300–314. [Google Scholar] [CrossRef] [Green Version]
  22. James, M.R.; Robson, S. Straightforward reconstruction of 3D surfaces and topography with a camera: Accuracy and geoscience application. J. Geophys. Res. Earth Surf. 2012, 117, 1–17. [Google Scholar] [CrossRef]
  23. Smith, M.W.; Carrivick, J.L.; Quincey, D.J. Structure from motion photogrammetry in physical geography. Progr. Phys. Geogr. 2015, 40, 1–29. [Google Scholar] [CrossRef]
  24. Zekkos, D.; Clark, M.; Whitworth, M.; Greenwood, W.; West, A.J.; Roback, K.; Li, G.; Chamlagain, D.; Manousakis, J.; Quackenbush, P.; et al. Observations of Landslides Caused by the April 2015 Gorkha, Nepal, Earthquake Based on Land, UAV, and Satellite Reconnaissance. Earthq. Spectra 2017, 33, S95–S114. [Google Scholar] [CrossRef]
  25. Greenwood, W.; Zekkos, D.; Lynch, J.; Bateman, J.; Clark, M.; Chamlagain, D. UAV-Based 3-D Characterization of Rock Masses and Rock Slides in Nepal. In Proceedings of the 50th U.S. Rock Mechanics/Geomechanics Symposium, Houston, TX, USA, 26–29 June 2016. [Google Scholar]
  26. Lucieer, A.; de Jong, S.M.; Turner, D. Mapping landslide displacements using Structure from Motion (SfM) and image correlation of multi-temporal UAV photography. Progr. Phys. Geogr. 2014, 38, 97–116. [Google Scholar] [CrossRef]
  27. Lindner, G.; Schraml, K.; Mansberger, R.; Hübl, J. UAV monitoring and documentation of a large landslide. Appl. Geomat. 2016, 8, 1–11. [Google Scholar] [CrossRef]
  28. Fernandez Galarreta, J.; Kerle, N.; Gerke, M. UAV-based urban structural damage assessment using object-based image analysis and semantic reasoning. Nat. Hazards Earth Syst. Sci. 2015, 15, 1087–1101. [Google Scholar] [CrossRef] [Green Version]
  29. Williams, J.G.; Rosser, N.J.; Kincey, M.E.; Benjamin, J.; Oven, K.J.; Densmore, A.L.; Milledge, D.G.; Robinson, T.R.; Jordan, C.A.; Dijkstra, T.A. Satellite-based emergency mapping using optical imagery: Experience and reflections from the 2015 Nepal earthquakes. Nat. Hazards Earth Syst. Sci. 2018, 18, 185–205. [Google Scholar] [CrossRef]
  30. Waltham, T. Very large landslides in the Himalayas. Geol. Today 1996, 12, 181–185. [Google Scholar] [CrossRef]
  31. Planet Team. Planet Application Program Interface: In Space for Life on Earth; Planet Team: San Francisco, CA, USA, 2018; Available online: https://api.planet.com (accessed on 8 February 2019).
  32. Westoby, M.J.; Dunning, S.A.; Woodward, J.; Hein, A.S.; Marrero, S.M.; Winter, K.; Sugden, D.E. Interannual surface evolution of an Antarctic blue-ice moraine using multi-temporal DEMs. Earth Surf. Dyn. 2016, 4, 515–529. [Google Scholar] [CrossRef] [Green Version]
  33. Ewertowski, M.W.; Tomczyk, A.M.; Evans, D.J.A.; Roberts, D.H.; Ewertowski, W. Operational Framework for Rapid, Very-high Resolution Mapping of Glacial Geomorphology Using Low-cost Unmanned Aerial Vehicles and Structure-from-Motion Approach. Remote Sens. 2019, 11, 65. [Google Scholar] [CrossRef]
  34. James, M.R.; Robson, S.; d’Oleire-Oltmanns, S.; Niethammer, U. Optimising UAV topographic surveys processed with structure-from-motion: Ground control quality, quantity and bundle adjustment. Geomorphology 2017, 280, 51–66. [Google Scholar] [CrossRef]
  35. Shean, D. High Mountain Asia 8-meter DEM Mosaics Derived from Optical Imagery, Version 1. Tile-641; NASA National Snow and Ice Data Center Distributed Active Archive Center: Boulder, CO, USA, 2018. Available online: https://doi.org/10.5067/KXOVQ9L172S2 (accessed on 19 July 2018).
  36. Shean, D. High Mountain Asia 8-meter DEMs Derived from Along-Track Optical Imagery, Version 1. AT_20131120_0508; NASA National Snow and Ice Data Center Distributed Active Archive Center: Boulder, CO, USA, 2018. Available online: https://doi.org/10.5067/GSACB044M4PK (accessed on 27 July 2018).
  37. Tachikawa, T.; Hato, M.; Kaku, M.; Iwasaki, A. Characteristics of ASTER GDEM version 2. In Proceedings of the 2011 IEEE International Geoscience and Remote Sensing Symposium, Vancouver, BC, Canada, 24–29 July 2011; pp. 3657–3660. [Google Scholar]
  38. Farr, T.G.; Rosen, P.A.; Caro, E.; Crippen, R.; Duren, R.; Hensley, S.; Kobrick, M.; Paller, M.; Rodriguez, E.; Roth, L.; et al. The Shuttle Radar Topography Mission. Rev. Geophys. 2007. [Google Scholar] [CrossRef]
  39. Nuth, C.; Kääb, A. Co-registration and bias corrections of satellite elevation data sets for quantifying glacier thickness change. The Cryosphere 2011, 5, 271–290. [Google Scholar] [CrossRef] [Green Version]
  40. OpenStreetMap Contributors. OpenStreetMap. 2019. Available online: https://www.openstreetmap.org (accessed on 23 August 2018).
  41. Chow, V.T. Open-Channel Hydraulics; McGraw-Hill Book Co.: New York, NY, USA, 1959. [Google Scholar]
  42. Bolch, T.; Pieczonka, T.; Benn, D.I. Multi-decadal mass loss of glaciers in the Everest area (Nepal Himalaya) derived from stereo imagery. Cryosphere 2011, 5, 349–358. [Google Scholar] [CrossRef] [Green Version]
  43. King, O.; Quincey, D.J.; Carrivick, J.L.; Rowan, A.V. Spatial variability in mass loss of glaciers in the Everest region, central Himalayas, between 2000 and 2015. Cryosphere 2017, 11, 407–426. [Google Scholar] [CrossRef]
  44. Weidinger, J. Landslide dams in the high mountains of India, Nepal and China-stability and life span of their dammed lakes. Ital. J. Eng. Geol. Environ. Spec. Issue 1 2006. [Google Scholar] [CrossRef]
  45. Tachikawa, T.; Kaku, M.; Iwasaki, A.; Gesch, D.; Oimoen, M.; Zhang, Z.; Danielson, J.; Krieger, T.; Curtis, B.; Haase, J. ASTER Global Digital Elevation Model Version 2–Summary of Validation Results; NASA: Pasadena, CA, USA, 2011.
  46. Purinton, B.; Bookhagen, B. Validation of digital elevation models (DEMs) and comparison of geomorphic metrics on the southern Central Andean Plateau. Earth Surf. Dyn. 2017, 5, 211–237. [Google Scholar] [CrossRef] [Green Version]
  47. Hayakawa, Y.S.; Oguchi, T.; Lin, Z. Comparison of new and existing global digital elevation models: ASTER G-DEM and SRTM-3. Geophys. Res. Lett. 2008, 35, L17404. [Google Scholar] [CrossRef]
  48. Forlani, G.; Dall’Asta, E.; Diotri, F.; Cella, U.M.d.; Roncella, R.; Santise, M. Quality Assessment of DSMs Produced from UAV Flights Georeferenced with On-Board RTK Positioning. Remote Sens. 2018, 10, 311. [Google Scholar] [CrossRef]
  49. Fazeli, H.; Samadzadegan, F.; Dadrasjavan, F. Evaluating the potential of RTK-UAV for automatic point cloud generation in 3D rapid mapping. Int. Arch. Photogramm. Remote Sens. Spat. Inf. Sci. 2016, 41, 221. [Google Scholar] [CrossRef]
  50. Gichamo, T.Z.; Popescu, I.; Jonoski, A.; Solomatine, D. River cross-section extraction from the ASTER global DEM for flood modeling. Environ. Model. Softw. 2012, 31, 37–46. [Google Scholar] [CrossRef]
  51. Watson, C.S.; Carrivick, J.; Quincey, D. An improved method to represent DEM uncertainty in glacial lake outburst flood propagation using stochastic simulations. J. Hydrol. 2015, 529, 1373–1389. [Google Scholar] [CrossRef] [Green Version]
  52. Byers, A.; McKinney, D.; Somos-Valenzuela, M.; Watanabe, T.; Lamsal, D. Glacial lakes of the Hinku and Hongu valleys, Makalu Barun National Park and Buffer Zone, Nepal. Nat. Hazards 2013, 69, 115–139. [Google Scholar] [CrossRef]
  53. Schwanghart, W.; Scherler, D. Bumps in river profiles: Uncertainty assessment and smoothing using quantile regression techniques. Earth Surf. Dyn. 2017, 5, 821–839. [Google Scholar] [CrossRef]
  54. Stumpf, A.; Malet, J.P.; Allemand, P.; Pierrot-Deseilligny, M.; Skupinski, G. Ground-based multi-view photogrammetry for the monitoring of landslide deformation and erosion. Geomorphology 2015, 231, 130–145. [Google Scholar] [CrossRef]
  55. Lague, D.; Brodu, N.; Leroux, J. Accurate 3D comparison of complex topography with terrestrial laser scanner: Application to the Rangitikei canyon (N-Z). ISPRS J. Photogramm. Remote Sens. 2013, 82, 10–26. [Google Scholar] [CrossRef] [Green Version]
  56. Swiss Foundation for Mine Action. Small-scale Mapping with Consumer Drones in Nepal. 2019. Available online: https://drones.fsd.ch/en/3561/ (accessed on 11 January 2019).
  57. Inoue, H.; Ohsumi, T.; Fukui, H.; Guragain, R.; Basyal, G.K.; Chaudhary, S.; Adhikari, S.R. Damage Mapping of April 2015 Nepal Earthquake using Small UAV. 2019. Available online: https://www.jst.go.jp/inter/sicp/country/j-rapid/nepal/pdf/j-rapid_nepal_inoue.pdf (accessed on 11 January 2019).
Figure 1. Location of the two study sites in central Nepal. A hillshade generated from the Advanced Land Observing Satellite (ALOS) World 3D 30 m (AW3D30) digital elevation model (DEM) is shown on the main panel. True colour backgrounds from Planet Team [31] are shown on the insets for Tal village (PlanetScope 23 April 2018) and Pisang landslides (RapidEye 10 November 2017).
Drones 03 00018 g001
Figure 2. (a) AW3D30 hillshade and river network; (b) Advanced Spaceborne Thermal Emission and Reflection Radiometer (ASTER) Global Digital Elevation Model (GDEM2) hillshade and river networks; (c) UAV hillshade and the Marsyangdi River channel; (d) DEM of difference (UAV DEM minus the AW3D30 DEM). The mean and one standard deviation are shown in the lower right corner.
Drones 03 00018 g002
Figure 3. (ac) Views of the UAV-derived point cloud of Tal village; (d) UAV orthophoto 24 April 2018. Photographs of the mass movement events close to Tal village are provided in Figure S1.
Drones 03 00018 g003
Figure 4. Elevation above the river channel for the UAV DEM with corresponding hillshade (a) and the AW3D30 with corresponding hillshade (b). Cross-valley profiles in (b) are shown in Figure 5. The mean and one standard deviation of the difference between the UAV and AW3D30 DEMs are shown for each profile. (c,d) Expanded insets (black box) showing the village of Tal and spot comparisons of elevations above the river channel. It is thought that the landslide (red rectangle) occurred in 2012.
Drones 03 00018 g004
Figure 5. Cross-valley profiles of the UAV and AW3D30 DEMs corresponding to Figure 4b: The mean and one standard deviation of the difference between the UAV and AW3D30 DEMs are (1) −0.2 ± 11.5 m, (2) −3.8 ± 9.6 m, (3) −0.7 ± 7.4 m and (4) −0.8 ± 5.3 m.
Drones 03 00018 g005
Figure 6. (a) Marsyangdi River channel upstream of Lower Pisang village. The river channels derived from each DEM are shown. (b) Buildings of Lower Pisang village with the different river channels and UAV Orthophoto background. (c) Terrain elevation above the Marsyangdi River channel, which exhibits an elevation drop of approximately 9 m over the reach shown.
Drones 03 00018 g006
Figure 7. Pre-earthquake (a) and post-earthquake (b) RapidEye images of the Marsyangdi River upstream of Lower Pisang village (false-colour composites of bands near-infrared, red, and blue). (c) DEM difference of the UAV DEM (26 April 2018) minus the HMA DEM (15 March 2015) showing a landslide (inset) that partially blocked the river. The inset background in (c) is the UAV orthophoto. A photograph of the landslide is provided in Figure S1.
Drones 03 00018 g007
Figure 8. (a) Area–volume relationships derived for 5, 10, and 15 m hypothetical dams blocking the Marsyangdi River. Second-order polynomial trend lines are fitted with the exception of the SRTM (linear trend). (bd) The extent of lakes forming behind simulated dams blocking the Marsyangdi River for the UAV DEM, HMA DEM, and AW3D30 and SRTM DEM, respectively. Background is the UAV orthophoto.
Drones 03 00018 g008
Figure 9. Simulated landslide-dammed lake outburst floods on the Marsyangdi River. Qp = 936, 468, 234, and 1874 m3 s−1 for simulations 1–4 respectively.
Drones 03 00018 g009
Figure 10. Using human-portable UAVs for hazard assessments and in disaster situations.
Drones 03 00018 g010
Table 1. Use of unmanned aerial vehicles (UAVs) in the Himalaya.
ConsiderationAdvantages of UAV Surveying Compared to Satellite ImagingLimitations of UAV Surveying Compared to Satellite Imaging
WeatherFlying underneath a cloud base
Flying during optimum lighting conditions
Maximum wind speed restrictions
Reduced battery life and risk of equipment loss in adverse weather conditions
AltitudeVariable aboveground flight altitude to determine imagery resolutionMaximum aboveground flight altitude may be fixed in commercial UAVs (e.g., 500 m) or by local/national regulations
TopographyOptimise flight time to minimise shadows
Improved slope coverage from multiazimuthal look angles and avoidance of layover
Ability to resolve overhanging topography
Requirement to navigate complex topography or rely on autonomous navigation
Spatial and spectral coverageTailored coverage to an area of interest with manual flight control or autonomous route planning software
Higher spatial resolution
Limited survey footprint (several square kilometres vs. tens of square kilometres)
UAV surveys may need to maintain line of sight to operator for practical reasons or permit compliance
Fewer spectral bands
Heterogeneous resolution
Temporal coverageInvestigator-specified repeat interval and season or time of day, and coordination with other field campaign data acquisitionsFewer repeat times related to high cost of field deployments compared to continuously operated satellites
In situ validationSimultaneous in situ validation of DEM accuracy and assessment of land cover and material properties is possible
Permissions, cost, and data availabilityPotential to crowdsource imagery following a disaster or to generate baseline topography for ongoing monitoringTransportation costs and import regulations
Permit, licensing, and liability insurance requirements
Local permissions or objections to flights
Higher costs per square kilometre of survey due to fieldwork deployment
Table 2. Summary of the UAV surveys and generated models and DEMs.
Site (Date)ImagesGCPsDense Cloud Points (×106)RMS Error (m)/(pix)Exported DEM Resolution (m) 2
Tal village
(April 2018)
4497122.951.12/0.872
Pisang landslides
(April 2018)
4090109.446.54 1/0.692
Note: 1 Reduced to 3.54 m after coregistration to a High Mountain Asia (HMA) DEM; 2 Selected to avoid small holes in the DEM in areas of sparse point coverage.
Table 3. Summary of DEMs of difference after coregistration.
SiteDEM DifferenceMean Elevation Difference (m)Standard Deviation (m)Uncertainty (m)
Tal villageUAV − AW3D30−1.2613.432.38
Pisang landslidesUAV − HMA−0.112.610.22
UAV − GDEM21.0012.262.09
UAV − AW3D30−0.137.881.19
UAV − SRTM0.067.741.16
Table 4. Spatial proximity of delineated river channels and mean building elevation above the river channel for Lower Pisang.
DEMDistance between DEM- and UAV-Derived River Channels (m)Mean Building Elevation above the River Channel (m)
Mean ± SDMaximum
HMA-Mos3.1 ± 5.633.214.2 ± 5.7
AW3D306.4 ± 7.336.89.2 ± 4.9
GDEM216.7 ± 19.597.913.1 ± 6.5
SRTM7.6 ± 9.347.06.1 ± 4.9
UAV--16.0 ± 5.2

