Figure 1.
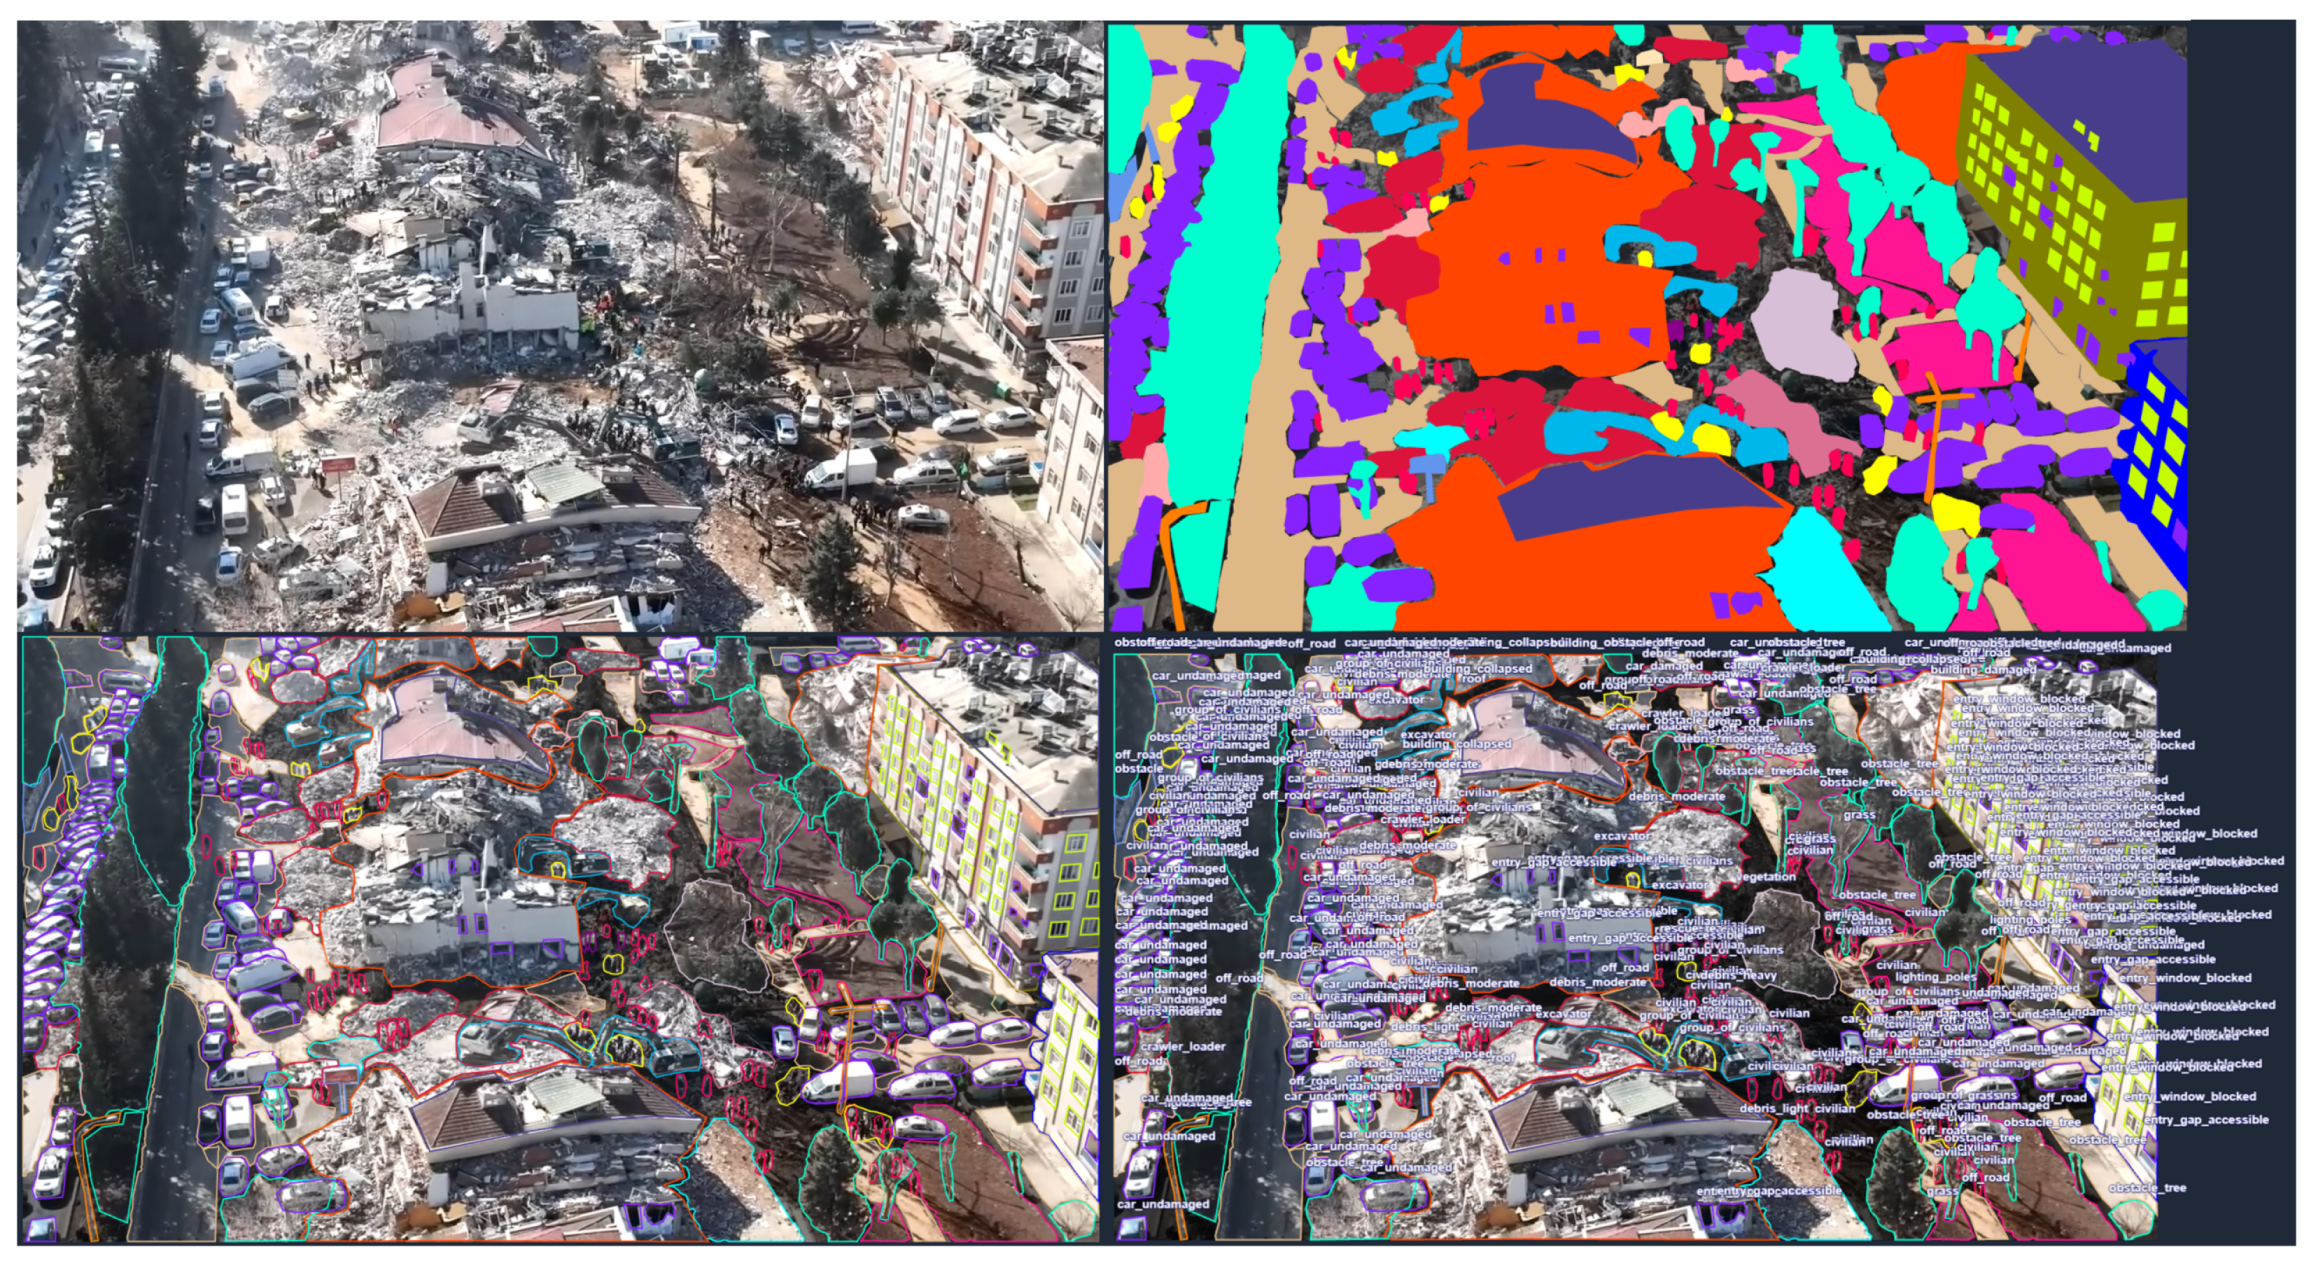
A representative post-earthquake frame (top-left) is processed by the YOLOv8-seg–based Detection–Refinement Network trained on the D’RespNeT corpus. The panels show the raw UAV image (top-left), colour-coded instance masks (top-right), polygon masks and instance boundaries overlaid on the RGB image (bottom-left), and dense class labels and detections rendered on the scene (bottom-right). Colours distinguish semantic classes consistently across the masks, boundaries, and labels; each colour corresponds to the class name displayed in the panel and has no ordinal meaning. D’RespNeT provides polygon-level annotations for SAR-relevant classes—including accessible and blocked entry points, structural damage and debris levels, rescue personnel, vehicles, and other operational context—derived from real post-disaster UAV footage. These annotations support operational situational awareness and the training and evaluation of the perception stack. The outputs also feed a traversability module: obstacles are identified during the UAV’s approach, and once the UAV reaches a bird’s-eye vantage point, the same perception stack generates an operator-in-the-loop ground-path cue to guide the UGV and support response teams.
Figure 1.
A representative post-earthquake frame (top-left) is processed by the YOLOv8-seg–based Detection–Refinement Network trained on the D’RespNeT corpus. The panels show the raw UAV image (top-left), colour-coded instance masks (top-right), polygon masks and instance boundaries overlaid on the RGB image (bottom-left), and dense class labels and detections rendered on the scene (bottom-right). Colours distinguish semantic classes consistently across the masks, boundaries, and labels; each colour corresponds to the class name displayed in the panel and has no ordinal meaning. D’RespNeT provides polygon-level annotations for SAR-relevant classes—including accessible and blocked entry points, structural damage and debris levels, rescue personnel, vehicles, and other operational context—derived from real post-disaster UAV footage. These annotations support operational situational awareness and the training and evaluation of the perception stack. The outputs also feed a traversability module: obstacles are identified during the UAV’s approach, and once the UAV reaches a bird’s-eye vantage point, the same perception stack generates an operator-in-the-loop ground-path cue to guide the UGV and support response teams.

Figure 2.
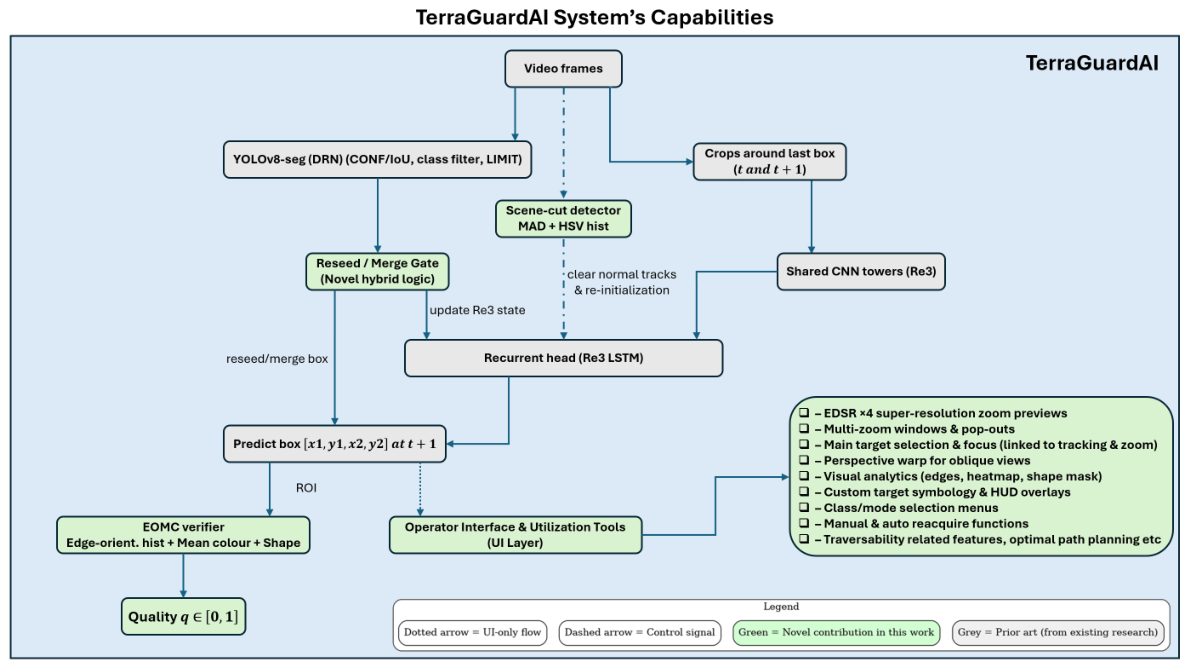
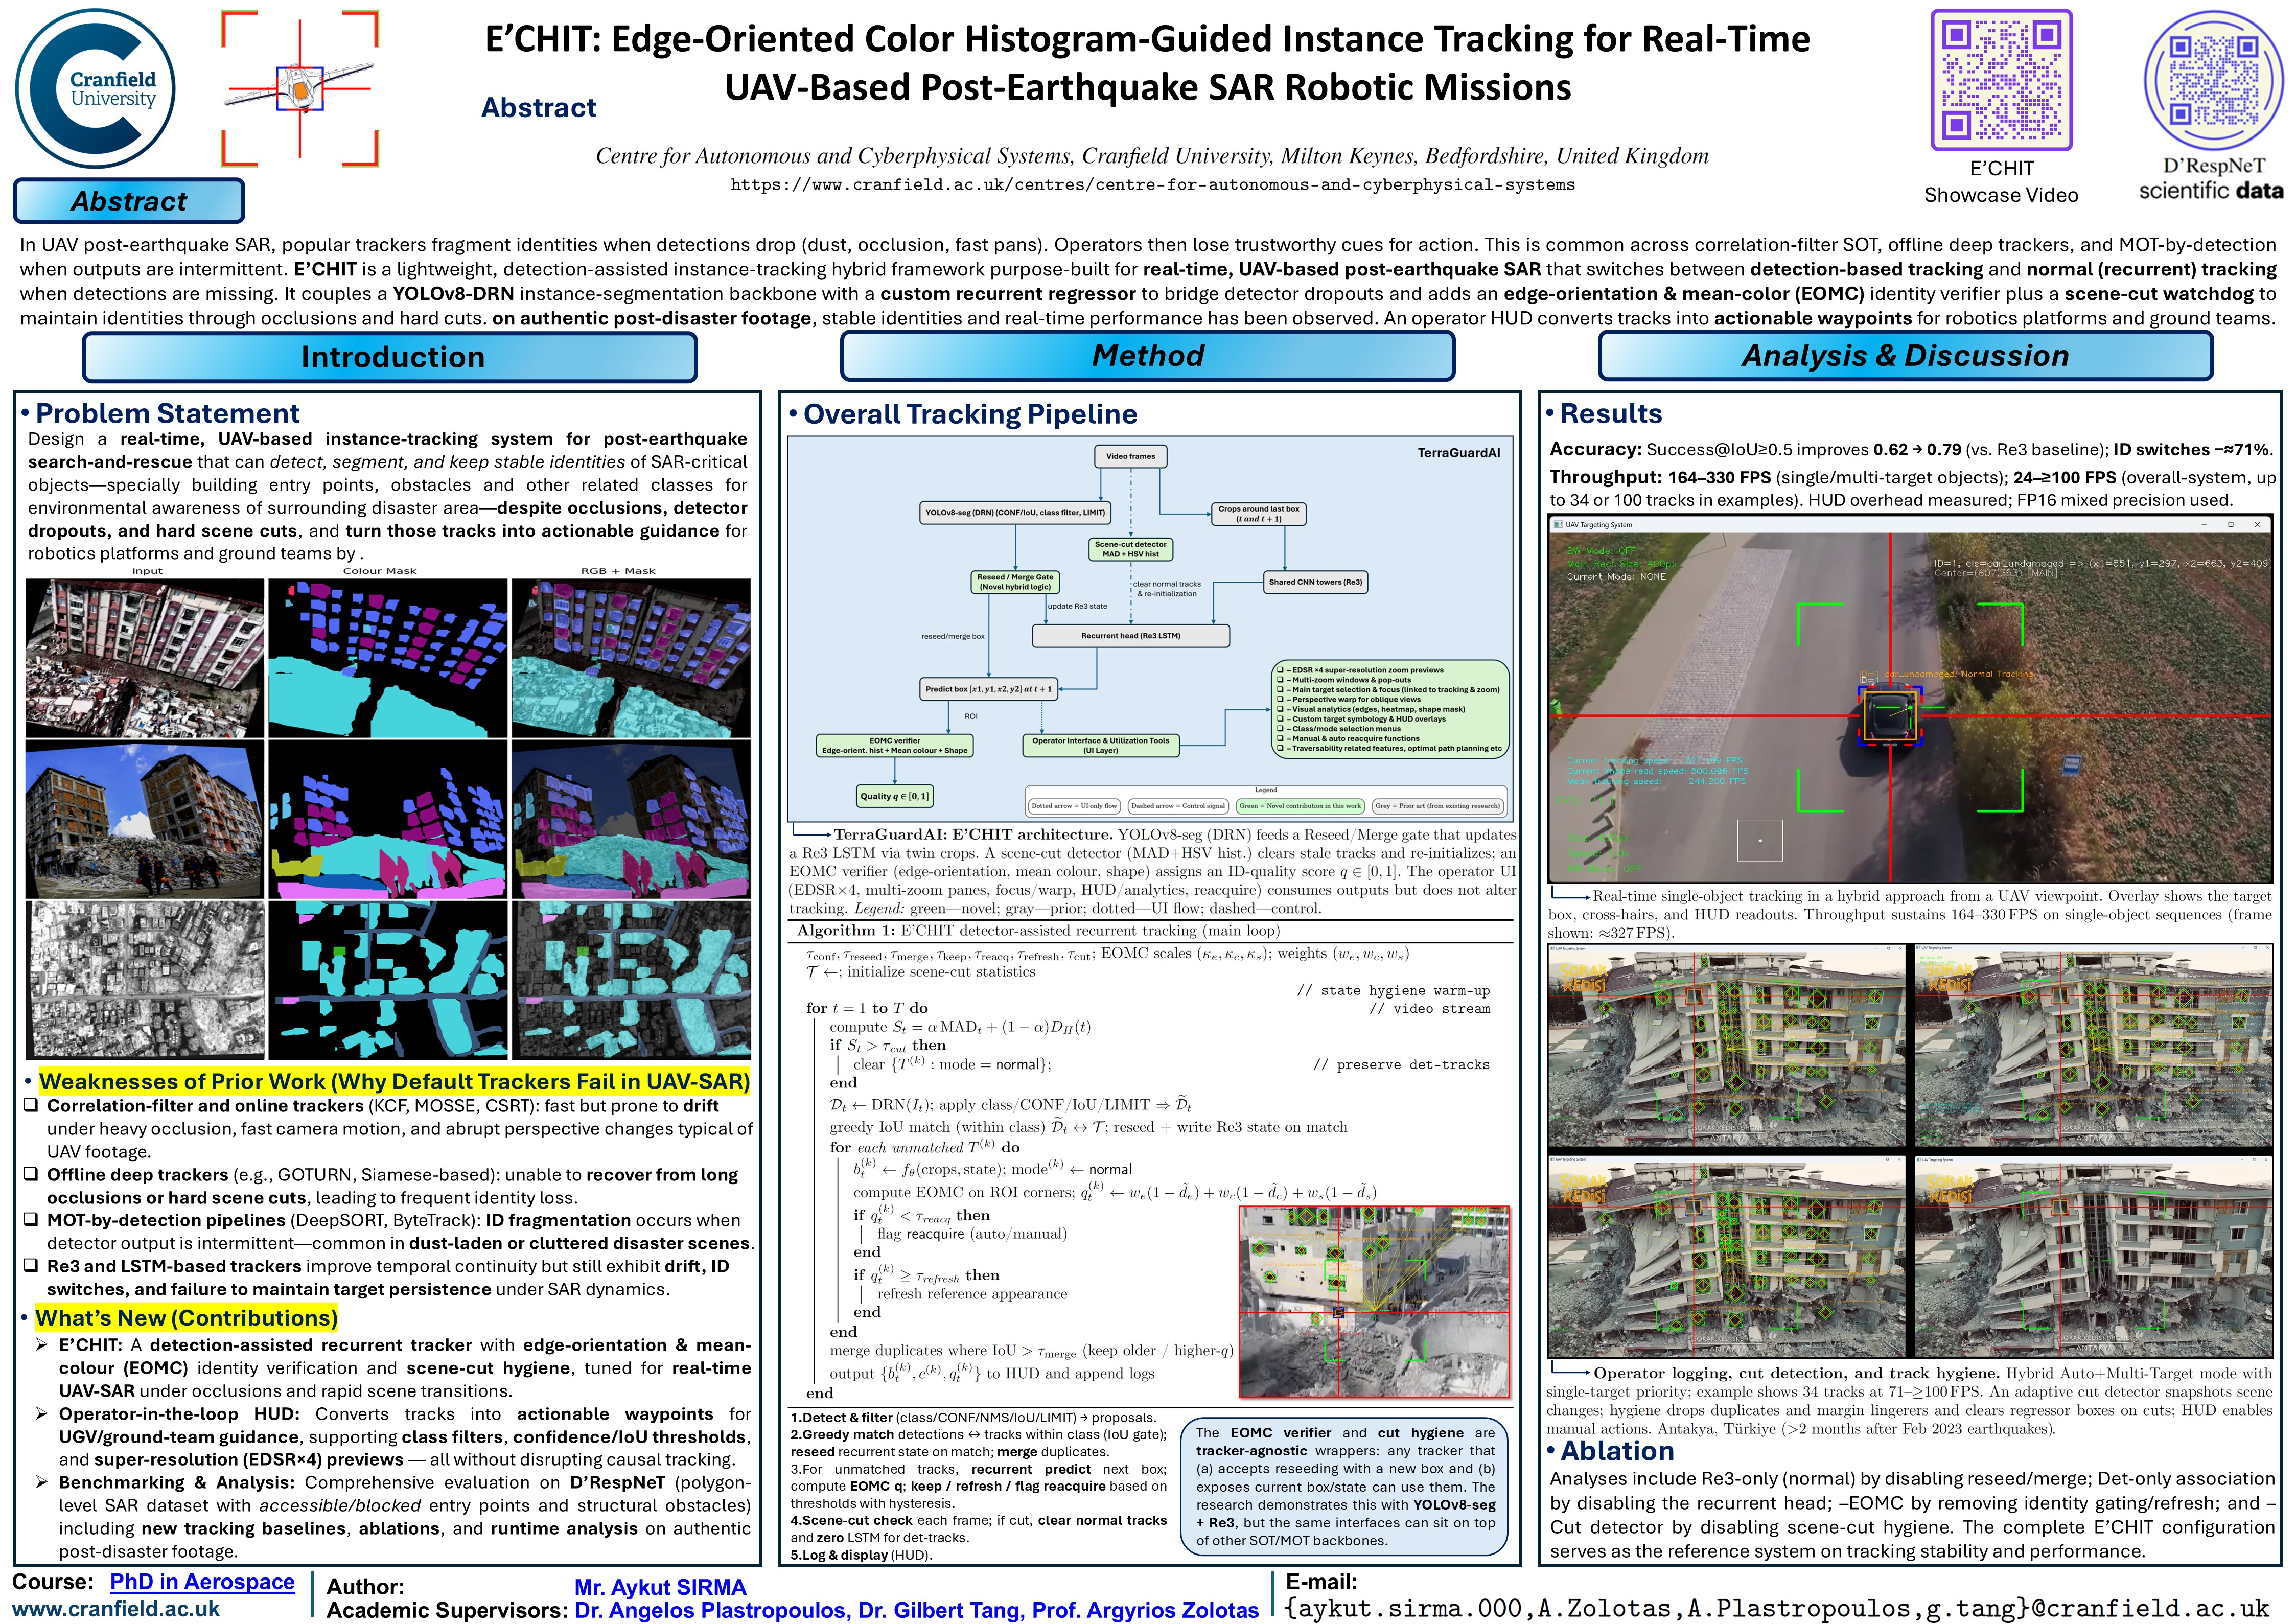
TerraGuardAI: E’CHIT hybrid–recurrent tracking and UI integration. YOLOv8-seg (DRN) provides detections to a Reseed/Merge Gate that updates the RE3 state. Two crops centred on the previous bounding box are processed by weight-shared CNN towers and a recurrent head (RE3 LSTM) to regress the next box. A scene-cut detector (MAD + HSV histogram) clears recurrently continued tracks and triggers re-initialisation. An EOMC verifier (edge-orientation histogram + mean colour + shape) returns an identity-integrity score . The operator UI layer (EDSR × 4 zooms, multi-zoom windows, focus/warp tools, visual analytics, symbology/HUD, and reacquisition controls) consumes tracker outputs but is non-causal to the tracking process. Legend: Green = proposed contribution; Grey = prior art; dotted arrows = UI-only flow; dashed arrows = control signals.
Figure 2.
TerraGuardAI: E’CHIT hybrid–recurrent tracking and UI integration. YOLOv8-seg (DRN) provides detections to a Reseed/Merge Gate that updates the RE3 state. Two crops centred on the previous bounding box are processed by weight-shared CNN towers and a recurrent head (RE3 LSTM) to regress the next box. A scene-cut detector (MAD + HSV histogram) clears recurrently continued tracks and triggers re-initialisation. An EOMC verifier (edge-orientation histogram + mean colour + shape) returns an identity-integrity score . The operator UI layer (EDSR × 4 zooms, multi-zoom windows, focus/warp tools, visual analytics, symbology/HUD, and reacquisition controls) consumes tracker outputs but is non-causal to the tracking process. Legend: Green = proposed contribution; Grey = prior art; dotted arrows = UI-only flow; dashed arrows = control signals.
Figure 3.
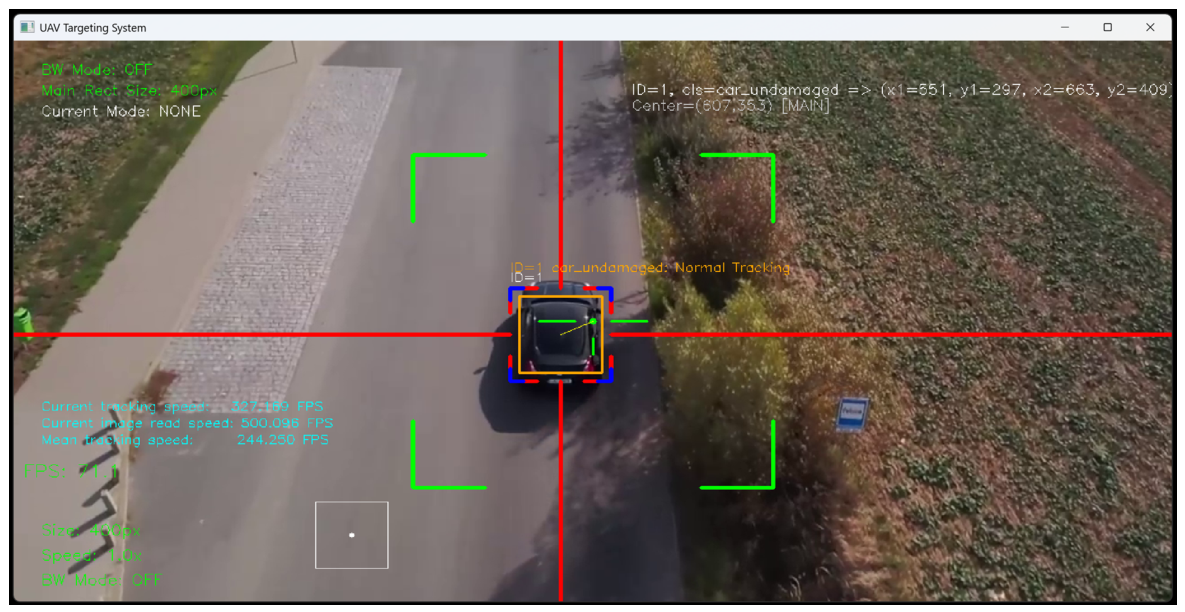
Real-time single-object tracking from a UAV viewpoint. The overlay shows the target bounding box, crosshairs, and HUD readouts. The tracker sustains 164–330 FPS on single-object sequences (frame shown: ≈327 FPS).
Figure 3.
Real-time single-object tracking from a UAV viewpoint. The overlay shows the target bounding box, crosshairs, and HUD readouts. The tracker sustains 164–330 FPS on single-object sequences (frame shown: ≈327 FPS).
Figure 4.
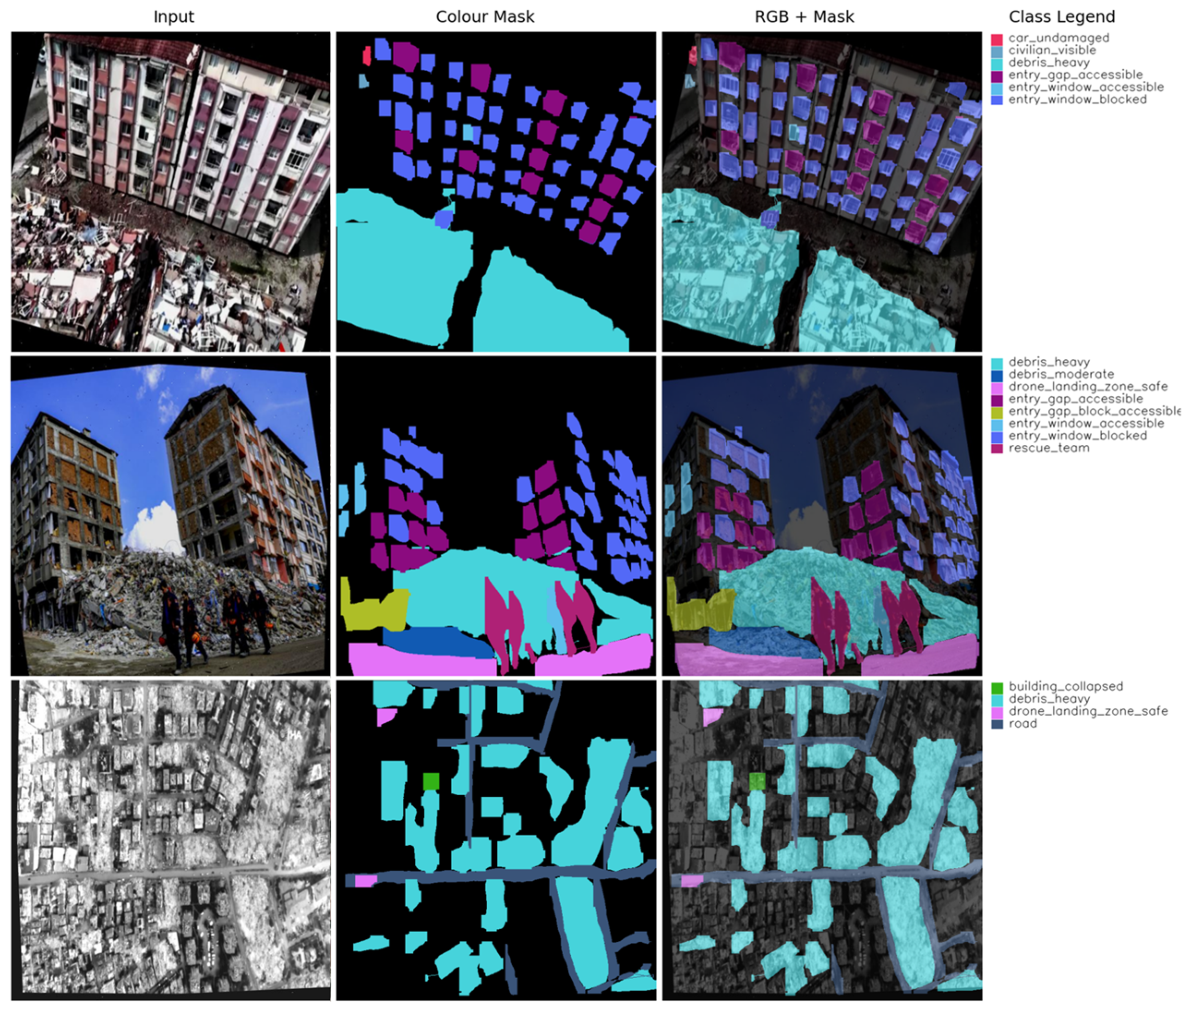
Representative samples from D’RespNeT showing diverse post-earthquake urban scenes and their instance-segmentation annotations. Each row presents a different UAV-captured disaster site. The columns show the original input frame, ground-truth polygon annotations, class-labelled predictions, YOLO inference with instance masks and class labels, a colour-coded mask visualisation, and a combined RGB–mask overlay. The dataset contains fine-grained polygon-level labels for 28 SAR-relevant classes, supporting detailed scene interpretation and UAV-based situational awareness in disaster-response operations.
Figure 4.
Representative samples from D’RespNeT showing diverse post-earthquake urban scenes and their instance-segmentation annotations. Each row presents a different UAV-captured disaster site. The columns show the original input frame, ground-truth polygon annotations, class-labelled predictions, YOLO inference with instance masks and class labels, a colour-coded mask visualisation, and a combined RGB–mask overlay. The dataset contains fine-grained polygon-level labels for 28 SAR-relevant classes, supporting detailed scene interpretation and UAV-based situational awareness in disaster-response operations.
Figure 5.
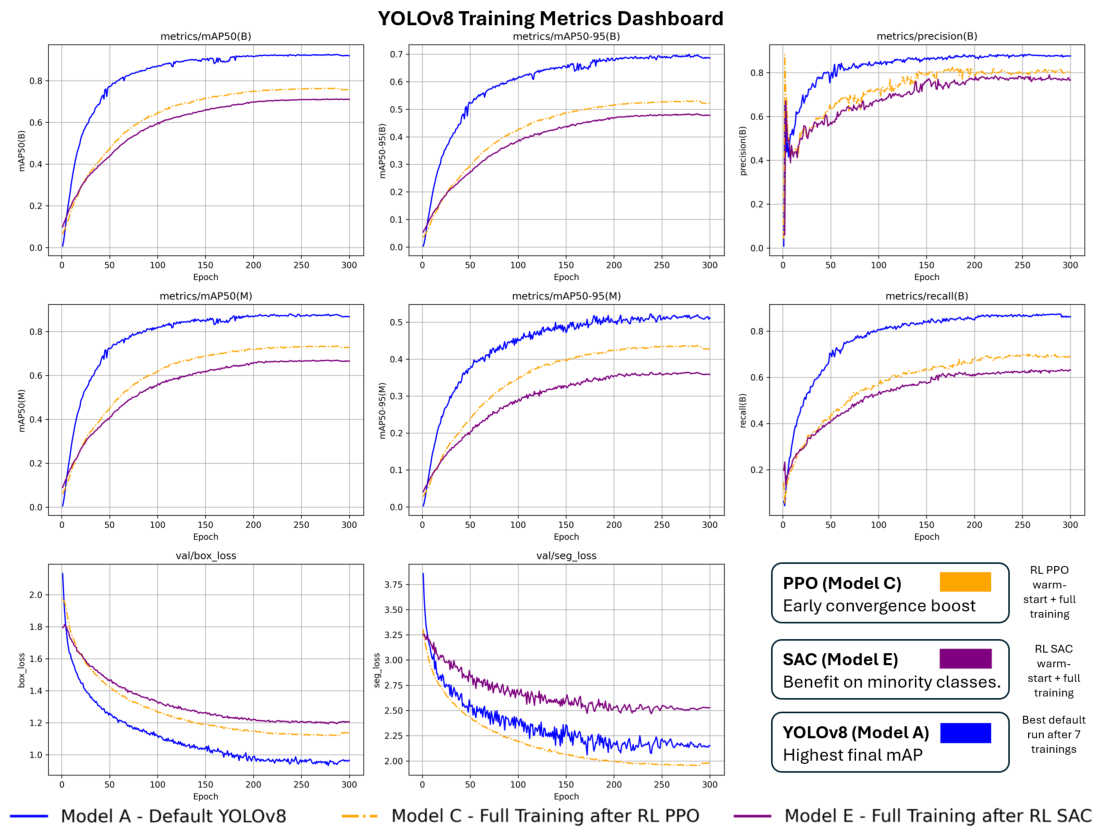
YOLOv8 training metrics comparing default training (Model A) with RL-initialised fine-tuning using PPO (Model C) and SAC (Model E). Models C and E begin from checkpoints generated by the custom PPO/SAC warm-start script before supervised fine-tuning. The upper panels report mAP, precision, and recall on their native scales, whereas the lower panels report validation losses on their native loss scales. The default schedule achieves the strongest final global mAP in the displayed experiment; RL is therefore not presented as the main driver of final accuracy. Its practical interpretation is narrower: the displayed warm starts produce different, and during some intervals smoother, early optimisation trajectories that may benefit selected difficult or under-represented SAR classes. The figure does not establish statistically significant stability or per-class superiority.
Figure 5.
YOLOv8 training metrics comparing default training (Model A) with RL-initialised fine-tuning using PPO (Model C) and SAC (Model E). Models C and E begin from checkpoints generated by the custom PPO/SAC warm-start script before supervised fine-tuning. The upper panels report mAP, precision, and recall on their native scales, whereas the lower panels report validation losses on their native loss scales. The default schedule achieves the strongest final global mAP in the displayed experiment; RL is therefore not presented as the main driver of final accuracy. Its practical interpretation is narrower: the displayed warm starts produce different, and during some intervals smoother, early optimisation trajectories that may benefit selected difficult or under-represented SAR classes. The figure does not establish statistically significant stability or per-class superiority.
Figure 6.
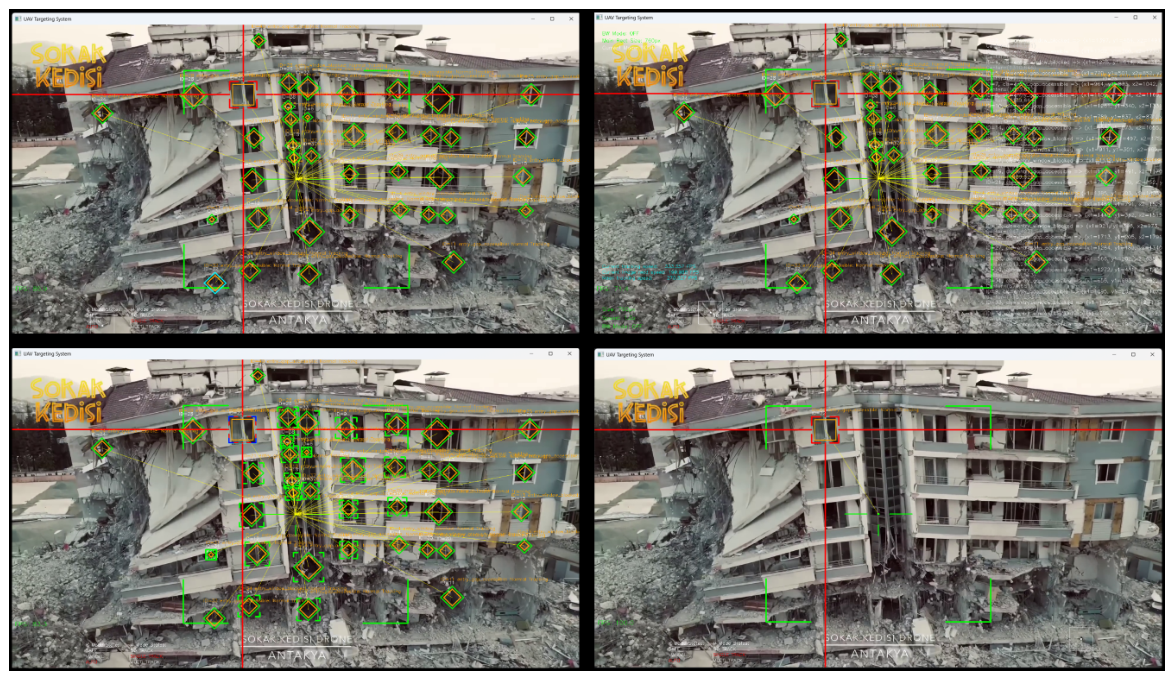
Operator logging, scene-change capture, and track hygiene. The operator can log data for either a selected target or all targets, while adaptive scene-change detection saves a snapshot at the moment of transition. Track-hygiene rules remove duplicate and overlapping boxes, retire boxes that remain at the frame boundary for a configurable patience window (50 frames by default), clear all recurrently continued boxes after a scene change and trigger reacquisition, and provide HUD controls for manual removal or cancellation. The test video is derived from aerial UAV footage of Antakya, Turkey, recorded more than two months after the February 2023 earthquakes [
37].
Figure 6.
Operator logging, scene-change capture, and track hygiene. The operator can log data for either a selected target or all targets, while adaptive scene-change detection saves a snapshot at the moment of transition. Track-hygiene rules remove duplicate and overlapping boxes, retire boxes that remain at the frame boundary for a configurable patience window (50 frames by default), clear all recurrently continued boxes after a scene change and trigger reacquisition, and provide HUD controls for manual removal or cancellation. The test video is derived from aerial UAV footage of Antakya, Turkey, recorded more than two months after the February 2023 earthquakes [
37].
Figure 7.
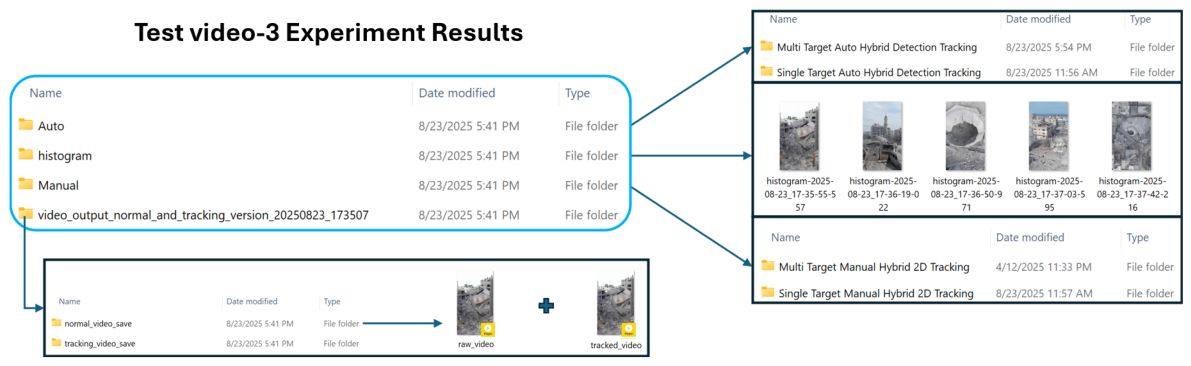
Test video-3: output structure and logs. The composite screenshot shows artefacts produced during a single run. Top-left: the root output directory contains the per-mode folders Auto and Manual, the histogram directory for scene-cut snapshots, and a timestamped run folder (e.g., video_output_normal_and_tracking_version_20250823_173507). Within the run folder, dual recordings are saved as normal_video_save/raw_video.avi (raw feed) and tracking_video_save/tracked_video.avi (HUD overlay). Top-right: example scene-cut JPEGs and the mode-specific logging roots for Multi- and Single-Target operation. Bottom: an excerpt from the frame-wise CSV log (e.g., log_20250823_173749.csv) showing the fields FrameIndex, VideoSpeed, FPS, NumTargets, TargetID, ClassName, X1, Y1, X2, Y2, CenterX, CenterY, and Size. These fields support after-action analysis and metric recomputation, including Success@0.5, ID switches, and throughput. Hotkeys: U for dual recording, E to toggle CSV logging (the file is written when logging is switched off), and S to save PNG snapshots to .../normal_image_save/ and .../calibration_image_save/.
Figure 7.
Test video-3: output structure and logs. The composite screenshot shows artefacts produced during a single run. Top-left: the root output directory contains the per-mode folders Auto and Manual, the histogram directory for scene-cut snapshots, and a timestamped run folder (e.g., video_output_normal_and_tracking_version_20250823_173507). Within the run folder, dual recordings are saved as normal_video_save/raw_video.avi (raw feed) and tracking_video_save/tracked_video.avi (HUD overlay). Top-right: example scene-cut JPEGs and the mode-specific logging roots for Multi- and Single-Target operation. Bottom: an excerpt from the frame-wise CSV log (e.g., log_20250823_173749.csv) showing the fields FrameIndex, VideoSpeed, FPS, NumTargets, TargetID, ClassName, X1, Y1, X2, Y2, CenterX, CenterY, and Size. These fields support after-action analysis and metric recomputation, including Success@0.5, ID switches, and throughput. Hotkeys: U for dual recording, E to toggle CSV logging (the file is written when logging is switched off), and S to save PNG snapshots to .../normal_image_save/ and .../calibration_image_save/.

Figure 8.
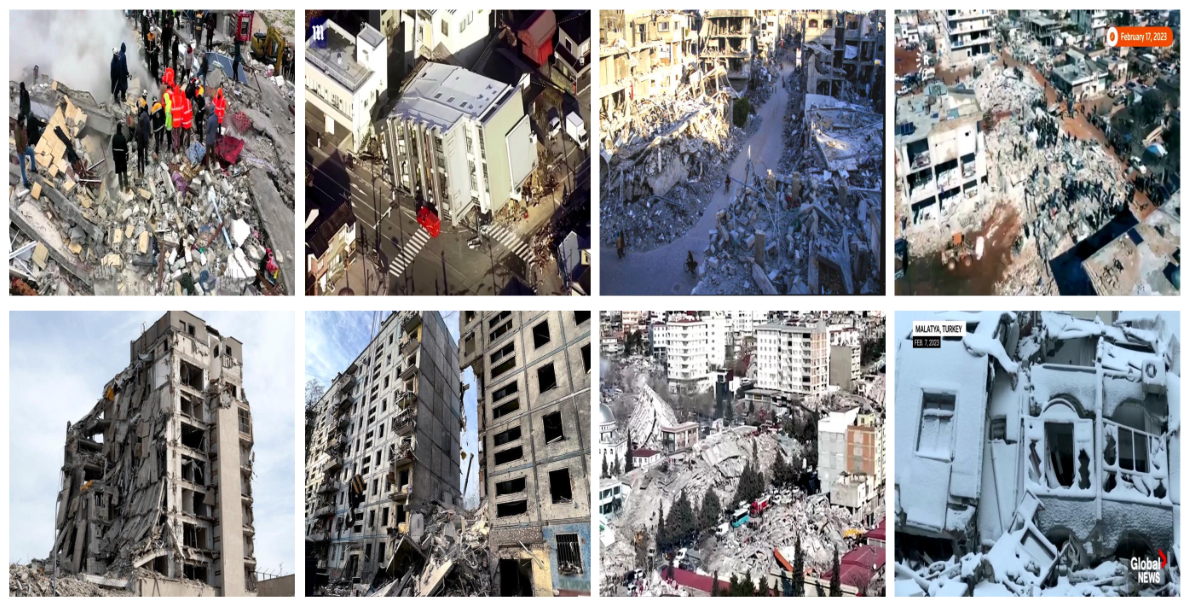
Scenario archetypes representing typical post-earthquake SAR environments: dense urban rubble with dust and rescue teams, high-rise structural collapse, wide-area destruction, occlusion-heavy streets and façades, and weather-affected ruins such as snow-covered buildings.
Figure 8.
Scenario archetypes representing typical post-earthquake SAR environments: dense urban rubble with dust and rescue teams, high-rise structural collapse, wide-area destruction, occlusion-heavy streets and façades, and weather-affected ruins such as snow-covered buildings.
Figure 9.
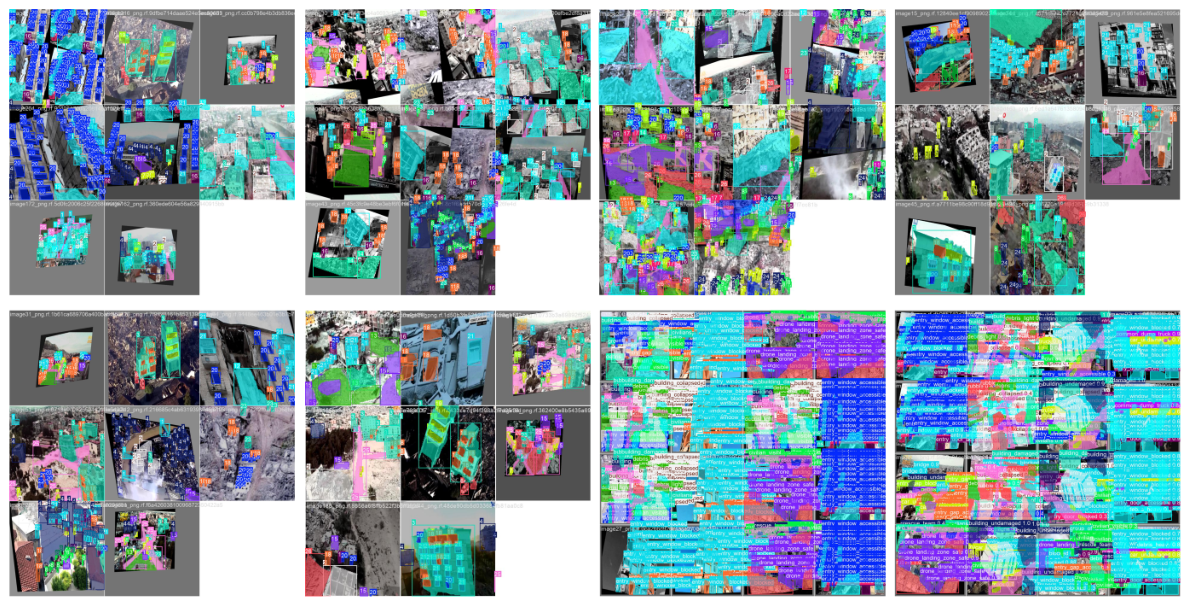
Examples of ground-truth annotations in D’RespNeT. Each image shows polygon-level masks and bounding boxes assigned to 28 disaster-response classes, including collapsed and damaged buildings, blocked and accessible entry points, debris categories, vehicles, and human presence. These examples illustrate the fine-grained instance-level detail required for reliable UAV-based situational awareness in post-earthquake environments. Colours correspond to the displayed semantic class labels and do not encode an additional rank or score; severity is conveyed only by the class name.
Figure 9.
Examples of ground-truth annotations in D’RespNeT. Each image shows polygon-level masks and bounding boxes assigned to 28 disaster-response classes, including collapsed and damaged buildings, blocked and accessible entry points, debris categories, vehicles, and human presence. These examples illustrate the fine-grained instance-level detail required for reliable UAV-based situational awareness in post-earthquake environments. Colours correspond to the displayed semantic class labels and do not encode an additional rank or score; severity is conveyed only by the class name.
Figure 10.
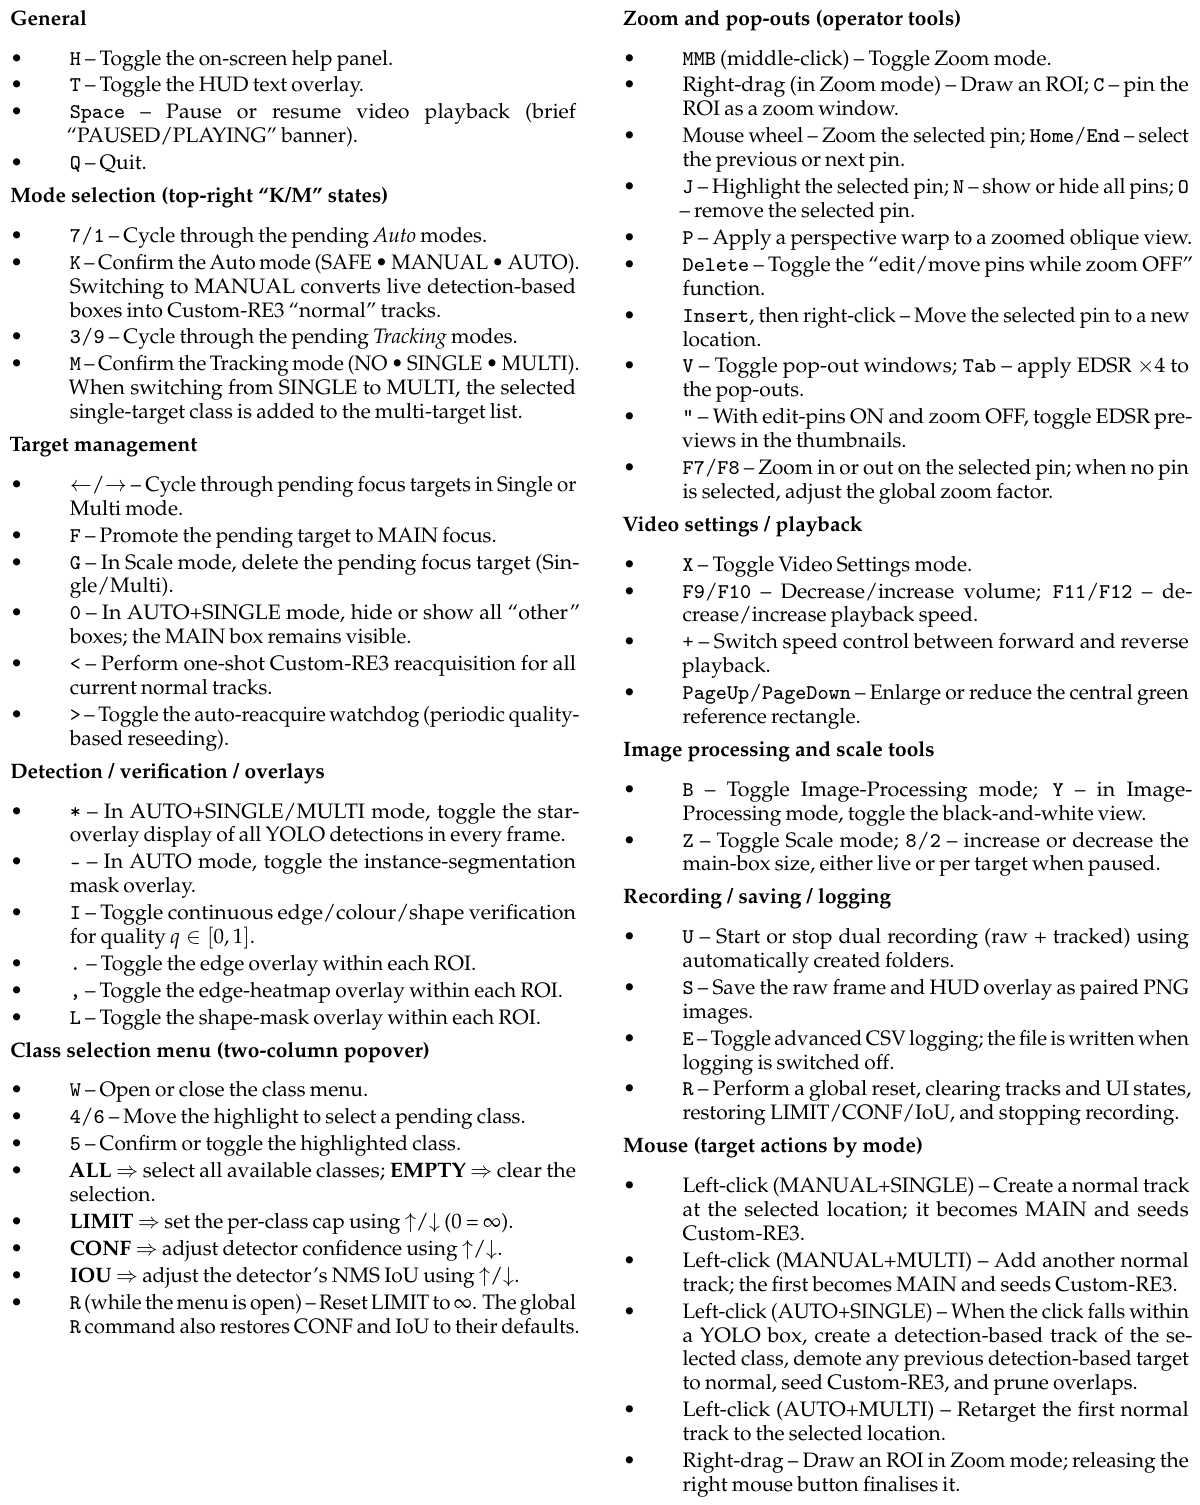
TerraGuardAI HUD keyboard and mouse controls. The up- and down-arrow keys increase and decrease the currently selected parameter, respectively.
Figure 10.
TerraGuardAI HUD keyboard and mouse controls. The up- and down-arrow keys increase and decrease the currently selected parameter, respectively.
Figure 11.
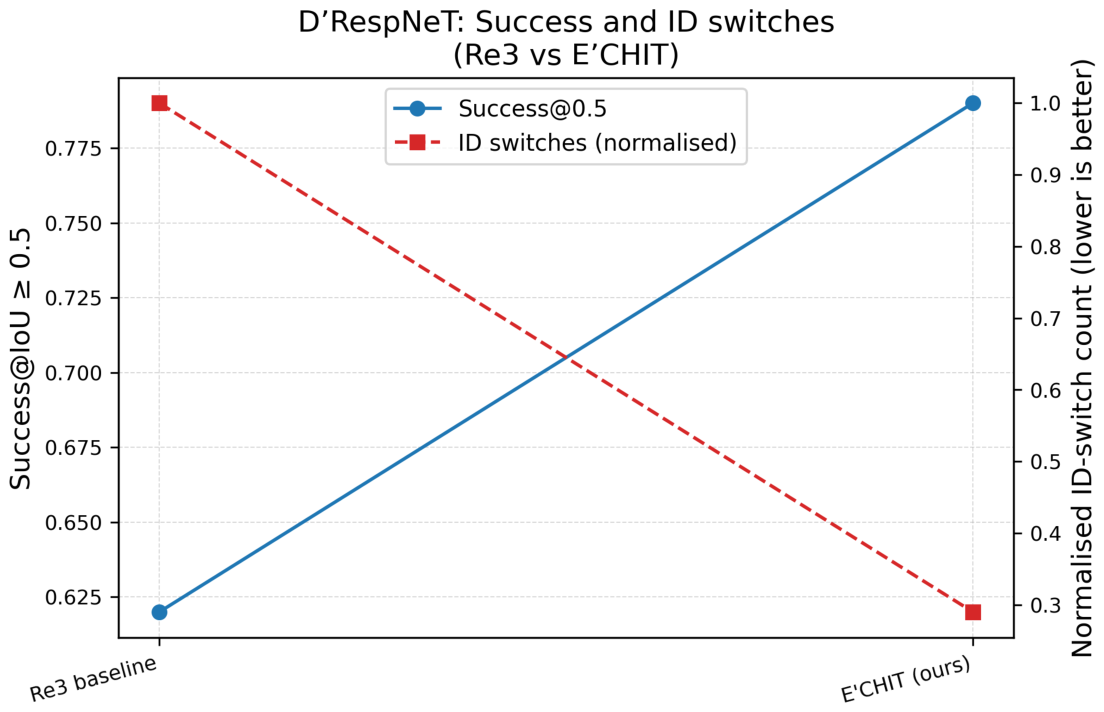
D’RespNeT mission-oriented comparison of the RE3 baseline and full E’CHIT using Success@0.5 (higher is better) and the normalised ID-switch count (lower is better). This comparison supports the paper’s primary quantitative claims.
Figure 11.
D’RespNeT mission-oriented comparison of the RE3 baseline and full E’CHIT using Success@0.5 (higher is better) and the normalised ID-switch count (lower is better). This comparison supports the paper’s primary quantitative claims.
Figure 12.
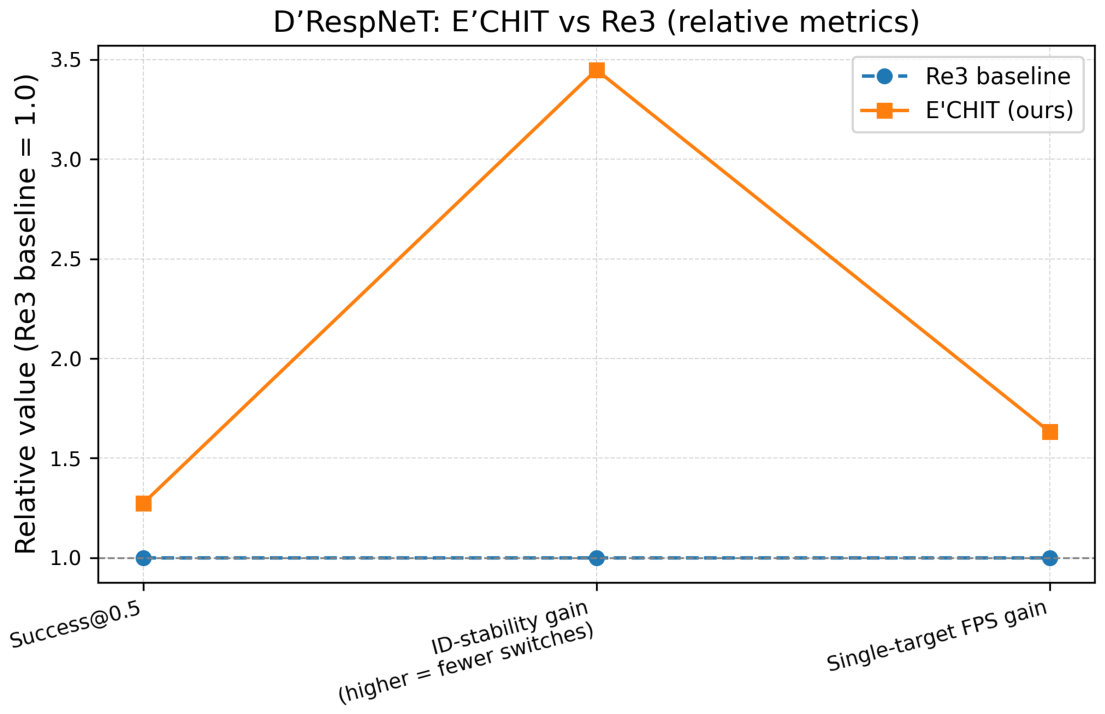
Descriptive relative factors on D’RespNeT (RE3 baseline = 1.0). E’CHIT increases Success@0.5 and the inverse identity-switch factor (higher values indicate fewer switches). The speed factor summarises the observed single-target configuration. The grey dashed horizontal line marks the RE3-normalised reference value of 1.0. The plot visualises the aggregate results and does not constitute a separate statistical test.
Figure 12.
Descriptive relative factors on D’RespNeT (RE3 baseline = 1.0). E’CHIT increases Success@0.5 and the inverse identity-switch factor (higher values indicate fewer switches). The speed factor summarises the observed single-target configuration. The grey dashed horizontal line marks the RE3-normalised reference value of 1.0. The plot visualises the aggregate results and does not constitute a separate statistical test.
Figure 13.
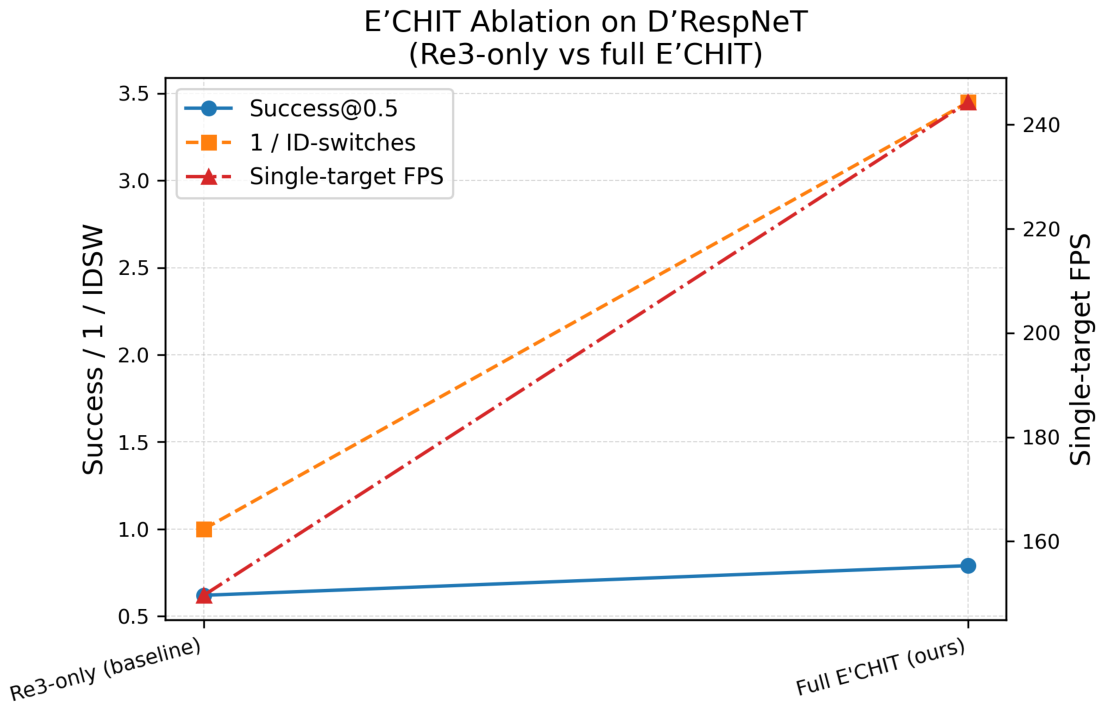
System-level ablation-style comparison on D’RespNeT: RE3-only versus full E’CHIT. The plot reports Success@0.5, an inverse ID-switch indicator (higher values imply fewer switches), and single-target FPS on the right axis. Only the complete baseline-to-system contrast is fully quantified; the figure should not be interpreted as a factorial numerical decomposition of the individual modules.
Figure 13.
System-level ablation-style comparison on D’RespNeT: RE3-only versus full E’CHIT. The plot reports Success@0.5, an inverse ID-switch indicator (higher values imply fewer switches), and single-target FPS on the right axis. Only the complete baseline-to-system contrast is fully quantified; the figure should not be interpreted as a factorial numerical decomposition of the individual modules.
Figure 14.
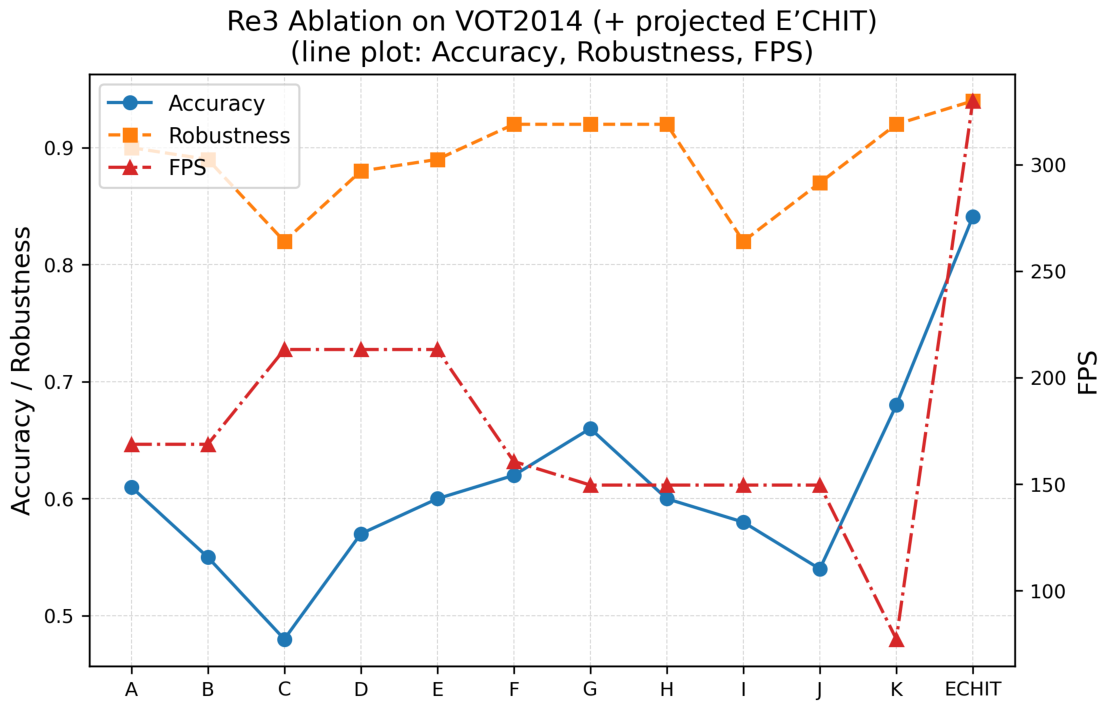
Historical, literature-derived RE3/VOT2014 contextual line plot (variants A–K). The background values reproduce results reported in previous research. The E’CHIT marker is an indicative, non-official cross-protocol placement based on the internal SAR evaluation; it is neither a VOT2014 run nor a score, rank, or protocol-identical comparison.
Figure 14.
Historical, literature-derived RE3/VOT2014 contextual line plot (variants A–K). The background values reproduce results reported in previous research. The E’CHIT marker is an indicative, non-official cross-protocol placement based on the internal SAR evaluation; it is neither a VOT2014 run nor a score, rank, or protocol-identical comparison.
Figure 15.
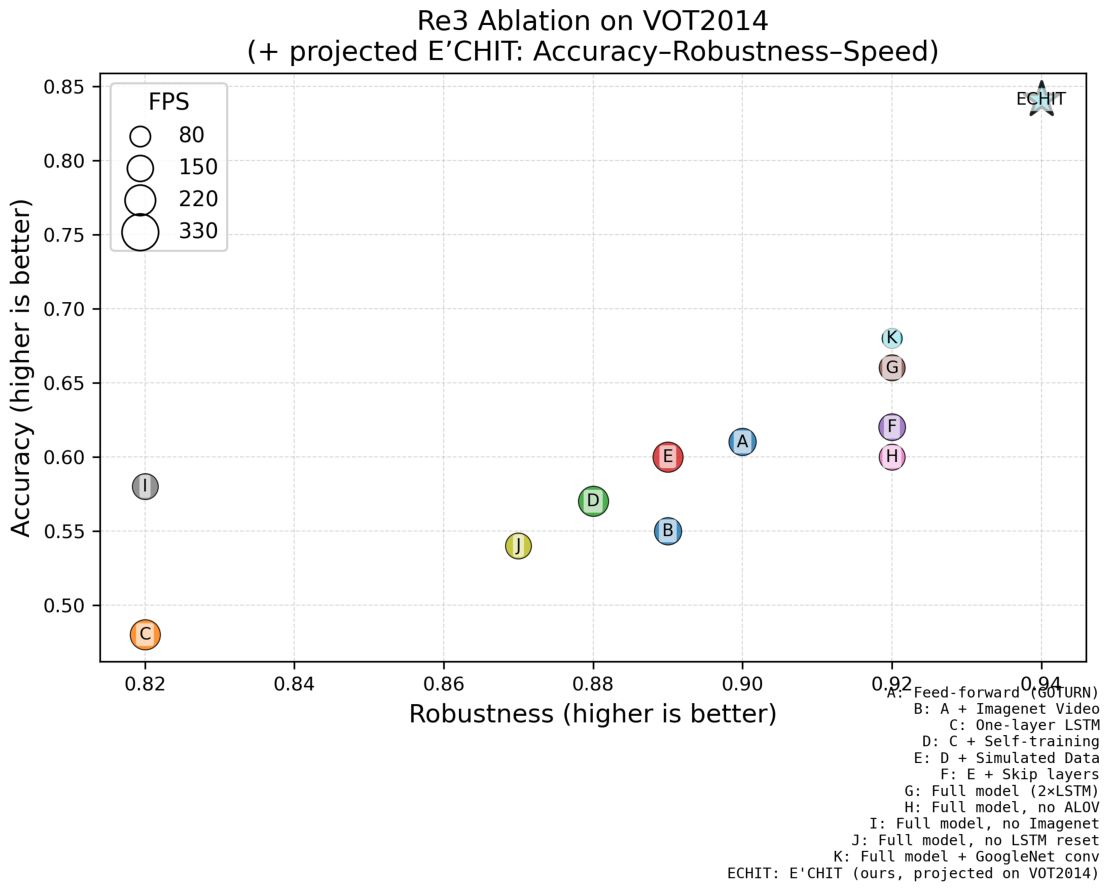
Historical, literature-derived RE3/VOT2014 Accuracy–Robustness context, with bubble size representing FPS. The E’CHIT marker is included solely for visual orientation and is excluded from official benchmark and superiority claims.
Figure 15.
Historical, literature-derived RE3/VOT2014 Accuracy–Robustness context, with bubble size representing FPS. The E’CHIT marker is included solely for visual orientation and is excluded from official benchmark and superiority claims.
Figure 16.
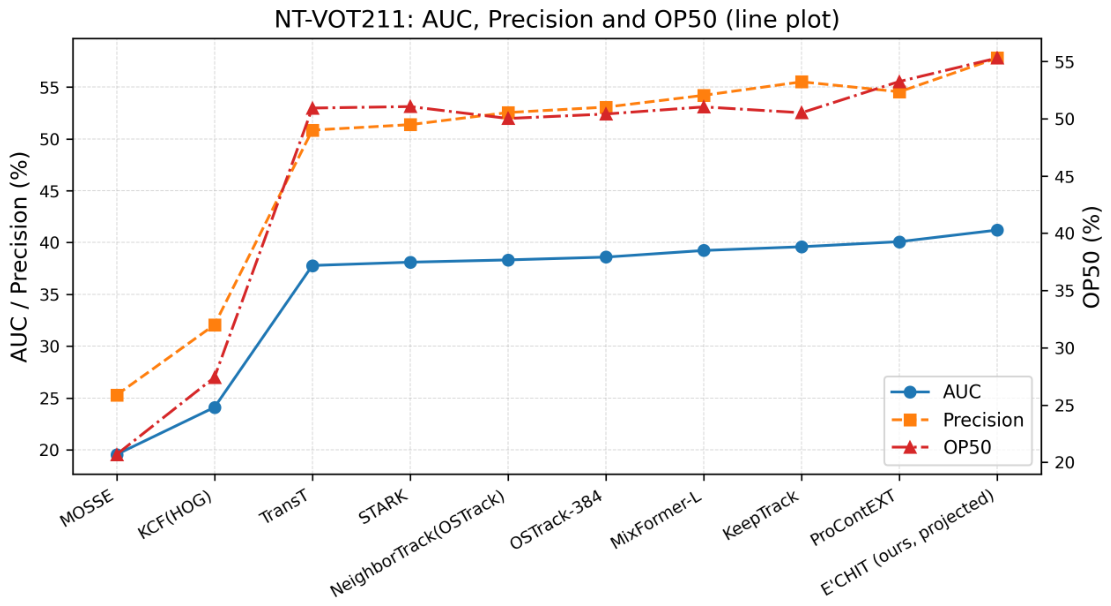
Historical, literature-derived NT-VOT211 contextual line plot showing AUC, Precision, and OP50 for representative trackers. Any E’CHIT marker is non-official and cross-protocol and is not presented as an NT-VOT211 score, rank, or direct-comparison result.
Figure 16.
Historical, literature-derived NT-VOT211 contextual line plot showing AUC, Precision, and OP50 for representative trackers. Any E’CHIT marker is non-official and cross-protocol and is not presented as an NT-VOT211 score, rank, or direct-comparison result.
Figure 17.
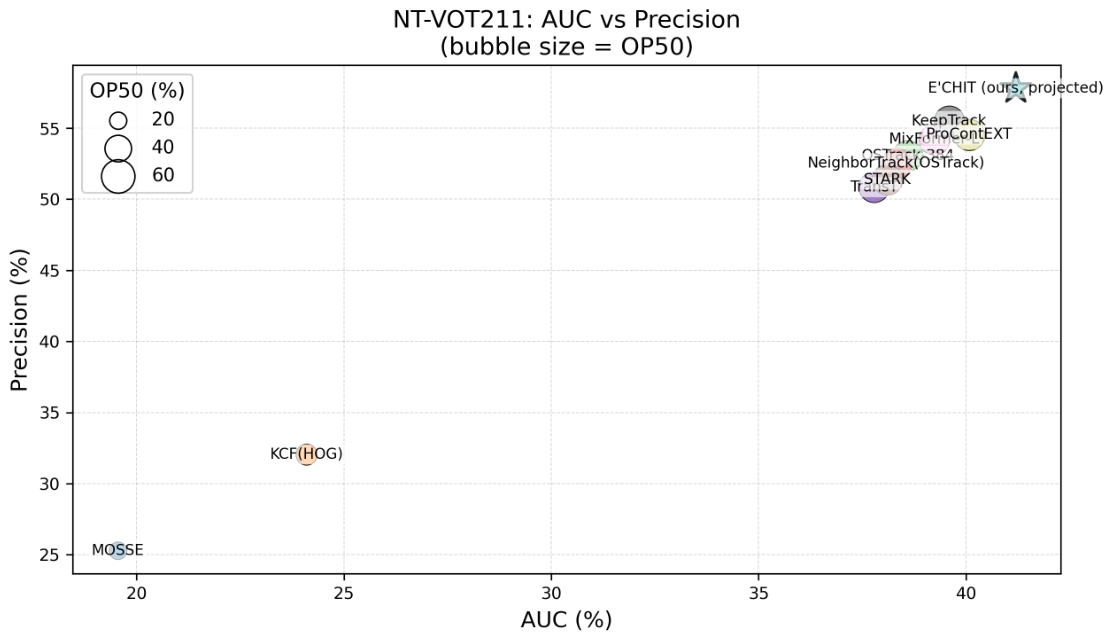
Historical, literature-derived NT-VOT211 contextual bubble plot showing AUC versus Precision, with bubble size representing OP50. The E’CHIT marker indicates only the internal SAR operating point and is not an official benchmark submission.
Figure 17.
Historical, literature-derived NT-VOT211 contextual bubble plot showing AUC versus Precision, with bubble size representing OP50. The E’CHIT marker indicates only the internal SAR operating point and is not an official benchmark submission.
Figure 18.
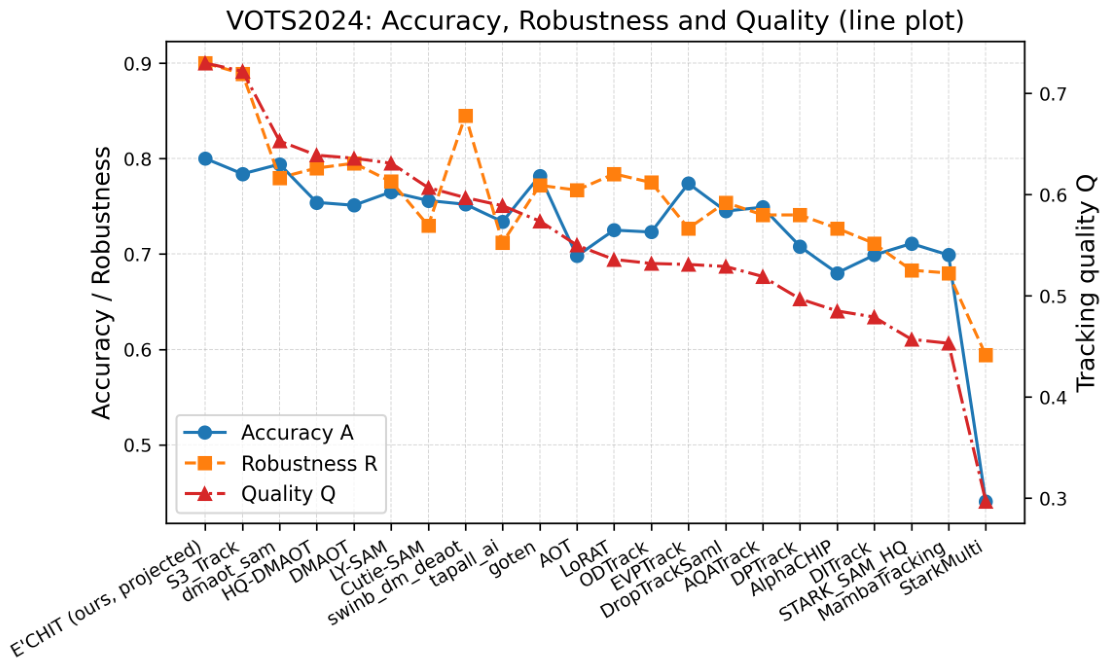
Historical, literature-derived VOTS2024 contextual line plot showing Accuracy (A), Robustness (R), and Quality (Q). Any E’CHIT marker is a non-official operating-point illustration rather than a VOTS2024 score, rank, or protocol-identical result.
Figure 18.
Historical, literature-derived VOTS2024 contextual line plot showing Accuracy (A), Robustness (R), and Quality (Q). Any E’CHIT marker is a non-official operating-point illustration rather than a VOTS2024 score, rank, or protocol-identical result.
Figure 19.
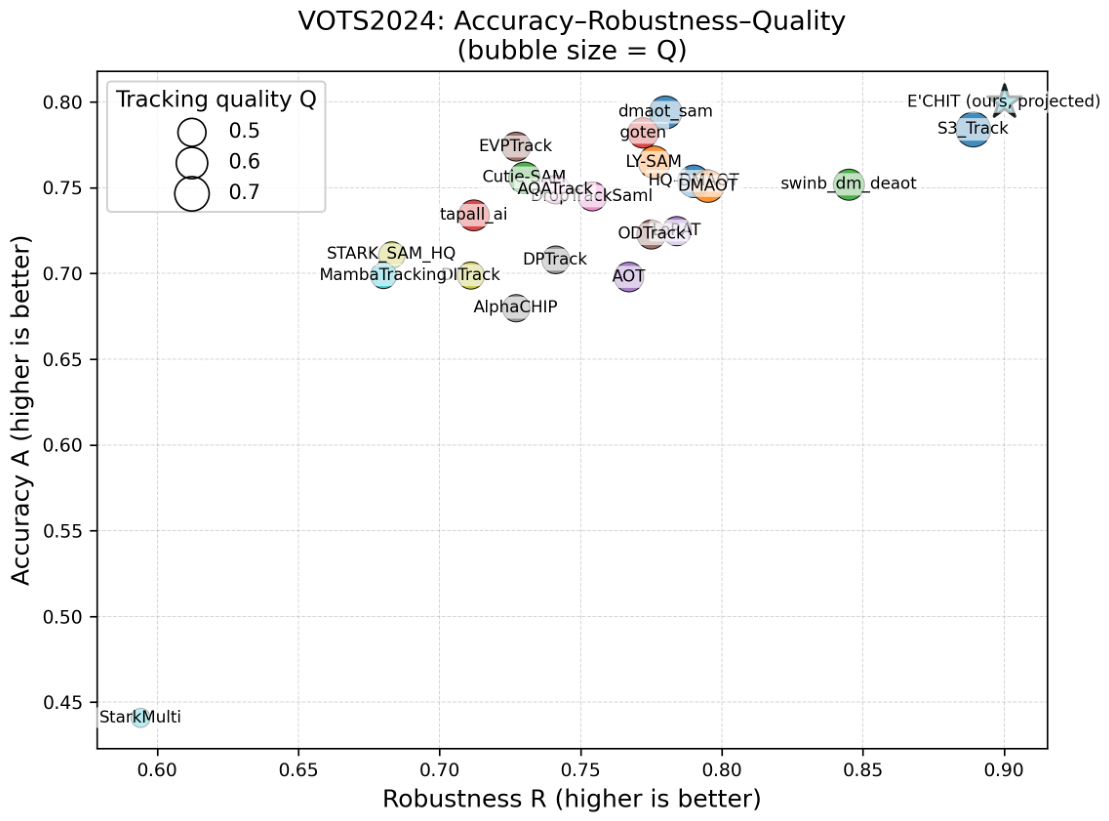
Historical, literature-derived VOTS2024 contextual bubble plot showing Accuracy versus Robustness, with bubble size representing Quality. The E’CHIT marker provides visual context only and is excluded from official benchmark and superiority claims.
Figure 19.
Historical, literature-derived VOTS2024 contextual bubble plot showing Accuracy versus Robustness, with bubble size representing Quality. The E’CHIT marker provides visual context only and is excluded from official benchmark and superiority claims.
Table 1.
Contribution hierarchy used in this study. The primary scientific contribution is separated from the supporting components to present the paper as a focused tracking study rather than a collection of independent modules.
Table 1.
Contribution hierarchy used in this study. The primary scientific contribution is separated from the supporting components to present the paper as a focused tracking study rather than a collection of independent modules.
| Role in the Paper | Component | How It Supports the Central Claim |
|---|
| Primary scientific contribution | E’CHIT identity-stabilised detector-assisted tracking | The evaluated implementation uses Custom-RE3 and combines DRN proposals, recurrent continuation, EOMC verification, and scene-cut hygiene to maintain target identity in authentic disaster-response UAV footage. The outer interface can be adapted to other compatible trackers after tracker-specific tuning. |
| Algorithmic sub-contribution | EOMC verifier and cut-aware state hygiene | Provides interpretable quality gating and prevents stale recurrent states from persisting across abrupt scene changes. |
| Experimental foundation | D’RespNeT and held-out UAV footage | Provides SAR-specific classes and mission-linked sequences for evaluating Success@0.5, identity switches, temporal coherence, and runtime. |
| Auxiliary training component | PPO/SAC detector warm start | Used only before deployment to support convergence and the learning of difficult classes; it is not the primary tracking contribution and does not run during inference. |
| Deployment/system component | TerraGuardAI HUD and logging layer | Converts identity-stable tracks into actionable SAR cues while ensuring that UI-based inspection remains non-causal with respect to the tracker state. |
Table 2.
Per-class polygon-instance distribution in the D’RespNeT snapshot used for detector training. The counts total 6288 instances across 28 SAR-relevant classes.
Table 2.
Per-class polygon-instance distribution in the D’RespNeT snapshot used for detector training. The counts total 6288 instances across 28 SAR-relevant classes.
| Class | Instances | Class | Instances |
|---|
| entry window blocked | 1057 | entry gap accessible | 917 |
| civilian visible | 702 | car undamaged | 616 |
| building damaged | 380 | entry window accessible | 366 |
| building collapsed | 305 | debris heavy | 263 |
| road | 233 | rescue team | 224 |
| building undamaged | 222 | group of civilians | 209 |
| rubble | 110 | drone landing zone safe | 109 |
| debris moderate | 104 | entry gap block accessible | 77 |
| entry door accessible | 69 | debris light | 60 |
| excavator | 59 | truck | 58 |
| car damaged | 46 | bus | 31 |
| bridge | 24 | backhoe loader | 18 |
| entry door blocked | 12 | crawler loader | 11 |
| common dump truck | 5 | crawler crane | 1 |
Table 3.
D’RespNeT dataset statistics used by the detector-to-tracker pipeline. The frame-based dataset was curated from approximately 30 publicly available source videos. The frame, split, and instance counts are exact, whereas the number of source videos is approximate.
Table 3.
D’RespNeT dataset statistics used by the detector-to-tracker pipeline. The frame-based dataset was curated from approximately 30 publicly available source videos. The frame, split, and instance counts are exact, whereas the number of source videos is approximate.
| Split/Source Item | Minimal | Moderate | Severe | Total | Notes |
|---|
| Original train frames | 44 | 67 | 53 | 164 | Manually annotated frames before augmentation. |
| Augmented train images | 220 | 335 | 265 | 820 | Five augmented variants per original training frame. |
| Validation frames | 6 | 8 | 7 | 21 | Retained unchanged for validation. |
| Test frames | 5 | 9 | 6 | 20 | Retained unchanged for final evaluation. |
| Original source frames | 55 | 84 | 66 | 205 | Stratified by scene-level accessibility category. |
| Public source videos | – | – | – | ≈30 | Public UAV, news, and livestream videos; most yielded 2–5 representative frames, with additional frames retained from longer or more diverse sources. |
| Final image count after augmentation | – | – | – | 861 | 820 training + 21 validation + 20 test images. |
| Polygon instances | – | – | – | 6288 | 28 classes; mean of 30.7 annotated instances per original frame. |
| Input format | – | – | – | 640 × 640 | Standardised from 1080p public UAV footage for YOLOv8-seg training. |
| Tracking evaluation regimes | – | – | – | 2 | Dataset-linked sequences use 3–5 labelled checkpoints; held-out videos support generalisation and checks of mission-relevant behaviour. |
Table 4.
Geographic and event-source coverage used for D’RespNeT training and E’CHIT stress testing. The primary quantitative split is reported in
Table 3; this table summarises source diversity and the operational role of each source type.
Table 4.
Geographic and event-source coverage used for D’RespNeT training and E’CHIT stress testing. The primary quantitative split is reported in
Table 3; this table summarises source diversity and the operational role of each source type.
| Event/Source Type | Geographic Coverage | Use in the Study |
|---|
| 2023 Türkiye earthquake UAV footage | Türkiye, including severely affected urban areas in and around Antakya and Gaziantep | Primary post-earthquake source for dataset curation, detector-training context, and dataset-linked tracking checks. |
| Myanmar earthquake footage | Earthquake-affected urban areas in Myanmar | Cross-event visual context and held-out stress testing where footage quality permits. |
| Japan earthquake/tsunami and comparable post-disaster footage | Coastal and urban areas in Japan affected by earthquakes or tsunamis | Domain-diversity context for post-disaster structures, debris, and route-obstruction patterns. |
| Weather-affected, cyclone, demolition, and war-impacted proxy footage | Comparable damaged or obstructed urban environments | Used only as contextual or held-out stress-test material for dust, snow, occlusion, hard cuts, and appearances resembling structural collapse. |
Table 5.
Axis and metric definitions for
Figure 5. This table distinguishes the metric and loss scales and clarifies that RL is used only during training.
Table 5.
Axis and metric definitions for
Figure 5. This table distinguishes the metric and loss scales and clarifies that RL is used only during training.
| Panel Group | Y-Axis Quantity | Interpretation |
|---|
| mAP panels | mAP50 and mAP50:95, native scale | Measure aggregate detector quality; the default supervised schedule remains the strongest final global mAP reference. |
| Precision/recall panels | Precision and recall, native scale | Monitor how the warm start changes detector learning for SAR-relevant targets; no claim of improved stability is made without repeated seeds. |
| Loss panels | Validation box, segmentation, and classification losses on their native scales | Lower values indicate improved optimisation behaviour; loss values are not directly comparable with mAP values. |
| Deployment status | No RL policy at inference | The deployed E’CHIT pipeline loads fixed YOLOv8-seg weights; PPO/SAC do not run during real-time tracking. |
Table 6.
Architecture and state handling of the Custom-RE3 recurrent regressor used within E’CHIT.
Table 6.
Architecture and state handling of the Custom-RE3 recurrent regressor used within E’CHIT.
| Component | Role in the E’CHIT Pipeline |
|---|
| Input crop pair | Two search regions are cropped around the previous box: one from and one from . The crops are padded around the target, resized to the tracker input size, and normalised. |
| Shared CNN towers | A weight-shared CNN encoder, following the convolutional feature-learning principle introduced by LeCun et al. [36], maps the previous and current crops to appearance–motion feature vectors. Weight sharing preserves a symmetric comparison and avoids the need for a second feature extractor. |
| Feature fusion | The two crop features are concatenated with a normalised descriptor of the previous box, providing the temporal module with both appearance and geometric context. |
| Recurrent head | An LSTM maintains a short-term hidden state for each active track and predicts a normalised bounding-box displacement rather than a class label. |
| Output head | A linear regression head converts the LSTM output into centre and scale changes and maps them back to image coordinates. |
| State reset/refresh | Detector reseeding or a hard scene cut resets the recurrent state to zero. High-quality EOMC evidence permits continued recurrent tracking, whereas low-quality evidence triggers reacquisition. |
| Tracker–adapter interface | E’CHIT exchanges initialisation/reseeding, prediction, reset, and bounding-box/state information with the temporal tracker. Custom-RE3 is the evaluated implementation; other compatible trackers require adapter modifications and tracker-specific retuning. |
Table 7.
Evaluation inventory and claim boundaries. Exact frame and split quantities are reported where available; the total number of source videos is approximate, and held-out clips are excluded from the labelled-frame Success@0.5 denominator.
Table 7.
Evaluation inventory and claim boundaries. Exact frame and split quantities are reported where available; the total number of source videos is approximate, and held-out clips are excluded from the labelled-frame Success@0.5 denominator.
| Evaluation Item | Available Quantity | Role in the Paper |
|---|
| Public source-video pool | Approximately 30 videos | Public UAV, news, and livestream sources used for dataset curation and sequence-level study; most contributed 2–5 representative images, with additional non-duplicate images retained from longer or more diverse sources. |
| Original annotated images | 205 | Exact pre-augmentation count: 164 training, 21 validation, and 20 test images. |
| Augmented detector training images | 820 | Five training variants per original training image; validation and test images remain unaugmented. |
| Dataset-linked tracking checkpoints | 3–5 selected frames per sequence | Support Success@0.5 and identity-consistency checks at mission-relevant points; checkpoint spacing varies with sequence length. |
| Held-out public clips | Additional stress-test material | Support diagnostic checks of generalisation, occlusion, scene cuts, and qualitative deployment behaviour; excluded from the primary labelled-frame denominator. |
| Primary reported outcomes | Success@0.5, normalised ID-switch change, and observed FPS ranges | Directly support the central quantitative claims. |
| Diagnostic outcomes | Fragmentation, time-to-reacquire, cut suppression, and operator actions | Definitions and logging support are provided; no complete aggregate estimate is reported where event denominators are incomplete. |
Table 8.
Frame-level CSV schema, with one row for each frame–target pair.
Table 8.
Frame-level CSV schema, with one row for each frame–target pair.
| Field | Meaning |
|---|
| FrameIndex | Sequential frame counter. |
| VideoSpeed | Processing-speed multiplier relative to real time. |
| FPS | Instantaneous frames per second. |
| NumTargets | Number of targets in the current frame. |
| TargetID | Unique identifier for the tracked target. |
| ClassName | Predicted class label. |
| X1, Y1, X2, Y2 | Bounding box corners (pixel coordinates). |
| CenterX, CenterY | Bounding box center (pixels). |
| Size | Bounding-box area (pixels2) or an equivalent measure. |
Table 9.
Operator controls and saved artefacts.
Table 9.
Operator controls and saved artefacts.
| Key | Action | Output Paths/Filenames |
|---|
| E | Toggle logging; switching logging off flushes the buffer | .../<Mode>/log_YYYYMMDD_HHMMSS.csv |
| U | Record both raw and overlaid video | .../normal_video_save/raw_video.avi;
.../tracking_video_save/tracked_video.avi |
| S | Save paired PNG snapshots (raw + overlay) | .../normal_image_save/; .../calibration_image_save/ |
| – | Scene-cut module (when enabled) | One JPEG per cut in .../histogram/ |
Table 10.
Evidence matrix for the experimental protocol. The table distinguishes directly measured quantities from current limitations and targets for future dense annotation.
Table 10.
Evidence matrix for the experimental protocol. The table distinguishes directly measured quantities from current limitations and targets for future dense annotation.
| Evaluation Question | Available Evidence | Current Interpretation | Remaining Limitation/Future Action |
|---|
| Tracking overlap | Sparse labelled frames in dataset-linked sequences | Supports Success@0.5 evaluation at selected mission checkpoints. | Dense frame-by-frame annotation would enable AUC/success curves and significance testing across all frames. |
| Temporal identity | Same-object matching across labelled checkpoints and logs | Supports checks of ID switches and fragmentation between labelled events. | Dense tracklets are required for full HOTA/IDF1/MOTA-style MOT evaluation. |
| Occlusion recovery | Event tags, EOMC quality reductions, reacquisition flags, and post-event labelled frames | Supports time-to-reacquire measurements and qualitative/quantitative checks of occlusion recovery. | Additional occlusion-specific labels would permit confidence intervals for individual occlusion types. |
| Hard scene cuts | Luminance/HSV cut scores and one-frame ghost-box-suppression logs | Supports assessment of state hygiene after abrupt edits. | Public benchmark-style cut datasets would strengthen external comparisons. |
| Runtime and operator load | Per-frame logs, FPS/latency measurements, and the actions-per-minute proxy | Supports claims concerning deployment feasibility and responsiveness. | Formal user studies are required for statistically supported human-factors claims. |
Table 11.
HUD design choices that establish the operator interface as a systems-level contribution rather than a passive visualisation layer.
Table 11.
HUD design choices that establish the operator interface as a systems-level contribution rather than a passive visualisation layer.
| HUD Mechanism | Implementation | Operational Benefit |
|---|
| Mode gating | SAFE/MANUAL/AUTO and NO/SINGLE/MULTI states are latched before tracker handover. | Prevents ambiguous authority changes and reduces unintended mode transitions during target handover. |
| Debounced inputs | Keyboard, mouse, and GUI-button commands are rising-edge gated and mirrored between onboard and ground-control builds. | Reduces repeated triggers and preserves consistent operator intent during rapid SAR operations. |
| Non-causal UI layer | Zoom, EDSR, overlays, logs, and pop-out windows consume tracker outputs but modify the estimator only through explicit controls. | Preserves repeatable tracking behaviour while supporting detailed inspection and after-action review. |
| Quality-aware reacquisition | EOMC quality q governs visual warnings, one-shot reacquisition, and auto-reacquire watchdog logic. | Helps the operator recover tracks after occlusion or detector dropout without silently accepting drift. |
| Audit and logging | Per-frame CSV records, snapshots, raw and annotated video, and scene-cut events are stored for each run. | Supports traceability, reproducibility, and subsequent mission review. |
Table 12.
Descriptive effect sizes for the primary measured comparison. The normalised IDSW measure uses the RE3-only value as the reference value of 1.00.
Table 12.
Descriptive effect sizes for the primary measured comparison. The normalised IDSW measure uses the RE3-only value as the reference value of 1.00.
| Metric | RE3-Only | Full E’CHIT | Descriptive Effect |
|---|
| Success@0.5 | 0.62 | 0.79 | Absolute gain ; relative gain . |
| Normalised identity switch count | 1.00 | ≈0.29 | Absolute normalised reduction ≈0.71; relative reduction ≈71%. |
| Single-target throughput | Baseline-specific range not used as a paired claim | Observed range of 164–330 FPS | Demonstrates real-time feasibility for the full pipeline; no paired statistical speed test is claimed. |
Table 13.
Protocol-aware comparison with contemporary tracking-by-detection methods. The table explains why dense-MOT leaderboard scores are not reported directly and clarifies how each method relates to the E’CHIT design.
Table 13.
Protocol-aware comparison with contemporary tracking-by-detection methods. The table explains why dense-MOT leaderboard scores are not reported directly and clarifies how each method relates to the E’CHIT design.
| Method | Association Principle | Strength in the Literature | Interpretation for the SAR Setting |
|---|
| RE3 baseline [1] | Recurrent single-object regression from paired crops | Fast temporal continuation without online back-propagation | Directly measured baseline in this paper: Success@0.5 = 0.62 and normalised IDSW = 1.00. |
| ByteTrack [12] | Associates high- and low-confidence detection boxes | Strong generic MOT performance when detections are dense and reliable | A useful reference for detector association, but potentially vulnerable to SAR detector gaps and hard cuts without additional identity and state hygiene. |
| OC-SORT [17] | Observation-centric SORT updates for occlusion and non-linear motion | Strong real-time SORT-family baseline, particularly for irregular motion | Relevant to UAV motion; direct dense evaluation requires frame-wise MOT-style labels that are not yet available for the SAR classes. |
| BoT-SORT [18] | Motion, appearance, and camera-motion compensation | Robust MOT association using an improved Kalman state and Re-ID cues | Highly relevant to moving vehicles and personnel, but less directly aligned with static entry points, debris, and scene-cut state resets. |
| StrongSORT [19] | Enhanced DeepSORT with stronger embeddings and association recovery | Strong generic baseline for MOT benchmarks | A useful future baseline for dense SAR tracklets; no protocol-equivalent score is reported in this sparse-label study. |
| Full E’CHIT | DRN reseeding, Custom-RE3 continuation, EOMC verification, and scene-cut hygiene | Designed for identity-stable UAV SAR operations and operator interaction | Directly measured in this paper: Success@0.5 = 0.79, ID switches reduced by approximately 71%, and real-time 1080p operation retained. |
Table 14.
Component evidence and quantitative status. Only the comparison between RE3-only and full E’CHIT has complete aggregate numerical results; the remaining rows report diagnostic evidence for the corresponding mechanisms.
Table 14.
Component evidence and quantitative status. Only the comparison between RE3-only and full E’CHIT has complete aggregate numerical results; the remaining rows report diagnostic evidence for the corresponding mechanisms.
| Variant/Component | Configuration | Evidence Available | Defensible Interpretation |
|---|
| RE3-only | Recurrent continuation without DRN reseeding, EOMC, or scene-cut hygiene | Success@0.5 = 0.62; normalised IDSW = 1.00 | Establishes the minimal recurrent baseline. |
| Full E’CHIT | DRN reseeding, Custom-RE3, EOMC, and scene-cut hygiene | Success@0.5 = 0.79; normalised IDSW | Primary measured system-level improvement: a increase in Success@0.5 and approximately 71% fewer normalised ID switches. |
| Detector association/reseeding | Detector-only or reseeding-disabled diagnostic runs | Failure logs show fragmentation after missed detections and recovery when a trusted same-class proposal becomes available. | Provides diagnostic support for the mechanism; no isolated aggregate contribution is claimed. |
| EOMC verifier | EOMC-disabled runs or inspection of quality traces | Quality traces identify appearance-inconsistent continuations and trigger reacquisition. | Supports interpretable drift control; no numerical share of the 0.17 gain is assigned causally to EOMC. |
| Scene-cut hygiene | Cut reset disabled or cut-event traces inspected | Without the reset, stale recurrent boxes can persist across edited footage; when enabled, scene-cut hygiene clears normal tracks. | Supports state-cleanup behaviour; no complete cut-suppression rate is reported. |
| HUD/logging | Non-causal interface enabled or disabled | Tracker state remains unchanged except when modified through explicit commands; run artefacts remain auditable. | A contribution to systems integration and reproducibility rather than an accuracy ablation. |
Table 15.
Statistical status of the reported evidence. The table distinguishes measured aggregate effects from diagnostic quantities and targets for future evaluation.
Table 15.
Statistical status of the reported evidence. The table distinguishes measured aggregate effects from diagnostic quantities and targets for future evaluation.
| Result Type | Current Report | Uncertainty Available | Claim Boundary |
|---|
| Success@0.5 | 0.62 (RE3-only) versus 0.79 (E’CHIT); absolute and relative | No sequence-level confidence interval reconstructed from aggregate values | Descriptive improvement under the sparse-checkpoint protocol; no p-value or population-wide superiority claim. |
| Identity switches | Normalised 1.00 versus ; approximately 71% reduction | Raw transition counts and the complete per-sequence distribution are not publicly reported | Descriptive reduction in the available mission-linked evaluation. |
| Component diagnostics | Variant traces and observations of failure modes | No complete factorial repeated-run distribution | Mechanistic interpretation only; no isolated numerical contribution. |
| Occlusion/cut diagnostics | TTR and suppression definitions, together with logs for complete events | No pooled event denominator in the present report | Diagnostic support only; no aggregate TTR or suppression estimate is reported. |
| Runtime | Observed ranges of 164–330 FPS for single-target tracking, 24–100+ FPS for end-to-end multi-target operation, and 71–100+ FPS in the illustrated 34-target run | Configuration-dependent observed ranges | Demonstrates real-time feasibility on the tested RTX-class GPU; no hardware-general percentile claim. |
| RL training | Default supervised training remains the strongest final global mAP reference; PPO/SAC produce different early trajectories | No repeated seeds or complete per-class uncertainty estimates | No universal or statistically established claim of RL superiority. |
| External benchmark figures | Literature-derived background values with an indicative E’CHIT marker | No protocol-identical statistical comparison | Contextual visualisation only; no official score, rank, or superiority claim. |
Table 16.
Interpretation and protocol status of the retained external benchmark figures. The background values are derived from the literature, and the E’CHIT markers indicate cross-protocol placements rather than official scores.
Table 16.
Interpretation and protocol status of the retained external benchmark figures. The background values are derived from the literature, and the E’CHIT markers indicate cross-protocol placements rather than official scores.
| Evaluation Source | Background Shown | E’CHIT Status in the Figure | Claim Boundary and Direct-Comparison Requirement |
|---|
| VOT2014 [41] | Historical RE3/VOT Accuracy–Robustness–Speed result space reported in the literature | Clearly labelled, non-official operating-point illustration; not generated through a VOT2014 run | No ranking or protocol-equivalent claim. Direct comparison requires the official sequences, initialisation/reset rules, toolkit, and aggregate output. |
| NT-VOT211 [40] | Published AUC, Precision, and OP50 result space for representative trackers | Clearly labelled, non-official contextual marker based on the internal SAR regime | No NT-VOT211 leaderboard claim. Direct comparison requires the official split and evaluator, without conversion from D’RespNeT metrics. |
| VOTS2024 [39,42] | Published Accuracy, Robustness, and Quality result space | Clearly labelled, non-official contextual marker; not an official segmentation-tracking submission | No VOTS2024 score or rank is claimed. Protocol-compliant segmentation outputs, use of the official toolkit, and the prescribed evaluation route are required. |
| E’CHIT mission evaluation (this paper) | D’RespNeT Success@0.5, normalised ID-switch change, diagnostic held-out evidence, and observed runtime | Directly measured under the mission protocol defined in this paper | These are the primary claims and are not numerically interchangeable with the external benchmark results. |
Table 17.
RL interpretation and deployment scope. PPO/SAC are auxiliary offline training tools and are neither the central contribution nor an inference-time module.
Table 17.
RL interpretation and deployment scope. PPO/SAC are auxiliary offline training tools and are neither the central contribution nor an inference-time module.
| Analysis Point | Evidence/Treatment | Interpretation in the Manuscript |
|---|
| Training versus inference | PPO/SAC operate only within the custom detector-training script. | The deployed E’CHIT pipeline loads fixed YOLOv8-seg weights; no RL policy runs during tracking. |
| Final global accuracy | The default supervised schedule is strongest in Figure 5. | No claim is made that PPO/SAC improve the final global mAP. |
| Early optimisation | PPO and SAC produce different trajectories in the displayed experiment. | They are treated as optional warm-start/meta-optimisation aids; any claim of improved stability would require repeated seeds. |
| Difficult/minority classes | Entry/access-point and rescue-related classes motivated the search. | The paper reports observed learning behaviour but does not claim statistically established per-class gains without a complete repeated-run table. |
| Parameter sensitivity | The learning rate, augmentation probabilities, reward weights, horizon length, and PPO/SAC settings affect the trajectory. | An RL checkpoint is retained only when supported by held-out validation; universal-gain claims are avoided. |
| Offline computational cost | . | The additional cost is incurred once and is dominated by repeated detector mini-epochs. |
| Deployed complexity | RL is absent from Equation (29). | The detector architecture, parameter count, Custom-RE3 module, inference graph, and per-frame tracking operations remain unchanged. |