Abstract
The thermal conductivity of humid air at different saturation levels has been investigated at 70 °C. A MEMS-based thermal conductivity sensor was calibrated and used to measure the thermal conductivity of humid air. The obtained results were compared to different equations for calculating the thermal conductivity of gas mixtures, in this case, dry air and water vapor. The selected equations predict contradicting behaviors of humid air at different temperatures and saturation levels. A semi-empirical equation by Melling et al. for the temperature range of 100 °C to 200 °C has shown the best agreement with the experimental data. We intend to study the temperature range from 0 to 100 °C in more detail and plan to adapt the interpolation to fit this temperature range.
1. Introduction
In investigations of the cross-sensitivity of a MEMS-based thermal conductivity sensor for the detection of hydrogen, an unexpected behavior towards humid air was observed. Water vapor at 70 °C has a thermal conductivity of 23.2 mW/m × K, whereas air at 70 °C has a thermal conductivity of 29.3 mW/m×K [1]. Simple mixing equations, e.g., by Udoetok, or a semi-empirical model by Tsilingiris predict a lower thermal conductivity for humid air than for dry air [2,3]. However, our measurements of humid air indicate an increase in thermal conductivity. We have compared our measurement results to different mixing equations, two of them specifically presented for the calculation of the thermal conductivity of humid air.
2. Materials and Methods
The measurements were performed using a MEMS-based thermal conductivity sensor presented by Emperhoff et al. in ref [4]. To calibrate the sensor, a measurement with varying concentrations between 0% and 3.5% in 0.7% steps of hydrogen in synthetic air was taken as shown in Figure 1a(i). A mixing equation from Mason and Saxena is used to calculate the thermal conductivity of the used gas mixtures (Figure 1a(ii)) [5]. According to Zhukov and Pätz, this is the most suited equation to describe gas mixtures containing hydrogen [6]. The measured sensitivity to hydrogen is converted to a sensitivity to changes in the thermal conductivity as shown in Figure 1a(iii). This correlation is applied to a thermal conductivity measurement with varying relative humidities ranging from 0% to 75% at a temperature of 70 °C. The resulting thermal conductivity is compared to thermal conductivity values of dry air and water vapor gas mixtures calculated with equations by Tsilingiris, Udoetok and Melling et al. [1,2,3].
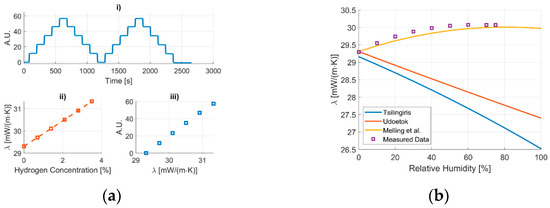
Figure 1.
(a) Calibration of the thermal conductivity sensor based on a measurement of different concentrations of hydrogen in synthetic air at 70 °C using an equation by Mason and Saxena to calculate the thermal conductivity of the used gas mixture [5]. (b) The measured signal is converted to a thermal conductivity value for different relative humidities at 70 °C and compared to calculated values with equations from Tsilingiris, Udoetok and Melling et al. [1,2,3].
3. Discussion
The graph in Figure 1b contains results from different approaches to determine the thermal conductivity of humid air at a temperature of 70 °C. This can be done for several temperatures and will be investigated in more detail. The mixing equations by Tsilingiris and Udoetok show a decrease in the thermal conductivity for increasing levels of humidity [2,3], whereas the conducted measurements showed an increase in the thermal conductivity. A second semi-empirical model which was proposed by Melling et al. shows much better agreement with the measured data [1]. This model was interpolated to fit a temperature range from 100 °C to 200 °C. A detailed investigation of the temperature range from 25 °C to 100 °C is planned to check the correlation for this range and adjust it if necessary.
Author Contributions
Conceptualization, S.E. and M.E.; methodology, S.E. and M.E.; validation, S.E.; investigation, S.E. and T.D.; writing—original draft preparation, S.E.; writing—review and editing, S.E., M.E. and J.W.; visualization, S.E.; supervision, M.E. and J.W. All authors have read and agreed to the published version of the manuscript.
Funding
This research was funded by the German Federal Ministry of Economic Affairs and Climate Action (BMWK), grant number 03EN5009A.
Institutional Review Board Statement
Not applicable.
Informed Consent Statement
Not applicable.
Data Availability Statement
Restrictions apply to the availability of these data. The datasets presented in this article are not readily available because of company restrictions. Requests to access the datasets should be directed to the corresponding author.
Conflicts of Interest
The authors S.E., M.E. and T.D. were employed by Infineon Technologies AG. The authors declare that they have no competing interests. Infineon Technologies AG has an interest in commercializing a thermal conductivity sensor.
References
- Melling, A.; Noppenberger, S.; Still, M.; Venzke, H. Interpolation Correlations for Fluid Properties of Humid Air in the Temperature Range 100 °C to 200 °C. J. Phys. Chem. Ref. Data 1997, 26, 1111–1123. [Google Scholar] [CrossRef]
- Tsilingiris, P.T. Thermophysical and Transport Properties of Humid Air at Temperature Range between 0 and 100 °C. Energy Convers. Manag. 2008, 49, 1098–1110. [Google Scholar] [CrossRef]
- Udoetok, E.S. Thermal Conductivity of Binary Mixtures of Gases. Front. Heat Mass Transf. FHMT 2013, 4, 023008. [Google Scholar] [CrossRef]
- Emperhoff, S.; Eberl, M.; Barraza, J.P.; Brandl, F.; Wöllenstein, J. Differential Thermal Conductivity Hydrogen Sensor. In Proceedings of the SMSI 2023, Nürnberg, Germany, 8–11 May 2023. [Google Scholar]
- Mason, E.A.; Saxena, S.C. Approximate Formula for the Thermal Conductivity of Gas Mixtures. Phys. Fluids 1958, 1, 361. [Google Scholar] [CrossRef]
- Zhukov, V.P.; Pätz, M. On Thermal Conductivity of Gas Mixtures Containing Hydrogen. Heat Mass Transf. 2017, 53, 2219–2222. [Google Scholar] [CrossRef]
Disclaimer/Publisher’s Note: The statements, opinions and data contained in all publications are solely those of the individual author(s) and contributor(s) and not of MDPI and/or the editor(s). MDPI and/or the editor(s) disclaim responsibility for any injury to people or property resulting from any ideas, methods, instructions or products referred to in the content. |
© 2024 by the authors. Licensee MDPI, Basel, Switzerland. This article is an open access article distributed under the terms and conditions of the Creative Commons Attribution (CC BY) license (https://creativecommons.org/licenses/by/4.0/).