Proceeding Paper

Insecticidal Activity Evaluation of Phenylazo and Dihydropyrrole-Fused Neonicotinoids Against Cowpea Aphids Using the MLR Approach †

Institute of Chemistry, Romanian Academy, Bul. Mihai Viteazu 24, 300223 Timisoara, Romania
*
Author to whom correspondence should be addressed.
Presented at the 22nd International Electronic Conference on Synthetic Organic Chemistry, 15 November–15 December 2018; Available Online: https://sciforum.net/conference/ecsoc-22.
Proceedings 2019, 9(1), 18; https://doi.org/10.3390/ecsoc-22-05664
Published: 14 November 2018

Abstract

:
This paper presents a Quantitative Structure-Activity Relationship (QSAR) study of a series of 24 dihydropyrrole-fused and phenylazo neonicotinoid derivatives, with insecticidal activity tested against Cowpea aphids (Aphis craccivora). In this regard, the conformational search ability of the OMEGA software was employed to model neonicotinoid conformer ensembles, using molecular mechanics calculations based on the 94s variant of the Merck Molecular force field (MMFF94). The minimum energy conformers were used to calculate structural descriptors, which were further related to the insecticidal activity (pLC50 values), using the multiple linear regression (MLR) approach. The genetic algorithm was used for variable selection and several criteria for internal and external model validation. A robust model (r2 = 0.880, r2adj = 0.855, q2LOO = 0.827, s = 0.2098, F = 34.295) with predictive power (concordance correlation coefficient (CCC)ext = 0.945, r2m= 0.824) was obtained, using the QSARINS software. The developed model can be confidently used for the prediction of the insecticidal activity of new chemicals, saving a substantial amount of time and money.

1. Introduction

Neonicotinoids are considered to be one of the most important and relevant classes of insecticides used nowadays [1,2]. Neonicotinoids are synthetic insecticides acting on the insect nicotinic acetylcholine receptor (nAChR) and have been increasingly used to control various insects during recent decades, especially since imidacloprid was introduced to the market [3]. However, the neonicotinoids success is being provoked by the rapid development of resistance [2] and severe bee toxicity [4,5,6]. It is considered that neonicotinoid insecticides represent the most effective chemical class for the control of sucking insect pests (aphids, whiteflies, leaf- and planthoppers, thrips), micro lepidoptera, and a number of coleopteran pest species [7]. Neonicotinoids have the advantage of their plant systemicity over other insecticides. After application into the soil or the seed, these compounds are absorbed through the plant roots, where they are distributed and give therefore consistent and long-lasting control of sucking insects.
The coplanar segment between guanidine or amidine and pharmacophore in the neonicotinoids could create an electronic conjugation to facilitate the partial negative charge flow toward the tip atom and increase the binding affinity to the insect target [8]. Photostabilized compounds selective for insects relative to mammals have photolabile nithiazine with a nitromethylene moiety and no cationic substituent [9].
Quantitative Structure-Activity Relationship (QSAR) is the most commonly used method to understand how chemical structure features correlate with the toxicity of natural and/or synthetic chemicals like insecticides. This method offers the possibility of searching for new insecticides with enhanced activity against insects and pests. The urgent need for the development of a new insecticide is related to the phenomenon of insecticide-resistant cases of pests. In this regard, several computational approaches were applied to study the insecticidal activity of neonicotinoids [10,11,12,13,14,15].
In this study, the QSAR model of 24 dihydropyrrole-fused and phenylazo neonicotinoid derivatives is derived from the data set of chemical structures and insecticidal activities tested against Cowpea aphids (Aphis craccivora) using multiple linear regression (MLR) approach.
Molecular mechanics calculations, using the 94s variant of the Merck Molecular force field (MMFF94), were used to model the neonicotinoid structures. Statistical analysis using several criteria was employed to find a robust and predictive MLR model. The best derived MLR model could be confidently used to predict the insecticidal activity of newly designed insecticides.

2. Methods

2.1. Dataset and Theoretical Molecular Descriptors Calculation

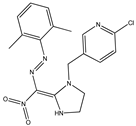
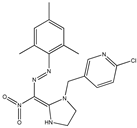
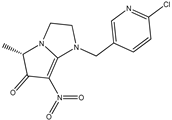
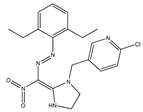
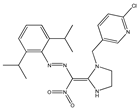
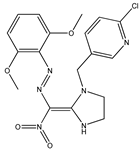
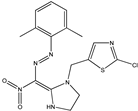
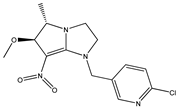
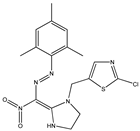
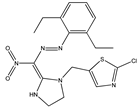
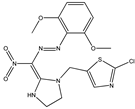
A dataset of 24 phenylazo and dihydropyrrole-fused neonicotinoid derivatives (Table 1) having the insecticidal activity (LC50, in mmol/L) against cowpea aphids (Aphis craccivora) [16,17] was analyzed. pLC50 values were used as the dependent variable.
The neonicotinoid structures were pre-optimized using the MMFF94 molecular mechanics force field included in the Omega (Omega v.2.5.1.4, OpenEye Scientific Software, Santa Fe, NM) software [18,19]. For conformer generation, the maximum number of conformers per compound set of 400 and a root-mean-square deviation (RMSD) value of 0.5 Å were employed during the conformer ensemble generation.
The conformers of minimum energy were then used to calculate the structural parameters, using the DRAGON (Dragon Professional 5.5, 2007, Talete S.R.L., Milano, Italy) and InstanJChem (Instant JChem (2012) version 5.10.0, Chemaxon) software.

2.2. The Multiple Linear Regression Method

The MLR approach [20] was employed to relate the pLC50 values with the calculated structural descriptors, using the QSARINS v. 2.2 program [21,22]. The genetic algorithm with leave-one-out cross-validation correlation coefficient was used for variable selection of a constrained function to be optimized, a mutation rate of 20%, and a population size with 10 and 500 iterations.

2.3. Model Validation

The dataset was divided randomly into training and test (25% of the total number of compounds) sets. Following compounds: 3, 11, 13, 14, 17, and 23 were included in the test set (Table 1).
Several criteria were used for testing the predictive model power: Q F 1 2 [23], Q F 2 2 [24], Q F 3 2 [25], the concordance correlation coefficient (CCC) [26] (having the thresholds values higher than 0.85, [27]) and the predictive parameter r m 2 (with a lowest threshold value of 0.5) [28].
The model overfit was checked using the Y-randomization test [29] and by comparing the root-mean-square errors (RMSE) and the mean absolute error (MAE) of the training and validation sets [30].
Y-scrambling [31], the adjusted correlation coefficient ( r a d j 2 ), and q2 (leave-one-out, q L O O 2 , and leave-more-out, q L M O 2 ) cross-validation coefficients were employed for internal model validation.
The Multi-Criteria Decision Making (MCDM) validation criterion [32] is used to summarize the performance of MLR models. For every validation criterion, a desirability function was associated, and MCDM had values between 0 (the worst) and 1 (the best).

3. Results and Discussion

The autoscaling method was employed for normalizing the data:
X T m j = X m j X ¯ m S m
where for each variable m, XTmj, and Xmj are the j values for the m variable after and before scaling, respectively. X ¯ m is the mean and Sm is the standard deviation of the variable.
The variables contained in the MLR models were selected using the genetic algorithm. The statistical (fitting and predictivity) results are included in Table 2, Table 3 and Table 4.
The ‘MCDM all’ scores, based on the fitting, cross-validated, and external criteria were considered for choosing the best MLR models.
For the reliability of the best MLR1 model, the experimental versus predicted pLC50 values and Y-scramble plots are presented in Figure 1 and Figure 2, respectively.
In the Y-scrambling test performed for the MLR models, a significant low scrambled r2 ( r s c r 2 ) and cross-validated q2 ( q s c r 2 ) values were obtained for 2000 trials. Figure 2 shows that in case of all the randomized models; the values of r s c r 2 and q s c r 2 for the MLR1 model were <0.5 ( r s c r 2 / q s c r 2 of 0.1759/-0.4035). The low calculated r s c r 2 and q s c r 2 values indicate no chance correlation for all MLR chosen models (Table 2).
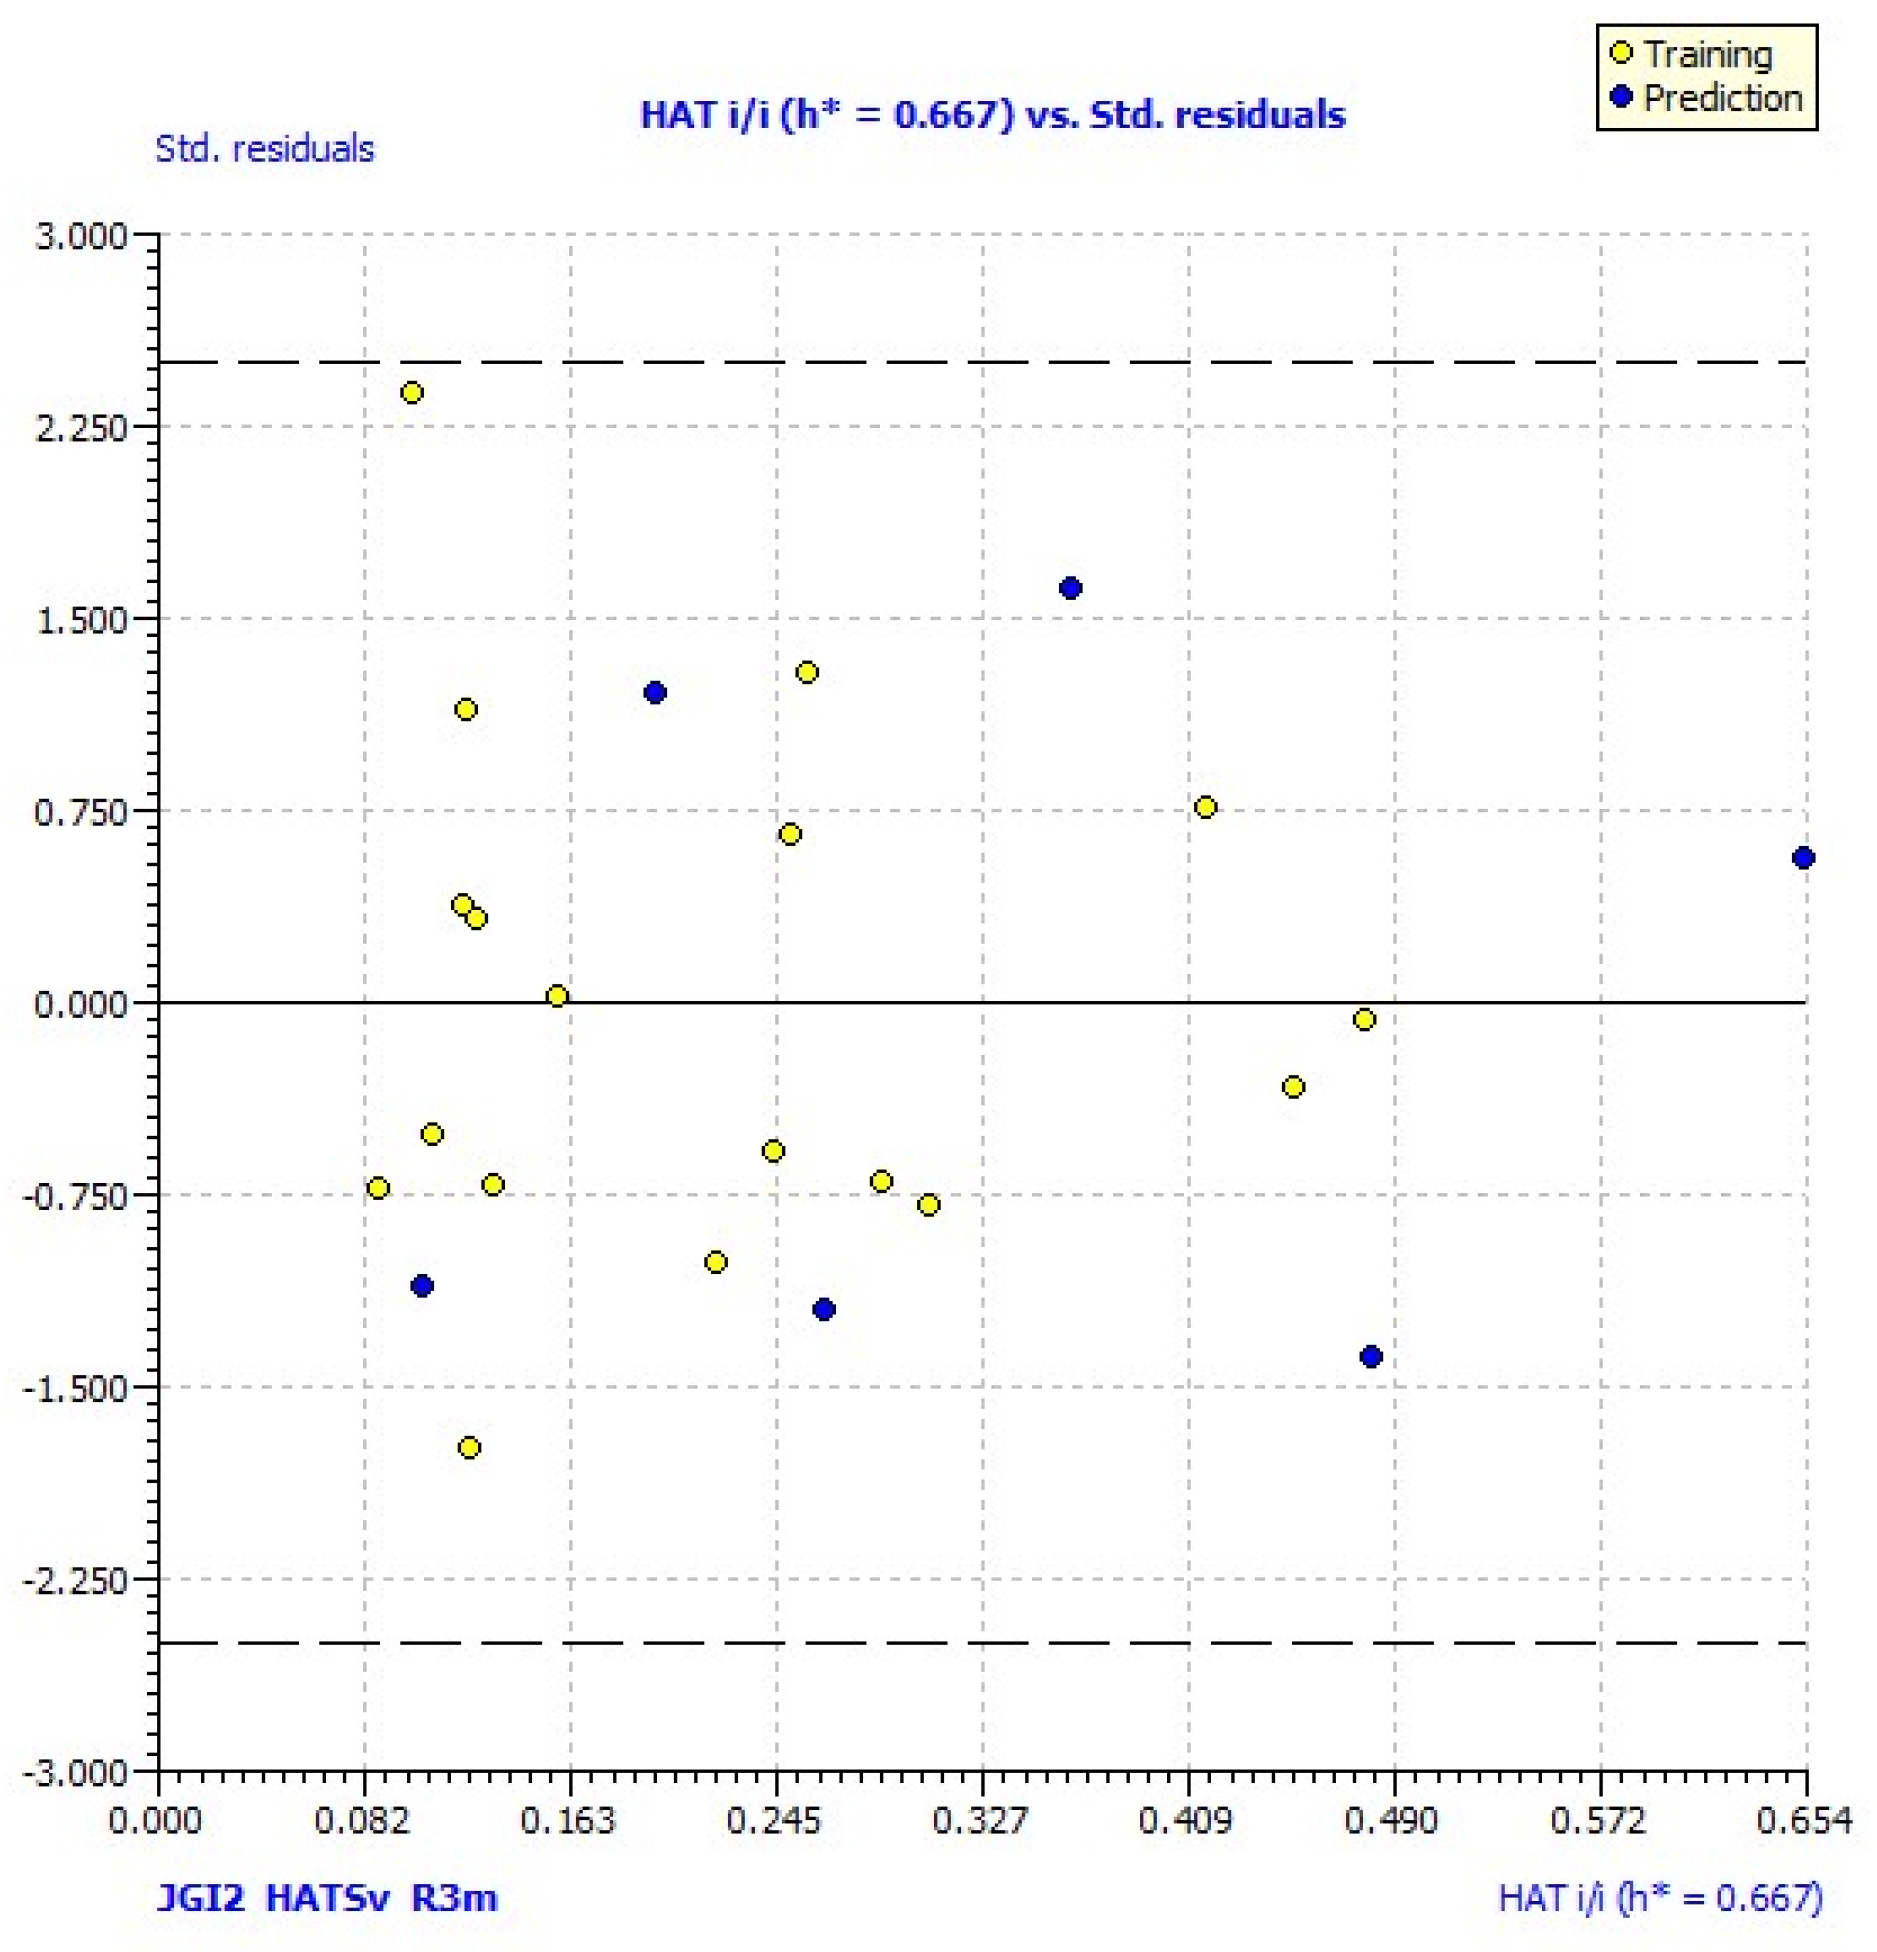
The Williams plot (standardized residuals versus leverages, with the leverage threshold h* = 0.667 for the MLR1 model), in the range of ±2.5σ, was used to verify the domain applicability. All compounds in the dataset are within the applicability domain of the MLR1 model, as presented in Figure 3.
The selected descriptors included in the MLR1 best model are not intercorrelated, as presented in the correlation matrix from Table 5.
Good correlations with the insecticidal activity and predictive model power were notices for all MLR models. Model MLR4 was less predictive (in accordance to its Q F 2 2 value) compared to the other MLR models. Closer values of the RMSE and the MAE of the training and validation sets were observed for the MLR2, MLR3, and MLR4 models. MLR1 model was considered being the best one according to several other statistical parameters of fitting and the ‘MCDM all’ score values.
The best MLR1 model had three descriptors: one Galvez topological charge index (JGI2, which means the topological charge index of order 2) and two GETAWAY descriptors (HATSv, which represents the leverage-weighted total index/weighted by atomic van der Waals volumes and R3m—R autocorrelation of lag 3/weighted by atomic masses). The increase of the JGI2 and HATSv descriptor values is favorable for high insecticidal activity. Lower values of R3m raise the insecticidal activity.
New neonicotinoid structures with insecticidal activity against the cowpea aphids can be designed based on the MLR models presented in this study.

4. Conclusions

Quantitative structure-insecticidal activity relationships were developed using the multiple linear regression approach for neonicotinoids with dihydropyrrole-fused and phenylazo moieties, active against the cowpea aphids (Aphis craccivora). Insecticide structures were modeled using the MMFF94s force field. Descriptors of the minimum conformers were related to the pLC50 values using the multiple linear regression approach. Good correlations and predictive models were obtained. Getaway and Galvez topological charge index descriptors included in the best MLR model can be used for prediction of new insecticides active against the cowpea aphids, saving experimental time and money.

Author Contributions

S.F.-T. and A.B. analyzed the data; A.B. contributed to molecular modeling calculations; S.F.-T. performed the statistical analysis and wrote the paper.

Acknowledgments

This project was financially supported by Project 1.1 of the Institute of Chemistry of the Romanian Academy. Access to the Chemaxon Ltd., and QSARINS software are greatly acknowledged by the authors.

Conflicts of Interest

The authors declare no conflict of interest.

References

  1. Ren, L.; Lou, Y.; Chen, N.; Xia, S.; Shao, X.; Xu, X.; Li, Z. Synthesis And Insecticidal Activities Of Tetrahydroimidazo[1,2-A]Pyridinones: Further Exploration On Cis-Neonicotinoids. Synth. Commun. 2014, 44, 858–867. [Google Scholar] [CrossRef]
  2. Nauen, R.; Denholm, I. Resistance of Insect Pests to Neonicotinoid Insecticides: Current Status and Future Prospects. Arch. Insect Biochem. 2005, 58, 200–215. [Google Scholar] [CrossRef]
  3. Kagabu, S. Chloronicotinyl insecticides discovery, application and future perspective. Rev. Toxicol. 1997, 1, 75–129. [Google Scholar]
  4. Henry, M.; Béguin, M.; Requier, F.; Rollin, O.; Odoux, J.F.; Aupinel, P.; Aptel, J.; Tchamitchian, S.; Decourtye, A. A common pesticide decreases foraging success and survival in honey bees. Science 2012, 336, 348–350. [Google Scholar] [CrossRef]
  5. Cameron, S.A.; Lozier, J.D.; Strange, J.P.; Koch, J.B.; Cordes, N.; Solter, L.F.; Griswold, T.L. Patterns of widespread decline in North American bumble bees. Proc. Natl. Acad. Sci. USA 2011, 108, 662–667. [Google Scholar] [CrossRef]
  6. Chen, N.; Xia, S.; Zou, M.; Shao, X. Bridged heterocyclic neonicotinoid analogues: Design, synthesis, and insecticidal activity. Res. Chem. Intermed. 2015, 41, 5293–5300. [Google Scholar] [CrossRef]
  7. Elbert, A.; Haas, M.; Springer, B.; Thielert, W.; Nauen, R. Applied aspects of neonicotinoid uses in crop protection. Pest. Manag. Sci. 2008, 64, 1099–1105. [Google Scholar] [CrossRef]
  8. Duan, H.; Zhang, W.; Zhao, J.; Liang, D.; Yang, X.; Jin, S. A novel halogen bond and a better-known hydrogen bond cooperation of neonicotinoid and insect nicotinic acetylcholine receptor recognition. J. Mol. Model. 2012, 18, 3867–3875. [Google Scholar] [CrossRef]
  9. Casida, J.E.; Durkin, K.A. Neuroactive Insecticides: Targets, Selectivity, Resistance, and Secondary Effects. Annu. Rev. Entomol. 2013, 58, 99–117. [Google Scholar] [CrossRef]
  10. Kagabu, S.; Nishimura, K.; Naruse, Y.; Ohno, I. Insecticidal and neuroblocking potencies of variants of the thiazolidine moiety of thiacloprid and quantitative relationship study for the key neonicotinoid pharmacophore. J. Pest. Sci. 2008, 33, 58–66. [Google Scholar] [CrossRef]
  11. Li, J.; Ju, X.L.; Jiang, F.C. Pharmacophore model for neonicotinoid insecticides. Chin. Chem. Lett. 2008, 19, 619–622. [Google Scholar] [CrossRef]
  12. Okazawa, A.; Akamatsu, M.; Nishiwaki, H.; Nakagawa, Y.; Miyagawa, H.; Nishimura, K.; Ueno, T. Three-dimensional quantitative structure-activity relationship analysis of acyclic and cyclic chloronicotinyl insecticides. Pest. Manag. Sci. 2000, 56, 509–515. [Google Scholar]
  13. Okazawa, A.; Akamatsu, M.; Ohoka, A.; Nishiwaki, H.; Cho, W.-J.; Nakagawa, Y.; Nishimura, K.; Ueno, T. Prediction of the Binding Mode of Imidacloprid and Related Compounds to House-Fly Head Acetylcholine Receptors Using Three-Dimensional QSAR Analysis. Pest. Sci. 1998, 54, 134–144. [Google Scholar] [CrossRef]
  14. Nakayama, A.; Sukekawa, M. Quantitative correlation between molecular similarity and receptor-binding activity of neonicotinoid insecticides. Pest. Sci. 1998, 52, 104–110. [Google Scholar] [CrossRef]
  15. Sung, N.-D.; Jang, S.-C.; Choi, K.-S. CoMFA and CoMSIA on the Neuroblocking Activity of 1-(6-Chloro-3-pyridylmethyl)-2-nitroiminoimidazolidine Analogues. Bull. Korean Chem. Soc. 2006, 27, 1741–1746. [Google Scholar]
  16. Ye, Z.; Xia, S.; Shao, X.; Cheng, J.; Xu, X.; Xu, Z.; Li, Z.; Qian, X. Design, synthesis, crystal structure analysis, and insecticidal evaluation of Phenylazoneonicotinoids. J. Agric. Food Chem. 2011, 59, 10615–10623. [Google Scholar] [CrossRef]
  17. Ye, Z.; Shi, L.; Shao, X.; Xu, X.; Xu, Z.; Li, Z. Pyrrole- and dihydropyrrole-fused Neonicotinoids: Design, synthesis, and insecticidal evaluation. J. Agric. Food Chem. 2013, 61, 312–319. [Google Scholar] [CrossRef]
  18. Hawkins, P.C.D.; Skillman, A.G.; Warren, G.L.; Ellingson, B.A.; Stahl, M.T. Conformer generation with OMEGA: Algorithm and validation using high quality structures from the Protein Databank and Cambridge Structural Database. J. Chem. Inf. Model. 2010, 50, 572–584. [Google Scholar] [CrossRef]
  19. Hawkins, P.C.D.; Nicholls, A. Conformer generation with OMEGA: Learning from the data set and the analysis of failures. J. Chem. Inf. Model. 2012, 52, 2919–2936. [Google Scholar] [CrossRef]
  20. Wold, S.; Dunn, W.J., III. Multivariate quantitative structure-activity relationships (QSAR): Conditions for their applicability. J. Chem. Inf. Comput. Sci. 1983, 23, 6–13. [Google Scholar] [CrossRef]
  21. Chirico, N.; Papa, E.; Kovarich, S.; Cassani, S.; Gramatica, P. QSARINS, software for QSAR MLR Model development and validation. QSAR Res. Unit in Environ. Chem. and Ecotox., DiSTA, University of Insubria, Varese, Italy. 2012. Available online: http://www.qsar.it (accessed on 15 May 2018).
  22. Gramatica, P.; Chirico, N.; Papa, E.; Cassani, S.; Kovarich, S. QSARINS: A new software for the development, analysis, and validation of QSAR MLR models. J. Comput. Chem. 2013, 34, 2121–2132. [Google Scholar] [CrossRef]
  23. Shi, L.M.; Fang, H.; Tong, W.; Wu, J.; Perkins, R.; Blair, R.M.; Branham, W.S.; Dial, S.L.; Moland, C.L.; Sheehan, D.M. QSAR models using a large diverse set of estrogens. J. Chem. Inf. Model. 2001, 41, 186–195. [Google Scholar] [CrossRef]
  24. Schüürmann, G.; Ebert, R.U.; Chen, J.; Wang, B.; Kühne, R. External validation and prediction employing the predictive squared correlation coefficient test set activity mean vs training set activity mean. J. Chem. Inf. Model. 2008, 48, 2140–2145. [Google Scholar] [CrossRef]
  25. Consonni, V.; Ballabio, D.; Todeschini, R. Comments on the definition of the Q2 parameter for QSAR validation. J. Chem. Inf. Model. 2009, 49, 1669–1678. [Google Scholar] [CrossRef]
  26. Chirico, N.; Gramatica, P. Real External Predictivity of QSAR Models: How to Evaluate It? Comparison of Different Validation Criteria and Proposal of Using the Concordance Correlation Coefficient. J. Chem. Inf. Model. 2011, 51, 2320–2335. [Google Scholar] [CrossRef] [PubMed]
  27. Chirico, N.; Gramatica, P. Real External Predictivity of QSAR Models. Part 2. New Intercomparable Thresholds for Different Validation Criteria and the Need for Scatter Plot Inspection. J. Chem. Inf. Model. 2012, 52, 2044–2058. [Google Scholar] [CrossRef]
  28. Roy, K.; Mitra, I. On the Use of the Metric r m 2 as an Effective Tool for Validation of QSAR Models in Computational Drug Design and Predictive Toxicology. Min.-Rev. Med. Chem. 2012, 12, 491–504. [Google Scholar]
  29. Eriksson, L.; Johansson, E.; Kettaneh-Wold, N.; Wold, S. Multi and Megavariate Data Analysis: Principles and Applications; Umetrics AB: Umea, Sweden, 2001; pp. 92–97. [Google Scholar]
  30. Goodarzi, M.; Deshpande, S.; Murugesan, V.; Katti, S.B.; Prabhakar, Y.S. Is Feature Selection Essential for ANN Modeling? QSAR Comb. Sci. 2009, 28, 1487–1499. [Google Scholar] [CrossRef]
  31. Todeschini, R.; Consonni, V.; Maiocchi, A. The K correlation index: Theory development and its application in chemometrics. Chemom. Intell. Lab. 1999, 46, 13–29. [Google Scholar] [CrossRef]
  32. Keller, H.R.; Massart, D.L.; Brans, J.P. Multicriteria decision making: A case study. Chemom. Intell. Lab. Syst. 1991, 11, 175–189. [Google Scholar] [CrossRef]
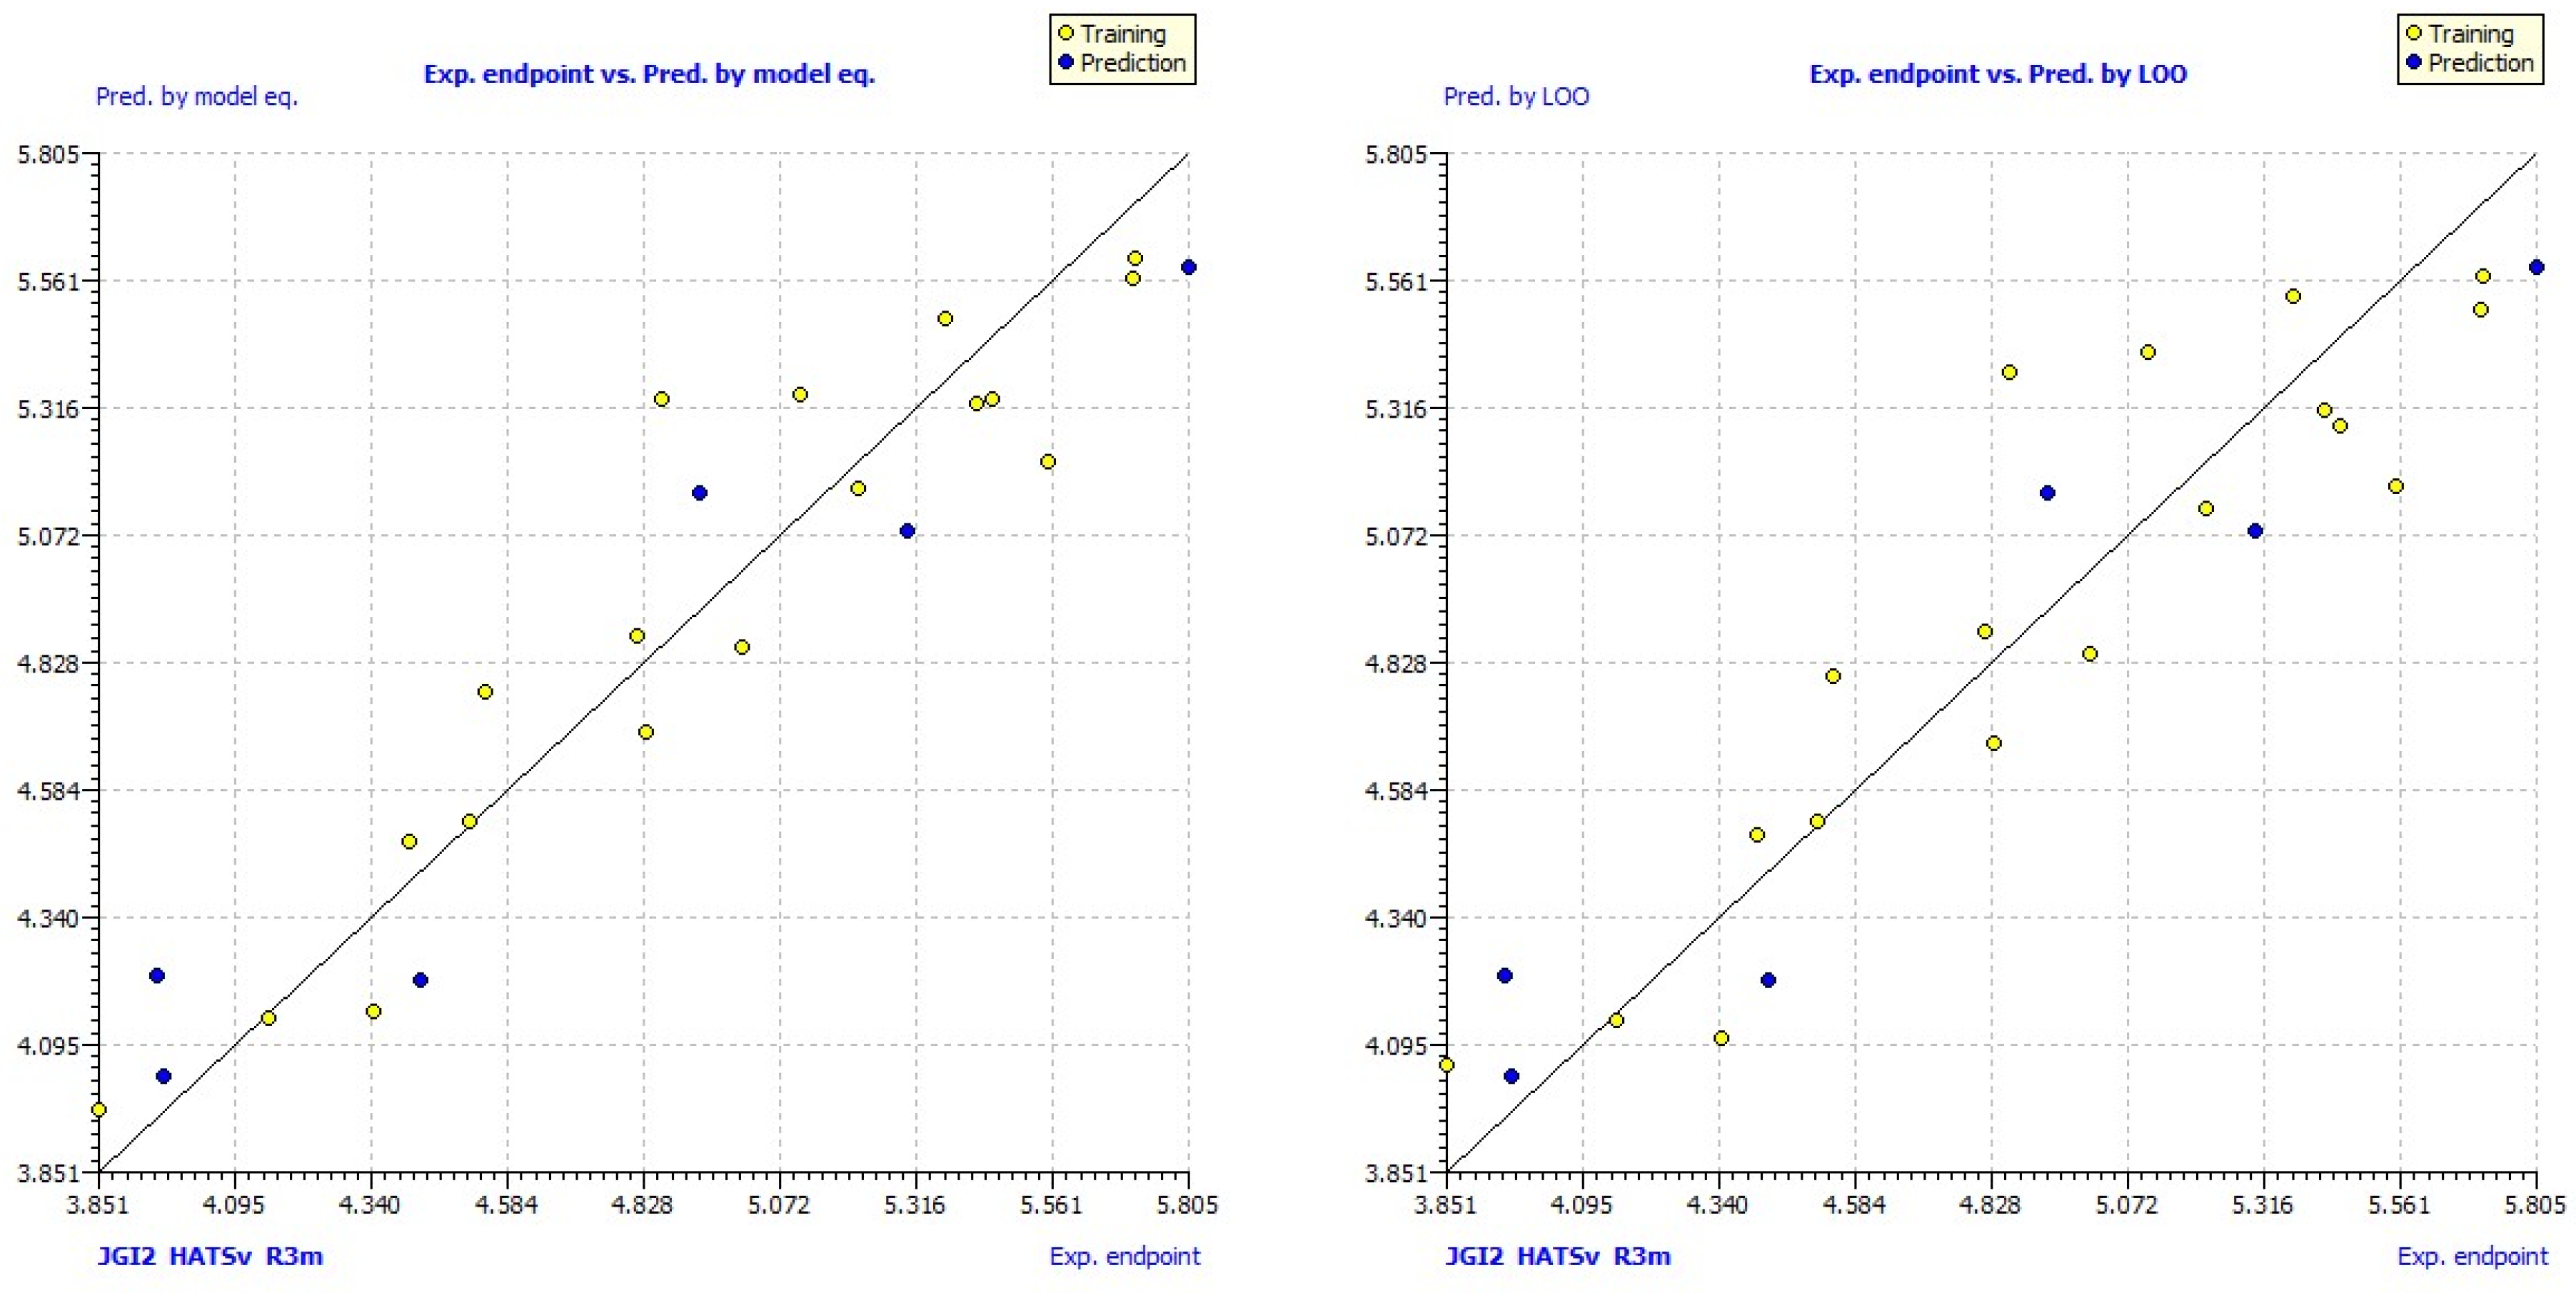
Figure 1. Plots of experimental versus predicted pLC50 values for the MLR1 model predicted by the model (left) and by the leave-one-out (right) cross-validation approach (yellow circles-training compounds and blue circles-test compounds).
Proceedings 09 00018 g001
Figure 2. Y-scramble plots for the MLR1 model.
Proceedings 09 00018 g002
Figure 3. Williams plot predicted by the MLR1 model (yellow circles-training compounds, blue circles-test compounds).
Proceedings 09 00018 g003
Table 1. Experimental (pLC50exp) and predicted for the best multiple linear regression (MLR) model (pLC50pred) insecticidal activity values of neonicotinoids.
NoStructurepLC50exppLC50predNoStructurepLC50exppLC50pred
1Proceedings 09 00018 i0015.215.1613 *Proceedings 09 00018 i0023.974.04
2Proceedings 09 00018 i0035.705.5714 *Proceedings 09 00018 i0044.434.22
3*Proceedings 09 00018 i0055.805.5915Proceedings 09 00018 i0065.375.49
4Proceedings 09 00018 i0075.715.6116 *Proceedings 09 00018 i0085.305.08
5Proceedings 09 00018 i0095.115.3417Proceedings 09 00018 i0105.435.33
6Proceedings 09 00018 i0113.853.9718Proceedings 09 00018 i0125.555.21
7Proceedings 09 00018 i0134.554.7719Proceedings 09 00018 i0144.865.34
8Proceedings 09 00018 i0154.524.5320Proceedings 09 00018 i0165.004.86
9Proceedings 09 00018 i0174.414.4921Proceedings 09 00018 i0185.465.33
10Proceedings 09 00018 i0194.354.1622Proceedings 09 00018 i0204.824.88
11*Proceedings 09 00018 i0213.964.2323*Proceedings 09 00018 i0224.935.16
12Proceedings 09 00018 i0234.164.1524Proceedings 09 00018 i0244.834.70
* Test compounds included in the best MLR model.
Table 2. Fitting and cross-validation statistical results of the MLR models *.
Model r t r a i n i n g 2 q L O O 2 q L M O 2 r a d j 2 RMSEtrMAEtrCCCtr r s c r 2 q s c r 2 SEEF
MLR10.8800.8270.8060.8550.1850.1470.9360.176−0.4040.21034.295
MLR20.8650.7930.7740.8370.1960.1640.9280.174−0.3960.22230.000
MLR30.8540.7770.7550.8220.2050.1720.9210.178−0.3900.23227.208
MLR40.8540.7900.7720.8230.2040.1610.9210.177−0.3970.23227.333
* r t r a i n i n g 2 : correlation coefficient; q L O O 2 leave-one-out correlation coefficient; q L M O 2 ; leave-more-out correlation coefficient; r a d j 2 ; adjusted correlation coefficient; RMSEtr: root-mean-square errors; MAEtr: mean absolute error; CCCtr: the concordance correlation coefficient; r s c r 2 and q s c r 2 : Yscrambling parameters; SEE: standard error of estimates; F: Fischer test.
Table 3. The model predictivity results *.
Model Q F 1 2 Q F 2 2 Q F 3 2 RMSEextMAEextCCCext
MLR10.9040.8440.9450.2110.2020.945
MLR20.8010.6760.8890.3040.2930.889
MLR30.8180.7040.8960.2910.2810.896
MLR40.7440.5830.8580.3450.3090.858
* Q F 1 2 ; Q F 2 2 ; Q F 3 2 : external validation parameters; RMSEext: root-mean-square errors; MAEext: mean absolute error; CCCext: the concordance correlation coefficient.
Table 4. The ‘Multi-Criteria Decision Making (MCDM) all’ score values, r m 2 predictivity parameter, and descriptors included in the MLR models *.
Model r m 2 MCDM allDescriptors included in the MLR model *
MLR10.8240.867JGI2 HATSv R3m
MLR20.7950.814BEHp2 JGI2 R3m
MLR30.7910.812JGI2 Mor06m R3m
MLR40.7200.786JGI2 R3m R8m+
* JGI2: mean topological charge index of order2 (Galvez topological charge index); HATSv: leverage-weighted total index/weighted by atomic van der Waals volumes (GETAWAY descriptor); R3m: R autocorrelation of lag 3/weighted by atomic masses (GETAWAY descriptor); BEHp2: highest eigenvalue n. 2 of Burden matrix/weighted by atomic polarizabilities (BCUT descriptor); Mor06m: 3D-MoRSE—signal 06/weighted by atomic masses (3D-MoRSE descriptor); R8m+: R maximal autocorrelation of lag 8/weighted by atomic masses (GETAWAY descriptor).
Table 5. Correlation matrix of the descriptors included in the best MLR1 model and their standardized coefficients (Std. coeff.).
JGI2HATSvR3mStd. coeff.
JGI21 0.967
HATSv−0.2781 0.321
R3m−0.1210.6231−0.617
Publisher’s Note: MDPI stays neutral with regard to jurisdictional claims in published maps and institutional affiliations.