Proceeding Paper

A Greener and Faster Approach for Determination of Phenolic Compounds by Smartphone-Based Colorimetry †

by
Luís Claudio Martins
1,2,
Anna Flavia de Souza Silva
1,
Liz Mary Bueno de Moraes
1,
Isabela Camargo Gonçalves
1,2,
Bianca Bacellar Rodrigues de Godoy
1,2 and
Fábio Rodrigo Piovezani Rocha
1,*
1
Center for Nuclear Energy in Agriculture, University of São Paulo, São Paulo 3550 308, Brazil
2
“Luiz de Queiroz” College of Agriculture, University of São Paulo, São Paulo 3550 308, Brazil
*
Author to whom correspondence should be addressed.
Presented at the 1st International Electronic Conference on Food Science and Functional Foods, 10–25 November 2020; Available online: https://foods_2020.sciforum.net/.
Proceedings 2021, 70(1), 20; https://doi.org/10.3390/foods_2020-07655
Published: 9 November 2020

Abstract

:
This work aims the development of an analytical alternative to determine phenolic compounds in fruits exploiting a greener microwave-assisted extraction and photometric detection by smartphone-based colorimetry. Acerola cherry (Malpighia emarginata) was selected as a model and the extraction was optimized by the Doehlert design, taking into account temperature, solvent composition, and extraction time. The Folin–Ciocalteau method was used to determine total phenolic content in the extracts, with a 5-fold reduction in reagent amount and waste generation. The optimal extraction was achieved with 17% v/v ethanol, at 38 °C, for 50 min. The total phenolic content determined by the proposed procedure (146 ± 4 mg GAE g−1 dry weight) agreed with the reference procedure (145.0 ± 0.7 mg GAE g−1 dry weight) at the 95% of confidence level. Due to these characteristics, the proposed approach is an alternative for screening fruits in research with bioactive compounds.

1. Introduction

Phenolic compounds are secondary metabolites produced by plants in response to ultraviolet light, water stress, and attack by pests, like insects, viruses, and bacteria. These compounds contribute for the growth and reproduction of plants. Phenolic compounds are classified according to their occurrence in the environment, including widely distributed (flavonoids, phenolic acids, and coumarins); poorly distributed (simple phenols and aldehydes derived from benzoic acids); and polymers (tannins and lignins) [1].
In the last decades, phenolic compounds have been investigated due to their benefits to human health, including antioxidant, antihypertensive, anti-inflammatory, anti-allergenic, anti-atherogenic, antimicrobial, cardioprotective, and vasodilator properties [2,3]. However, these properties are only achieved with enough consumption of fruits, vegetables, and plant-based beverages that are the main sources of these components [4]. Acerola cherry (Malpighia emarginata D.C) is a small fruit native of the Caribbean Islands that has been widely studied due to rich phenolic profile and ascorbic acid content, which makes it an excellent and attractive substitute for synthetic antioxidants [5,6,7].
Several analytical methods have been proposed to quantify phenolic compounds in food matrices, but colorimetric assays are widely used for the first screening of bioactive compounds in plant foods and their by-products [8]. The reaction of phenolic compounds with Folin–Ciocalteau reagent is the main method exploited, due to its easy implementation and applicability in the laboratorial routine [9].
Smartphone-based assays have been exploited in several areas, e.g., food authenticity, water control or medical diagnostic [10,11,12]. This approach is based on the acquisition of images by photographic devices (smartphones, scanners or digital cameras), followed by the image conversion in channels of a suitable color system, such as RGB (red-green-blue), HSV (hue, saturation, value) or CIE Lab [11]. Under proper conditions, the performance is comparable with those achieved by conventional laboratory equipment, such as spectrophotometers and fluorometers [13].
The present work aims to develop a greener and fast analytical alternative to quantify phenolic compounds in fruits, taken acerola cherry as a model. For that, a Doehlert experimental design was exploited to optimize the extraction conditions. Photometric measurements in the hydroalcoholic extracts were conducted by smartphone-based digital image colorimetry.

2. Materials and Methods

2.1. Samples and Extraction Preparation

Acerola cherry samples were provided by the Product Development Laboratory from the “Luiz de Queiroz” College of Agriculture (State of São Paulo, Brazil). The samples were sanitized with a sodium hypochlorite solution (100 mg L−1) and lyophilized until total water removal. The dried fruits were ground in a processor (Philips walita RI7625/71) for 5 min and stored frozen (−18 °C) until the extraction of the analytes.
Extraction of phenolic compounds was conducted in a microwave oven (Ethos 1600, Milestone, Italy). The effect of 3 variables was investigated: ethanol:water proportion in the extractant, (from 0 to 99% v/v), temperature (from 30 to 60 °C), and extraction time (from 10 to 50 min), according to a Doehlert experimental design. In total, 17 experiments were conducted, including five repetitions at the central point. For that, 0.500 g of acerola powder was weighed directly inside the microwave flasks and then mixed with 30 mL of extractor solvent. After extraction, the extracts were centrifuged at 5000 rpm for 20 min, filtered using a Whatman n.42 filter paper, and stored at −18 °C protected from the light until the chemical analysis.

2.2. Determination of Total Phenolic Content

The total phenolic content (TPC) was determined by the Folin–Ciocalteau method that lead to a blue colored product from reduction of phosphomolybdic and phosphotungstic acids by the analytes [14]. The hydroalcoholic extracts were diluted in water at the concentration 1:20 (v/v). An aliquot of 0.5 mL of the diluted sample was transferred to 15 mL Falcon® tubes and then mixed with 2.5 mL of the solution 0.5 mol L−1 of Folin–Ciocalteau reagent. After 5 min of reaction, 2.0 mL of the sodium carbonate 4% (m/v) solution was added and mixed, and the mixture was kept protected from the light, for two hours. Phenolic compounds concentration was determined using a spectrophotometer (Femto 700 Plus, Sao Paulo, Brazil) at 740 nm and by smartphone-based colorimetry (item 2.2.1). The results were expressed as milligram of equivalent gallic acid per gram of dried sample (GAE, mg g−1 of dried acerola).

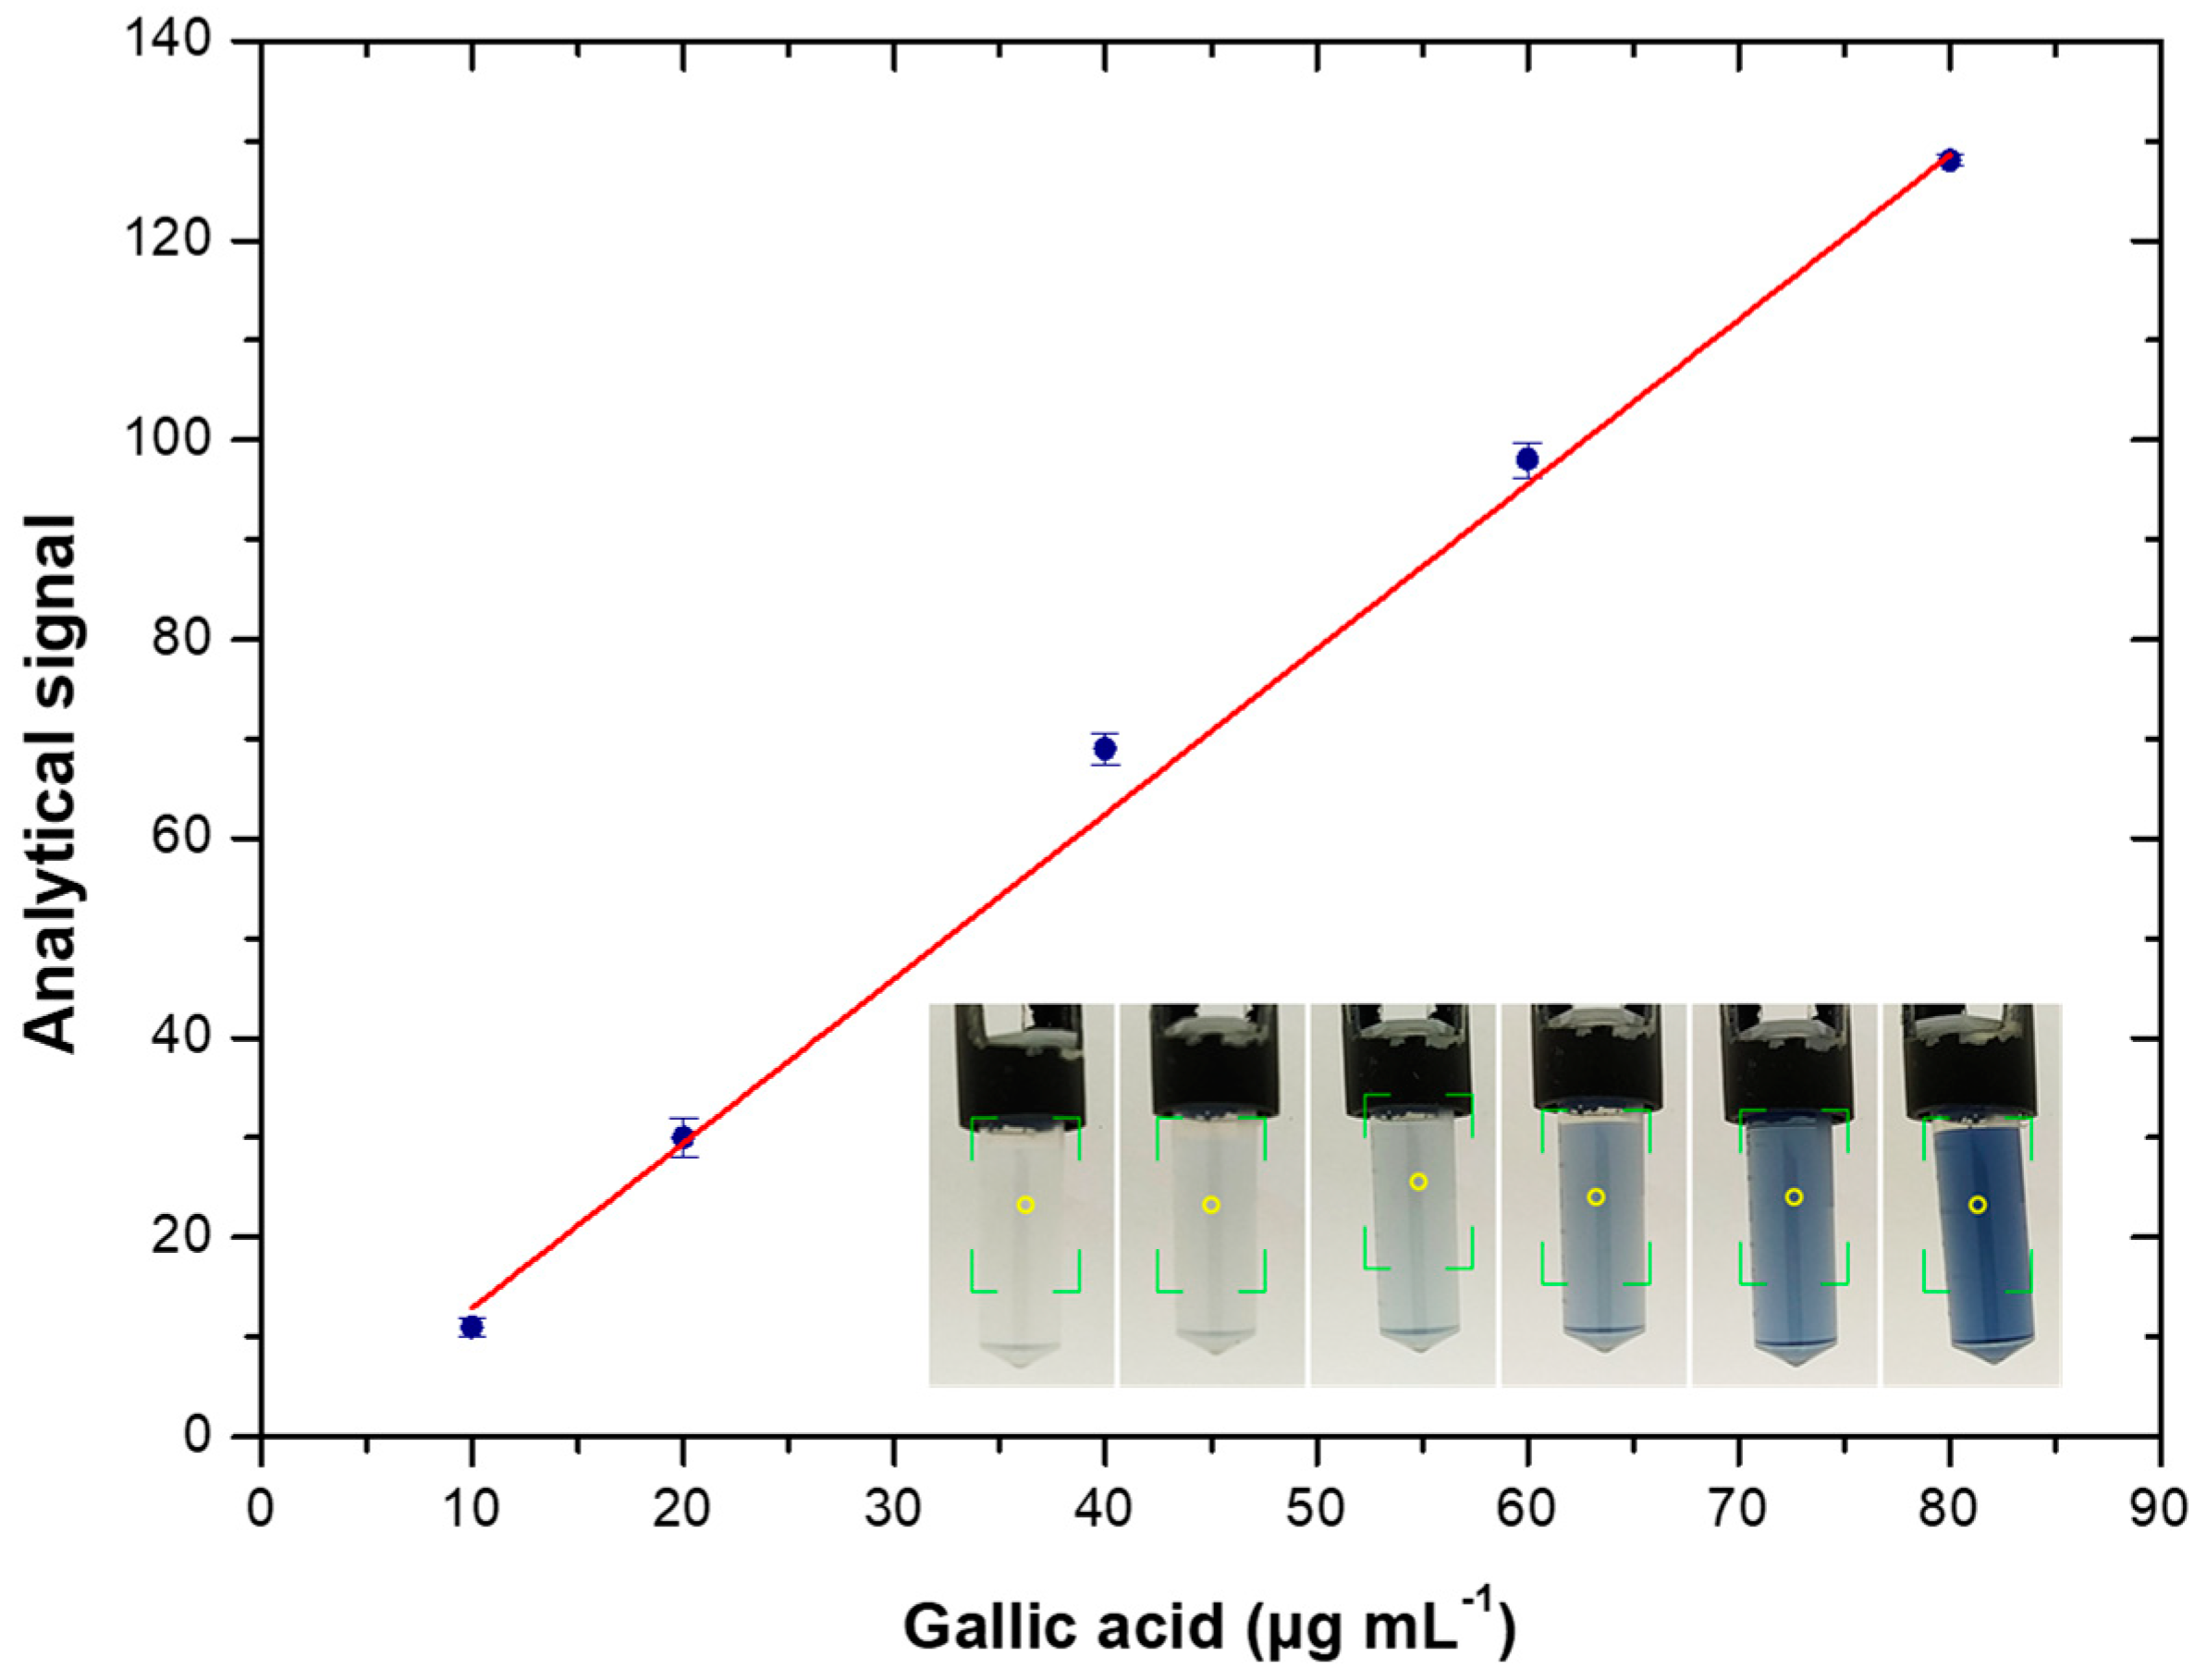
2.2.1. Smartphone-Based Photometric Detection

The photometric measurements were based on the reflected radiation captured directly at the Eppendorf® tubes. It was used a smartphone (Xiaomi Mi A3, Android 10) equipped with a 48-megapixel camera that presents a resolution of 8000 × 6000 pixel and a lens aperture of f/1.79. The images were acquired at the central region of the tubes, considering a region of interest of 32 × 32 pixel, and then converted to RGB channels using a free application (ColorGrab, Loomatix, version 3.7.6, 2020). Images were acquired into a styrofoam box (14 cm high × 16 cm wide × 10.5 cm deep) with a LED-lamp (Kian, 30 high-brightness LED SMD, 1.5 W, 3.7 V, feed with a lithium battery) placed on the bottom of the box, aiming to keep constant illumination. The R channel was monitored due to its complementarity with the color of the formed product. The limits of detection (LOD) and quantification (LOQ) were determined according to the Equations 1 and 2, respectively.
LOD = 3 × S d b 2 + S d i 2 m
LOQ = 3 × L O D
In which Sdb = standard deviation of 3 measurements of blank solutions; Sdi = standard error; m = angular coefficient of the calibration curve [15].

3. Results and Discussion

3.1. TPC Content

The TPC of the acerola extracts determined by spectrophotometry and smartphone-based photometry for the different extraction conditions indicated by the Doehlert design are shown in Table 1.
The TPC determined by spectrophotometry and smartphone-based colorimetry were in close agreement (differences not significant at 95% of confidence level, as evaluated by a paired t-test) as demonstrated in Table 1. Values varied from 76.5 ± 0.9 to 145.0 ± 0.7 mg GAE g−1 of dried acerola, which agreed with those reported in the literature (from 9.1 to 152.54 mg GAE g−1 of dried acerola [16]). The experiment number 11 (extraction with 17% (v/v) ethanol, at 38 °C for 50 min) presented the highest efficiency of extraction of phenolic compounds. This condition is quite different from the one recommended in the literature for extraction of polyphenols with convective heating (extraction with 14.5% (v/v) ethanol, at 55.6 °C for 50 min) [17] and provided a TPC value 39% higher, indicating the better efficiency of the microwave-assisted extraction.
For the photometric measurements, the analytical signal was determined by discounting the values measured from the reference solutions and samples (Rx) from those measured with water (R0 = 182 ± 1), i.e., Analytical signal = R0−Rx. This provided an analytical response directly proportional to the color intensity (Figure 1): Analytical signal = (1.652 ± 0.044) X − (3.584 ± 2.882), r = 0.999, in which X corresponds to the TPC. The LOD (99.7% of confidence level) and LOQ were 3 and 10 µg mL−1, respectively. Due to the microanalysis provided by smartphone-based digital images, reagent consumption and waste generation were 5-fold lower than in the reference method.

4. Conclusions

A more efficient extraction of phenolic compounds was achieved by microwave-assisted extraction, also minimizing the extraction temperature (from 55.6 to 38 °C), thus minimizing risks of oxidation of the species during this step. The smartphone-based detection presented an efficient, cost-effective, simple, and fast approach to determine the total phenolic content in acerola extracts, being a reliable alternative for the screening of fruits. It was also demonstrated that photometric measurements can be conducted with a portable and widely available smartphone camera, with results in agreement with those attained by spectrophotometry. Moreover, the minimization of reagent consumption and waste generation provided by microanalysis are in agreement with the principles of green chemistry. The optimized extraction condition will be adopted for determination of TPC in other fruits as well as for determination of the phenolic profile using High-Performance Liquid Chromatography.

Author Contributions

Conceptualization: L.C.M., A.F.d.S.S., F.R.P.R. Methodology: A.F.d.S.S., L.M.B.d.M., I.C.G., B.B.R.d.G. Software: L.C.M. Validation: L.M.B.d.M., L.C.M. Formal analysis: L.C.M., L.M.B.d.M., A.F.d.S.S., I.C.G., B.B.R.d.G. Investigation: B.B.R.d.G., I.C.G. Resources: L.C.M., F.R.P.R. Data curation: L.C.M., A.F.d.S.S., L.M.B.d.M., I.C.G., B.B.R.d.G.; L.C.M. Writing—original draft preparation: L.C.M., A.F.d.S.S., L.M.B.d.M., I.C.G., B.B.R.d.G. Writing—review and editing: F.R.P.R. Supervision: F.R.P.R. Project administration: F.R.P.R. Funding acquisition: F.R.P.R. All authors have read and agreed to the published version of the manuscript.

Funding

This research was funded by the Luiz de Queiroz Agrarian Studies Foundation (FEALQ), process 10.098−6, National Council of Technological and Scientific Development (CNPq), São Paulo Research Foundation (FAPESP), Coordination for the Improvement of Higher Education Personnel (CAPES, financial code 001), and National Institute of Advanced Analytical Sciences and Technologies (INCTAA).

Institutional Review Board Statement

Not applicable.

Informed Consent Statement

Not applicable.

Data Availability Statement

Data sharing is not applicable to this article.

Conflicts of Interest

The authors declare no conflict of interest.

References

  1. Castelucci, A.C.L. Avaliação Da Estabilidade Dos Compostos Bioativos de Polpas de Frutas Nativas Submetidas ao Processo de Irradiação. Ph.D. Thesis, Universidade de São Paulo, Sao Paulo, Brazil, 2015. [Google Scholar] [CrossRef]
  2. Granato, D.; Barba, F.J.; Bursać Kovačević, D.; Lorenzo, J.M.; Cruz, A.G.; Putnik, P. Functional Foods: Product Development, Technological Trends, Efficacy Testing, and Safety. Annu. Rev. Food Sci. Technol. 2020, 11, 93–118. [Google Scholar] [CrossRef] [PubMed]
  3. Dias, R.; Oliveira, H.; Fernandes, I.; Simal-Gandara, J.; Perez-Gregorio, R. Recent Advances in Extracting Phenolic Compounds from Food and Their Use in Disease Prevention and as Cosmetics. Crit. Rev. Food Sci. Nutr. 2020, 1–22. [Google Scholar] [CrossRef] [PubMed]
  4. Granato, D.; Santos, J.S.; Maciel, L.G.; Nunes, D.S. Chemical Perspective and Criticism on Selected Analytical Methods Used to Estimate the Total Content of Phenolic Compounds in Food Matrices. TrAC Trends Anal. Chem. 2016, 80, 266–279. [Google Scholar] [CrossRef]
  5. Caetano, A.C.D.S.; Araújo, C.R.D.; Lima, V.L.A.G.D.; Maciel, M.I.S.; Melo, E.D.A. Evaluation of Antioxidant Activity of Agro-Industrial Waste of Acerola (Malpighia emarginata D.C.) Fruit Extracts. Ciênc. E Tecnol. Aliment. 2011, 31, 769–775. [Google Scholar] [CrossRef]
  6. Da Cruz, R.G.; Beney, L.; Gervais, P.; De Lira, S.P.; de Souza Vieira, T.M.F.; Dupont, S. Comparison of the Antioxidant Property of Acerola Extracts with Synthetic Antioxidants Using an in Vivo Method with Yeasts. Food Chem. 2019, 277, 698–705. [Google Scholar] [CrossRef] [PubMed]
  7. Mezadri, T.; Villaño, D.; Fernández-Pachón, M.S.; García-Parrilla, M.C.; Troncoso, A.M. Antioxidant Compounds and Antioxidant Activity in Acerola (Malpighia emarginata DC.) Fruits and Derivatives. J. Food Compos. Anal. 2008, 21, 282–290. [Google Scholar] [CrossRef]
  8. de Camargo, A.C.; Biasoto, A.C.T.; Schwember, A.R.; Granato, D.; Rasera, G.B.; Franchin, M.; Rosalen, P.L.; Alencar, S.M.; Shahidi, F. Should We Ban Total Phenolics and Antioxidant Screening Methods? The Link between Antioxidant Potential and Activation of NF-ΚB Using Phenolic Compounds from Grape by-Products. Food Chem. 2019, 290, 229–238. [Google Scholar] [CrossRef] [PubMed]
  9. Blainski, A.; Lopes, G.; de Mello, J. Application and Analysis of the Folin Ciocalteu Method for the Determination of the Total Phenolic Content from Limonium brasiliense L. Molecules 2013, 18, 6852–6865. [Google Scholar] [CrossRef] [PubMed]
  10. Soni, A.; Jha, S.K. Smartphone Based Non-Invasive Salivary Glucose Biosensor. Anal. Chim. Acta 2017, 996, 54–63. [Google Scholar] [CrossRef] [PubMed]
  11. Silva, A.F.S.; Rocha, F.R.P. A Novel Approach to Detect Milk Adulteration Based on the Determination of Protein Content by Smartphone-Based Digital Image Colorimetry. Food Control 2020, 115, 107299. [Google Scholar] [CrossRef]
  12. Masawat, P.; Harfield, A.; Srihirun, N.; Namwong, A. Green Determination of Total Iron in Water by Digital Image Colorimetry. Anal. Lett. 2017, 50, 173–185. [Google Scholar] [CrossRef]
  13. Jung, Y.; Kim, J.; Awofeso, O.; Kim, H.; Regnier, F.; Bae, E. Smartphone-Based Colorimetric Analysis for Detection of Saliva Alcohol Concentration. Appl. Opt. 2015, 54, 9183. [Google Scholar] [CrossRef] [PubMed]
  14. Singleton, V.L.; Orthofer, R.; Lamuela-Raventós, R.M. Analysis of Total Phenols and Other Oxidation Substrates and Antioxidants by Means of Folin-Ciocalteu Reagent. In Oxidants and Antioxidants Part A; Academic Press: Cambridge, MA, USA, 1999; Volume 299, pp. 152–178. [Google Scholar] [CrossRef]
  15. Brown, L.; Mac Berthouex, P. Limit of Detection. Stat. Environ. Eng. Second Ed. 2002, 55. [Google Scholar] [CrossRef]
  16. Silva, P.B.; Mendes, L.G.; Rehder, A.P.B.; Duarte, C.R.; Barrozo, M.A.S. Optimization of Ultrasound-Assisted Extraction of Bioactive Compounds from Acerola Waste. J. Food Sci. Technol. 2020, 57, 4627–4636. [Google Scholar] [CrossRef] [PubMed]
  17. Cruz, R.G. Potencial de Metabólitos da Acerola (Malpighia emarginata) Como Antioxidantes em Diferentes Sistemas Oxidativos Mediados por Radicais Livres. Ph.D. Thesis, Doutorado em Ciência e Tecnologia de Alimentos, Universidade de São Paulo, Piracicaba, Sao Paulo, Brazil, 2018. [Google Scholar] [CrossRef]
Figure 1. Calibration graph for determination of TPC (µg of gallic acid mL−1). The insert shows the images of the Eppendorf tubes corresponding to blank (left) and increasing TPC values.
Proceedings 70 00020 g001
Table 1. Real values, coded values, and total phenolic content (TPC) in extraction conditions indicated by the Doehlert design.
ExperimentVariablesAnalytical Response 1
Temperature (°C)Ethanol Concentration (% v/v)Extraction Time (min)Reference MethodProposed Method
160 (1)50 (0)30 (0)107 ± 2107 ± 2
253 (0.500)99 (0.866)30 (0)101.4 ± 0.8102 ± 2
353 (0.500)66 (0.289)50 (0.817)106 ± 2107 ± 3
430 (−1)50 (0)30 (0)131 ± 1131.1 ± 0.8
538 (−0.500)0 (−0.866)30 (0)76.5 ± 0.977 ± 2
638 (−0.500)33 (−0.289)10 (−0.817)121.3 ± 0.9124 ± 4
753 (0.500)0 (−0.866)30 (0)79 ± 278 ± 1
853 (0.500)33 (−0.289)10 (−0.817)129 ± 2132 ± 1
938 (−0.500)99 (0.866)30 (0)124.4 ± 0.9126.3 ± 0.8
1045 (0)83 (0.577)10 (−0.817)114.6 ± 0.6119.0 ± 0.8
1138 (−0.500)66 (0.289)50 (0.817)145.0 ± 0.7146 ± 4
1245 (0)17 (−0.577)50 (0.817)120 ± 5120 ± 5
13 (CP)45 (0)50 (0)30 (0)122123
14 (CP)45 (0)50 (0)30 (0)113113
15 (CP)45 (0)50 (0)30 (0)120116
16 (CP)45 (0)50 (0)30 (0)126124
17 (CP)45 (0)50 (0)30 (0)113116
1 mg GAE g−1 of dried acerola, considering (mean ± standard deviation). CP = Central Point. In the variables column, the values in parentheses represent the coded values.
Publisher’s Note: MDPI stays neutral with regard to jurisdictional claims in published maps and institutional affiliations.

