Proceeding Paper

Observations on the Instrumental Measurements of Liquid Food Stickiness †

by
Seyed Mostafa Kazemeini
and
Andrew J. Rosenthal
*
Biomaterials Group, Division of Food, Nutrition and Dietetics, University of Nottingham, Sutton Bonington LE12 5RD, UK
*
Author to whom correspondence should be addressed.
Presented at the 1st International Electronic Conference on Food Science and Functional Foods, 10–25 November 2020; Available online: https://foods_2020.sciforum.net/.
Proceedings 2021, 70(1), 102; https://doi.org/10.3390/foods_2020-07714
Published: 10 November 2020

Abstract

:
While we encounter sticky liquids in our daily life and are able to discriminate between them, instrumental measurements of stickiness are difficult to match to those that relate to our perception. In this paper, we examine some of the factors that influence instrumental measurements of stickiness in liquid foods. The shortcomings of using the maximum peak or the area under the curve are discussed, and a hitherto unused measure, the gradient of the force–distance curve, is suggested as a measure of tension per unit contact area. The zero-perimeter virtual probe, which compensates for the changing meniscus and mass of liquid below it, is introduced. This zero-perimeter approach allows us to extrapolate measures of stickiness such as the gradient of the force–distance curve or the area below that curve. Despite the zero-perimeter correction, there is still a speed dependency on results from instrumentally measured stickiness (for all indexes considered). The speed of the test is responsible for the type of failure (cohesive or adhesive) reported by other authors.

1. Introduction

Stickiness is an important characteristic of many food materials, and it has a major influence on numerous industrial processes. While in some products it is a desirable property, for example in bonding oats together in a breakfast bar, in many it causes problems such as doughs sticking to conveyor belts or material not separating from a depositing mould. Related scientific terms include adhesiveness and cohesiveness, though again, the meanings of these terms are poorly defined. This is compounded by some highly influential papers on texture measurement, which have (perhaps inappropriately) attributed parts of a texture analyser curve to a particular property [1]. Ultimately, understanding what contributes to stickiness is a worthy aspiration, and publications such as Adhikari and coworkers [2] attempt to quantify the different forces involved. They report the study of Brennan and Mohamed, which attempted to correlate the sensory stickiness of sugar solutions with a number of physical measures, finding viscosity and surface tension gave the best relationships.
Fiszman and Damasio [3] surveyed a variety of instrumental food stickiness tests, illustrating the diversity of measures that researchers have used. The normal approach taken is to press a probe onto the food surface and then pull it away while measuring the force. The two most widely used measures are the area under the force–time/distance curve and the peak force to detach the probe from the surface [3].
Possibly, as a result of the engineering limitations of the early texture analysers, many of the publications on stickiness measurement deal with force–time curves. Hoseney and Smewing [4] show the effect of varying the withdrawal speed on the force required to pull a probe away from a surface (Figure 1).
When a probe is slowly raised as if to try and separate it from the surface of a sticky liquid, a column of liquid clings on below. Close to the liquid surface, the meniscus of the liquid spreads out beyond the perimeter of the probe, and the force pulling downwards on the probe is due to the mass of liquid held above the plane liquid surface. Moreover, as the separation of the probe from the plane surface increases, the shape of the meniscus changes as the probe rises from the surface [5].
The aim of this work was to better understand the forces and factors involved in the instrumental measurement of stickiness. We aimed to quantify the forces involved in the stickiness of syrups with the hope that the lessons learned might be extended to other materials.

2. Materials and Methods

2.1. Sample Materials

Several sticky proprietary syrups were used for tests: golden syrup (Tate & Lyle, London, UK), black treacle (Tate & Lyle, London, UK) and clear honey (Rowse, UK). The syrups were poured into plastic Petri dishes, clamped onto the base of the texture analyser and tested as below.

2.2. Texture Analyser and Probes

Stable Micro Systems (Godalming, UK) manufactured a series of three bespoke acrylic probes. One had a single head, but the other two were multiheaded, with three and six heads all milled out of an acrylic block. The contact surfaces of all the probes were on the same plane.
The geometries of the three probes are given in Table 1.
A TA.HD texture analyser (Stable Micro Systems, Godalming, UK) was used with a 5 kg load cell. The TestMaker application (Stable Micro Systems, Godalming, UK) was used to write a sequence whereby the probe was brought into contact with the liquid surface. It had to remember that position then push 0.3 mm into the material followed by a 10 s pause to try to allow the liquids to achieve good contact. The probe was then pulled back to the remembered position, and there then followed a further 2 min pause. The probe was then withdrawn from the surface at a defined speed until detachment was achieved. Photographic images of the probe liquid contact were taken with an iPhone 7 Plus.

3. Results and Discussion

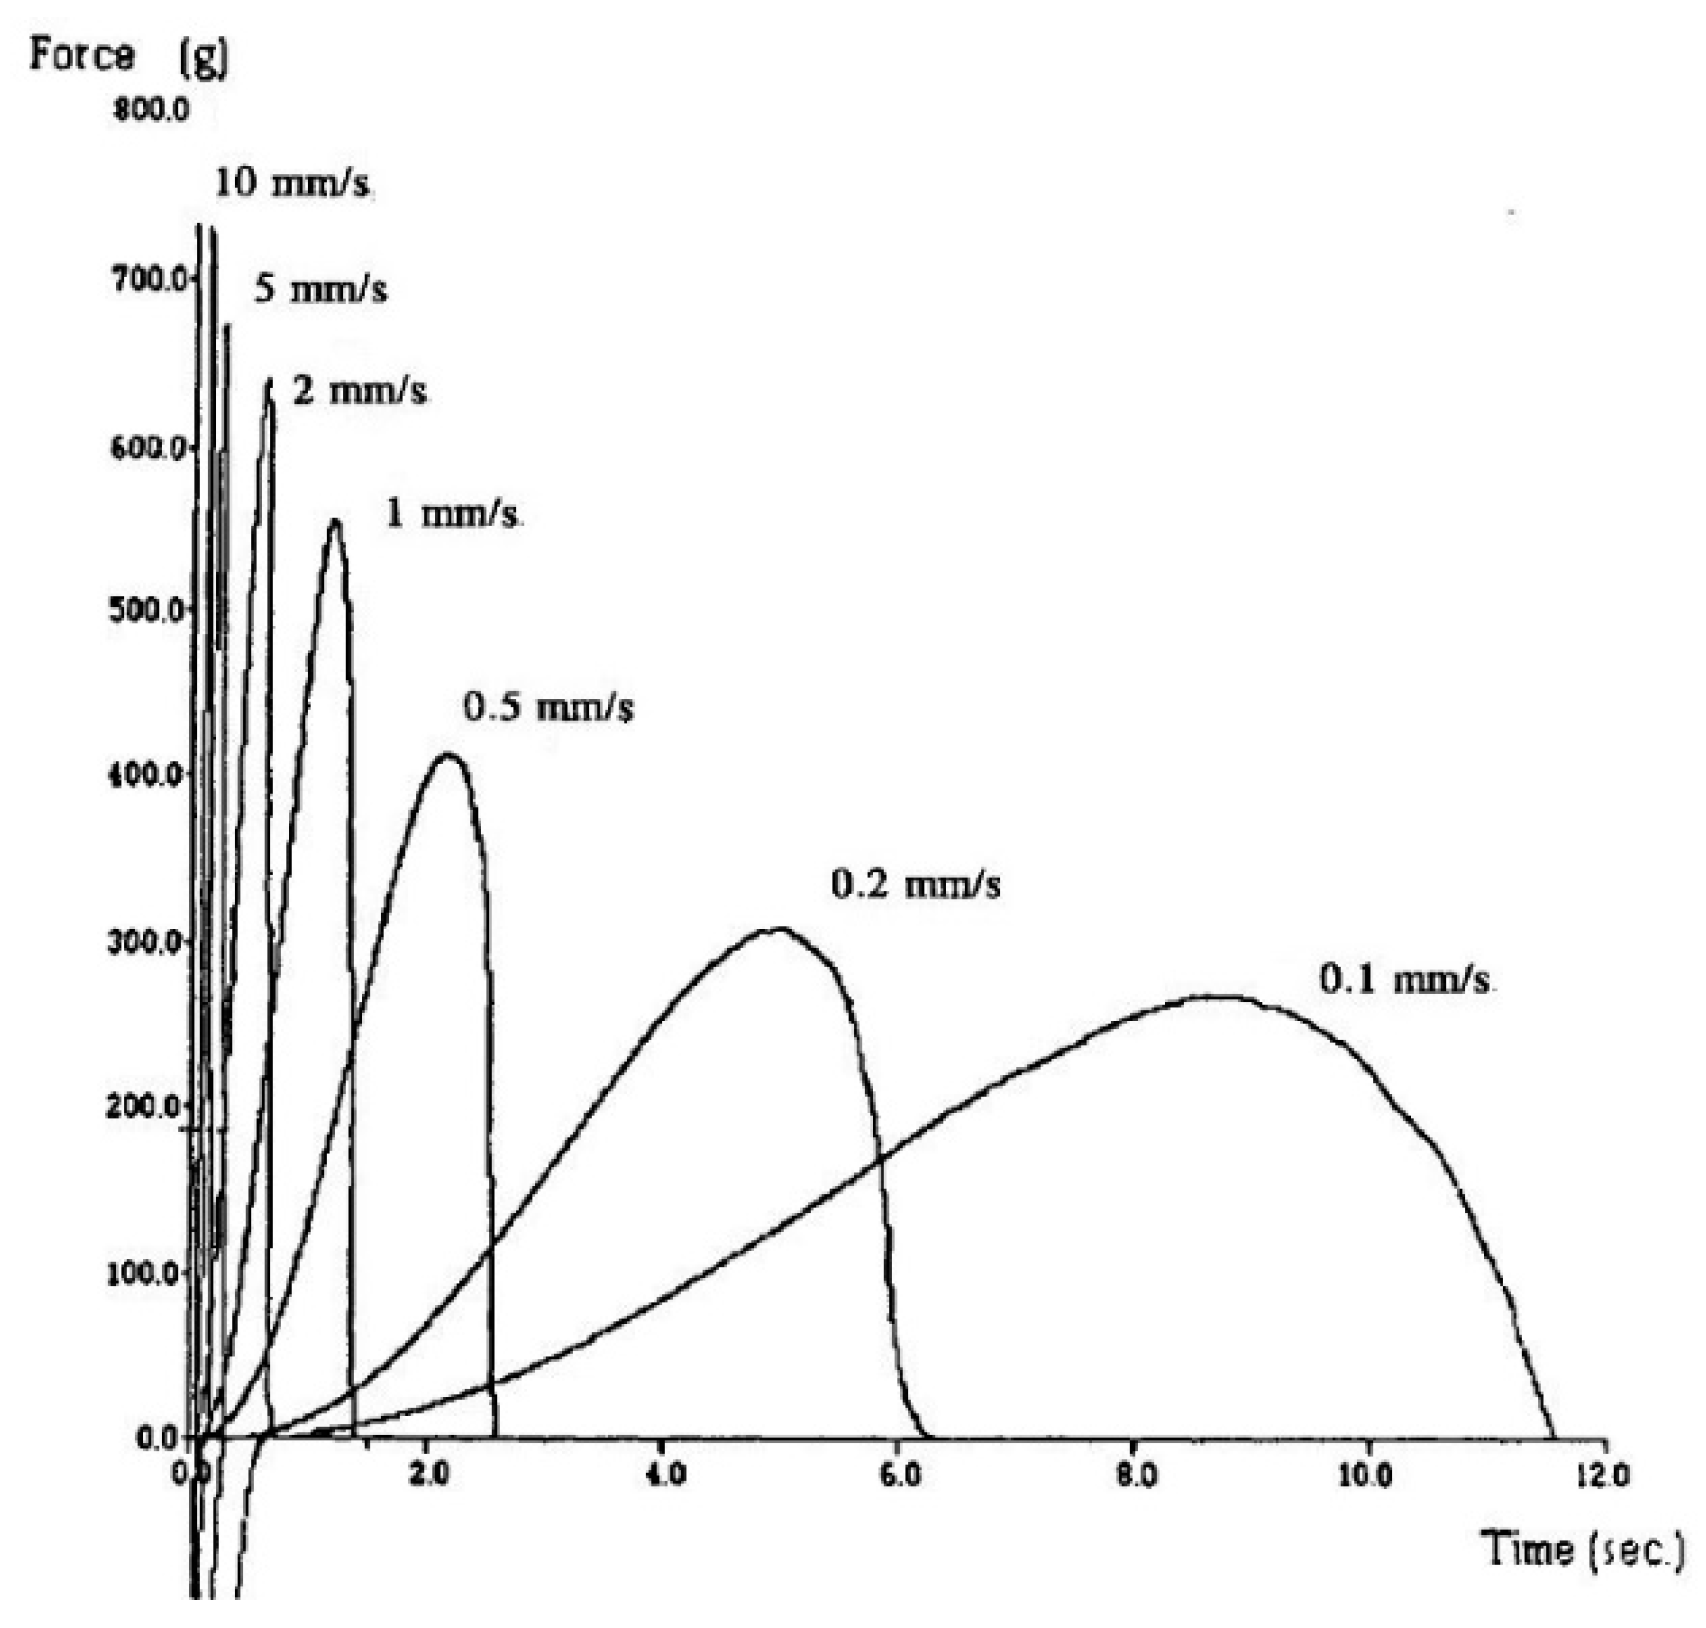
The spread of the peaks in 
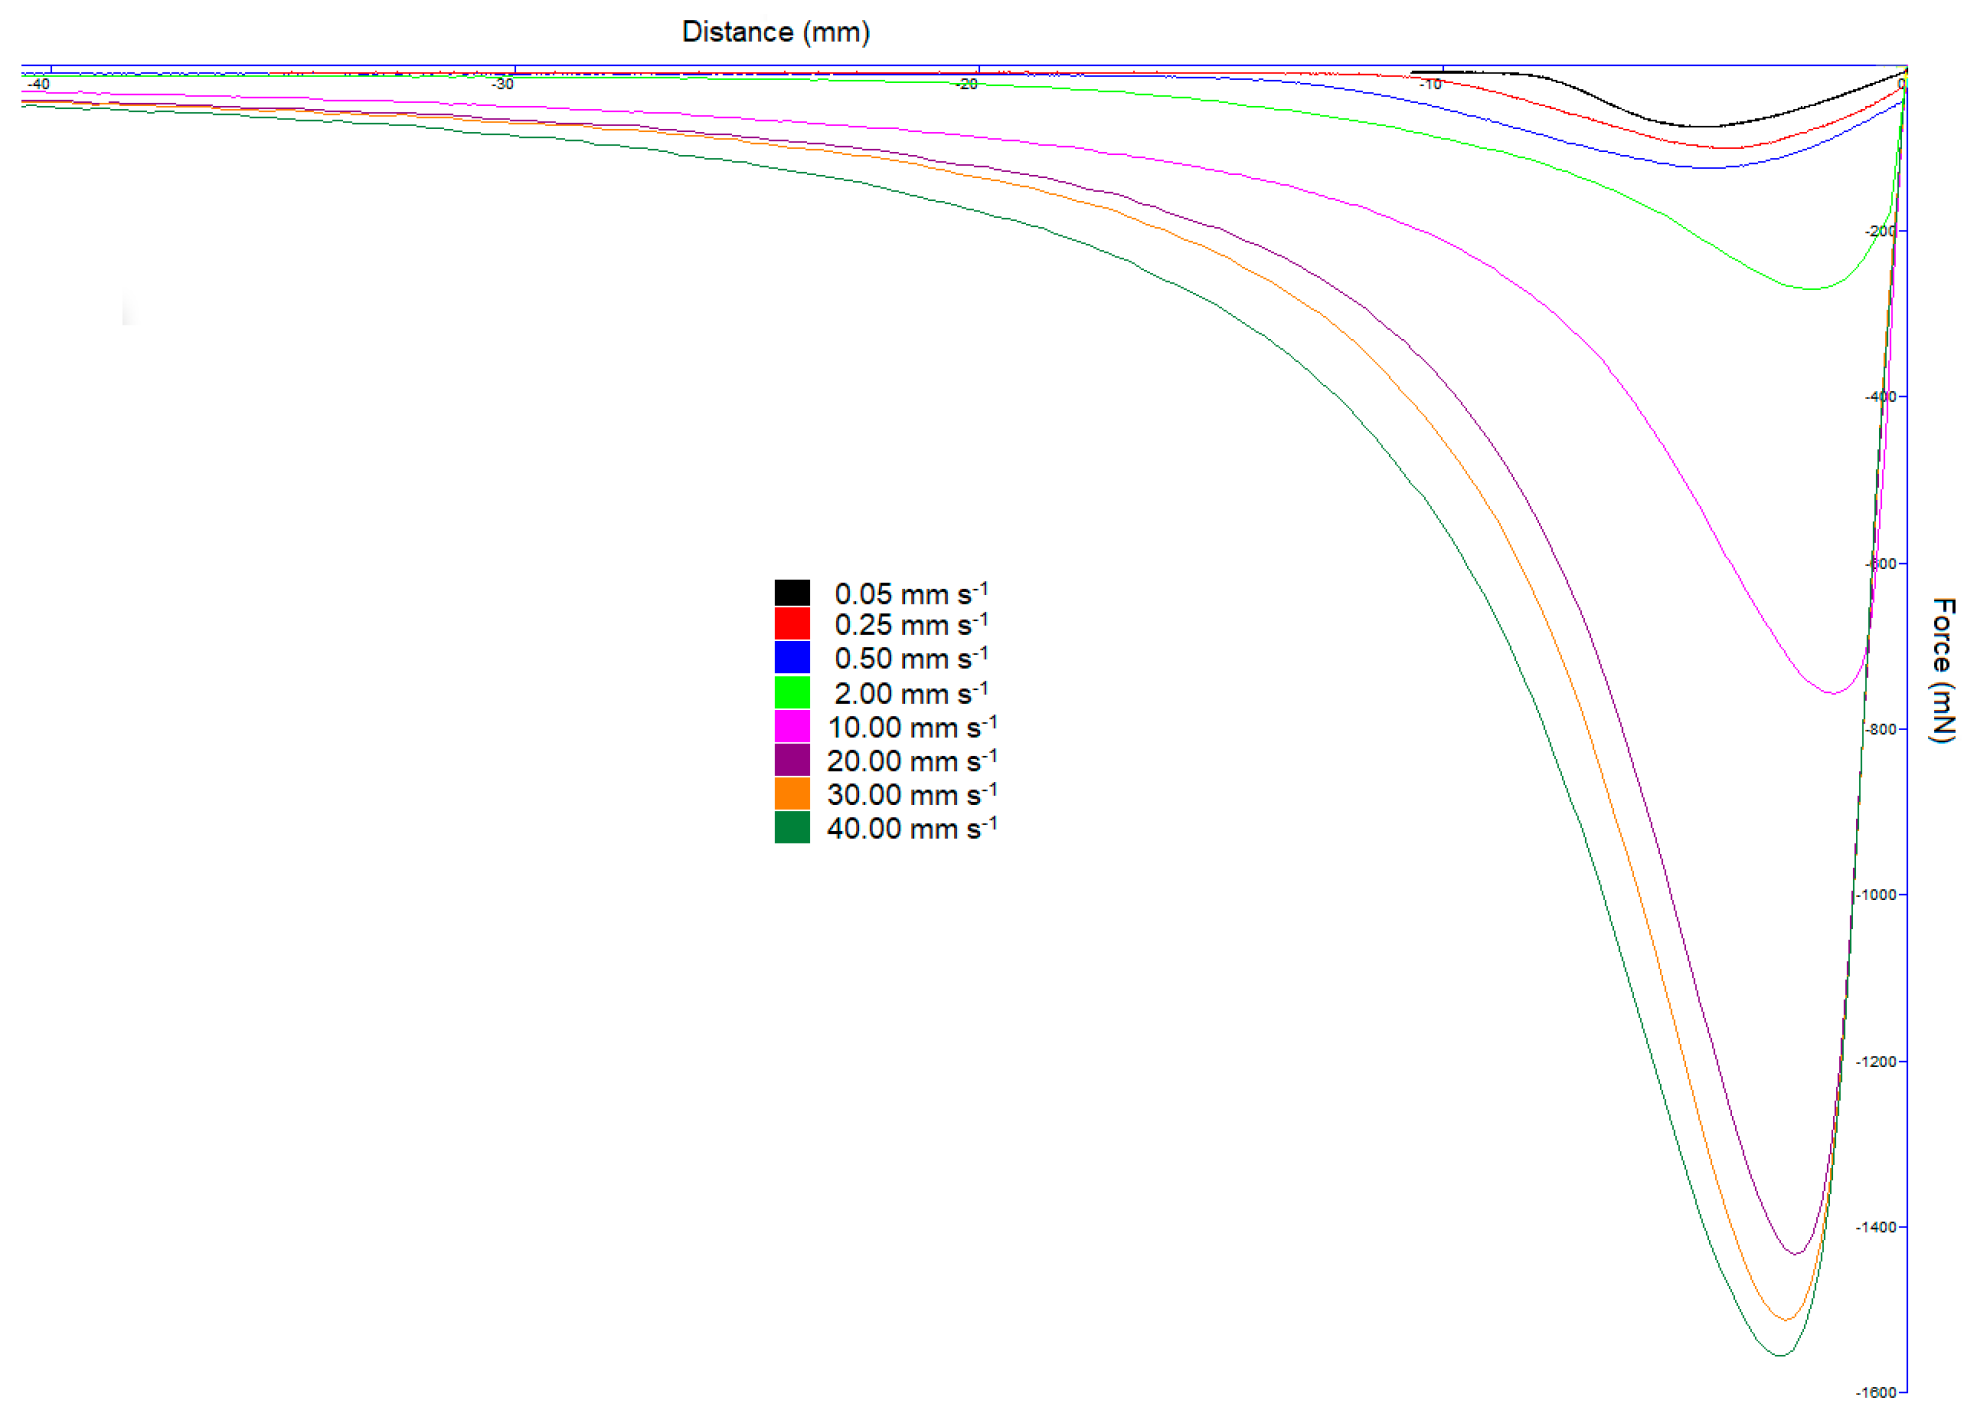
Figure 1 was resolved by transposing the horizontal time axis to distance. Figure 2 has the same experimental design as undertaken by Hoseney and Smewing [4], with a range of separation speeds, which almost span the capability of the texture analyser used. In Figure 2, we have drawn the curves as negative peaks; however, throughout this discussion, we will refer to the peak as the maximum force (as referring to a minimum force makes little sense).
By plotting the distance of separation as opposed to time on the horizontal axis, we observe that the distance to the negative peak is roughly the same regardless of the speed of the probe. This is consistent with Hoseney and Smewing [4], though not at all obvious from Figure 1. In contrast, the distance that the probe moves from the liquids’ plane surface to the maximum negative peak is both visibly similar and intuitively the same for all probe speeds in Figure 2. In Figure 1, the areas under the curves are greater for the slower speeds, with the units of this quantity being force–time. In Figure 2, the units are force–distance, and the areas under the curves are greatest for the higher speeds. Moreover, if researchers assign stickiness to the area under the curve, then the derived units of force–distance are energy or work (J).
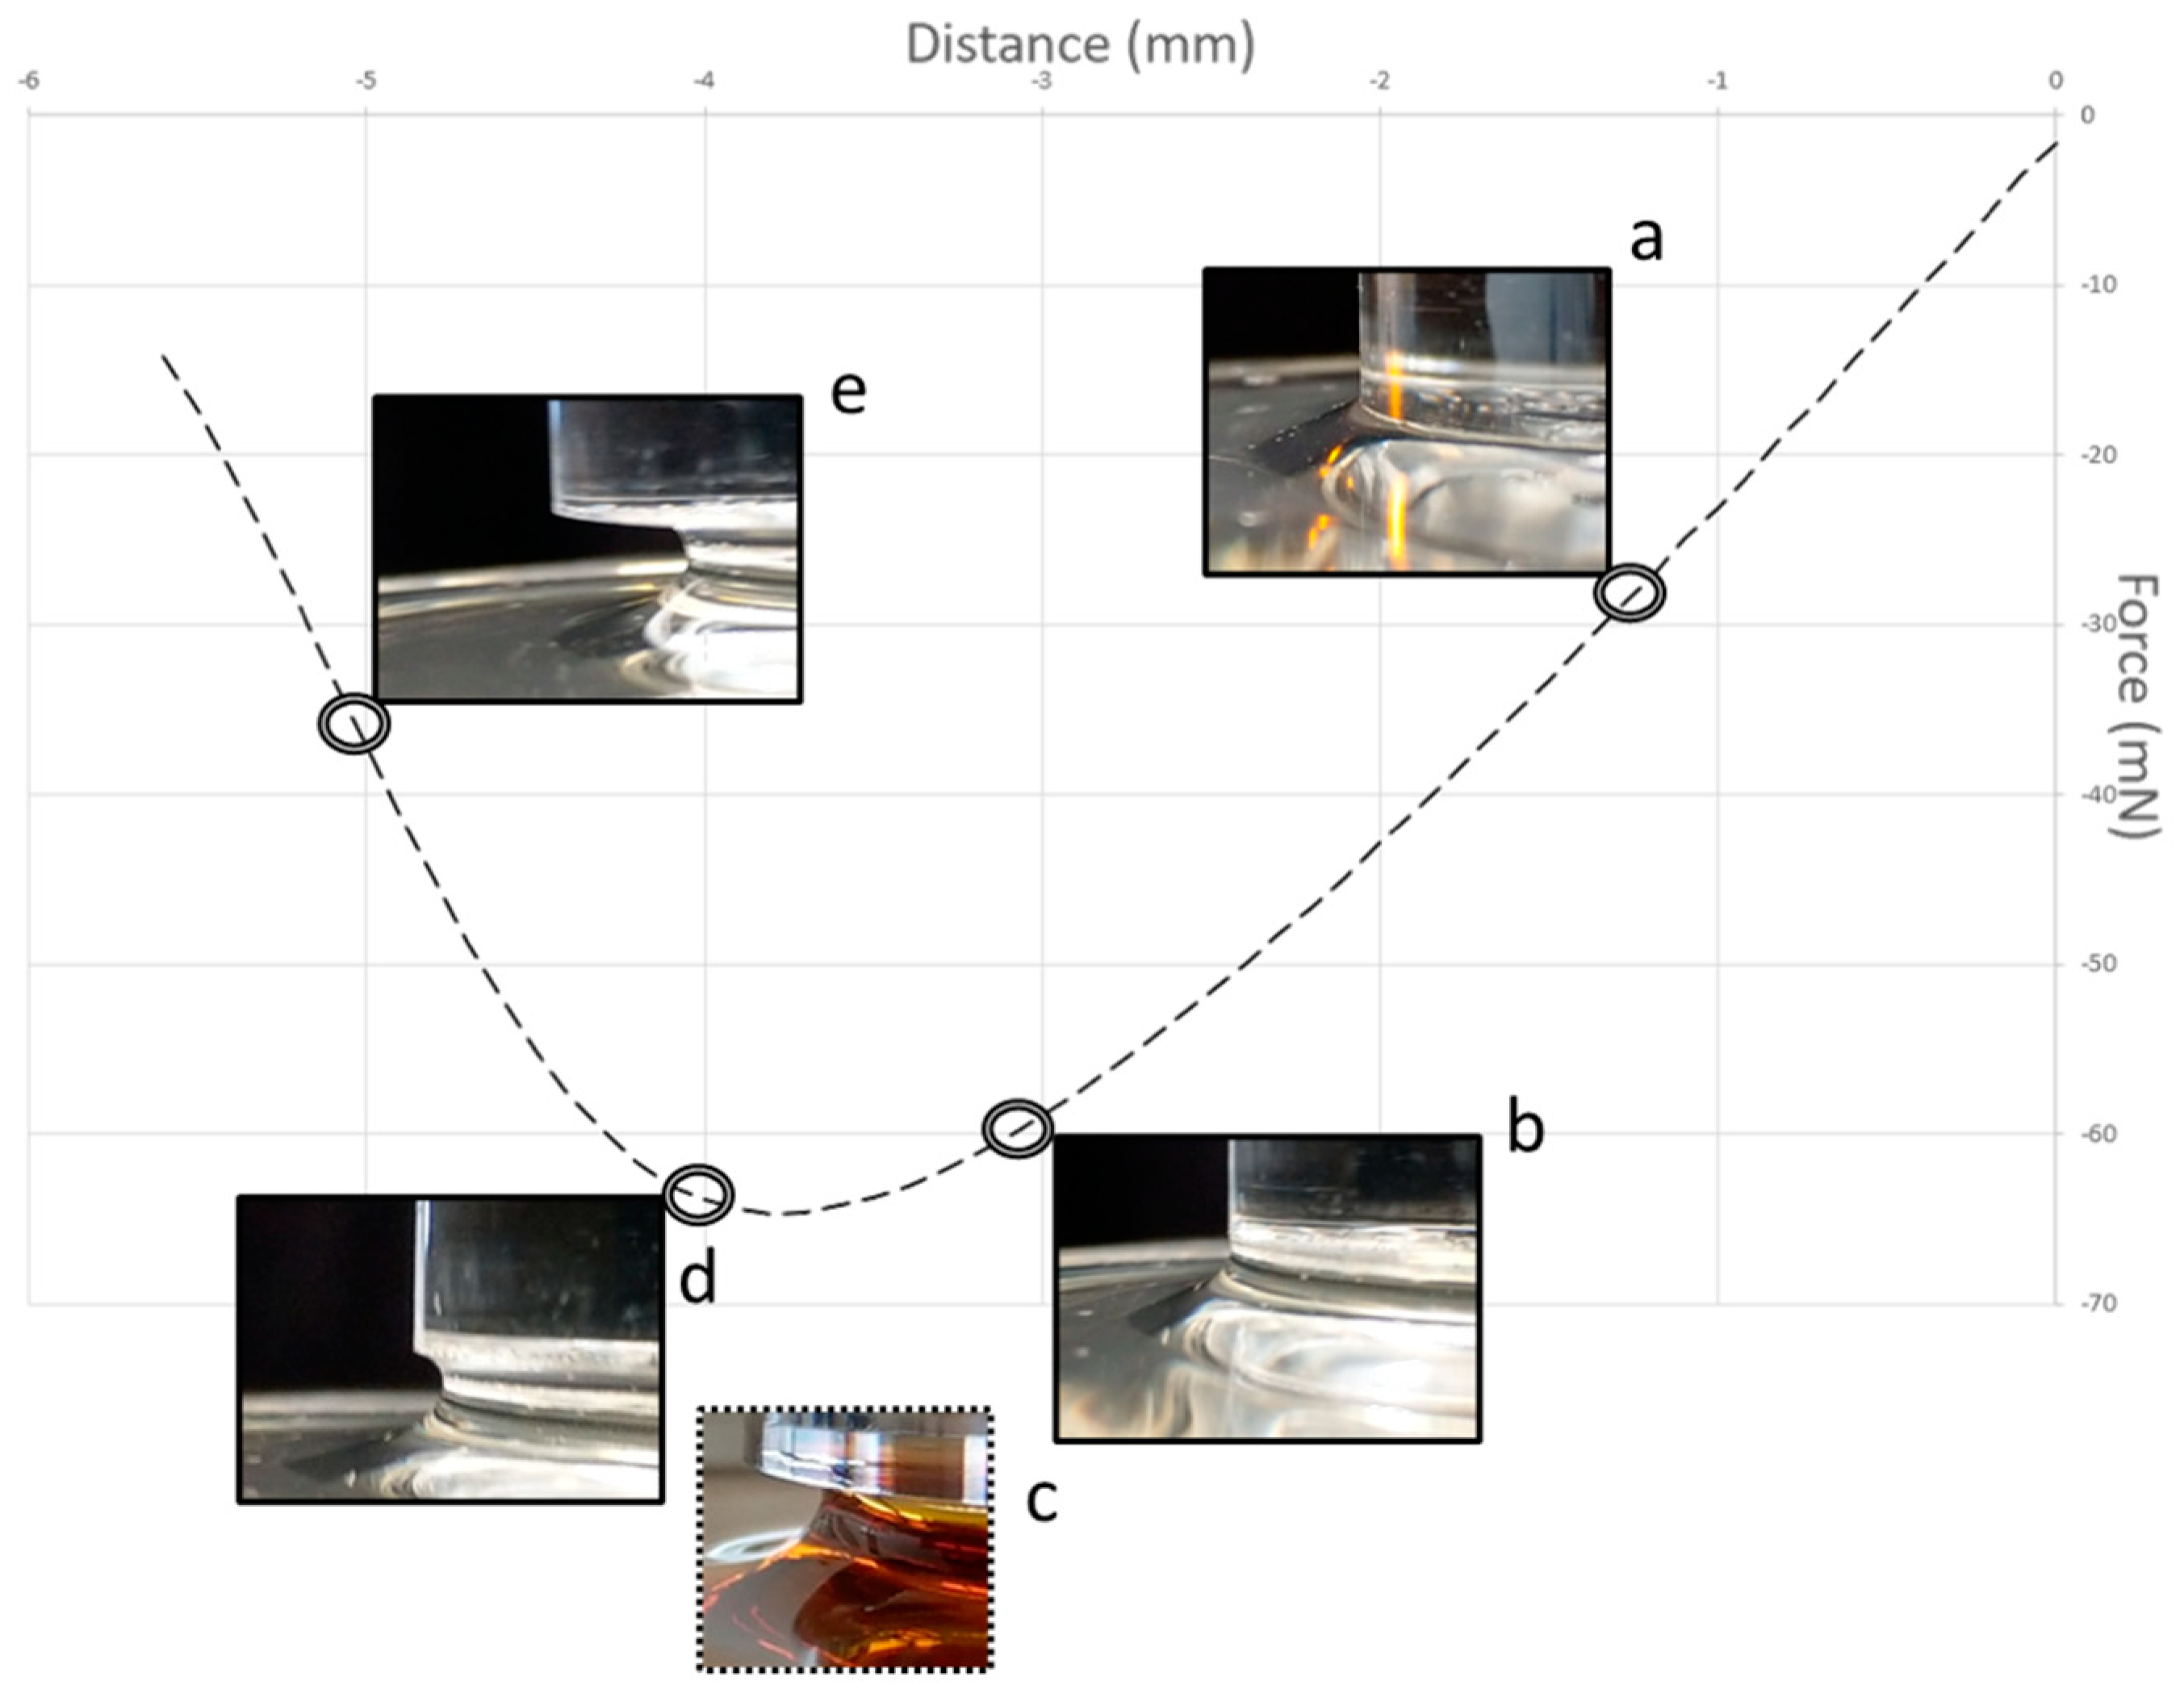
Figure 3 shows a typical curve for the separation of a probe from the surface of a sticky liquid (at a relatively low speed). When the separation is about 1.5 mm, the liquid is still in good contact with the edge of the probe, though the surface develops a curvature (inset of Figure 3a). Before the peak is reached, the force starts to lessen (inset of Figure 3b) as the curve starts to flatten; this is followed by the narrowing of the column of the liquid joining the probe to the body of liquid below. The curvature of the glucose syrup as the probe pulls away exhibits a concave necking (inset of Figure 3d), holding firmly to the probe perimeter and narrowing within the liquid itself (this is shown diagrammatically in Figure 4d). In contrast, the inset image with a broken line (inset of Figure 3c) is for golden syrup at the peak, and while the column of the liquid thins, it does not hold fast to the perimeter of the probe but forms a narrowing cylinder attached to the base of the probe (this is shown diagrammatically in Figure 4b). After the peak is passed, the force continues to reduce as the thickness of the column of the liquid progressively thins (e.g., inset Figure 3e).
Stickiness has been attributed to the interaction of liquid viscosity and the interfacial properties between the probe material and the liquid [2]. Figure 3 shows a linear region at the start of probe withdrawal, during which time the perimeter is fully in contact with the liquid. The inset images in Figure 3 show the curvature of the liquid observed during these early stages of probe withdrawal. The forces acting downward on the probe are due to the surface tension but also the mass of the liquid below the probe and within the truncated annular region beyond the cylindrical perimeter of the probe (Figure 4a). During the linear part of the force–distance curve, during the stages of probe withdrawal from the surface, the curvature of the liquid adhering to the perimeter of the probe is a complex relationship, which changes as the probe progressively moves up [5].
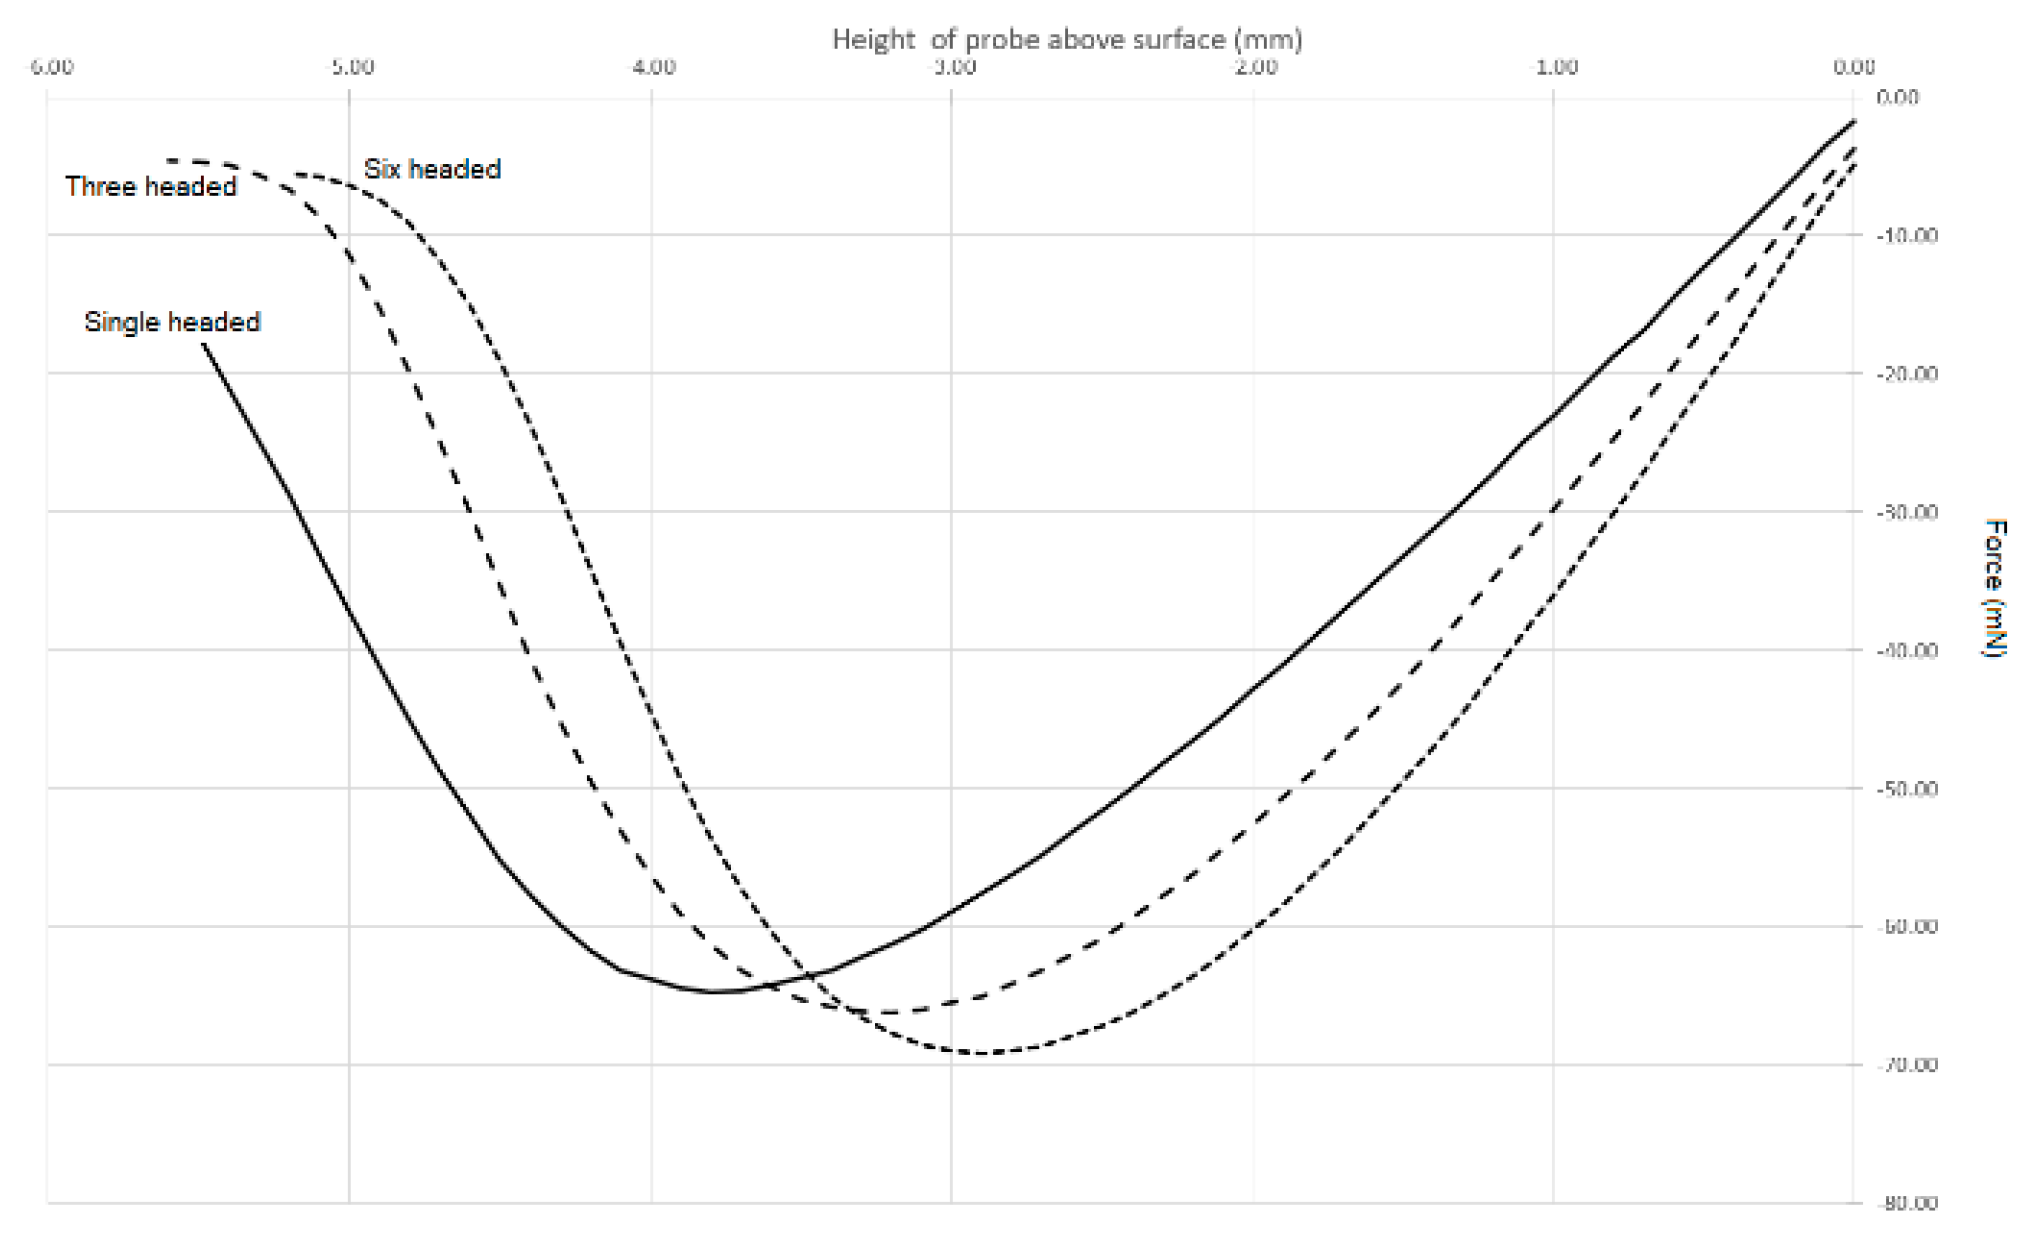
In an attempt to compensate for the effects of curvature, we developed a practical (nontheoretical) solution that utilises multiheaded probes with a common surface area in contact with the liquid. The dimensions of these probes are shown in Table 1. Despite having the same contact area in touch with the liquid, if we sequentially undertake the stickiness test outlined above with each of these probes, we produce three different curves that do not superimpose on each other (Figure 5). While the curves in Figure 5 are all of a similar basic shape, the curve features, such as distance to reach the maximum negative peak, force at the maximum negative peak, area under the curve and gradient of the linear portion of the curve, are all slightly different. However, if we plot these features against the total probe perimeter, we unsurprisingly obtain good straight lines.
Furthermore, if we extrapolate such lines to zero, we effectively obtain the force we would obtain from a zero-perimeter probe. Of course, such a probe does not exist, yet the force exerted on such a virtual probe would be solely due to the mass of the liquid in a cylinder below a 962 mm2 probe.
Our zero-perimeter virtual probe overcomes problems with the unpredictable meniscus; however, we can see from Figure 3 that, strictly speaking, the known contact area (962 mm2) is only valid during the linear part of the curve, and this in reality excludes the use of parameters such as the peak force or the area under the curve. However, we continued to make use of the parameters of peak force and the area under the curve as measures of stickiness, albeit with our zero-perimeter curve. At least the zero-perimeter probe excludes the effect of the curved meniscus and as such better defines the system.
If the purpose of a stickiness test is to determine a defined material property, then the dimensions of the geometry are important. That is to say, in an ideal world we would be able to express the stickiness per m2. Yet, once the curve begins to deviate from a linear force–distance behaviour, the sample geometry has changed. Ideally, we should obtain our measure of stickiness from the linear portion of the curve, otherwise we are measuring a property of ill-defined dimensions. Certainly, during the linear part of the force–distance curve, there is neither separation of the liquid from the perimeter nor necking of the sample, thus the instrumental readings obtained will relate to the contact area of the probe. Moreover, if we consider that property our zero-perimeter virtual probe, we can overcome changes in the meniscus. On this basis, using a property of this linear region such as its gradient would perhaps give us a better measure of stickiness and one that can be related to the probe geometry. Appropriately, the units of this gradient are force per unit distance (Nm−1); in other words, a tension, which is possibly a better match for stickiness than either the peak force or work used to separate the probe. At low test speeds, the gradient of the linear portion of the force–distance curve is straightforward to measure; however, as is apparent from Figure 2, at higher speeds, and especially with the more viscous liquids, the curve is almost vertical. It is as if the liquid cannot flow or yield, with the stress exerted by the texture analyser being unable to be dissipated, thereby rapidly rising. Although in Figure 2 these high-speed curves appear to superimpose upon each other, if the horizontal axis is enlarged, we can discriminate between them.
Figure 1 and 
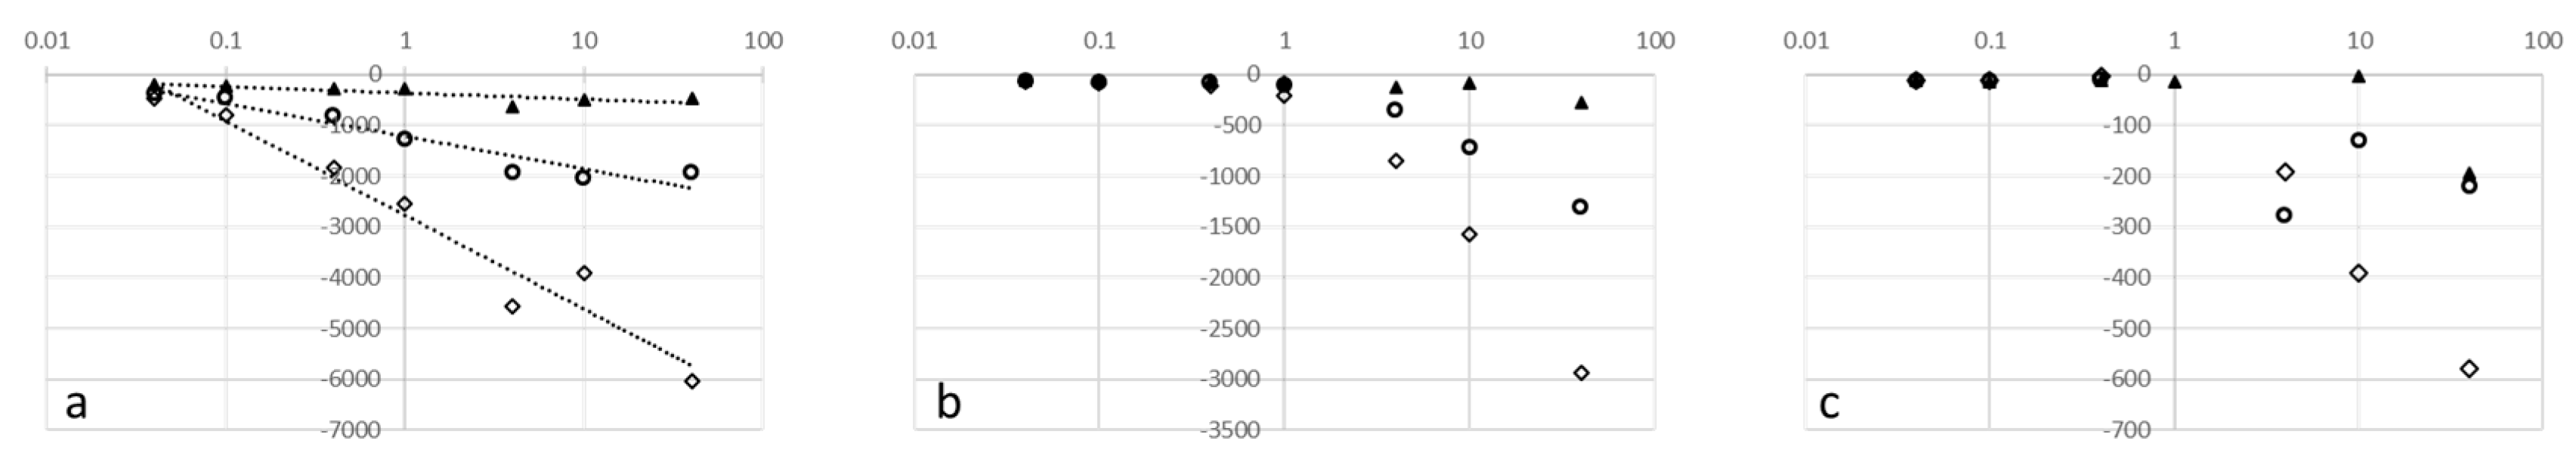
Figure 2 emphasise the importance of probe withdrawal speed on the curve obtained. Making use of our multiheaded probes, we were able to estimate the various parts of the curves of our zero-perimeter virtual probe, being withdrawn from different sticky liquids at a range of speeds. Reminding ourselves that the purpose of these tests is to measure stickiness as a characteristic property of the material, we attempted to examine the relationship between the initial gradient, the maximum negative peak force and the area under the curve of the zero-perimeter virtual probe as functions of withdrawal speed.
To cope with the wide range of withdrawal speeds employed to collect the data in Figure 6, we plotted the withdrawal speed on a log axis. Figure 6b,c appears to show a discontinuity, remaining relatively low at slow speeds and then increasing logarithmically after some critical value, which is specific for each liquid.
Kilcast and Roberts [6] introduced the idea of adhesive and cohesive failure based on whether a sticky liquid leaves a residue on the probe or separates cleanly when a probe is pulled out of a sticky material. We concur with Noren, Scanlon and Arntfield [7], who observed that the cohesive/adhesive failure behaviour actually depends on the speed at which the test is undertaken. We speculate that as the probe is withdrawn from the liquid surface, at low speeds, the liquid is able to flow back to the liquid bulk, allowing it to cleanly separate from the surface of the probe, progressing from Figure 4a,b and finishing at Figure 4c—i.e., adhesive failure. In contrast, once we exceed the critical speed that marks the discontinuity in Figure 6b,c, the separating probe moves faster than allows the liquid to flow back to the bulk with the result that the probe liquid behaviour progresses from Figure 4a,d ending with Figure 4e—i.e., cohesive failure.
Earlier, we commented on the almost vertical force–distance curves of the high-speed tests, and the idea that the material cannot dissipate the stress through flow or relaxation is consistent with stresses building within the material until that material cannot support further stretching and undergoes catastrophic failure. If the separation of the probe from the surface of the liquid is faster than allows the liquid to flow, we get cohesive failure. In this study, we are dealing with viscous syrups. Many foods are glassy materials, which are often considered to be supercooled liquids. Such materials have immensely high viscosities, which would be difficult to flow in the time frame of the test protocol outlined here. Thus, we would expect glassy materials to undergo cohesive failure. Some other foods are viscoelastic (e.g., doughs), and in such situations, we expect the failure to depend on the predominance of viscous and elastic elements present. In the case of viscoelastic materials, both the ease of flow and the elastic limits of the material will dictate whether the texture analyser imposed force can be adequately dissipated in the time frame of the test or whether we will end with cohesive failure.
In our daily life, we experience the phenomenon of stickiness in the liquids we interact with, and perhaps the approach we should take from a physical testing point of view is to employ separation speeds akin to those employed in the manual manipulation of materials with our fingers and jaw motion. Shama and Sherman [8] used a similar approach in recommending shear rates with which to evaluate the viscosity of liquids if they are to match our human experience.

4. Conclusions

Clearly, the data collected to measure stickiness of liquids have a huge dependence on the speed and geometry of the test being undertaken. We might even go so far as to say the results are artefacts of the test method employed.
Our zero-perimeter virtual probe overcomes problems with the unpredictable meniscus. The probe is only in full contact with the probe during the linear region of the force–distance curve, and as such, perhaps the gradient would give us a better measure of stickiness and one that can be related to the probe geometry. In contrast, while the peak force and the area under the curve are not able to relate the force to the geometry of the probe, the zero-perimeter virtual probe does reduce some of the variability in results arising from the curved meniscus.

Author Contributions

S.M.K. and A.J.R. designed the experiments, analysed the data and wrote the manuscript together. A.J.R. conceived and designed the multiheaded probes. S.M.K. undertook the data collection. All authors have read and agreed to the published version of the manuscript.

Funding

We are grateful to Innovate UK, Project 102706, for funding the manufacture of the multiheaded probes.

Acknowledgments

We are grateful to G Yakubov for valuable discussions.

Conflicts of Interest

The authors declare no conflict of interest.

References

  1. Nishinari, K.; Fang, Y.; Rosenthal, A. Human oral processing and texture profile analysis parameters: Bridging the gap between the sensory evaluation and the instrumental measurements. J. Texture Stud. 2019, 50, 369–380. [Google Scholar] [CrossRef] [PubMed]
  2. Adhikari, B.; Howes, T.; Bhandari, B.R.; Truong, V. Stickiness in foods: A review of mechanisms and test methods. Int. J. Food Prop. 2001, 4, 1–33. [Google Scholar] [CrossRef]
  3. Fiszman, S.M.; Damasio, M.H. Instrumental measurement of adhesiveness in solid and semi-solid foods. A survey. J. Texture Stud. 2000, 31, 69–91. [Google Scholar] [CrossRef]
  4. Hoseney, R.C.; Smewing, J.O. Instrumental Measurement of Stickiness of Doughs and Other Foods. J. Texture Stud. 1999, 30, 123–136. [Google Scholar] [CrossRef]
  5. Henriksson, U.; Erisson, J.C. Thermodynamics of capilary rise: Why is the meniscus curved? J. Chem. Educ. 2004, 81, 150–154. [Google Scholar] [CrossRef]
  6. Kilcast, D.; Roberts, C. Perception and Measurement of Stickiness in Sugar-Rich Foods. J. Texture Stud. 1998, 29, 81–100. [Google Scholar] [CrossRef]
  7. Noren, N.E.; Scanlon, M.G.; Arntfield, S.D. Differentiating between tackiness and stickiness and their induction in foods. Trends Food Sci. Technol. 2019, 88, 290–301. [Google Scholar] [CrossRef]
  8. Sharma, F.; Sherman, P. Identificiation of stimuli controlling the sensory evaluation of viscosity: II oral methods. J. Texture Stud. 1973, 4, 111–115. [Google Scholar] [CrossRef]
Figure 1. Typical force–time curves of stickiness at different withdrawal speeds (adapted from [4]).
Proceedings 70 00102 g001
Figure 2. Typical force–distance curves depicting stickiness at different withdrawal speeds for a single-headed probe.
Proceedings 70 00102 g002
Figure 3. Force–distance curve for glucose syrup with images of the probe contact surface. The inset images with a broken border are golden syrup at its force–distance peak.
Proceedings 70 00102 g003
Figure 4. Schematic view of the stickiness test of liquids. (a) Starting state and early stages of the pull—linear portion of the curve; (b) narrowing liquid column—loss of adhesion; (c) adhesive detachment; (d) narrowing liquid column—necking; (e) cohesive failure.
Proceedings 70 00102 g004
Figure 5. Force–distance curves for glucose syrup with constant area (varying perimeter) probes. The probe withdrawal speed is 0.01 mm·s−1.
Proceedings 70 00102 g005
Figure 6. Influence of probe withdrawal velocity on the parameters of the zero-perimeter virtual probe curves. (a) Area under the curve; (b) peak force; (c) initial gradient. ○ Golden syrup; ◇ black treacle; ▲ honey.
Proceedings 70 00102 g006
Table 1. Dimensions of the multiheaded probes.
Number of HeadsDiameter of Heads
(mm)
Total Perimeter
(mm)
Total Contact Area
(mm2)
135.0110962
320.0190962
614.0269962
Publisher’s Note: MDPI stays neutral with regard to jurisdictional claims in published maps and institutional affiliations.

