Proceeding Paper

Effect of the Variation in Humidity of the Medium on the GPR Radar Response †

by
Aye Mint Mohamed Mostapha
1,*,
Gamil Alsharahi
2,
Ahmed Faize
2 and
Abdellah Driouach
1
1
Faculty of Sciences, Abdelmalek Essaâdi University, Tetouan 93000, Morocco
2
Faculty Polydisiplinarly, Mohammed 1st University, Nador 60000, Morocco
*
Author to whom correspondence should be addressed.
Presented at the 14th International Conference on Interdisciplinarity in Engineering—INTER-ENG 2020, Târgu Mureș, Romania, 8–9 October 2020.
Proceedings 2020, 63(1), 37; https://doi.org/10.3390/proceedings2020063037
Published: 18 December 2020

Abstract

:
This work presents research on the influence of the variation in humidity of the medium on the Ground-penetrating radar GPR response. During this research, we used a GPR SIR 3000 system coupled with a 400 MHz frequency antenna, and GprMax and Reflexw software, which are based on the numerical method known as finite difference in time domain (FDTD). The results obtained (experimental and by simulation) have shown that the reflection force and the penetration depth of GPR waves are strongly related to the physical properties of the objects and the medium inspected. The increase in the conductivity of the inspected medium causes areduction inthe depth of the GPR waves, which causes the non-detection of objects.

1. Introduction

Ground penetrating radar is a non-destructive technique used to assess the location and depth of underground targets [1,2]. It is based on the emission, by an antenna coupled to the ground, of short electromagnetic pulses, of harmonic waves confined to a certain frequency band. Once the transmitted signal is returned, by deep-buried objects, it will be picked up by the GPR receiving antenna and will be transformed into a response signal, which is in the form of an image called a radargram. This image radargram will be processed with specialized software to collect information from the subsoil [3]. Its wide range of sampling frequency combined with its non-destructive nature and its ease of implementation have enabled it to find a large number of applications [4] such as archeology, the construction of buildings, the detection of antipersonnel mines, shallow geological research or the criminal science sector, where it can be used can find corpses or buried weapons, etc. [5,6,7,8]. GPR provides the precise spatial location of targets from high-resolution images over short periods. These images can be affected by several factors such as the nature of the ground, internal and external noise, etc. The interest of this work focuses on the influence of the variation insoil humidity on the quality of the radargram.

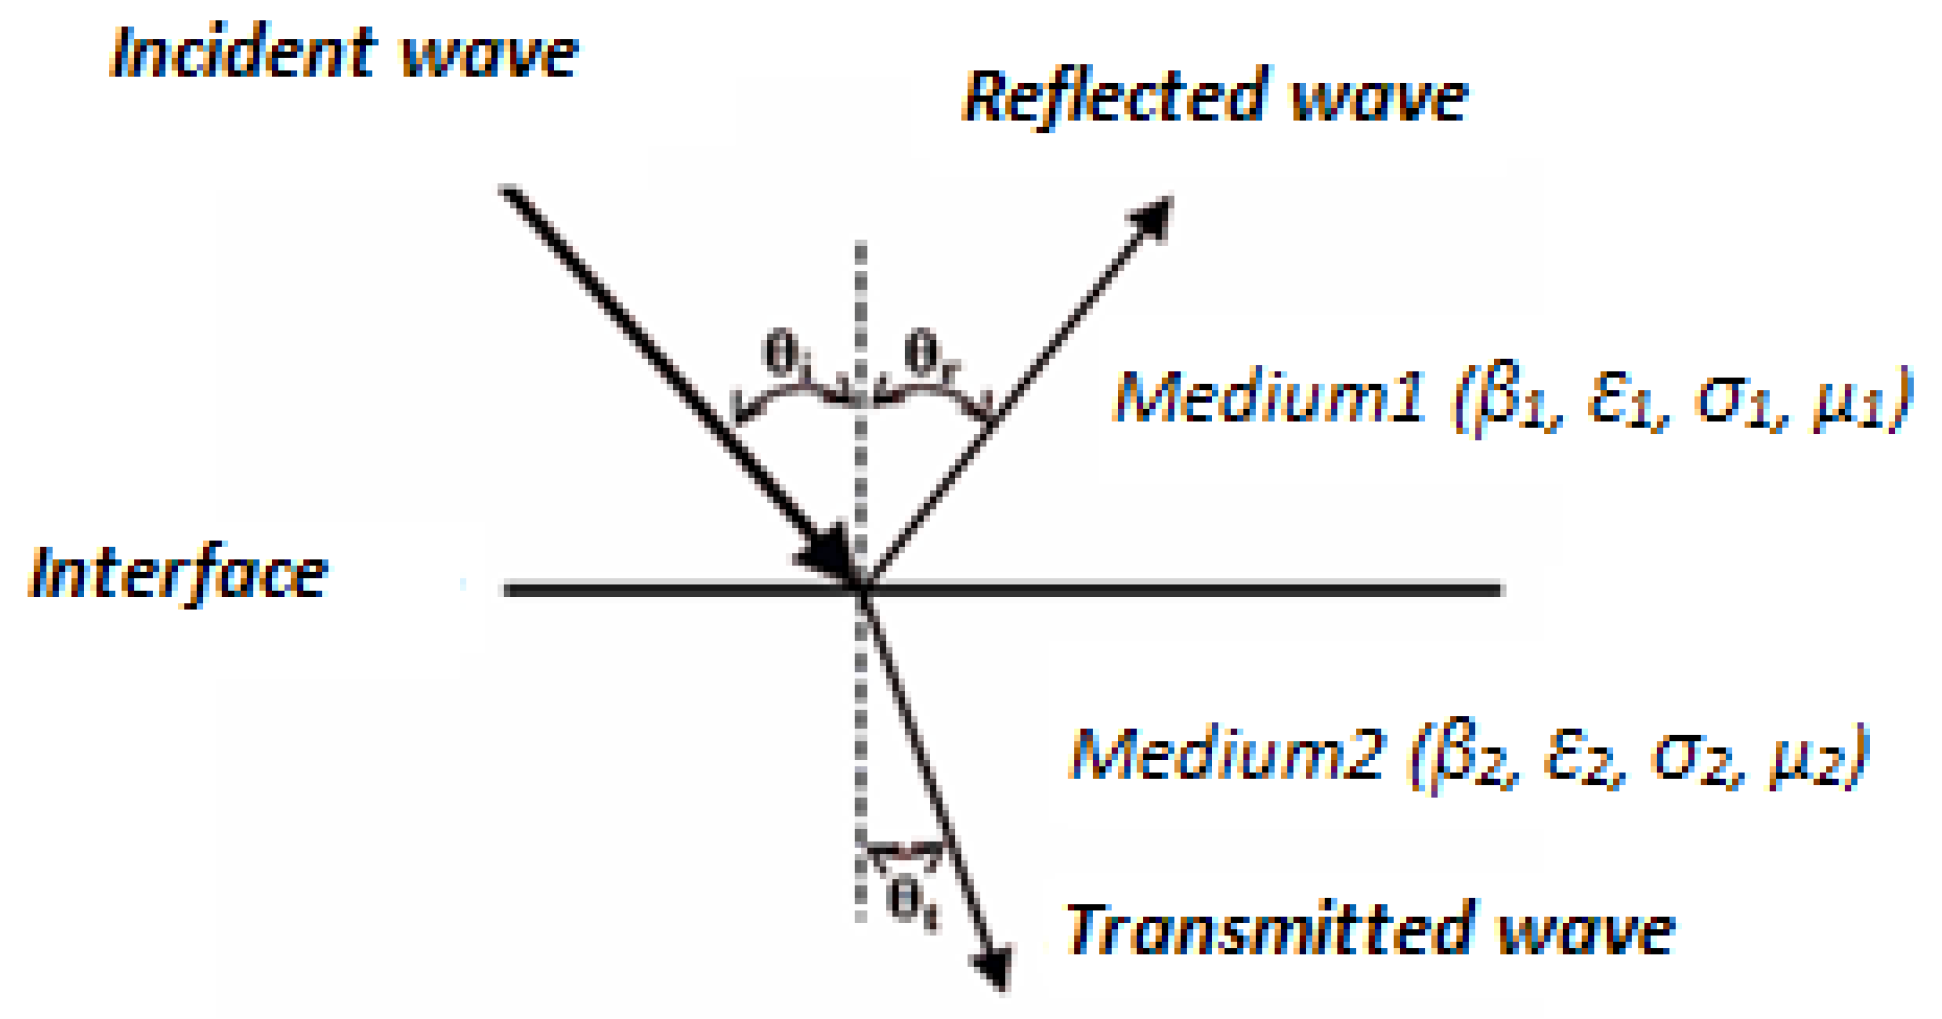
2. Snell–Descartes Laws

When an electromagnetic wave strikes the interface between two media with different dielectric properties, part of its energy is reflected and the rest is transmitted to the lower medium (Figure 1). The incident, reflected and transmitted wave directions are linked together by Snell’s law [9,10,11].
θi = θr (Snell’s law of reflection)
β1 sin θi = β2 sin θt
β1: medium1 wave number; β2: medium2 wave number.
If several interfaces are present, this rule must be applied to each limit and the wavefront or rays must bend or change direction at each limit. If the speed or the materials vary continuously, this relationship still applies. In GPR, medium 1 can easily be considered as an atmospheric environment and medium 2 considered as the soil or material to be probed [12,13].

3. Methodology

In this work, we have used a GPR SIR3000, Gprmax and Refexw software.
  • GPR SIR3000
The SIR3000 is a lightweight, portable, single-channel (Figure 2), ground-penetrating radar system that is ideal for a wide variety of applications.
  • Reflexw
This is a processing software program for GPR and seismic wave propagation based on the Finite-difference time-domain FDTD. Field data as well assynthetic data can be processed in two and three dimensions. In our case, we used the Reflexw 2D [14].
  • GprMax2d
GprMax is based on FDTD and is available free of charge for both academic and commercial use; it has been successfully employed in many situations. The tool can be downloaded from www.gprmax.org or by contacting the author [14].

4. Results and Discussion

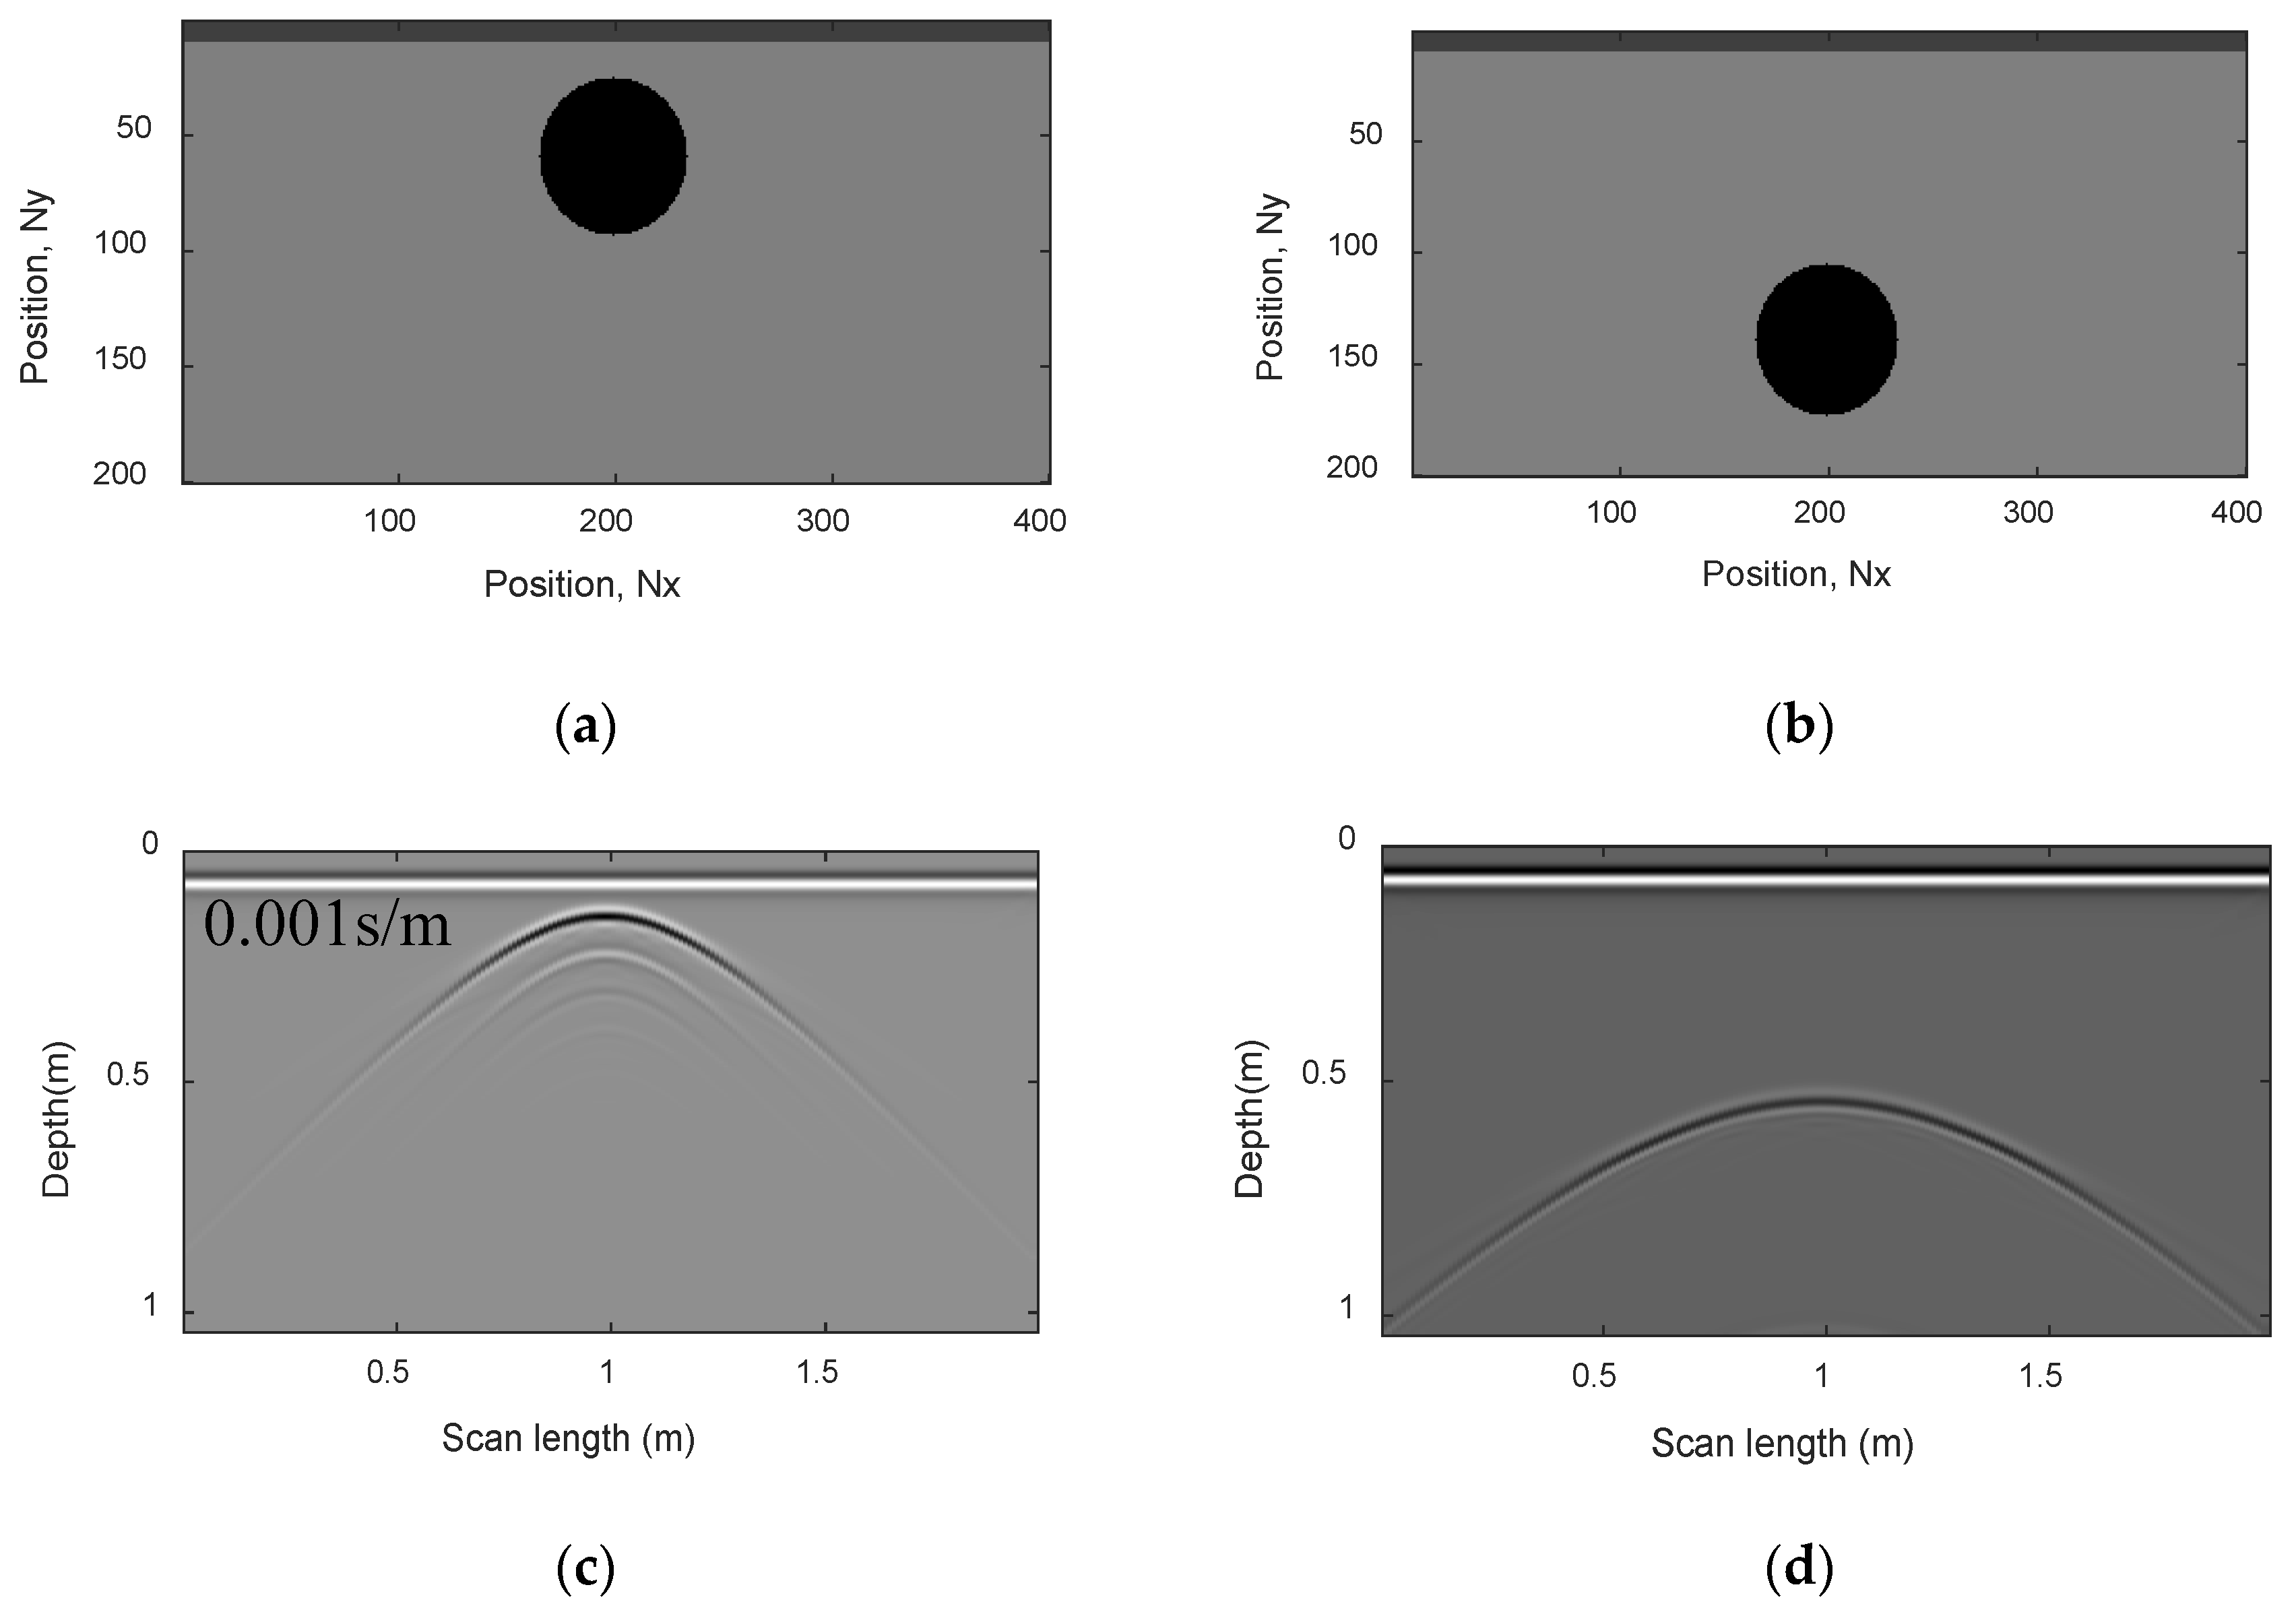
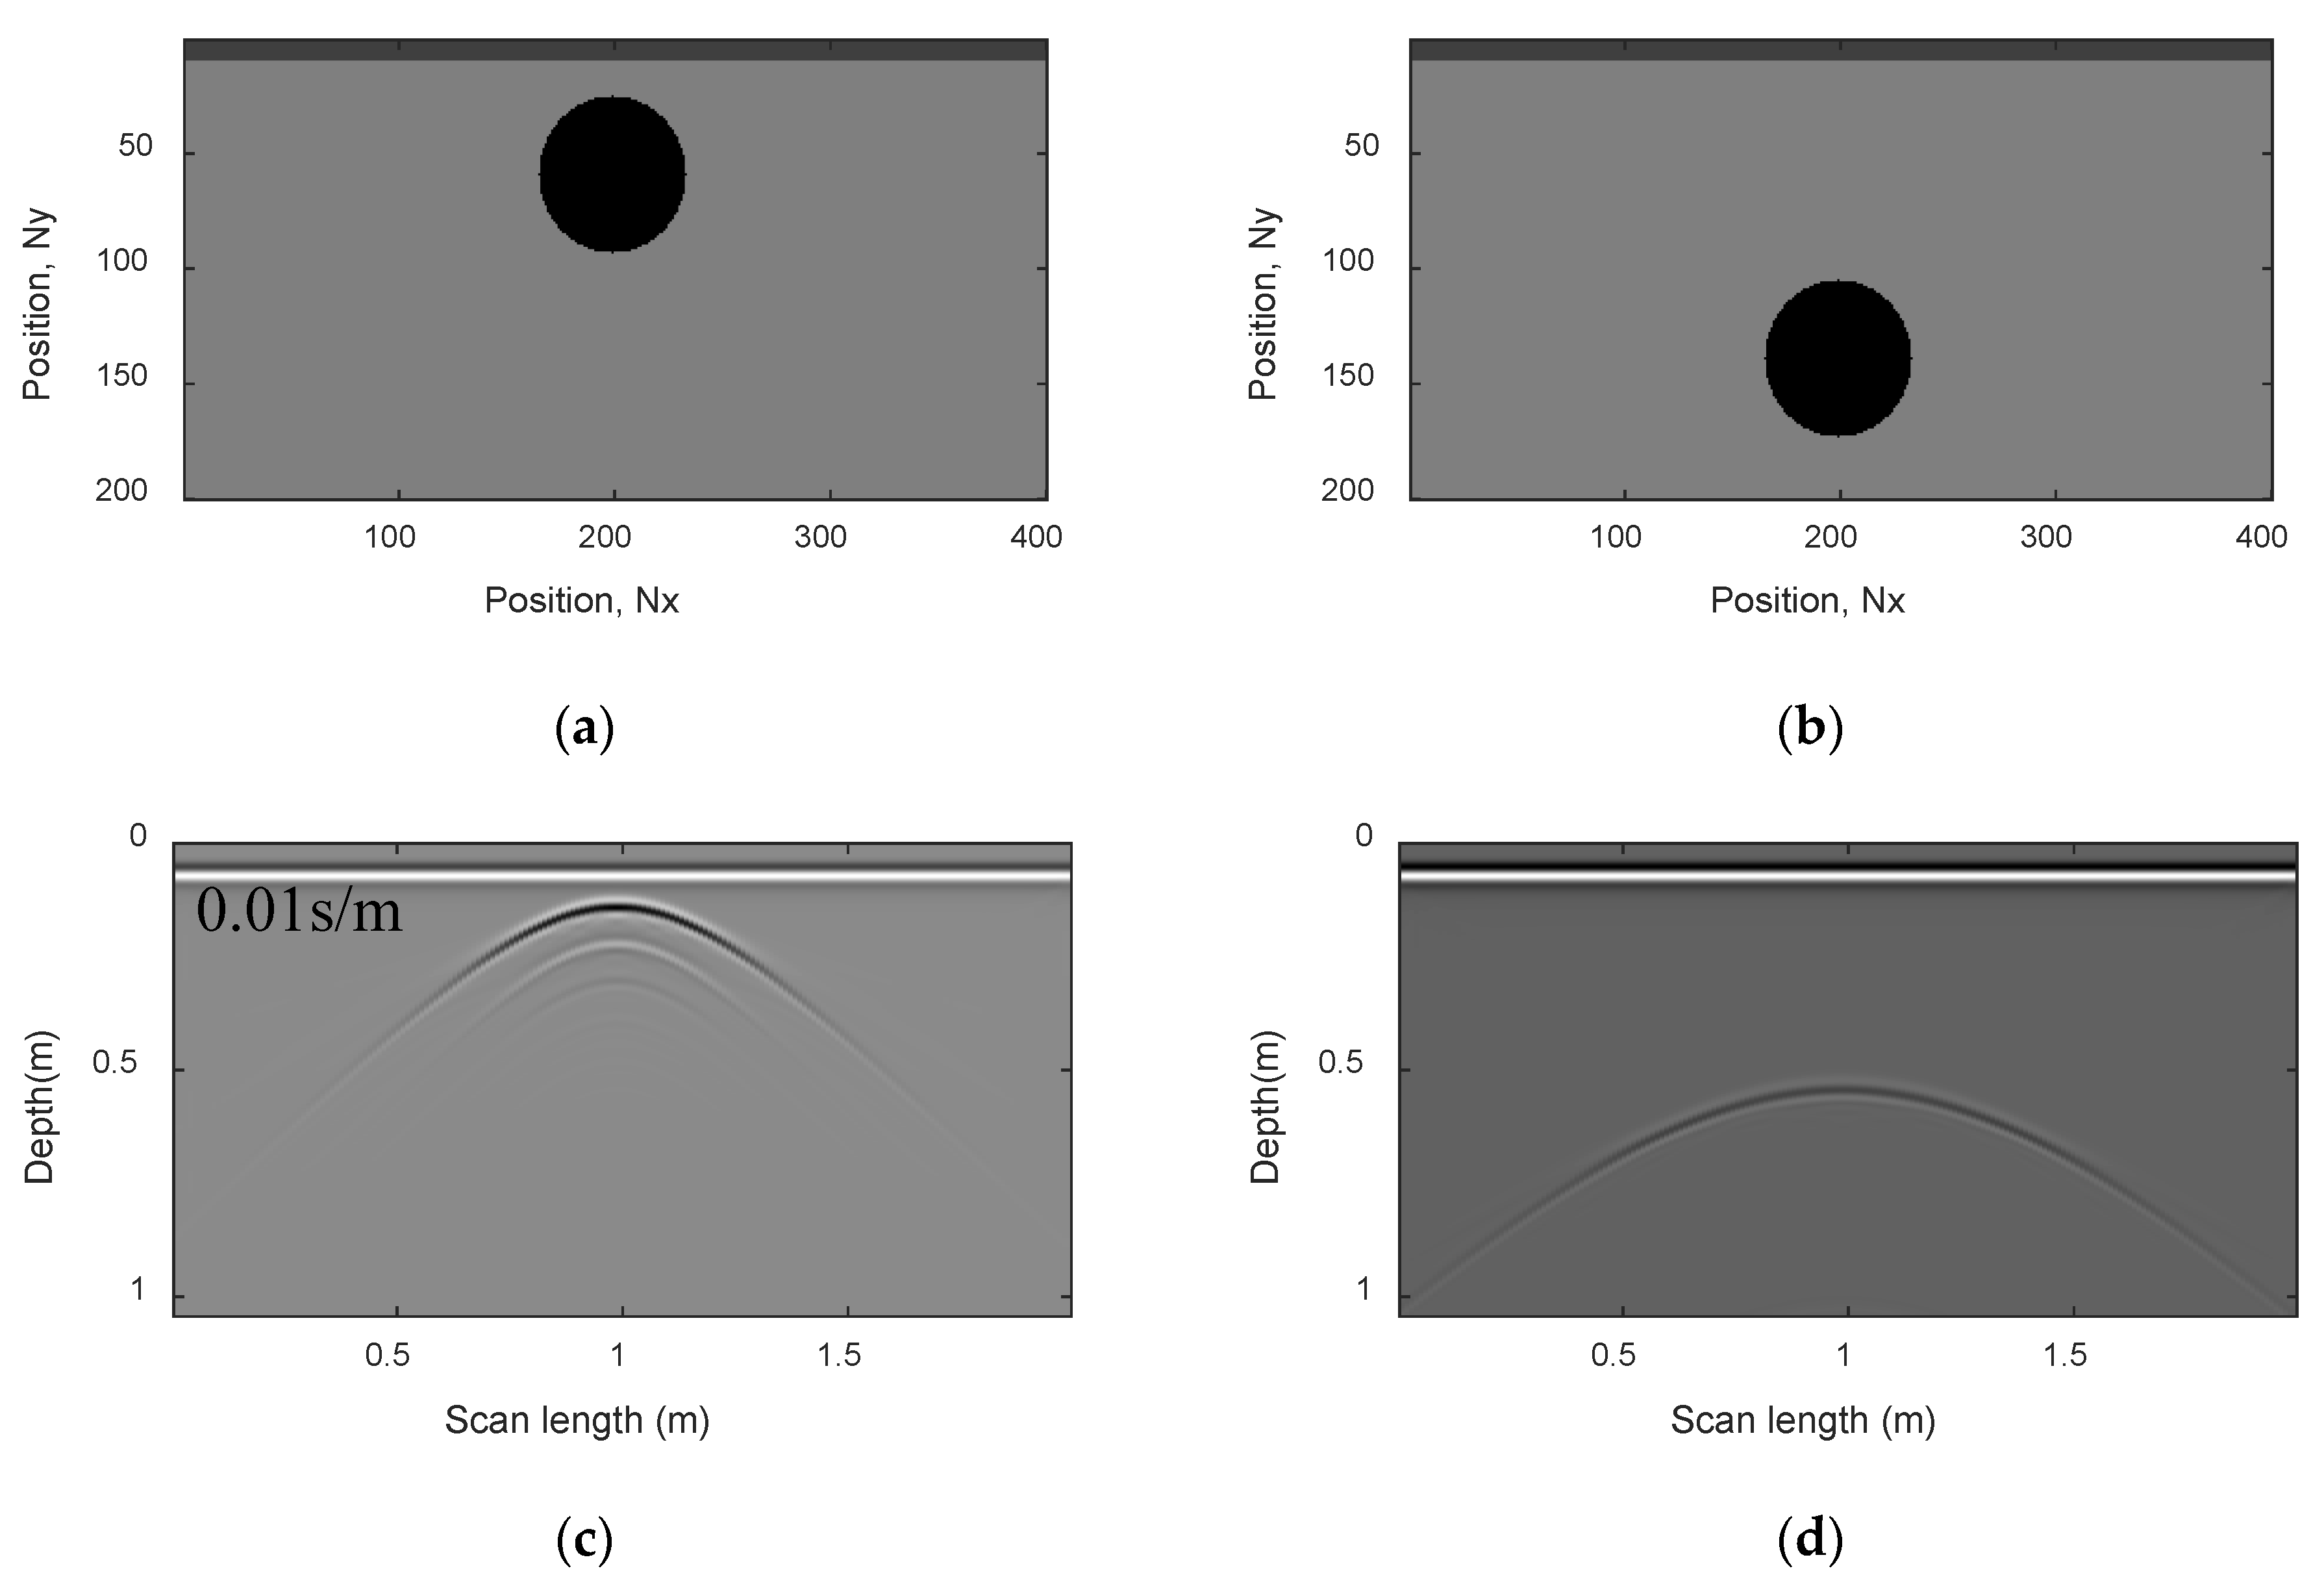
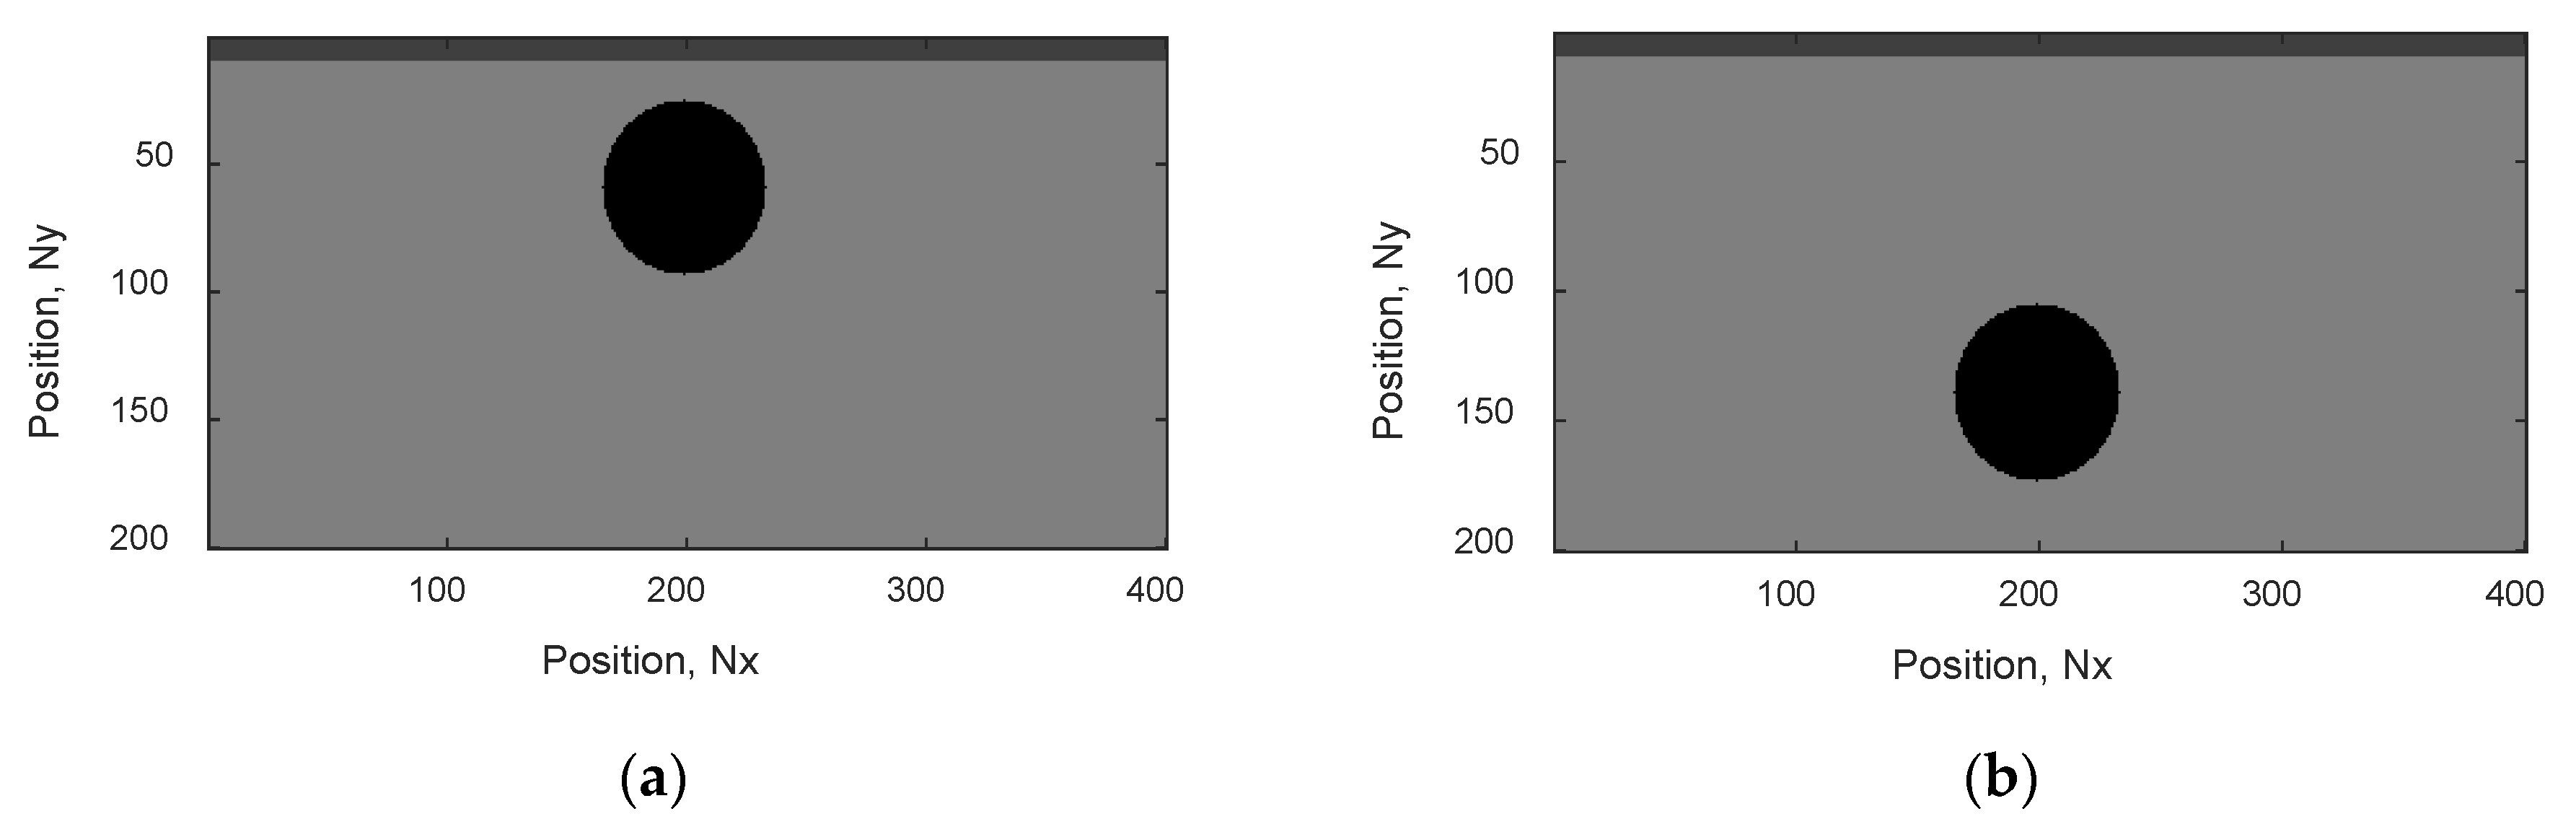
4.1. Simulation Results

The purpose of this paragraph is to show the influence of the humidity of the mediumon the GPRoperation. We simulated the detection of a conductive object (circular) buried in a medium of wet sand by varying each time the conductivity of the medium and the depth of the object.
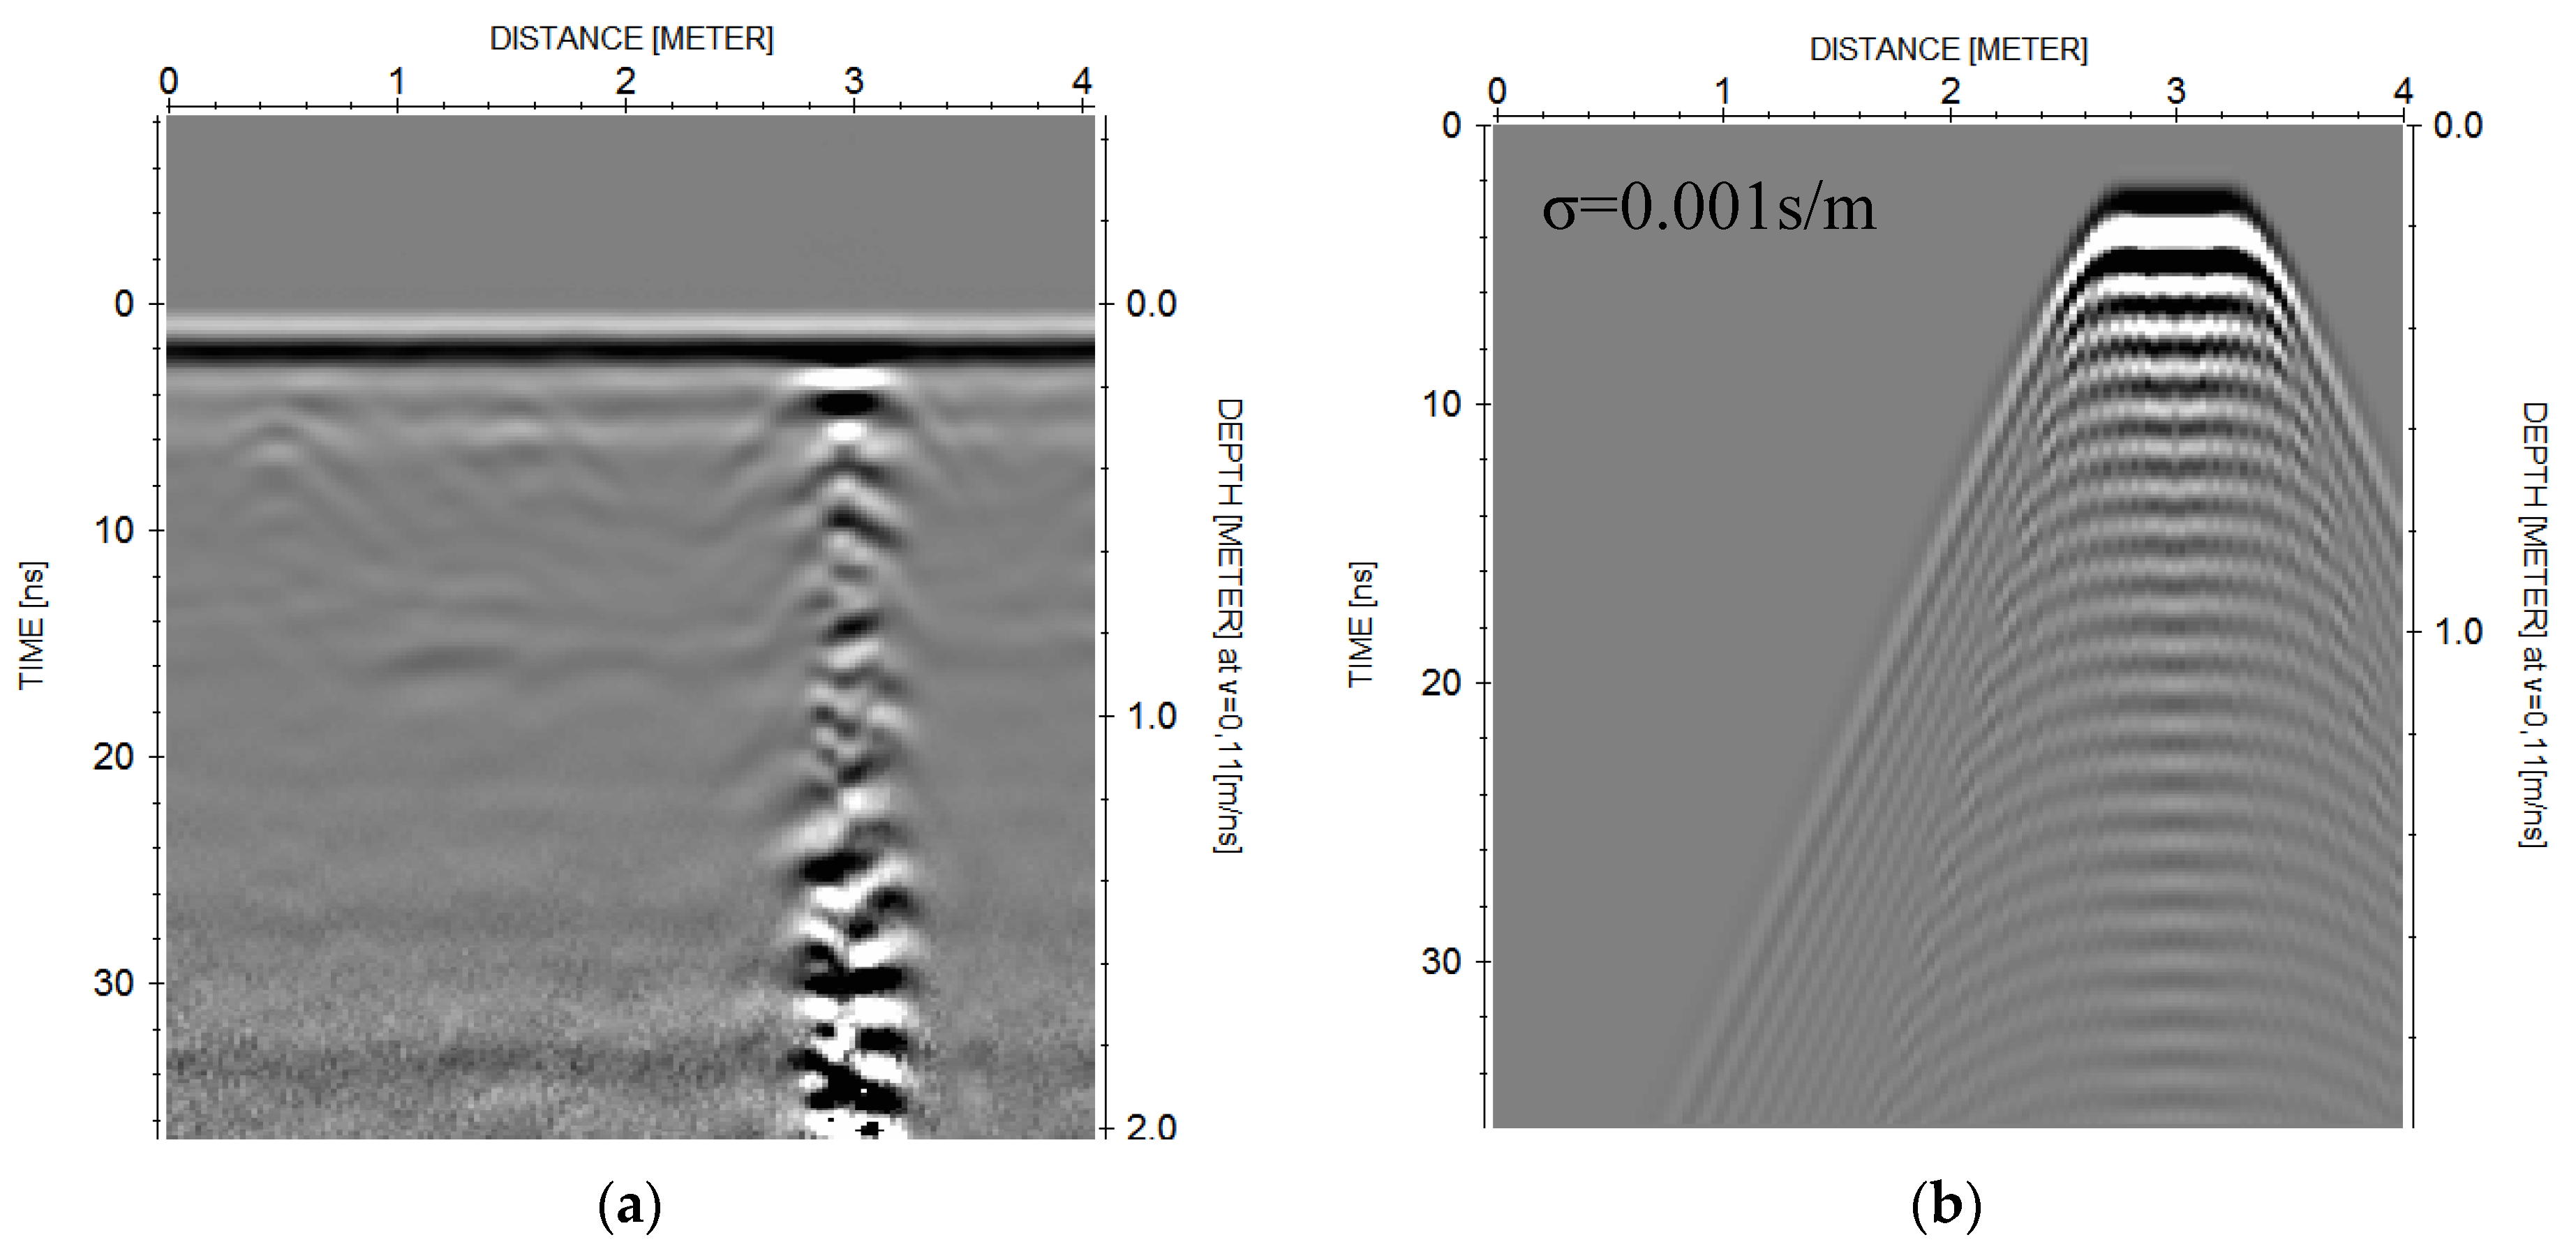
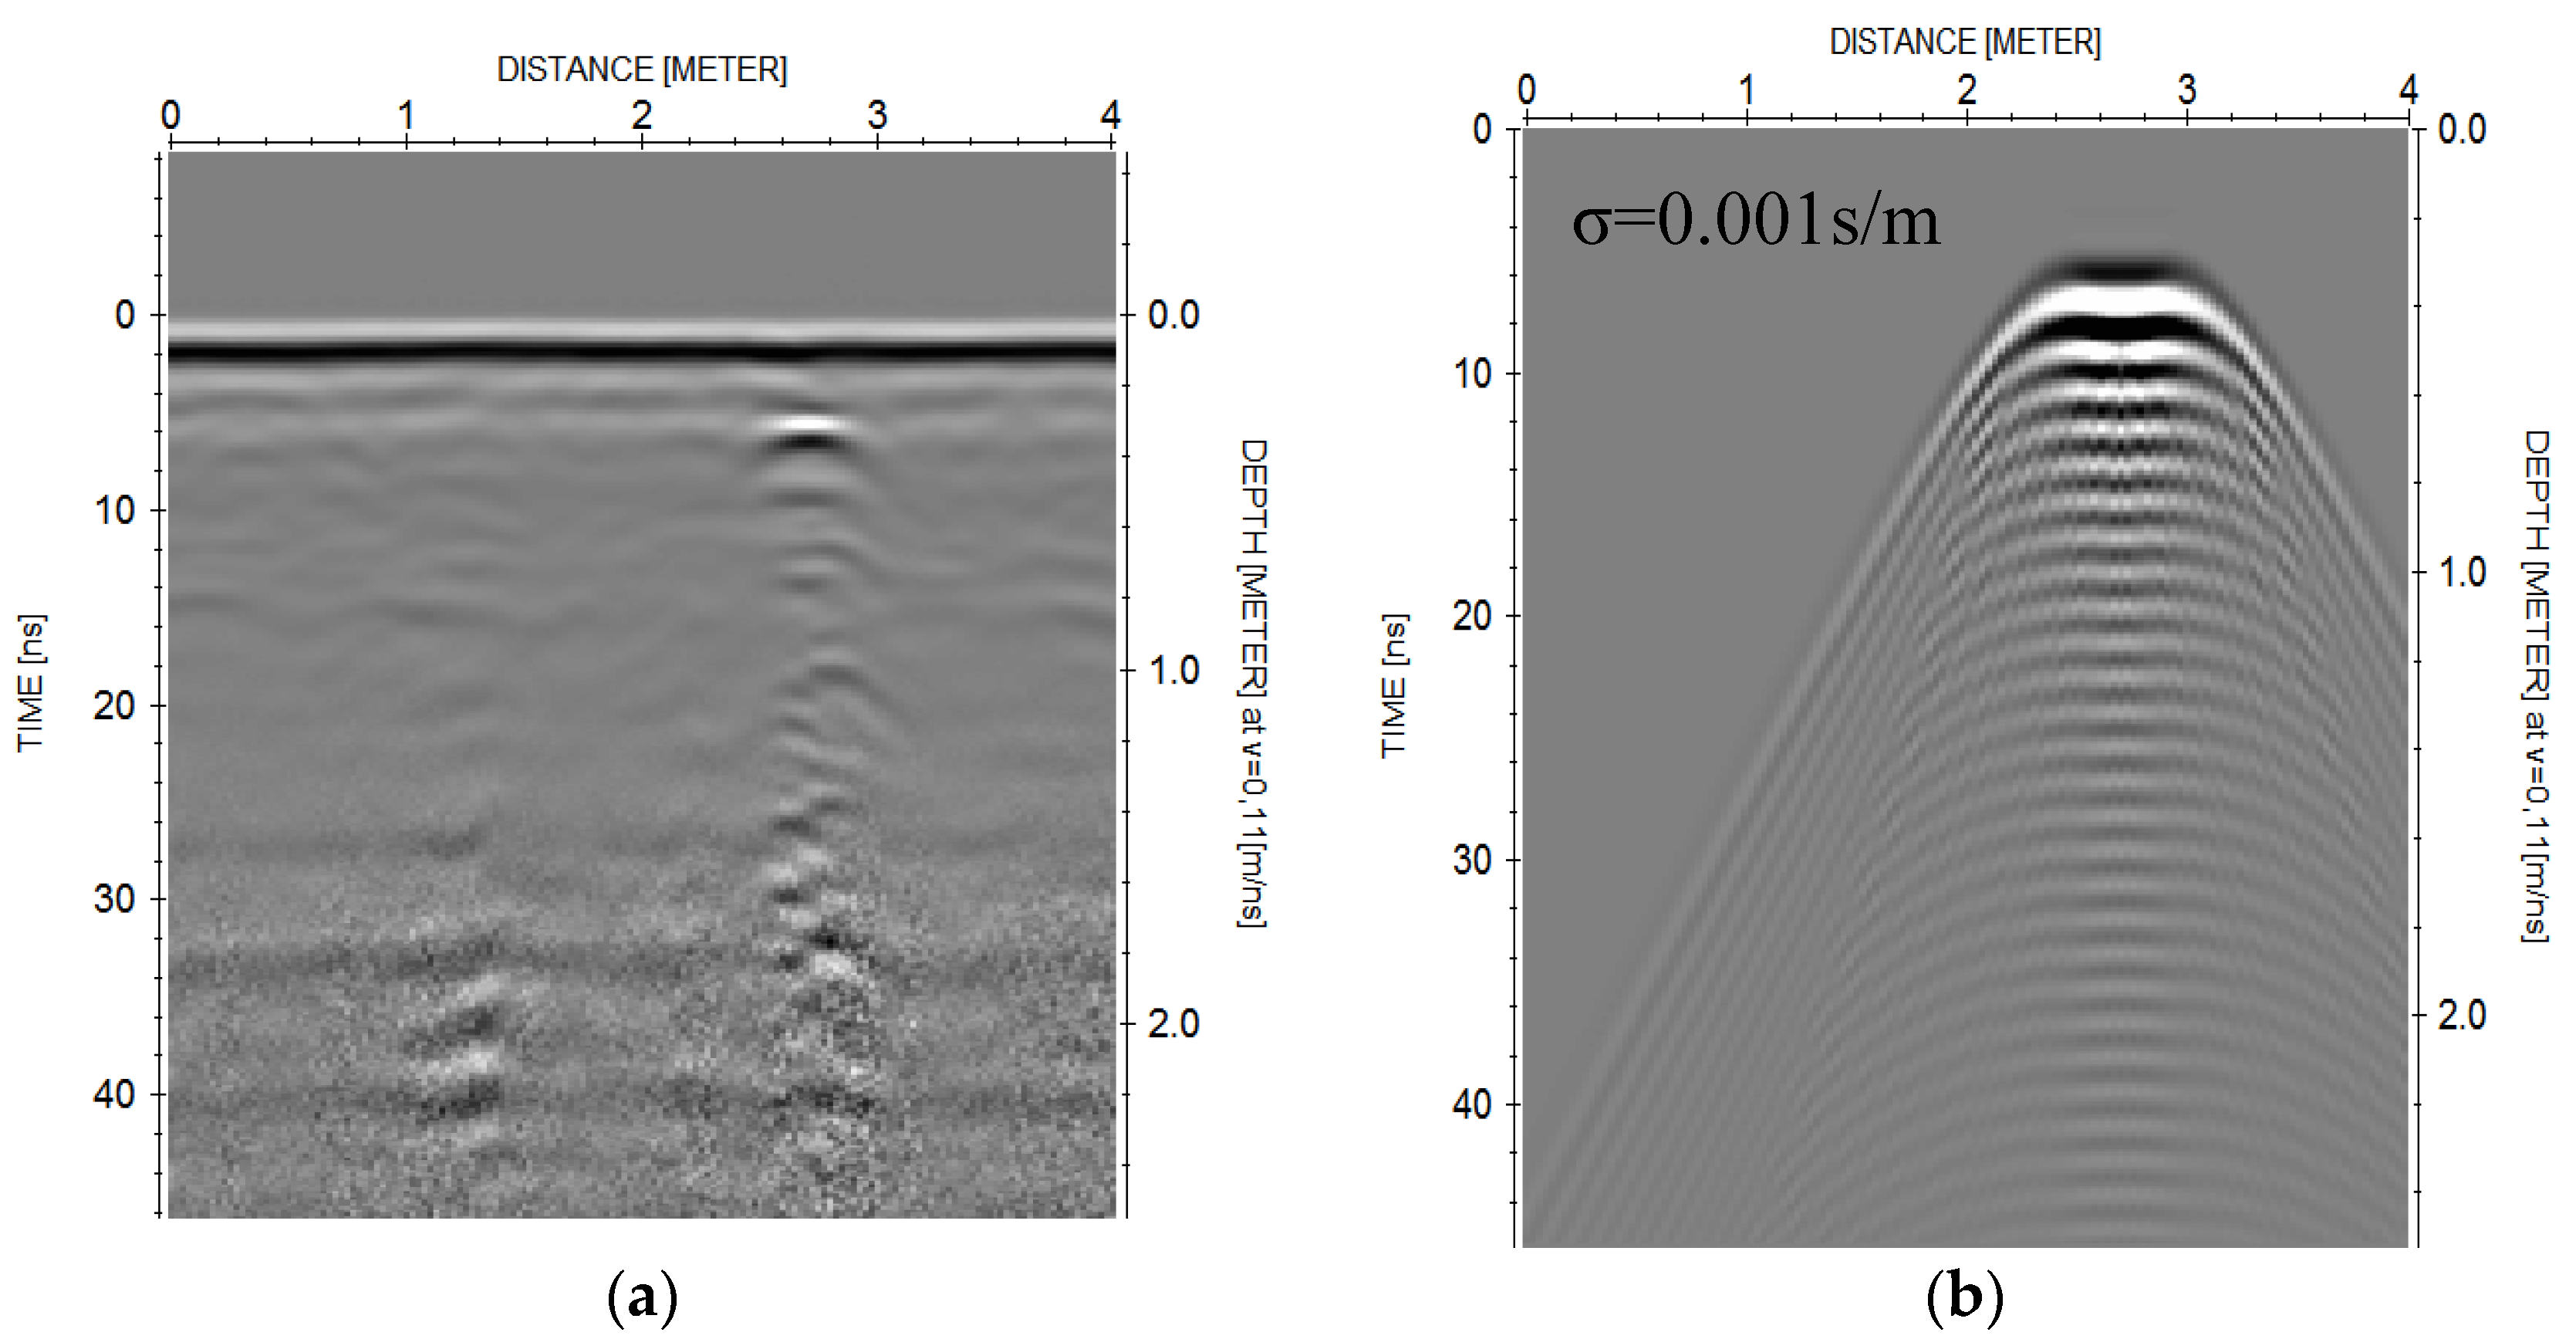
  • With a conductivity of 0.001 s/m, the targets are easily detectable by the GPR in the two depths chosen for this study: 0.3 and 0.7 m.
  • We also note that with a conductivity of 0.01 s/m, the GPR detects objects but with less visible hyperbolas than for the previous case.
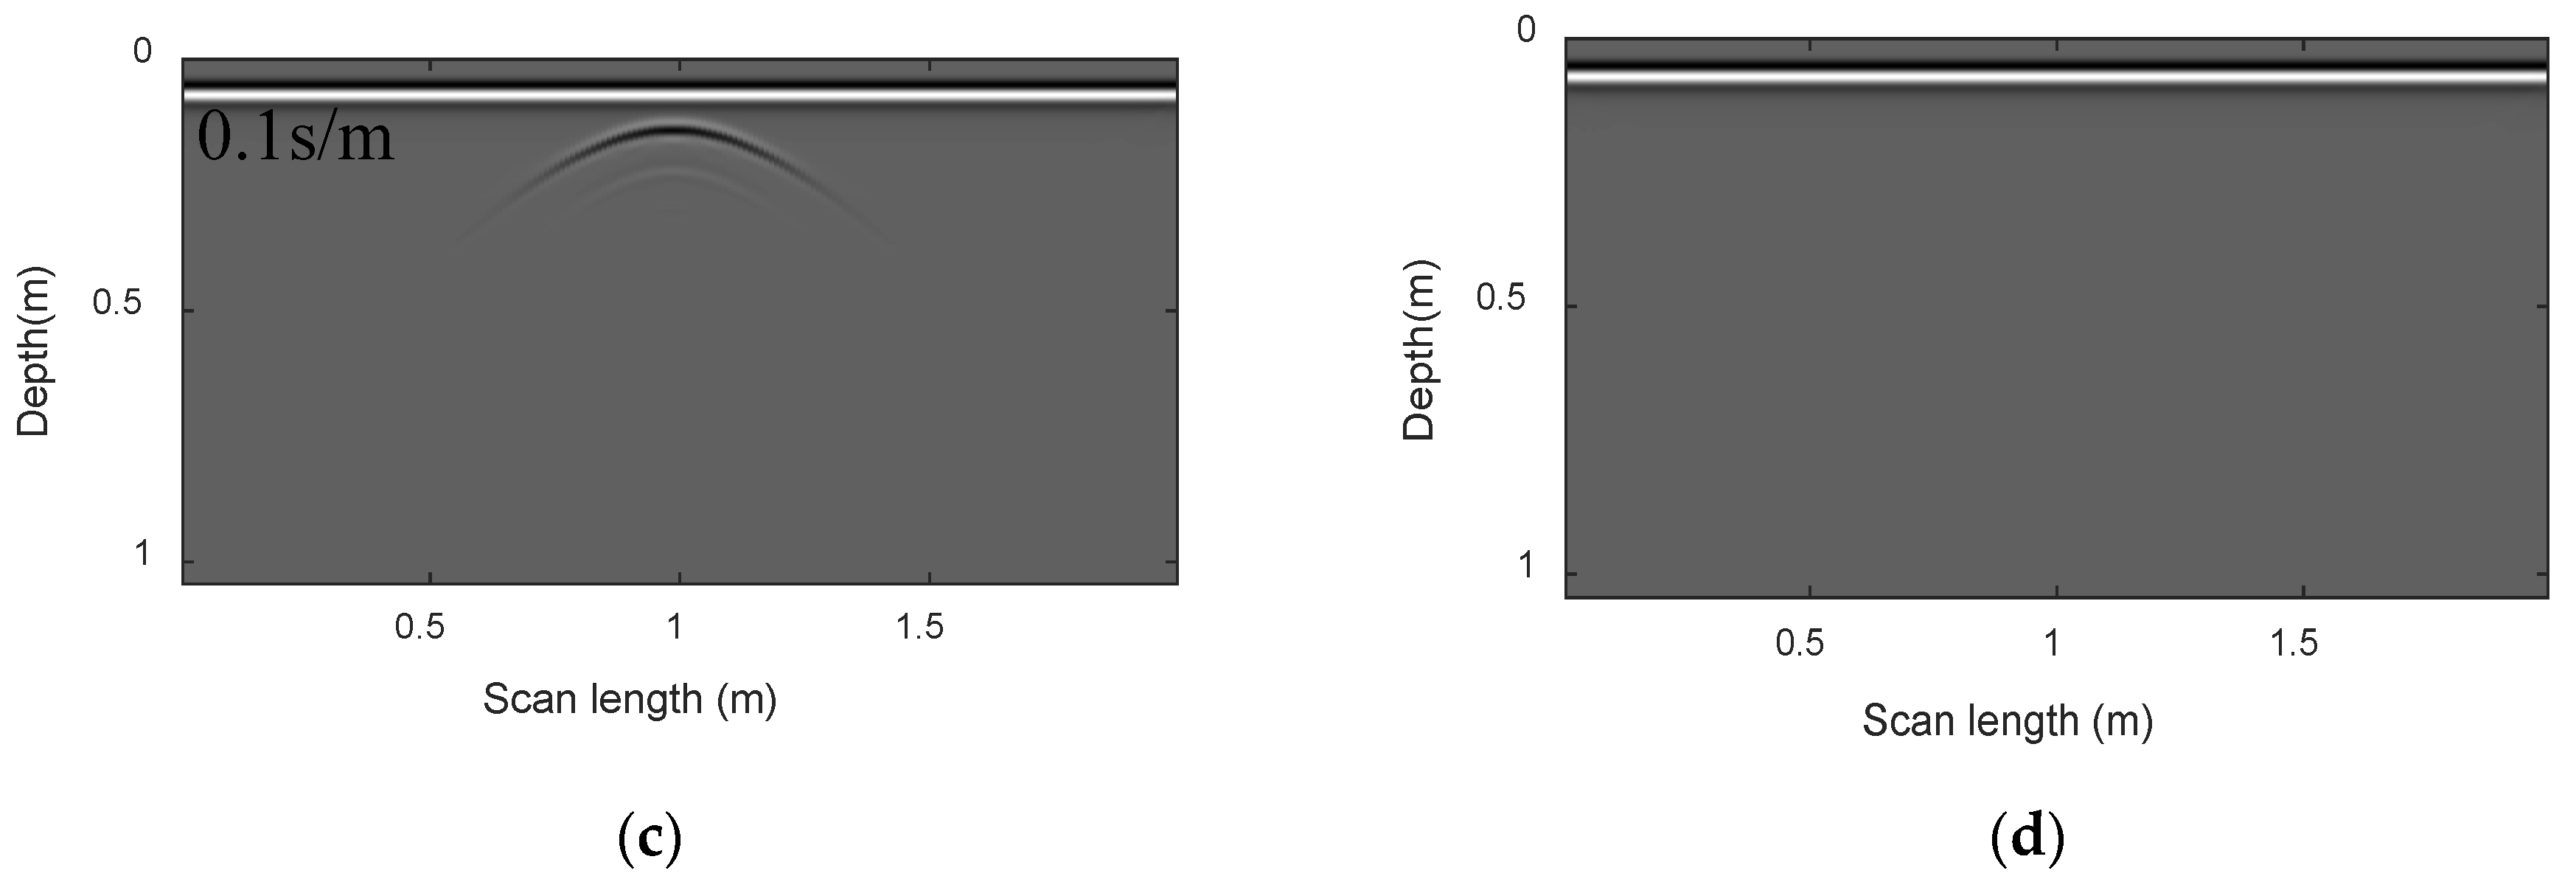
  • Meanwhile, for aconductivity of 0.1 s/m, and at a depth of 0.3, the presence of the object is indicated by an almost invisible hyperbola, and at a depth of 0.7 m, the object is invisible.
Following the results obtained, it is clear that the change in conductivity affects the quality of the GPR results.

4.1.1. Simulation of a Medium with a Conductivity of 0.001 s/m

Figure 3a,b present two models of two conductive objects buried in a medium of wet sand with a conductivity of 0.001 s/m at two different depths, 0.3 and 0.7 m, while Figure 3c,d present the radargrams obtained. We note the detection of two objects in this case; the presence of each object is indicated by the presence of a clearly visible hyperbola.

4.1.2. Simulation of a Medium with a Conductivity of 0.01 s/m

In this case, we simulated the detection of the same previous objects in the medium of wet sand with a conductivity of 0.01 s/m. On the obtained radargrams (Figure 4c,d), we note that the hyperbolas indicating the presence of objects are less clear than the previous case due to the increase in the conductivity of the medium.

4.1.3. Simulation of a Medium with a Conductivity of 0.1 s/m

In the case where the conductivity of the medium is 0.1 s/m, we note the detection of the object at a depth of 0.3 m, with a hyperbola that is almost invisible, while at a depth of 0.7 m, the object is invisible due to the increased conductivity of the medium and the depth of the target (Figure 5c,d).

4.2. Experimental Results (by GPR Radar)

This section presents experiments carried out on the beach in the city of Martil (located 12 km from Tétouan), in order to detect buried objects of different types using our GPR radar system (model SIR3000), equipped with an antenna of 400 MHz. For this experimental study, we used:
  • A conductive object,
  • A container (empty and filled with sea water) and
  • A rocky object.
The results obtained experimentally by the GPR were processed by the Reflexw software; with this same software, and using the same objects mentioned above, we carried out simulations of the GPR measurements and we found good agreement between them.

4.2.1. Conductive Object

For the detection of the buried conductive object (Figure 6), we chose two depths: 0.3 and 0.5 m:
  • Depth 0.3 m
Figure 7a shows the radargram obtained at this depth; we can see the presence of the hyperbola indicating the object in question. It is clearly visible, due to strong reflections by the conductive object. Figure 7b shows the result of the same object and under the same conditions as those of the experiment.
  • Depth of 0.5 m
At a depth of 0.5 m, we noticed that the hyperbolas which represent the conductive object seem less visible than for the previous case (depth of 0.3 m), due to the increase in depth, which decreases the intensity wave reflection. We also observed this difference in the results obtained by simulation, shown in Figure 8b.

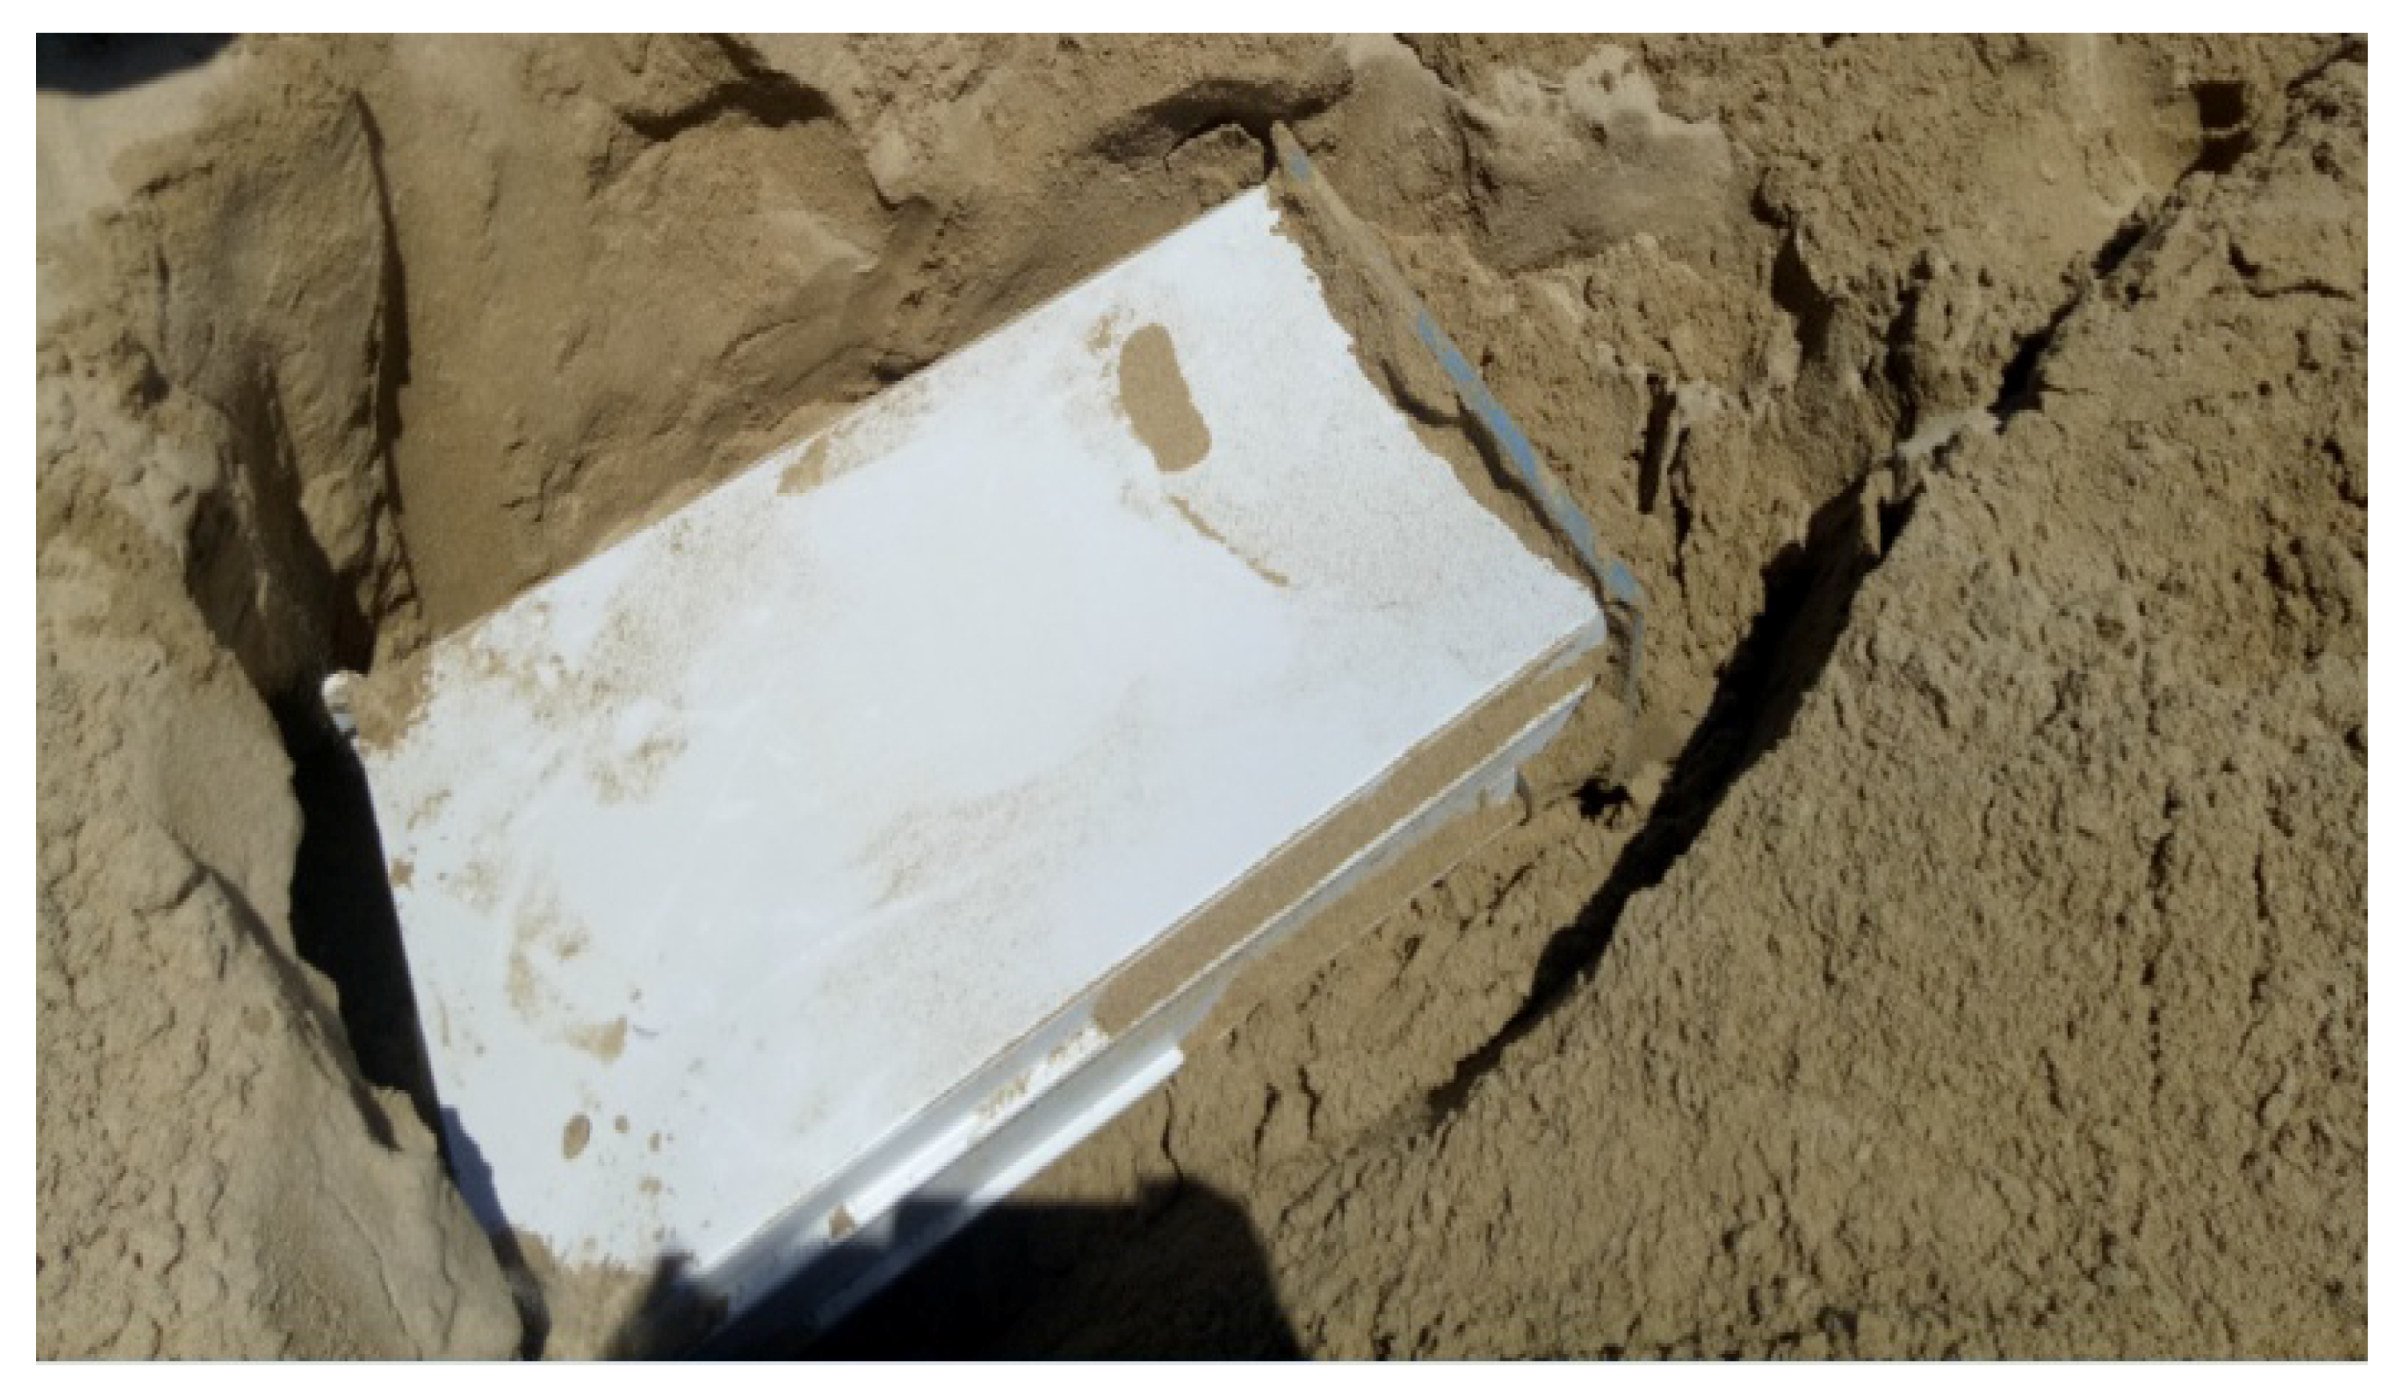
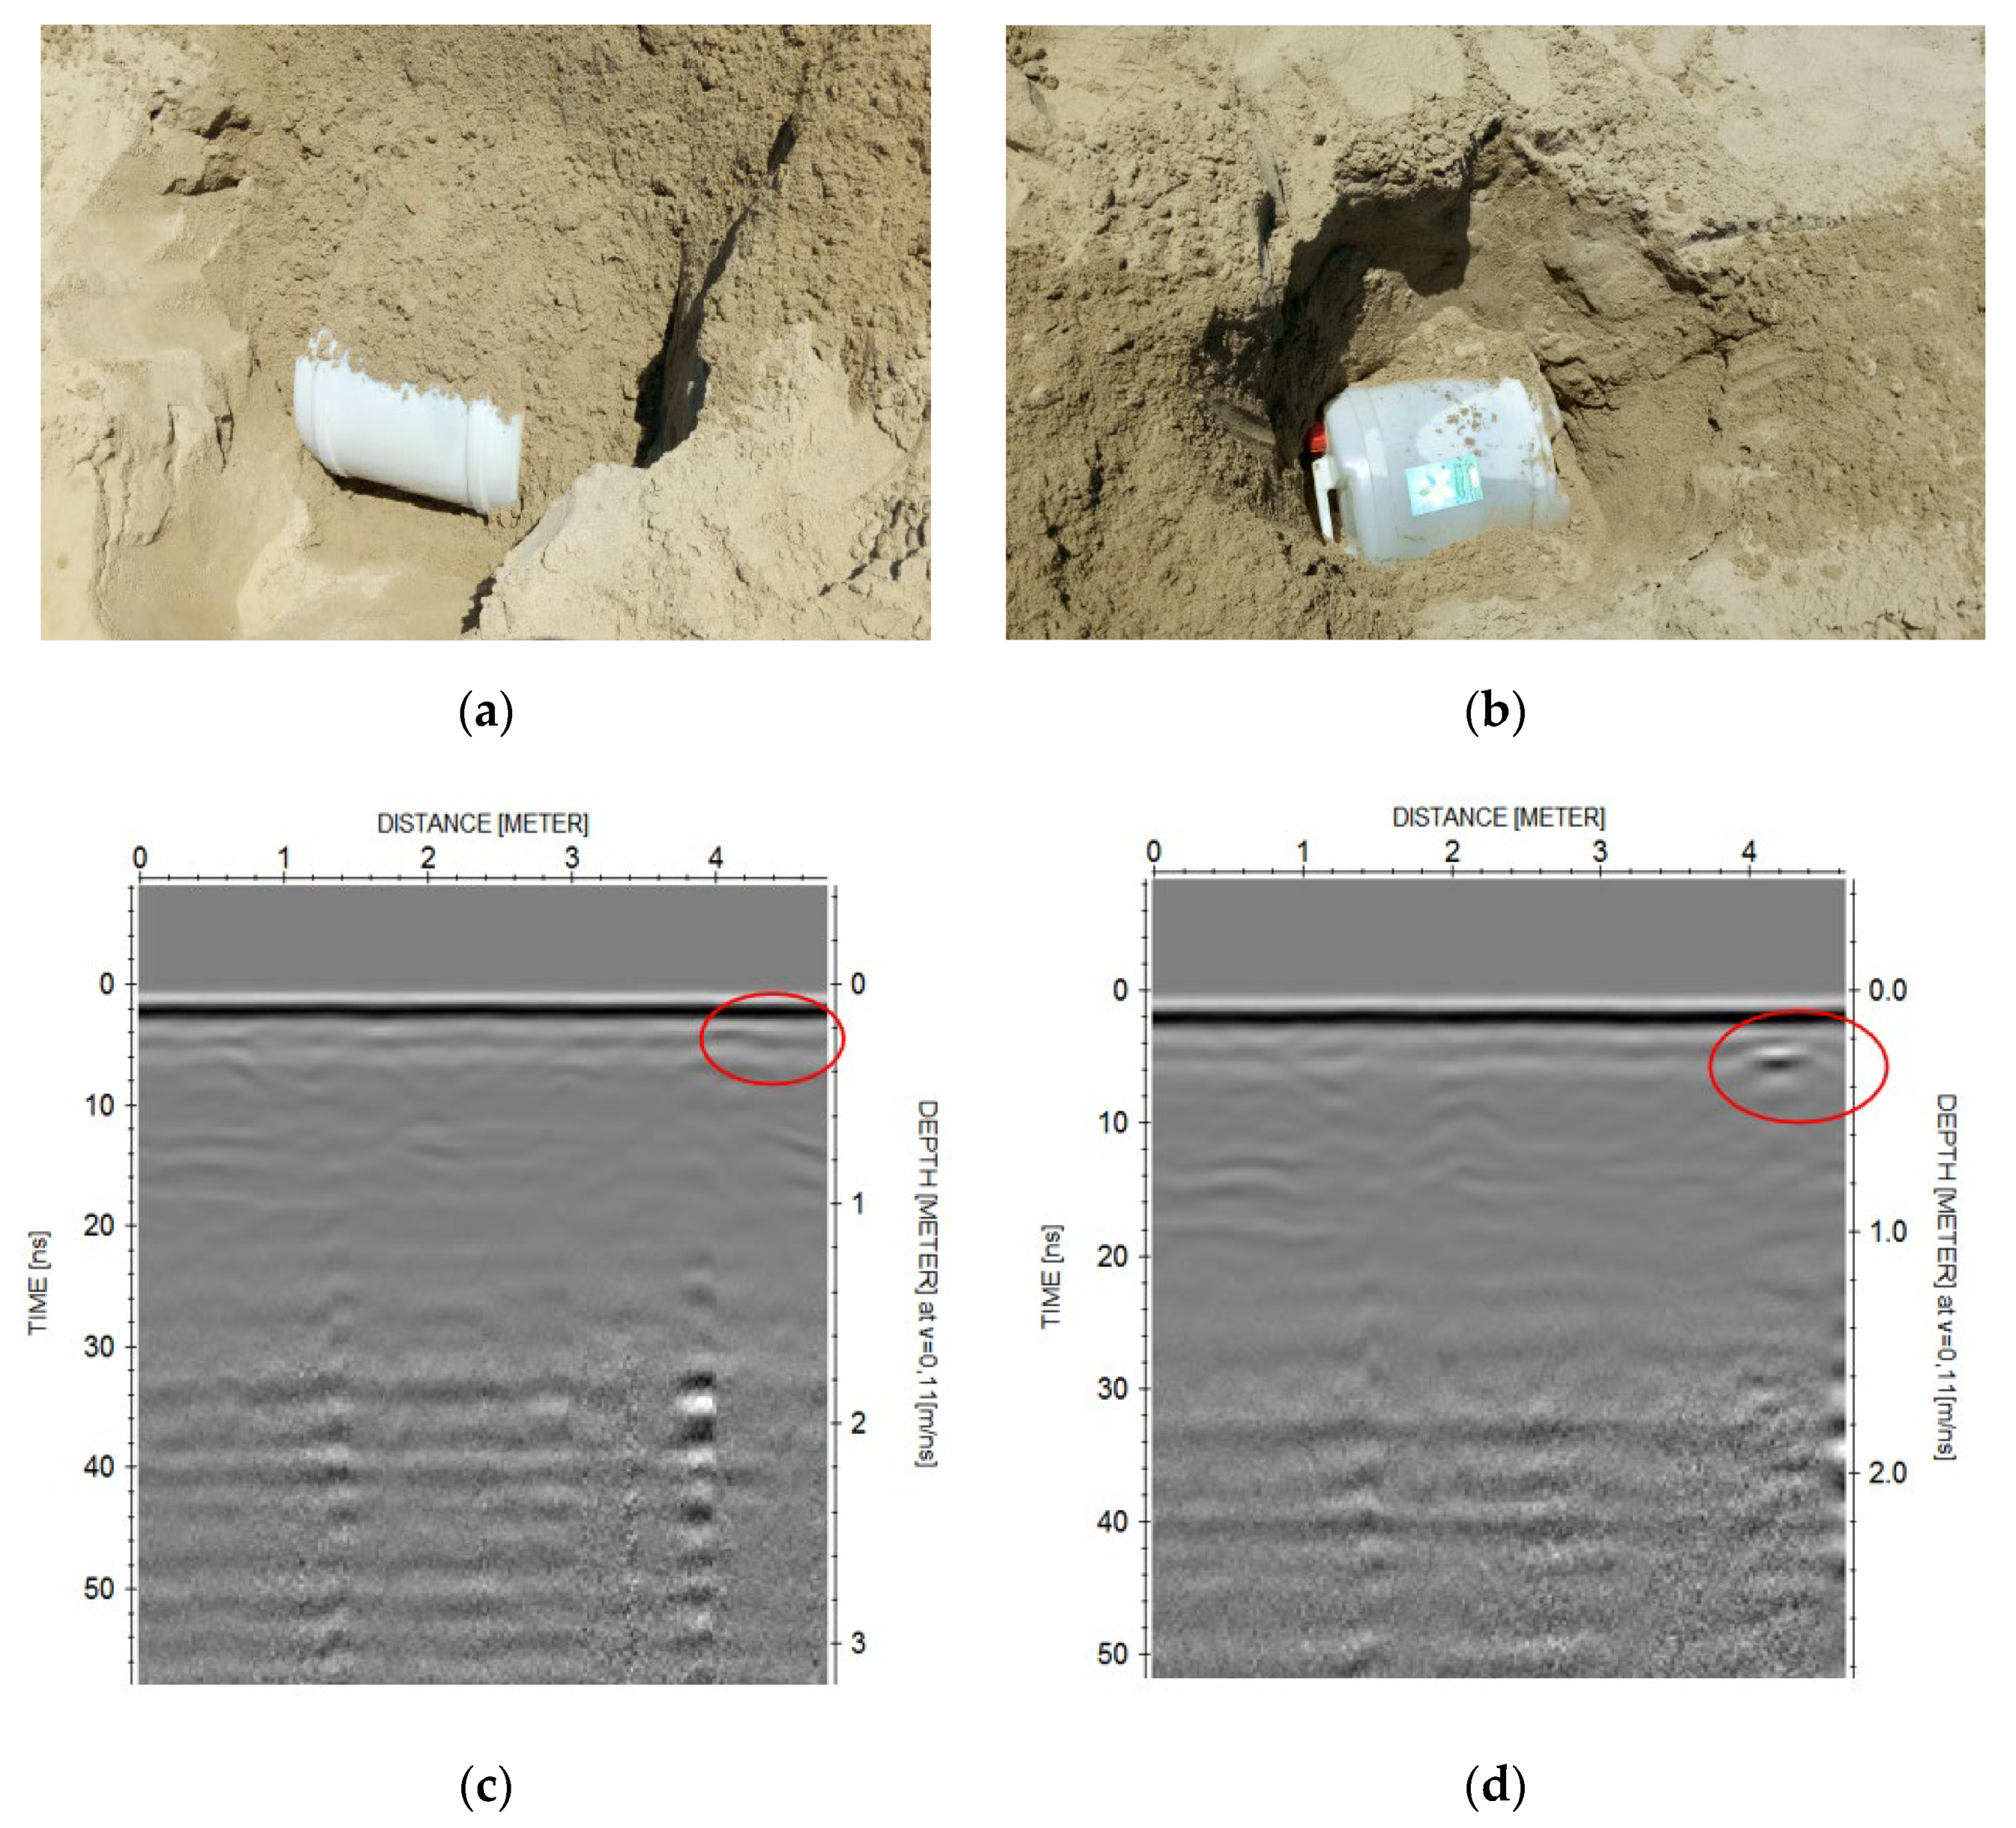
4.2.2. Use of Dielectric Objects: A Plastic Container (Empty Then Filled with Seawater)

During this experiment, we proceeded as follows:
  • First, we tested the GPR with an empty underground container (Figure 9);
  • Then, in a second step, we used the same container but this time the container was filled with sea water (see Figure 9b).
We found that the GPR could not detect the presence of the empty container (Figure 9c). On the other hand, when the container was filled with sea water, which has a high conductivity, the visibility of the object was better (Figure 9d). This is due to the significant difference in permittivity between the water inside the container and the medium, which created strong signal reflection.

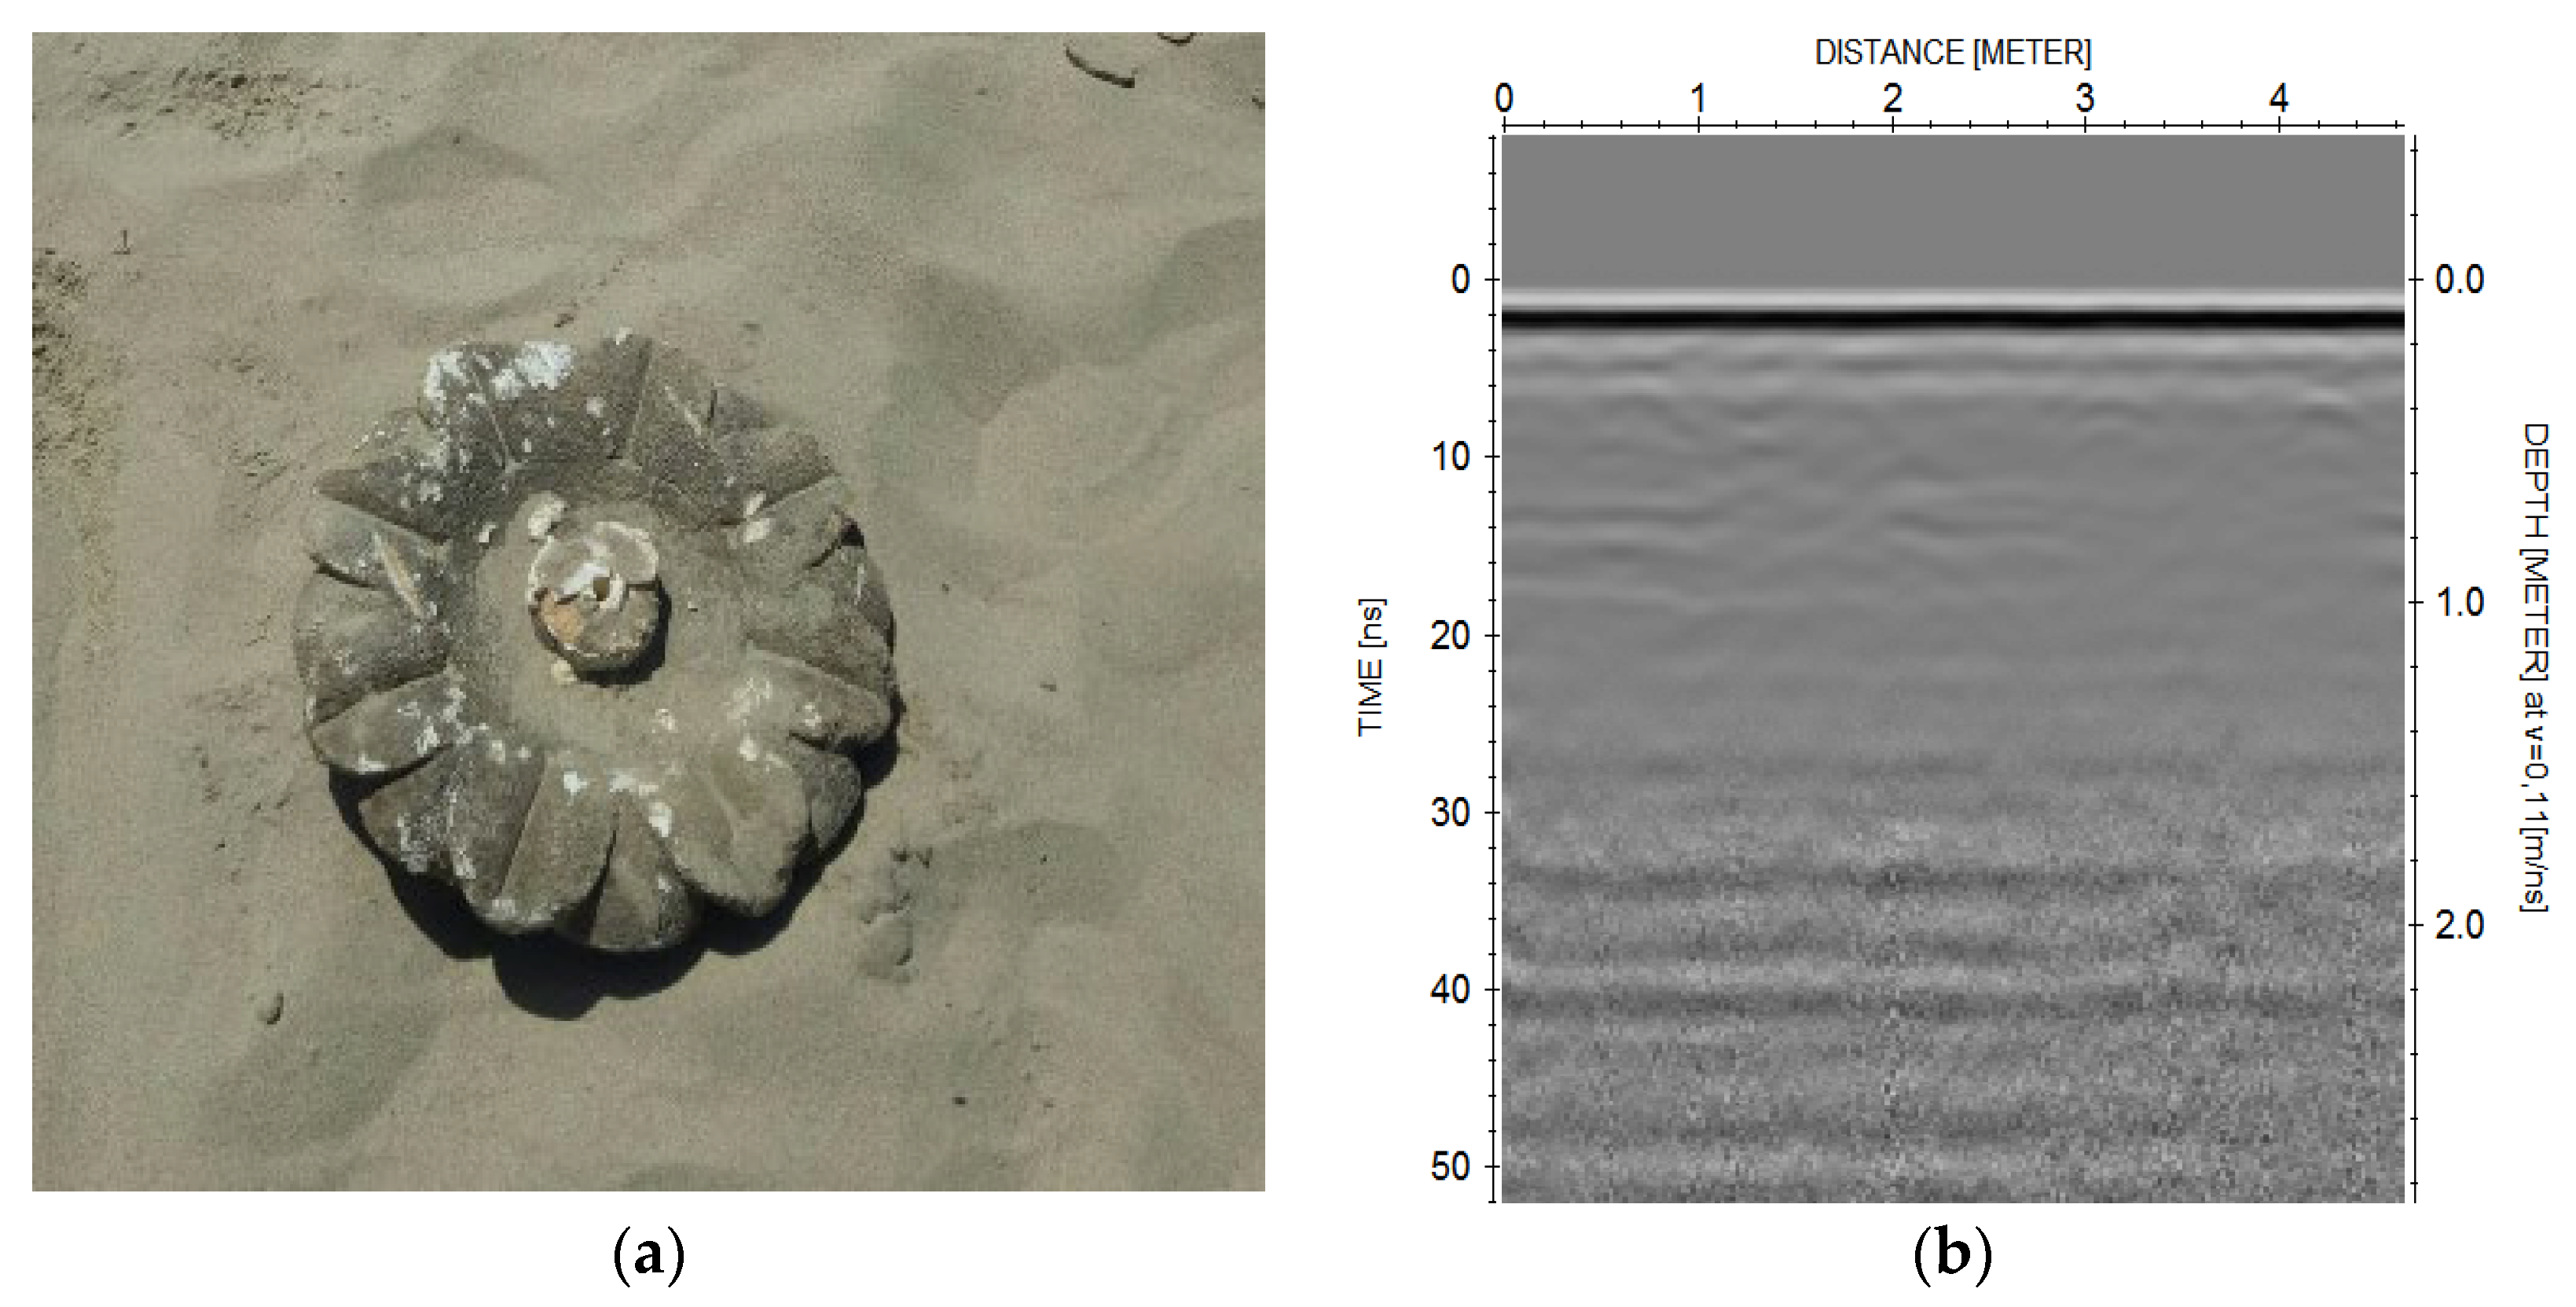
4.2.3. Use of a Rocky Object

In this case, we buried a rocky object at a depth of 0.2 m (Figure 10a); despite this small depth, the GPR was unable to detect the object, which was due to the humidity of the environment and the poor reflection of the rocky object.

5. Conclusions

The study presented in this work allowed us to gaina global idea of the GPR response for targets with different physical properties and shapes, buried in a wet sand medium.
The results obtained showed that:
  • The conductive objects are easily detectable by GPR due to their high conductivities, which cause total reflection of the signal.
  • The higher the difference in permittivity between the object and the medium, the greater the reflection strength of the signal.
  • The humidity of the medium reducesthe penetration depth of GPR waves, which causes the non-detection of targets.

References

  1. Kanli, A.I.; Taller, G.; Nagy, P.; Tildy, P.; Pronay, Z.; Toros, E. GPR survey for reinforcement of historical heritage construction at fire tower of Sopron. J. Appl. Geophys. 2015, 112, 79–90. [Google Scholar] [CrossRef]
  2. Boubaki, N. Détection de Cavités Par DeuxMéthodesGéophysiques: Radar de Sol et Mesures de RésistivitésÉlectriques. Ph.D. Thesis, Université Paris Sud-Paris XI, Orsay, France, 2013. [Google Scholar]
  3. Mostapha, A.M.M.; Alsharahi, G.; Driouach, A. Effect of External Noise on Ground Penetrating Radar Ability to Detect Objects. Int. J. Microw. Opt. Technol. 2019, 14, 124–131. [Google Scholar]
  4. Alsharahi, G.; Faize, A.; Louzazni, M.; Mostapha, A.; Bayjja, M.; Driouach, A. Detection of cavities and fragile areas by numerical methods and GPR application. J. Appl. Geophys. 2019, 164, 225–236. [Google Scholar] [CrossRef]
  5. Heggy, E. Etude et Modélisationdes Performances des Radars SondeursBasseFréquence Pour la Recherchede L’eauDansle Sous-Sol de Mars. Ph.D. Thesis, Université Pierre et Marie Curie-Paris VI, Paris, France, 2002. [Google Scholar]
  6. Potin, D. Traitement des Signaux Pour la Détectionde Mines Antipersonnel. Ph.D. Thesis, Ecole Centrale de Lille, Villeneuve-d’Ascq, France, 2007. [Google Scholar]
  7. Faize, A.; Alsharahi, G.; Hamdaoui, M. Radar GPR Application to Explore and Study Archaeological Sites: Case Study. Int. J. Adv. Comput. Sci. Appl. 2020, 11, 179–182. [Google Scholar] [CrossRef]
  8. Alsharahi, G.; Faize, A.; Maftei, C.; Bayjja, M.; Louzazni, M.; Driouach, A.; Khamlichi, A. Analysis and Modeling of GPR Signals to Detect Cavities: Case Studies in Morocco. J. Electromagn. Eng. Sci. 2019, 19, 177–187. [Google Scholar] [CrossRef]
  9. Zhao, W.; Forte, E.; Fontana, F.; Pipan, M.; Tian, G. GPR imaging and characterization of ancient Roman ruins in the Aquileia Archaeological Park, NE Italy. Measurement 2018, 113, 161–171. [Google Scholar] [CrossRef]
  10. Annan, P. Ground Penetrating Radar Principles, Procedures and Applications; Sensors and Software: Mississauga, ON, Canada, 2003; 278p. [Google Scholar]
  11. Hamdaoui, M. Effect of electromagnetic parameters of the medium on the GPR data. Int. J. Emerg. Trends Eng. Res. 2020, 8, 1749–1755. [Google Scholar] [CrossRef]
  12. Perez, R. Contribution à L’analyseThéoriqueet Expérimentalede Bscan GPR: Performances des Antennes: ApportsD’une Configuration Multistatique. Ph.D. Thesis, Université de Limoges, Limoges, France, 2005. [Google Scholar]
  13. Mehennaoui, N. Etude Théoriquede la Propagation des OndesÉlectromagnétiquesDansles MilieuxHétérogènes-Application au Radar Sol. Master’s Thesis, Université Ferhat Abbas-Setif, Sétif, Algeria, 2018. [Google Scholar]
  14. Mostapha, A.M.M.; Alsharahi, G.; Driouach, A. Simulation effect of polarization of targets on the Ground Penetrating Radar response. In Proceedings of the 2017 International Conference on Wireless Technologies, Embedded and Intelligent Systems (WITS), Fez, Morocco, 19–20 April 2017. [Google Scholar]
Figure 1. Diagram representing the phenomena of reflection and transmission at the interface between two media which represent different dielectric contrasts.
Proceedings 63 00037 g001
Figure 2. GPR SIR3000.
Proceedings 63 00037 g002
Figure 3. Simulation results(a,b) models of two conductive objects buried in a medium of wet sand at a depth of 0.3 and 0.7 m (c,d) object detection radargrams.
Proceedings 63 00037 g003
Figure 4. Simulation results(a,b) two conductive objects buried in a wet sand medium at a depth of 0.3 and 0.7 m (c,d) object detection radargrams.
Proceedings 63 00037 g004
Figure 5. Simulation results(a,b) two conductive objects buried in a wet sand medium at a depth of 0.3 and 0.7 m (c,d) object detection radargrams.
Proceedings 63 00037 g005aProceedings 63 00037 g005b
Figure 6. Image of a conductive object with dimensions 0.61 × 0.35 m.
Proceedings 63 00037 g006
Figure 7. (a) Result obtained by GPR, and (b) result obtained by simulation.
Proceedings 63 00037 g007
Figure 8. (a) Result obtained by GPR, (b) result obtained by simulation.
Proceedings 63 00037 g008
Figure 9. (a) Image of an empty container, (b) image of a container filled with water, (c,d) the resulting radargrams.
Proceedings 63 00037 g009
Figure 10. (a) Image of a rock, (b) radargram obtained.
Proceedings 63 00037 g010
Publisher’s Note: MDPI stays neutral with regard to jurisdictional claims in published maps and institutional affiliations.

