1. Introduction
Impedance sensing is a label free, real time technique that is used to monitor cellular function. First pioneered by Giever and Keese, impedance sensing exposes live cells to very small electrical currents at various frequencies [
1,
2]. By measuring the resistance that the cells provide to this current, we can accurately measure the responses of the cells in real time. As no labeling is required, this is highly non-invasive, and can be carried out over extended periods to give high-resolution information over long periods. Furthermore, this information is quantified, and is thus able to be directly analyzed statistically. Mathematical models can also be applied to this data in order to allow the exploration of various cellular parameters that cannot be readily measured directly [
3]. These advantages have triggered the broad adoption of impedance sensing in a wide variety of applications, with a range of custom instruments having been developed [
4,
5,
6,
7]. However, the adoption of these systems has been limited, as the construction of a specialist instrumentation is technically challenging. In contrast, commercially available instruments provide a turnkey solution to accessing impedance sensing. In this paper, we compare three such systems, the physical characteristics of which are summarized in
Figure 1.
Giever and Keese’s original Electric Cell-substrate Impedance Sensing (ECIS) invention has since been commercialized by Applied Biophysics as the ECIS ZΘ [
8]. This instrument uses 96-well plates with electrodes fabricated directly onto the base of the chip. Impedance and phase measurements at a range of frequencies are collected by the instrument, and subsequently, these can then be modelled computationally to indicate biologically-relevant cellular parameters. This results in three values being generated: Rb, Cm and Alpha. Rb represents the cell–cell interaction between endothelial cells; Cm represents the membrane resistance of the cells; whilst Alpha represents the distance between the cells and the underlying substrate (basolateral adhesion) [
3]. Together, these values allow for the in-depth analysis of biological responses [
9].
More recently, ACEA Biosciences (now part of Agilent) released the xCELLigence instrument [
10]. Much like ECIS, this instrument uses gold electrodes fabricated directly onto the base of a 96-well plate. However, this instrument only collects impedance measurements at three frequencies, making modeling impossible.
Finally, the cellZscope is the most recent addition to the market, and is able to measure impedance across a Transwell filter [
11]. The Transwell is seated in a metal pot that acts as an electrical conductor, whilst a second electrode is suspended over the cells, making contact with the media in the apical chamber, completing the circuit and allowing impedance to be measured. Like ECIS, phase and impedance data are collected at a range of frequencies. Because impedance is captured at a number of frequencies, modelling can also be conducted. This results in the calculation of transendothelial electrical resistance (TER) as a measurement of the cell–cell junctional interaction, and Ccl as a measure of membrane impedance [
11]. An equivalent of the Alpha value generated by the ECIS instrument is not included in this model, as the porous nature of the Transwells means that this measurement is not physically present and therefore not sensible to infer.
Despite the abundance of studies using these instruments, direct comparisons have not been conducted. This is a critical lack of knowledge, as the inferences from the data collected from all three instruments are regularly used together to interrogate cellular responses [
12,
13,
14,
15,
16]. Therefore, in this paper, we use all three commercially available instruments, in order to analyze the similarities and differences between all three instruments. The hCMVEC cell line was chosen due to its low overall resistance, which—although characteristic of brain microvascular endothelial cell lines—makes study challenging [
17].
The inflammatory cytokines TNFα and IL1β were selected for these experiments due to their well-defined biphasic response. The response of hCMVECs to IL1β and TNFα has been explored on a molecular level, and the response has been well-characterized using impedance instruments [
18]. These responses are ideal for this study, as the cytokines first cause a decrease in resistance, followed by a substantial increase for an extended period. This change reflects an initial weakening of the paracellular barrier strength, followed by a sustained strengthening of the endothelial barrier. These treatments therefore allow decreases and increases in resistance to be examined from the same stimulus. Furthermore, this is an ideal response to use impedance sensing for, because the transient nature makes the response difficult to examine with traditional single time point analysis, as the initial decrease would be easy to miss [
19]. For this study, a concentration at the high end of the physiological range was selected to give a robust response, with good characteristics for the testing of the impedance instruments.
We evaluated two key parameters of the data produced: the difference in magnitude at key points in time, and the difference in the shape of the curve. A difference in magnitude is useful as it has a straightforward interpretation, and correlates well with traditional single time point assays [
9,
12]. The second characteristic is a difference in the shape of the curve, as even if two responses have the same magnitude at a key time point, they may reach that point in a very different way. This was analyzed using cross correlation, which generates a single value between 1 and -1 for each pair of curves. A value of 1 represents identical curves, −1 represents opposite curves, and 0 shows no correlation between the two readings [
20]. By assessing both these characteristics in concert, we are able to robustly compare the responses from all three systems.
In this paper, we ran the same experiment simultaneously on all three impedance-sensing instruments. We show that, although the instruments’ impedance measurements have similar shapes, they differ in magnitude, demonstrating significant differences in sensitivity. Furthermore, the different modeled measurements increase the sensitivity of the measurements significantly, and these values cannot be directly inferred from overall impedance measurements. Overall, this demonstrates the importance of selecting the most appropriate instrument for any particular experiment.
2. Materials and Methods
2.1. Culture of the Brain Endothelial Cells
Human cerebral microvascular endothelial cells (hCMVECs) were purchased from Applied Biological Materials Inc (cat# T0259). The cells were cultured in 75 cm2 Nunc flasks (cat# 156499) using M199 medium containing 10% FBS, 1 μg/mL hydrocortisone, 3 ng/mL hFGF, 1 ng/mL hEGF, 10 μg/mL heparin, 2 mM GlutaMAX and 80 μM dibutyryl-cAMP, later referred to as complete M199 medium. For both the cell maintenance and experiments, cultureware was coated with 1 μg/cm2 collagen I dissolved in 0.02 M acetic acid at room temperature for 1 h, before being washed 3 times with sterile MilliQ water, prior to the cell plating. To passage the cells, T75 flasks were washed twice with 4ml pre-warmed PBS before being incubated with 4ml pre-warmed TrypLE for 5 min. The TrypLE was then neutralized with an additional 4ml complete M199 before the cells were centrifuged at 100× g for 5 min, counted, and prepared to the appropriate concentration for the experimental seeding. All of the experiments used cells between passages 11 and 16. All of the impedance instruments and cell cultures were kept in dedicated incubators at 37 °C, 5% CO2, and 100% humidity.
2.2. Preparation of Cells in Impedance Sensing Technology
ECIS: 96W20idf plates were treated with 10 mM cysteine for 15 min to standardize the electrode impedance. The wells were then collagen coated, as described above. The hCMVECs were seeded at 80,000 cells per well in 200 µL complete M199 medium. The cells were allowed to proliferate for 48 h, allowing all of the units to stabilize. The ECIS machine was run continuously in multi-frequency mode using the default frequency spectra.
XCELLigence: E-plates (96 wells) were collagen coated as described above. The plate was then flooded with 122 µL complete M199 and well calibration conducted. The plate was then returned to the hood and the media were replaced with 122 µL media containing 48,800 cells per well, in order to account for the decreased surface area of an xCELLigence plate compared to an ECIS plate. The cells were then allowed to proliferate for 48 h until the Cell Index (CI) had stabilized.
CellZscope: before the experiment began, all of the cellZscope components were cleaned with MiliQ water, 70% ethanol, and then MiliQ water again. The pots and dipping electrodes were then autoclaved to ensure their sterility. Before the coating began, the Cell Module was assembled under sterile conditions, and each of the stainless steel pots was flooded with 900 µL basal M199 media. The assembled module was then placed in the cell culture incubator to equilibrate for at least one hour. Transwells (Corning) were coated from the apical side, as previously described. The hCMVECs were then seeded into the apical chamber at 80,000 cells per well, in 200 µL complete M199 medium. Transwells were then transferred into the Cell Module, taking care not to trap any bubbles underneath the membrane. The cell module was then placed in the instrument, and the spectra were acquired at the highest resolution between 1 and 100K ohms every 15 min.
2.3. Treatment with Inflammatory Cytokines
On the day of the treatment, complete M199 was pre-warmed, and either TNFα, IL1β, or an equivalent amount of water (henceforth labeled as the control) was added to form a 5× stock. Each instrument was then paused, and the stock was gently introduced to the middle of the well or apical chamber in order to reach the final concentration required. The cells were then returned to the instruments and the measurements resumed. The monitoring continued on all of the instruments for a further 27 h.
2.4. Data Analysis
RStudio (version 1.1.414, RStudio, Inc., Boston, MA, USA) and the vascr package developed by James Hucklesby (unpublished) were used to import the data and generate the cross correlation values. Vascr uses the ccf function in the stats package to run the underlying cross correlation analysis. The modeling was completed in the software provided by the vendor for each instrument, respectively, against a cell-free well in the same experiment.
Graphs: the graphs were generated using ggplot2 version 3.3.2. All of the graphs show the mean ± SEM of the replicates from one representative experiment. All of the experiments were repeated at least three times, and similar results were observed.
3. Results and Discussion
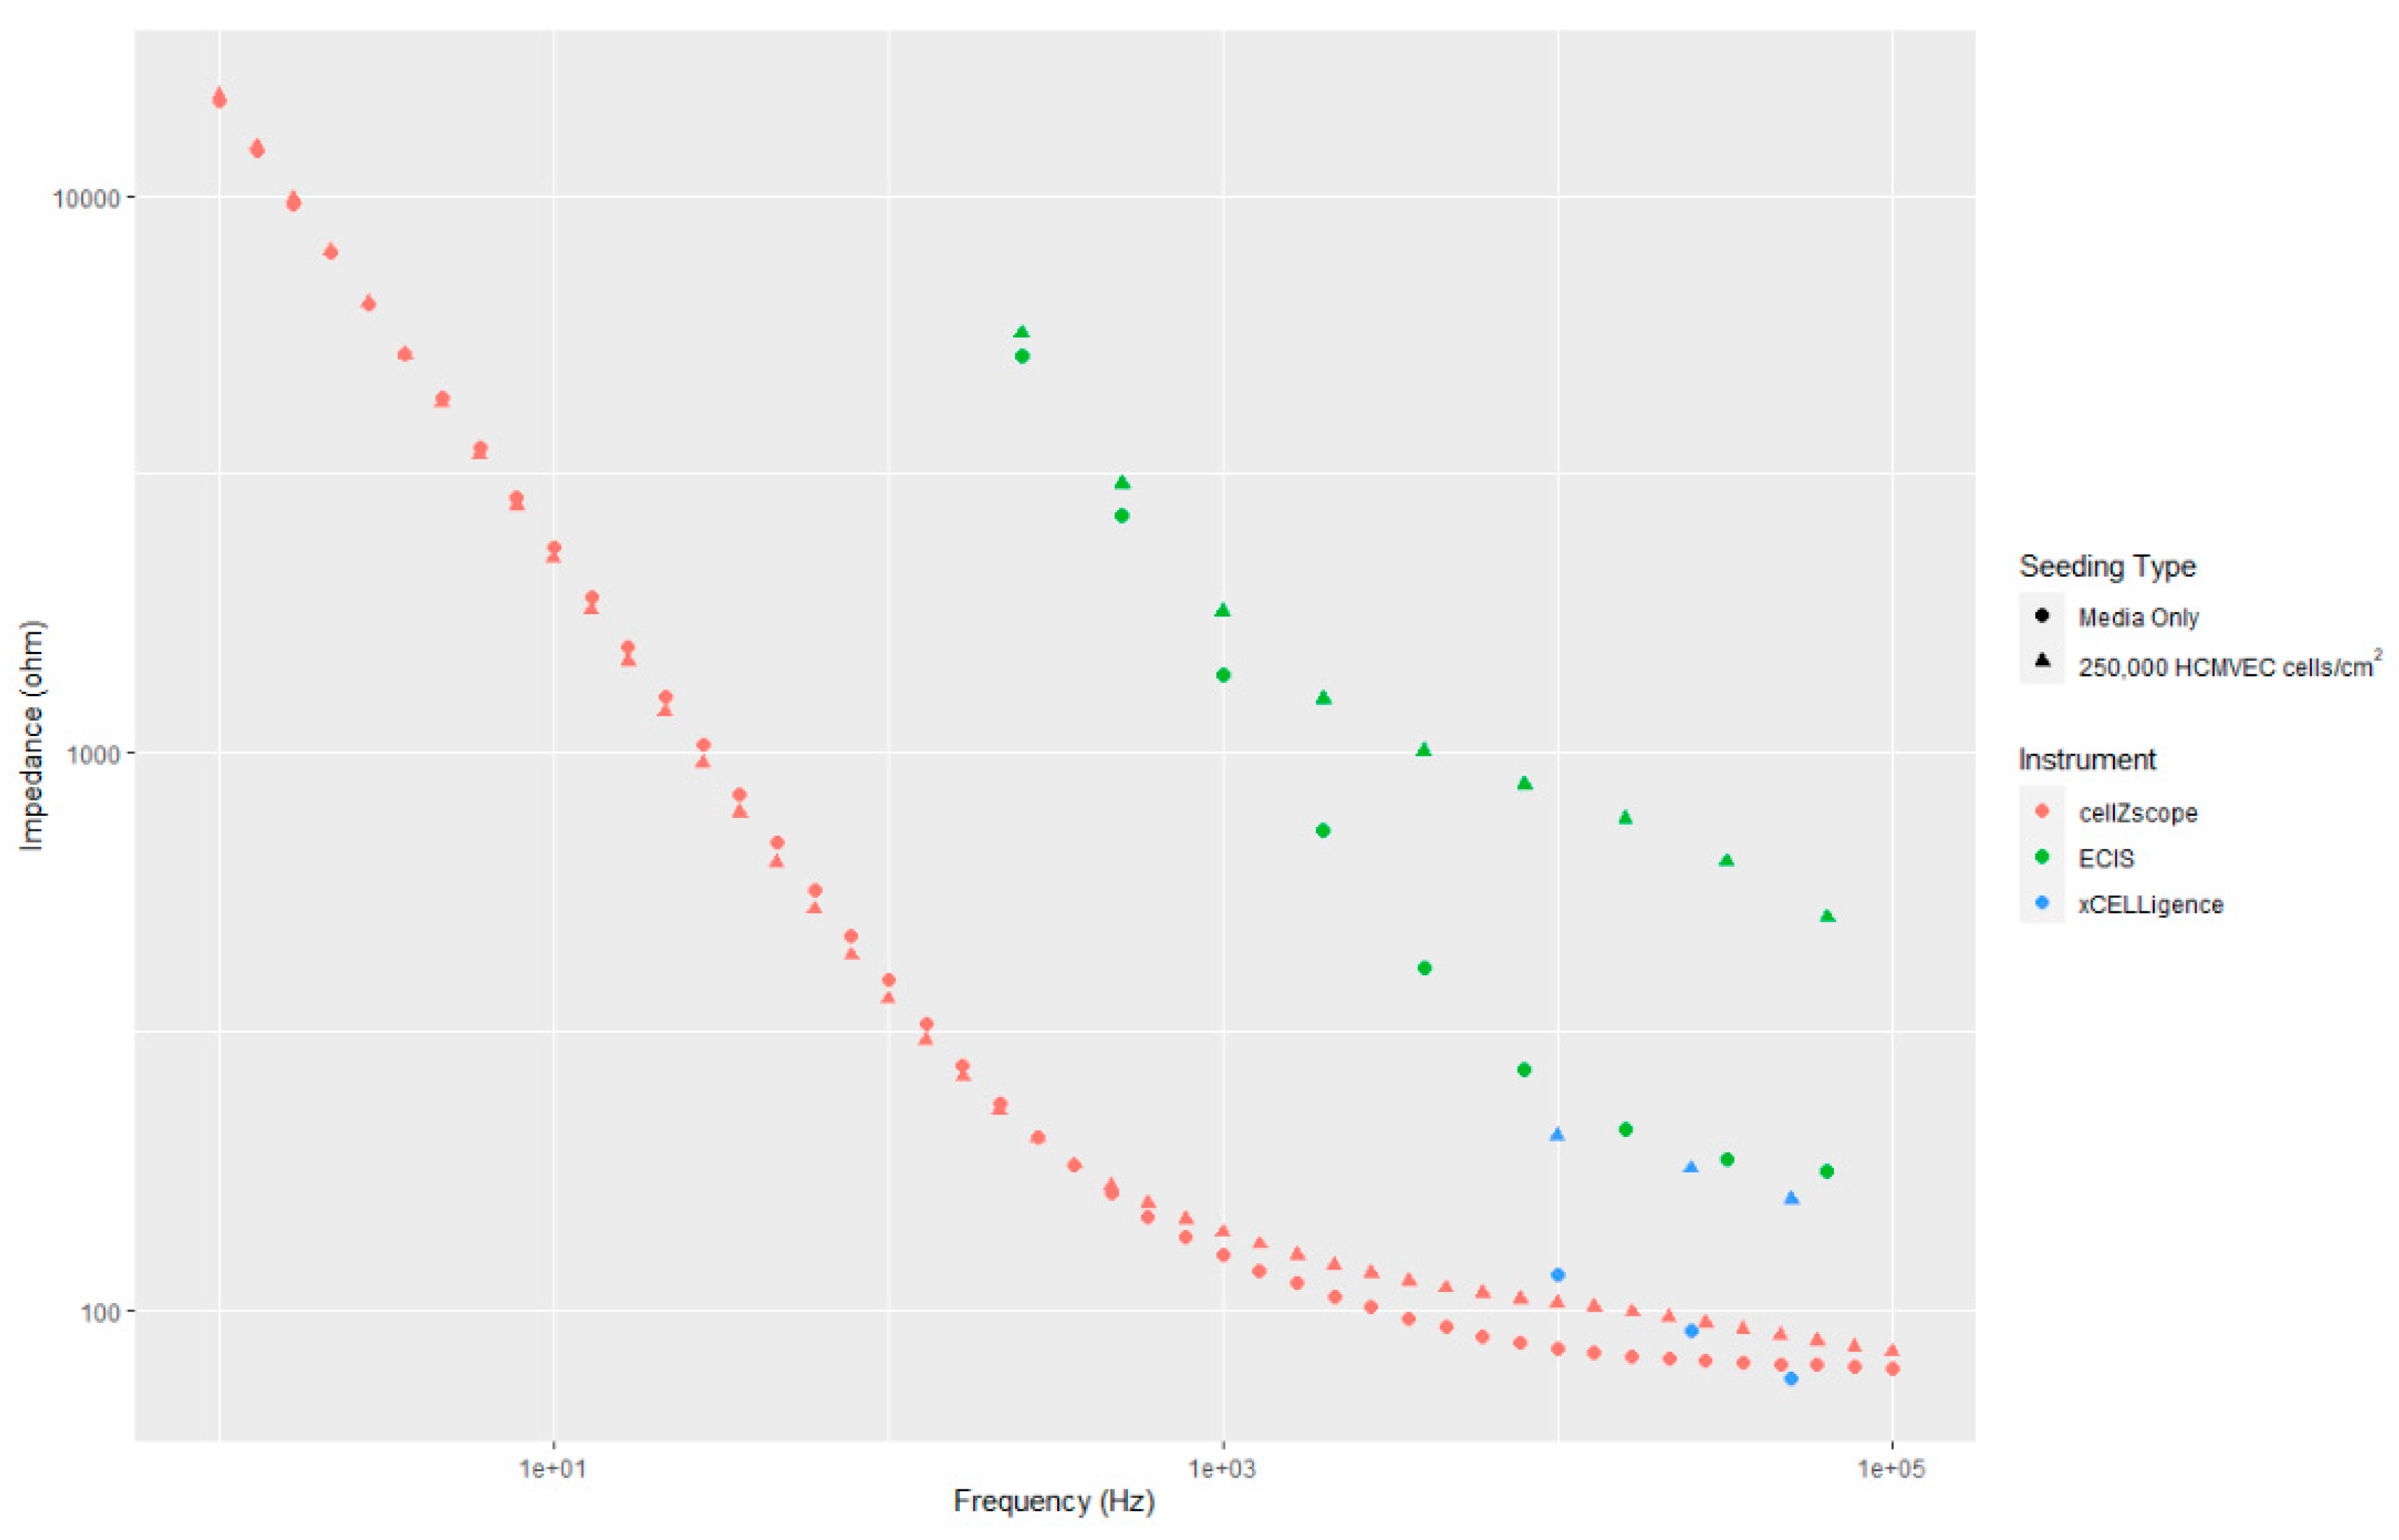
To assess the comparability of the three instruments, we first collected the impedance spectra of a confluent monolayer at 47 h, after the simultaneous seeding of either 250,000 cells/cm
2 or media only (
Figure 2). This time point was selected as the cells had formed a stable monolayer in all of the units collected by all three instruments for an extended period, providing the baseline for further treatments. As all three instruments were seeded simultaneously using the same preparation of cells, we can directly compare the measurements collected.
This dataset immediately demonstrates the quantity of the data collected by each instrument, and the relative concordance across all three instruments. The cellZscope captured 34 data points, compared to 9 from the ECIS instrument, and only 3 from the xCELLigence. The small number of data points collected over a relatively narrow range makes it clear why the xCELLigence data cannot be modelled, as it is impossible to determine the overall impedance response of the cells. The trends from the ECIS and xCELLigence instruments were similar, showing only a slight sigmoidal shape. This lack of a clear sigmoidal shape—characteristic of cell lines with a low overall impedance—demonstrates the power of these impedance instruments to detect even slight barrier function. However, this difference is not immediately obvious, and therefore the modelling (conducted later in this paper) will be invaluable in interpreting these datasets.
Although all three trends are similar and distinct from the media-only controls, the values are not directly comparable in magnitude. This is due to the drastic differences in the electrode area and configuration between the instruments, which affect the absolute value of the impedance measured. Despite this, the trends are similar, demonstrating that similar cellular characteristics are being measured. Furthermore, all three instruments were able to detect the cellular monolayer’s presence, as all of the values increased from their media-only values. This difference was particularly apparent in the ECIS and xCELLigence instruments, where the cells are in direct contact with the electrodes; however, a change in shape was still apparent on the cellZscope. Although this demonstrates that the presence of a static endothelial monolayer can be detected, it does not speak to the ability to discern the responses from the cells.
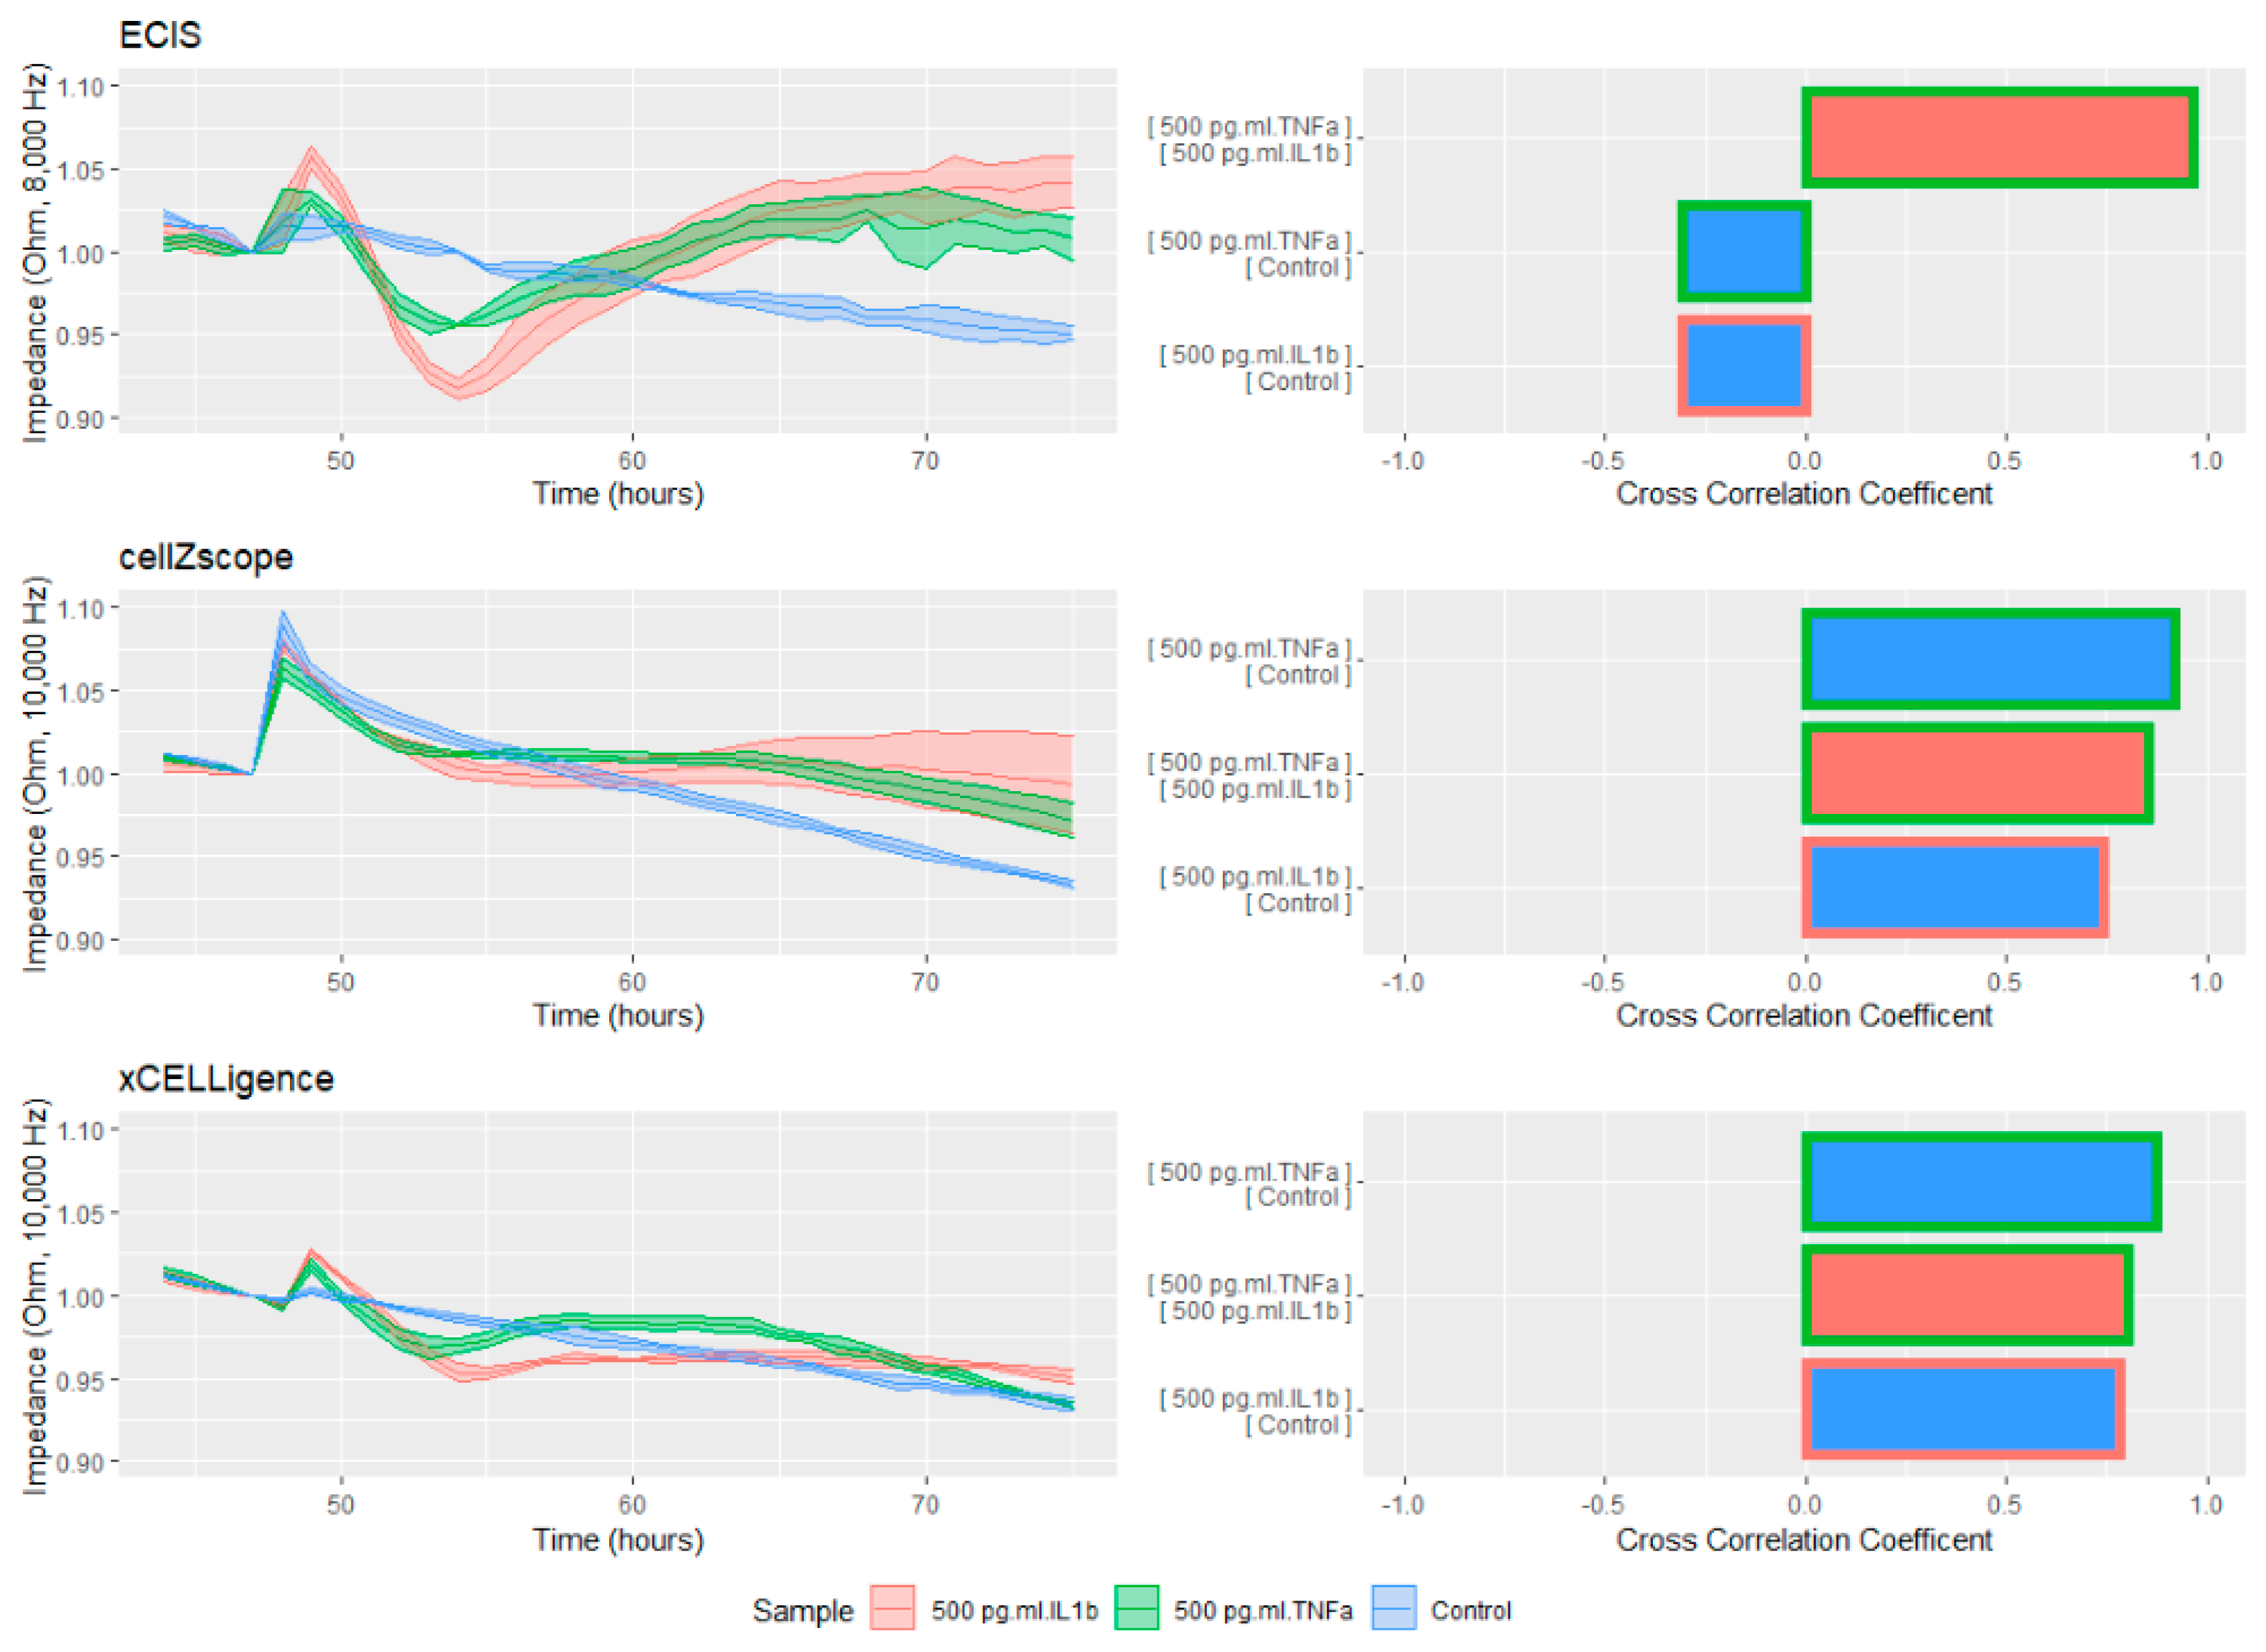
To test the sensitivity of each system regarding the detection of cellular responses, the confluent cellular monolayers were treated with the inflammatory cytokines TNFα and IL1β (
Figure 3) before the impedance readings were continued. In order to obtain the purest comparison across all of the instruments, frequencies as similar as possible to each other were selected. The data was then normalized to one hour before treatment and is presented as a percentage change in order to allow direct comparison despite the large differences in the baseline measurements between the instruments. Finally, the cross correlation was calculated in order to test the instruments’ ability to separate the curves’ shapes.
Although all of the instruments were able to detect differences between the treatments, the ECIS readings were by far the most sensitive. IL1β caused a 9% reduction in the raw ECIS impedance, followed by an increase of 5% by the 70 h time point. Although the cellZscope had a similar increase above the vehicle at 70 h, the initial loss of barrier function was much less pronounced. The xCELLigence was also able to detect both the increasing and decreasing impedance; however, the change in the magnitude of both phases was much less than that of the ECIS machine. The ECIS instrument’s ability to resolve the absolute differences in both phases also helped to generate large differences in the cross correlation coefficients between the different treatments. The results were striking, ranging between almost perfect correlation between the two inflammatory stimuli and −0.3 between each inflammatory stimulus and the control well. This demonstrates that the ECIS is able to unambiguously distinguish between the stimuli. The other two instruments are still able to make a distinction, but their sensitivity is considerably lower.
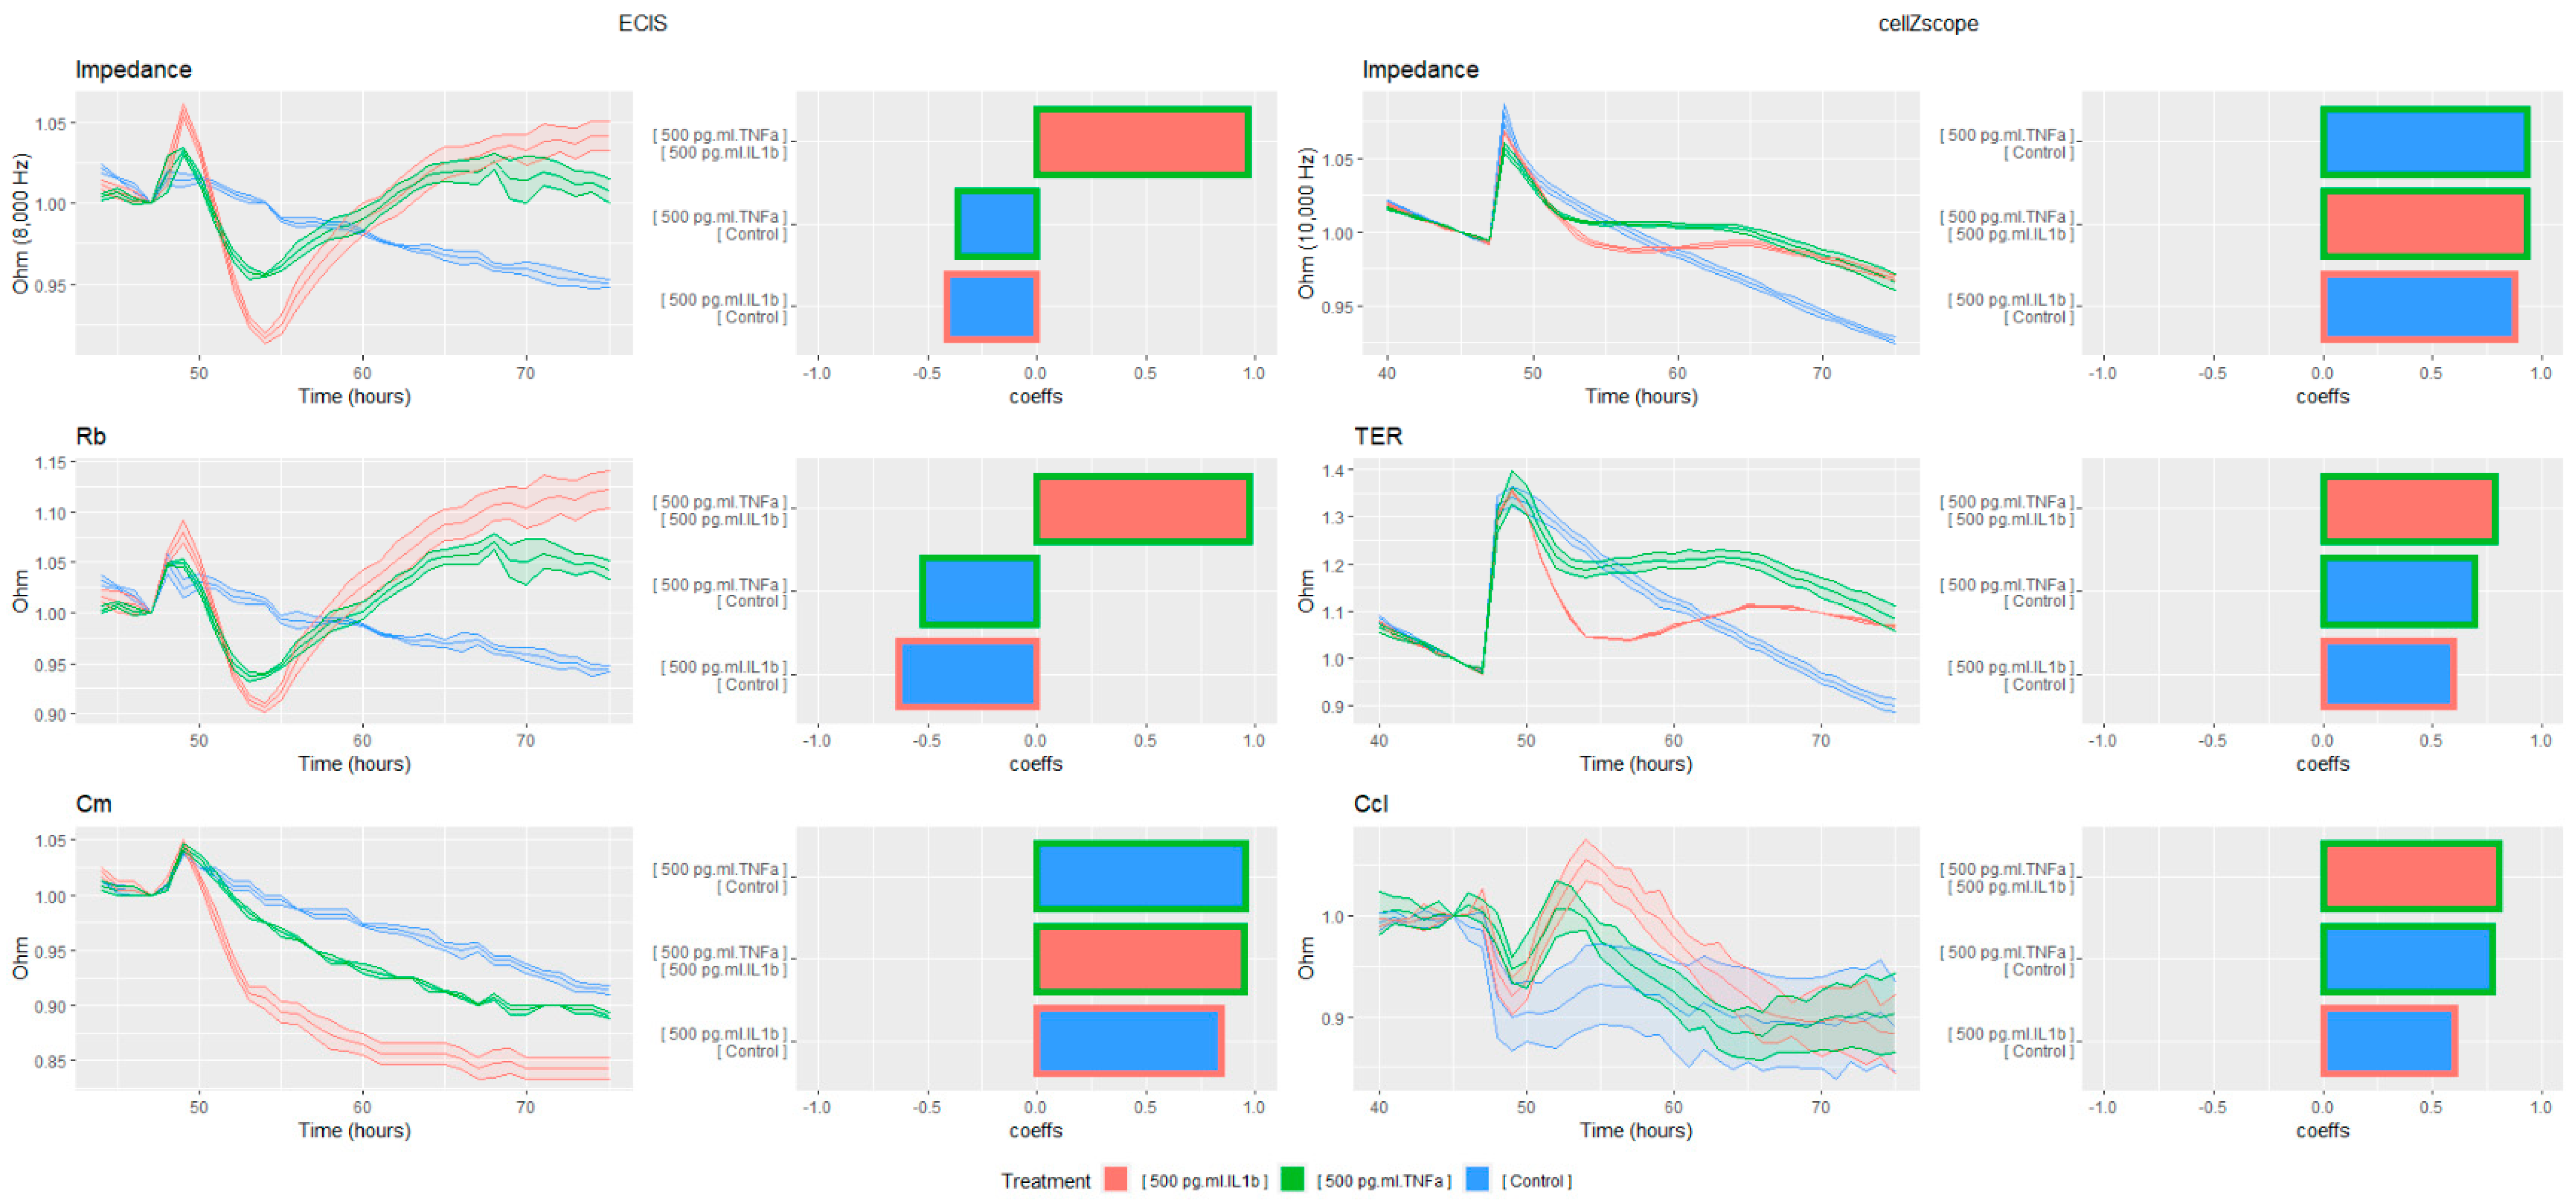
In order to achieve further sensitivity, the ECIS data was then modeled, and the cross-correlation analysis was repeated (
Figure 4). Although the ECIS was already the most sensitive to magnitude and shape changes, this effect was further amplified when the Rb was examined. Although all three samples had similar shapes and high cross correlation values, the difference in magnitude was immediately evident. Furthermore, the trend in Cm was very different to that of Rb, and the effect was not evident from the examination of the impedance data alone. This demonstrates the strong ability of ECIS modeling to separate cellular phenomena, and to highlight particular areas for further examination.
The modeling of the cellZscope data also increased the experimental sensitivity and allowed for additional inference. Compared to the raw impedance, TER amplified the response to both cytokines, lowering the cross correlation and increasing magnitude changes. Whilst the cell–cell association values were similar, with the trend in TER being similar to that observed in Rb using ECIS, the response in the membrane capacitance values was different between the two instruments. Rather than generating a sustained decrease in Cm, the inflammatory response in Ccl was transient, and had a much larger difference in shape between stimuli. This may be due to differences in the cellular morphology between those cultured on Transwells versus those grown on solid surfaces. The ability of modeling to increase the sensitivity of the cellZscope data also provides opportunities to study less pronounced cellular phenomena, particularly those where basolateral access is required, and therefore the more sensitive ECIS instrument is unable to be employed.
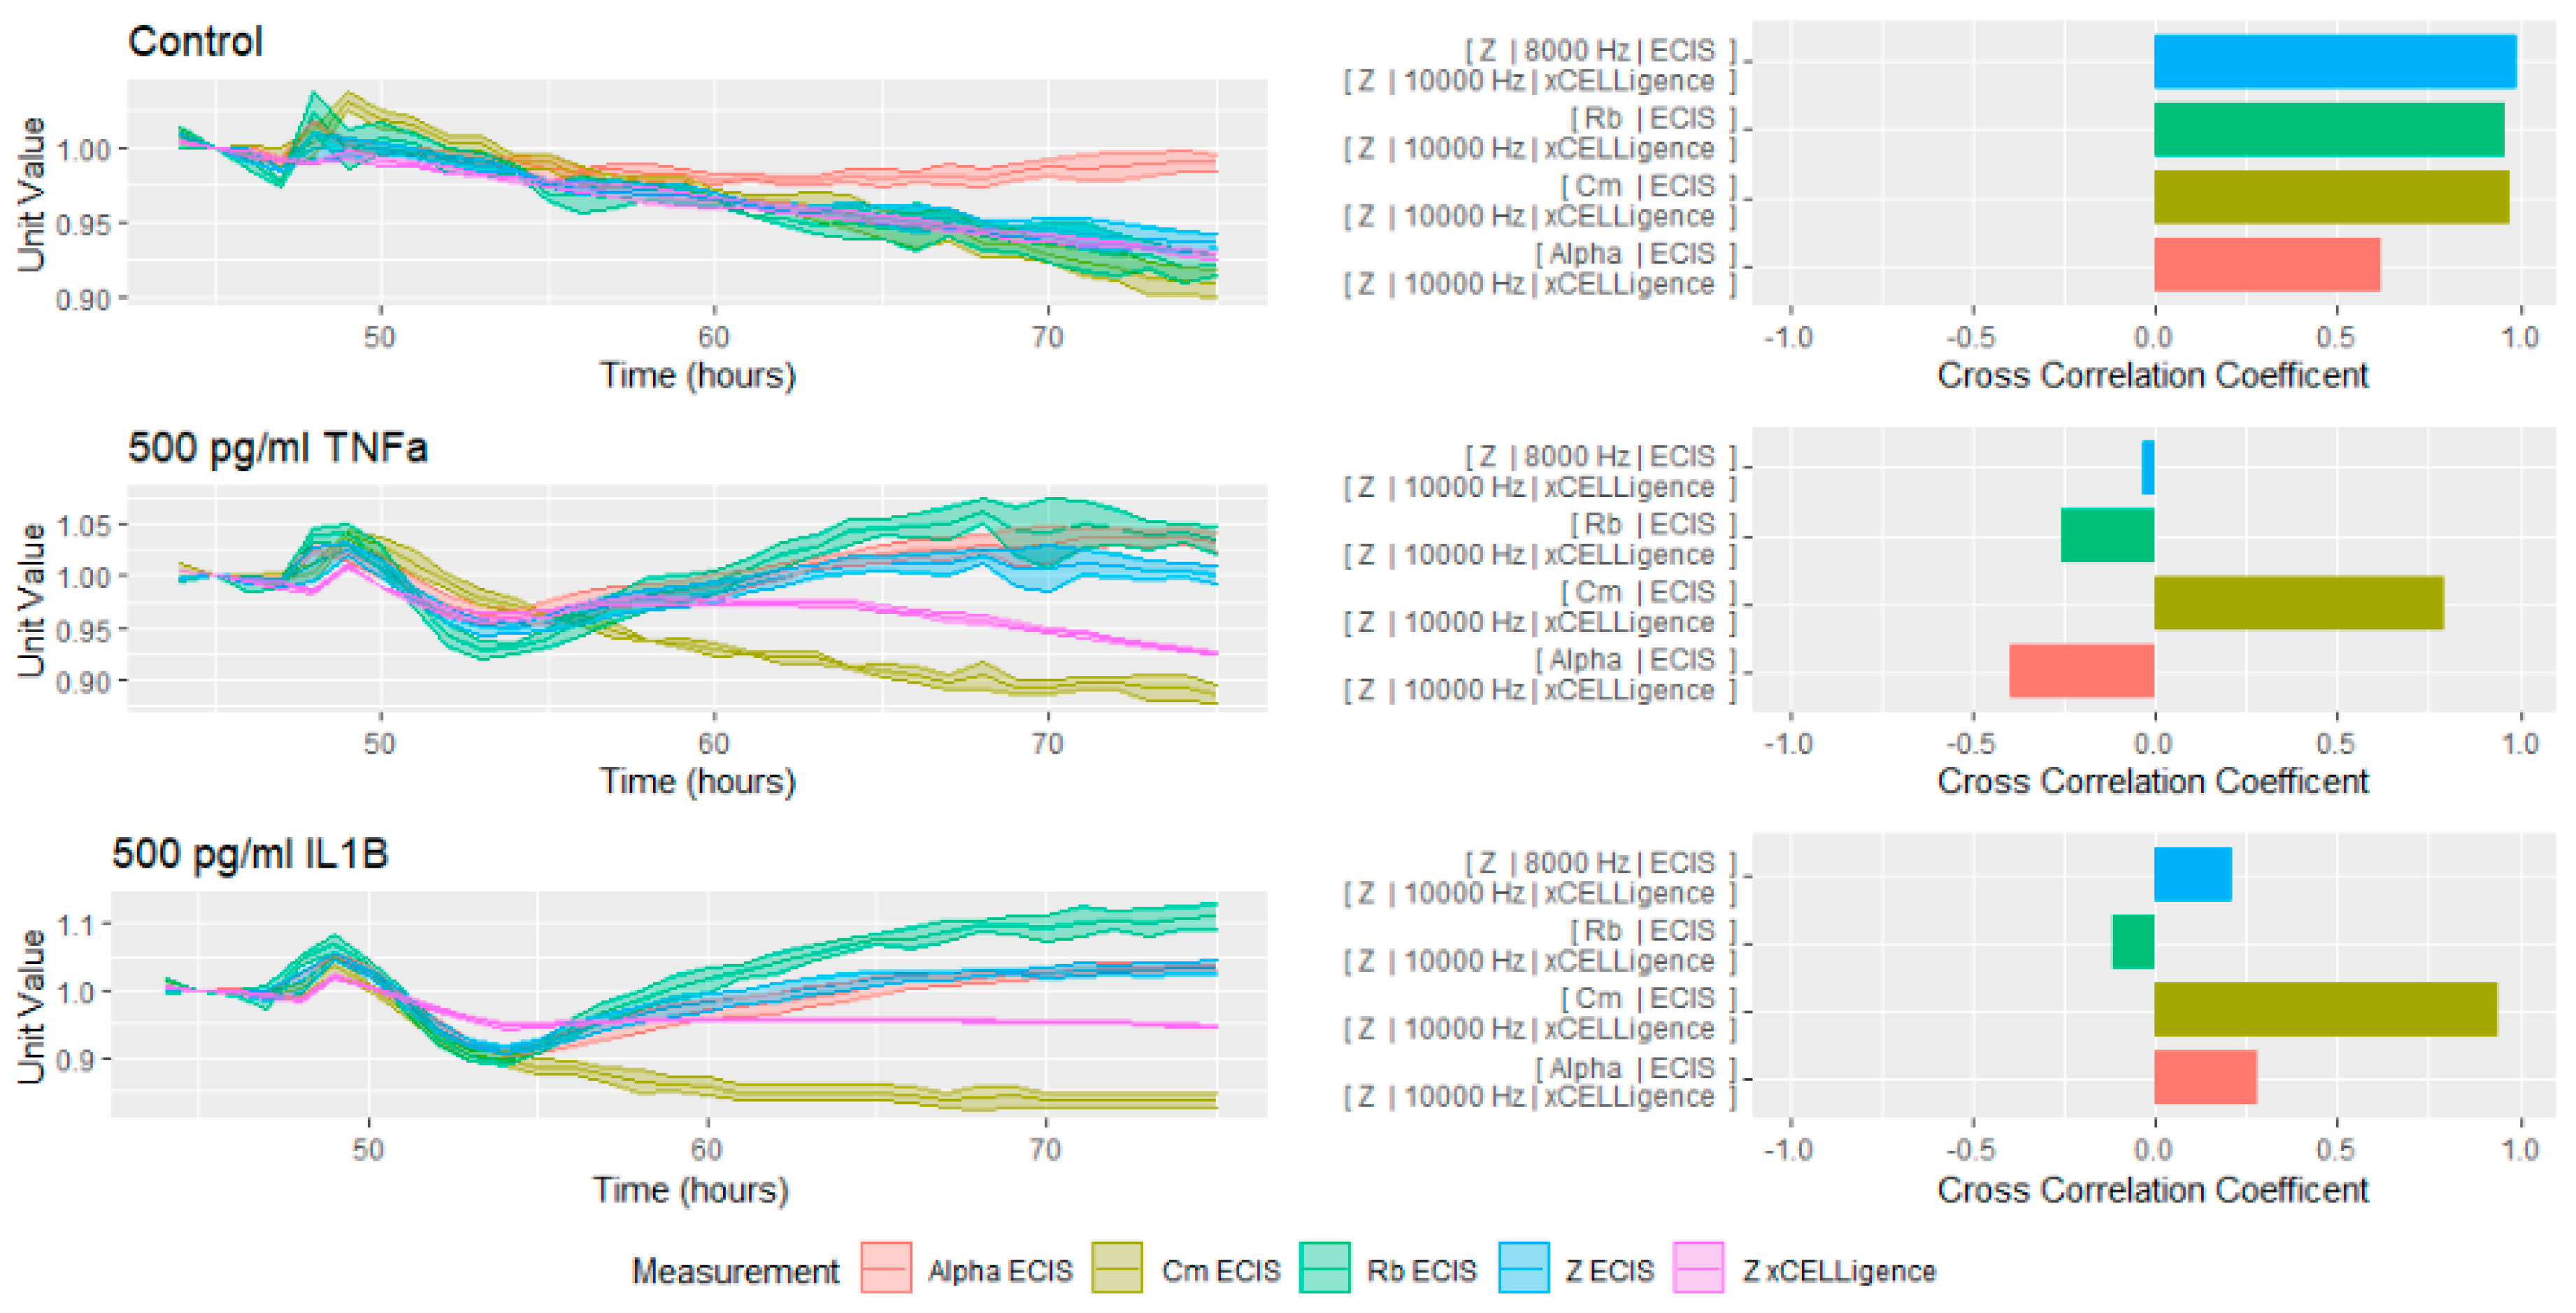
Given the significant utility of the modelled data, we attempted to correlate the xCELLigence data (
Figure 5, Purple) with both the modelled and raw parameters acquired from the ECIS measurements. Although the systems are very similar in their physical setup, the impedance measurements collected were not identical. The cross correlation and magnitude of the readings between the two instruments was very high in the control well; however, this similarity was not present in the cells treated with inflammatory cytokines. Of all of the ECIS units, Cm was the most similar in shape to the xCELLigence readings, although the magnitude was very different. Furthermore, even the relationship between the ECIS units and the xCELLigence measurements was inconsistent. Therefore, it is impossible to use xCELLigence as a proxy for any particular measurement, and it must be interpreted independently.

 ,
, 