Proceeding Paper

Combined Multilateration with Machine Learning for Enhanced Aircraft Localization †

Centre for Aviation, School of Engineering, Zurich University of Applied Sciences, 8400 Winterthur, Switzerland
*
Author to whom correspondence should be addressed.
Presented at the 8th OpenSky Symposium 2020, Online, 12–13 November 2020.
Proceedings 2020, 59(1), 2; https://doi.org/10.3390/proceedings2020059002
Published: 1 December 2020
(This article belongs to the Proceedings of 8th OpenSky Symposium 2020)

Abstract

:
In this paper, we present an aircraft localization solution developed in the context of the Aircraft Localization Competition and applied to the OpenSky Network real-world ADS-B data. The developed solution is based on a combination of machine learning and multilateration using data provided by time synchronized ground receivers. A gradient boosting regression technique is used to obtain an estimate of the geometric altitude of the aircraft, as well as a first guess of the 2D aircraft position. Then, a triplet-wise and an all-in-view multilateration technique are implemented to obtain an accurate estimate of the aircraft latitude and longitude. A sensitivity analysis of the accuracy as a function of the number of receivers is conducted and used to optimize the proposed solution. The obtained predictions have an accuracy below 25 m for the 2D root mean squared error and below 35 m for the geometric altitude.

1. Introduction

In order to maintain safe air traffic operation, Air Traffic Control (ATC) needs to know where all aircraft are located at any point in time. While traditionally aircraft localization is provided by primary and secondary radar systems, more recent localization technologies such as Automatic Dependent Surveillance-Broadcast (ADS-B) or Automatic Dependent Surveillance-Contract (ADS-C) provide precise aircraft position (and a large number of other) information. ADS-B combines Global Navigation Satellite System (GNSS)-based positioning and conventional navigation technologies (inertial navigation and ground-based navaids) to continuously broadcast the best estimate of the aircraft’s position. Since ADS-B relies heavily on GNSS-based position solutions, it is, however, sensitive to jamming (i.e., radio frequency interference to inhibit reception of the very weak GNSS signals) [1] or spoofing (i.e., counterfeit signals to deliberately alter the position estimate) [2]. In order to reliably receive ADS-B signals within the desired coverage area, typically a system of ground stations (receivers or sensors) is necessary. Based on the information gathered in the network, other methods to locate aircraft can be applied. The most prominent example is multilateration. In multilateration, the distance of several known reference stations (e.g., the ADS-B receiver locations) to the transmitting aircraft is determined. Based on these measurements, the location of the aircraft can be estimated, as described in more detail later in this paper. In this context, the OpenSky Network (OSN), a non-profit organization focusing on the collection, distribution, and provision of open-access ADS-B data [3], in collaboration with the Swiss Cyber-Defence Campus (CYD), has organized an online “aircraft localization challenge”. The objective of this challenge was to develop the best localization solution based on real-world data obtained through the OSN network. In the literature, a number of solutions are presented: Scaramuzza et al. [4], for example, presented a pure multilateration-based approach to the localization problem, while Strohmeier et al. [5] developed a grid-based localization approach using the k-nearest neighbor machine learning algorithm. In this paper, we present a localization solution that combines machine learning and multilateration-based techniques. With this solution, the authors obtained second place in the first round of the aircraft localization challenge.

2. The Aircraft Localization Competition

2.1. Competition Goal

The aircraft localization competition was introduced by OSN and CYD on their web platform AIcrowd [6]. The purpose of the competition is to develop localization solutions for aircraft using ADS-B data. For some of the aircraft, the position in the ADS-B message was intentionally removed. Competition participants were subsequently asked to reconstruct the missing position data. The competition was divided into two rounds: the first round took place between June and July and the second round between September and October. During the first round, participants were provided with data of ADS-B receivers, the position of which was known. Furthermore, the internal receiver clocks were synchronized within the network. For the second round, participants could not assume known receiver positions and synchronized internal clocks any longer. This made the problem significantly more challenging as precise time synchronization was necessary to obtain meaningful time-difference of arrival measurements for multilateration. In this paper, the authors present a solution that was developed for the first round of the competition, i.e., the simplified problem with synchronized receivers in known locations.

2.2. Datasets

Multiple datasets were provided for this competition. The training/competition dataset consists of several rows of ADS-B messages, where each row in the dataset represents the reception of one aircraft position report and contains the following information [6,7]:
  • A unique aircraft identifier
  • The Unix timestamp indicated when the message was received by the OSN server
  • Unique identifiers of all sensors that received the message
  • Nanosecond timestamps at which each sensor received the message
  • Signal strength measurements from each of the sensors
  • The position of the aircraft (latitude, longitude, height); latitude and longitude is empty for the training rows
  • The barometric altitude of the aircraft
The second dataset available concerns the sensors (also known as receivers). Each row corresponds to one receiver and includes the following information:
  • A unique sensor identifier
  • The position of the sensor (latitude, longitude, height)
  • The type of hardware and software
For the remainder of this paper, the rows in the provided dataset where the position information is available will be referred to as the “training dataset”, while the rows for which this information is missing will be referred to as the “competition dataset”.

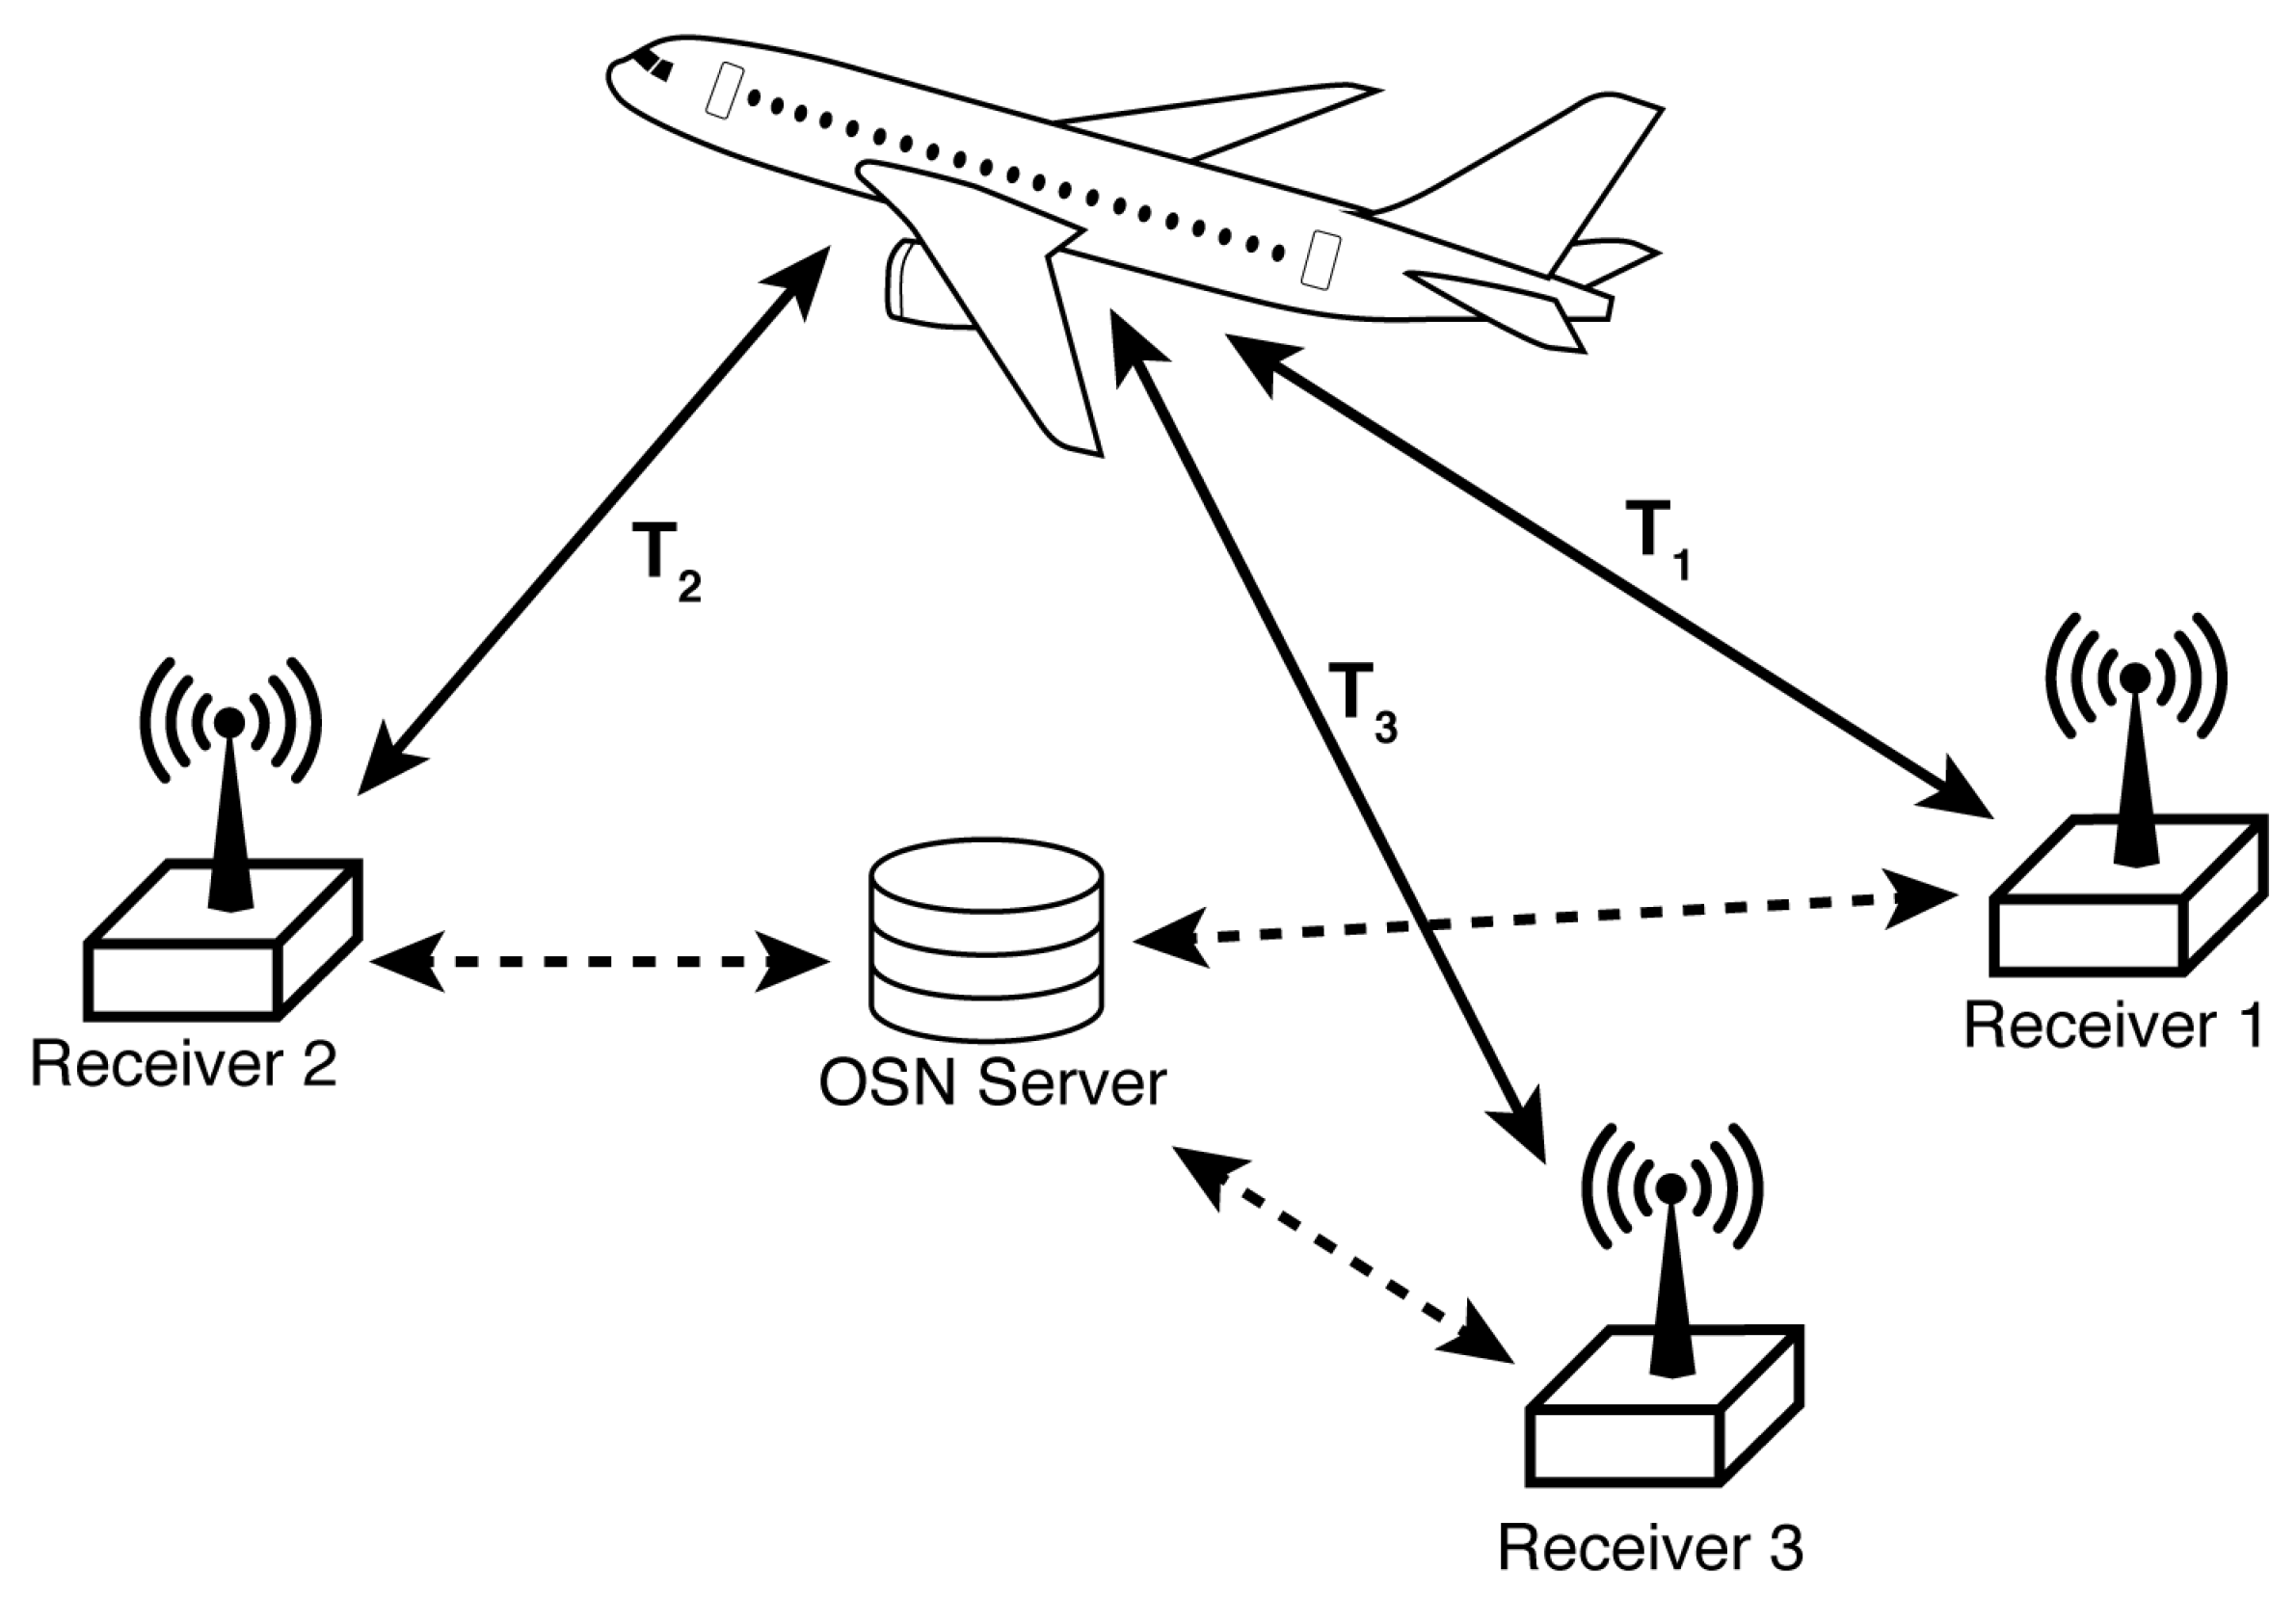
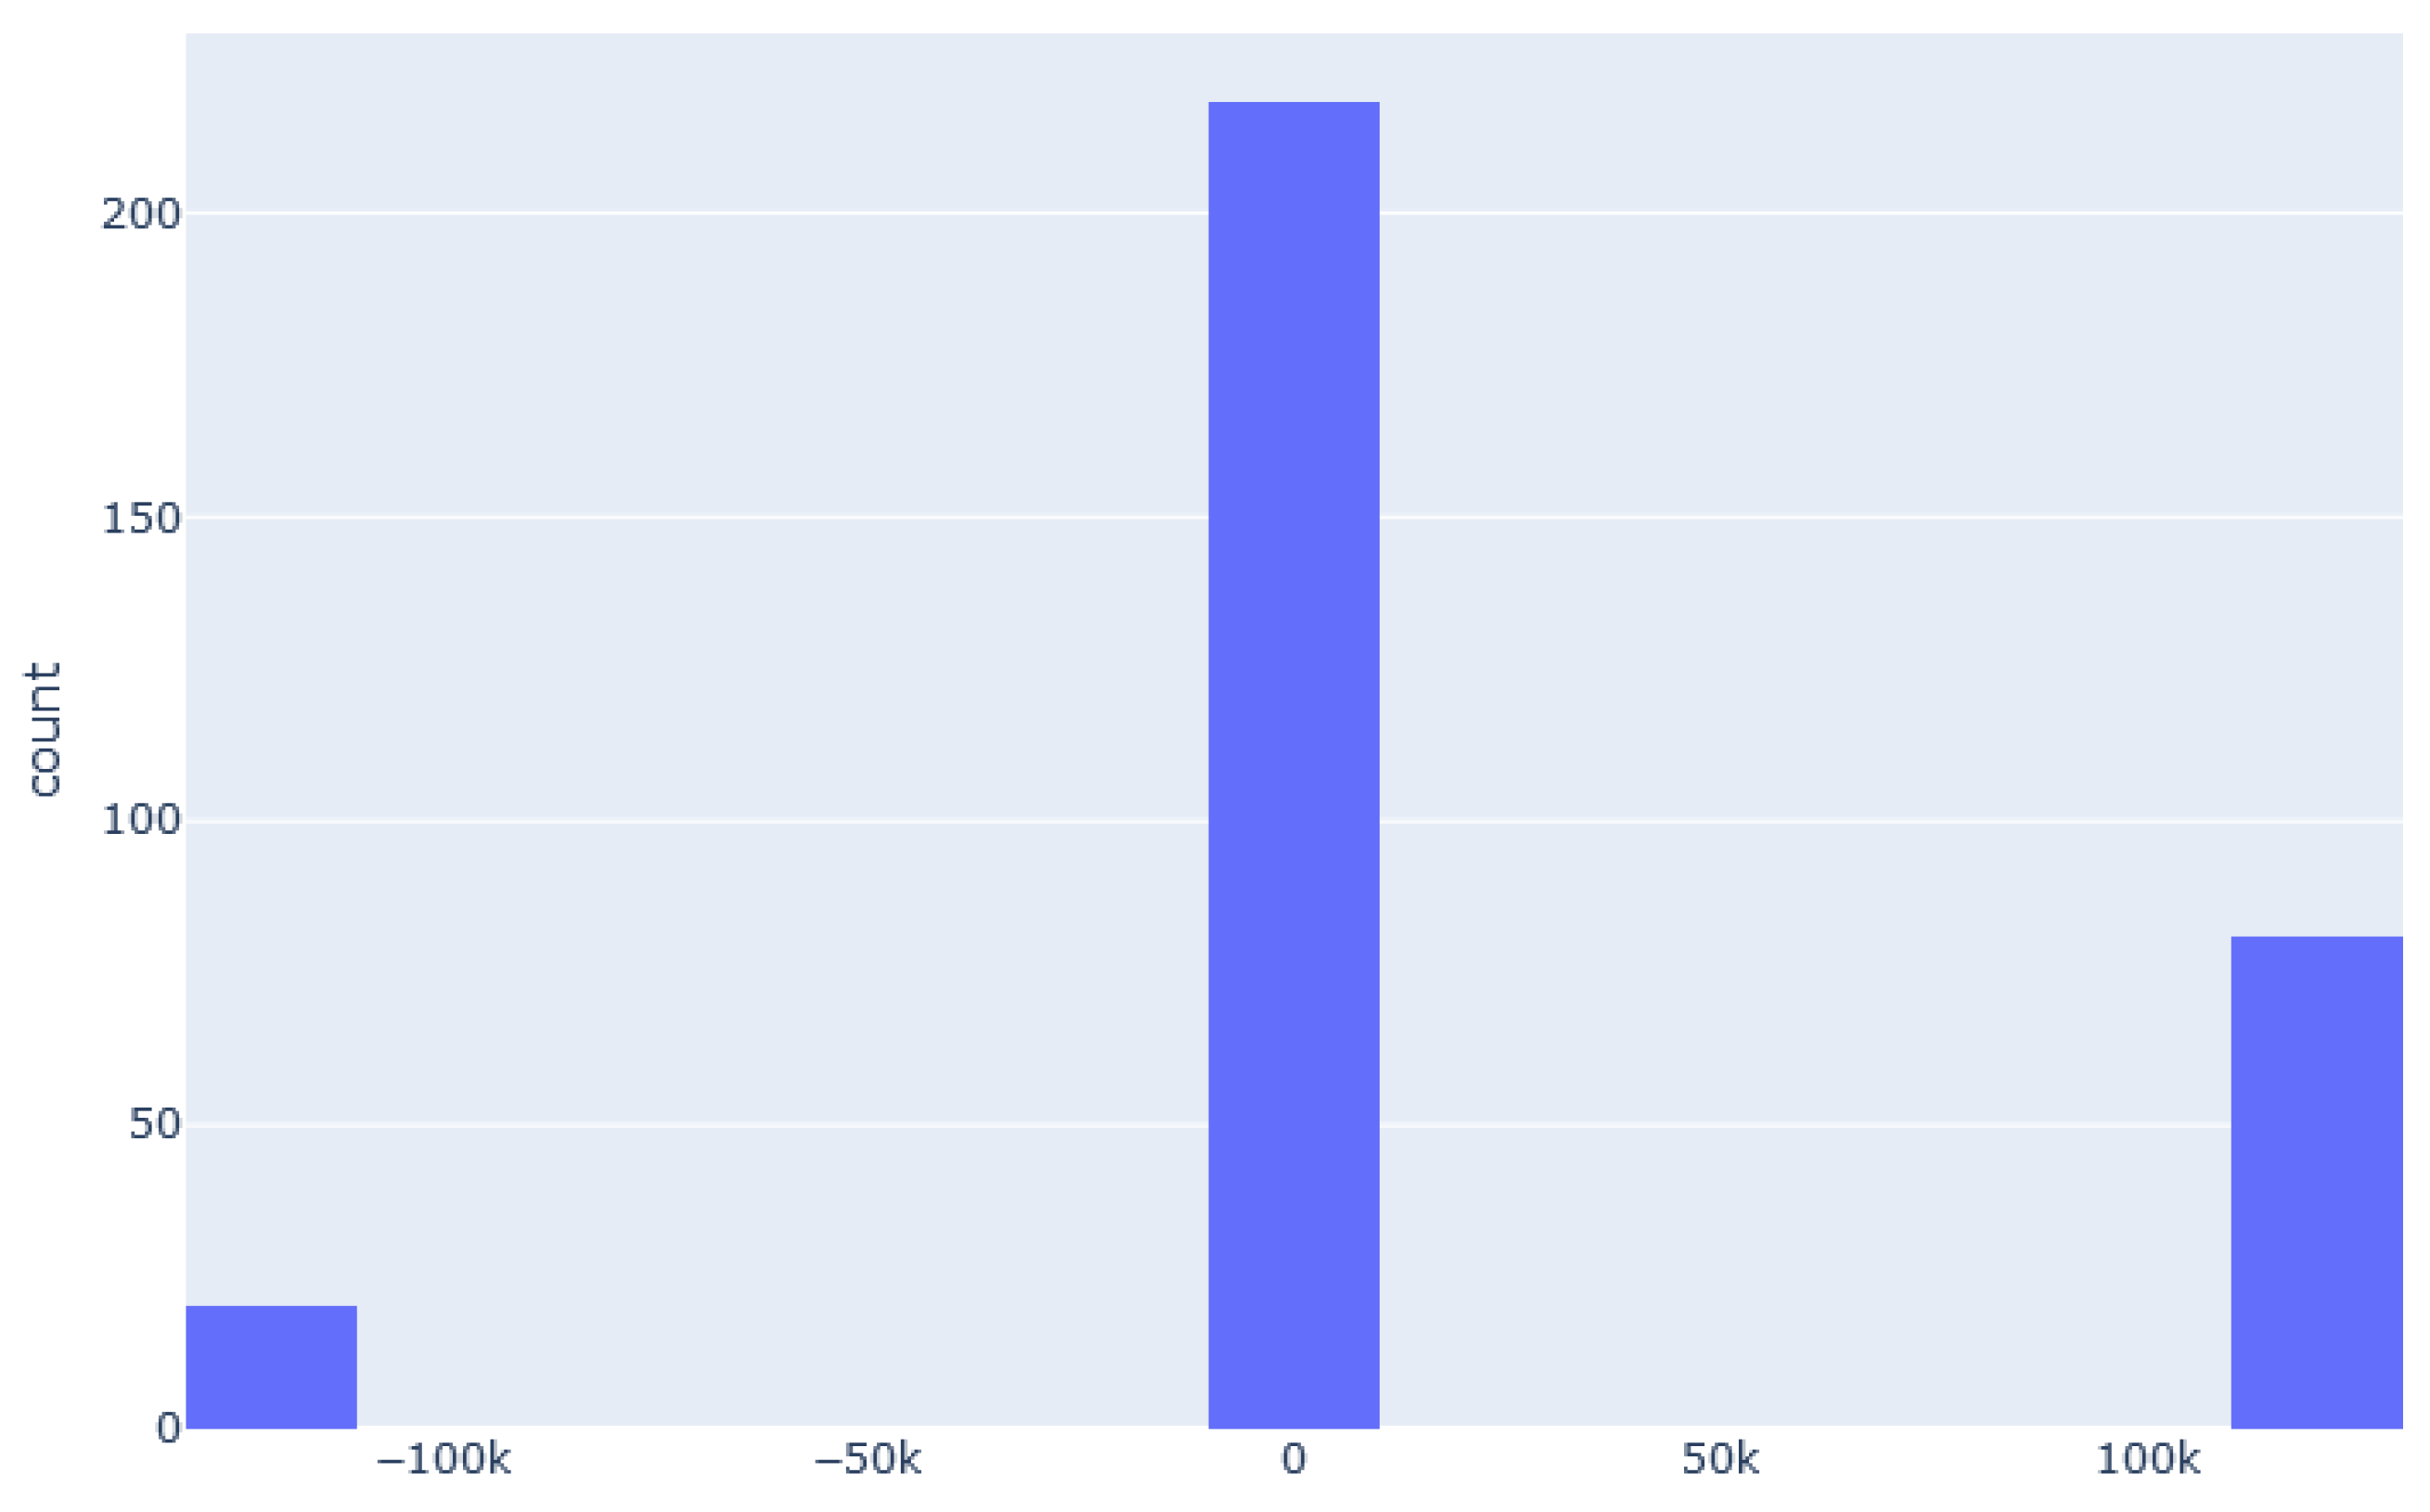
2.3. Time Difference of Arrival

The concept of Time Difference of Arrival (TDoA) is a key component in multilateration. As shown in Figure 1, the time it takes for a signal to travel the distance from an aircraft to a ground station depends on the distance between the two. When two ground stations are positioned at different distances from the aircraft, the signal will arrive at the ground stations at slightly different times. In the first round of this competition, the ground stations have a synchronized time stamp. Given the synchronization of time, it is possible to easily determine the TDoA of the signal transmitted by the aircraft.

2.3.1. Pairwise TDoA

For each message being received by at least two different receivers, the dataset can be reshaped into a pairwise structure. In this new form, each row consists of a pair of sensors ( s 0 , s 1 ) and a message ID. This means that each message ID received by m receivers is now represented by n = m ! 2 ! ( m 2 ) ! rows. The observed TDoA can therefore be extracted for all pairs of sensors by comparing when a message was received by s 0 and s 1 .
The TDoA depends on the geometry of the transmitter and receivers. Knowing the sensors and the aircraft position, a theoretical TDoA can be computed. For a pair of receivers ( i , j ) and an aircraft a, the theoretical TDoA is defined as:
t h e o r e t i c a l _ T D o A = d a i d a j c
where d a i and d a j refer to the Euclidean distance between aircraft and ADS-B receivers i and j, respectively, and c is the speed of light.

2.3.2. Observation/Theoretical Comparison

The authors assume that the error in TDoA, d e l t a _ e r r o r , depends on the pair of receivers as shown in Equation (2).
o b s e r v e d _ T D o A = t h e o r e t i c a l _ T D o A + d e l t a _ e r r o r
A statistical description of the pairwise errors (as shown in Table 1) was conducted. Consequently, Figure 2 shows the distribution of the median pairwise errors, while Figure 3 shows the distribution of the pairwise errors’ interdecile range. Interestingly enough and despite the fact that the receivers are supposed to be synchronized, it can be seen in Figure 2 that some pairs of sensors have median errors of around ±120,000 ns despite a narrow pairwise error interdecile range distribution. A further analysis of the pairs having an error offset of ±120,000 ns demonstrated that this corresponds to the pairs including a sensor of type GRX1090 and a sensor of type Radarscape. In effect, it turns out that the different times at which sensors of type Radarcape are receiving messages systematically lag by about 120,000 ns. In the context of the competition, the authors therefore corrected the o b s e r v e d _ T D o A by removing the TDoA corresponding offset for pairs including a sensor of type GRX1090 and one of type Radarscape.

3. The Localization Solution

In this section, the different localization solutions that were developed for this competition are discussed. First, a machine learning approach is presented. In the second part, a triplet-wise multilateration approach, then an all-in-view multilateration, and finally, a combined multilateration approach are presented.

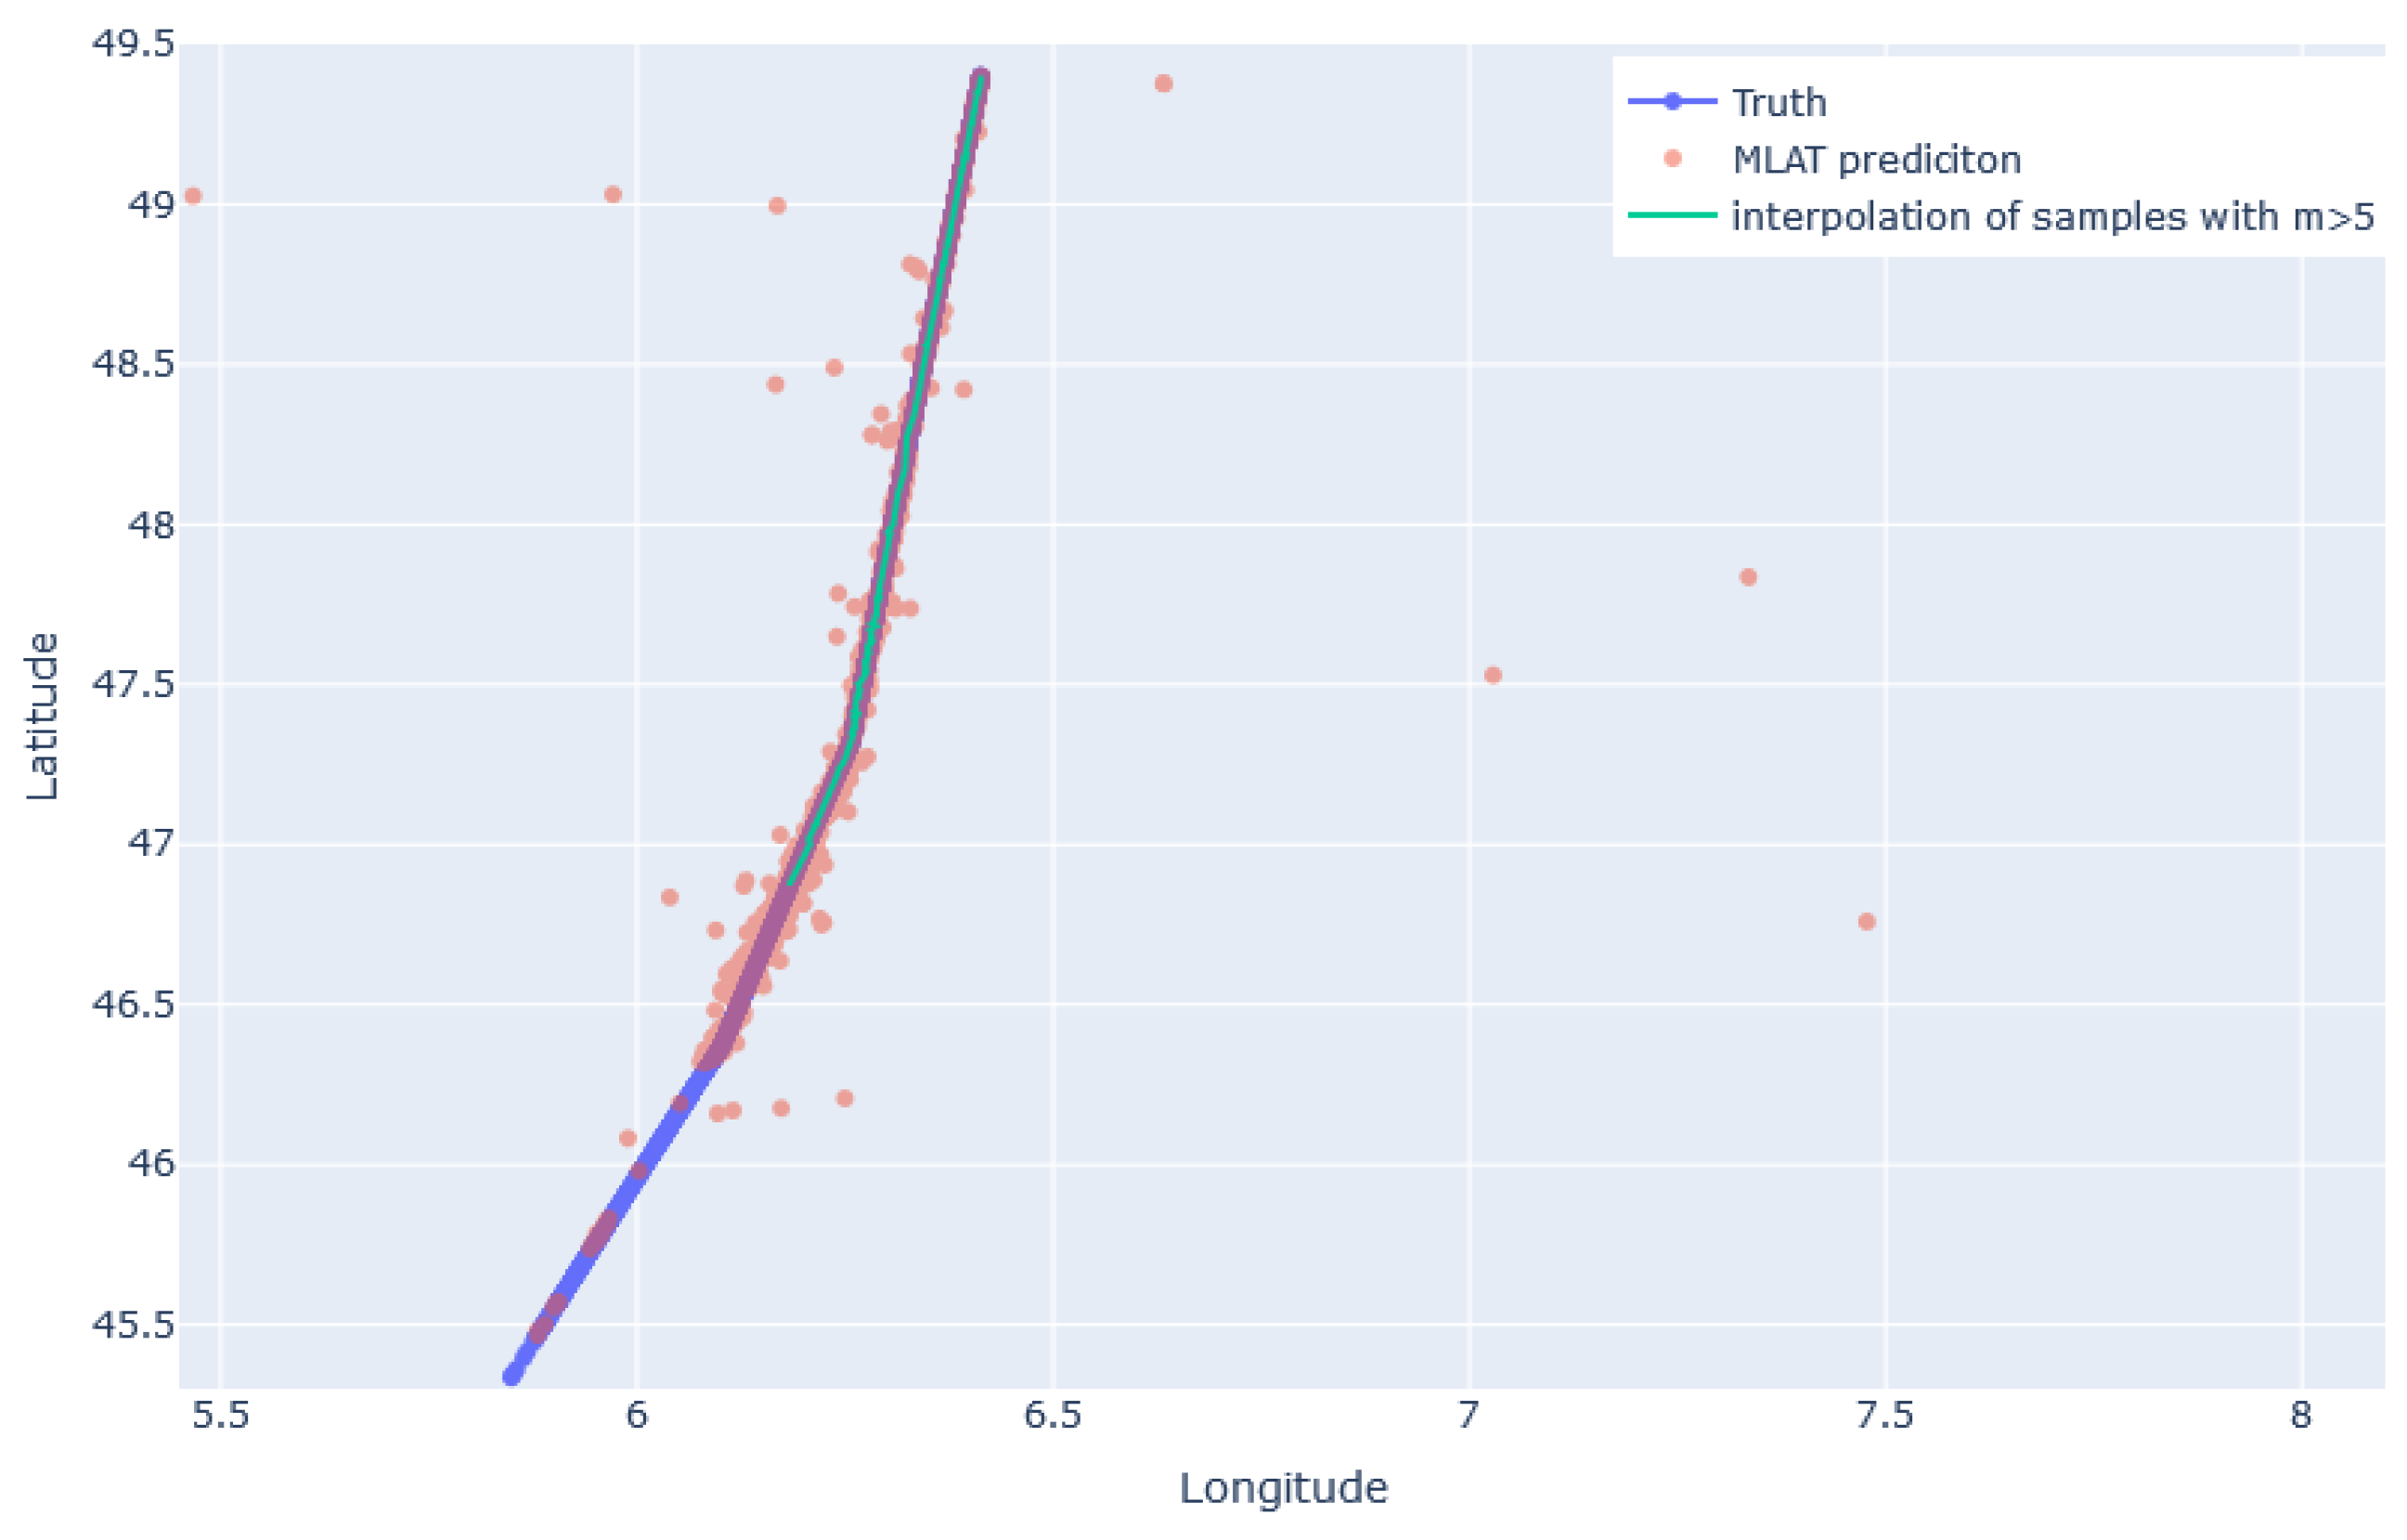
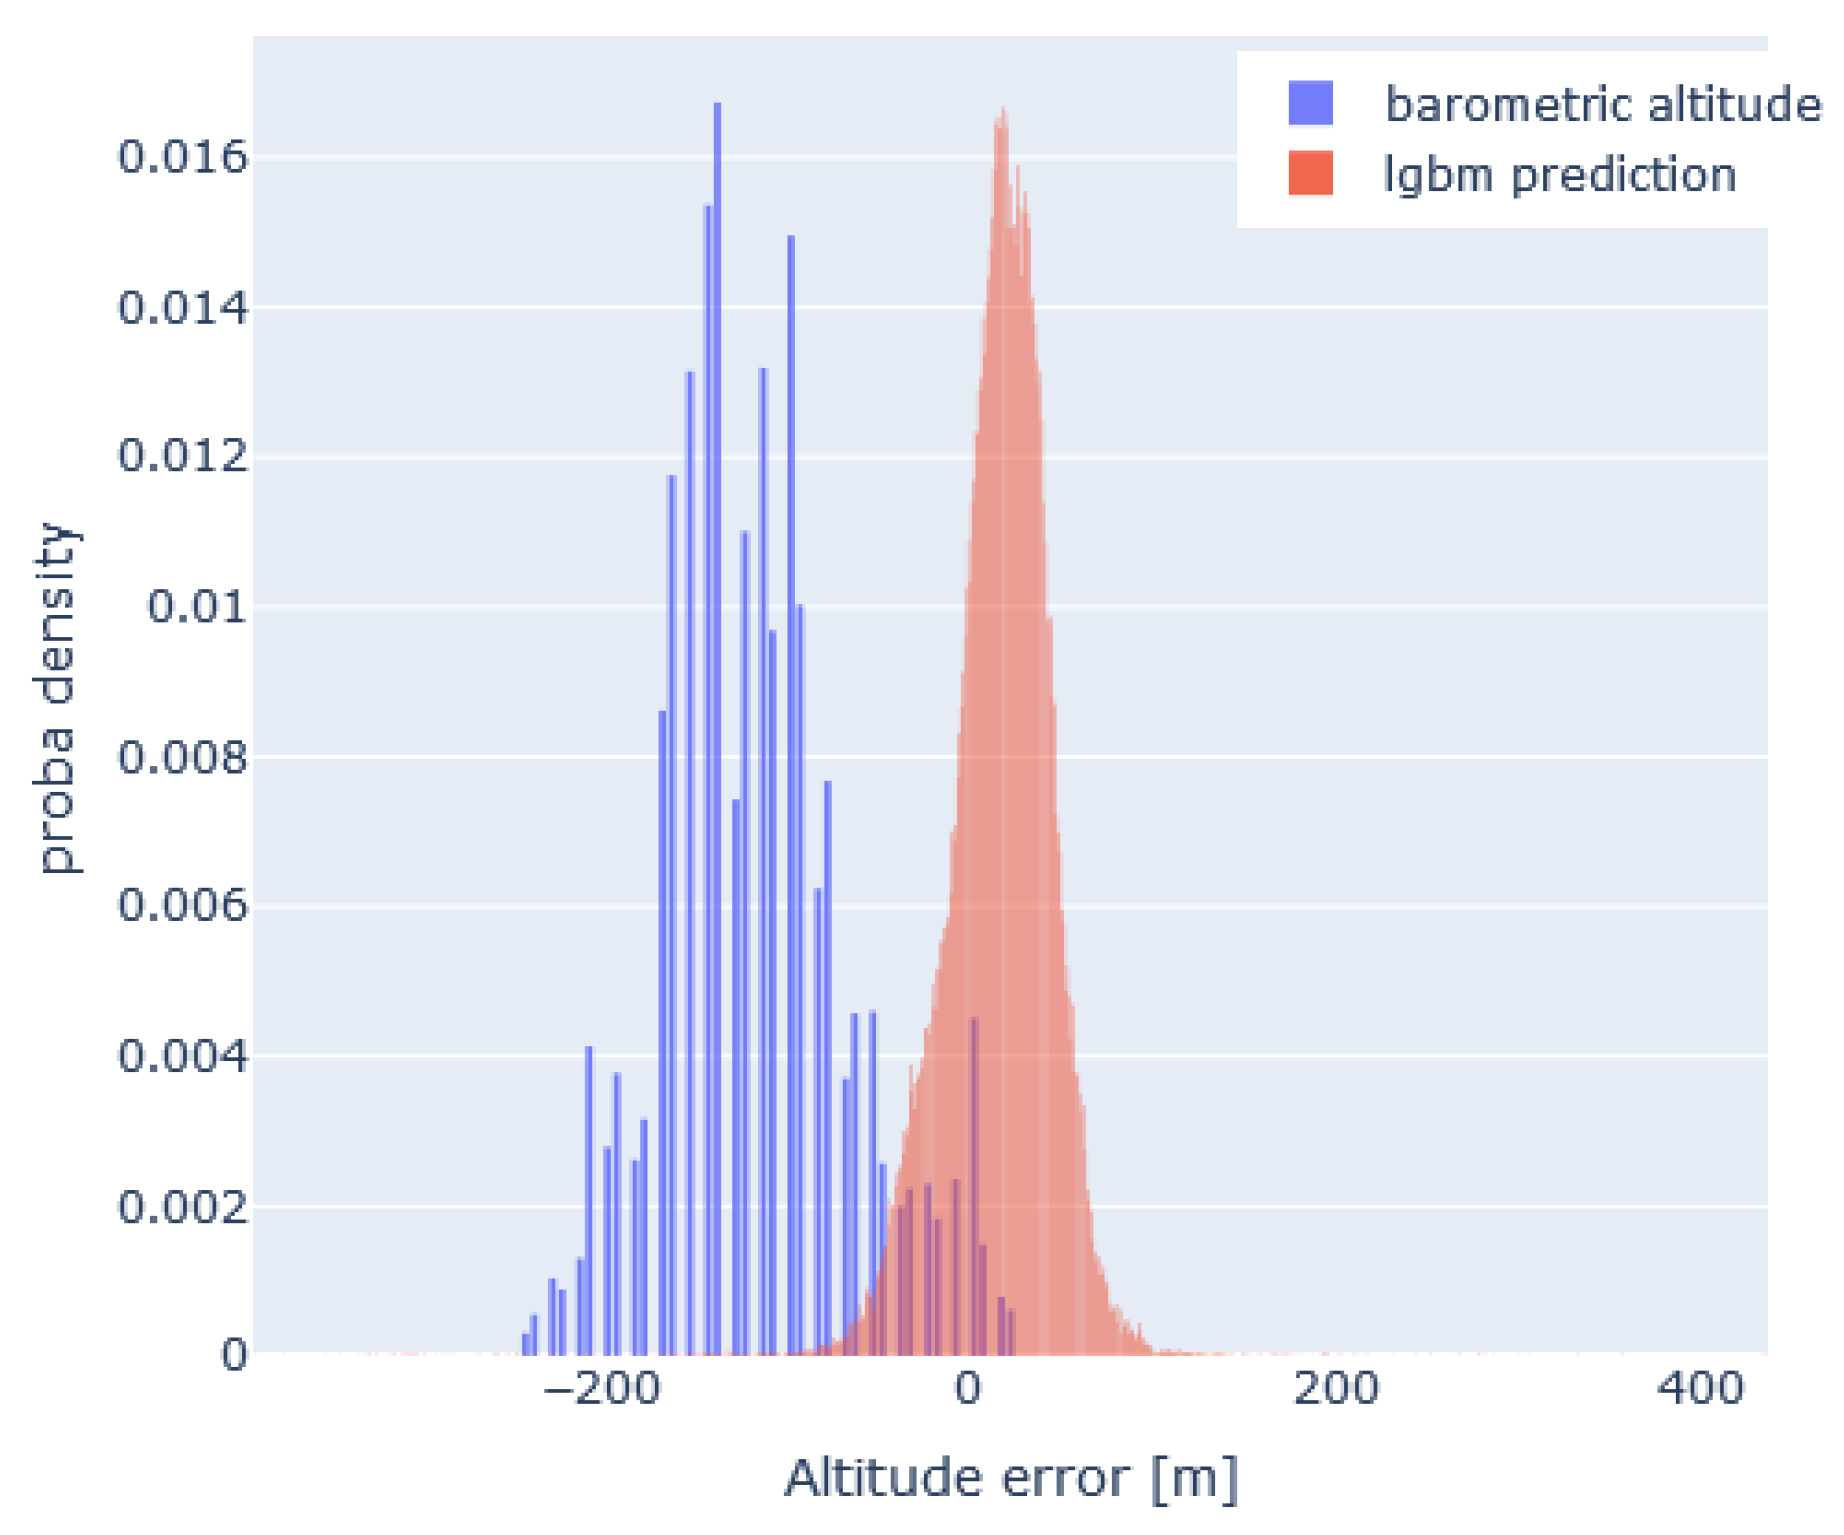
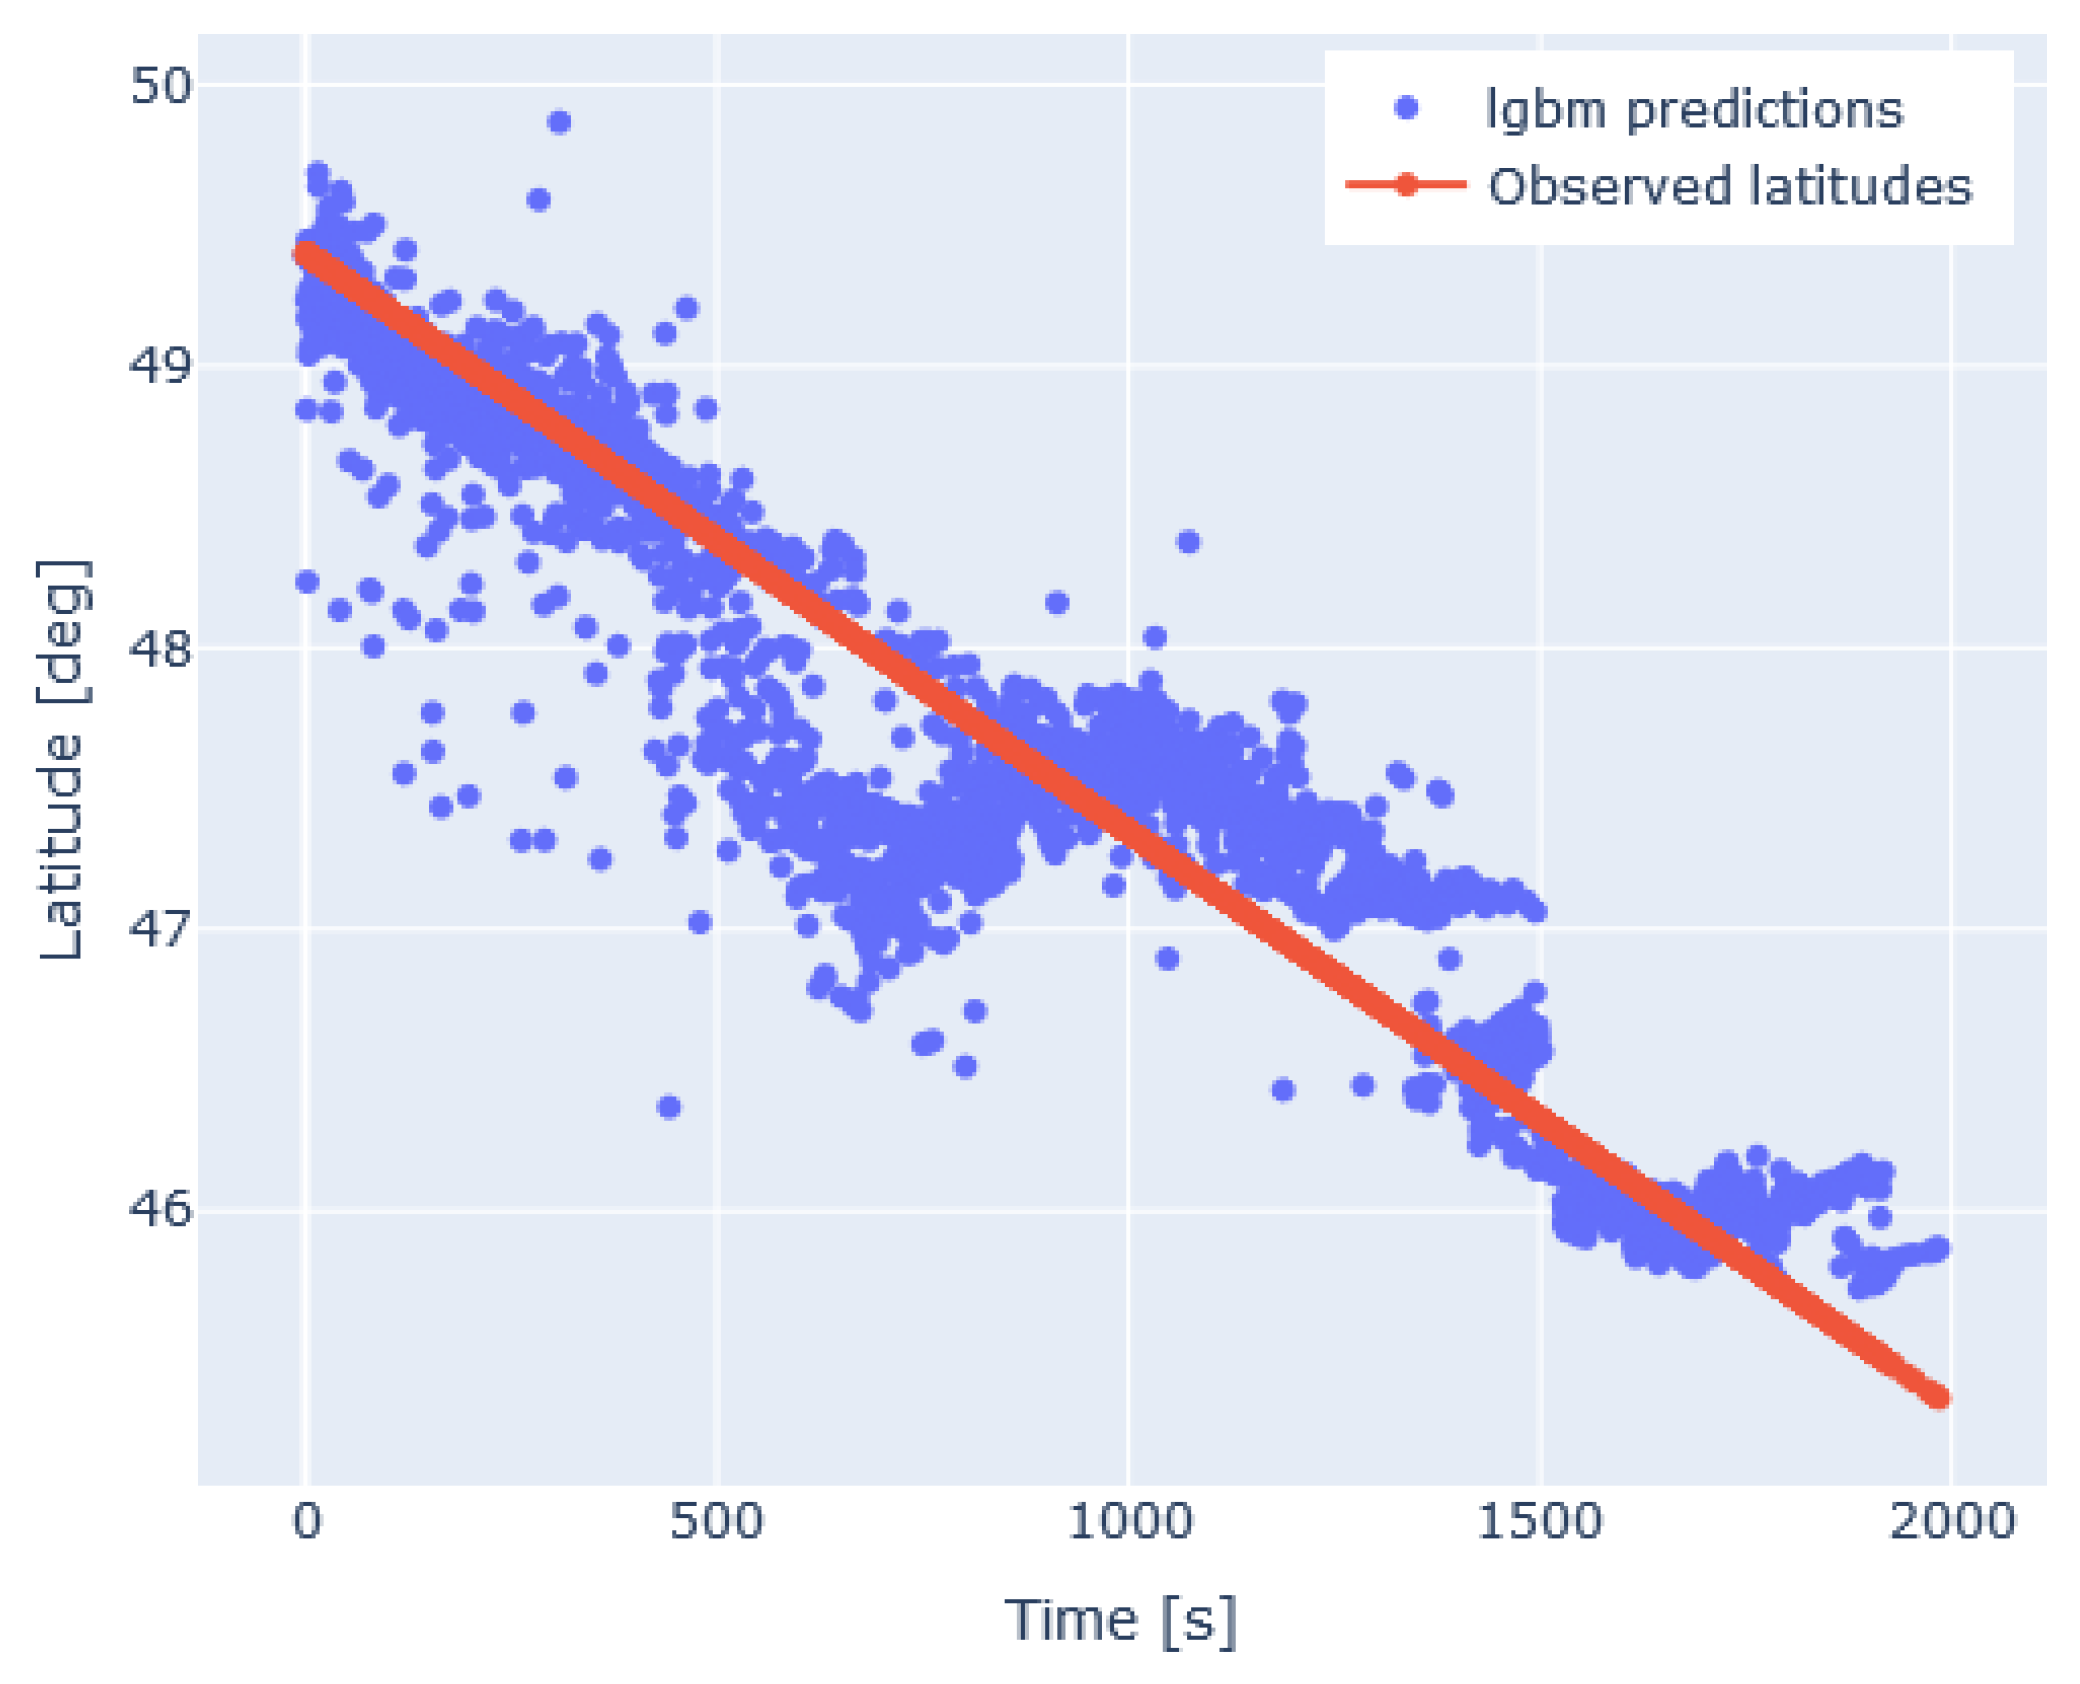
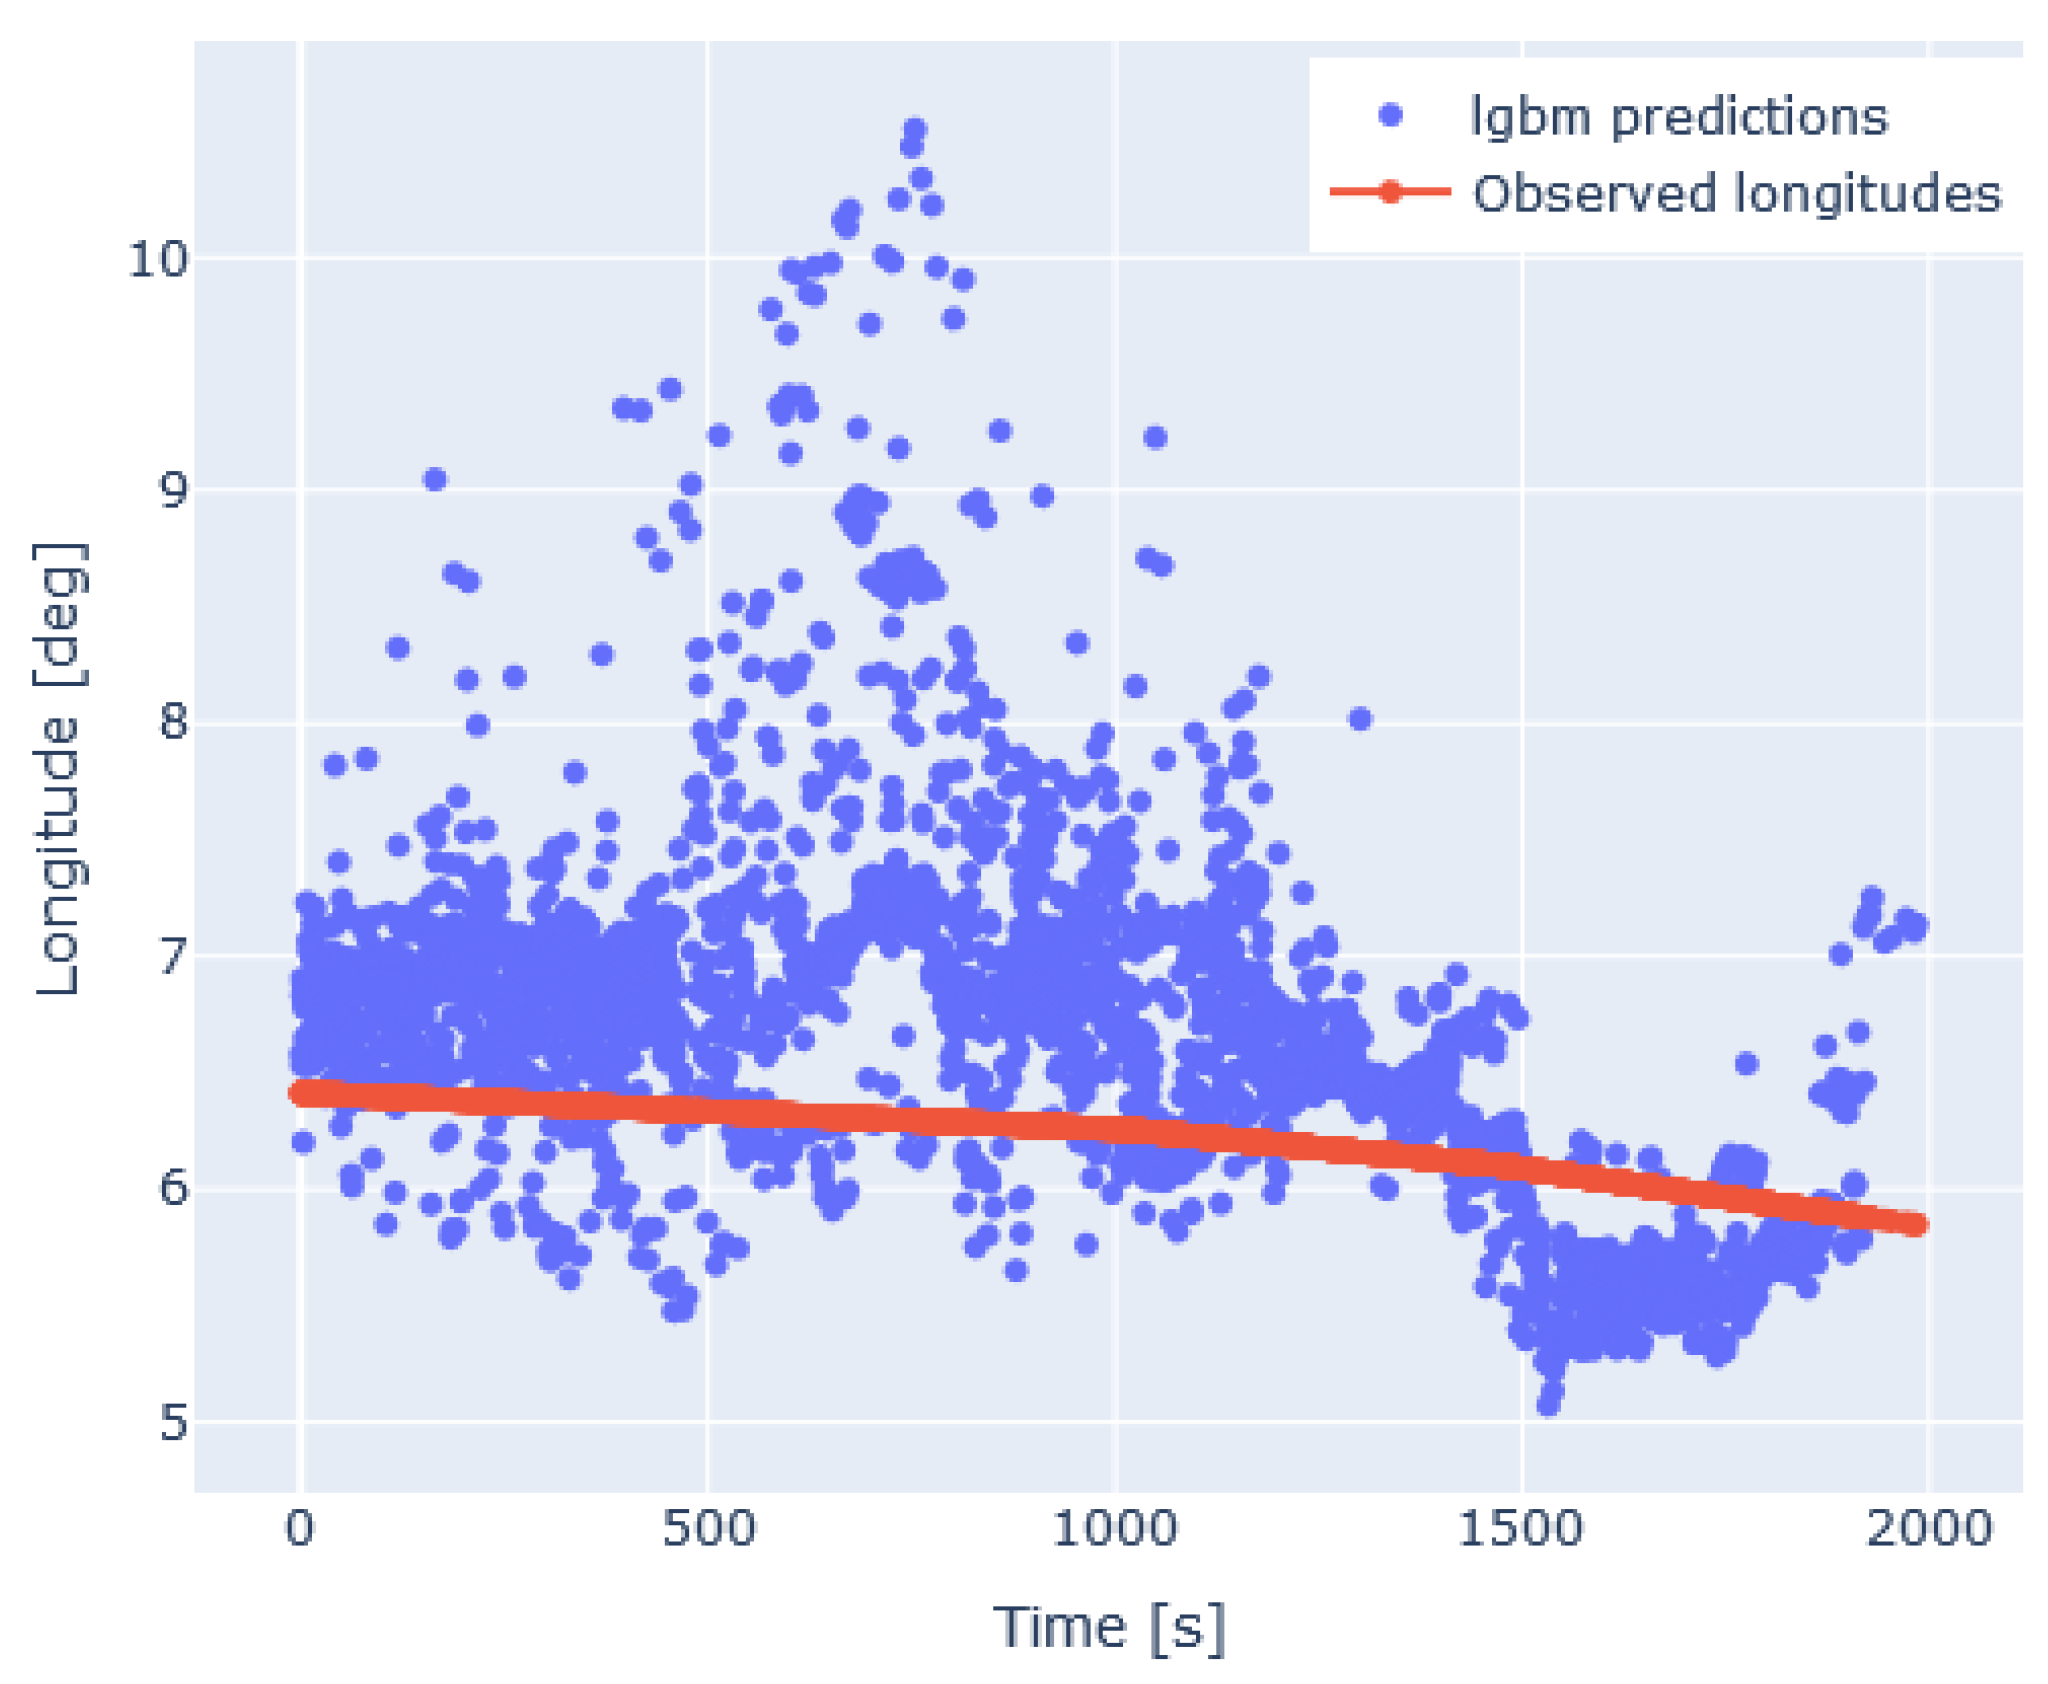
3.1. Machine Learning-Based Localization

The localization problem can be seen as a regression problem. In a first attempt, a machine learning-based localization method was developed for this competition. This method consists of training several machine learning models (one for each dimension) to solve a regression problem on the latitude, longitude, and geometric altitude, as shown in Equation (3). Because each ADS-B message is received by at least two receivers, the pairwise approach was used again.
l a t p r e d = f l a t ( s i , s j , t , p i , p j , A l t b a r o , T D o A c o r r e c t e d ) l o n p r e d = f l o n ( s i , s j , t , p i , p j , A l t b a r o , T D o A c o r r e c t e d ) A l t _ g e o p r e d = f a l t ( s i , s j , t , p i , p j , A l t b a r o , T D o A c o r r e c t e d )
with:
s i : The first receiver ID
s j : The second receiver ID
t: The time at which the server receives the message
p i : The signal strength of the signal received by the first receiver
p j : The signal strength of the signal received by the first receiver
A l t b a r o : The barometric altitude of the airplane
T D o A c o r r e c t e d : The corrected TDoA between the first and second receiver
The different functions of Equation (3) were obtained by training a Gradient Boosting regression Model [8] using the LightGBM (LGBM) [9] implementation. LGBM produces a regression model in the form of regression trees by combining boosting and gradient descent techniques. Given the pairwise format used, multiple predictions are available when a message is received by more than two receivers. Indeed, one prediction per pair of sensors becomes available. To assure robustness against outliers, the median values of the predictions corresponding to the same message are used as the estimate.
Upon reviewing the results, it turns out that the Root Mean Squared Difference (RMSD) between geometric altitude and barometric altitude is around 137 m. Therefore, the geometric altitude could have been approximated by directly using the barometric altitude. Nevertheless, the LGBM geometric altitude prediction perform much better with an RMSD below 34 m, as can be observed in Figure 4, Figure 5 and Figure 6, showing the LGBM prediction of the latitude and the longitude with respect to the truth. A general trend is predicted correctly; the predictions, however, differ from the truth by up to about 1 in latitude and up to 4 in longitude. The root mean squared 2D position error obtained with this model is slightly below 40,000 m.
While the model performs rather well for the geometric altitude, the models for latitude and longitude are less promising. The authors did not try to improve these models, but instead used the obtained results just as an initial position estimate that will be used for the multilateration techniques presented below.

3.2. Multilateration-Based Localization

Multilateration is a method to estimate the location of an object, based on measurements from a network of reference stations that receive the signal from the aircraft. In the context of this work, of course, the objects to be located are flying aircraft.
The TDoA between two stations then defines a hyperbola of possible locations of the aircraft. Repeating the same process with another pair of ground stations then defines a second hyperbola. The intersection of the two hyperbolas is the location of the aircraft. Mathematically, the difference of the geometrical distances between the aircraft and the i’th and j’th ground station can be described as:
δ i j = Δ t i j · c = d a i d a j
with:
d a i = ( x i x a ) 2 + ( y i y a ) 2 + ( z i z a ) 2
and:
d a j = ( x j x a ) 2 + ( y j y a ) 2 + ( z j z a ) 2
where:
( x i , y i , z i ) = P i : known position of the i t h ADS-B receiver
( x a , y a , z a ) = P a : unknown position of the aircraft
d a i : Euclidean distance between the aircraft and the i t h ADS-B receiver
δ i j : difference of the Euclidean distance between the aircraft to the i t h receiver and the aircraft to the j t h receiver
Δ t i j : TDoA between the i t h and j t h receiver
c: speed of light
For a single observation of an aircraft by m receivers, the multilateration problem can be written as a system of n non-linear equations:
d a i d a j = d t i j c d a p d a q = d t p q c
with:
n = m ! 2 ! ( m 2 ) !
The solution of the M L A T system of equations in Equation (7) can be found by using non-linear solvers. Typically, least squares methods can be used to approximate the solutions of such a system of equations. For this work, a solution to find the geometric altitude of the aircraft was already presented in Section 3.1. Therefore, at least two observation (i.e.,three receiving sensors) are needed to find the two-dimensional position of the aircraft. When more than two observations are available, three different strategies are implemented: firstly, a triplet-wise approach, secondly, an all-in-view solution, and finally, a combined strategy.

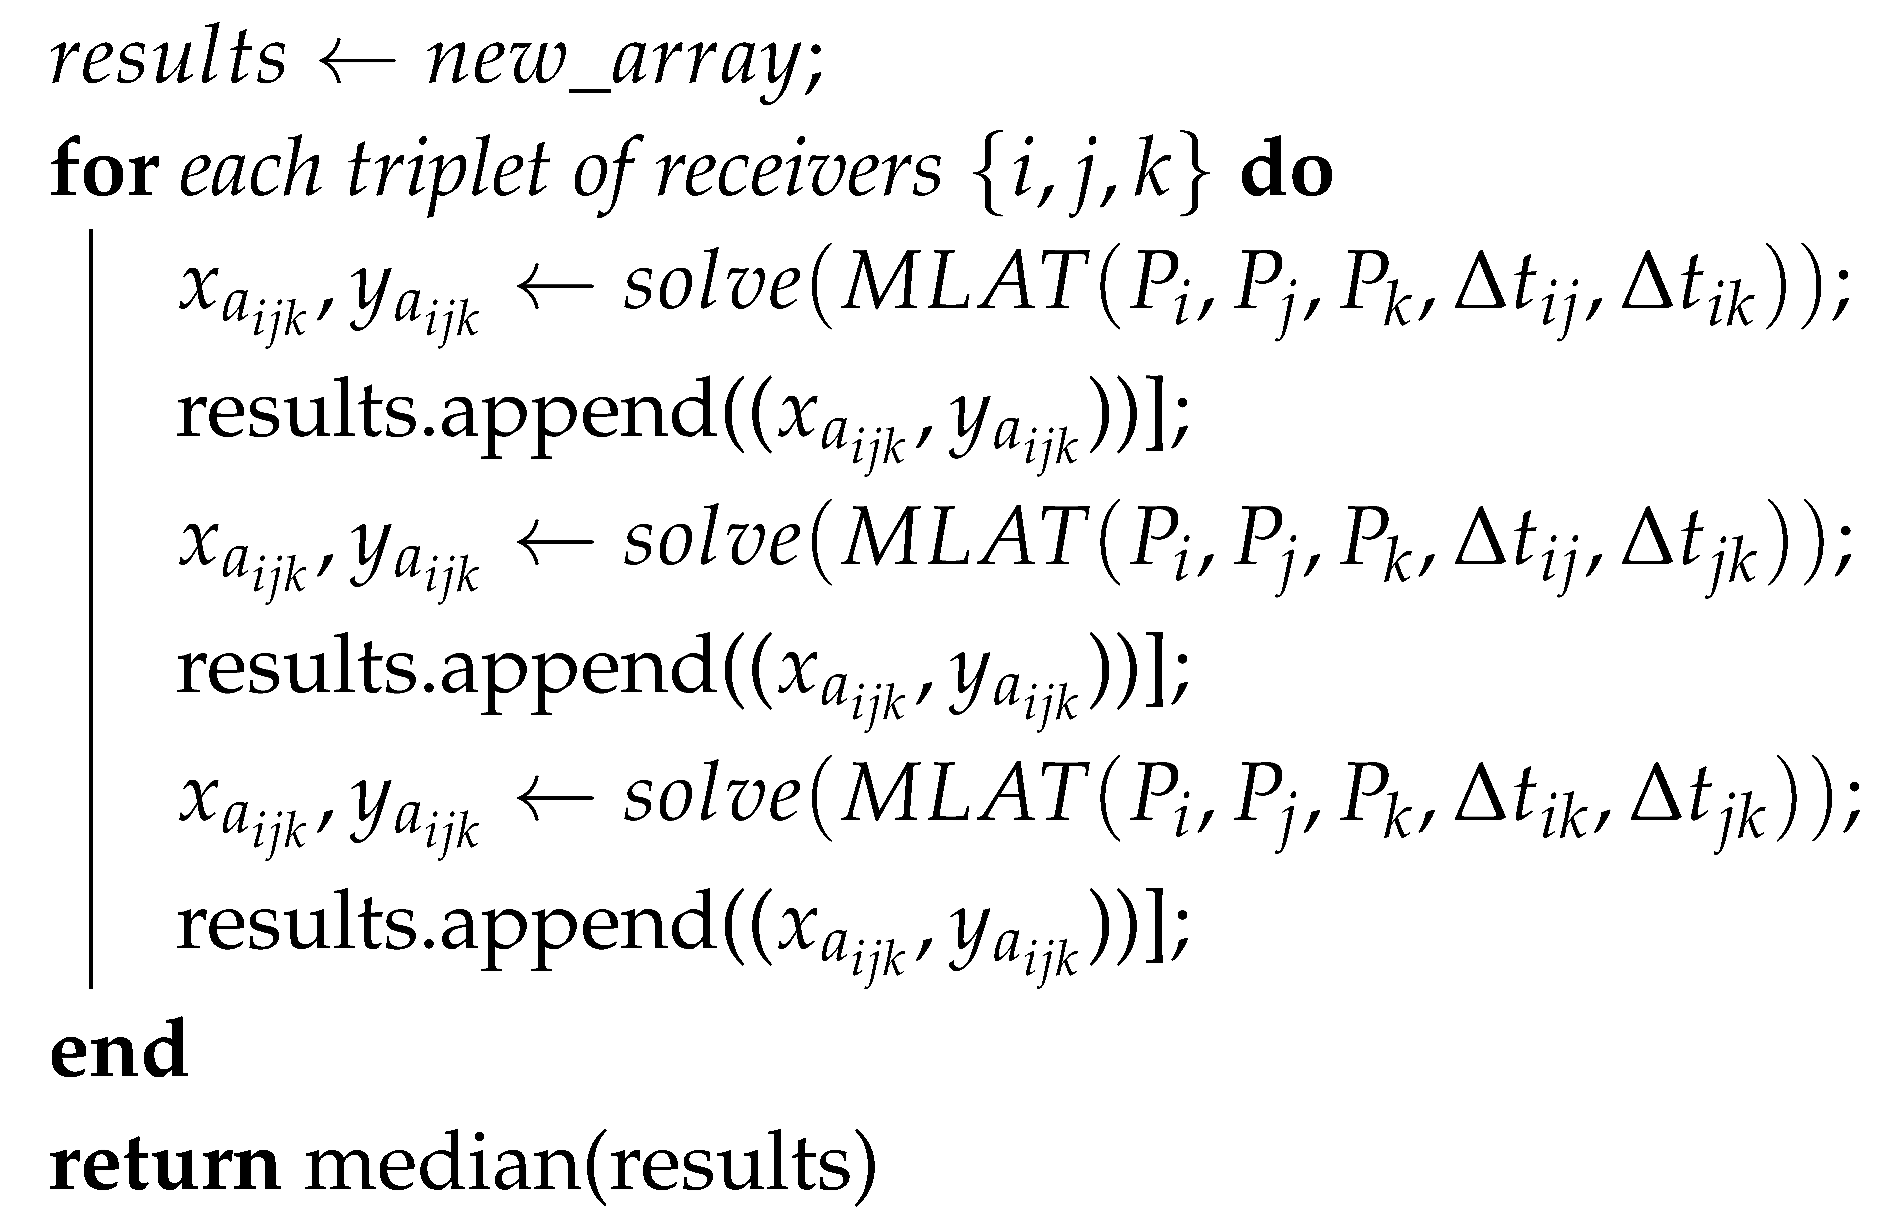
3.2.1. Triplet-Wise Multilateration

When n > 2 (i.e., m 3 ), the system of equations in Equation (7) is over-determined for the two-dimensional aircraft position solution. The first proposed strategy is to independently solve all the systems of two equations for all the combinations of two observations available, which leads to n ! 2 ! ( n 2 ) ! solutions. In practice, TDoAs ( Δ t i ) and sensor locations ( P i ) are not perfectly known, and each solution is different. To account for possible outlying parameters, the authors propose to take the median of all the solutions as the final estimate.

3.2.2. All-in-View Multilateration

Another approach to deal with the over-determined case is not to solve each triplet of MLATequations independently, but to solve all of them at once. This concept is widely used in GNSS applications. The over-determined system is used to improve the quality of the position estimate in a least-squares sense. More satellites (in the GNSS case) or more ground stations (in the MLAT case) typically lead to a better geometric diversity in the solution and therefore improve the solution [10]. This all-in-view concept corresponds to solving a system of n 2 nonlinear equations with two unknowns. The Levenberg–Marquardt [11] algorithm implemented in scipy was used to solve this optimization problems.

3.2.3. Combined Multilateration

The “all-in-view” concept has the advantage of being more accurate, but it can struggle with converging in the presence of outliers in the equations’ parameters, while the triplet-wise method has the advantage of being less sensitive to outliers. Indeed, taking the median (as opposed to the mean) in the last step in Algorithm 1 has a positive impact on decreasing the outliers’ effect on the prediction. To get the best of both the methods, the authors implemented the following strategy:
  • The triplet-wise multilateration is applied,
  • the modified z-score [12] is computed for each triplet solution
  • only the triplet of sensors with a z-score below 3.5 is labeled as “valid sensors”
  • the all-in-view multilateration is solved for all the sensors that are in the list of valid sensors as defined in Step 3.
Algorithm 1: Triplet-wise multilateration algorithm.
Proceedings 59 00002 i001

4. Results

4.1. Triplet-Wise versus Combined Multilateration

To assess the accuracy of each method, a comparative analysis between the triplet-wise and the combined multilateration was performed on the competition dataset. Table 2 summarizes the results of this comparative analysis for different metrics. While the coverage is slightly lower for the combined multilateration, the 2D position error is always smaller for each of the three quartiles. In the OSN competition, the solutions were evaluated by the Root Mean Squared Error (RMSE), with the worst (largest) 10% of the errors ignored. The RMSE is also significantly lower for the combined multilateration with 95.56 m versus 155 m for the triplet-wise method.

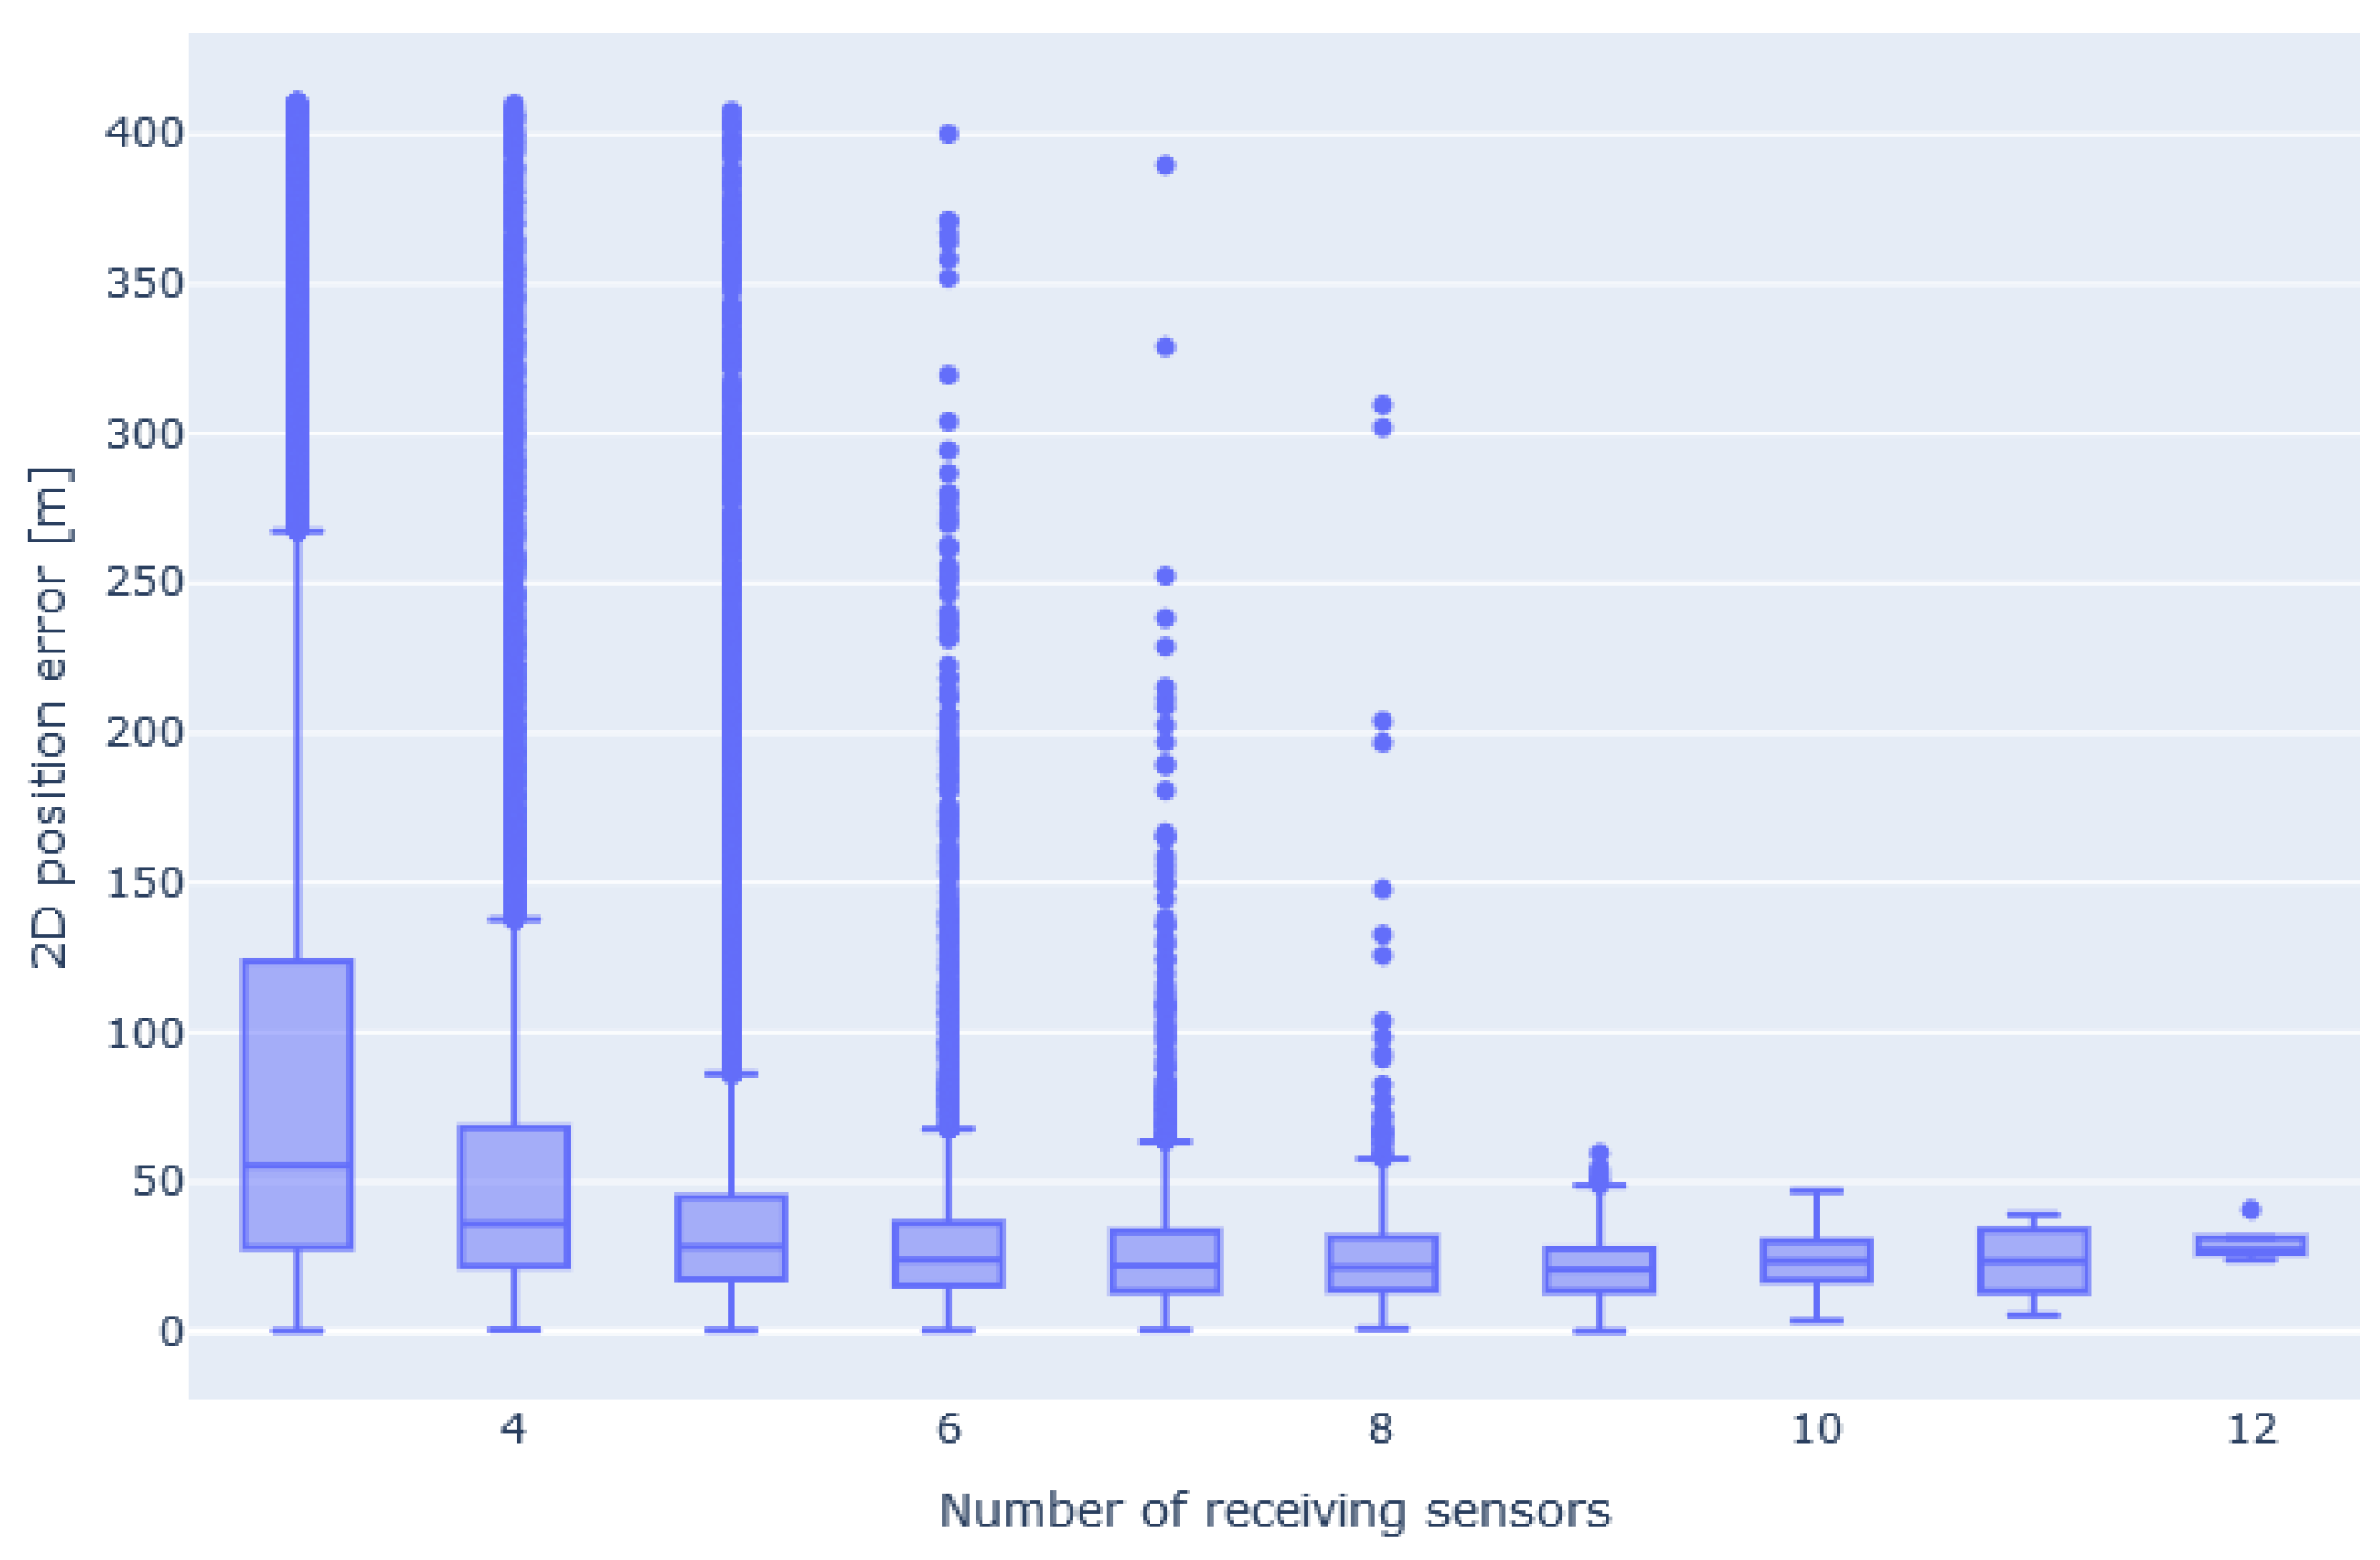
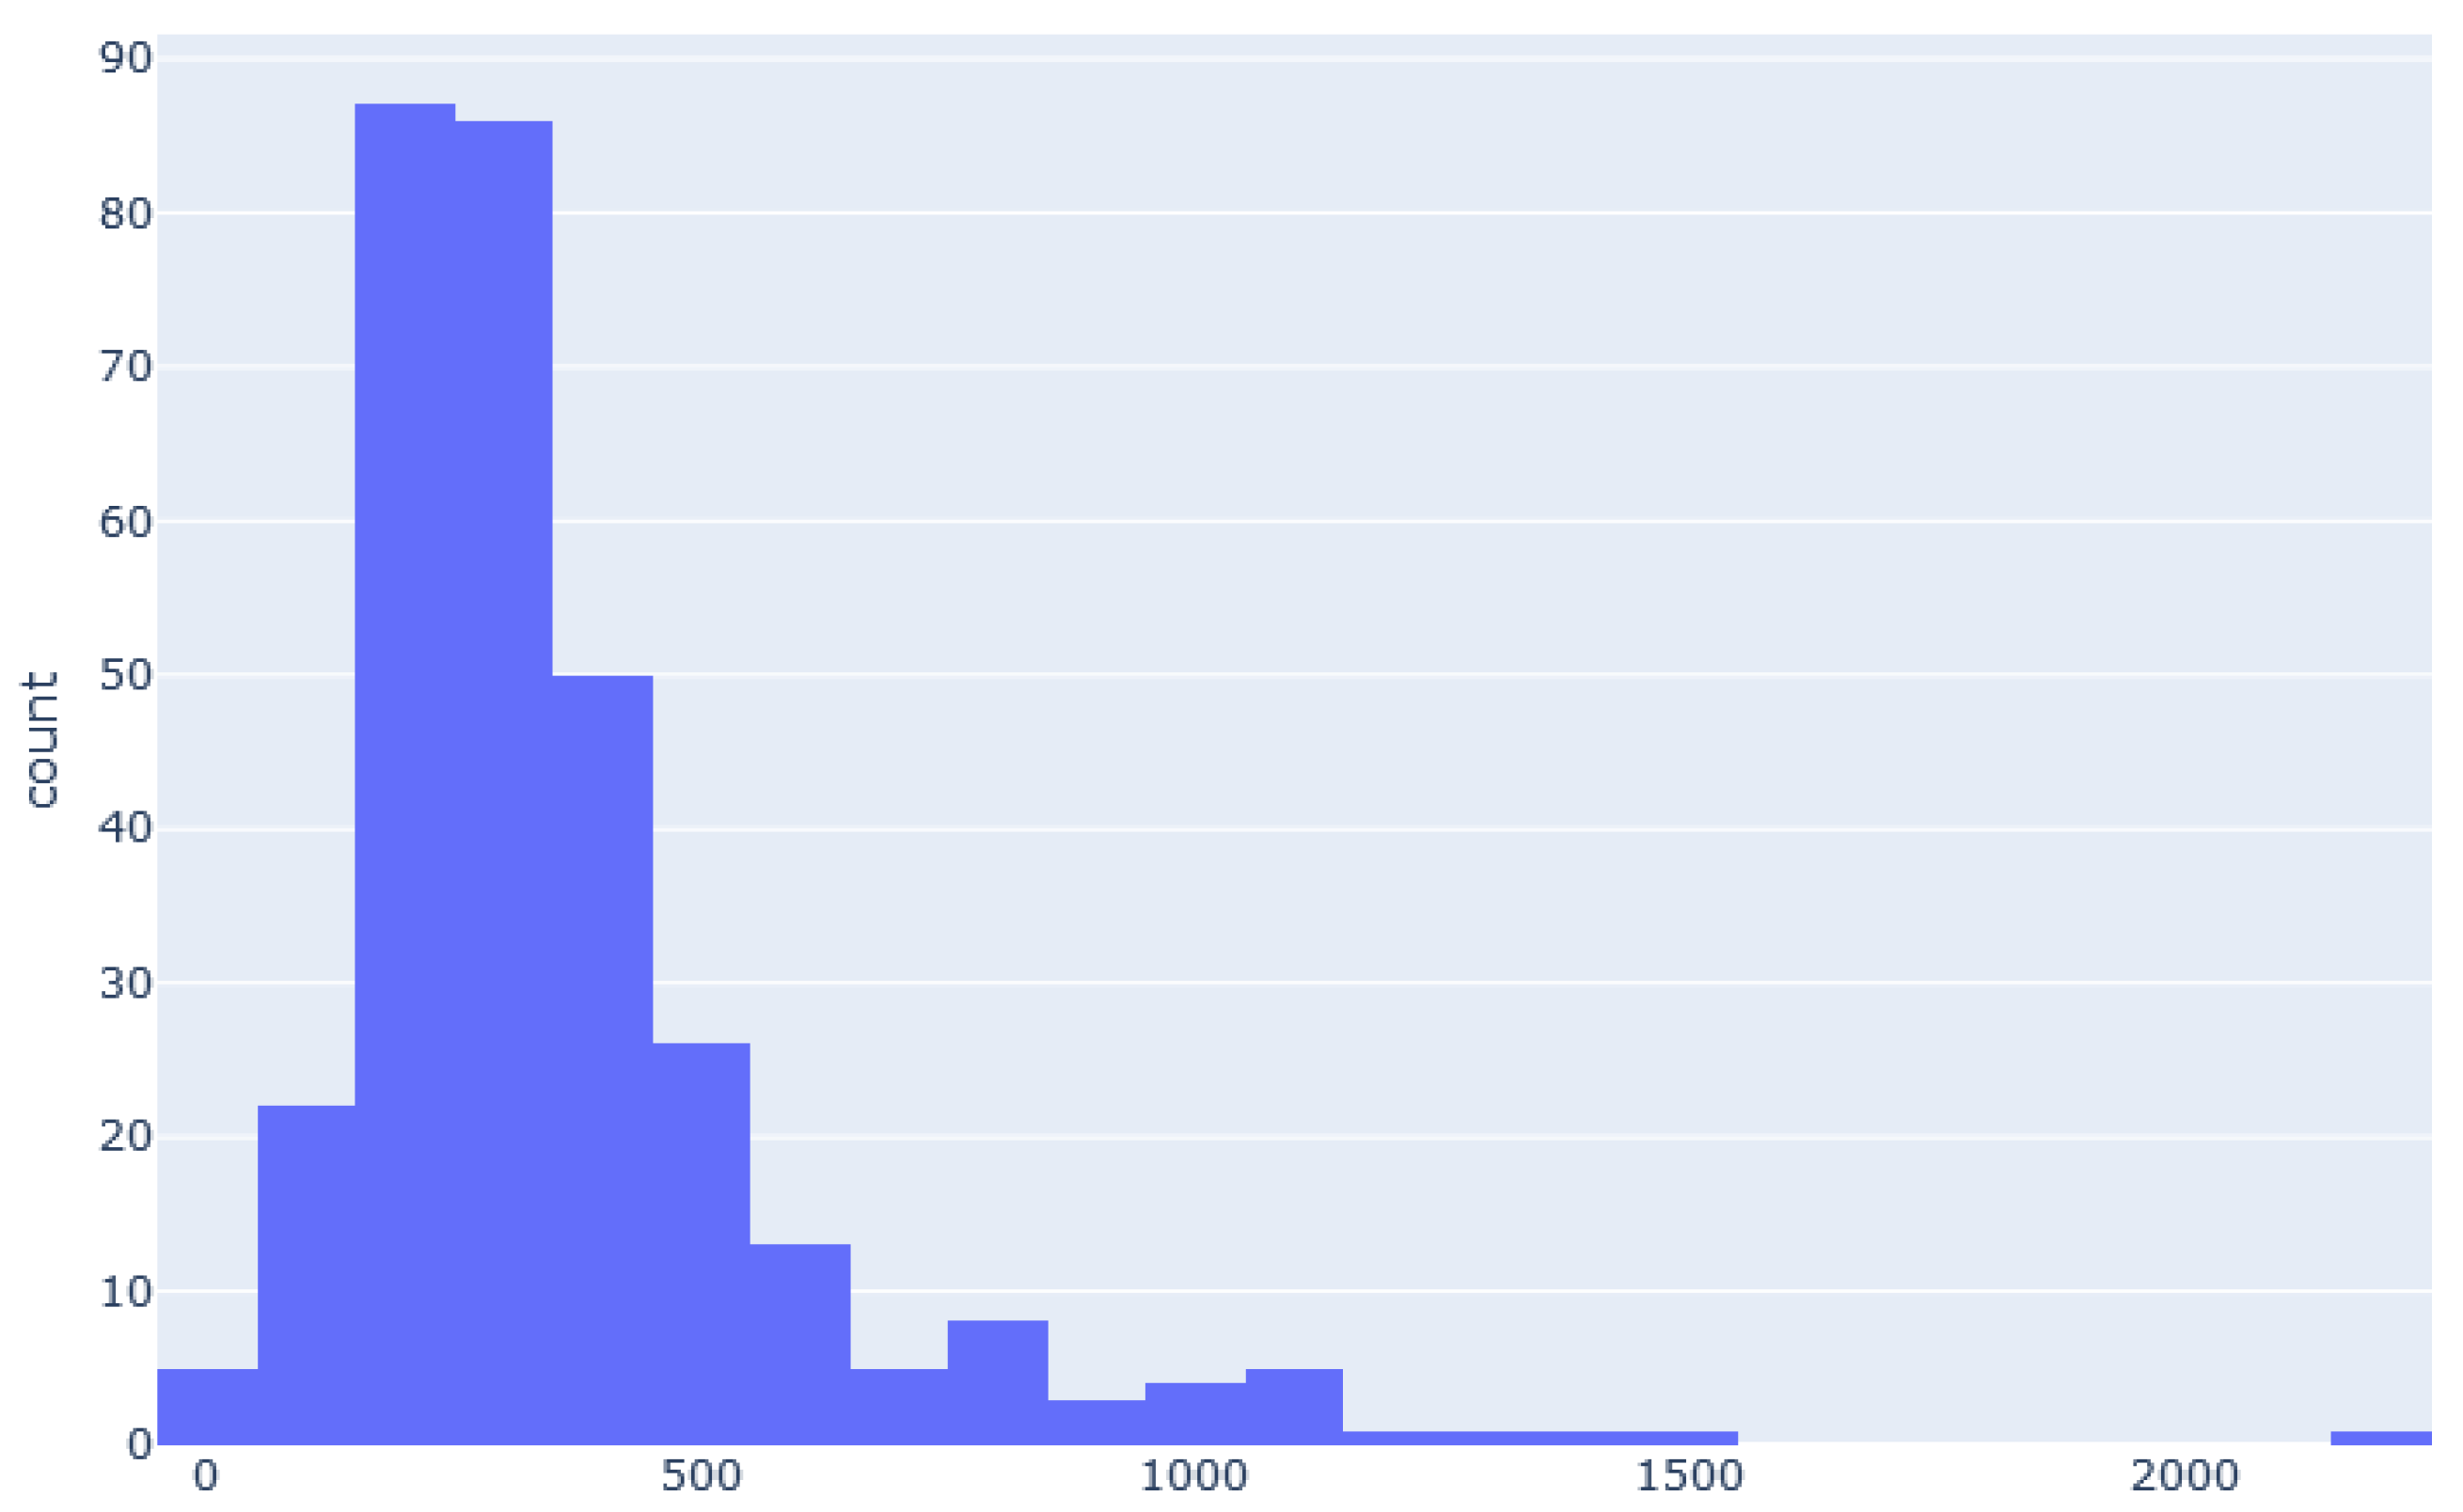
4.2. Accuracy as a Function of the Number of Receivers

The relationship between accuracy and the number of receivers of an ADS-B message was investigated. Figure 7 shows the 2D position estimation error distribution as a function of the number of receivers. It can be seen that, unsurprisingly, the errors tend to be smaller when the number of receivers increases.
To optimize the localization solution in the context of the competition, the authors decided to exclusively use multilateration results when more than five receivers were available. Figure 8 shows how the proposed solution performs for an example trajectory. It can be seen that selecting only estimates that have five or more receivers available reduces coverage (only 22% of the positions to estimate have five or more available receivers), but greatly improves accuracy. In order to reach the minimum coverage of 50% that was imposed in the competition, the missing values (when less than five receivers were available) were estimated using a polynomial interpolation between measurements, which were separated by less than 25 s. The solution proposed in this paper achieved a 2D RMSE of 25 m for a coverage slightly above 50%.

4.3. Computational considerations

The time to compute the localization solution depends on the number of receivers available. As shown in Table 3, the time is mainly driven by the triplet-wise multilateration. In effect, the number of systems of two equations to solve is n ! 2 ! ( n 2 ) ! , while for the all-in-view, there is only one system of n equations. It is important to mention that the Levenberg–Marquardt algorithm is an iterative process, and we observed that the accuracy of the first guess had an impact on the convergence time. In scenarios where the accuracy of the all-in-view multilateration was high, for example to verify suspicious (i.e., potentially erroneous) aircraft data, an average time below 0.2 s on an Intel(R) Xeon(R) Platinum 8164 [email protected] GHz was needed to compute the aircraft position.

5. Conclusions

Different localization methods that led to the combined multilateration solution that obtained the second place at the Aircraft Localization Competition are presented in this paper. The proposed method manages to reach about 25 m for the RSME on the 2D position with a coverage of 50% on the competition dataset. The combined multilateration suffers from expensive computational times, especially when the number of receivers is high. Further work could be done on the integration of Signal Strength (SS) information, by selecting only the n receivers with the highest SS in order to reduce the computation time. The chosen n would then depend on the available computation power and desired accuracy. SS could also be used to weight equations in the all-in-view multilateration to improve accuracy.

Author Contributions

Conceptualization, B.F.; methodology, B.F.; software, B.F.; investigation, B.F.; writing, original draft preparation, B.F.; writing, review and editing, B.F., M.F., and R.M.; visualization, B.F. All authors read and agreed to the published version of the manuscript.

Funding

This research received no external funding.

Conflicts of Interest

The authors declare no conflict of interest.

References

  1. Pérez Marcos, E.; Konovaltsev, A.; Caizzone, S.; Cuntz, M.; Yinusa, K.; Elmarissi, W.; Meurer, M. Interference and Spoofing Detection for GNSS Maritime Applications Using Direction of Arrival Measurements and a Conformal Antenna Array. In Proceedings of the 31st International Technical Meeting of the Satellite Division of the Institute of Navigation (ION GNSS+ 2018), Miami, FL, USA, 24–28 September 2018. [Google Scholar]
  2. Psiaki, M.L.; Humphreys, T.E. GNSS spoofing and detection. Proc. IEEE 2016, 104, 1258–1270. [Google Scholar] [CrossRef]
  3. Schäfer, M.; Strohmeier, M.; Lenders, V.; Martinovic, I.; Wilhelm, M. Bringing up OpenSky: A large-scale ADS-B sensor network for research. In Proceedings of the 13th International Symposium on Information Processing in Sensor Networks (IPSN 2014), Berlin, Germany, 15–17 April 2014; pp. 83–94. [Google Scholar]
  4. Scaramuzza, M.; Loeser, M.; Früh, D. Mobile MLAT for PBN and ADS-B performance assessments. In Proceedings of the ENRI International Workshop on ATM/CNS (EIWAC2015), Tokyo, Japan, 17–19 November 2015. [Google Scholar]
  5. Strohmeier, M.; Martinovic, I.; Lenders, V. A k-NN-Based Localization Approach for Crowdsourced Air Traffic Communication Networks. IEEE Trans. Aerosp. Electron. Syst. 2018, 54, 1519–1529. [Google Scholar] [CrossRef]
  6. CYD Campus Aircraft Localization Competition: Challenges. 2020. Available online: https://www.aicrowd.com/challenges/cyd-campus-aircraft-localization-competition (accessed on 2 November 2020).
  7. Aircraft Localization Competition: Documentation. 2020. Available online: https://competition.opensky-network.org/ (accessed on 2 November 2020).
  8. Friedman, J.H. Greedy function approximation: A gradient boosting machine. Ann. Stat. 2001, 29, 1189–1232. [Google Scholar] [CrossRef]
  9. Ke, G.; Meng, Q.; Finley, T.; Wang, T.; Chen, W.; Ma, W.; Ye, Q.; Liu, T.Y. LightGBM: A Highly Efficient Gradient Boosting Decision Tree. In Advances in Neural Information Processing Systems 30; Guyon, I., Luxburg, U.V., Bengio, S., Wallach, H., Fergus, R., Vishwanathan, S., Garnett, R., Eds.; Curran Associates, Inc.: Red Hook, NY, USA, 2017; pp. 3146–3154. [Google Scholar]
  10. Yang, Y.; Miao, L. GDOP results in all-in-view positioning and in four optimum satellites positioning with GPS PRN codes ranging. In Proceedings of the PLANS 2004. Position Location and Navigation Symposium (IEEE Cat. No. 04CH37556), Monterey, CA, USA, 26–29 April 2004; pp. 723–727. [Google Scholar]
  11. Moré, J.J. The Levenberg-Marquardt algorithm: Implementation and theory. In Numerical Analysis; Springer: Berlin/Heidelberg, Germany, 1978; pp. 105–116. [Google Scholar]
  12. Iglewicz, B.; Hoaglin, D. How to Detect and Handle Outliers; ASQC Basic References in Quality Control; ASQC Quality Press: Milwaukee, WI, USA, 1993. [Google Scholar]
Figure 1. Basic sensors/airplane architecture. OSN, OpenSky Network.
Proceedings 59 00002 g001
Figure 2. Pairwise median error distribution in ns.
Proceedings 59 00002 g002
Figure 3. Pairwise error interdecile range distribution in ns.
Proceedings 59 00002 g003
Figure 4. Error distributions for barometric altitude and predictions with respect to geometric altitude. LGBM, LightGBM.
Proceedings 59 00002 g004
Figure 5. Example of LGBM latitude prediction for a trajectory.
Proceedings 59 00002 g005
Figure 6. Example of LGBM longitude prediction for a trajectory.
Proceedings 59 00002 g006
Figure 7. 2D errors box plots for different numbers of receivers.
Proceedings 59 00002 g007
Figure 8. Localization solution for a trajectory sample.
Proceedings 59 00002 g008
Table 1. Example of pairwise errors observations among 3 receivers.
Pairs ( s 414 , s 550 ) ( s 414 , s 663 ) ( s 550 , s 663 )
Observed errors (ns)103−120,785−120,888
−131−120,509−120,409
−879−120,613−120,958
Pairwise Median (ns)67−120,508−120,577
Pairwise Interdecile Range (ns)444419840
Table 2. Result comparison between triplet-wise and combined multilateration.
MetricTriplet-WiseCombined Multilateration
Coverage64.76%64.47%
2D Error 1st quartile22.32 m20.18 m
2D Error median39.19 m34.02 m
2D Error 3rd quartile83.89 m67.53 m
Competition evaluation criteria155 m95.56 m
Table 3. Computation time for different localization solutions with respect to the number of receivers.
Localization Solution m = 3 m = 4 m = 5 m = 6
Triplet-wise0.15 s0.61 s1.53 s3.97 s
All-in-view0.12 s0.17 s0.23 s0.16 s
Combined0.27 s0.78 s1.76 s4.13 s
Publisher’s Note: MDPI stays neutral with regard to jurisdictional claims in published maps and institutional affiliations.

